BIMSTEC Security Challenges: Building a Cooperative Framework

PROSPECTS OF REGIONAL COOPERATION IN TRADE, INVESTMENT AND FINANCE IN ASIA:
AN EMPIRICAL ANALYSIS ON BIMSTEC COUNTRIES AND JAPAN
SWAPAN K. BHATTACHARYA BISWA N. BHATTACHARYAY
CESIFO WORKING PAPER NO. 1725 CATEGORY 7: TRADE POLICY
MAY 2006
An electronic version of the paper may be downloaded • from the SSRN website: www.SSRN.com • from the RePEc website: www.RePEc.org
• from the CESifo website: Twww.CESifo-group.deT

CESifo Working Paper No. 1725
PROSPECTS OF REGIONAL COOPERATION IN TRADE, INVESTMENT AND FINANCE IN ASIA:
AN EMPIRICAL ANALYSIS ON BIMSTEC COUNTRIES AND JAPAN
Abstract The seven-nation Bay of Bengal Initiative for Multisectoral Technical and Economic Cooperation (BIMSTEC), comprising Bangladesh, Bhutan, India, Myanmar, Nepal, Sri Lanka and Thailand is emerging as one of the major subregional groups in Asia. Japan is the second largest trading partner for BIMSTEC countries. The paper discusses prospects for strengthening BIMSTEC countries and Japan’s cooperation and integration in trade, investment, and finance. It analyzes the trends and patterns of bilateral and subregional economic cooperation in Asia as well as BIMSTEC-Japan trade. It examines empirically whether BIMSTEC-Japan economic cooperation will increase intraregional trade using a gravity model. Japan-BIMSTEC cooperation will increase intraregional trade but not uniformly for all countries. The potential losses on trade for some countries will be compensated by gains in other areas, such as, stepped up resource transfer, foreign direct investment flows, technology transfer, and market access to services. The paper also presents the need for and possible areas of economic cooperation and integration in investment and finance.
JEL Code: F02, F13, F15, F36, F4.
Swapan K. Bhattacharya Indian Institute of Public Administration
International Trade Department Indraprastha Road
Ring Road, New Delhi-110002 India
Biswa N. Bhattacharyay Office of the President
Asian Development Bank Manila
Philippines [email protected]
Based on the papers, “Does BIMSTEC-Japan Economic Cooperation Increase Intraregional Trade? The Case for Free Trade Arrangement,” and “Towards a Greater Economic Cooperation and Integration among BIMSTEC Countries and Japan in Money, Finance, and Investment” presented at the First International Conference “Towards BIMSTEC-Japan Comprehensive Economic Cooperation: Vision and Tasks Ahead”, Kolkata, India, 16-17 December, 2005. The views expressed in this paper are those of the authors and do not represent those of the organizations in which the authors belong. The usual disclaimers will apply.

2
Prospects and Challenges of Regional Cooperation and Integration in Trade,
Investment and Finance in Asia: An Empirical Analysis on BIMSTEC Countries and Japan2
Swapan K. Bhattacharya and Biswa N. Bhattacharyay Introduction The past few decades have seen a remarkable growth and dynamism as well as a period of economic turbulence in Asia. The Asian financial crisis of 1997 was a wake-up call for policymakers that regional cooperation and integration can maximize the benefits of globalization while minimizing the costs. Economic cooperation and integration is based on complementarities that help to maximize the mutual benefits of all involved. By working together, countries enjoy social and economic benefits that otherwise may not be achieved solely through individual efforts. Regional integration can produce win-win outcomes in terms of the quantity and quality of economic growth, while aiding in the reduction of global imbalances. More importantly, regional integration is a potential driver of sustainable economic growth that will contribute to the poverty reduction goals in developing countries, if accompanied by pro-poor national policies. The unsuccessful World Trade Organization (WTO) trade talks in Cancun resulted in an increasing trend toward regional cooperation and integration, such as bilateral and subregional trade agreements in Asia and in other regions, particularly the expanded European Union (EU), and North American integration, namely, the North American Free Trade Agreement (NAFTA), Central American Free Trade Agreement (CAFTA), and Gulf Cooperation Council (GCC) Currency Union.3
The world has witnessed a recent wave of regional trade and cooperation agreements (RTCAs) involving both developing and developed countries. These agreements have mushroomed in since 1990. By July 2005, a total of 330 agreements had been registered with the WTO (and its predecessor, General Agreement on Tariff and Trade (GATT) compared to only 130 in January 1995. Of these, 180 are currently in force. Additional RTCAs are believed to be operational but not yet registered. Apart from Mongolia, all WTO members are involved in one or more regional trade agreements.4 At present, there are 33 major RTCAs worldwide.
Following the global trend, Asia also witnessed a shift in regional trade strategy from multilateral to subregional and bilateral trade agreements. Subregional and bilateral regional cooperation and integration can help maximize the benefits of globalization, while minimizing its risks. There are 49 major subregional and bilateral trade and cooperation Agreements in Asia. The type of RTCAs in a region like Asia could be classified into four categories: (i) bilateral between two countries of the region, such as Singapore-India RTCA; (ii) subregional consisting of several countries in the region, such as, Associations of South East Asian Nations (ASEAN) Free Trade Agreement (AFTA); (iii) between one country and a subregion, such as, China-ASEAN RTCA; and (iv) regional RTCAs including most countries in the region, such as the proposed Asian Community.
Seven-nation Bay of Bengal Initiative for Multisectoral Technical and Economic Cooperation (BIMSTEC), comprising Bangladesh, Bhutan, India, Myanmar, Nepal, Sri Lanka, and Thailand was set up in 1997. BIMSTEC is emerging as one of the major subregional groups in Asia. BIMSTEC has 5 South Asian 2 Based on the papers, “Does BIMSTEC-Japan Economic Cooperation Increase Intraregional Trade? The Case for Free Trade
Arrangement,” and “Towards a Greater Economic Cooperation and Integration among BIMSTEC Countries and Japan in Money, Finance, and Investment” presented at the First International Conference “Towards BIMSTEC-Japan Comprehensive Economic Cooperation: Vision and Tasks Ahead”, Kolkata, India, 16-17 December, 2005. The views expressed in this paper are those of the authors and do not represent those of the organizations in which the authors belong. The usual disclaimers will apply.
3 The six members of the Gulf Cooperation Council (GCC) consisting of Bahrain, Kuwait, Oman, Qatar, Saudi Arabia and the United Arab Emirates (UAE), decided to create a single currency by 2010.
4 WTO website, http://www.wto.org/english/thewto_e/whatis_e/tif_e/bey1_e.htm

3
Association for Regional Cooperation (SAARC) members and two members from ASEAN, Thailand and Myanmar. This is a bridge between the South Asia and South East Asia subregions. This covers 1.32 billion people around the Bay of Bengal with its immense resources and strategic shipping routes. Its combined GDP is about US$1.3 trillion.
On the other hand, Japan is the second largest trading partner for BIMSTEC countries. It requires low-risk and higher returns destinations for its surplus savings that are now invested in developed countries’ capital markets with low returns. It also needs new markets to address its excess industrial capacity problem. High wages and an aging population in Japan call for the solution of immigrant labor. Outsourcing to BIMSTEC region could be attractive for Japanese companies. In view of the above, the opportunity costs of not moving toward greater economic cooperation integration among BIMSTEC countries and Japan could be enormous. This subregional cooperation and integration could be building blocks for a region-wide integration. Another important factor for pushing this integration now is the emergence of India as a major economic force in the region. India is moving toward greater openness and will play a key role in this subregional integration. Over the last decade, some BIMSTEC countries have liberalized foreign direct investment (FDI) and trade regime, and started liberalizing their financial sector. As a result, the recent years witnessed a significant growth in exports and imports of BIMSTEC countries; however, FDI inflows decreased drastically in 2003-2004. The major trade partners of BIMSTEC countries are Japan, Singapore, and United States. During 2003-2004, USA accounted for 21.6% of total BIMSTEC exports and 7.7% of imports, whereas Japan accounted for 9.7% and 9.6%, respectively. Therefore, an increased economic cooperation and integration among BIMSTEC countries and Japan will produce significant benefits to all participating countries, particularly in terms of sustained economic growth and much needed inflow of foreign investment. This cooperation will strengthen the economic and trade link between South Asian and Southeast Asian countries, and play an important role towards a pan-Asian integration and cooperation. BIMSTEC is at a starting stage of evaluating its performance in the intraregional cooperation in the area of trade, investment and others. It is yet to set any agenda of extending preferential trading/tariff arrangements (PTAs) among its members, neither has it outlined any policy framework on how to go about with the PTAs and Free Trade Agreements (FTAs). BIMSTEC has an enormous trade potential because of its own intraregional trade at present. Japan can be a vibrant partner of BIMSTEC due to its robust trade and other economic activities in this region. Japan has been emerging as one of the countries in this region with active pro-Asian policies in trade and investment, which is manifested through the opening of its market to Asian partners and increasing amount of FDI flows to other countries. Japan is the largest economy in Asia, but its market potential is still untapped by the members of the bloc. Japan’s intra-bloc trade was only 3.96% of its total trade during 2003, which shows it has enough room for increasing trade and economic cooperation with the BIMSTEC countries. This provides a strong case for the liberalization of trade within BIMSTEC and between BIMSTEC and Japan through PTAs and FTAs. If trade among the bloc countries is free or at least starts with the preferential arrangement, welfare gain is enormous. The paper discusses prospects for strengthening BIMSTEC countries and Japan’s cooperation and integration in trade, investment, and finance. It analyzes the trends and patterns of bilateral and subregional economic cooperation in Asia as well as BIMSTEC-Japan trade. It examines whether BIMSTEC-Japan economic cooperation will increase intraregional trade by measuring the impact of PTAs by the proportionate change in exports and imports of Japan and other BIMSTEC countries in terms of dollars using a gravity model. It also presents the need for and possible areas of economic cooperation and integration in investment and finance. Recent Trends in Regionalism in Asia Regionalism is a reality these days among trading nations because of its proximity to demand pattern, easy process to conclude agreements based on mutual interests and resource endowments and consensus among smaller groups of countries to any issue. This becomes very popular among countries where multilateral efforts to augment trade gradually plummeted due to the complex web of interests. In the present set up of the WTO,

4
where 149 countries are members, it is almost impossible to reach a consensus in any multilateral issue. As a result, many ministerial meetings at the auspices of WTO collapsed. The major problem of the Seattle Meet was the lack of consensus among the members on the issues of environment and labor standards. The Doha Meet did not succeed mainly due to lack of consensus on developmental agenda on one hand and issue of agricultural subsidies on the other. The Cancun Meet failed largely because of the uncompromising attitude of the European Union (EU) on the issue of reduction of agricultural subsidies and cotton subsidies given by the US government to its farmers. The Hong Kong Meet did not produce significant results because of the contentious issue of agricultural subsidies given by the EU. Multilateralism under the WTO is getting weaker every day due to the lack of consensus on contentious issues among its 149 members. It becomes an impossible task for the trade regulatory body to bring all erring members with divergent national interests into an agreement to any single issue. This is precisely the reason why bilateralism and subregionalism/regionalism are becoming so popular in the sideline of multilateralism. World trade becomes more and more regional rather than international in the sense that more than 60% of world trade is covered by regional trading agreements (RTAs). Recently, there has been a spurt of RTA than ever before. Regional Trade Blocs (RTBs) are concluded under Article XIV of WTO and Enabling Clause XII, where similar interested parties can form an RTA in order to enhance intraregional trade in tandem with the multilateral arrangement. The recent years have witnessed increased integration in Asia; however, it is still one of the least integrated regions compared to other regions. Until recently, regional cooperation activities in Asia have focused mainly on subregional cooperation. In Asia, the major subregional economic cooperation initiatives consisting of several Asian countries include (i) ASEAN in East Asia, (ii) SAARC in South Asia, (iii) Greater Mekong Subregion Economic Cooperation Program (GMS) in Southeast and East Asia, (iv) South Asia Subregional Economic Cooperation (SASEC) in South Asia, (v) BIMSTEC in South and Southeast Asia, (vi) Brunei Indonesia Malaysia Philippines–East ASEAN Growth Area (BIMP-EAGA) in Southeast Asia and (vii) Kunming Economic Cooperation Initiative among Bangladesh, PRC, India, and Myanmar in South and East Asia. GMS, BIMP-EGA and SASEC are more related to cooperation regarding cross-border infrastructure development and regional public goods. Bilateral trade accords are ascending, marking a shift from a regional emphasis on multilateralism. There are aggressive pursuits of these deals among Asian countries, and between Asian and non-Asian countries. A new dimension to regional cooperation is evolving as "bridges" and "linkages" built across sub-regions. There are several FTAs involving countries belonging to various subregions of Asia, such as, ASEAN and India FTA, Singapore-India FTA and Thailand-India FTA. SAARC, formed in 1985, started with much fanfare but is still crawling due to political factors between major trading partners of this region. The Bangkok Agreement (BA) started in the early 80s, but it is yet to take off. Revitalization of the BA is mooted extending its members to some developed countries. Much touted Asian Economic Community is still at the conceptual stage due to complex web of FTAs among different divergent groups of countries in the Asian region, and is unlikely to materialize because of its scope and coverage. India has recently concluded some Comprehensive Economic and Cooperation Agreements (CECA) with some Asian countries without crystallizing the frontier of liberalization of trade through PTAs, which will be culminated with FTAs. Regional integration among the South Asian countries is the weakest in the world, next to Sub-Saharan countries. Even after 20 years of its formation, the first of this kind in this region, intraregional trade among SAARC countries hovered around 4%–4.5%. Any attempt to forge intraregional economic cooperation through PTAs remains unsuccessful due to political differences between two major trading partners of this region. As a first step to enhance regional economic cooperation, member countries thought to conclude PTA among them in order to promote intraregional trade. The first South Asian Preferential Tariff Arrangement (SAPTA) was concluded in 1995, just 10 years after the formation of SAARC. So far, member countries have concluded three rounds of SAPTA negotiations (i.e., SAPTA I, II, III) and reached an agreement for the conclusion of SAPTA IV with national schedules of the respective countries. In the Islamabad Meet in 2004, member countries have unanimously adopted a resolution to form South Asian Free Trade Arrangement (SAFTA) in
5
January 2006, but countries still have to go a long way to materialize this vision. To date, SAARC is far away from achieving SAFTA.
Due to inherent weaknesses of SAARC to emerge as a vibrant regional trading bloc, India is looking for other options to form regional groupings. According to the SAARC Charter, any member can form a subregional group for enhancing intraregional trade through PTAs. India has so far explored Bangladesh, Bhutan, India, and Nepal – Growth Quadrangle (BBIN-GQ) and Mekong–Ganga Cooperation incorporating 5 ASEAN countries (i.e., Cambodia, Lao PDR, Myanmar, Thailand, and Viet Nam) without any worthwhile progress in this area. Realizing the importance of economic cooperation between South and South East Asia, Thailand took the initiative in 1994 to explore the possibility of the formation of a subregional group encompassing this region. After a series of deliberations of Inter-Ministerial Consultation and with the active support of Asian Development Bank (ADB) and United Nations Economic and Social Commission for Asia and the Pacific (UNESCAP), a regional forum was established in 1997 with initially four countries (i.e., Bangladesh, India, Sri Lanka, and Thailand. Myanmar joined the forum later on in the newly formed subregional group, which was formally known as Bangladesh-India-Myanmar-Sri Lanka-Thailand Economic Cooperation (BIMSTEC), and is now known as Bay of Bengal Initiative for Multisectoral Technical and Economic Cooperation. This subregional group not only aims to increase intraregional trade among the members, but also include wider areas of cooperation, i.e., investment, industry, technology, human resource development, agriculture, and infrastructure. BIMSTEC: A Journey towards Regional Integration Historically, all countries of the BIMSTEC were linked with each other for their regular trade through land route and sea. Going back into the memory lane, one can see that land and sea routes between Arabia and China ran through this region, which was possibly among the richest part of the world built on free trade till the Portuguese arrived on the scene. It is a well-known fact that these countries had a common history, culture and commercial ties with each other over centuries. In the ancient times, India’s trade linkage with these countries through sea route was among the best in the world. The famous ‘silk route’ between India and ASEAN countries was the main artery of economic activity of this region, which India, of late, had initiated to revive its past glory to rejuvenate the economic landscape of this region. The formation of BIMSTEC can be attributed to two things: (i) one is the failure of SAARC to form a vibrant regional forum for trade and economic cooperation; and (ii) ongoing process of liberalization of South Asian economies desperate to discover new markets in the ASEAN region as a substitute of SAARC, whose scope is limited due to non-economic factor that is unlikely to change in the near future. Another factor, which may be cited for the formation of this bloc, is Thailand’s desire to establish strong foothold on the Indian subcontinent because of increasing competition it has been facing in the ASEAN markets. Though BIMSTEC came into existence very recently, its formation can be traced back to mid-1960s, when both India and Sri Lanka were invited to join ASEAN but declined. In 1981, Sri Lanka made an unsuccessful attempt to join ASEAN, but it was both India and Pakistan which obtained Dialogue Partner status in 1993. The approach of South Asian countries to establish link and enhance economic cooperation shows their intention to strengthen economic relations with the ASEAN countries (Kelegama 2000). BIMSTEC may be used as a conduit for South Asian countries to establish and develop a good relationship with the ASEAN countries. Keeping this objective in mind, Bangladesh, India, Sri Lanka, and Thailand requested UNESCAP to undertake a study on the practicality of the formation of a regional forum among themselves, which culminated with a document on “BIMSTEC Development Programme: Overview and Sectoral Cooperation” in 1997. The Report identifies sectoral cooperation in the areas of technology, transport and communications, energy, tourism, agriculture, fisheries, and human resource development. Based on the report, a trans-South Asian regional forum was established in June 1997 to strengthen cooperation in the areas of trade and investment inter alia. Initially, it had 4 members: Bangladesh, India, Sri Lanka and Thailand. The first Ministerial Meeting was held in Bangkok in December 1997, where it got expanded with Myanmar’s membership. Nepal was given an observer status in 1999, but now both Nepal and Bhutan have become full-fledged members along with two South East Asian nations. BIMSTEC also adopted a framework agreement for an FTA to be implemented within 10 years at its first summit held in Bangkok in July 2004.
6
All members of the group have identified six major areas for strengthening economic cooperation and have also assigned one lead country for each group. Bangladesh is tasked to take care of investment, technology is given to Sri Lanka, and India is asked to lead tourism, and transport and communication sectors, energy is given to Myanmar, and Thailand to lead the fishery sector. Expert level meetings have already taken place in areas of tourism, fisheries, and trade and investment. But priority was given to some sub-sectors such as e-BIMSTEC and speedy completion of the BIMSTEC component of the Trans-Asian Railway and Asian highway projects. Every country of this bloc is keen to have more dialogues and to upgrade it to the ministerial level. Five ministerial meetings have taken place: Bangkok in December 1997; Dhaka in December 1998; New Delhi in July 2000; Yangon in December 2001; and Colombo in December 2002. At the fourth meeting, it was decided that member countries would upgrade the meeting to full ministerial level from the Deputy Minister/Minister of State level and the fifth meeting at Sri Lanka was the first meeting at the level of ministers. The trade and economic ministers had three meetings: Bangkok in August 1998; New Delhi in April 2000; and Yangon in February 2001. Right from the first meeting, trade and industry ministers have emphasized the setting up of a free trade area in the region for which it was decided that Heads of States of all governments meet in Thailand in the first quarter of 2004. Exploring the possibility of free trade among its members and to make it operational, Ministers of the group in their Third Meeting in Yangon set-up a Group of Experts (GOE), with India as the Chair country to work out the details of a time-bound program in this regard. The GOE held two meetings and has recommended a negative list approach toward achieving this objective. Another decision was to set-up a BIMSTEC Secretariat in Thailand. Since the moratorium on the expansion of membership ended in 2002, the meeting decided the criteria to be involved for the expansion of membership. The year 2004 had been declared the “Visit BIMSTEC Year” in which expert groups on tourism were asked to make a detailed plan for the success of the event at its meeting in February 2003. In sideline of the governments’ approaches, the private sector had also taken initiatives to expedite the process of integration, which included establishing the Chambers of Commerce and Federation of Processed Food Industries, exclusively for the region. BIMSTEC member countries are also contemplating on the formation of BIMSTEC Economic Forum in line with the Pacific Economic Cooperation Council, whose basic objective is the formation of independent academic and business groups for regular interactions with government officials. In order to make these groups active, there should be independent funds both for research institutions and academic groups (Kelegama, 1998) in line with Asia-Pacific Economic Cooperation (APEC) and Indian Ocean Rim - Association for Regional Cooperation (IOR-ARC), 5 so that they can conduct independent studies estimating the gains from economic cooperation of this region. This should be seriously thought of since there is not much enthusiasm from the private sector about the possible gains from the economic cooperation of this region so far. BIMSTEC-Japan Trade: Patterns and Trends BIMSTEC is the first formal link between South Asian and South East Asian countries bridging India’s Look East Policy with Thailand’s Look West Policy. For India, it is the best alternative to SAARC, which is almost defunct due to the Pakistan factor. It provides the best opportunities for the inclusion of Myanmar and Thailand which has been the real thrust givers to this regional grouping. Besides providing a link between South East Asia and South Asia, BIMSTEC has massive potential in hydroelectricity and hydrocarbons. Issues of hydroelectricity and natural gas supply from Nepal and Bangladesh are of immense importance to India. BIMSTEC is expected to be more successful in enhancing intraregional trade because of its proximity of demand and strong historical, cultural, and economic ties with member countries.
5 The Indian Ocean Rim Association for Regional Cooperation was launched in Mauritius in 1997. The Association comprises 18
member states: Australia, Bangladesh, India, Indonesia, Iran, Kenya, Madagascar, Malaysia, Mauritius, Mozambique, Oman, Singapore, South Africa, Sri Lanka, Tanzania, Thailand, UAE, and Yemen. Egypt, France, Japan, People’s Republic of China, and the United Kingdom are dialogue partners, while the Indian Ocean Tourism Organisation is an observer. Seychelles withdrew as a member on 1 July 2003. The Association aims to facilitate trade and investment in the region. Working groups have business and academic representatives to ensure that different points of view and interests are fully reflected in IOR-ARC's work program.
7
Prior to the formation of a trading bloc, every member has been attached with another with some PTA. Bangladesh has extended South Asia Preferential Trading Arrangement (SAPTA) to India and Sri Lanka and Global System of Trade Preference (GSTP) and Bangkok Agreement (BA) to Thailand. Both Bangladesh and India are the beneficiaries of BA and GSTP. India covers Bangladesh in SAPTA, GSTP and BA, and GSTP to Thailand. India and Sri Lanka concluded Indo-Sri Lanka Bilateral Trading Arrangement in 1998, which came into force in 2000, under which India gave duty free treatment to almost all Sri Lankan products except few negative lists and on 31 March 2003, where Sri Lanka will give free market access to Indian products by 2008 with few negative lists. Myanmar does not have any economic cooperation agreement with South Asian countries. Since it is one of the members of ASEAN, it has extended PTAs with ASEAN countries only. Sri Lanka extends PTAs to Bangladesh through SAPTA, BA and GSPT and to India; these are SAPTA, Indo-Sri Lanka Bilateral Trade Agreement (ISLBTA) and BA. Thailand extends GSTP to Bangladesh, India and Sri Lanka and ASEAN PTA to Myanmar. The matrix of PTAs among the BIMSTEC countries is shown in Table 1.
Table 1: Existing PTAs among BIMSTEC Countries
To: Bangladesh India Myanmar Sri Lanka Thailand From Bangladesh SAPTA SAPTA GSTP BA BA GSTP GSTP India SAPTA SAPTA GSTP GSTP ISLBTA BA BA Myanmar ASEAN PTA Sri Lanka SAPTA SAPTA GSTP BA ISLBTA GSTP BA GSTP
Thailand GSTP GSTP ASEAN
PTA GSTP
GSTP= Global System of Trade Preference, BA= Bangkok Agreement, ISLBTA= Indo-Sri Lanka Bilateral Trade Agreement, SAPTA=South Asia Preferential Trading Arrangement
Source: Saman Kelegama, Bangkok Agreement and BIMSTEC: Crawling Regional Economic Groupings in Asia, Journal of Asian Economics, 2001, p.115
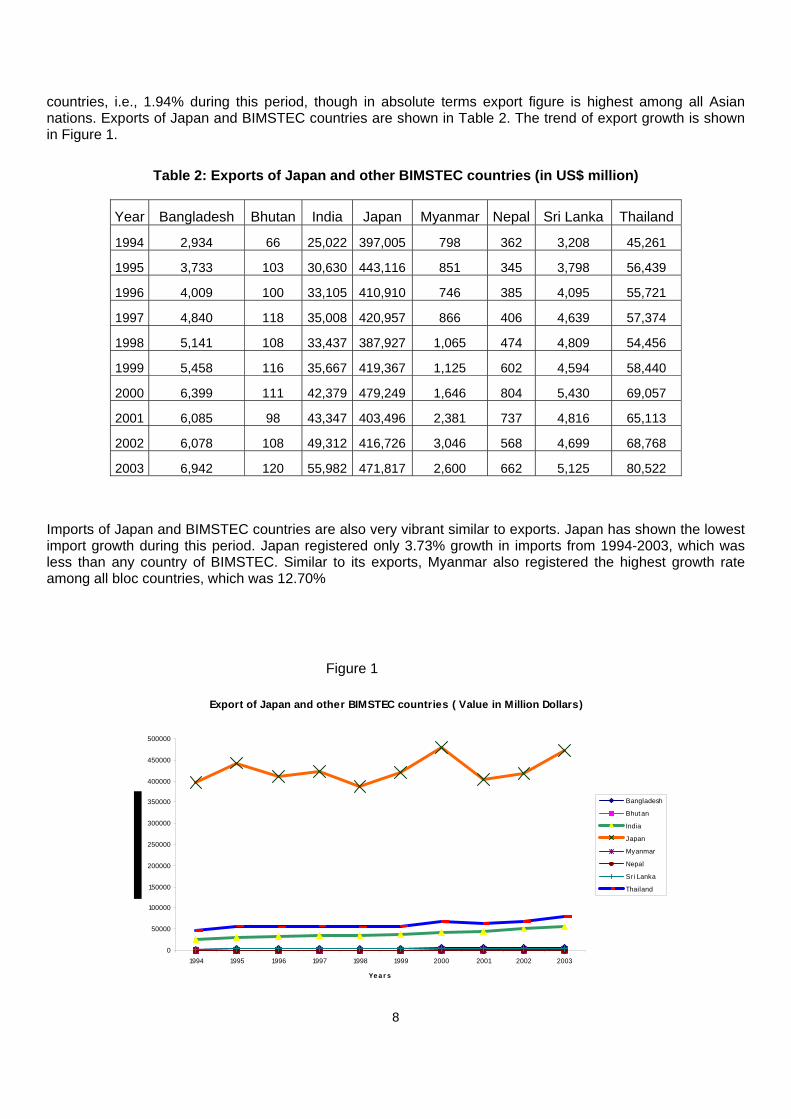
Intraregional trade among the BIMSTEC countries was 14.75% in 2003, which showed that there is much potential in augmenting trade and investment among the members of BIMSTEC. Though it is not a fully active regional forum, time series data showed that intraregional trade (including Japan) increased significantly over the years. Bangladesh’s intraregional trade showed a significant increase from 10.14% of its total trade in 2001 to 15.21% in 2003. . India’s intraregional trade increased from 4.12% in 2001 to 6.61% in 2003. Corresponding figures for Myanmar were 27.63% and 33.13% respectively. Nepal’s intraregional trade has declined from 43.07% to 37.6% during the same period. Sri Lanka’s share increased from 8.33% to 17.86% during the same comparable periods. Thailand’s share of intraregional trade en increased astronomically from 2.19% in 2001 to 21.16% in 2003. The growth of Japan-BIMSTEC trade has been significant. Data on exports of Japan and BIMSTEC countries show that growth rate is much higher and relatively smaller in poorer countries compared to that of the more developed countries. An analysis of the export data from 1994 to 2003 for eight countries, including Japan, shows that the growth rate of exports is highest in the case of Myanmar, which registered an exponential growth of 14.02% during this period, followed by Bangladesh, whose growth in exports was 10.04%. India’s export growth rate during this period was 9.35%. Growth rates of exports of Bhutan and Nepal are also very impressive. During this period, Nepal registered an export growth of 6.93%, and the figure was 6.86% in case of Bhutan. Thailand has experienced a moderate growth of 6.61% in exports during this period, followed by Sri Lanka whose rate was 5.34%. Surprisingly, Japan has registered the lowest growth in exports among all
8
countries, i.e., 1.94% during this period, though in absolute terms export figure is highest among all Asian nations. Exports of Japan and BIMSTEC countries are shown in Table 2. The trend of export growth is shown in Figure 1.
Table 2: Exports of Japan and other BIMSTEC countries (in US$ million)
Year Bangladesh Bhutan India Japan Myanmar Nepal Sri Lanka Thailand
1994 2,934 66 25,022 397,005 798 362 3,208 45,261
1995 3,733 103 30,630 443,116 851 345 3,798 56,439
1996 4,009 100 33,105 410,910 746 385 4,095 55,721
1997 4,840 118 35,008 420,957 866 406 4,639 57,374
1998 5,141 108 33,437 387,927 1,065 474 4,809 54,456
1999 5,458 116 35,667 419,367 1,125 602 4,594 58,440
2000 6,399 111 42,379 479,249 1,646 804 5,430 69,057
2001 6,085 98 43,347 403,496 2,381 737 4,816 65,113
2002 6,078 108 49,312 416,726 3,046 568 4,699 68,768
2003 6,942 120 55,982 471,817 2,600 662 5,125 80,522
Imports of Japan and BIMSTEC countries are also very vibrant similar to exports. Japan has shown the lowest import growth during this period. Japan registered only 3.73% growth in imports from 1994-2003, which was less than any country of BIMSTEC. Similar to its exports, Myanmar also registered the highest growth rate among all bloc countries, which was 12.70%
Figure 1
Export of Japan and other BIMSTEC countries ( Value in Million Dollars)
0
50000
100000
150000
200000
250000
300000
350000
400000
450000
500000
1994 1995 1996 1997 1998 1999 2000 2001 2002 2003
Ye a r s
Bangladesh
Bhut an
India
Japan
Myanmar
Nepal
Sri Lanka
Thailand

9
during this period. Import growth of India was also higher compared to other countries of the region during this period. India registered an import growth of 11.36% followed by Bhutan whose growth in imports was 9.01% Bangladesh’s imports also registered a higher growth of 8.35%. Growth rates of Nepal, Sri Lanka and Thailand are less compared to other members. During the same period, Nepal registered an import growth of 4.75% and growth rates for Sri Lanka and Thailand were 3.80% and 3.74%, respectively. The trends and patterns of import growth of Japan and other BIMSTEC countries are shown in Table 3 and Figure 2.
Table 3: Imports of Japan and other BIMSTEC countries (in US$ million)
Year Bangladesh Bhutan India Japan Myanmar Nepal Sri Lanka Thailand1994 4,602 92 26,843 275,235 886 1,155 4,767 54,459 1995 6,502 112 34,707 335,882 1,335 1,333 5,306 70,786 1996 6,621 128 37,942 349,152 1,358 1,398 5,442 72,332 1997 6,898 137 41,432 338,754 2,037 1,693 5,864 62,854 1998 6,974 134 42,980 280,484 2,666 1,246 5,905 42,971 1999 7,694 182 46,979 311,262 2,300 1,422 5,961 50,342 2000 8,360 203 51,523 379,511 2,401 1,573 7,177 61,924 2001 8,350 191 50,392 349,089 2,877 1,473 5,973 62,058 2002 7,914 165 56,517 337,194 2,348 1,419 6,105 64,658 2003 9,476 200 70,707 382,930 2,600 1,754 6,672 75,809
Figure 2
Imports of Japan and other BIMSTEC countries
0
50000
100000
150000
200000
250000
300000
350000
400000
1994 1995 1996 1997 1998 1999 2000 2001 2002 2003
Years
Valu
e in
Mill
ion
US
Dol
lars Bangladesh
Bhutan
India
Japan
Myanmar
Nepal
Sri Lanka
Thailand
The matrices of intraregional exports and imports between Japan and BIMSTEC countries and total trade for 2003 are shown in Tables 4 and 5, respectively. This is based on 2003 data, which is the latest available complete data on the direction of intraregional trade. Table 4 also shows the total world exports and imports of the respective countries. The consolidated figures on total intraregional trade of Japan and BIMSTEC countries and the share of trade with the BIMSTEC in total world trade of the respective countries are presented in Table
10
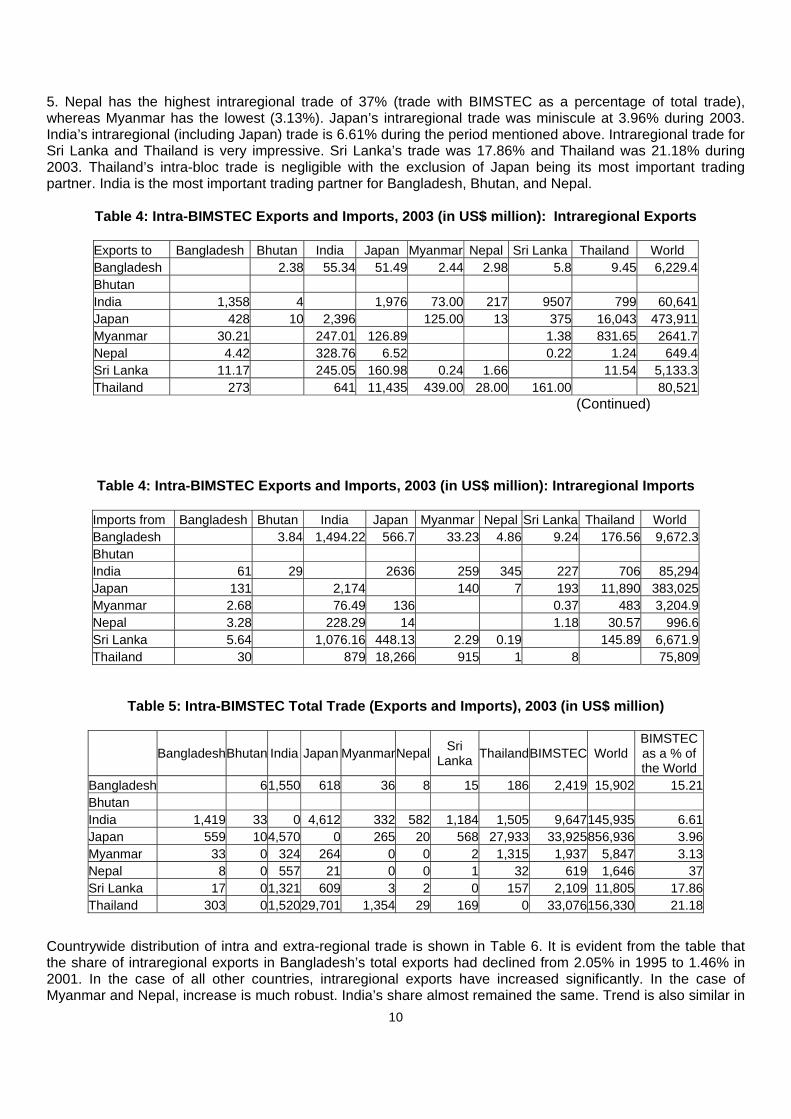
5. Nepal has the highest intraregional trade of 37% (trade with BIMSTEC as a percentage of total trade), whereas Myanmar has the lowest (3.13%). Japan’s intraregional trade was miniscule at 3.96% during 2003. India’s intraregional (including Japan) trade is 6.61% during the period mentioned above. Intraregional trade for Sri Lanka and Thailand is very impressive. Sri Lanka’s trade was 17.86% and Thailand was 21.18% during 2003. Thailand’s intra-bloc trade is negligible with the exclusion of Japan being its most important trading partner. India is the most important trading partner for Bangladesh, Bhutan, and Nepal.
Table 4: Intra-BIMSTEC Exports and Imports, 2003 (in US$ million): Intraregional Exports
Exports to Bangladesh Bhutan India Japan Myanmar Nepal Sri Lanka Thailand World Bangladesh 2.38 55.34 51.49 2.44 2.98 5.8 9.45 6,229.4Bhutan India 1,358 4 1,976 73.00 217 9507 799 60,641Japan 428 10 2,396 125.00 13 375 16,043 473,911Myanmar 30.21 247.01 126.89 1.38 831.65 2641.7Nepal 4.42 328.76 6.52 0.22 1.24 649.4Sri Lanka 11.17 245.05 160.98 0.24 1.66 11.54 5,133.3Thailand 273 641 11,435 439.00 28.00 161.00 80,521
(Continued)
Table 4: Intra-BIMSTEC Exports and Imports, 2003 (in US$ million): Intraregional Imports
Imports from Bangladesh Bhutan India Japan Myanmar Nepal Sri Lanka Thailand World Bangladesh 3.84 1,494.22 566.7 33.23 4.86 9.24 176.56 9,672.3Bhutan India 61 29 2636 259 345 227 706 85,294Japan 131 2,174 140 7 193 11,890 383,025Myanmar 2.68 76.49 136 0.37 483 3,204.9Nepal 3.28 228.29 14 1.18 30.57 996.6Sri Lanka 5.64 1,076.16 448.13 2.29 0.19 145.89 6,671.9Thailand 30 879 18,266 915 1 8 75,809
Table 5: Intra-BIMSTEC Total Trade (Exports and Imports), 2003 (in US$ million)
BangladeshBhutan India Japan MyanmarNepal Sri
Lanka ThailandBIMSTEC World BIMSTEC as a % of the World
Bangladesh 6 1,550 618 36 8 15 186 2,419 15,902 15.21Bhutan India 1,419 33 0 4,612 332 582 1,184 1,505 9,647145,935 6.61Japan 559 10 4,570 0 265 20 568 27,933 33,925856,936 3.96Myanmar 33 0 324 264 0 0 2 1,315 1,937 5,847 3.13Nepal 8 0 557 21 0 0 1 32 619 1,646 37Sri Lanka 17 0 1,321 609 3 2 0 157 2,109 11,805 17.86Thailand 303 0 1,52029,701 1,354 29 169 0 33,076156,330 21.18
Countrywide distribution of intra and extra-regional trade is shown in Table 6. It is evident from the table that the share of intraregional exports in Bangladesh’s total exports had declined from 2.05% in 1995 to 1.46% in 2001. In the case of all other countries, intraregional exports have increased significantly. In the case of Myanmar and Nepal, increase is much robust. India’s share almost remained the same. Trend is also similar in

11
the case of imports where share of intraregional imports in Bangladesh’s total imports have declined slightly, whereas the same has increased significantly for Nepal, Myanmar, and Thailand. Even India’s share had improved from 1.35% to 2.33% from 1995 to 2001.
Table 6: Countrywide Intra and Extra-BIMSTEC Shares in Trade
Export Share (%) Import Share (%) Trade Share (%) Intra-Bloc Extra-Bloc Intra-Bloc Extra-Bloc Intra-Bloc Extra-Bloc
Countries 1995 2001 1995 2001 1995 2001 1995 2001 1995 2001 1995 2001Bangladesh 2.05 1.46 97.95 98.54 16.84 15.67 83.16 84.33 12.03 10.14 87.97 89.86India 6.37 6.22 93.63 93.78 1.35 2.33 98.65 97.67 3.71 4.12 96.29 95.88Myanmar 15.69 37.49 84.31 62.51 1.07 17.4 98.93 82.6 6.02 27.63 93.98 72.37Nepal 9.26 35.03 90.74 64.97 35.33 46.49 64.67 53.51 27.59 43.07 72.41 56.93Sri Lanka 1.68 2.54 98.34 97.46 13.19 13.1 86.81 86.9 7.9 8.33 92.1 91.67Thailand 1.45 1.9 98.55 98.1 0.97 2.5 99.03 97.5 1.18 2.19 98.82 97.81
The trends in total trade show a similar picture. Bangladesh’s intraregional trade has declined slightly from 12.03% in 1995 to 10.14% in 2001. All other countries’ shares of intraregional trade have increased, with the most notable increase for Thailand, Myanmar, and Nepal. Therefore, intraregional trade has been picking up and will increase further if every country agreed to preferential trading followed by FTAs with each other. Prior to the formation of PTAs and FTAs, it is important to assess the significance of the external sector to the total national economy. The importance of the external sector can be gauged by the degree of openness of the respective economies, which can be measured by the trade-Gross Domestic Product (GDP) ratios of the countries taken into consideration. A country is considered to be more open if its trade-GDP ratio is higher. The gain of a country from the PTA and FTA depends on its degree of openness. The higher the degree of openness, the higher is the gain from FTA. As it is evident from Table 7, trade-GDP ratio in Bangladesh was 31.83% in 2003, which was 45.94% in the case of Bhutan and 21.09% in the case of India and 19.97% in the case of Japan. The ratios for Nepal, Sri Lanka and Thailand were 41.29%, 64.69% and 109.36% respectively. Thailand’s external sector is very vibrant compared to other members of the BIMSTEC. Ratios are relatively less in both Japan and India because of their robust domestic demand and size of the economies. Trade-GDP ratios of the BIMSTEC countries, including Japan, are shown in Table 7.
Table 7: Trade of Goods as a Percentage of GDP
Year Bangladesh Bhutan India Japan Myanmar Nepal Sri Lanka Thailand1994 22.32 57.72 16.08 14.02 - 37.3 68.05 69.001995 26.98 69.28 18.4 14.75 - 38.13 69.87 75.781996 28.14 68.42 18.43 16.21 - 39.43 68.62 7.481997 27.74 64.69 18.66 17.64 - 42.67 69.6 79.681998 27.48 60.05 18.47 17.00 - 35.42 67.83 87.11999 28.62 66.96 18.49 16.41 - 41.21 67.41 88.922000 31.28 64.41 20.53 18.09 - 43.26 77.19 106.732001 30.72 53.95 19.59 18.08 - 39.54 68.52 110.072002 29.42 45.25 20.74 18.98 - 35.73 65.3 105.252003 31.83 45.94 21.09 19.87 - 41.29 64.69 109.36
Assessing Likely Impact of PTAs and FTA between Japan and BIMSTEC: Quantifying the Trade Impact Analytical Framework One of the key questions regarding the benefits of FTA is: this BIMSTEC-Japan economic cooperation increase intraregional trade? Several studies attempted to estimate the effects of regional trading blocs on
12
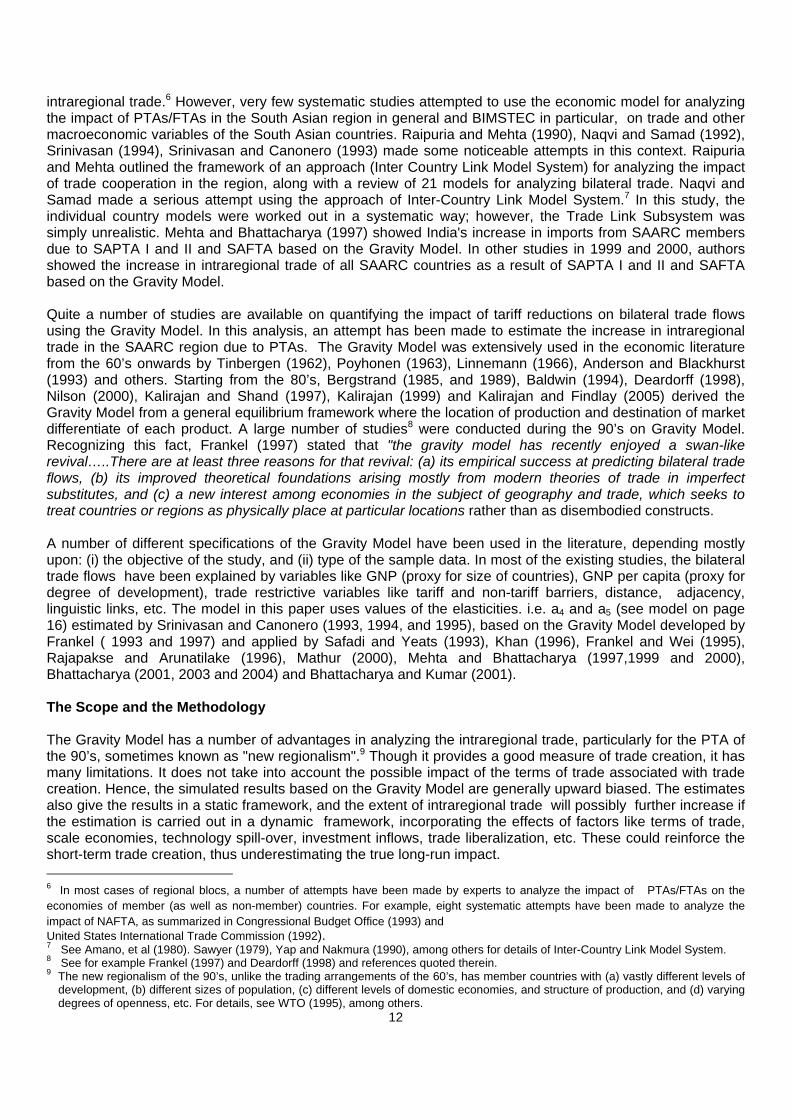
intraregional trade.6 However, very few systematic studies attempted to use the economic model for analyzing the impact of PTAs/FTAs in the South Asian region in general and BIMSTEC in particular, on trade and other macroeconomic variables of the South Asian countries. Raipuria and Mehta (1990), Naqvi and Samad (1992), Srinivasan (1994), Srinivasan and Canonero (1993) made some noticeable attempts in this context. Raipuria and Mehta outlined the framework of an approach (Inter Country Link Model System) for analyzing the impact of trade cooperation in the region, along with a review of 21 models for analyzing bilateral trade. Naqvi and Samad made a serious attempt using the approach of Inter-Country Link Model System.7 In this study, the individual country models were worked out in a systematic way; however, the Trade Link Subsystem was simply unrealistic. Mehta and Bhattacharya (1997) showed India's increase in imports from SAARC members due to SAPTA I and II and SAFTA based on the Gravity Model. In other studies in 1999 and 2000, authors showed the increase in intraregional trade of all SAARC countries as a result of SAPTA I and II and SAFTA based on the Gravity Model. Quite a number of studies are available on quantifying the impact of tariff reductions on bilateral trade flows using the Gravity Model. In this analysis, an attempt has been made to estimate the increase in intraregional trade in the SAARC region due to PTAs. The Gravity Model was extensively used in the economic literature from the 60’s onwards by Tinbergen (1962), Poyhonen (1963), Linnemann (1966), Anderson and Blackhurst (1993) and others. Starting from the 80’s, Bergstrand (1985, and 1989), Baldwin (1994), Deardorff (1998), Nilson (2000), Kalirajan and Shand (1997), Kalirajan (1999) and Kalirajan and Findlay (2005) derived the Gravity Model from a general equilibrium framework where the location of production and destination of market differentiate of each product. A large number of studies8 were conducted during the 90’s on Gravity Model. Recognizing this fact, Frankel (1997) stated that "the gravity model has recently enjoyed a swan-like revival…..There are at least three reasons for that revival: (a) its empirical success at predicting bilateral trade flows, (b) its improved theoretical foundations arising mostly from modern theories of trade in imperfect substitutes, and (c) a new interest among economies in the subject of geography and trade, which seeks to treat countries or regions as physically place at particular locations rather than as disembodied constructs. A number of different specifications of the Gravity Model have been used in the literature, depending mostly upon: (i) the objective of the study, and (ii) type of the sample data. In most of the existing studies, the bilateral trade flows have been explained by variables like GNP (proxy for size of countries), GNP per capita (proxy for degree of development), trade restrictive variables like tariff and non-tariff barriers, distance, adjacency, linguistic links, etc. The model in this paper uses values of the elasticities. i.e. a4 and a5 (see model on page 16) estimated by Srinivasan and Canonero (1993, 1994, and 1995), based on the Gravity Model developed by Frankel ( 1993 and 1997) and applied by Safadi and Yeats (1993), Khan (1996), Frankel and Wei (1995), Rajapakse and Arunatilake (1996), Mathur (2000), Mehta and Bhattacharya (1997,1999 and 2000), Bhattacharya (2001, 2003 and 2004) and Bhattacharya and Kumar (2001). The Scope and the Methodology The Gravity Model has a number of advantages in analyzing the intraregional trade, particularly for the PTA of the 90’s, sometimes known as "new regionalism".9 Though it provides a good measure of trade creation, it has many limitations. It does not take into account the possible impact of the terms of trade associated with trade creation. Hence, the simulated results based on the Gravity Model are generally upward biased. The estimates also give the results in a static framework, and the extent of intraregional trade will possibly further increase if the estimation is carried out in a dynamic framework, incorporating the effects of factors like terms of trade, scale economies, technology spill-over, investment inflows, trade liberalization, etc. These could reinforce the short-term trade creation, thus underestimating the true long-run impact. 6 In most cases of regional blocs, a number of attempts have been made by experts to analyze the impact of PTAs/FTAs on the economies of member (as well as non-member) countries. For example, eight systematic attempts have been made to analyze the impact of NAFTA, as summarized in Congressional Budget Office (1993) and United States International Trade Commission (1992). 7 See Amano, et al (1980). Sawyer (1979), Yap and Nakmura (1990), among others for details of Inter-Country Link Model System. 8 See for example Frankel (1997) and Deardorff (1998) and references quoted therein. 9 The new regionalism of the 90’s, unlike the trading arrangements of the 60’s, has member countries with (a) vastly different levels of
development, (b) different sizes of population, (c) different levels of domestic economies, and structure of production, and (d) varying degrees of openness, etc. For details, see WTO (1995), among others.

13
Due to lack of basic information to quantify the required variables, the estimation of the parameters related to aforementioned factors becomes difficult. For example, some price elasticities could be approximated but information on scale economies do not exist. However, a number of existing studies have shown that the short-term impact is higher than the dynamic impact. The results in this paper do not take into consideration the concessions offered in the form of non-tariff barriers; it only considers reduction of tariffs under different scenarios, which is purely hypothetical. The results of alternate scenarios have also not measured the effect of PTAs/FTAs on different variables related to welfare.10 Even if the simulations undertaken here correctly measure the impact on trade creation, it should be realized that this impact is not the only factor to be taken into account in evaluating FTAs. The negative effect on bilateral trade with countries not entering in the simulated arrangement is not assessed in these simulations. Therefore, none of the indicators from the simulations could be viewed as a welfare measure, thus making the comparison of different scenarios incomplete. The results of the simulations presented here serve the limited purpose of providing an estimate of the potential effects on bilateral trade between each BIMSTEC country and its partner Japan in the simulated PTA. The analysis has measured the impact of PTAs by the proportionate change in exports and imports of Japan and other BIMSTEC countries in dollars. The higher the initial tariff level on trade between partners, the greater the final effect of reduction and elimination of tariffs. As explained in the model on page 16, the result of reduction of tariffs would be reflected in the increased estimated values of a4 and a5. However, tariff is only one of the many factors that determine the impact of PTA on trade. In assessing the impact, the following factors should be noted. First, since T1 representing tariffs imposed by Japan on its imports from BIMSTEC countries are initially higher than T2 representing tariffs imposed by BIMSTEC countries on their imports from Japan, the higher the coefficient of T2 in absolute values, and the greater the impact of preferential arrangement. Secondly, since a4 and a5 are elasticities indicating the proportionate response of bilateral trade to changes in tariffs, the initial tariff levels as well as initial trade level are relevant for determining the absolute changes in trade in both BIMSTEC countries and Japan following a PTA. A comparative static analysis of tariff reductions has been undertaken under different scenarios and its effects on increase in imports and exports of both Japan and BIMSTEC countries. The objective of this analysis is to see costs and benefits of different PTAs and FTA to different countries of this region in one hand, and trade potentials between Japan and BIMSTEC countries on the other. Four hypothetical scenarios in this study are as follows:
(i) 25% across the board tariff cuts by all countries; (ii) 50% across the board tariff cuts by all countries; (iii) 75% across the board tariff cuts by all countries; and (iv) 100% tariff cuts i.e. free trade among all countries (Japan and BIMSTEC).
The results of the simulations obtained are indicative because these are estimated values based on hypothetical scenarios under the proposed Japan-BIMSTEC economic integration by liberalizing economies through FTAs. However, these simulations do not take into consideration the removal of non-tariff barriers (NTB), which is the major hindrance of free trade in this region. Though tariffs are reduced and then eliminated in a phased manner over the years, it is observed that the extent of NTBs have been increasing over the years, whose trade distorting effects are much more than tariffs. In this analysis, only the gains in terms of trade generation are simulated and not welfare improvement. Data Sources This exercise is based on elasticities estimated by Srinivasan and Canonero (1993) using panel data. Frankel’s estimation procedure is adopted in this model. The results of the simulations are not valid to any particular
10 Pigato, et al. (1997) have estimated the welfare consequences of a scenario when all tariffs between India and rest of the SAARC
member countries (SMCs) are removed. The welfare gains are trade creation benefits - trade diversion losses + terms of trade gains. The welfare results generate significant benefits for both India and the rest of the SMCs. However, it should be noted that the simulation is based on tariff rates of 1993-94 and 1997-98. There is free trade between India-Nepal and India-Bhutan under bilateral trading arrangements.

14
year; these are indicative due to reductions in tariffs under different hypothetical scenarios. Both tariffs and trade data used in this analysis are taken from TRAINS CD-ROM compiled by United Nations Conference on Trade and Development (UNCTAD). Trade and tariffs data are taken for 2003 and in some exceptional cases tariff data are taken for 2004 where data in 2003 are not available. In the case of Japan, there are different average (weighted) tariff rates applicable for different countries depending on the nature of goods of the exporting countries entering the Japanese market. But BIMSTEC countries do not have such detailed average tariff rates applicable to their imports from different countries on different goods. In these cases, an average (weighted) tariff of the respective countries in aggregate rather than countrywide imports is used. Data provided by World Development Indicators by the World Bank were also used here. The Model This analysis used the Gravity Model developed by Frankel, et al. (1993) and extensively used by Safadi and Yeats (1993) in their analysis to estimate the likely impact of the formation of the North American Free Trade Area on South Asia by considering other potential trading arrangements. Following the above methodology, Srinivasan and Canonero (S-C) estimated the effects of PTAs on South Asian countries. This study used the S-C model, adopted by S-C (1993, 1994, and 1997). The main texture of the S-C model is as follows: Log BTI c, d, t = a 0 + a1 log (GNP c, t * GNP d, t) + a2 log (PCGNPc, t * PCGNPd, t) +
a3 Dc, d + a4 log (1+ TRc, d) + a5 log (1+TRd,c) + a6 log REXRTc, d, t + e c, d, t
and e c, d, t = uc + vd + wt + ηc, d, t, where, BTI c, d, t = Bilateral trade of commodity 'I' between country 'c' and Country/region’d’ at time’t’. GNPc, t (or GNPd, t ) = Gross National Product of country 'c' ( or 'd' ) at time t PCGNPc, t (or, PCGNPd, t) = Per capita Gross National Product of country 'c' on Country’d’. Dc, d = Distance between relevant centers of ‘c’ on country 'd'. TRc, d = Tariff rate imposed by country 'c' on country’d’. TRd, c = Tariff rate imposed by country’d’ on country 'c'. REXRTc, d, t = Real Effective Exchange Rate between countries 'c' and 'd', at time 't'. u, v = country specific effects w = temporal effects η = random effects a = regression coefficients S-C used the cross-country data (of 21 trading countries/partners) over time (i.e., 1968–1991) to estimate the above mentioned gravity equation for 9 commodity groups. The commodity groups have been selected keeping in view the trade of South Asian countries. Further, the variance-component regression model was adopted to capture the spatial impact of individual countries (u and v) and time period (t). Although the model used by S-C captures the impact of country characteristics and temporal effects through variance components, and are estimated for the commodity groups relevant to South Asia.11 This model has a number of limitations. The simulations are based on the same tariff rate for all the 9 commodity groups. To quote an example, India's tariff rates for both clothing and fuels were taken as 42% in their study. Further, the
11 This portion is heavily drawn from the analysis of Mehta, R.K. and Bhattacharya, S. K., SAPTA to SAFTA: Impact on Intraregional
Trade, Paper presented to the 35th Annual Conference of the Indian Econometric Society, Jaipur, March 11-13, 1999. The authors are very grateful to Rajesh Mehta for his contribution to the specification of the model.

15
estimation of the Variance Component Model is carried out using data for incomplete panels, i.e. missing observations. But the estimation procedure does not seem to capture the features of incomplete repeated samples. The estimates of the Variance Component Model for incomplete panels were examined in the literature by Biφrn (1981), Wansbeek and Kapteyn (1989) and others. In spite of all these limitations, the fitted regression equations of 8 commodity groups are very satisfactory. Some of the relevant parameters of the regression equation used in simulations are reported below for ready reference. The essence of the Gravity Model is that bilateral trade flow is positively related to the size of the two countries and inversely related to the distance between them. This follows the concept of physical science, where gravity force is directly proportional to the mass of two bodies and inversely proportional to the distance between them.12 The Methodology The elasticities estimated by S-C are given in Table 8. Coefficient “a5” is relevant while estimating gains from exports of both Japan and BIMSTEC countries at different levels of desegregation as well as total exports. On the other hand, coefficient “a4” is considered in estimating increase in intraregional imports of different countries due to PTAs and FTA. For estimating increase in Japan’s exports to and imports from BIMSTEC countries and vice-versa, elasticities estimated by S- C were used. These elasticities are a bit higher than what it usually should be. However, these are the most dependable scientific calculation of elasticities valid for South Asian countries. The elasticities are higher because these are tariff elasticities and not the usual price elasticities, meaning the increase in trade is estimated due to reduction in tariffs but not reduction in price as it was explained earlier. While estimating a likely increase in Japan’s imports from BIMSTEC in value terms, a Variance Component Model is used. The entire commodities at 8-digit level are grouped into nine major groups. S-C estimated elasticities by using panel data.
Table 8: Elasticities of Major Commodities
Group
No.
Commodity Groups ‘a4’ ‘a5’
I Total Trade -3.9 -4.66 I Coffee, tea, coca & spices -5.81 -0.43 II Textile fibre -15.38 -7.78 III Fuels -3.83 -8.15 IV Non-fuel primaries(except covered in I&II -4.76 -6.0 V Leather, dressed, fur etc -2.08 -2.73 VI Textile yarn, fabrics etc -5.16 -4.31 VII Machine & transport equipt. -3.45 -3.14 VIII Clothing -2.41 -10.03 IX Other manufactures -4.66 -4.77
Source: Srinivasan and Canonero (1993).
Given the estimated parametric value of ‘a4’ and ‘a5’ from the fitted regression equations (of the 9 commodity groups), and changes in tariff rates under different alternative scenarios, the percentage increase in import from d to c (i.e. from BIMSTEC to Japan) and percentage increase in exports from c to d (i.e. from Japan to BIMSTEC) are worked out. The methodology is:
[ exp { ^a log ((1+TRc, d ) 1 / ( 1+ TR c, d ) 0 ) + ½ σ 2 } -1 ] * 100,
12 Beata Kasia Smarzynska (1997),” Resurrecting the Gravity Model: In Search of the Centre of International Trade”, mimeo, Yale
University, p.4

16
and increase of import of c from d (i.e. from BIMSTEC to Japan)
[exp { ^a 5 log ((1+TR d, c ) 1 / (1+TR d, c ) 0 ) + ½ ^σ2 } – 1 ] * 100, and increase of exports from c to d ( i.e. from Japan to BIMSTEC),
where,
^σ2 = σ2a 4 log (1+TR c, d) + a 5 log (1 + TR d, c).
The elasticities used in these simulations are much higher than what it is expected to be. The reasons are as follows: (i) these are not price elasticities, these are tariff elasticities showing the increase in demand due to reduction in preferential tariffs. In BIMSTEC countries in general and SAARC countries (BIMSTEC has five members from SAARC countries) in particular, the role of prices in the intraregional trade is insignificant because the size of the economies is too small (except Thailand) to affect the price structure of the goods traded in this region. Notwithstanding, Nepal and Bhutan have substantial trade linkages with India under bilateral FTA. Therefore, this model has not considered increase in demand with respect to change in prices, which is almost meaningless in this region. In this case 1+TR is the most appropriate method to estimate the increase in trade due to reduction in tariff rather than on price. (ii) Within the BIMSTEC region, trade is not free; therefore prices have marginal impact in determining demand. Intraregional trade is constrained by labyrinth non-tariff barriers like quota and licensing etc. (iii) Elasticities (1+TR) are higher due to the distance factor. It is also a priori true that price elasticity is inversely related to distance. If the distance is less, elasticity is high than the commodities imported by India from the USA and Europe where there is less elasticity due to the distance factor. The increase in Japan’s exports to and imports from BIMSTEC countries is estimated under four hypothetical scenarios:
(i) 25% tariff cuts, (ii) 50% tariff cuts, (iii) 75% tariff cuts, and (iv) 100% tariff cuts, i.e. if there is free trade between Japan and BIMSTEC.
The results of the simulations obtained are only indicative because these are estimated assuming four hypothetical scenarios of preferential tariff concessions. However, these simulations do not take into consideration the gains from trade that may emerge from the liberalization of non-tariff barriers. The gains are simulated from trade creation and not from welfare improvement. Results of the Study The results summarizing the likely increase in intraregional trade between Japan and BIMSTEC countries based on the gravity model under different scenarios, especially under the option of free trade scenario, are presented in Tables 9 to 16. One of the scenarios in the analysis is 100% tariff cuts, which means duty free trade by all countries of this region. This is the situation of free trade without any tariff barriers, but intensity of non-tariff barriers may remain the same. Nevertheless, every country can maintain a smaller negative list in line with the Indo-Sri Lanka Bilateral FTA. In this exercise, an average (weighted) tariff of all countries (i.e., BIMSTEC and Japan) is used for 2003. Tariff rates of different countries during 2003 are as follows: Bangladesh -15.9%, Bhutan - information not available), India - 28%, Japan- 2.4%, Myanmar -3.9%, Nepal - 15.6%, Sri Lanka - 6.8%, and Thailand - 8.3%. It is apparent from the tariff figures of different countries that India has the highest rate of customs tariffs among all countries of this region, while Japan has the lowest tariff rate. Table 9 shows the estimated increase in intraregional imports due to PTAs and FTA in million US dollars. The import of each country is shown under four different aforementioned scenarios, including the free trade option. Every country has 28 probable scenarios of likely increase in imports due to PTAs and FTA, and Table 9 has such 196 scenarios estimating an increase in imports for each country from Japan and BIMSTEC countries under different hypothetical conditions. Bhutan’s increase in imports could be estimated because it’s imports is

17
miniscule (much below one million dollars from other countries), and an average (weighted) tariff rate for 2003 is not available. The estimated increase in exports of Japan and other BIMSTEC countries compared to the rest of the bloc members and Japan through the gravity model under 196 different scenarios are presented in Table 10. Similar to imports, the value of Bhutan’s increase in exports to other countries could not be estimated because of lack of tariff data. Gains from PTAs and FTAs of different countries are roughly determined by the difference between the values of exports and imports in one hand and variation of percentage increase on the other hand. Simulation results of increase in imports and exports of Japan and BIMSTEC countries are shown in Tables 9 and 10.

18
Table 9: Likely Increase in Intraregional (BIMSTEC-Japan) Imports due to PTAs & FTA, 2003
(in US$ Million)
Bangladesh Bhutan India Japan Imports fromScen..I Scen. II Scen. III FTA Scen. I Scen. II. Scen. III FTA Scen. I Scen. II Scen. III FTA Scen. I Scen. II Scen. III FTA
Bangladesh 0 0 0 0 0.6 1.19 1.79 2.38 231.64 463.28 694.92 926.57 87.85 175.71 263.56 351.41Bhutan India 16.65 33.31 49.96 66.61 7.92 15.83 23.75 31.67 720.17 1440.35 2160.52 2880.7Japan 11.93 23.86 35.79 47.72 0 0 0 0 41.55 83.09 124.64 166.18 Myanmar 0.1 0.2 0.31 0.41 0 0 0 0 2.91 5.82 8.73 11.63 5.21 10.42 15.62 20.83Nepal 0.5 1.0 1.5 2.0 0 0 0 0 34.72 69.45 104.17 138.89 2.19 4.39 6.58 8.78 Sri Lanka 0.38 0.76 1.14 1.52 0 0 0 0 72.4 144.8 217.2 289.59 30.15 60.3 90.44 120.59Thailand 2.43 4.86 7.28 9.71 0 0 0 0 71.13 142.27 213.4 284.53 1478.18 2956.35 4434.53 5912.7
Myanmar Nepal Sri Lanka Thailand Imports from
Scen. I Scen. II Scen. III FTA Scen. I Scen. II Scen. III FTA Scen. I Scen. II Scen. III FTA Scen. I Scen. II Scen. III FTA Bangladesh 5.15 10.3 15.45 20.61 0.75 1.51 2.26 3.01 1.43 2.86 4.3 5.73 27.37 54.74 82.11 109.48Bhutan India 70.71 141.41 212.12 282.56 94.19 188.37 282.56 376.74 61.97 123.94 185.91 247.88 192.74 385.48 578.21 770.21Japan 10.84 21.68 32.51 43.35 0.38 0.76 1.14 1.52 7.13 15.05 22.58 30.11 263.16 526.31 789.47 1052.62Myanmar 0 0 0 0 0.01 0.03 0.04 0.06 18.38 36.76 55.14 73.52 Nepal 0 0 0 0 0.18 0.36 0.54 0.72 4.65 9.3 13.95 18.6 Sri Lanka 0.15 0.31 0.46 0.62 0.01 0.02 0.03 0.04 9.77 19.54 29.3 39.07 Thailand 74.05 148.09 222.14 296.19 0.08 0.16 0.24 0.32 0.65 1.29 1.94 2.59 Source: Results are based on simulations described in the text. Note Scen. means scenario.

19
Table 10: Likely Increase in Intraregional (BIMSTEC-Japan) Exports due to PTAs and FTA, 2003 (US$ Million)
Bangladesh Bhutan India Japan Exports to
Scen.I Scen II Scen III FTA Scen I Scen II Scen III FTA Scen I Scen II Scen III FTA Scen I Scen II Scen III FTA Bangladesh 0 0 0 0 18.05 36.1 54.16 72.21 1.11 2.88 4.32 5.76Bhutan India 241.49 503.1 754.65 1006.2 0 0 0 0 53.04 110.5 165.75 221 Japan 73.65 147.29 220.94 294.58 0 0 0 0 766.5 1533 2299.51 3066.01 Myanmar 5.6 11.19 16.79 22.38 0 0 0 0 80.57 161.15 241.72 322.3 3.55 7.1 10.64 14.19Nepal 0.82 1.64 2.46 3.27 0 0 0 0 107.24 214.48 321.72 428.97 0.18 0.36 0.55 0.73Sri Lanka 2.07 4.14 6.21 8.28 0 0 0 0 79.94 159.87 239.81 319.74 4.5 9 13.5 18 Thailand 50.57 101.14 151.71 202.28 0 0 0 0 209.09 418.19 627.28 836.38 319.75 639.5 959.25 1279
Myanmar Nepal Sri Lanka Thailand Exports to Scen I Scen II ScenIII FTA Scen I Scen II Scen III FTA Scen I Scen II Scen III FTA Scen I Scen II Scen III FTA
Bangladesh 0.11 0.22 0.33 0.44 0.54 1.08 1.61 2.15 0.46 0.92 1.38 1.84 0.91 1.83 2.74 3.66 Bhutan India 3.18 6.63 9.95 13.27 37.86 78.88 118.31 157.75 72.78 151.63 227.44 303.25 74.17 154.520 231.78 309.04Japan 5.29 10.54 15.81 21.09 2.36 4.73 7.09 9.45 48.84 97.69 146.53 195.37 2558.57 5117.35 7676.02 10234.7Myanmar 0 0 0 0 0.11 0.22 0.33 0.44 80.42 160.83 241.25 321.67Nepal 0 0 0 0 0.02 0.03 0.05 0.07 0.12 0.24 0.36 0.48 Sri Lanka 0.01 0.02 0.03 0.04 0.3 0.6 0.91 1.21 1.12 2.23 3.35 4.46 Thailand 19.95 39.89 59.84 79.78 3.63 7.27 10.9 14.54 12.75 25.51 38.26 57.02 Source: Results are based on simulations described in the text.
Note Scen. means scenario

20
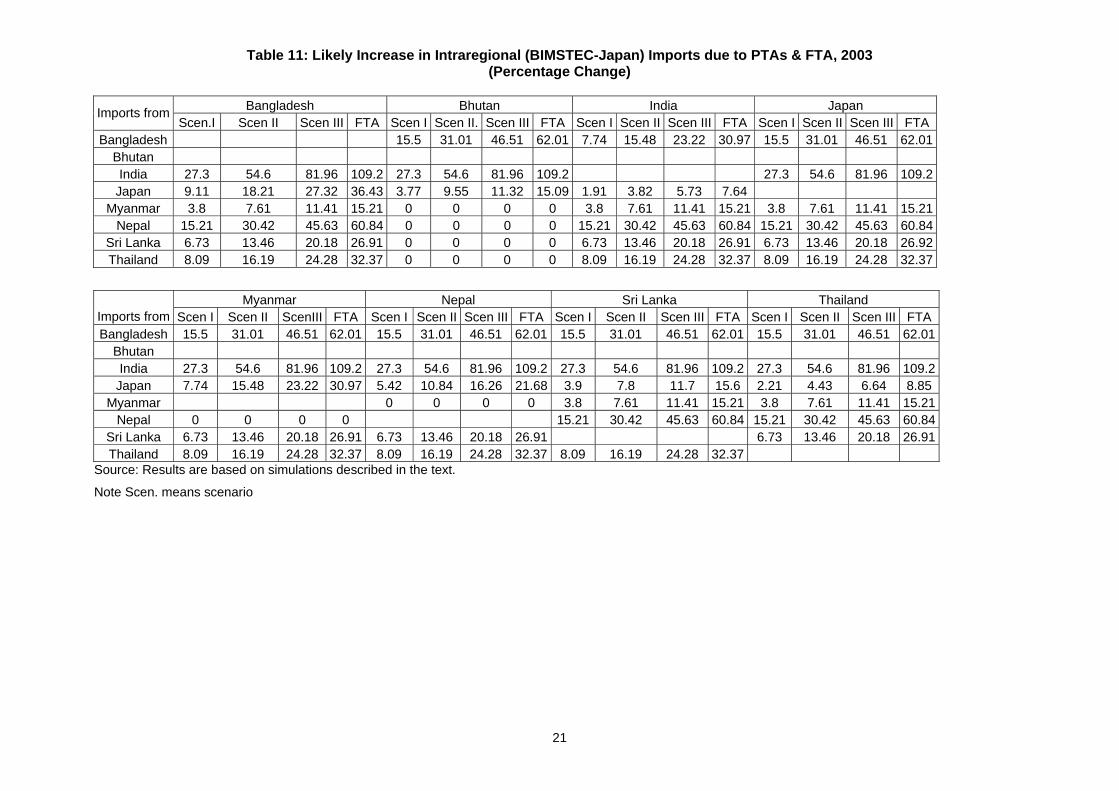
On the basis of Tables 9 and 10, the percentage increase in imports and exports of Japan and BIMSTEC countries are estimated under different scenarios. Tables 11 and 12 present 196 observations percentage increases in imports from and exports to Japan and BIMSTEC countries (excluding Bhutan) under different variants of tariff cuts. An analysis of these tables shows that in the country whose tariff rate is high, the increase in imports would be higher than the increase in exports both in absolute value and percentage increase and vice-versa. Percentage increase in exports and imports will give a better idea on how far one country should go with tariff cuts. Higher tariffs should have longer transition periods because in-depth tariff cuts increase its imports significantly higher than exports to countries whose tariff levels are low.
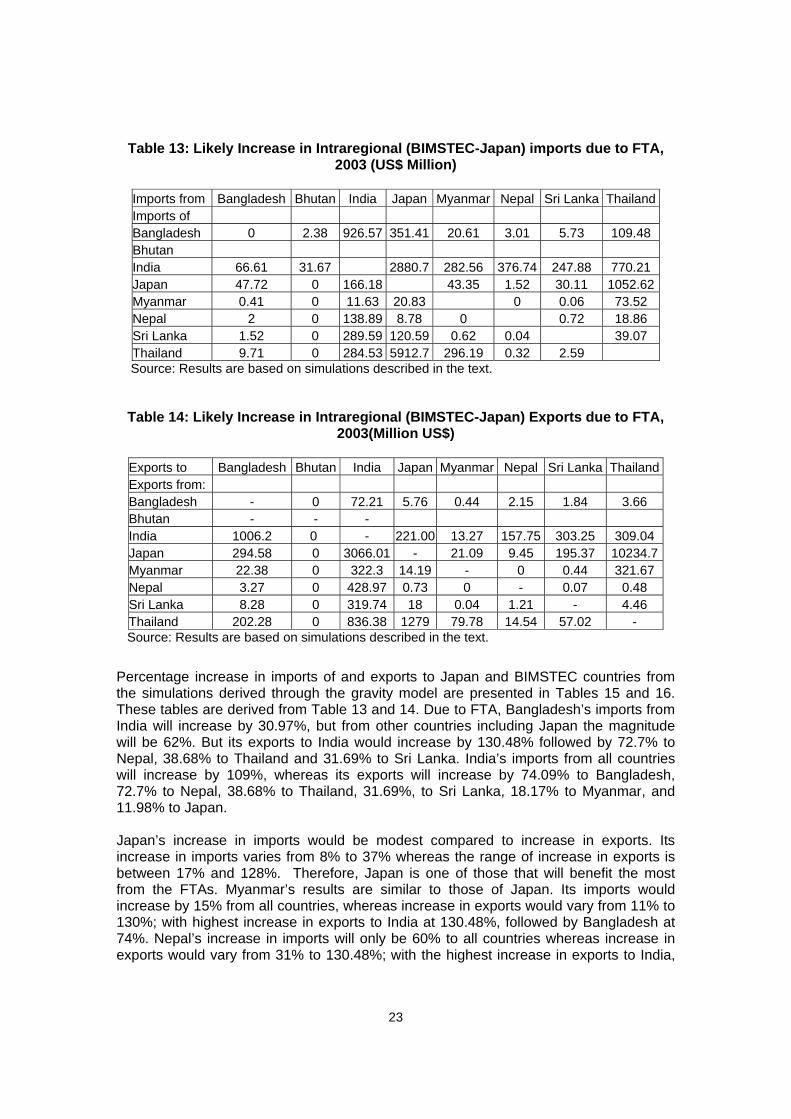
The results of simulations depicting free trade options are presented in Tables 13 and 14. Due to free trade, Bangladesh’s imports from India would be US$926.57 million whereas its exports to India would be increased only by US$72.21 million, which is less than 10% of imports. India’s increase in imports from Japan would be the highest. Since India’s tariff rate of 28% is the highest among all BIMSTEC countries and Japan’s tariff rate is very low at 2.4%, uniform reduction in tariffs among all countries will affect countries whose tariff rate are high. Therefore, India’s increase in imports from and exports to Japan would be US$2,880.7 million and US$221 million (which is less than 10% of imports), respectively. If Japan concludes FTA with BIMSTEC countries, its growth in exports to BIMSTEC countries will be much more than its imports, which means Japan will be the maximum beneficiary of free trade. Japan’s imports will be the highest from Thailand (US$1,052.62 million) whereas its exports to Thailand will increase by US$ 10,234.7 million. Myanmar’s imports from Thailand will increase by US$73.52 million, the highest among all bloc countries, followed by US$20.83 million from Japan and by US$11.63 million from India. But its exports will increase tremendously. Its exports to both India and Japan will increase by US$322 million followed by Bangladesh (US$22.38 million). Nepal will benefit most from the FTA in this region. Given its tariff regime, free trade will increase imports by US$138.89 million from India followed by US$18.6 million from Thailand. Its exports to India would increase by US$428.87 million, followed by US$3.27 million to Bangladesh. Nepal already enjoys almost duty free trade with India. Free trade is also beneficial for Sri Lanka as its exports and imports from India will increase by US$319.74 million and US$289.59 million, respectively; from Japan by US$120.59 million and US$18.00 million, respectively; and from Thailand by US$39.07 million and US$4.6 million, respectively. India and Sri Lanka have already concluded bilateral FTA for which India has extended free trade treatment to a host of Sri Lankan products, except small negative list since 1 April 2003, and Sri Lanka will reciprocate the same by 2008. In case of Thailand, maximum increase in imports will originate from Japan (US$5,912.7 million), followed by Myanmar (US$296.19 million) and India (US$284.53 million). On the other hand, its exports to Japan will increase by US$1,279 million, followed by India (US$836.38 million), Bangladesh (US$202.28 million), Myanmar by (US$79.78 million), Sri Lanka (US$57.02 million) and Nepal (US$14.54 million).
21
Table 11: Likely Increase in Intraregional (BIMSTEC-Japan) Imports due to PTAs & FTA, 2003 (Percentage Change)
Bangladesh Bhutan India Japan Imports from
Scen.I Scen II Scen III FTA Scen I Scen II. Scen III FTA Scen I Scen II Scen III FTA Scen I Scen II Scen III FTA Bangladesh 15.5 31.01 46.51 62.01 7.74 15.48 23.22 30.97 15.5 31.01 46.51 62.01
Bhutan India 27.3 54.6 81.96 109.2 27.3 54.6 81.96 109.2 27.3 54.6 81.96 109.2
Japan 9.11 18.21 27.32 36.43 3.77 9.55 11.32 15.09 1.91 3.82 5.73 7.64 Myanmar 3.8 7.61 11.41 15.21 0 0 0 0 3.8 7.61 11.41 15.21 3.8 7.61 11.41 15.21
Nepal 15.21 30.42 45.63 60.84 0 0 0 0 15.21 30.42 45.63 60.84 15.21 30.42 45.63 60.84Sri Lanka 6.73 13.46 20.18 26.91 0 0 0 0 6.73 13.46 20.18 26.91 6.73 13.46 20.18 26.92Thailand 8.09 16.19 24.28 32.37 0 0 0 0 8.09 16.19 24.28 32.37 8.09 16.19 24.28 32.37
Myanmar Nepal Sri Lanka Thailand Imports from Scen I Scen II ScenIII FTA Scen I Scen II Scen III FTA Scen I Scen II Scen III FTA Scen I Scen II Scen III FTA Bangladesh 15.5 31.01 46.51 62.01 15.5 31.01 46.51 62.01 15.5 31.01 46.51 62.01 15.5 31.01 46.51 62.01
Bhutan India 27.3 54.6 81.96 109.2 27.3 54.6 81.96 109.2 27.3 54.6 81.96 109.2 27.3 54.6 81.96 109.2
Japan 7.74 15.48 23.22 30.97 5.42 10.84 16.26 21.68 3.9 7.8 11.7 15.6 2.21 4.43 6.64 8.85Myanmar 0 0 0 0 3.8 7.61 11.41 15.21 3.8 7.61 11.41 15.21
Nepal 0 0 0 0 15.21 30.42 45.63 60.84 15.21 30.42 45.63 60.84Sri Lanka 6.73 13.46 20.18 26.91 6.73 13.46 20.18 26.91 6.73 13.46 20.18 26.91Thailand 8.09 16.19 24.28 32.37 8.09 16.19 24.28 32.37 8.09 16.19 24.28 32.37
Source: Results are based on simulations described in the text.
Note Scen. means scenario

22
Table 12: Likely Increase in Intraregional (BIMSTEC-Japan) Exports due to PTAs and FTA, 2003 (Percentage Change)
Bangladesh Bhutan India Japan Exports to
Scen.I Scen II Scen III FTA Scen I Scen II. Scen III FTA Scen I Scen II Scen III FTA Scen I Scen II Scen III FTA Bangladesh 0 0 0 0 36.62 65.24 97.86 130.48 2.8 5.59 8.39 11.18Bhutan India 17.78 37.05 55.57 74.09 0 0 0 0 2.68 5.59 8.39 11.98Japan 17.21 34.41 51.62 68.83 0 0 0 0 31.99 63.98 95.97 127.96 Myanmar 18.52 37.05 55.57 74.09 0 0 0 0 36.62 65.24 97.86 130.48 2.8 5.59 8.39 11.18Nepal 18.52 37.05 55.57 74.09 0 0 0 0 32.62 65.24 97.86 130.48 2.8 5.59 8.39 11.18Sri Lanka 18.52 37.05 55.57 74.09 0 0 0 0 32.62 65.24 97.86 130.48 2.8 5.59 8.39 11.18Thailand 18.52 37.05 55.57 74.09 0 0 0 0 32.62 65.24 97.86 130.48 2.8 5.59 8.39 11.18
Myanmar Nepal Sri Lanka Thailand Exports to Scen I Scen II ScenIII FTA Scen I Scen II Scen III FTA Scen I Scen II Scen III FTA Scen I Scen II Scen III FTA
Bangladesh 4.54 9.09 13.63 18.17 18.17 36.35 54.52 72.7 7.92 15.84 23.77 31.69 9.67 19.34 29.01 38.68Bhutan India 4.36 9.09 13.63 18.17 17.45 36.35 54.52 72.7 7.61 15.84 23.77 31.69 9.82 19.34 28.01 38.68Japan 4.22 8.43 12.65 16.87 18.17 36.35 54.52 72.7 13.02 26.05 39.07 52.1 15.95 31.9 47.65 63.8Myanmar 0 0 0 0 7.92 15.84 23.77 31.69 9.67 19.34 29.01 38.68Nepal 0 0 0 0 9.67 19.34 29.01 38.68 7.92 15.84 23.77 31.69Sri Lanka 4.54 9.09 13.63 18.17 18.17 36.35 54.52 72.7 9.67 19.34 29.01 38.68Thailand 4.54 9.09 13.63 18.17 18.17 36.35 54.52 72.7 7.92 15.84 23.77 31.69 Sources: Results are based on simulations described in the text. Note: Scen. means scenario
23
Table 13: Likely Increase in Intraregional (BIMSTEC-Japan) imports due to FTA, 2003 (US$ Million)
Imports from Bangladesh Bhutan India Japan Myanmar Nepal Sri Lanka ThailandImports of Bangladesh 0 2.38 926.57 351.41 20.61 3.01 5.73 109.48 Bhutan India 66.61 31.67 2880.7 282.56 376.74 247.88 770.21 Japan 47.72 0 166.18 43.35 1.52 30.11 1052.62Myanmar 0.41 0 11.63 20.83 0 0.06 73.52 Nepal 2 0 138.89 8.78 0 0.72 18.86 Sri Lanka 1.52 0 289.59 120.59 0.62 0.04 39.07 Thailand 9.71 0 284.53 5912.7 296.19 0.32 2.59
Source: Results are based on simulations described in the text.
Table 14: Likely Increase in Intraregional (BIMSTEC-Japan) Exports due to FTA, 2003(Million US$)
Exports to Bangladesh Bhutan India Japan Myanmar Nepal Sri Lanka ThailandExports from: Bangladesh - 0 72.21 5.76 0.44 2.15 1.84 3.66 Bhutan - - - India 1006.2 0 - 221.00 13.27 157.75 303.25 309.04 Japan 294.58 0 3066.01 - 21.09 9.45 195.37 10234.7Myanmar 22.38 0 322.3 14.19 - 0 0.44 321.67 Nepal 3.27 0 428.97 0.73 0 - 0.07 0.48 Sri Lanka 8.28 0 319.74 18 0.04 1.21 - 4.46 Thailand 202.28 0 836.38 1279 79.78 14.54 57.02 -
Source: Results are based on simulations described in the text.
Percentage increase in imports of and exports to Japan and BIMSTEC countries from the simulations derived through the gravity model are presented in Tables 15 and 16. These tables are derived from Table 13 and 14. Due to FTA, Bangladesh’s imports from India will increase by 30.97%, but from other countries including Japan the magnitude will be 62%. But its exports to India would increase by 130.48% followed by 72.7% to Nepal, 38.68% to Thailand and 31.69% to Sri Lanka. India’s imports from all countries will increase by 109%, whereas its exports will increase by 74.09% to Bangladesh, 72.7% to Nepal, 38.68% to Thailand, 31.69%, to Sri Lanka, 18.17% to Myanmar, and 11.98% to Japan. Japan’s increase in imports would be modest compared to increase in exports. Its increase in imports varies from 8% to 37% whereas the range of increase in exports is between 17% and 128%. Therefore, Japan is one of those that will benefit the most from the FTAs. Myanmar’s results are similar to those of Japan. Its imports would increase by 15% from all countries, whereas increase in exports would vary from 11% to 130%; with highest increase in exports to India at 130.48%, followed by Bangladesh at 74%. Nepal’s increase in imports will only be 60% to all countries whereas increase in exports would vary from 31% to 130.48%; with the highest increase in exports to India,
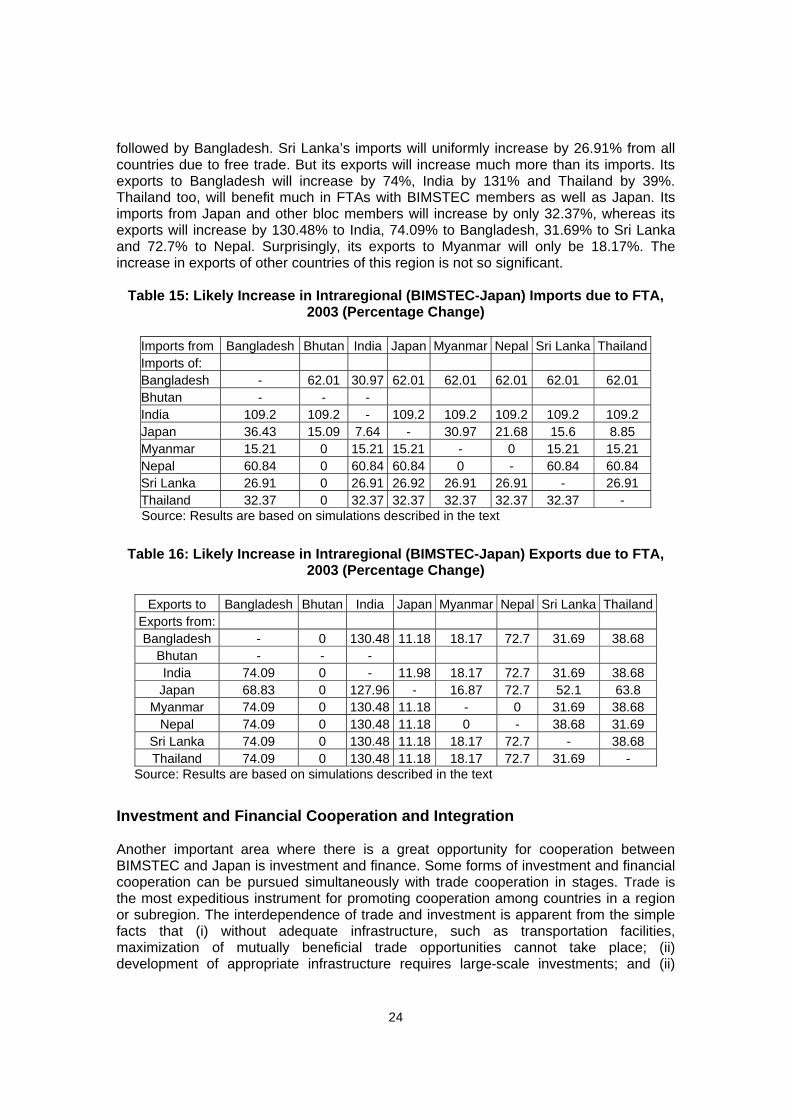
24
followed by Bangladesh. Sri Lanka’s imports will uniformly increase by 26.91% from all countries due to free trade. But its exports will increase much more than its imports. Its exports to Bangladesh will increase by 74%, India by 131% and Thailand by 39%. Thailand too, will benefit much in FTAs with BIMSTEC members as well as Japan. Its imports from Japan and other bloc members will increase by only 32.37%, whereas its exports will increase by 130.48% to India, 74.09% to Bangladesh, 31.69% to Sri Lanka and 72.7% to Nepal. Surprisingly, its exports to Myanmar will only be 18.17%. The increase in exports of other countries of this region is not so significant.
Table 15: Likely Increase in Intraregional (BIMSTEC-Japan) Imports due to FTA,
2003 (Percentage Change)
Imports from Bangladesh Bhutan India Japan Myanmar Nepal Sri Lanka Thailand Imports of: Bangladesh - 62.01 30.97 62.01 62.01 62.01 62.01 62.01 Bhutan - - - India 109.2 109.2 - 109.2 109.2 109.2 109.2 109.2 Japan 36.43 15.09 7.64 - 30.97 21.68 15.6 8.85 Myanmar 15.21 0 15.21 15.21 - 0 15.21 15.21 Nepal 60.84 0 60.84 60.84 0 - 60.84 60.84 Sri Lanka 26.91 0 26.91 26.92 26.91 26.91 - 26.91 Thailand 32.37 0 32.37 32.37 32.37 32.37 32.37 -
Source: Results are based on simulations described in the text
Table 16: Likely Increase in Intraregional (BIMSTEC-Japan) Exports due to FTA,
2003 (Percentage Change)
Exports to Bangladesh Bhutan India Japan Myanmar Nepal Sri Lanka Thailand Exports from: Bangladesh - 0 130.48 11.18 18.17 72.7 31.69 38.68
Bhutan - - - India 74.09 0 - 11.98 18.17 72.7 31.69 38.68 Japan 68.83 0 127.96 - 16.87 72.7 52.1 63.8
Myanmar 74.09 0 130.48 11.18 - 0 31.69 38.68 Nepal 74.09 0 130.48 11.18 0 - 38.68 31.69
Sri Lanka 74.09 0 130.48 11.18 18.17 72.7 - 38.68 Thailand 74.09 0 130.48 11.18 18.17 72.7 31.69 -
Source: Results are based on simulations described in the text
Investment and Financial Cooperation and Integration Another important area where there is a great opportunity for cooperation between BIMSTEC and Japan is investment and finance. Some forms of investment and financial cooperation can be pursued simultaneously with trade cooperation in stages. Trade is the most expeditious instrument for promoting cooperation among countries in a region or subregion. The interdependence of trade and investment is apparent from the simple facts that (i) without adequate infrastructure, such as transportation facilities, maximization of mutually beneficial trade opportunities cannot take place; (ii) development of appropriate infrastructure requires large-scale investments; and (ii)
25
economies of scale may dictate that such investments be cross-border investments. Such investments, moreover, can benefit the poorest people in the most remote locations (Bhattacharyay and De, 2005). Financial integration or openness is a process by which separated financial markets become connected, open, and unified so that all the market players have full and free access to the integrated markets. It can be achieved through deregulation, liberalization, and privatization of the market. Liberalization of the capital account is a key step towards openness. This allows the market players, consumers, and investors free and full access to all markets to acquire different kinds of financial products, risk management methods, and investment and portfolio diversification facilities. In theory, financial integration or financial globalization assists in supplying and allocating capital, fostering economic growth, and reducing macroeconomic volatility; hence, increasing the standard of living or welfare. It assists economic growth by developing effective financial sectors, enlarging supply of savings, enhancing risk management systems, decreasing the cost of capital, and transferring modern technology and skills. Financial integration is usually achieved by reducing restrictions on capital flows and allowing markets to set prices of currencies and securities. It often requires privatizing state-owned banks and firms. It is to be noted that integration in the financial sectors can produce significant benefits as well as bring new risks and challenges. As real sector integration, financial sector integration brings economies of scale and promotes competition and efficiency of the markets. It will enhance the provision of financial services, decrease funding costs, and facilitate diversification of risks across markets. However, regulators and supervisors of financial sectors face new and increased challenges. Therefore, BIMSTEC-Japan cooperation should promote an appropriate financial integration process that takes into account heterogeneous states of development of member economies, particularly banking and financial sectors, bond markets, exchange rate systems, and capital account systems. There is an urgent need to strengthen and harmonize prudential norms and financial supervisions between member countries. The country capacity building needs to be undertaken to efficiently perform consolidated supervision in the light of increased cross-border banking and financial activities. Monetary and financial integration is a very complicated and long process and usually lags behind the real sector integration as evidenced in the European integration process. The Asian financial crisis has shown that financial matters should be considered along with real sector integration.
In recent years, there has been significant widening and deepening of economic reforms in several BIMSTEC countries. As a result of increased liberalization, financial markets will play a greater role in the allocation of resources, and consequently will contribute to greater efficiency in economy. However, one can not ignore the adverse consequence of the financial instability. It is very important to build a strong and resilient financial system.
There are significant opportunities and challenges facing BIMSTEC-Japan financial integration. They should recognize and learn from the steps taken since the Asian financial crisis to enhance regional financial cooperation and integration, particularly from ASEAN countries plus three (Japan, South Korea and People Republic of China) Surveillance Process. Bhattacharyay (2004) presented a framework for the regional surveillance using financial soundness analysis for monitoring economic and financial vulnerability of the region and member countries.

26
Investment Cooperation to Strengthen Intraregional Investment
Intraregional investment can be divided into two categories: FDI and portfolio investment. According to an analysis carried out by the Associated Chambers of Commerce and Industry of India, “exports of BIMSTEC countries increased from US$104.9 billion in 1999–2000 to US$143.2 billion in 2003–2004, whereas the imports grew robustly from US$103.4 billion in 1999–2000 to US$152.4 billion in 2003–04. In contrast, FDI inflows reached over US$15.0 billion during 1999–2000 and subsequently fell to little over US$12.0 billion towards the end of 2003–2004”. In terms of the distribution of FDI inflow during the period, the highest recipient of FDI was India with 69.6% of total FDIs in the region followed by Thailand (21.7%), Sri Lanka (4.9%), Myanmar (2.6%) and Bangladesh (less than 0.10%). In view of this trend, investment cooperation is of utmost importance to strengthen intraregional investment for achieving industrial and market integration. At the same time, member countries have to strengthen their productivity and competitiveness to attract FDIs. A recent study by Schiff and winters (2003) showed that the flow from FDI tends to increase both from within and outside the region as a result of increased economic integration. Large inflows of FDI contribute directly to increase income through raising the capital intensity of production, and indirectly through enhancing ethnical progress. Several BIMSTEC economies are quite small to undertake productive activities that could exploit large economies of scale. Economies of scale are better utilized for larger markets arising out of economic integration, and small countries have larger market access. BIMSTEC economies will gain significantly from combined resources and markets as a result of scale effects and increased intensity of combination. Increased foreign private investment in the region will depend on the quality of governance and accountability, in public and private sectors, transparency and predictability of investment related policies, rules and regulation. In order to achieve increased intraregional FDI and portfolio investment flows, member countries should further strengthen macroeconomic conditions and liberalize and harmonize investment regime. Furthermore, strong domestic financial infrastructures and deregulation of domestic financial and capital markets are essential for attracting private investment. Domestic financial institutions should provide support for intraregional investment. A formal institutional mechanism should be established for investment facilitation, strengthening and harmonization of investment rules, procedures and standards as well as dispute settlements. Therefore, a center for promoting greater investment cooperation needs to be set up to attract increased intraregional investment. This center will be a one-stop clearing house for all investment/FDI-related information. It will undertake analytic work and monitor investment-related activities. A study group should be established to identify sector/project areas with comparative advantage and significant potential for growth. This will lead to a strategy for investment cooperation in the areas of joint ventures, intraregional trade and third country exports. The group should assess the investment climate that will identify production capabilities and export-related investment projects. The group should assess price competitiveness, supply constraints, problems of specification, and design and level of technology in the identified areas. Finally, a long-term strategy for investment cooperation and integration should be formulated and implemented.

27
Banking and Financial Cooperation Banking and financial cooperation should be undertaken in stages. These stages include: (i) cooperation information sharing and peer pressure to strengthen domestic and regional financial system; (ii) developing effective mechanisms for regulation and supervision of financial sectors; and (iii) harmonization of rules, regulations, and prudential norms of financial systems. The above financial cooperation will assist in preventing and combating future financial crises. As discussed earlier, prior to the financial integration, there is an urgent need to strengthen and harmonize financial regulatory and supervisory standards consistent with international standards. Prudential supervision and enforcement should be harmonized and strengthened in the following areas: (i) rules and accounting standards of the financial sector in line with international standards, (ii) financial regulatory and supervisory standards consistent with international standards, (iii) consolidated supervision of cross-border banking and financial activities, and (iv) a centralized credit information system. Efforts at the regional level for effective consolidated supervision should assist the process of strengthening prudential mentoring capacity of supervisors at the country level. A common framework for supervising financial groups should be established. International institutions (like the International Monetary Fund) and regional institutions (like the Asian Development Bank) could support this effort through harmonizing regulations at country level. This harmonization and strengthening of the financial sector together with associated financial initiatives would make the region more attractive for foreign investment and enhance intraregional capital flows. At the same time, legal and regulatory framework and institutional arrangements should be strengthened to ensure greater autonomy and independence of supervisory authorities, particularly the central banks or monetary authorities. Capacity of security or financial regulators responsible for market supervision needs to be enhanced through training, seminar, workshops, and hands-on experience. Many BIMSTEC countries’ financial sector, such as Bangladesh, India, Nepal and Sri Lanka, receive a significant amount of workers’ remittances within and outside the region. A small portion of these remittances are intermediated through banks. A regional coordination in strengthening remittance-related services can contribute to the reduction of transaction costs and the increase in financial deepening. Financial Sector Reform Several member countries have shallow financial markets. The liberalization of the domestic economy and the strengthening of the domestic financial infrastructure are essential prior to the comprehensive economic, monetary, and financial integration. BIMSTEC countries should continue to undertake further economic and financial sector reforms, which are the building blocks for enhanced financial integration. BIMSTEC countries should allow participation of regional institutions in the domestic financial markets. The opening of the financial sector will increase competition and market size, which will reduce the price of financial services. The competition will enforce better capital allocation resulting in efficiency gain.
28
There is a need to develop a strong insurance system, including health insurance sector as countries often face large shocks, such as natural disasters (including earthquakes, heavy rainfall, flood, and drought), contagious diseases (including AIDS, SARS and Avian Flu) and crop diseases. Regional insurance companies can be more efficient and effective as they can pool risk covering a larger and diverse market. Integration and Development of Capital Markets/Local Bond Markets The bond and stock markets are quite shallow in most BIMSTEC countries. Bhutan, Myanmar, and Nepal do not have active stock and bond markets. Myanmar is now taking measures to develop a capital market, including the issuance of treasury bonds. India and Thailand have active and comparatively large bond markets. Bonds issued can be divided into two major components: government and corporate debt securities. The market is dominated by government debt securities. Bond investors comprise individual and institutional investors, including insurance companies, pension funds, mutual funds and banks. During the 1990s, many BIMSTEC countries have improved access to their capital markets. Integration and development of local bond markets is essential for an alternative source of financing for both public and corporate sectors in the region. There is a need to adopt measures to widen, deepen, and diversify BIMSTEC capital/bond markets and integrate BIMSTEC-Japan capital markets through linking up with each other. There is a need to create deeper, efficient, and well-regulated capital markets for effective allocation of BIMSTEC-Japan savings. It is very important to develop a regional market for government securities to assist in improved liquidity management by financial institutions. BIMSTEC countries should undertake further institutional and regulatory reforms that will enhance the development of local bond markets. The main areas of reform include: (i) strengthening bond market infrastructure, (ii) liberalizing the local bond markets to allow supranational and international financial institutions, and (iii) promoting appropriate financial products to attract retail and offshore investors. Well-functioning clearing, payment settlement, and credit rating systems have to be in place for efficient securities markets. The adoption of a common clearing, payment settlement system and credit rating system for member countries will achieve large economies of scale. Common regulations for processing check and securities, a common framework for electronic payment and settlements and book entry system will assist in increased integration of cross-border banking and financial transactions and thus promote the development of a regional financial system. Conclusion BIMSTEC’s share in total world trade is very small compared to other blocs in the region. In 2003, its share in the world trade was only 2.20%. The most notable, however, is that the intraregional trade is significantly higher than many economic groupings in the Asia Pacific region, except East Asia Economic Grouping (EAEG) and ASEAN. In 2003, intraregional trade among BIMSTEC countries was 14.75% as against 5.6% among the SAARC countries, 23.0% among ASEAN countries, 6.1% among the members of Indian Ocean Commission, 5.7% among Bangkok Agreement countries and 11.9% among

29
South American Common Market (MERCOSUR) countries. Intraregional trade among BIMSTEC countries is high mainly due to Thailand, which is the most vibrant economy of this region. Higher intraregional trade in this region implies that it has potential to grow than almost all regional blocs that exist in this region, such as, SAARC and Bangkok Agreement. Intraregional trade is fairly high among BIMSTEC countries even in the absence of any PTA. Therefore, once PTAs and FTAs are negotiated and come into force, intraregional trade will grow much faster. If there is an FTA between Japan and BIMSTEC, then this will emerge as one of the most vibrant economic groups in the region to reckon with. BIMSTEC is one of the new entrants in the bandwagon of regional economic forums of this region. It was first formed in June 1997 and got expanded in December 1997, which had five meetings so far. But it needs to get WTO legitimacy. It can form a regional trading bloc under Article XII of Enabling Clause or Article XXIV of GATT. It should formulate a comprehensive policy on PTAs first and then FTA. The process of FTA formation of should start with PTA as early as possible; otherwise, it will end up as a “talk shop”. While moving towards this objective, countries will experience many complicated problems faced by other agreements. First of all, they need to define ‘rules of origin’. Given the already operational regional agreements in the BIMSTEC region, this is bound to result in a ‘spaghetti bowl’ type of phenomenon, where for a given product, there could be several and different tariff rates depending on what origin is assigned to it (Panagariya, 1999). Another problem is the harmonization of standards and uniform certification procedures among members, and between Japan and BIMSTEC. The third problem is the identification of a negative list of commodities of respective countries and a detailed plan to prune it in a phased manner and to prepare a comprehensive national schedule of items to be offered for concession. This may not be a very easy task as tariff levels are skewly distributed among member countries on one hand, and each country wants better market access to other country. For example, Thailand wants duty free treatment for its auto components exports to the Indian market but India is unlikely to open it because this is also a vibrant sector in India. The tariff level in Japan is as low as 2.4% in 2003, whereas this is significantly higher in BIMSTEC countries. There is an apprehension for the bloc countries that once tariffs are lowered, there will be a surge in imports from Japan which will take advantage of the liberalized tariff regime. On the other hand, exports from the BIMSTEC countries to Japan cannot rise significantly because of their existing lower tariffs on one hand and higher incidence of non-tariff barriers (NTBs) on the other. Therefore, there should be a comprehensive program to liberalize NTB and remove in tandem with the liberalization of tariffs. Success of PTA and FTA depends on the liberalization of NTBs, and every member should prepare a comprehensive plan on how to minimize it. The simulation results shows that due to Japan-BIMSTEC FTA, Japan’s increase in import from BIMSTEC countries will be marginal but for obvious reasons its exports to BIMSTEC countries will increase significantly. This is due to levels of tariffs existing between Japan and BIMSTEC. In spite of such adverse scenario, Japan-BIMSTEC FTA still merits consideration if gains in other areas for BIMSTEC countries which will outweigh potential losses on the trade front, such as, stepped up resource transfer, foreign direct investment (FDI) flows, technology transfer and market access to services. BIMSTEC’s gains in terms of additional FDI flows or export-oriented FDI following the entry of Japan in BIMSTEC appear to be marginal, if at all given its relatively large domestic market, lack of geographical and cultural proximity with Japan, the major
30
source of FDI in the region. At present BIMSTEC also does not appear to be equipped to evolve into a full-fledged regional trade agreement (RTA) with customs union, common market and free mobility of factors of production that facilitate industrial restructuring in favor of less developed countries of BIMSTEC. However, Japan may offer additional economic assistance to poorer countries and provide market access to labor intensive services to compensate for the asymmetries arising from trade. Developed countries do provide substantial economic assistance to less developed regions in the RTAs such as EU that has facilitating convergence of levels of development across the bloc.
In this paper, estimates have been done in a static framework. The exports of BIMSTEC countries to Japan would increase further if the estimates were carried out in a dynamic framework. One can try to measure the welfare gains of Japan-BIMSTEC FTA. Moreover, a comparative static analysis using gravity model has been undertaken. Simulation results do not cover the trade potentials between Japan and BIMSTEC countries. Therefore, one should make an attempt to estimate trade potentials between Japan and BIMSTEC by estimating stochastic frontier production function using gravity model, which provides an empirically tractable general equilibrium framework for bilateral trade flow analysis. The major areas of possible investment and financial cooperation include: (i) investment cooperation to strengthen intraregional investment for achieving industrial and market integration; (ii) banking (including central banking) and financial cooperation: (iii) financial sector reform; and (iv) integration and development of local capital/bond markets as an alternative source of financing for both public and corporate sectors in the region. Banking and financial cooperation includes: (a) cooperation information sharing and peer pressure to strengthen domestic and regional financial system; (b) developing effective mechanisms for regulation and supervision of financial sectors; and (c) harmonization of rules, regulations, and prudential norms of financial systems. An increased economic cooperation and integration among BIMSTEC countries and Japan will produce significant benefits to all participating countries, particularly sustained economic growth and much needed inflow of foreign investment to BIMSTEC countries. In addition, this cooperation will strengthen the economic and trade link between South Asian and Southeast Asian countries and will contribute towards a pan-Asian integration and cooperation. Appropriate investment and financial cooperation and integration will make member countries more resilient against external shocks and financial crises. The vast cultural, social, and economic diversity of BIMSTEC countries and Japan and heterogeneous states of development make regional cooperation and integration a difficult and complex task, requiring careful prioritization of achievable targets. The diverse structure, development, and openness of the financial sectors, exchange rate regimes, financial and supervisory regulatory frameworks, and country capacity make the task of regional integration in investment and finance highly challenging.
There is a potential for mutually beneficial cooperation between BIMSTEC and Japan. However, increased cooperation needs some essential pre-requisites. BIMSTEC need to create conducive business environment or climate and macroeconomically stable economy to attract Japanese and other investors.

31
Integration will bring reduced transaction costs, greater productive infrastructure services, lower trade barriers, faster communication of ideas, goods and services, and rising capital flows. Integration requires a strong political will, not only at the national level, but also at the regional level (Bhattacharyay and De, 2005). Governments and key institutions should understand the challenges and complexities associated with deepening trade, investment and financial integration. Moving the vision closer to reality requires defining a clear direction for integration, and identifying strategies and actions to get there and harness its full potential. Multilateral institutions such as the IMF, World Bank, and ADB can help the economic cooperation and integration process (within their mandates) by helping test ideas through feasibility studies and research, building country capacity, working toward improved effectiveness, avoiding duplication, and taking on a subsidiary role in supporting and nudging forward the regional policy agenda. References Amano, Akihiro, Kurihara E., and Samuelson, L. (1980), ‘Trade Linkage Sub-Model in
the EPA World Economic Model’, Economic Bulletin, No. 19, Economic Research Institute, Economic Plan Agency, Government of Japan.
Anderson, Kym and Blackhurst Richard (eds.) (1993): Regional Integration and
Global Trading System, New York, Harvester/Wheatsheaf. Bagwell, Kyle and Staiger Robert (1993a): ‘Multilateral Tariff Cooperation During the Formation of Regional Free Trade Areas’, NBER Working Paper No. 4364. ___(1993b): ‘Multilateral Tariff Cooperation during the Formation of Customs
Unions’, Paper presented at the universities Research Conference on International Trade Rules and Institutions, December 4, NBER, Cambridge, MA.
Baldwin, Richard (1994): ‘A Domino Theory of Regionalism’, Centre for Economic Policy
Research, Discussion Paper No. 857. Baltagi, B N (1985): ‘Pooling Cross-section with Unequal Time-series Lengths’, Economic Letters, 18; 133-136. Bergstrand, J H (1985): ‘The Gravity Equation in International Economic Foundations
and Empirical Evidence’, Review of Economics and Statistics, 67: 474-481. Bergstrand, J H (1989): ‘The Generalised Gravity Equation, Monopolistic Competition
and the Factor-proportions Theory in International Trade’, Review of Economics and Statistics, 71: 143-153.
Bhagwati, J N (1993): ‘Regionalism and Multilateralism: An Overview’, in Jaime de Melo
and Arvind Panagariya (eds.), New Dimensions in Regional Integration, Cambridge University Press., pp.22-51.
Bhattacharyay, Biswa N. (2004), Quantitative Framework for Macroprudential/Financial
Soundness Analysis for Monitoring Economic and Financial Vulnerability, Irving Fisher Committee (IFC) Bulletin, Nov. Netherlands.
32
Bhattacharyay, Biswa N. (2005); “Towards a Greater Economic Cooperation and Integration among BIMSTEC Countries and Japan in Money, Finance and Investment” presented at the First International Conference “Towards BIMSTEC-Japan Comprehensive Economic Cooperation: Vision and Tasks Ahead, Kolkata, India, 16-17 December, 2005.
Bhattacharyay, Biswa N., and P. De. (2005) “Promotion of Trade and Investments between People’s Republic of China and India: Toward a Regional Perspective”, Asian Development Review, Vol. 22, no. 1, pp.45-70, 2005. Bhattacharya, S K, and Mehta R.K. (1997): ‘SAPTA I, SAPTA II and SAFTA: Impact on India’s Imports’, South Asian Survey, 4(2), 259-275. Bhattacharya, S K, Mehta R. K. (1999); ‘SAPTA to SAFTA: Impact on Intra- regional Trade’, paper submitted to the 35th Annual Conference of the Indian
Econometric Society, Jaipur, Mach 11-13,1999, pp.1-38. Bhattacharya, S.K. and Mehta, R.K. (1997), SAPTA I & SAPTA II: Impact on India’s
Imports, paper presented at the International Conference on SAARC at the Andhra University, Visakhapatnam.
Bhatacharya,S.K., and Mehta, R.K. (2000), " The South Asian Preferential Trading
Arrangements: Impact on Intraregional Trade," Asia Pacific Journal of Economics and Business, Vol. 4. No. 1, June, Australia and USA, pp. 92-111.
Bhattacharya, S.K. and Nagesh Kumar (2001), Extending BA to the Developed
Countries in the Asia Pacific Region: An Indian Perspective, Paper presented at the “Expert Group Meeting on the Revitalization of the BA, UN-UNESCAP, 29-30 October, Bangkok.
Bhattacharya, S.K. ( 2003), “Major Issues in India-Bangladesh Trade and Transit and the
Ways to Resolve Them”, paper presented in Dhaka in Indo-Bangladesh Track II Dialogue, Jointly organized by Centre for Policy Research, New Delhi, and Centre for Policy Dialogue, Dhaka from 29 – 30 March 2003.
__________.(2001), “Regional Trading Arrangements among SAARC Countries and
India’s Imports”, South Asia Economic Journal, 2(2), July-December 2001. ___________(2004), Does Bangladesh Benefit from Preferential Trade with India? A
Gravity Analysis, Economic and Political Weekly, No. 48 pp.5152-62. _________(1999), Preferential Trading Arrangements among SAARC Countries :
Estimating their Effects on India’s Imports, in R.K. Gupta(ed), Liberalization and Globalization of Indian Economy, Atlantic Publishers, New Delhi,
Biϕrn E (1981): ‘Estimating Economic Relations from Incomplete Cross-section/Time-
series Data’, Journal of Econometrics, 16: pp221-236. Charan Wadhva (1996), “Assessing SAARC Preferential Trading Arrangement
(SAPTA)”, South Asian Survey 3:1 and 2. pp. 173-194,
33
Congressional Budget Office (1993), “A Budgetary and Economic Analysis of North
America Free Trade Agreement," USCBO, July Deardorff, A V (1998): ‘Determinants of Bilateral Trade: Does Gravity Work in a
Neo-classical World? ‘, in the Frankel J A (ed), Regionalisation of the World Economy, NBER, University of Chicago Press, 7-32.
Erzan, Refik and Alexander J Yeats (1992): ‘Free Trade Agreements with the
United States: What’s In It for Latin America?’, World Bank Policy Research Paper.
Frankel, Jeffrey, Ernesto Stein and Shang-Jin Wei (1993): “Trading Blocs: The Natural,
the Unnatural and the Super- Natural” paper presented at the Sixth Inter American Seminar in Economics (NBER) in Caracas, Venezuela.
Frankel, Jeffrey and Shang-Jin Wei (1993): ‘Trade Blocs and Currency Blocs’, NBER
Working Paper No. 4335. Frankel, J.A., and S. Wei (1995), “The New Regionalism and Aisa: Impact and Options”,
paper presented at the Conference, The Emerging Global Trading Environment and Developing Asia, held at the Asian Development Bank, Manila, May 29-31, 1995.
Frankel, J A (1997): Regional Trading Blocs in the World Economic System, Institute of International Economics, Washington. Kalirajan, K. (1999), Stochastic Varying Coefficients Gravity Model: An Application in
Trade Analysis, Journal of Applied Statistics, Vol. 26, No.2, pp 185-193. Kalirajan, K. and Findlay, Christopher (2005), Estimating Potential Trade Using Gravity
Models: A Suggested Methodology, (forthcoming) and mimeo from National Graduate School for Policy Studies, Tokyo
Kalirajan, K. P. and Shand, R. T., (1997), Yamzawa’s Open Economic Association: An
Indian Ocean Grouping for Economic Cooperation”, The Developing Economies, 35: pp 3-25.
Kelegama, S. (2001), Bangkok Agree and BIMSTEC: Crawling Regional Economic
Groupings in Asia, Journal of Asian Economics 12, 105-121. _________(2000a), “South Asia and other Regional Economic Groupings” in A.N.Ram,
K.K.Bhargava & S. Kathri (eds.) South Asia, 2010 Challenges and Responses (pp110-131) New Delhi, Sage.
________(2000b), Open Regionalism and APEC: Rhetoric and Reality, Economic and
Political Weekly, XXXV. ________(1998), Can Open Regionalism Work in the IOR-ARC? ASEAN Economic
Bulletin, 15 (2) 153-167.

34
Khan H. Ashfaque (1996), “Application of the Gravity Model”, in Study of the Emerging Trading Environment and Developing Asia, Conference on Country Studies, Country Report, Pakistan, Asian Development Bank, 1996, pp 1-9. Krugman, Paul (1991): ‘The Move to Free Trade Zones’, Federal Reserve Bank of
Kansas City, Economic Review, 76(6), November/December, pp. 5-25. Kumar, Nagesh (2002), Towards an Asian Economic Community: Vision of Closer
Economic Cooperation in Asia, Discussion Paper No. 32 Research and Information System for Developing Countries, New Delhi.
Kumar, Nagesh (ed.), Towards an Asian Economic Community :Vision of a New Asia,
Jointly published by RIS and Institute of Southeast Asian Studies, Singapore, 2004.
Kumar, Nagesh (2005), A Broader Asian Community and a Possible Roadmap,
Economic and Political Weekly, September 5, 2005, No. 36 pp. 3926-3931. Levy, Phillip (1993): ‘A Political –Economic Analysis of Free Trade Agreements’, Stanford University Press. Linnemann, H (1966): An Economic Study of International Trade Flows, North-Holland
Publishing Company, Amsterdam. Linson, L. (2000), Trade Integration and the EU Economic Membership Criteria,
European Journal of Political Economy, 16(4): pp 807-827. Mathur, Somesh (2000), "Pattern of International Trade, New Trade Theories and
Evidence from Gravity Equation Analysis," Indian Economic Journal, 47(4), pp. 68-88.
Naqvi, S N H, and Samad, S A (eds.) (1992): SAARC Link: An Econometric Approach,
Oxford & IBH Publishing Co. Ltd. Panagariya, Arvind (1993): ‘Should East Asia Go Regional? No and Maybe’, the World
Bank Policy Research Working Paper, WPS 1209, the World Bank, Washington D.C.
___________(1999), The Regionalism Debate: An Overview . The World Economy,
22(4), 477-509. Perroni,Carlo and John Whalley (1993): “The New Regionalism: Trade
Liberalization or Insurance?’, paper presented at the Universities Research Conference on International Trade Rules and Institutions, december4, NBER, Cambridge, MA.
Piagato, M. C. Farah, K. Itakura, K.Jun, W. Martin, K. Murrel and T.G. Srinivasan (1997),
"Suuth Asia's Integration into the World Economy", World Bank, Washington D.C. Poyhonen (1963): ‘A Tentative Model or the Volume of Trade between Countries’,
Welsirtschaftliches Archive, 90(1), pp 93-99.
35
Rajapakse, Purnima and Arunatilake,Nisha (1996), Would a Reduction in Trade Barriers
Promote Intra-SAARC Trade? Institute of Policy Studies, Colombo, March 1996, pp. 1-29.
Raipuria, K M and Mehta, R K (1990): ‘Towards Trade Link Modeling for SAARC’, South
Asian Journal, 4(2): 167-179. Safadi, Raed and Yeats J Alexander (1993), ‘The North American Free Trade
Agreement: Its Effect on South Asia’, World Bank: Policy Research Working Paper, pp. 1-32.
Sawyer, J A (ed.) (1979): Modelling the International Transmission Mechanism, . North-Holland Publishing Co., Amsterdam Shand, R.T. and Kalirajan, K.P. (1997) , ‘Yamazawa’s open economic association : An
Indian Ocean Grouping for economic cooperation’, The Developing Economics, 35: pp 3-25.
Schiff, M., and Winters, L.A (2003), Regional Integration and Development, Oxford,
United Kingdom, University Press. Somesh, Mathur (2000), Pattern of International Trade, New Trade Theories and
Evidence from Gravity Equation Analysis, Indian Economic Journal, vol.47, no.4. pp. 68-88.
Srinivasan, T N (1994): ‘Regional Trading Arrangements and Beyond: Exploring Some Option for South-Asia: Theory, Empirics and Policy’, Report No. IDB-142,
South –Asia Region, World Bank, pp. 1-40. _______ (1996), Regionalism and the World Trade Organization: Is Non-Discrimination
Passé’? , Discussion Paper No. 767, Economic Growth Centre, Yale University, December, pp. 1-29.
Srinivasan, T N and Canonero, C (1993): ‘Preferential Trade Arrangement:
Estimating the Effects on South Asia Countries’, Report, South-Asia Region, World Bank, September, pp. 1-58.
______ (1994), " Regional Trading Arrangements and Beyond: Exploring Some Options
for South Asia-Theory, Empirics and Policy, World Bank ______ (1995), "Preferential Trading Arrangements in South Asia: Theory, Empirics and Policy", June, unpublished ______(1997)," "Liberalization of Trade Among Neighbours: Two Illustrative Models and
Simulations," South Asia Discussion Paper Series, Supplement II to IDP # 142, World Bank.
Tinbergen, J (1962): Shaping the World Economy: Suggestions for an International
Economic Policy, New York.
36
United States International Trade Commission (1992), "Economy-Wide Modeling of the Economic Implications of an FTA with Mexico and NAFTA with Canada and Mexico", US Publication No. 2516, Washington D.C. USITC
Whalley, John (1993): ‘Regional Trade Arrangements in North America: CUSTA
and NAFTA’, in Jaime de Melo and Arvind Panagariya (eds.), New Dimensions in Regional Integration, Cambridge university Press, pp.352-382.
Whalley, John (1992): ‘Expanding the North American Free Trade Agreement’, Institute for Policy Reform Working Paper No. 42. Wansbeek, T and Kapteyn, A (1989): ‘Estimating of the Error-components Model with
Incomplete Panels’, Journal of Econometrics, 41: 341-361. World Trade Organization (1995), "Regionalism and the World Trading System", WTO,
Geneva. Yap, S T and Nakamura, Y (1990): ASEAN LINK: An Econometric Study, Longman,
Singapore.

CESifo Working Paper Series (for full list see Twww.cesifo-group.de)T
___________________________________________________________________________ 1661 Ben J. Heijdra and Jenny E. Ligthart, Fiscal Policy, Monopolistic Competition, and
Finite Lives, February 2006 1662 Ludger Woessmann, Public-Private Partnership and Schooling Outcomes across
Countries, February 2006 1663 Topi Miettinen and Panu Poutvaara, Political Parties and Network Formation, February
2006 1664 Alessandro Cigno and Annalisa Luporini, Optimal Policy Towards Families with
Different Amounts of Social Capital, in the Presence of Asymmetric Information and Stochastic Fertility, February 2006
1665 Samuel Muehlemann and Stefan C. Wolter, Regional Effects on Employer Provided
Training: Evidence from Apprenticeship Training in Switzerland, February 2006 1666 Laszlo Goerke, Bureaucratic Corruption and Profit Tax Evasion, February 2006 1667 Ivo J. M. Arnold and Jan J. G. Lemmen, Inflation Expectations and Inflation
Uncertainty in the Eurozone: Evidence from Survey Data, February 2006 1668 Hans Gersbach and Hans Haller, Voice and Bargaining Power, February 2006 1669 Françoise Forges and Frédéric Koessler, Long Persuasion Games, February 2006 1670 Florian Englmaier and Markus Reisinger, Information, Coordination, and the
Industrialization of Countries, February 2006 1671 Hendrik Hakenes and Andreas Irmen, Something out of Nothing? Neoclassical Growth
and the ‘Trivial’ Steady State, February 2006 1672 Torsten Persson and Guido Tabellini, Democracy and Development: The Devil in the
Details, February 2006 1673 Michael Rauber and Heinrich W. Ursprung, Evaluation of Researchers: A Life Cycle
Analysis of German Academic Economists, February 2006 1674 Ernesto Reuben and Frans van Winden, Reciprocity and Emotions when Reciprocators
Know each other, February 2006 1675 Assar Lindbeck and Mats Persson, A Model of Income Insurance and Social Norms,
February 2006 1676 Horst Raff, Michael Ryan and Frank Staehler, Asset Ownership and Foreign-Market
Entry, February 2006

1677 Miguel Portela, Rob Alessie and Coen Teulings, Measurement Error in Education and
Growth Regressions, February 2006 1678 Andreas Haufler, Alexander Klemm and Guttorm Schjelderup, Globalisation and the
Mix of Wage and Profit Taxes, February 2006 1679 Kurt R. Brekke and Lars Sørgard, Public versus Private Health Care in a National
Health Service, March 2006 1680 Dominik Grafenhofer, Christian Jaag, Christian Keuschnigg and Mirela Keuschnigg,
Probabilistic Aging, March 2006 1681 Wladimir Raymond, Pierre Mohnen, Franz Palm and Sybrand Schim van der Loeff,
Persistence of Innovation in Dutch Manufacturing: Is it Spurious?, March 2006 1682 Andrea Colciago, V. Anton Muscatelli, Tiziano Ropele and Patrizio Tirelli, The Role of
Fiscal Policy in a Monetary Union: Are National Automatic Stabilizers Effective?, March 2006
1683 Mario Jametti and Thomas von Ungern-Sternberg, Risk Selection in Natural Disaster
Insurance – the Case of France, March 2006 1684 Ken Sennewald and Klaus Waelde, “Itô’s Lemma“ and the Bellman Equation for
Poisson Processes: An Applied View, March 2006 1685 Ernesto Reuben and Frans van Winden, Negative Reciprocity and the Interaction of
Emotions and Fairness Norms, March 2006 1686 Françoise Forges, The Ex Ante Incentive Compatible Core in Exchange Economies
with and without Indivisibilities, March 2006 1687 Assar Lindbeck, Mårten Palme and Mats Persson, Job Security and Work Absence:
Evidence from a Natural Experiment, March 2006 1688 Sebastian Buhai and Coen Teulings, Tenure Profiles and Efficient Separation in a
Stochastic Productivity Model, March 2006 1689 Gebhard Kirchgaessner and Silika Prohl, Sustainability of Swiss Fiscal Policy, March
2006 1690 A. Lans Bovenberg and Peter Birch Sørensen, Optimal Taxation and Social Insurance in
a Lifetime Perspective, March 2006 1691 Moritz Schularick and Thomas M. Steger, Does Financial Integration Spur Economic
Growth? New Evidence from the First Era of Financial Globalization, March 2006 1692 Burkhard Heer and Alfred Maussner, Business Cycle Dynamics of a New Keynesian
Overlapping Generations Model with Progressive Income Taxation, March 2006
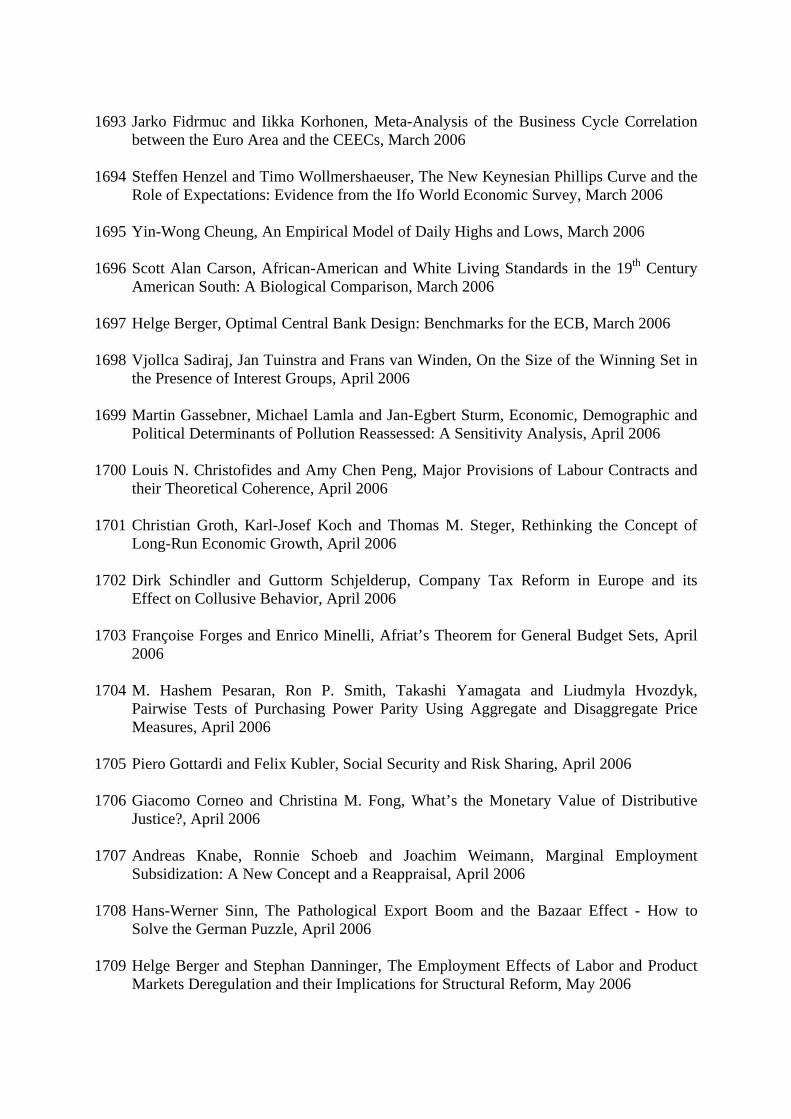
1693 Jarko Fidrmuc and Iikka Korhonen, Meta-Analysis of the Business Cycle Correlation
between the Euro Area and the CEECs, March 2006 1694 Steffen Henzel and Timo Wollmershaeuser, The New Keynesian Phillips Curve and the
Role of Expectations: Evidence from the Ifo World Economic Survey, March 2006 1695 Yin-Wong Cheung, An Empirical Model of Daily Highs and Lows, March 2006 1696 Scott Alan Carson, African-American and White Living Standards in the 19th Century
American South: A Biological Comparison, March 2006 1697 Helge Berger, Optimal Central Bank Design: Benchmarks for the ECB, March 2006 1698 Vjollca Sadiraj, Jan Tuinstra and Frans van Winden, On the Size of the Winning Set in
the Presence of Interest Groups, April 2006 1699 Martin Gassebner, Michael Lamla and Jan-Egbert Sturm, Economic, Demographic and
Political Determinants of Pollution Reassessed: A Sensitivity Analysis, April 2006 1700 Louis N. Christofides and Amy Chen Peng, Major Provisions of Labour Contracts and
their Theoretical Coherence, April 2006 1701 Christian Groth, Karl-Josef Koch and Thomas M. Steger, Rethinking the Concept of
Long-Run Economic Growth, April 2006 1702 Dirk Schindler and Guttorm Schjelderup, Company Tax Reform in Europe and its
Effect on Collusive Behavior, April 2006 1703 Françoise Forges and Enrico Minelli, Afriat’s Theorem for General Budget Sets, April
2006 1704 M. Hashem Pesaran, Ron P. Smith, Takashi Yamagata and Liudmyla Hvozdyk,
Pairwise Tests of Purchasing Power Parity Using Aggregate and Disaggregate Price Measures, April 2006
1705 Piero Gottardi and Felix Kubler, Social Security and Risk Sharing, April 2006 1706 Giacomo Corneo and Christina M. Fong, What’s the Monetary Value of Distributive
Justice?, April 2006 1707 Andreas Knabe, Ronnie Schoeb and Joachim Weimann, Marginal Employment
Subsidization: A New Concept and a Reappraisal, April 2006 1708 Hans-Werner Sinn, The Pathological Export Boom and the Bazaar Effect - How to
Solve the German Puzzle, April 2006 1709 Helge Berger and Stephan Danninger, The Employment Effects of Labor and Product
Markets Deregulation and their Implications for Structural Reform, May 2006

1710 Michael Ehrmann and Marcel Fratzscher, Global Financial Transmission of Monetary
Policy Shocks, May 2006 1711 Carsten Eckel and Hartmut Egger, Wage Bargaining and Multinational Firms in General
Equilibrium, May 2006 1712 Mathias Hoffmann, Proprietary Income, Entrepreneurial Risk, and the Predictability of
U.S. Stock Returns, May 2006 1713 Marc-Andreas Muendler and Sascha O. Becker, Margins of Multinational Labor
Substitution, May 2006 1714 Surajeet Chakravarty and W. Bentley MacLeod, Construction Contracts (or “How to
Get the Right Building at the Right Price?”), May 2006 1715 David Encaoua and Yassine Lefouili, Choosing Intellectual Protection: Imitation, Patent
Strength and Licensing, May 2006 1716 Chris van Klaveren, Bernard van Praag and Henriette Maassen van den Brink,
Empirical Estimation Results of a Collective Household Time Allocation Model, May 2006
1717 Paul De Grauwe and Agnieszka Markiewicz, Learning to Forecast the Exchange Rate:
Two Competing Approaches, May 2006 1718 Sijbren Cnossen, Tobacco Taxation in the European Union, May 2006 1719 Marcel Gérard and Fernando Ruiz, Interjurisdictional Competition for Higher Education
and Firms, May 2006 1720 Ronald McKinnon and Gunther Schnabl, China’s Exchange Rate and International
Adjustment in Wages, Prices, and Interest Rates: Japan Déjà Vu?, May 2006 1721 Paolo M. Panteghini, The Capital Structure of Multinational Companies under Tax
Competition, May 2006 1722 Johannes Becker, Clemens Fuest and Thomas Hemmelgarn, Corporate Tax Reform and
Foreign Direct Investment in Germany – Evidence from Firm-Level Data, May 2006 1723 Christian Kleiber, Martin Sexauer and Klaus Waelde, Bequests, Taxation and the
Distribution of Wealth in a General Equilibrium Model, May 2006 1724 Axel Dreher and Jan-Egbert Sturm, Do IMF and World Bank Influence Voting in the
UN General Assembly?, May 2006 1725 Swapan K. Bhattacharya and Biswa N. Bhattacharyay, Prospects of Regional
Cooperation in Trade, Investment and Finance in Asia: An Empirical Analysis on BIMSTEC Countries and Japan, May 2006