SHRM Human Capital Benchmarking Study - Nifty … Capital_… · SHRM® Human Capital Benchmarking...
52
SHRM ® Human Capital Benchmarking Study 2008 EXECUTIVE SUMMARY Also available: SHRM Customized Benchmarking Service o Database of more than 5,000 organizations. o To order a complete analysis of the results customized to your organization, please see pages 34-35.
Transcript of SHRM Human Capital Benchmarking Study - Nifty … Capital_… · SHRM® Human Capital Benchmarking...

SHRM® Human Capital Benchmarking Study
2008 EXECUTIVE SUMMARY
Also available:
SHRM Customized Benchmarking Service
o Database of more than 5,000 organizations. o To order a complete analysis of the results customized
to your organization, please see pages 34-35.

SHRM® Human Capital Benchmarking Study: 2008 Executive Summary 2
Contents
3 Introduction 6 Methodology 8 Using Benchmarking Data 11 Key Findings
11 HR Departments and Expenses 11 HR-to-Employee Ratios 12 Employment 21 Compensation 23 Organizational Data
25 Conclusion
26 Profile of Organizations Responding to the Survey
28 Human Capital Glossary of Metric Terms, Definitions and Calculations 34 SHRM Customized Benchmarking Service
SHRM® Human Capital Benchmarking Study: 2008 Executive Summary 3
Introduction: Human Capital Analytics and the Economy Economic retrenchment, which began with the collapse of the housing market in mid-2007,1 caused many organizations to limit their hiring. The SHRM/Rutgers Leading Indicators of National Employment (LINE®, www.shrm.org/line) noted a marked downward shift in hiring expectations, which began in September 2007 and continued throughout the year. As the economy got weaker, organizations faced many travails. Revenue per full-time equivalent (FTE) and net income per FTE decreased from the previous by year by 23% and 11% respectively, and because of that, many executives received lower cash bonus payouts compared with the previous year. Executives in 2007 received median target bonus percentage of 4%, significantly down from the previous year’s median percentage of 18%. In 2007, the annual turnover rate was a median of 15%, repeating the employee turnover rates in 2005 and 2006 (median annual turnover rate of 14% and 15%, respectively). Yet even with this employee turnover rate, organizations were not aggressive in restaffing lost talent as organizational revenue and net income continued to slide. Human capital management is comprehensive because it includes not only human resource (HR) practices, but also other work practices and people management strategies that increase organizational performance. The important distinction between human resource management and human capital management is that human capital extends well beyond the HR function to encompass the total people strategy of the organization. Human capital is owned by all of the business leaders and resides with everyone in the organization.2 The advantage of this is that businesses are starting to understand what HR professionals have known for years—that human resource programs and activities contribute to the bottom line. In 2007, a symposium conducted by SHRM on the topic of human capital analytics brought together leading academics and human capital researchers, experienced HR executives, well-known human capital consultants and senior members of SHRM’s professional staff to focus on defining human capital analytics, assessing its current application and arriving at a vision where human capital analytics plays a more critical predictive role in business decisions. The participants defined human capital analytics as the process by which the value of an organization’s people is measured and improved for the purpose of enhancing organizational performance.3 The purpose of the 2008 SHRM Human Capital Benchmarking Study is to provide HR professionals and other business executives with key human capital measures. In business, where the need to measure is strong, benchmarking can help identify an organization’s human capital strengths and weaknesses, create a framework for managing change and encourage employees toward continuous improvement. Yet for some HR professionals, when it comes to measuring activities around human capital, concrete measures can feel elusive. Numbers that relate to the context of a specific business, particularly the same industry, employee size, organizational revenue size and geographic location, are usually difficult to find. But it is precisely this organizational
1 Shorter, G. (2008). Bear Stearns: Crisis and “rescue” for a major provider of mortgage-related products. Washington, DC: Congressional Research Service. 2 Chartered Institute for Personnel and Development. (2004). Human capital reporting: An internal perspective. London: Author. 3 Society for Human Resource Management. (2007). SHRM Symposium on Human Capital Analytics. Alexandria, VA: Author.

SHRM® Human Capital Benchmarking Study: 2008 Executive Summary 4
profiling that is most beneficial to enable similar organizations to compare themselves to each other. This executive summary contains key metrics from more than 600 organizations on HR departments and their expenses, HR-to-employee ratios, employment, compensation and organizational revenue. In addition, SHRM’s database collection initiative in early 2008 yielded more than 5,000 additional organizations that together are part of the SHRM Customized Benchmarking Service, which is detailed on pages 34-35. This executive summary and the SHRM Customized Benchmarking Service provide more than 140 benchmarks for many industries, so that comparisons can be made, when possible, within a similar industry. Key Metrics and Data Collected (Number of organizations responding = 614)
HR Departments and Expenses
Total HR staff HR-to-employee
ratio* Percentage of HR
staff in supervisory roles or higher
Percentage of HR staff in professional/technical roles
Percentage of HR staff in administrative support roles
Reporting structure for head of HR
HR positions organizations expect to hire in 2008
Areas of outsourcing
HR Expenses
HR expenses HR expense to
operating expense ratio
HR expense per FTE*
Employment Number of positions
filled* Time-to-fill* Cost-per-hire* Annual overall turnover
rate* Annual voluntary
turnover rate Annual involuntary
turnover rate Compensation
Annual salary increase* Salaries as a percentage
of operating expense* Average target bonus
percentage for non-executives
Average target bonus percentage for executives*
Organizational Data Revenue Revenue per FTE* Net income Net income per FTE* Positions for
succession planning Tuition/Education Data
• Annual maximum tuition/education reimbursement allowed
• Percentage of employees participating in tuition/education
Expectations for Change in 2008
Expectations for revenue change in 2008
Expectations for HR hiring in 2008*
Expectations for changes in hiring in 2008*
*Metrics reported in this executive summary. The full SHRM Customized Benchmarking Database contains more than 140 metrics and is available at www.shrm.org/benchmarks.
For information about additional metrics, please see a sample customized report beginning on page 36. A glossary of metric terms, definitions and calculations is available on page 28.
SHRM® Human Capital Benchmarking Study: 2008 Executive Summary 5
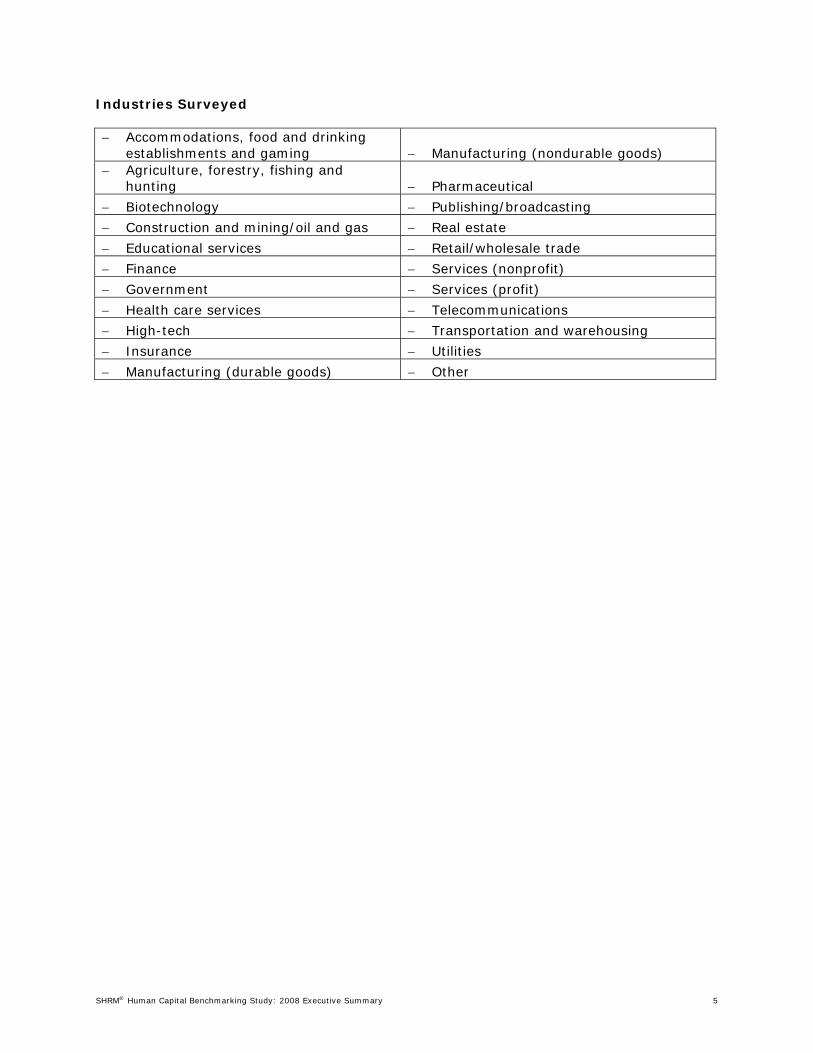
Industries Surveyed − Accommodations, food and drinking
establishments and gaming − Manufacturing (nondurable goods) − Agriculture, forestry, fishing and
hunting − Pharmaceutical
− Biotechnology − Publishing/broadcasting
− Construction and mining/oil and gas − Real estate
− Educational services − Retail/wholesale trade
− Finance − Services (nonprofit)
− Government − Services (profit)
− Health care services − Telecommunications
− High-tech − Transportation and warehousing
− Insurance − Utilities
− Manufacturing (durable goods) − Other

SHRM® Human Capital Benchmarking Study: 2008 Executive Summary 6
Methodology Purpose The 2008 SHRM Human Capital Benchmarking Study was conducted in order to collect human capital metrics across various industries. The study collected data on human resource departments and expenses, hiring trends, compensation, and turnover. In addition, organizational data, such as revenue, expenses and employee size, were obtained. Data were collected for 2007, along with expectations for change in 2008. Survey The survey was created by SHRM’s Strategic Research Program and was revised from the prior year’s survey instrument. The results of the 2007 SHRM Human Capital Benchmarking Study led to several revisions to the questions asked, as well as to reformatting of several questions. This survey was also reviewed by the SHRM Human Capital Measurement/HR Metrics Special Expertise Panel. The Panel is made up of SHRM members who are experts in the field of human capital measurement and metrics. Participants SHRM members who were HR managers, assistant or associate directors, directors, assistant or associate vice presidents, vice presidents or presidents were included in the sample. The members had to meet the following criteria: have a valid e-mail address and business phone number, have not been selected to participate in a survey with SHRM in the past six months and be residents of the United States. Procedure In March 2008, an e-mail that included a link to the SHRM Human Capital Benchmarking Survey was sent to 5,000 randomly selected SHRM members who were senior HR professionals. Of these, 4,710 e-mails were successfully delivered, and 614 senior HR professionals responded on behalf of their organizations, yielding a response rate of 14%. The survey was accessible for a period of six weeks.
In an effort to encourage participation in the study, respondents were informed that they would be entered in a drawing to be one of 40 respondents to receive a $25 American Express gift certificate. In addition, participants received an all-industry report that consisted of 43 metrics. Four reminders were sent over the course of six weeks, and selected participants who had not yet responded received follow-up telephone calls. Quality Control Every effort was made to ensure the accuracy of the data. At the completion of data collection, the data were checked for duplicate responses. When a respondent submitted a survey more than once (which occurred in rare instance), the survey with the latest time was retained and all prior submissions were deleted. The data were then put through a rigorous accuracy check process.4 The survey included many quantitative questions that were checked to ensure that they were understood by respondents and the data submitted were accurate. For example, the number of HR full-time equivalent employees (FTEs) had to equal the sum of the categories of HR FTEs, and the number of HR FTEs had to be less than the total FTEs in the organization. The HR expenses had to be less than the total organizational expenses. Overall, there were few inconsistencies identified within the data. When inconsistencies were identified, steps were taken to resolve the discrepancy. In the
4 Due to the nature of the data in the current study, only data that were three standard deviations above the average were excluded. In other words, this includes data in which 99.5% of the data fall below the given data point. Extreme outliers can skew the results, leading to higher (or lower) averages among the measures.

SHRM® Human Capital Benchmarking Study: 2008 Executive Summary 7
rare instance when the data could not be verified and appeared inaccurate, they were excluded from the analysis. This was done to ensure that the highest quality data were included in the study.

SHRM® Human Capital Benchmarking Study: 2008 Executive Summary 8
Using Benchmarking Data Benchmarking is rapidly becoming an indispensable tool for HR professionals. It is a mechanism for measuring processes, practices and results against the competition or “peer” companies in order to improve performance. Used wisely, it can transform a company’s HR and people management strategies by showing how human capital practices influence organizational performance. HR professionals can use benchmarking data to compare their organization against its competitors or other similar organizations. For example, HR professionals can compare their organization’s health care costs to those of similar organizations to see if the discrepancy is large enough to warrant further analysis. Benchmarking also protects areas or programs that are performing well. For example, if line executives want recruiting costs lowered, benchmarking data may show that their current recruiting costs are in line with their industry. In fact, to lower costs far below their competitors might actually jeopardize their organization’s ability to find the right talent to compete in the market. Benchmarking can also create support and momentum for organizational change. For example, making changes to existing pay practices may be difficult, unless there is objective benchmarking data that can support otherwise. Similarly, if the HR professional wants to alter an organization’s long-standing practice of not offering employee bonus plans, making that argument alone, without benchmarking data, is very difficult. Benchmarking data can help make the case. CEOs and board-level executives also depend on quality benchmarking data to make strategic decisions that affect their organizations. In fact, benchmarking is more effective when used as part of an overall business strategy. It is less effective, however, when companies use benchmarking only for short-term cost reductions and not as part of a long-term strategy. For example, when an organization lowers training budgets to meet short-term budget goals, these cutbacks will have a negative impact on developing the skills of the organization’s workforce. Thus, although a short-term objective is achieved, over the long term, the knowledge and skills of its human capital will start to lag behind the market, and the organization will lose its competitive advantage. Understanding the Data As you compare your own data against the data of other organizations, keep the following in mind: 1. A deviation between your figure (for any human capital measure) and the comparative
figure is not necessarily favorable or unfavorable; it is merely an indication that additional analyses may be needed. Human capital measures that relate more closely to the context of your organization’s industry, revenue size, geographic location and employee size are more descriptive and meaningful than information that is more generic in nature, such as all industries combined. The larger the discrepancy between your figure and those found in this executive summary, the greater the need for additional scrutiny.
2. In cases where you determine that large deviations do exist, it may be helpful to go
back and calculate the same human capital measure for your organization over the past several years to identify any existing trends.

SHRM® Human Capital Benchmarking Study: 2008 Executive Summary 9
3. The information in this executive summary should be used as a tool for decision-making rather than an absolute standard. Because companies differ in their overall business strategy, location, size and other factors, any two companies can be well managed, yet some of their human capital measures may differ greatly. No decision should be made solely based on the results of any one study.
Working With the Data The information in this executive summary is designed to be a tool to help you evaluate decisions and activities that affect your organization’s human capital. When reviewing these data, it is important to realize that business strategy, organizational culture, leadership behaviors and industry pressures are just a few of the many factors that drive various human capital measures. For example, an industry that generally hires nonskilled labor, such as construction, may have less costly benefits packages than the high-tech industry that hires specialized knowledge workers. This is because organizations in the high-tech industry may need to have richer, more attractive benefits plans to make them more enticing in order to attract “hard-to-find” knowledge workers. Absolute measures are not meaningful in isolation—they should be compared with one or more measures to determine whether a satisfactory level exists. Other measures, for example, might be your organization’s past results in this area or comparatives based on organizational size, industry or geographic location. Notes and Caveats Number of organizations: The number of organizations (indicated by “n”) is noted in each table and figure and indicates the number of organizations (not individuals) that provided data relevant to a particular table. The number of organizations varies from table to table because some organizations did not respond to all of the questions. Organizations may not have responded to a question on the survey because all or some part(s) of the question were not applicable or because the requested data were unavailable. This also accounts for the varying number of responses within a table. Confidence level and margin of error: A confidence level and margin of error give readers some measure of how much they can rely on survey responses to represent all of SHRM member organizations. Given the level of response to the survey, SHRM Research is 95% confident that responses given by all responding organizations can be generalized to all SHRM members, in general, with a margin of error of approximately 3%. For example, 80% of the responding organizations reported that they were for-profit. With a 3% margin of error, the reader can be 95% confident that between 77% and 83% of SHRM members come from for-profit organizations. It is important to know that as the sample size decreases, the margin of error increases. Minimum respondents for summary calculations: No summary calculations were made for items with fewer than 10 participating organizations. Tables illustrating 25th percentile, median and 75th percentile should be interpreted with caution when the number of responding organizations is small. Extreme values dropped: Due to the nature of the data in the current study, data that were three standard deviations above the average were excluded. In other words, 0.5% of the data were omitted from the analyses. The extreme outliers, or data anomalies, can skew the results, leading to much higher averages among the measures.
SHRM® Human Capital Benchmarking Study: 2008 Executive Summary 10
Table and figure percentages: Where relevant, data depicted in tables and figures may not add to exactly 100% due to rounding. In addition, percentages may exceed 100% due to multiples response options (i.e., several organizations may respond to more than one category for the same question). Other categories: In some cases, participating organizations included “other” as a response to a survey question. Efforts were made to examine the verbatim content of the “other” responses and recategorize them into the categories listed. Oftentimes, verbatim content was distinctive to the organization, making it impossible to recategorize.

SHRM® Human Capital Benchmarking Study: 2008 Executive Summary 11
Key Findings HR DEPARTMENT AND EXPENSES HR expense per FTE remained relatively stable at a median of $1,176 in 2007, compared to $1,200 in the previous year. Faced with lower profits and a downturn in hiring activity during the latter part of the year, organizations did not feel it necessary to make additional investments in HR in 2007. Yet for 2008, 24% of the responding organizations anticipate hiring additional HR staff--an indication that some investments in HR may occur. Hires for administrative HR support and HR generalist positions are the top two positions that organizations expect to hire in 2008. These positions also made up the bulk of HR hiring in 2006 and 2007, therefore continuing the trend that organizations are not hiring individuals with staffing and recruitment skills, but HR professionals with broad human resource backgrounds and providing them increased administrative support. Table 1 list the areas of HR in which hiring is expected in 2008. Table 1: Areas of HR in Which Hiring Is Expected in 2008 (n = 90)
Administrative HR support 47%
HR Generalist 40%
Recruiting 26%
Director or above 18%
Compensation 16%
Benefits 12%
HRIS 10%
Diversity 8%
Other 6% Note: Percentages do not total 100% as multiple responses were allowed. Source: SHRM Human Capital Benchmarking Study: 2008 Executive Summary HR-TO-EMPLOYEE RATIOS While the median number of FTEs for the HR department in 2007 was two, the average was 13. The large difference between median and average values indicates that some HR departments reported a large number of staff. However, a more manageable way to compare HR staffing levels among organizations is to use the HR-to-employee ratio. This ratio represents the number of HR staff per 100 employees in an organization supported by HR. The number is calculated by dividing the number of HR FTEs by the total number of employees (FTEs) in the organization and multiplying the outcome by 100: HR-to-Employee = Total number of HR FTEs X 100 Ratio Total number of employee FTEs Table 2 shows how HR-to-employee ratios change by organizational size. The data suggest that the primary driver in HR-to-employee ratios is organizational size. This ratio can be helpful for understanding the number of HR FTEs that are typically supporting a specific-size organization.
SHRM® Human Capital Benchmarking Study: 2008 Executive Summary 12
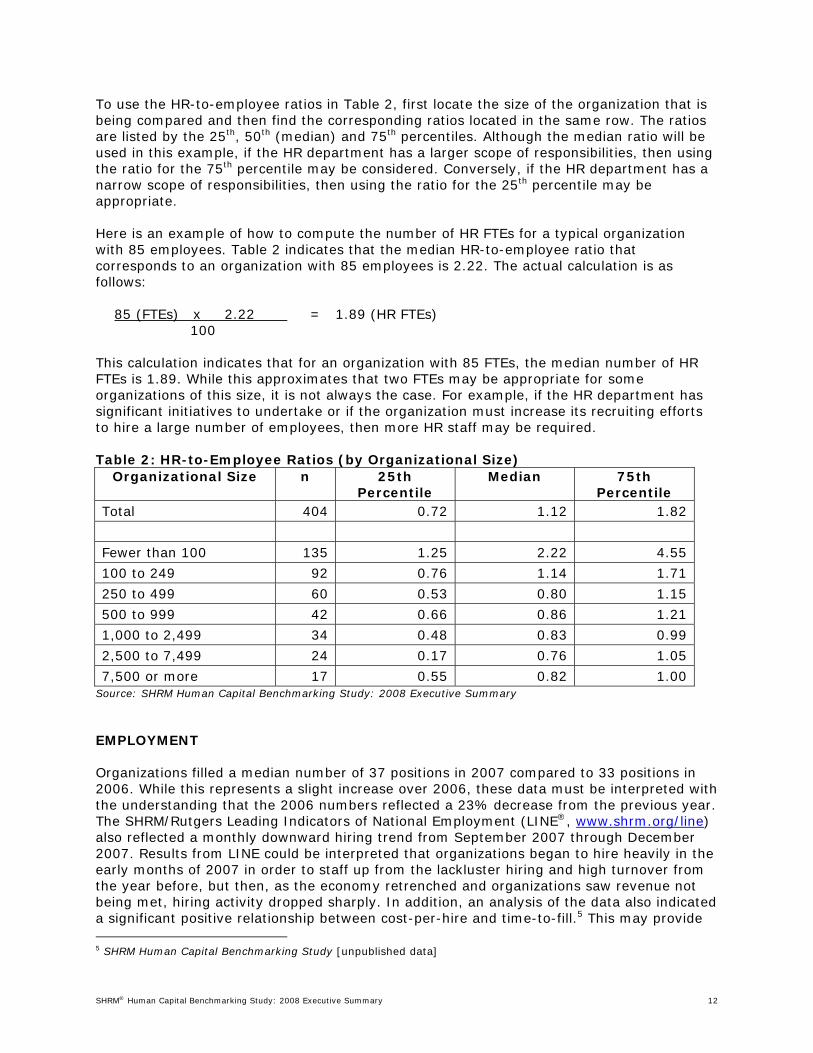
To use the HR-to-employee ratios in Table 2, first locate the size of the organization that is being compared and then find the corresponding ratios located in the same row. The ratios are listed by the 25th, 50th (median) and 75th percentiles. Although the median ratio will be used in this example, if the HR department has a larger scope of responsibilities, then using the ratio for the 75th percentile may be considered. Conversely, if the HR department has a narrow scope of responsibilities, then using the ratio for the 25th percentile may be appropriate. Here is an example of how to compute the number of HR FTEs for a typical organization with 85 employees. Table 2 indicates that the median HR-to-employee ratio that corresponds to an organization with 85 employees is 2.22. The actual calculation is as follows: 85 (FTEs) x 2.22 = 1.89 (HR FTEs) 100 This calculation indicates that for an organization with 85 FTEs, the median number of HR FTEs is 1.89. While this approximates that two FTEs may be appropriate for some organizations of this size, it is not always the case. For example, if the HR department has significant initiatives to undertake or if the organization must increase its recruiting efforts to hire a large number of employees, then more HR staff may be required. Table 2: HR-to-Employee Ratios (by Organizational Size)
Organizational Size n 25th Percentile
Median 75th Percentile
Total 404 0.72 1.12 1.82
Fewer than 100 135 1.25 2.22 4.55
100 to 249 92 0.76 1.14 1.71
250 to 499 60 0.53 0.80 1.15
500 to 999 42 0.66 0.86 1.21
1,000 to 2,499 34 0.48 0.83 0.99
2,500 to 7,499 24 0.17 0.76 1.05
7,500 or more 17 0.55 0.82 1.00 Source: SHRM Human Capital Benchmarking Study: 2008 Executive Summary EMPLOYMENT Organizations filled a median number of 37 positions in 2007 compared to 33 positions in 2006. While this represents a slight increase over 2006, these data must be interpreted with the understanding that the 2006 numbers reflected a 23% decrease from the previous year. The SHRM/Rutgers Leading Indicators of National Employment (LINE®, www.shrm.org/line) also reflected a monthly downward hiring trend from September 2007 through December 2007. Results from LINE could be interpreted that organizations began to hire heavily in the early months of 2007 in order to staff up from the lackluster hiring and high turnover from the year before, but then, as the economy retrenched and organizations saw revenue not being met, hiring activity dropped sharply. In addition, an analysis of the data also indicated a significant positive relationship between cost-per-hire and time-to-fill.5 This may provide 5 SHRM Human Capital Benchmarking Study [unpublished data]

SHRM® Human Capital Benchmarking Study: 2008 Executive Summary 13
some insight about staffing strategies. For example, it may suggest that once a position opens, a recruiter typically uses less costly ways to fill it. But as time-to-fill increases and pressure from the hiring manager mounts as work deadlines aren’t met, only then will recruiters increase spending to fill the position. Obviously, such a strategy makes sense for filling most openings because recruiters are often held accountable for cost-per-hire targets. However, for positions that historically have a high cost-per-hire and long time-to-fill, these data suggest that it may be wiser to initially use a more expensive sourcing strategy, such as a third-party agency, because ultimately time-to-fill will be lower and cost-per-hire will likely decrease. Table 3 illustrates the percentage of positions filled as a proportion of total employees and the actual number of employees hired by industry. When used in combination with the actual number of positions filled, these data allow an organization to compare its hiring activity level with others in its industry. Transportation and warehousing, health care services and nonprofit services had the top three highest medians for percentages of positions filled in 2007. Transportation and warehousing, insurance, and government were the industries with the highest number of actual hires. Slightly more than one-third (36%) of organizations expected hiring activity to increase in 2008, reflecting lower hiring expectations than what was reported by organizations the previous year (43%). As indicated in Table 4, construction, mining, oil and gas, nondurable goods manufacturing, and high-tech were the top three industries that expected hiring to increase in 2008.

SHRM® Human Capital Benchmarking Study: 2008 Executive Summary 14
Table 3: Industry Hiring Activity for 2007
Industry Percent of Positions Filled
in 2007 Actual Number of Positions Filled
in 2007
n
25th Percentile
Median 75th
Percentile n
25th Percentile
Median 75th
Percentile
Total 364 11% 20% 32% 364 10 37 100
Construction, mining, oil and gas 11 12% 18% 52% 11 15 30 500 Educational services 21 8% 11% 18% 21 10 17 43
Finance 19 19% 27% 31% 19 13 56 73
Government 14 8% 12% 22% 14 25 85 176 Health care services 32 23% 30% 39% 32 37 58 111
High-tech 13 16% 20% 28% 13 20 42 60
Insurance 10 11% 15% 33% 10 20 93 263 Manufacturing (durable goods) 60 8% 12% 25% 60 12 37 96.5 Manufacturing (nondurable goods) 24 7% 16% 25% 24 12 29 49 Services (nonprofit) 34 13% 25% 36% 34 7 34 79
Services (profit) 52 11% 19% 30% 52 3 11 69 Retail/wholesale trade 16 15% 22% 42% 16 13 49 136 Transportation and warehousing 12 18% 33% 51% 12 30 124 359
Government agency 22 8% 13% 31% 22 25 64 163 Nonprofit organization 73 13% 22% 33% 73 15 50 135 Privately owned for-profit organization 205 6% 14% 28% 205 10 24 75 Publicly owned for-profit organization 62 6% 14% 28% 62 13 59 159
Note: Industries with fewer than 10 organizations were omitted from the table. They were: accommodations, food and drinking places, and gaming; agriculture, forestry, fishing and hunting; biotechnology; pharmaceutical; publishing and broadcasting; real estate; telecommunications; utilities; and other. Source: SHRM Human Capital Benchmarking Study: 2008 Executive Summary In 2007, the median cost-per-hire and time-to-fill data were $1,820 and 27 days, respectively. Although these figures reflect the median figures for all organizations that responded to the study, the actual 2007 averages were higher—$4,222 and 35 days, respectively. The large difference between median and average values indicates that some HR departments reported high cost-per-hire data. While in 2007 the median cost-per-hire jumped more than 46% from the previous year, which had a median of $1,250 for the previous year, this may be because hiring stopped after major financial and sourcing commitments to sourcing were done. Cost-per-hire may also differ even within the same industry, depending on the level of position being hired. For example, organizations that

SHRM® Human Capital Benchmarking Study: 2008 Executive Summary 15
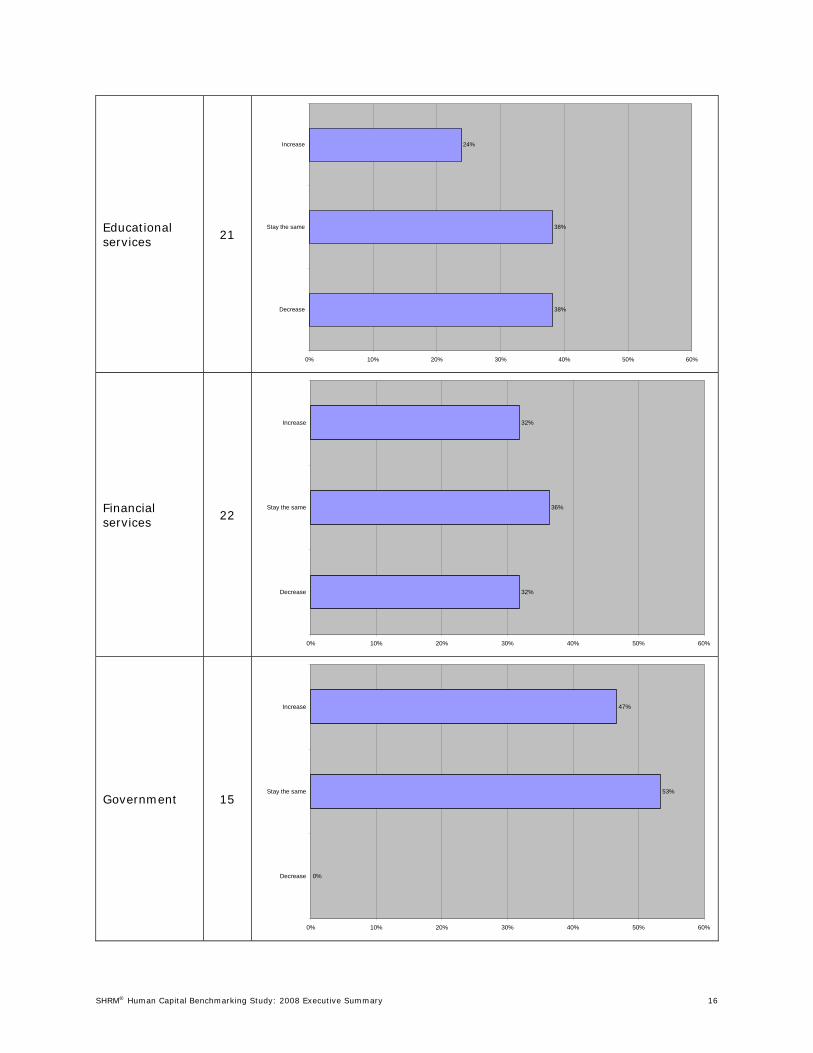
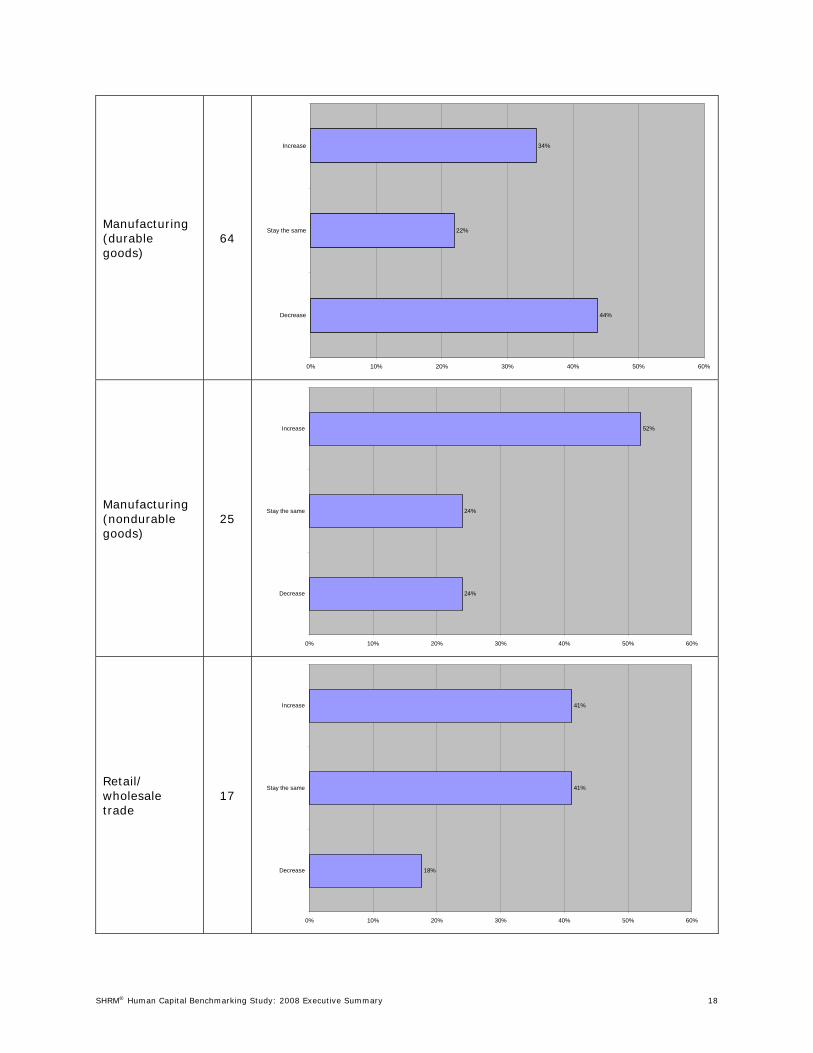
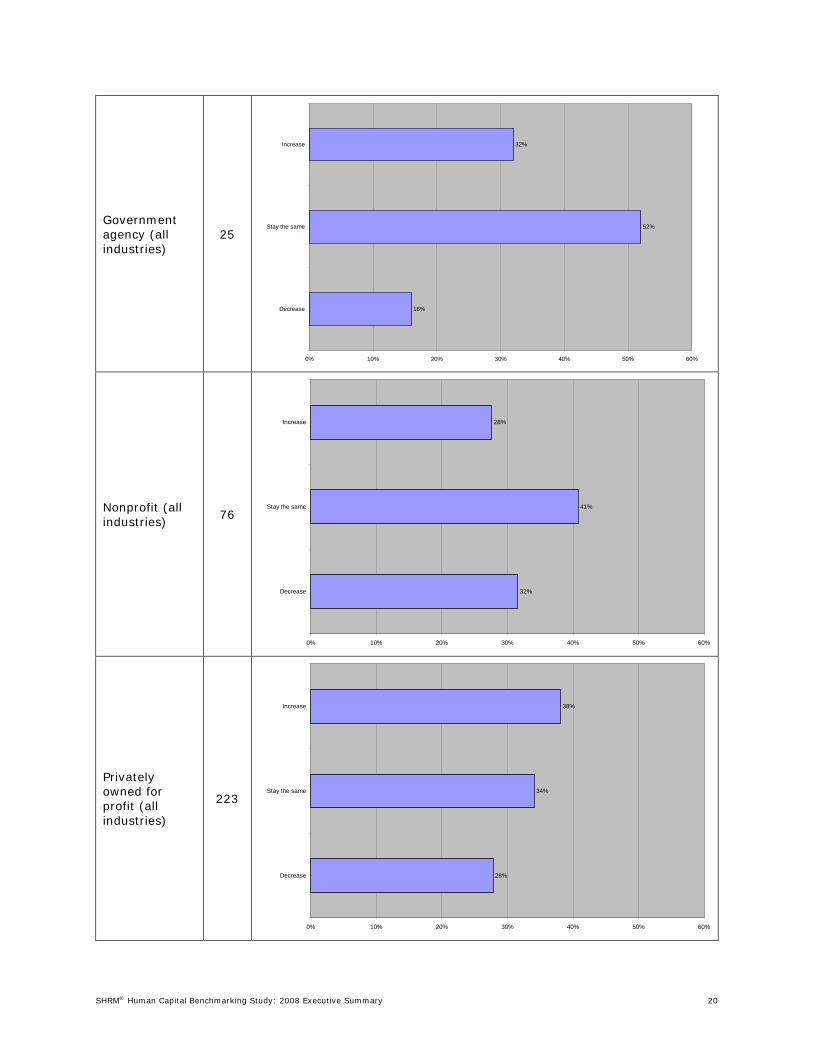
filled many executive-level positions that involved relocation costs would have a significantly greater cost-per-hire that those that did not recruit for such positions. Table 4: Industry Hiring Projections for 2008
Industry n Hiring Projections in 2008
All industries 394
28%
36%
36%
0% 10% 20% 30% 40% 50% 60%
Decrease
Stay the same
Increase
Construction, mining, oil and gas
11
18%
27%
55%
0% 10% 20% 30% 40% 50% 60%
Decrease
Stay the same
Increase
SHRM® Human Capital Benchmarking Study: 2008 Executive Summary 16
Educational services 21
38%
38%
24%
0% 10% 20% 30% 40% 50% 60%
Decrease
Stay the same
Increase
Financial services 22
32%
36%
32%
0% 10% 20% 30% 40% 50% 60%
Decrease
Stay the same
Increase
Government 15
0%
53%
47%
0% 10% 20% 30% 40% 50% 60%
Decrease
Stay the same
Increase

SHRM® Human Capital Benchmarking Study: 2008 Executive Summary 17
Health 35
20%
57%
23%
0% 10% 20% 30% 40% 50% 60%
Decrease
Stay the same
Increase
High-tech 14
14%
36%
50%
0% 10% 20% 30% 40% 50% 60%
Decrease
Stay the same
Increase
Insurance 10
30%
40%
30%
0% 10% 20% 30% 40% 50% 60%
Decrease
Stay the same
Increase
SHRM® Human Capital Benchmarking Study: 2008 Executive Summary 18
Manufacturing (durable goods)
64
44%
22%
34%
0% 10% 20% 30% 40% 50% 60%
Decrease
Stay the same
Increase
Manufacturing (nondurable goods)
25
24%
24%
52%
0% 10% 20% 30% 40% 50% 60%
Decrease
Stay the same
Increase
Retail/ wholesale trade
17
18%
41%
41%
0% 10% 20% 30% 40% 50% 60%
Decrease
Stay the same
Increase

SHRM® Human Capital Benchmarking Study: 2008 Executive Summary 19
Service (nonprofit) 36
36%
44%
19%
0% 10% 20% 30% 40% 50% 60%
Decrease
Stay the same
Increase
Service (profit) 60
22%
37%
42%
0% 10% 20% 30% 40% 50% 60%
Decrease
Stay the same
Increase
Transportation and warehousing
13
23%
38%
38%
0% 10% 20% 30% 40% 50% 60%
Decrease
Stay the same
Increase
SHRM® Human Capital Benchmarking Study: 2008 Executive Summary 20
Government agency (all industries)
25
16%
52%
32%
0% 10% 20% 30% 40% 50% 60%
Decrease
Stay the same
Increase
Nonprofit (all industries)
76
32%
41%
28%
0% 10% 20% 30% 40% 50% 60%
Decrease
Stay the same
Increase
Privately owned for profit (all industries)
223
28%
34%
38%
0% 10% 20% 30% 40% 50% 60%
Decrease
Stay the same
Increase

SHRM® Human Capital Benchmarking Study: 2008 Executive Summary 21
Publicly owned for profit (all industries)
67
30%
34%
36%
0% 10% 20% 30% 40% 50% 60%
Decrease
Stay the same
Increase
Note: Industries with fewer than 10 organizations were omitted from the table. They were: accommodations, food and drinking places, and gaming; agriculture, forestry, fishing and hunting; biotechnology; pharmaceutical; publishing and broadcasting; real estate; telecommunications; utilities; and other. Source: SHRM Human Capital Benchmarking Study: 2008 Executive Summary COMPENSATION For all organizations, the median expected annual increase for salaries was 3.3% in 2008—a slight decrease from 3.5% reported for the previous year. In 2007, the median annual target bonus percentage for executives was 4%, reflecting a decrease from last year’s median annual target percentage of 18%. Most likely, this decrease is the result of organizations not meeting their financial goals, thereby affecting executive bonus compensation. Table 5 indicates the annual target bonus percentage for executives. Organizations with fewer than 100 employees, as well as those with more than 7,500 employees, had the lowest target bonus percentage for executives, each with a median of 0. This may be because very large organizations are often publicly held and therefore have executive bonus payouts tied more directly to achieving certain stock price objectives, which may not have been met because of the down economy. Small organizations with fewer than 100 employees, however, may have limited resources and therefore have less financial cushion to afford executive bonuses during difficult economic times. In addition, small organizations may not even have formal executive bonus plans in place.

SHRM® Human Capital Benchmarking Study: 2008 Executive Summary 22
Table 5: 2007 Target Bonus Percentage for Executives (by Organizational Size)
n 25th
Percentile Median 75th
Percentile
All sizes 233 0% 4% 20%
Fewer than 100 87 0% 0% 10%
100 to 249 49 0% 3% 13%
250 to 499 40 0% 16% 25%
500 to 999 22 0% 13% 25%
1,000 to 2,499 21 0% 8% 19%
2,500 to 7,499 7 15% 25% 40%
7,500 or more 7 0% 0% 25% Source: SHRM Human Capital Benchmarking Study: 2008 Executive Summary Salaries as a percentage of operating expense are related to two important factors that drive any business. These are the base salary costs associated with human capital and all other costs that are required to operate the business and keep it running. While operating expenses do include salary, they also include other expenses, such as parts and supplies, rent, printing, travel and capital depreciation. Table 6 indicates that the median increase in salaries as a percentage of operating expense for all industries in 2007 was 57%, which was higher than the figure of 50% for 2006. This increase in salaries relative to other expenses may have taken place because organizations are cutting back more aggressively in non-staff areas in order to reduce costs, which, in turn, makes salaries a large portion of overall expenses. Table 6 indicates that publicly owned for-profit organizations had lower median salaries as a percentage of operating expense than nonprofit organizations, privately owned for-profit organizations or government agencies. Because publicly owned for-profit organizations face greater scrutiny from the investor community, they may keep total salary costs low in order to keep profitability up and stock values high. Table 6: Salaries as a Percentage of Operating Expense in 2007 (by Profit Status)
n 25th
Percentile Median 75th
Percentile
All industries 182 20% 57% 40%
Government agency 10 11% 54% 40%
Nonprofit organization 45 33% 56% 43% Privately owned for-profit organization 102 18% 60% 42% Publicly owned for-profit organization 25 18% 45% 37% Source: SHRM Human Capital Benchmarking Study: 2008 Executive Summary

SHRM® Human Capital Benchmarking Study: 2008 Executive Summary 23
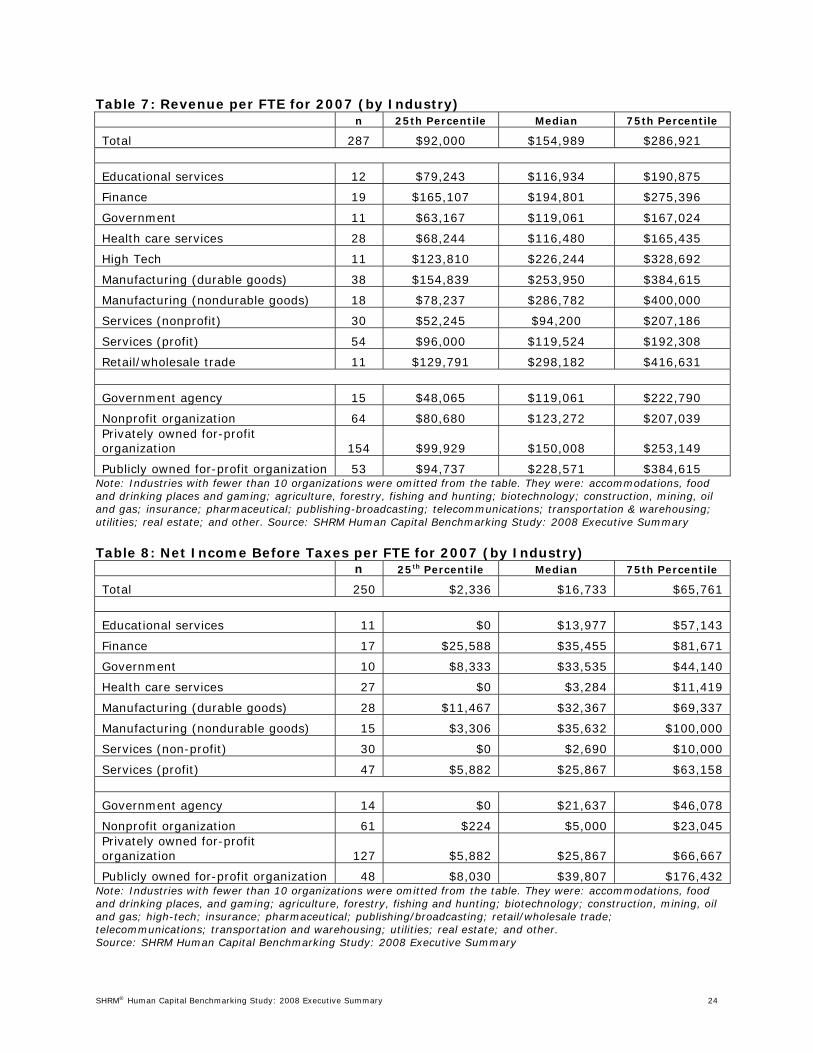
ORGANIZATIONAL DATA Total gross revenue and total net income are strategic financial indicators of performance for most organizations. When total revenue is divided by total employees (FTEs), the resulting number is a marker of efficiency.6 This ratio, termed revenue per FTE, conceptually links the time and effort associated with the firm’s human capital to its revenue output. To illustrate, for an organization that has $100 million in revenues and 300 FTEs, the calculation yields a ratio of $333,333 per FTE. If the revenue per FTE ratio increases, it indicates that there is greater efficiency and productivity because more output is being produced per FTE. If the ratio decreases, it indicates less efficiency and productivity. The ratio of net income per FTE also follows a similar logic. It calculates efficiency by taking net income before taxes, which is the difference between gross revenue and expenses, and divides it by the number of FTEs. Since net income per FTE comprises two factors, it is best looked at over time.7 Both metrics, however, are basic measures that look at productivity in terms of employees and financial performance. Although one is not a better “indicator” than the other per se, revenue per FTE is a more sensitive indicator because it consists of only one factor—revenue. Standing alone, without comparisons within a specific industry or other organizational characteristics, these metrics may not have much value. But used over time, they are a way for HR professionals to track relationships in operational issues and financial performance to employee productivity. The overall 2007 median for revenue per FTE was $154,989, which represented a 23% decrease from the previous year. The top three industries with the highest medians for revenue per FTE were retail/wholesale trade, manufacturing (nondurable goods) and manufacturing (durable goods). Net income per FTE for all industries was $16,733, representing an 11% decrease over the previous year. Manufacturing (nondurable goods), finance and government were the industries with the highest median net income per FTE. Tables 7 and 8 provide a breakdown of revenue per FTE and net income per FTE for all industries.
6 Fitz-enz, J., & Davison, B. (2002). How to measure human resources management (3rd edition). New York: McGraw-Hill. 7 Ibid.
SHRM® Human Capital Benchmarking Study: 2008 Executive Summary 24
Table 7: Revenue per FTE for 2007 (by Industry) n 25th Percentile Median 75th Percentile
Total 287 $92,000 $154,989 $286,921
Educational services 12 $79,243 $116,934 $190,875
Finance 19 $165,107 $194,801 $275,396
Government 11 $63,167 $119,061 $167,024
Health care services 28 $68,244 $116,480 $165,435
High Tech 11 $123,810 $226,244 $328,692
Manufacturing (durable goods) 38 $154,839 $253,950 $384,615
Manufacturing (nondurable goods) 18 $78,237 $286,782 $400,000
Services (nonprofit) 30 $52,245 $94,200 $207,186
Services (profit) 54 $96,000 $119,524 $192,308
Retail/wholesale trade 11 $129,791 $298,182 $416,631
Government agency 15 $48,065 $119,061 $222,790
Nonprofit organization 64 $80,680 $123,272 $207,039 Privately owned for-profit organization 154 $99,929 $150,008 $253,149
Publicly owned for-profit organization 53 $94,737 $228,571 $384,615 Note: Industries with fewer than 10 organizations were omitted from the table. They were: accommodations, food and drinking places and gaming; agriculture, forestry, fishing and hunting; biotechnology; construction, mining, oil and gas; insurance; pharmaceutical; publishing-broadcasting; telecommunications; transportation & warehousing; utilities; real estate; and other. Source: SHRM Human Capital Benchmarking Study: 2008 Executive Summary Table 8: Net Income Before Taxes per FTE for 2007 (by Industry) n 25th Percentile Median 75th Percentile
Total 250 $2,336 $16,733 $65,761
Educational services 11 $0 $13,977 $57,143
Finance 17 $25,588 $35,455 $81,671
Government 10 $8,333 $33,535 $44,140
Health care services 27 $0 $3,284 $11,419
Manufacturing (durable goods) 28 $11,467 $32,367 $69,337
Manufacturing (nondurable goods) 15 $3,306 $35,632 $100,000
Services (non-profit) 30 $0 $2,690 $10,000
Services (profit) 47 $5,882 $25,867 $63,158
Government agency 14 $0 $21,637 $46,078
Nonprofit organization 61 $224 $5,000 $23,045 Privately owned for-profit organization 127 $5,882 $25,867 $66,667
Publicly owned for-profit organization 48 $8,030 $39,807 $176,432 Note: Industries with fewer than 10 organizations were omitted from the table. They were: accommodations, food and drinking places, and gaming; agriculture, forestry, fishing and hunting; biotechnology; construction, mining, oil and gas; high-tech; insurance; pharmaceutical; publishing/broadcasting; retail/wholesale trade; telecommunications; transportation and warehousing; utilities; real estate; and other. Source: SHRM Human Capital Benchmarking Study: 2008 Executive Summary

SHRM® Human Capital Benchmarking Study: 2008 Executive Summary 25
Conclusion Confronted with an unexpected shift in the economy beginning mid-2007, organizations had cut back on hiring and other expenses as they grappled to reach profit margins in light of dwindling revenues. Because human capital contributes to firm performance, salaries as a percentage of operating expense increased over last year, as it appears that firms first tried to cut other expenses before payroll costs. Talent acquisition may remain flat if the economy continues to recoil in 2008. Should this occur, organizations may increase their scrutiny of a candidate’s qualifications to make sure he or she meets or exceeds expectations, knowing that candidates will wait longer for an offer because job options are slim. However, it is possible that such delays may ultimately increase the time-to-fill metric in 2008. In a down economy, organizations may also increasingly scrutinize performance of existing staff.
Often when financial targets aren’t being met, organizations look more fully at existing programs to evaluate their return on investment. Because of this, business executives in HR and other disciplines may be required to show their program’s linkage between their costs and revenue. One way to achieve this is to provide objective benchmarking data that executives can use to compare their organization’s human capital measures against similar organizations within the same industry. Benchmarking data represent one of the first steps to uncovering the links between human capital management practices and firm performance. When used wisely, benchmarking data can protect programs that are performing well, create support for organizational change and help executives in HR and other disciplines make strategic decisions that affect their organizations. Care must be taken, however, not to use benchmarking data as merely justification for cutting costs. A better way to gain support is to relate how investments in HR help support the business strategy. Otherwise, HR may find itself overly defending their costs, as opposed to demonstrating how it contributes to an organization’s bottom line.

SHRM® Human Capital Benchmarking Study: 2008 Executive Summary
26
Profile of Organizations Responding to the Survey The make-up of organizations that responded to the survey varied greatly. Factors such as workforce size, industry, revenue and geographic location all affect the way in which the HR department aligns its activities to support the organization. The profile of organizations responding to this executive summary is also comparable to the makeup of organizations responding to the 2008 SHRM Human Capital Benchmarking Study. Tables 9 through 14 provide a breakdown of the range of employers that responded to this survey. Table 9: HR Department Level (n = 614) Corporate (companywide) 66% Facility/location 17% Business unit/division 16%
Note: Percentages do not total 100% due to rounding. Source: SHRM Human Capital Benchmarking Study: 2008 Executive Summary Table 10: Industry (n = 603)
Accommodations, food and drinking places, and gaming 1%
Agriculture, forestry, fishing and hunting 1%
Biotechnology 1%
Construction, mining, oil and gas 3%
Educational services 5%
Finance 6%
Government 4%
Health care services 8%
High-tech 4%
Insurance 3%
Manufacturing (durable goods) 16%
Manufacturing (nondurable goods) 6%
Pharmaceutical 1%
Publishing/broadcasting 2%
Real estate 1%
Retail/wholesale trade 5%
Services (nonprofit) 9%
Services (profit) 15%
Telecommunications 3%
Transportation and warehousing 3%
Utilities 2%
Other 2% Source: SHRM Human Capital Benchmarking Study: 2008 Executive Summary

SHRM® Human Capital Benchmarking Study: 2008 Executive Summary
27
Table 11: Number of FTEs for the Organizational Level (n = 579) Fewer than 100 32% 100 to 249 22% 250 to 499 14% 500 to 999 10% 1,000 to 2,499 9% 2,500 to 7,499 7% 7,500 or more 7%
Source: SHRM Human Capital Benchmarking Study: 2008 Executive Summary Table 12: Organizational Revenue in 2007 (n = 288) Under $5 million 17% $5 million to $24.9 million 32% $25 million to $99.9 million 23% $100 million to $999.9 million 21% Over $1 billion 8%
Source: SHRM Human Capital Benchmarking Study: 2008 Executive Summary Table 13: Region (n = 596)
Northeast (Connecticut, Delaware, Maine, Maryland, Massachusetts, New Hampshire, New Jersey, New York, Pennsylvania, Rhode Island, Vermont)
23%
Pacific West (Alaska, California, Hawaii, Idaho, Montana, Nevada, Oregon, Washington, Wyoming)
22%
Southwest Central (Arizona, Arkansas, Colorado, Kansas, Louisiana, Missouri, New Mexico, Oklahoma, Texas, Utah)
21%
North Central (Illinois, Indiana, Iowa, Michigan, Minnesota, Nebraska, North Dakota, Ohio, South Dakota, Wisconsin)
18%
Southeast (Alabama, District of Columbia, Florida, Georgia, Kentucky, Mississippi, North Carolina, South Carolina, Tennessee, Virginia, West Virginia)
17%
Note: Percentages do not total 100% due to rounding. Source: SHRM Human Capital Benchmarking Study: 2008 Executive Summary Table 14: Profit Status (n = 589)
Privately owned for-profit organization 53% Publicly owned for-profit organization 22% Nonprofit organization 18% Government agency 6%
Source: SHRM Human Capital Benchmarking Study: 2008 Executive Summary

SHRM® Human Capital Benchmarking Study: 2008 Executive Summary
28
Human Capital Glossary of Metric Terms, Definitions and Calculations Statistical Definitions “ n ” Letter “n” in tables and figures indicates the number of respondents to each question. Therefore, when it is noted that n = 25, it indicates that the number of respondents was 25. Percentile The percentage of responses in a group that have values less than or equal to that particular value. For example, when data are arranged from lowest to highest, the 25th percentile is the point at which 75% of the data are above and 25% are below it. Conversely, the 75th percentile is the point at which 25% of the data are above and 75% are below it. Median (50th percentile) The median is the midpoint of the set of numbers or values arranged in ascending order. It is recommended that the median is used as a basis for all interpretations of the data when the average and median are discrepant. Average The average is the sum of the responses divided by the total number of responses. It is also known as the mean. This measure is affected more than the median by the occurrence of outliers (extreme values). For this reason, the average reported may be greater than the 75th percentile or less than the 25th percentile. Organizational Data FTE FTE is an abbreviation for full-time equivalent. Full-time equivalents represent the total labor hours invested. To convert part-time staff into FTEs, divide the total number of hours worked by part-time employees during the work year by the total number of hours in the work year (e.g., if the average work week is 37.5 hours, total number of hours in a work year would be 37.5 hours/week x 52 weeks = 1,950). Converting the number of employees to FTEs provides a more accurate understanding of the level of effort being applied in an organization. For example, if two employees are job-sharing, the FTE number is only one. Revenue In business, revenue is the amount of money that a company actually receives from its activities, mostly from sales of products and/or services to customers. To investors, revenue is less important than profit, or income, which is the amount of money the company has earned after deducting all of its expenses.
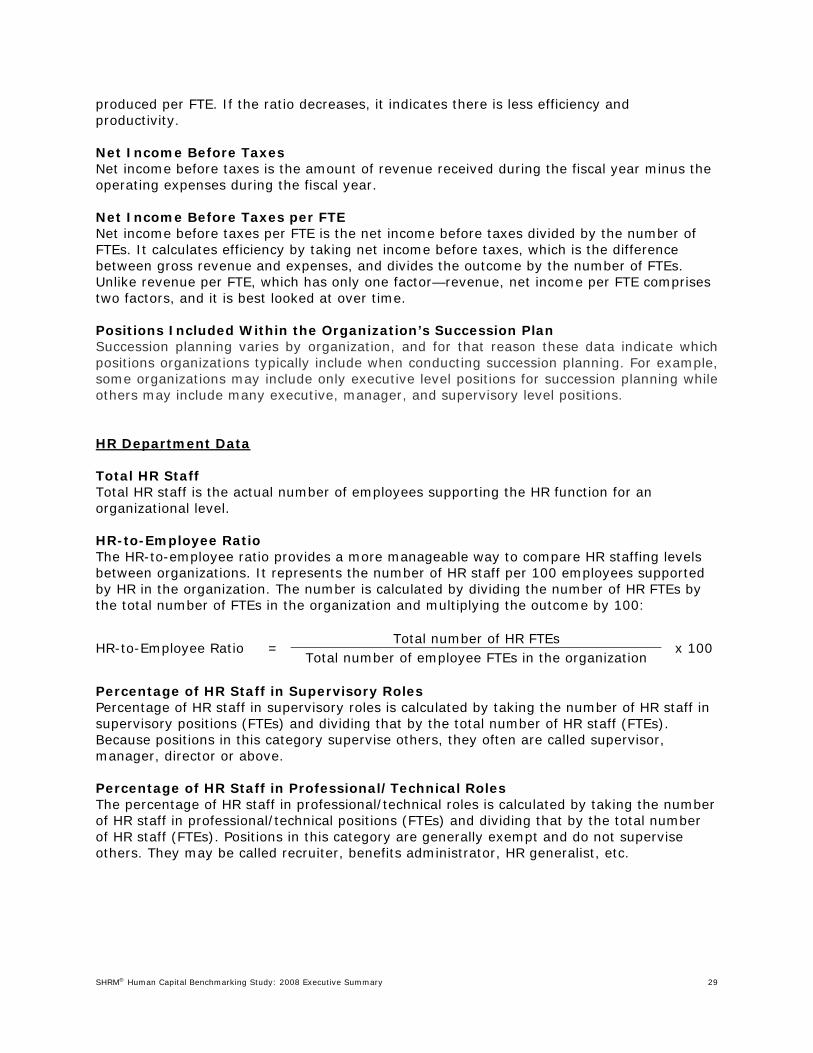
Revenue per FTE Revenue per FTE is the total amount of revenue received during an organization’s fiscal year divided by the number of FTEs. This ratio conceptually links the time and effort associated with the firm’s human capital to its revenue output. If the revenue-per-FTE ratio increases, it indicates that there is greater efficiency and productivity because more output is being
SHRM® Human Capital Benchmarking Study: 2008 Executive Summary
29
produced per FTE. If the ratio decreases, it indicates there is less efficiency and productivity. Net Income Before Taxes Net income before taxes is the amount of revenue received during the fiscal year minus the operating expenses during the fiscal year. Net Income Before Taxes per FTE Net income before taxes per FTE is the net income before taxes divided by the number of FTEs. It calculates efficiency by taking net income before taxes, which is the difference between gross revenue and expenses, and divides the outcome by the number of FTEs. Unlike revenue per FTE, which has only one factor—revenue, net income per FTE comprises two factors, and it is best looked at over time. Positions Included Within the Organization’s Succession Plan Succession planning varies by organization, and for that reason these data indicate which positions organizations typically include when conducting succession planning. For example, some organizations may include only executive level positions for succession planning while others may include many executive, manager, and supervisory level positions. HR Department Data Total HR Staff Total HR staff is the actual number of employees supporting the HR function for an organizational level. HR-to-Employee Ratio The HR-to-employee ratio provides a more manageable way to compare HR staffing levels between organizations. It represents the number of HR staff per 100 employees supported by HR in the organization. The number is calculated by dividing the number of HR FTEs by the total number of FTEs in the organization and multiplying the outcome by 100:
Total number of HR FTEs HR-to-Employee Ratio =
Total number of employee FTEs in the organization x 100
Percentage of HR Staff in Supervisory Roles Percentage of HR staff in supervisory roles is calculated by taking the number of HR staff in supervisory positions (FTEs) and dividing that by the total number of HR staff (FTEs). Because positions in this category supervise others, they often are called supervisor, manager, director or above. Percentage of HR Staff in Professional/Technical Roles The percentage of HR staff in professional/technical roles is calculated by taking the number of HR staff in professional/technical positions (FTEs) and dividing that by the total number of HR staff (FTEs). Positions in this category are generally exempt and do not supervise others. They may be called recruiter, benefits administrator, HR generalist, etc.

SHRM® Human Capital Benchmarking Study: 2008 Executive Summary
30
Percentage of HR Staff in Administrative Support Roles The percentage of HR staff in administrative support roles is calculated by taking the number of HR staff in administrative support positions (FTEs) and dividing that by the number by the total of HR staff (FTEs). Often, but not always, positions in this category are non-exempt. They may be called coordinator, assistant, etc. Reporting Structure for the Head of HR Reporting structure for the head of HR indicates to what position within the organization the head of HR reports. Occasionally in very small companies the head of HR may report to the CFO or head of an operating unit. In larger organizations the head of HR usually reports to the President of CEO. Types of HR Positions Organizations Expect to Hire in the Coming Year This metric reflects the expectations for HR hiring, including the types of HR positions that organizations anticipate hiring in 2008. Areas of HR Outsourcing Areas of HR outsourcing indicates what activities or functions within the human resource function are being transferred to an external service provider to perform. HR activities may be partially or completely outsourced and may include areas such as benefits administration, reference checking, HR technology, etc. HR Expense Data HR Expenses Human resource expenses represent HR’s total costs for a given fiscal year.
HR Expense to Operating Expense Ratio HR expense to operating expense ratio is calculated by dividing the organization’s total HR expenses by the operating expenses for a given fiscal year. This ratio depicts the amount of HR expenses as a percentage of total operating expenses, which is an indication of the amount of dollars an organization invests in its HR function. HR Expense to FTE Ratio HR expense by FTE ratio represents the amount of human resource dollars spent per FTE in the organization. It is calculated by taking the HR expenses for a given fiscal year and dividing that by the number of FTEs in the organization. Compensation Data Annual Salary Increase Annual salary increase is the percentage of increase in salaries that an organization expects to provide to its employees for a given fiscal year. Salaries as a Percentage of Operating Expense Salaries as a percentage of operating expense is calculated by taking the total amount of employee salaries divided by the operating expense for a given fiscal year. Target Bonus Percentage for Nonexecutives The target bonus for nonexecutives represents the average percentage of base pay that is targeted to be paid out in cash to nonexecutive staff during a given year.
SHRM® Human Capital Benchmarking Study: 2008 Executive Summary
31
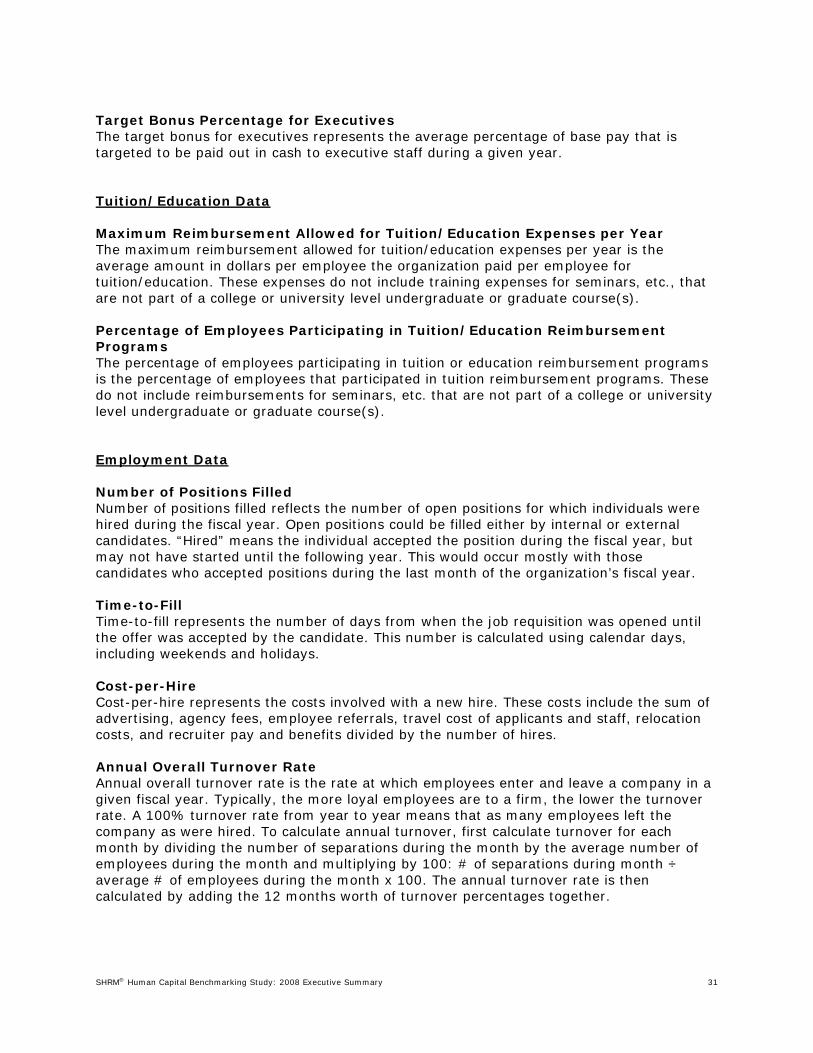
Target Bonus Percentage for Executives The target bonus for executives represents the average percentage of base pay that is targeted to be paid out in cash to executive staff during a given year. Tuition/Education Data Maximum Reimbursement Allowed for Tuition/Education Expenses per Year The maximum reimbursement allowed for tuition/education expenses per year is the average amount in dollars per employee the organization paid per employee for tuition/education. These expenses do not include training expenses for seminars, etc., that are not part of a college or university level undergraduate or graduate course(s). Percentage of Employees Participating in Tuition/Education Reimbursement Programs The percentage of employees participating in tuition or education reimbursement programs is the percentage of employees that participated in tuition reimbursement programs. These do not include reimbursements for seminars, etc. that are not part of a college or university level undergraduate or graduate course(s). Employment Data Number of Positions Filled Number of positions filled reflects the number of open positions for which individuals were hired during the fiscal year. Open positions could be filled either by internal or external candidates. “Hired” means the individual accepted the position during the fiscal year, but may not have started until the following year. This would occur mostly with those candidates who accepted positions during the last month of the organization’s fiscal year. Time-to-Fill Time-to-fill represents the number of days from when the job requisition was opened until the offer was accepted by the candidate. This number is calculated using calendar days, including weekends and holidays. Cost-per-Hire Cost-per-hire represents the costs involved with a new hire. These costs include the sum of advertising, agency fees, employee referrals, travel cost of applicants and staff, relocation costs, and recruiter pay and benefits divided by the number of hires. Annual Overall Turnover Rate Annual overall turnover rate is the rate at which employees enter and leave a company in a given fiscal year. Typically, the more loyal employees are to a firm, the lower the turnover rate. A 100% turnover rate from year to year means that as many employees left the company as were hired. To calculate annual turnover, first calculate turnover for each month by dividing the number of separations during the month by the average number of employees during the month and multiplying by 100: # of separations during month ÷ average # of employees during the month x 100. The annual turnover rate is then calculated by adding the 12 months worth of turnover percentages together.

SHRM® Human Capital Benchmarking Study: 2008 Executive Summary
32
Annual Voluntary Turnover Rate Annual voluntary turnover rate is the rate at which employees enter and voluntarily leave a company in a given fiscal year. To calculate annual voluntary turnover, first calculate the voluntary turnover for each month by dividing the number of voluntary separations during the month by the average number of employees during the month and multiplying by 100: # of voluntary separations during month ÷ average # of employees during the month x 100. The annual voluntary turnover rate is then calculated by adding the 12 months worth of voluntary turnover percentages together. Annual Involuntary Turnover Rate Annual involuntary turnover rate is the rate at which employees enter and involuntarily leave a company in a given fiscal year. Involuntary terminations, for example, occur when the organization asks the employee to leave the company. They usually occur as a result of poor performance, layoffs or other reasons. To calculate annual involuntary turnover rate, first calculate involuntary turnover for each month by dividing the number of involuntary separations during the month by the average number of employees during the month and multiplying by 100: # of involuntary separations during month ÷ average # of employees during the month x 100. The annual involuntary turnover rate is then calculated by adding the 12 months worth of turnover percentages together. Expectations for Revenue and Organizational Hiring Percentage of Organizations Expecting Changes in Revenue in the Coming Year The expectations for revenue change indicate whether HR professionals anticipate their organization’s revenue to increase, decrease or stay the same in 2008 as compared to 2007. Percentage of Organizations Expecting Changes in Hiring in the Coming Year The expectations for changes in hiring indicate whether HR professionals anticipate their organization’s hiring activity to increase, decrease or stay the same in 2008 as compared to 2007. More Profitable Organizations More profitable organizations were defined as organizations with a net income to revenue ratio at or above the 60th percentile in their industry.

SHRM® Human Capital Benchmarking Study: 2008 Executive Summary
33
Executive Summary Project Team Project leader: John Dooney, manager, Strategic Research Project contributors: Andrew Mariotti, Strategic Research analyst
Noel Smith, Strategic Research analyst Steve Williams, Ph.D., SPHR, director, SHRM Research
External contributors and members of SHRM’s Human Capital Measurement/HR Metrics Special Expertise Panel:
Ron Adler; Jane Aggarwal, SPHR; Crist Berry, SPHR; Joanne Bintliff-Ritchie, SPHR; Barbara Casper, Ed.D.; William Greenhaigh; Steven Hunt, Ph.D., SPHR; Catherine Johnson-Komins, PHR; Jane Lewis, SPHR; Donald P. Rogers, Ph.D., SPHR; Uma, Sivasubramani, MBA, SPHR; Raelyn Trende, MBA, SPHR; Jeffrey Weaver
Copy editor: Katya Scanlan, copy editor This report is published by the Society for Human Resource Management (SHRM). All content is for informational purposes only and is not to be construed as a guaranteed outcome. The Society for Human Resource Management cannot accept responsibility for any errors or omissions or any liability resulting from the use or misuse of any such information. © 2008 Society for Human Resource Management. All rights reserved. This publication may not be reproduced, stored in a retrieval system or transmitted in whole or in part, in any form or by any means, electronic, mechanical, photocopying, recording or otherwise, without the prior written permission of the Society for Human Resource Management, 1800 Duke Street, Alexandria, VA 22314, USA. For more information, please contact: SHRM Research Department 1800 Duke Street, Alexandria, VA 22314, USA Phone: (703) 548-3440 Fax: (703) 535-6432 Web: www.shrm.org/research

*** Fictitious Data Sample***
Leading People, Leading Organizations
SHRM® 2008 CUSTOMIZED HUMAN CAPITAL BENCHMARKING REPORT
This report includes
Customized tables based on your criteria 5 A glossary of terms 19
Prepared by
Society for Human Resource Management
SHRM Customized Health Care, and Retirement and Welfare Benchmarking Reports are also available. Please visit our website at http://www.shrm.org/research/benchmarks © 2008 Society for Human Resource Management. All rights reserved. This publication may not be reproduced, stored in a retrieval system or transmitted in whole or in part, in any form or by any means, electronic, mechanical, photocopying, recording or otherwise, without the prior written permission of the Society for Human Resource Management, 1800 Duke Street, Alexandria, VA 22314, USA.

*** Fictitious Data Sample***
Leading People, Leading Organizations
Thank you for ordering a
SHRM 2008 Customized Human Capital Benchmarking Report!
Your report is based on the following criteria:
Selection Criteria
Industry Staff Size
Your Industry FTE Range
LICENSE AGREEMENT FOR THE SHRM CUSTOMIZED BENCHMARKING REPORT By opening and using this SHRM Customized Benchmarking Report (the “Report”), you (“User”) hereby agree as follows: (i) That the Society for Human Resource Management is the exclusive copyright owner of the Report. (ii) Provided that the required fee for use of the Report by User has been paid to SHRM, User has the right, by this License, to use the Report solely for the internal purposes of their employer (“Company”) or for the internal purposes of a single client of Company (“Single Client”), and to make or distribute copies of the Report to other employees within the Company or to employees within the Single Client, provided that such other Company employees or Single Client employees may only use the Report for the internal purposes of the Company, or Single Client. Except as allowed above with respect to use by employees of Company for the internal purposes of Company or employees of Single Client for the internal purposes of Single Client, neither User, Company, nor Single Client have any right to print, make, or distribute any copies, in any media, of the Report. (iii) Neither User, Company, nor Single Client has any right to sell, or sublicense, loan, or otherwise convey or distribute the Report or any copies thereof in any media to any third parties outside of the Company or Single Client.
*** Fictitious Data Sample***
Leading People, Leading Organizations
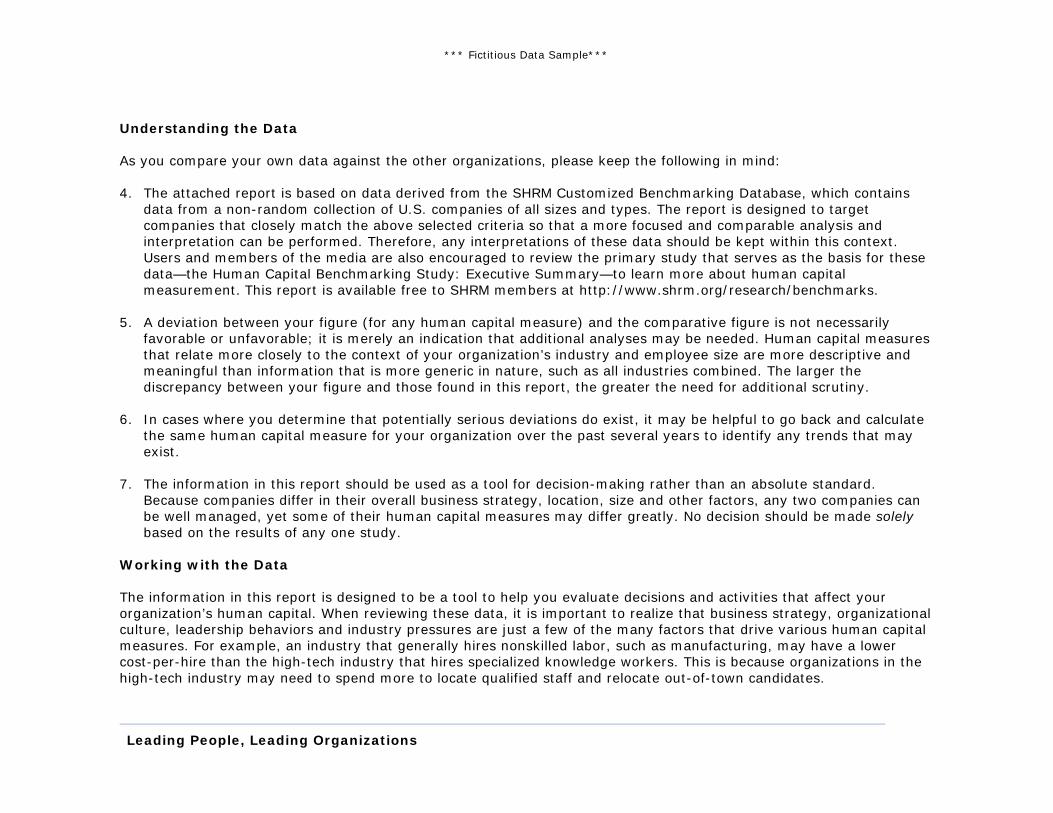
Understanding the Data As you compare your own data against the other organizations, please keep the following in mind: 4. The attached report is based on data derived from the SHRM Customized Benchmarking Database, which contains
data from a non-random collection of U.S. companies of all sizes and types. The report is designed to target companies that closely match the above selected criteria so that a more focused and comparable analysis and interpretation can be performed. Therefore, any interpretations of these data should be kept within this context. Users and members of the media are also encouraged to review the primary study that serves as the basis for these data—the Human Capital Benchmarking Study: Executive Summary—to learn more about human capital measurement. This report is available free to SHRM members at http://www.shrm.org/research/benchmarks.
5. A deviation between your figure (for any human capital measure) and the comparative figure is not necessarily
favorable or unfavorable; it is merely an indication that additional analyses may be needed. Human capital measures that relate more closely to the context of your organization’s industry and employee size are more descriptive and meaningful than information that is more generic in nature, such as all industries combined. The larger the discrepancy between your figure and those found in this report, the greater the need for additional scrutiny.
6. In cases where you determine that potentially serious deviations do exist, it may be helpful to go back and calculate
the same human capital measure for your organization over the past several years to identify any trends that may exist.
7. The information in this report should be used as a tool for decision-making rather than an absolute standard.
Because companies differ in their overall business strategy, location, size and other factors, any two companies can be well managed, yet some of their human capital measures may differ greatly. No decision should be made solely based on the results of any one study.
Working with the Data The information in this report is designed to be a tool to help you evaluate decisions and activities that affect your organization’s human capital. When reviewing these data, it is important to realize that business strategy, organizational culture, leadership behaviors and industry pressures are just a few of the many factors that drive various human capital measures. For example, an industry that generally hires nonskilled labor, such as manufacturing, may have a lower cost-per-hire than the high-tech industry that hires specialized knowledge workers. This is because organizations in the high-tech industry may need to spend more to locate qualified staff and relocate out-of-town candidates.

*** Fictitious Data Sample***
Leading People, Leading Organizations
Absolute measures are not meaningful in isolation—they should be compared with one or more measures to determine whether a satisfactory level exists. Other measures, for example, might be your organization’s past results in this area or comparatives based on organizational size, industry or geographic location. Each page in the custom tables contains customized benchmarks in aggregated form. There may be discrepancies between your organization’s human capital benchmarks and the average or median numbers for a particular category. It is particularly helpful to communicate to line managers and other executives that just because your organization has benchmarks which are different from the average or median, it does not mean they are favorable or unfavorable. Rather it may be the result of a particular total rewards strategy, special circumstances, or other business initiatives that cause differences with your organization’s benchmarks. Notes The data in this report were collected in the Spring of 2008 and reflect 2007 and 2008 data. The “n” is comprised of the organizations that responded to the specific benchmark for which it is listed. Therefore, the number of peer organizations may vary from benchmark to benchmark. Some benchmarks are less frequently collected by organizations, or may be more difficult to obtain. Therefore some benchmarks show a smaller “n” than others. Data are not displayed when there are fewer than 5 organizations for a specific metric. The last four tables of the report provide additional benchmarks for more profitable organizations. More profitable organizations were defined as organizations with a net income to revenue ratio at or above the 60th percentile in the industry selected for the sample. This information is provided for the industry selected, regardless of other criteria such as size. Disclaimer This report is published by the Society for Human Resource Management (SHRM). The Society for Human Resource Management cannot accept responsibility for any errors or omissions or any liability resulting from the use or misuse of any such information.

*** Fictitious Data Sample***
Leading People, Leading Organizations
SHRM CUSTOMIZED HUMAN CAPITAL BENCHMARKING REPORT
ORGANIZATIONAL DATA
Revenue Revenue per
FTE Net Income
Before Taxes Net Income Before
Taxes per FTE
n 95 82 74 81
25th Percentile $8,000,000 $80,000 $125,000 $1,000
Median $22,000000 $170,000 $4,000,000 $12,000
75th Percentile $52,000,000 $350,000 $12,000,000 $30,000
Average $33,000,000 $210,000 $8,200,000 $21,000
* To ensure that the data are seen as credible, data for metrics with an “n” of less than 5 are not displayed.
*** Fictitious Data Sample***
Leading People, Leading Organizations
SHRM CUSTOMIZED HUMAN CAPITAL BENCHMARKING REPORT
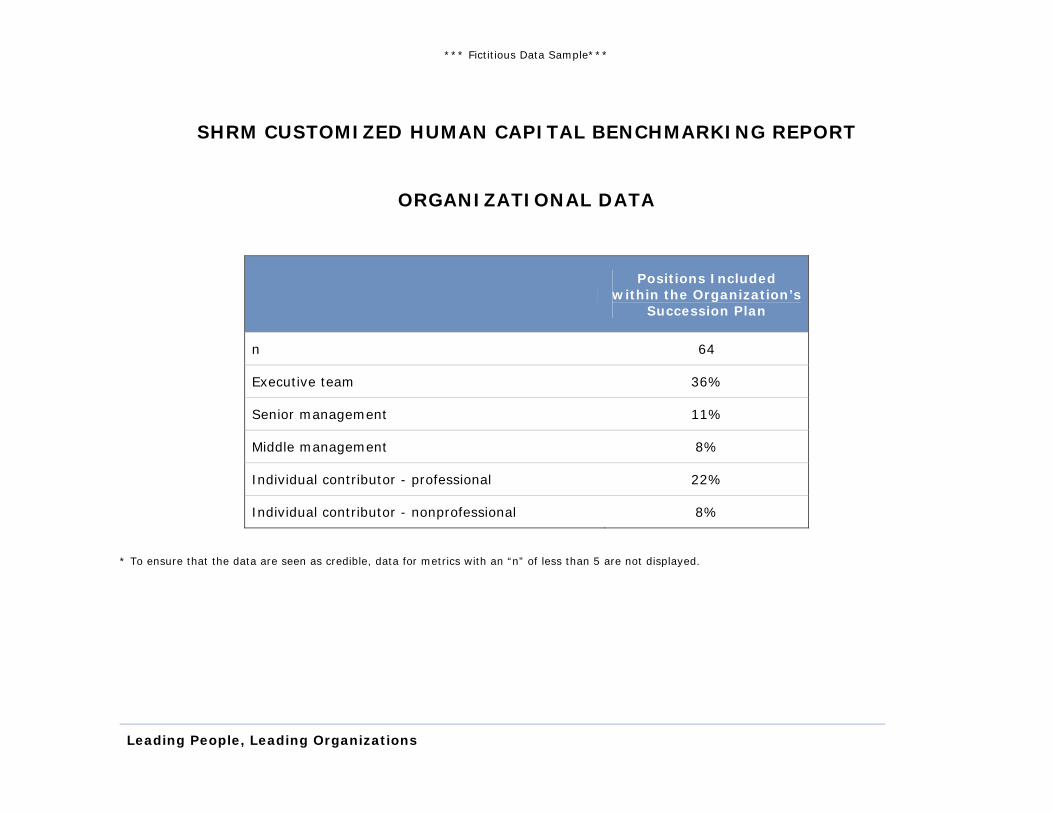
ORGANIZATIONAL DATA
Positions Included
within the Organization’s Succession Plan
n 64
Executive team 36%
Senior management 11%
Middle management 8%
Individual contributor - professional 22%
Individual contributor - nonprofessional 8%
* To ensure that the data are seen as credible, data for metrics with an “n” of less than 5 are not displayed.

*** Fictitious Data Sample***
Leading People, Leading Organizations
SHRM CUSTOMIZED HUMAN CAPITAL BENCHMARKING REPORT
HR DEPARTMENT DATA
Total HR Staff HR-to-
Employee Ratio
Percentage of HR Staff in Supervisory
Roles
Percentage of HR Staff in
Professional/ Technical Roles
Percentage of HR Staff in
Administrative Support Roles
n 99 80 77 78 90
25th Percentile 1.0 0.70 31% 14% 15%
Median 2.0 1.00 50% 23% 20%
75th Percentile 4.9 1.75 66% 33% 35%
Average 2.4 1.25 51% 23% 25%
* To ensure that the data are seen as credible, data for metrics with an “n” of less than 5 are not displayed.
*** Fictitious Data Sample***
Leading People, Leading Organizations
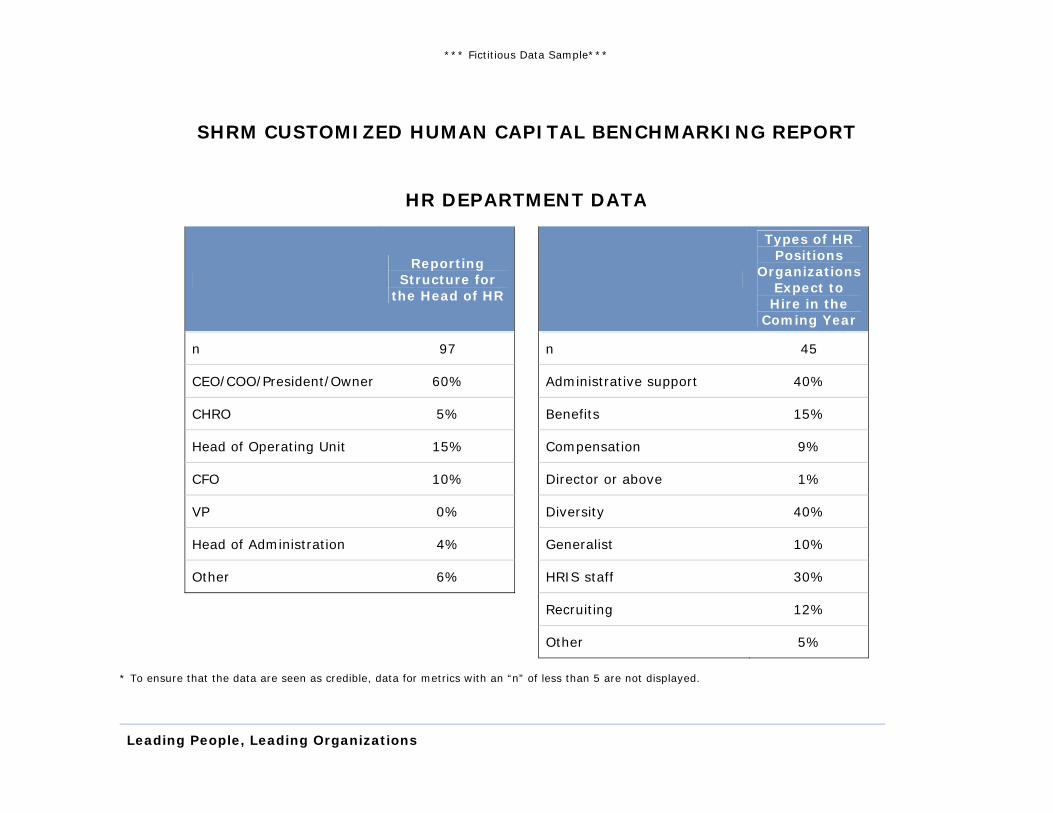
SHRM CUSTOMIZED HUMAN CAPITAL BENCHMARKING REPORT
HR DEPARTMENT DATA
Reporting
Structure for the Head of HR
Types of HR Positions
Organizations Expect to Hire in the
Coming Year
n 97 n 45
CEO/COO/President/Owner 60% Administrative support 40%
CHRO 5% Benefits 15%
Head of Operating Unit 15% Compensation 9%
CFO 10% Director or above 1%
VP 0% Diversity 40%
Head of Administration 4% Generalist 10%
Other 6% HRIS staff 30%
Recruiting 12%
Other 5%
* To ensure that the data are seen as credible, data for metrics with an “n” of less than 5 are not displayed.
*** Fictitious Data Sample***
Leading People, Leading Organizations
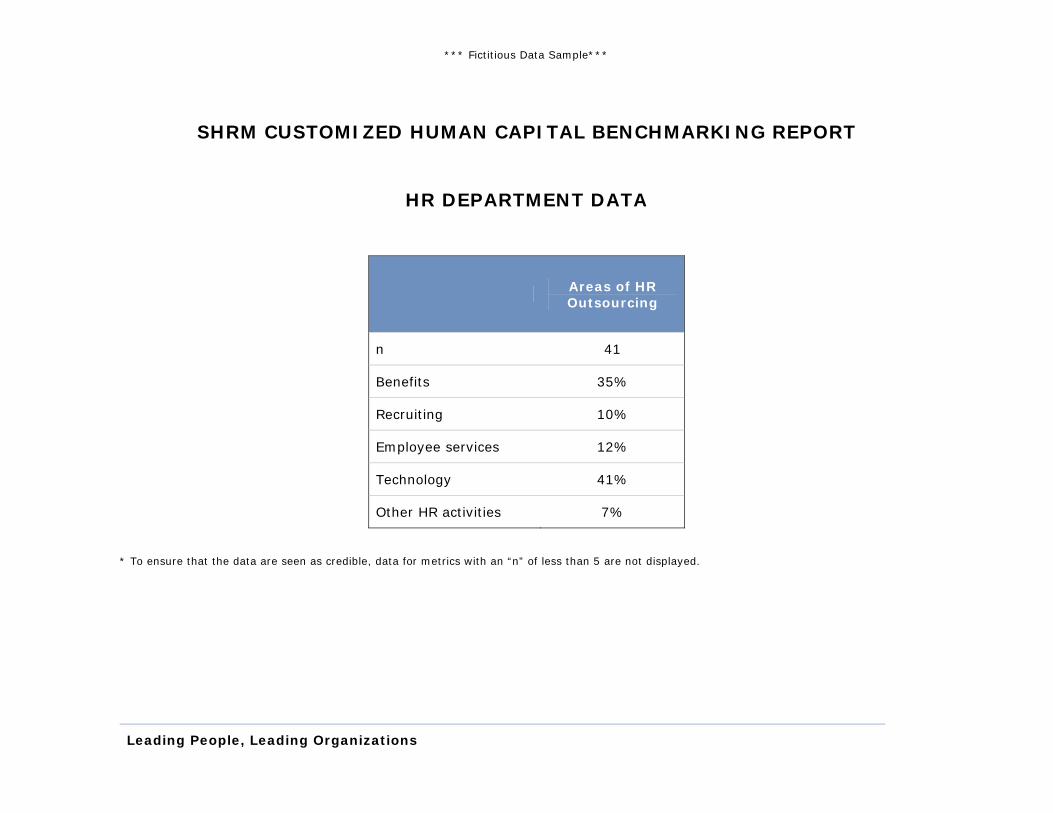
SHRM CUSTOMIZED HUMAN CAPITAL BENCHMARKING REPORT
HR DEPARTMENT DATA
Areas of HR Outsourcing
n 41
Benefits 35%
Recruiting 10%
Employee services 12%
Technology 41%
Other HR activities 7%
* To ensure that the data are seen as credible, data for metrics with an “n” of less than 5 are not displayed.

*** Fictitious Data Sample***
Leading People, Leading Organizations
SHRM CUSTOMIZED HUMAN CAPITAL BENCHMARKING REPORT
HR EXPENSE DATA
HR Expenses HR Expense to
Operating Expense Ratio
HR Expense to FTE Ratio
n 50 45 35
25th Percentile $100,000 0.5% $600
Median $250,000 1.0% $1,200
75th Percentile $700,000 2.0% $2,400
Average $400,000 1.0% $1,500
* To ensure that the data are seen as credible, data for metrics with an “n” of less than 5 are not displayed.

*** Fictitious Data Sample***
Leading People, Leading Organizations
SHRM CUSTOMIZED HUMAN CAPITAL BENCHMARKING REPORT
COMPENSATION DATA
Annual Salary
Increase
Salaries as a Percentage of
Operating Expense
Target Bonus Percentage for Non-Executives
Target Bonus Percentage for
Executives
n 60 51 39 48
25th Percentile 3.0% 30.0% 3.0% 8.0%
Median 3.5% 45.0% 5.0% 14.0%
75th Percentile 4.0% 60.0% 8.0% 24.0%
Average 3.5% 45.0% 5.1% 16.0%
* To ensure that the data are seen as credible, data for metrics with an “n” of less than 5 are not displayed.

*** Fictitious Data Sample***
Leading People, Leading Organizations
SHRM CUSTOMIZED HUMAN CAPITAL BENCHMARKING REPORT
TUITION/EDUCATION DATA
Maximum Reimbursement
Allowed for Tuition/Education Expenses per Year
Percentage of Employees Participating in
Tuition/Education Reimbursement Programs
n 60 55
25th Percentile $1,500 0.5%
Median $3,000 2.0%
75th Percentile $5,000 5.5%
Average $3,500 2.8%
* To ensure that the data are seen as credible, data for metrics with an “n” of less than 5 are not displayed.
*** Fictitious Data Sample***
Leading People, Leading Organizations
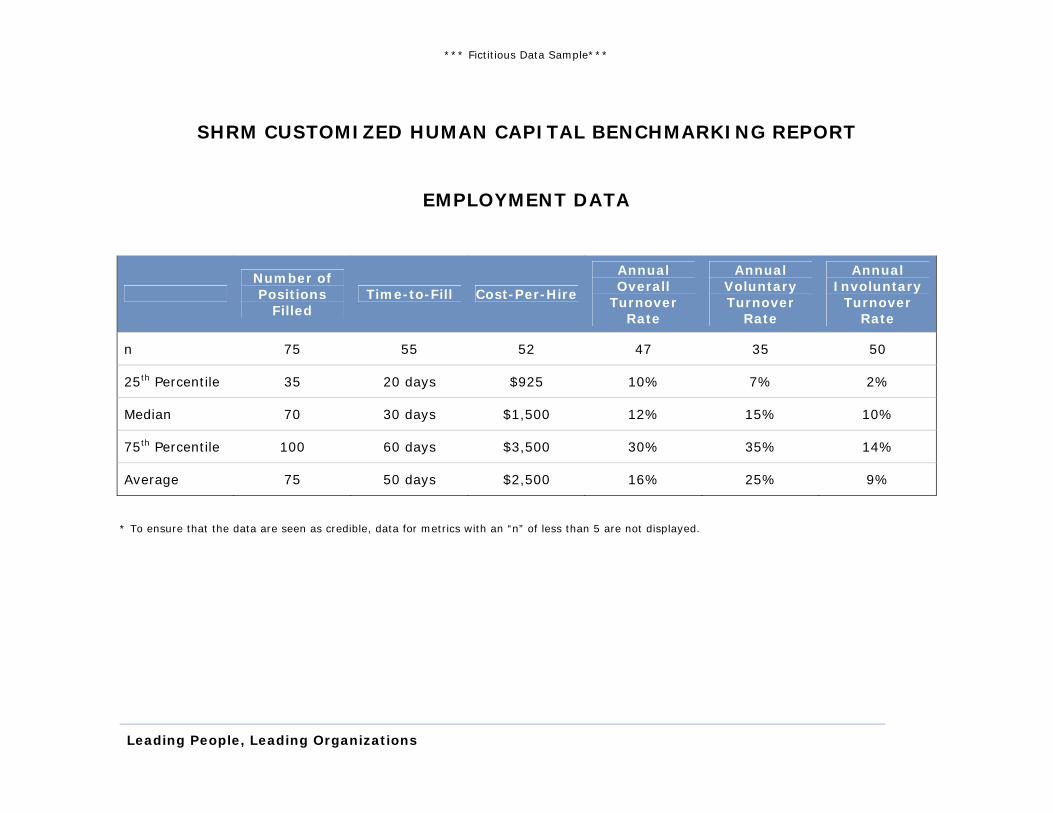
SHRM CUSTOMIZED HUMAN CAPITAL BENCHMARKING REPORT
EMPLOYMENT DATA
Number of Positions
Filled Time-to-Fill Cost-Per-Hire
Annual Overall
Turnover Rate
Annual Voluntary Turnover
Rate
Annual Involuntary
Turnover Rate
n 75 55 52 47 35 50
25th Percentile 35 20 days $925 10% 7% 2%
Median 70 30 days $1,500 12% 15% 10%
75th Percentile 100 60 days $3,500 30% 35% 14%
Average 75 50 days $2,500 16% 25% 9%
* To ensure that the data are seen as credible, data for metrics with an “n” of less than 5 are not displayed.
*** Fictitious Data Sample***
Leading People, Leading Organizations
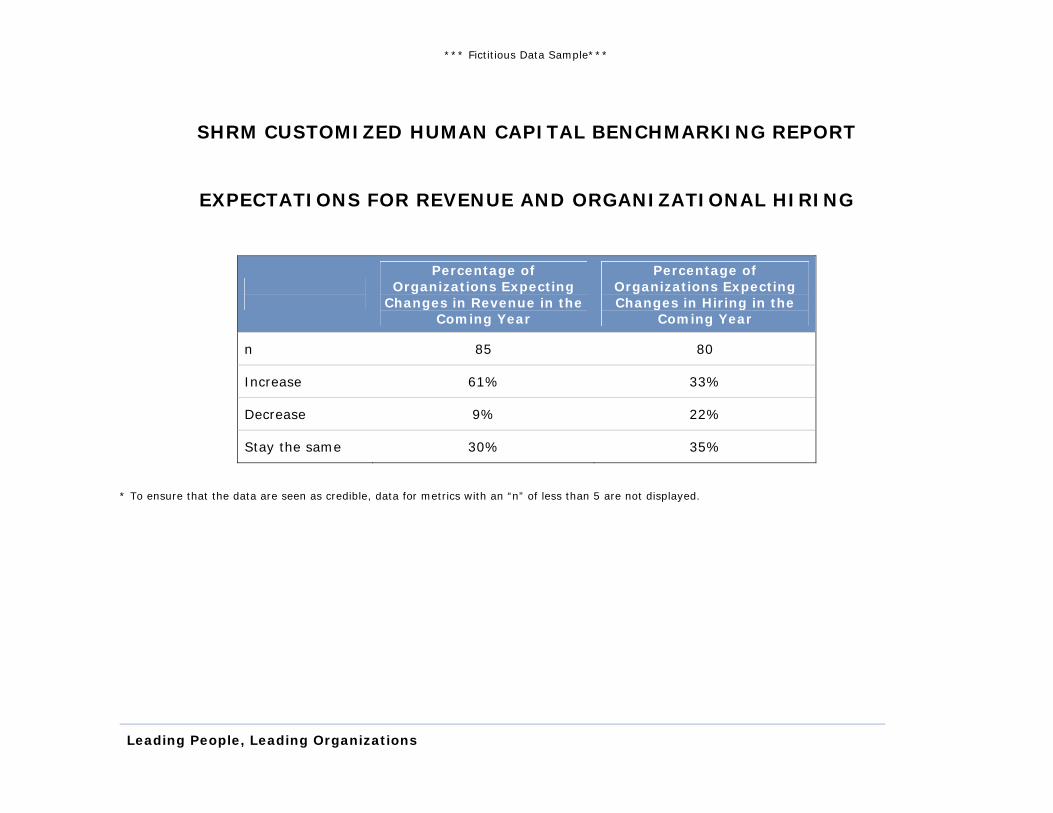
SHRM CUSTOMIZED HUMAN CAPITAL BENCHMARKING REPORT
EXPECTATIONS FOR REVENUE AND ORGANIZATIONAL HIRING
Percentage of Organizations Expecting
Changes in Revenue in the Coming Year
Percentage of Organizations Expecting Changes in Hiring in the
Coming Year
n 85 80
Increase 61% 33%
Decrease 9% 22%
Stay the same 30% 35%
* To ensure that the data are seen as credible, data for metrics with an “n” of less than 5 are not displayed.
*** Fictitious Data Sample***
Leading People, Leading Organizations
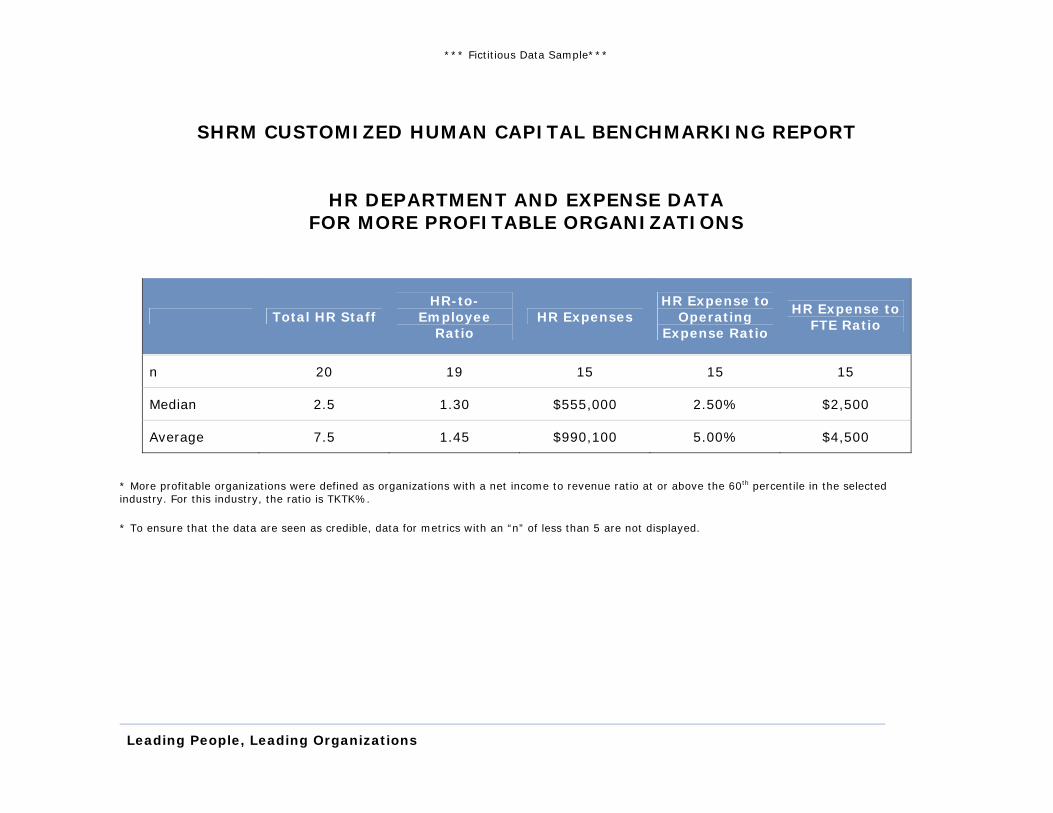
SHRM CUSTOMIZED HUMAN CAPITAL BENCHMARKING REPORT
HR DEPARTMENT AND EXPENSE DATA FOR MORE PROFITABLE ORGANIZATIONS
Total HR Staff HR-to-
Employee Ratio
HR Expenses HR Expense to
Operating Expense Ratio
HR Expense to FTE Ratio
n 20 19 15 15 15
Median 2.5 1.30 $555,000 2.50% $2,500
Average 7.5 1.45 $990,100 5.00% $4,500
* More profitable organizations were defined as organizations with a net income to revenue ratio at or above the 60th percentile in the selected industry. For this industry, the ratio is TKTK%. * To ensure that the data are seen as credible, data for metrics with an “n” of less than 5 are not displayed.

*** Fictitious Data Sample***
Leading People, Leading Organizations
SHRM CUSTOMIZED HUMAN CAPITAL BENCHMARKING REPORT
COMPENSATION DATA FOR MORE PROFITABLE ORGANIZATIONS
Annual Salary
Increase for the Coming Year
Target Bonus Percentage for Non-Executives
Target Bonus Percentage for
Executives
n 10 10 12
Median 3.0% 3.0% 15.0%
Average 3.7% 4.0% 12.0%
* More profitable organizations were defined as organizations with a net income to revenue ratio at or above the 60th percentile in the selected industry. For this industry, the ratio is TKTK%. * To ensure that the data are seen as credible, data for metrics with an “n” of less than 5 are not displayed.
*** Fictitious Data Sample***
Leading People, Leading Organizations
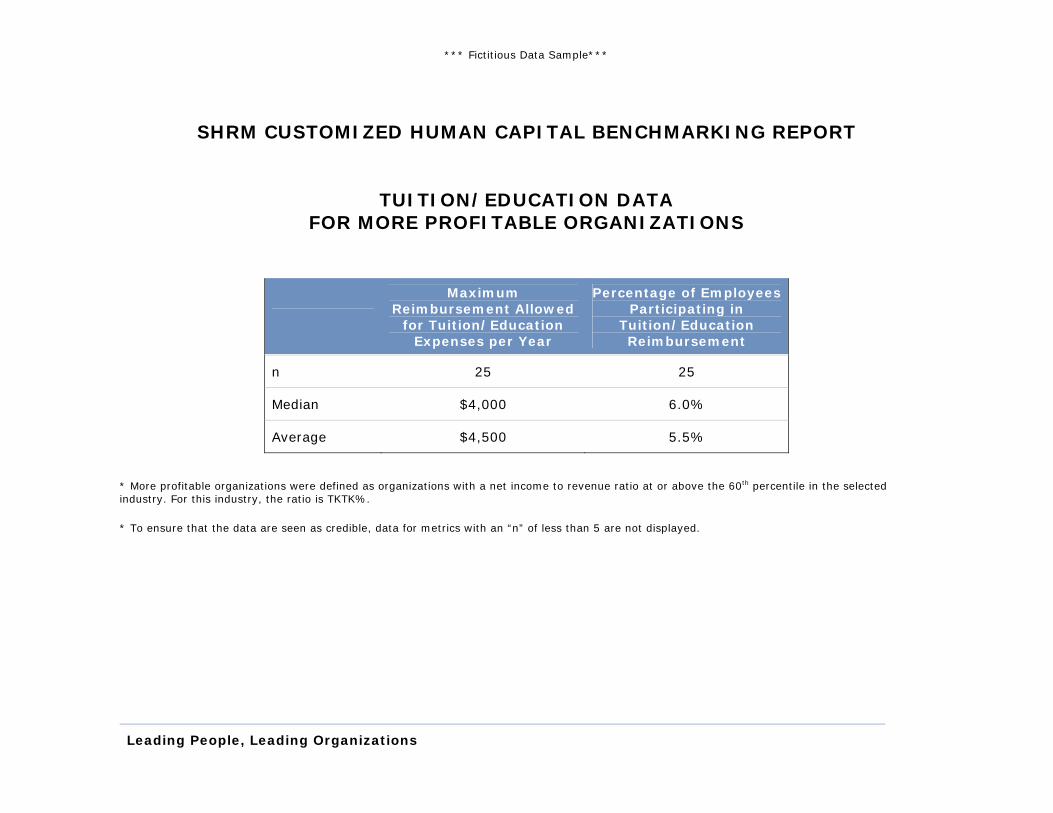
SHRM CUSTOMIZED HUMAN CAPITAL BENCHMARKING REPORT
TUITION/EDUCATION DATA FOR MORE PROFITABLE ORGANIZATIONS
Maximum Reimbursement Allowed
for Tuition/Education Expenses per Year
Percentage of Employees Participating in
Tuition/Education Reimbursement
n 25 25
Median $4,000 6.0%
Average $4,500 5.5%
* More profitable organizations were defined as organizations with a net income to revenue ratio at or above the 60th percentile in the selected industry. For this industry, the ratio is TKTK%. * To ensure that the data are seen as credible, data for metrics with an “n” of less than 5 are not displayed.
*** Fictitious Data Sample***
Leading People, Leading Organizations
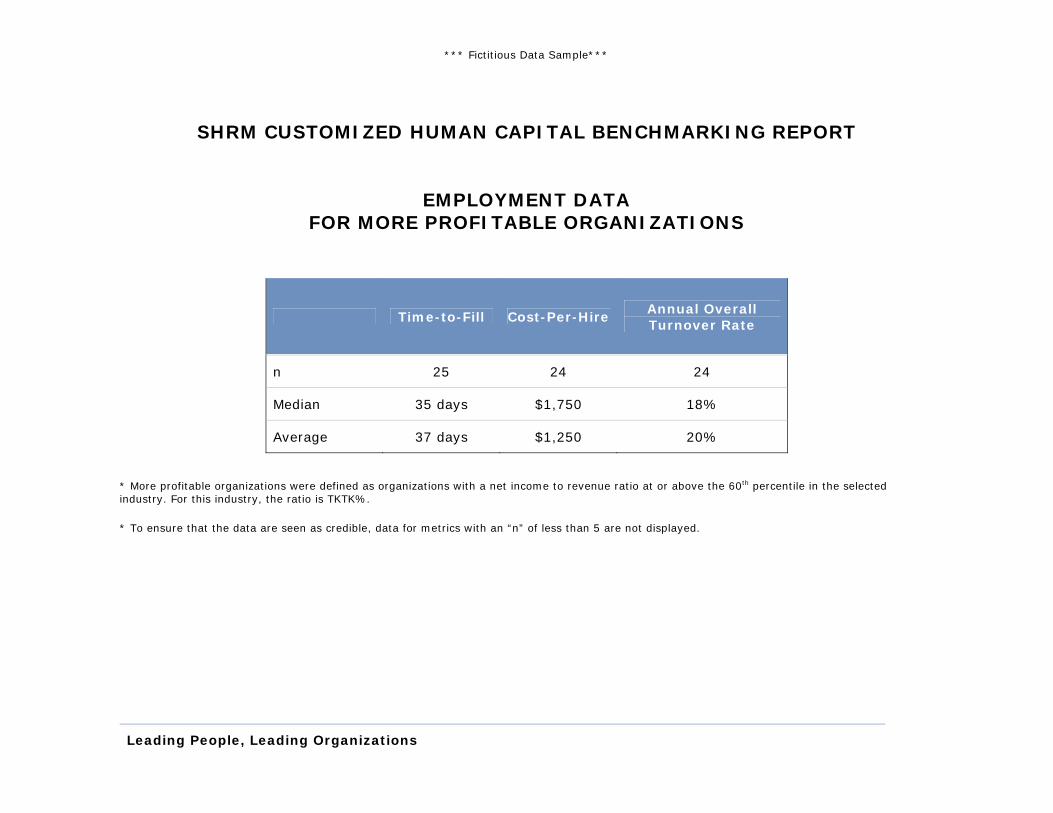
SHRM CUSTOMIZED HUMAN CAPITAL BENCHMARKING REPORT
EMPLOYMENT DATA FOR MORE PROFITABLE ORGANIZATIONS
Time-to-Fill Cost-Per-Hire Annual Overall Turnover Rate
n 25 24 24
Median 35 days $1,750 18%
Average 37 days $1,250 20%
* More profitable organizations were defined as organizations with a net income to revenue ratio at or above the 60th percentile in the selected industry. For this industry, the ratio is TKTK%. * To ensure that the data are seen as credible, data for metrics with an “n” of less than 5 are not displayed.

*** Fictitious Data Sample***
Leading People, Leading Organizations
NOTES AND COMMENTS