Should I Outsource Infrastructure? · Rackspace Should I Outsource Infrastructure? 3 TOTAL COST OF...
35
Should I Outsource Infrastructure? AN INSIGHTFUL TCO ANALYSIS OF ON-PREMISE VS. OUTSOURCED WORKLOADS Introduction 2 Overview of Infrastructure Economics 2 Total Cost of Ownership 3 Modeling ABC Company’s Infrastructure TCO 3 TCO Summary 4 CapEx Vs OpEx in the TCO Categories 5 Server Hardware 6 Server Software 7 Network Infrastructure 7 Storage 8 Backup Infrastructure 9 Power and Facilities 10 IT Labor Costs 11 System Administration Staff 11 Training and Turnover 12 Network Bandwidth 12 Indirect Costs 13 Estimating the TCO Differential from Outsourcing 14 Outsource, or Not? 15 Conclusion 17 About Rackspace 17 Appendices 18 Server Hardware 18 Server Software 20 Network Infrastructure 21 Storage 22 Backup 23 Power and Facilities 24 System Admin Labor 26 IT Training Costs 27 Staff Turnover Costs 28 Network Bandwidth Costs 28 Indirect Business Costs 29 Notes 35 CONTENTS
Transcript of Should I Outsource Infrastructure? · Rackspace Should I Outsource Infrastructure? 3 TOTAL COST OF...

Should I Outsource Infrastructure? AN INSIGHTFUL TCO ANALYSIS OF ON-PREMISE
VS. OUTSOURCED WORKLOADS
Introduction . . . . . . . . . . . . . . . . . . . . 2
Overview of Infrastructure Economics . . . . . . 2
Total Cost of Ownership . . . . . . . . . . . . . . 3 Modeling ABC Company’s Infrastructure TCO . . . . . . . . . . . . . . . . . . . . . . . . 3 TCO Summary . . . . . . . . . . . . . . . . . . 4
CapEx Vs . OpEx in the TCO Categories . . . . . 5 Server Hardware . . . . . . . . . . . . . . . . 6 Server Software . . . . . . . . . . . . . . . . . 7 Network Infrastructure . . . . . . . . . . . . . 7 Storage . . . . . . . . . . . . . . . . . . . . . . 8 Backup Infrastructure . . . . . . . . . . . . . . 9 Power and Facilities . . . . . . . . . . . . . .10 IT Labor Costs . . . . . . . . . . . . . . . . . . 11 System Administration Staff . . . . . . . . 11 Training and Turnover . . . . . . . . . . . . 12 Network Bandwidth . . . . . . . . . . . . . . 12
Indirect Costs . . . . . . . . . . . . . . . . . . . . 13
Estimating the TCO Differential from Outsourcing . . . . . . . . . . . . . . . . . . . . 14
Outsource, or Not? . . . . . . . . . . . . . . . . . 15
Conclusion . . . . . . . . . . . . . . . . . . . . . 17
About Rackspace . . . . . . . . . . . . . . . . . 17
Appendices . . . . . . . . . . . . . . . . . . . . . 18 Server Hardware . . . . . . . . . . . . . . . . 18 Server Software . . . . . . . . . . . . . . . . 20 Network Infrastructure . . . . . . . . . . . . . 21 Storage . . . . . . . . . . . . . . . . . . . . . 22 Backup . . . . . . . . . . . . . . . . . . . . . 23 Power and Facilities . . . . . . . . . . . . . 24 System Admin Labor . . . . . . . . . . . . . 26 IT Training Costs . . . . . . . . . . . . . . . 27 Staff Turnover Costs . . . . . . . . . . . . . 28 Network Bandwidth Costs . . . . . . . . . . 28 Indirect Business Costs . . . . . . . . . . . . 29
Notes . . . . . . . . . . . . . . . . . . . . . . . 35
CONTENTS

2 Rackspace | Should I Outsource Infrastructure?
INTRODUCTION
The question, “Should I outsource?” is probably one of
the oldest inquiries ever made in the history of the IT
profession . Today, though, the question of outsourcing
has evolved dramatically, especially for infrastructure . In
addition to basic colo, there are hosted private clouds,
public clouds, and hybrids . Plus, there are even new ways
for IT to function as an organization . IT can be a service
broker for business units, a clearinghouse for information,
and so forth .
The fundamental questions about outsourcing, however,
have never changed: Will this make business sense?
What are the investments, expenses, and payoffs? This
paper addresses these most important and basic issues .
Based on a Total Cost of Ownership (TCO) modeling
methodology built from our extensive experience working
with IT organizations of all sizes, the paper shows how
you can make a detailed, informed assessment of the
financial side of the outsourcing decision .
OVERVIEW OF INFRASTRUCTURE ECONOMICS
Not all dollars are equal . When calculating the costs of
building and maintaining IT infrastructure, a business
will view a dollar spent on a capital expenditure (CapEx)
quite differently from a dollar spent on operating the
infrastructure (OpEx) . CapEx and OpEx are subject to
different accounting rules and they reflect different values
Should I Outsource Infrastructure?AN INSIGHTFUL TCO ANALYSIS OF ON-PREMISE VS.
OUTSOURCED WORKLOADS
to the business . CapEx spent on equipment and software is
an asset, carried on a company’s balance sheet . OpEx hits
the income statement and affects earnings .
What does this have to do with managing IT infrastructure?
A lot, actually . Both CapEx and OpEx figures, which play
prominently in any IT manager’s efforts to budget for
infrastructure, serve to answer the most basic question that
is on the lips of every shareholder: “What is the company
doing with my money?”
The CEO is responsible for answering that essential
shareholder question . His or her perspective on IT
infrastructure expense should also inform the IT manager’s
thinking about the issue . The IT manager is entrusted
with the IT department’s portion of the shareholder’s
money . Regarding CapEx, the CEO wants to know, “Is
this infrastructure asset the best possible use of the
shareholder’s money?” Could it be better invested in some
sort of strategic asset, such as a research laboratory or a
cutting edge manufacturing plant? The CEO also regards
OpEx with suspicion because a dollar saved in OpEx is
worth many times that amount in entity valuation . If a
stock is trading at 10 times earnings, for instance, a dollar
saved on OpEx is actually worth $10 to the shareholders,
a group that invariably includes the CEO . This formula
applies for both public and private companies .

3 Rackspace | Should I Outsource Infrastructure?
TOTAL COST OF OWNERSHIP
Outsourcing infrastructure can be, in many cases, a preferable alternative
to building and running IT infrastructure in-house . It is not always the best
alternative, for many reasons, but on a purely financial basis, it typically
compares favorably . To understand the financial impact of outsourcing, it is
first necessary to understand what one’s infrastructure truly costs to build and
run . There may be hidden or indirect costs to consider in addition to expenses
that are well understood . You need to know the Total Cost of Ownership (TCO)
for your IT assets .
TCO is a critical, but somewhat subjective number . To make an informed
decision about outsourcing infrastructure, it’s absolutely essential to
understand the complete costs of maintaining infrastructure in-house .
However, approaches to estimating TCO vary from one organization to another .
In general, though, the more thorough the analysis and comprehensive
the estimate, the more valuable the TCO figure will be for making the right
business decision . Rackspace® has adopted the Alinean® TCO methodology .
The Alinean methodology, and ones like it, are effective because they take
into account the broadest range of potential costs and model them based on
realistic assumptions . Alinean separates TCO into three basic cost categories:
• Capital Costs (CapEx) – defined as new purchases of hardware and software
• Operating Expenses (OpEx) – including hardware and software support
costs, personnel, and related services
• Indirect Business Costs – including the impact of downtime on productivity,
the increase of business agility, and so forth
MODELING ABC COMPANY’S INFRASTRUCTURE TCO
To make the TCO analysis useful and easy to understand, we will apply
the Alinean methodology to ABC Company, a hypothetical infrastructure .
ABC Company should look familiar to you if you are involved in managing
infrastructure at a mid-to-large sized enterprise . ABC is a financial services
company that runs a critical, web-based business application on the Microsoft®
Windows Server® platform . The application uses Microsoft SQL Server® for
its database component . ABC Company uses VMware vSphere® software
to virtualize the dedicated servers . The application requires the following
infrastructure elements:
Servers• 10 servers with 2 x hex-core processors and 256GB of RAM – running
Windows Server using SQL Server Enterprise database (not virtualized by
VMware vSphere)

4 Rackspace | Should I Outsource Infrastructure?
• 25 servers with 4 x octa-core processors and 256GB of RAM – virtualized by
VMware vSphere and running Windows as the guest operating system
• 3 servers with 1 x hex-core processor and 32GB of RAM – virtualized by
VMware and running Windows with database to support multiple VMs for
Microsoft Exchange
Network Equipment• 2 Cisco® ASA 5555-X Series Next-Generation Firewalls
• 1 Imperva® SecureSphere® Web Application Firewall (WAF)
• 2 F5® BIG-IP® 3600 Load Balancer
• 1 Intrusion Detection (IDS)
Storage• 100TB of EMC® VNX5700 storage
• 250TB of EMC Isilon® NL400 storage
TCO SUMMARY
The table below shows the final output of the Alinean TCO analysis on ABC
Company’s infrastructure . In this three-year view, the TCO will be $11,627,439 to
host the infrastructure in-house . Of this, $4 .9 million is CapEx while $5 .6 million
is OpEx and just over $1 million is indirect cost . We will now explore how we
arrived at these numbers in depth .
SELF-MANAGED ANNUAL COST DETAILS
YEAR 1 YEAR 2 YEAR 3 TOTAL
CAPITAL COSTS (CAPEX)
Current server hardware costs $646,380 $115,920 $120,960 $883,260
Server software license costs $1,241,225 $124,123 $136,535 $1,501,882
Network infrastructure costs $73,401 $7,340 $8,074 $88,815
Storage costs $1,773,300 $301,461 $307,490 $2,382,251
Backup infrastructure costs $64,200 $11,800 $11,800 $87,800
Total Annual Capital Costs $3,798,506 $560,644 $584,859 $4,944,009
TABLE 1: 3 YEAR TCO SUMMARY FOR ABC COMPANY’S INFRASTRUCTURE, BASED ON THE ALINEAN METHODOLOGY

5 Rackspace | Should I Outsource Infrastructure?
SELF-MANAGED ANNUAL COST DETAILS
YEAR 1 YEAR 2 YEAR 3 TOTAL
OPERATING EXPENSES (OPEX)
Current server hardware support costs $65,835 $72,765 $79,695 $218,295
Software support costs $310,306 $341,337 $375,471 $1,027,114
Network infrastructure support costs $5,872 $ 6,459 $7,105 $19,437
Storage warranty costs $169,620 $198,455 $227,868 $595,943
Data center power and facilities cost $433,958 $433,958 $433,958 $1,301,873
Current system admin labor costs $693,241 $720,970 $749,809 $2,164,020
IT training costs $42,420 $42,420 $42,420 $127,260
IT staff turnover costs $20,224 $20,224 $20,224 $60,671
Network bandwidth costs $36,000 $36,000 $36,000 $108,000
Total Annual Operating Expenses $1,777,475 $1,872,588 $1,972,549 $5,622,612
INDIRECT BUSINESS COSTS
Indirect Cost Realization Factor 20%
Unplanned downtime - productivity
impact
$91,097 $91,097 $91,097 $273,291
Planning downtime - productivity
impact
$121,324 $121,324 $121,324 $363,972
Business agility - productivity impact $46,849 $46,849 $46,849 $140,548
Unplanned downtime - business costs $30,091 $30,091 $30,091 $90,272
Planning downtime - business costs $32,060 $32,060 $32,060 $96,180
Business agility - revenue impact $32,185 $32,185 $32,185 $96,556
Total Annual Business Costs $353,606 $353,606 $353,606 $1,060,819
Total $5,929,588 $2,786,838 $2,911,014 $11,627,439
CAPEX VS. OPEX IN THE TCO CATEGORIES
Some of the Alinean TCO categories are purely operational, affecting only
OpEx . For example, IT staff salaries are an expense . There is no direct capital
investment required to hire people, if you exclude office facilities and the like .
Other categories will break out into both a CapEx and OpEx figure . Server
hardware, server software, network infrastructure, storage, backup, and power
and facilities all contain CapEx and OpEx expenditures . This split occurs
because in each of these categories, the purchase of the hardware or software

6 Rackspace | Should I Outsource Infrastructure?
asset invariably triggers a related, recurring maintenance charge . Typically, the
numbers are in proportion . The higher the asset price, the higher the support
fee will be . Software maintenance is usually around 25% of the license cost
each year, and so on .
Server Hardware Server hardware costs depend on processor speeds, memory, on-board
storage, and other factors . The Server Hardware Appendix shows the pricing
and feature detail for the servers acquired by ABC Company in this exercise .
The five-year server hardware cost projection shown in Table 2 reflects the
assumptions that ABC Company will add servers at a growth rate of 10% a
year . In year 1, the company must buy 38 servers, for a CapEx expenditure
of $598,500 . In years 2 and 3, they buy 4 more servers per year, followed by
purchases of 5 servers per year in years 4 and 5 . By year 5, ABC Company has
51 servers . Given an assumption of a 36-month replacement cycle for server
hardware, the company must purchase 38 replacement machines in year 4 .
Spare parts are estimated at 8% of purchase cost, an expenditure that starts at
$47,880 in year 1 and grows in proportion to the installed base of servers . Total
CapEx for server hardware is $646,380 in year 1 . CapEx drops in years 2 and 3,
but rises again to $741,510 in year 4 as adding servers for growth and replacing
aging servers requires a substantial capital outlay .
OpEx for server hardware is based on server maintenance costs . Service
contracts, priced at 11% of purchase price, generate an annual OpEx
expenditure that starts at $65,835 in year 1 and grows to $97,020 in year 5 .
Total costs for server hardware, including CapEx and OpEx, are $1,101,555 for
the first three years and $2,240,753 for the five-year projection .
ANNUAL SERVER HARDWARE COSTS
YEAR 1 YEAR 2 YEAR 3 YEAR 4 YEAR 5
Number of servers (beginning of year) 0 38 42 46 51
Servers added for growth 38 4 4 5 5
Servers purchased for replacement 0 0 0 38 4
Average purchase price per new server $15,750 $15,750 $15,750 $15,750 $15,750
Annual server purchase costs $598,500 $63,000 $63,000 $677,250 $141,750
Annual costs for server spare and
replacement parts
$47,880 $52,920 $57,960 $64,260 $70,560
Annual server hardware costs (CapEx) $646,380 $115,920 $120,960 $741,510 $212,310
Annual server hardware maintenance
costs (OpEx)
$65,835 $72,765 $79,695 $88,358 $97,020
Total server hardware costs $712,215 $188,685 $200,655 $829,868 $309,330
TABLE 2: ANNUAL SERVER HARDWARE COSTS

7 Rackspace | Should I Outsource Infrastructure?
SERVER SOFTWARE
To run its web application, ABC Company has to purchase server software,
including Windows Server operating system software, SQL Server database
software, and VMware vSphere software . The details of the license counts
and fees are contained in the Server Software Appendix . Software is an asset .
Though you can’t touch it or see it, software code must be booked as an asset
on the corporate balance sheet as a capital expense and depreciated over time
just like a forklift or an air conditioner . Acquiring the software for this project
requires a CapEx of $1 .2 million in year 1 . As shown in Table 3, with a 10%
annual growth rate in the server install base, software CapEx continues in each
subsequent year, starting with $124,123 in year two and growing to $165,207 in
year five .
ANNUAL SERVER SOFTWARE COSTS
YEAR 1 YEAR 2 YEAR 3 YEAR 4 YEAR 5
Annual server software purchase costs
(CapEx)
$1,241,225 $124,123 $136,535 $150,188 $165,207
Annual server software support costs
(OpEx)
$310,306 $341,337 $375,471 $ 413,018 $454,319
Total server software costs $1,551,531 $465,459 $512,005 $ 563,206 $619,526
OpEx for server software is based on ongoing support, which is standard for
most enterprise software products . Calculated in this case at 25% of license
fees, server support costs total $310,306 in year one . With the growth in the
server install base, the server software OpEx grows to $454,319 by year five .
The three-year total cost for server software is $2,528,296 . The five-year total
is $ 3,711,728 .
NETWORK INFRASTRUCTURE
The network infrastructure required to connect the web application to all
users – internal and external – should be included in the TCO estimate . In the
scenario, the new web application will involve the purchase of new network
infrastructure equipment . This makes it relatively simple to estimate CapEx and
OpEx for the network infrastructure elements of the TCO .
Many companies, however, will already have a network infrastructure in place .
A new application will share that infrastructure with other systems already
running . Should the costs associated with that network be applied to the TCO
for the new application? Yes, it should . This may contradict what is generally
known as the “sunk cost” theory of TCO . In this approach, if the system in
question has already been paid for, then the cost is “sunk” and should not be
considered relevant to any future investments . There may be some financial
and accounting merit to this argument, but the best practice is to include the
TABLE 3: ANNUAL SERVER SOFTWARE COSTS

8 Rackspace | Should I Outsource Infrastructure?
costs of any IT asset that is employed for a particular use case . The basic rule
of the Alinean TCO methodology is that the cost of a shared infrastructure
asset should be applied proportionally to the TCO of a proposed use case .
ABC Company’s new web application needs firewalls, load balancers, network
switches, and an intrusion detection system (IDS .) The specific models and
their costs are detailed in the Network Infrastructure Appendix . The initial
CapEx outlay for network infrastructure hardware is $73,401, as shown in
Table 4 . As the server install base grows, additional CapEx continues in each
subsequent year, starting at $7,340 in year two and growing to $9,770 in
year five . OpEx is based on ongoing maintenance costs and service contracts
estimated at 8% of hardware purchase cost . OpEx for network infrastructure
grows from $5,872 in year one to $8,597 in year five . The three-year TCO for
network infrastructure is $108,252 . By the fifth year, the total cost of network
infrastructure will be $143,316 .
ANNUAL NETWORK INFRASTRUCTURE COSTS
YEAR 1 YEAR 2 YEAR 3 YEAR 4 YEAR 5
Annual network equipment purchase
costs (CapEx)
$73,401 $7,340 $8,074 $8,882 $9,770
Annual network equipment
maintenance costs (OpEx)
$5,872 $6,459 $7,105 $7,816 $8,597
Total network infrastructure costs $79,273 $13,799 $15,179 $16,697 $18,367
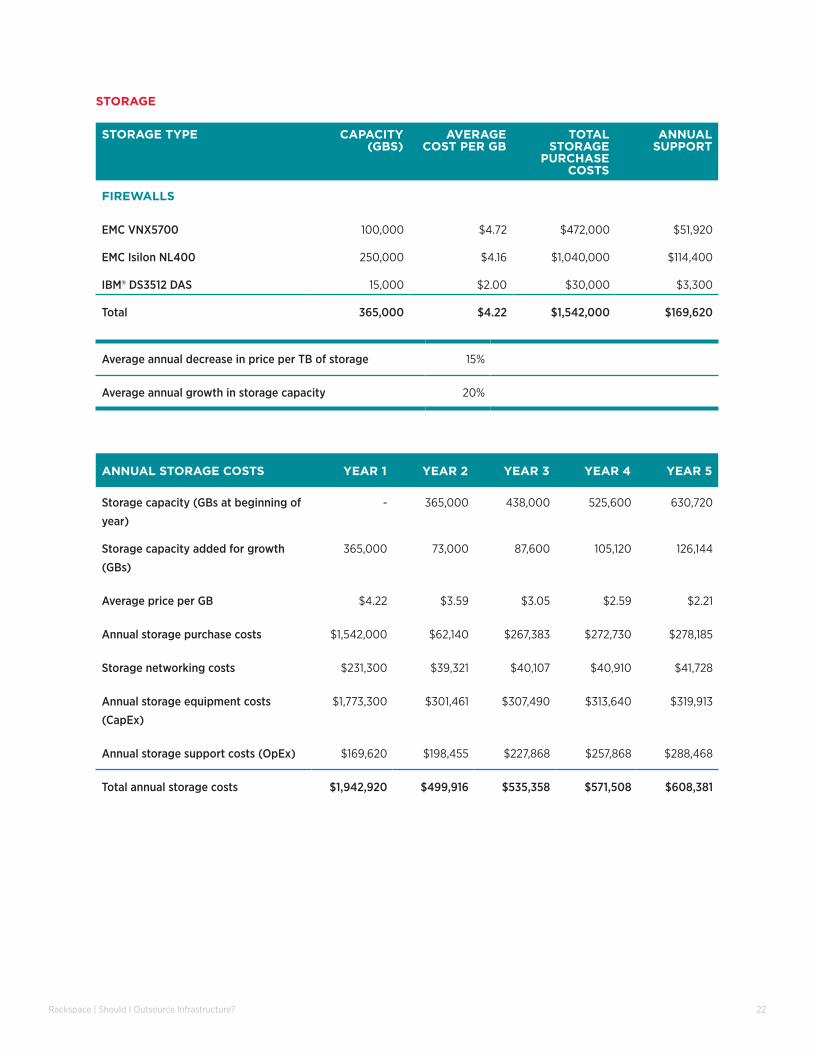
STORAGE
ABC Company’s web application needs storage, just like any business system .
Based on requirements, ABC’s IT managers figure they can use three different
types of storage hardware: 100,000 GB on an EMC VNX5700 array, 250,000
GB on an EMC Isilon NL400, and 15,000 GB on DAS . The Storage Appendix
contains the cost details . The interesting thing about storage as a TCO item is
that while storage needs invariably rise over time, the cost per GB for hardware
typically falls year by year . In this case, ABC Company is able to project that it
will need to add 73,000 GB in year two, 87,600 GB in year three, and so forth .
Cost per GB for hardware is projected to decrease from an average of $4 .22/
GB in year one to $2 .21 in year five – a 50% drop! With storage networking
costs, calculated at 15% of storage hardware purchase price, the total CapEx
for storage is $1 .7 million in year one, with supplemental storage purchases
totaling over $300,000 per year for the next four years . Storage OpEx,
estimated as an 11% support fee for the storage hardware, grows from $169,620
in year one to $288,468 in year five . The three-year TCO for storage is $2 .9
million . The five-year TCO is $4 .1 million .
TABLE 4: ANNUAL NETWORK INFRASTRUCTURE COSTS

9 Rackspace | Should I Outsource Infrastructure?
ANNUAL STORAGE COSTS YEAR 1 YEAR 2 YEAR 3 YEAR 4 YEAR 5
Storage capacity - 365,000 438,000 525,600 630,720
Storage capacity added for growth
(GBs)
365,000 73,000 87,600 105,120 126,144
Average price per GB $4 .22 $3 .59 $3 .05 $2 .59 $2 .21
Annual storage purchase costs $1,542,000 $262,140 $267,383 $272,730 $278,185
Storage networking costs $231,300 $39,321 $40,107 $40,910 $41,728
Annual storage equipment costs
(CapEx)
$1,773,300 $301,461 $307,490 $313,640 $319,913
Annual storage support costs (OpEx) $169,620 $198,455 $227,868 $257,868 $288,468
Total annual storage costs $1,942,920 $499,916 $535,358 $571,508 $608,381
BACKUP INFRASTRUCTURE
Backup is another TCO element that often gets lumped into “sunk costs .” Yet,
it should definitely be factored into TCO, even if the actual dollar amounts are
relatively low . If anything, backup should be included for two reasons beyond
the basic costs involved . At one level, backup is a repetitive administrative
task . It also appears in the IT staff section of the TCO analysis . However, routine
as backup might be, it’s actually very important while being prone to error –
errors that can be extremely costly if they are not noticed .
ANNUAL BACKUP COSTS YEAR 1 YEAR 2 YEAR 3 YEAR 4 YEAR 5
Backup equipment costs (tape drives) $20,000
Backup software licenses $2,000
Annual backup software support costs $400 $400 $400 $400 $400
Annual tape media costs $30,400
Annual off-site tape storage costs $11,400 $11,400 $11,400 $11,400 $11,400
Total annual backup infrastructure costs $64,200 $11,800 $11,800 $11,800 $11,800
Table 6 summarizes ABC Company’s backup TCO . As detailed in the Backup
Appendix, a single tape drive can accommodate 5 servers . With 38 servers
installed, ABC Company will need 8 tape drives, each costing $2,500 . Each
server requires its own backup software, with its own support fees . Tape
media, that needs to have 2 sets of tapes for each server, comes to $30,400 .
Backup has a three-year TCO of $87,800, of which $22,000 is CapEx . The five-
year TCO is $111,400 .
TABLE 6: ANNUAL BACKUP COSTS
TABLE 5: ANNUAL STORAGE COSTS

10 Rackspace | Should I Outsource Infrastructure?
POWER AND FACILITIES
The web application will need to be hosted in a physical data center facility .
The facility, and the hardware, will require electrical power to run and cool
itself . In this example, we’re going to assume that the data center already
exists . However, unlike a “sunk cost” that can be ignored in a TCO analysis, the
CapEx that went into building the data center in the past will be factored into
this analysis as a per-square-foot of floor space cost based on depreciation
of the data center asset . In this way, the already-constructed data center will
appear in the TCO as OpEx even though its construction was CapEx in an
earlier time period .
If a new data center were required for a system, then of course its cost would
have to be considered CapEx . Many companies today are building new data
centers to handle increases in computing load . It’s a costly proposition . A
15,000 square foot data center, which can hold about 460 racks1, will cost
between $4 .6 and $18 million2,3, for basic construction and infrastructure .
The Power & Facilities Appendix details how data center operating costs are
determined . There are two basic cost factors: floor space and power . Floor
space costs are derived from a combination of building operating overhead
and depreciation of the facility construction costs . For instance, if a 15,000
square foot data center costs $10 million to build, and was depreciated over 15
years, which is an industry norm4, the depreciation charge for data center floor
space would be $44 per square foot per year . The Alinean model costs data
center floor space at $62 per square foot per year, which adds overhead such
as insurance, maintenance, and so forth, to the base depreciation figure .
How much floor space should be assigned to ABC Company’s new web
application? Based on the size of the hardware required, the analysis shows
that the system will use 190 Us of rack space . A U is 1 .75” high . Most servers are
1, 2 or 4Us in height . There are 42 Us in a standard 19” wide data center rack .
For practical purposes, this analysis assumes that there are 40 usable Us in a
rack . Each rack requires 20 square feet of floor space . The web application,
with 190 Us, requires 5 racks, for a total of 100 square feet of floor space .
As Table 7 shows, this results in an annual floor space charge of $6,200 for
hosting the racks for the web application in house .
ANNUAL DATA CENTER FACILITIES COSTS
YEAR 1 YEAR 2 YEAR 3 YEAR 4 YEAR 5
Annual costs for data center floor space $6,200 $6,200 $6,200 $6,200 $6,200
Annual data center energy costs $90,235 $90,235 $90,235 $90,235 $90,235
Data center addition cost factor 4 .5 4 .5 4 .5 4 .5 4 .5
Annual data center facilities costs $433,958 $433,958 $433,958 $433,958 $433,958
TABLE 7: ANNUAL DATA CENTER FACILITIES AND POWER COSTS
11 Rackspace | Should I Outsource Infrastructure?
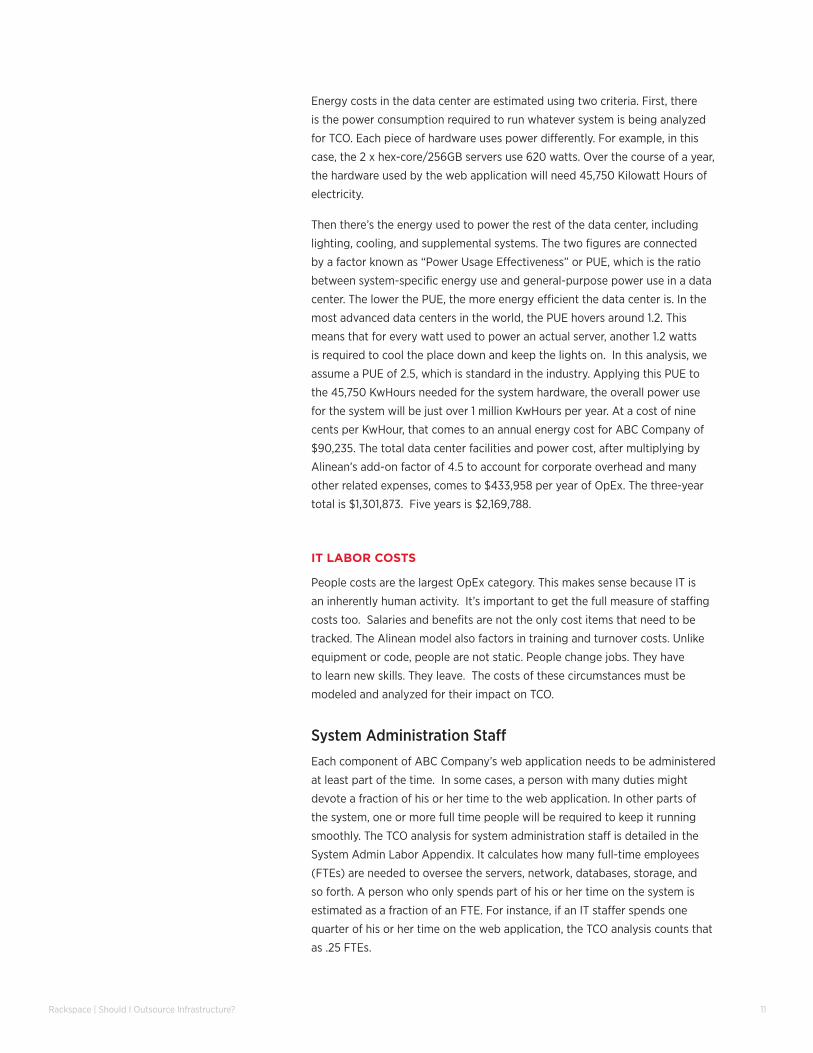
Energy costs in the data center are estimated using two criteria . First, there
is the power consumption required to run whatever system is being analyzed
for TCO . Each piece of hardware uses power differently . For example, in this
case, the 2 x hex-core/256GB servers use 620 watts . Over the course of a year,
the hardware used by the web application will need 45,750 Kilowatt Hours of
electricity .
Then there’s the energy used to power the rest of the data center, including
lighting, cooling, and supplemental systems . The two figures are connected
by a factor known as “Power Usage Effectiveness” or PUE, which is the ratio
between system-specific energy use and general-purpose power use in a data
center . The lower the PUE, the more energy efficient the data center is . In the
most advanced data centers in the world, the PUE hovers around 1 .2 . This
means that for every watt used to power an actual server, another 1 .2 watts
is required to cool the place down and keep the lights on . In this analysis, we
assume a PUE of 2 .5, which is standard in the industry . Applying this PUE to
the 45,750 KwHours needed for the system hardware, the overall power use
for the system will be just over 1 million KwHours per year . At a cost of nine
cents per KwHour, that comes to an annual energy cost for ABC Company of
$90,235 . The total data center facilities and power cost, after multiplying by
Alinean’s add-on factor of 4 .5 to account for corporate overhead and many
other related expenses, comes to $433,958 per year of OpEx . The three-year
total is $1,301,873 . Five years is $2,169,788 .
IT LABOR COSTS
People costs are the largest OpEx category . This makes sense because IT is
an inherently human activity . It’s important to get the full measure of staffing
costs too . Salaries and benefits are not the only cost items that need to be
tracked . The Alinean model also factors in training and turnover costs . Unlike
equipment or code, people are not static . People change jobs . They have
to learn new skills . They leave . The costs of these circumstances must be
modeled and analyzed for their impact on TCO .
System Administration StaffEach component of ABC Company’s web application needs to be administered
at least part of the time . In some cases, a person with many duties might
devote a fraction of his or her time to the web application . In other parts of
the system, one or more full time people will be required to keep it running
smoothly . The TCO analysis for system administration staff is detailed in the
System Admin Labor Appendix . It calculates how many full-time employees
(FTEs) are needed to oversee the servers, network, databases, storage, and
so forth . A person who only spends part of his or her time on the system is
estimated as a fraction of an FTE . For instance, if an IT staffer spends one
quarter of his or her time on the web application, the TCO analysis counts that
as .25 FTEs .

12 Rackspace | Should I Outsource Infrastructure?
IT LABOR COSTS YEAR 1 YEAR 2 YEAR 3 YEAR 4 YEAR 5
Average fully-burdened salary $110,741 $115,171 $119,778 $124,569 $129,552
System admin labor costs $693,241 $720,970 $749,809 $779,801 $810,993
System admin staff (FTEs) 6 .26 6 .26 6 .26 6 .26 6 .26
System administration efforts (hours) 11,268 11,268 11,268 11,268 11,268
Different administrator types earn different salaries . In this analysis, we
estimate that a server administrator earns $83,385 a year while a database
administrator earns $93,195 . These figures are based on standard industry
salaries from the Alinean TCO methodology . With taxes and benefits, the “fully
burdened” salary averages $110,741 per year . As shown in Table 8, with 6 .26
FTEs required for the web application, the system admin labor costs total
$693,241 in year one .
Training and TurnoverThe Alinean model assumes that IT staff members will receive either 40 or
80 hours per year for training, as detailed in the IT Training Costs Appendix .
At a rate of $3,500 per 40 hour training unit, the IT staff required to run ABC
Company’s web application will accrue training costs of $42,420 per year .
Table 9 summarizes the costs and hours involved .
YEAR 1 YEAR 2 YEAR 3 YEAR 4 YEAR 5
IT training costs $ 42,420 $ 42,420 $ 42,420 $ 42,420 $42,420
IT training hours 485 485 485 485 485
Staff turnover is estimated at 15% per year, which means that ABC Company
will be replacing .94 FTEs per year for its web application . Recruitment costs
run 20% of the fully-burdened salary, or $16,716 per year . Adding on-boarding
costs equivalent to three weeks’ salary, the total cost of IT staff turnover will be
$20,224 annually . A detailed look at these costs is found in the Staff Turnover
Costs Appendix .
YEAR 1 YEAR 2 YEAR 3 YEAR 4 YEAR 5
IT staff turnover costs $ 20,224 $ 20,224 $ 20,224 $ 20,224 $ 20,224
Network Bandwidth The web application will use a portion of ABC Company’s network bandwidth .
A pro-rata share of the bandwidth cost should be applied to OpEx . The
TABLE 10: ANNUAL IT STAFF TURNOVER COSTS
TABLE 9: ANNUAL IT TRAINING COSTS
TABLE 8: ANNUAL IT LABOR COSTS

13 Rackspace | Should I Outsource Infrastructure?
YEAR 1 YEAR 2 YEAR 3 YEAR 4 YEAR 5
Number of T-1 lines required 8 .00 8 .00 8 .00 8 .00 8 .00
Total annual network bandwidth costs $36,000 $36,000 $36,000 $36,000 $36,000
INDIRECT COSTS
TCO should include an estimate of indirect costs of hosting a system in-house .
Indirect costs include unplanned downtime, planned downtime, and business
agility . Each of these indirect cost categories has a real impact on a business’s
financial picture even if they can be somewhat challenging to measure .
Indirect costs estimation tends to be more subjective and assumption-based
than the clear-cut dollars and cents of the hardware/software/network types
of TCO elements . However, based on our experience, we’ve found that
outsourced hosting delivers better indirect cost performance, as detailed in the
Indirect Cost Appendix and summarized in Table 12 .
INDIRECT BUSINESS COSTS YEAR 1 YEAR 2 YEAR 3 YEAR 4 YEAR 5
CURRENT SELF-MANAGED COSTS
Unplanned downtime - productivity
impact
$455,485 $455,485 $455,485 $455,485 $455,485
Planned downtime - productivity impact $606,620 $606,620 $606,620 $606,620 $606,620
Business agility - productivity impact $234,247 $234,247 $234,247 $234,247 $234,247
Unplanned downtime - business costs
(Revenue opportunity cost)
$150,453 $150,453 $150,453 $150,453 $150,453
Planned downtime - business costs
(Revenue opportunity cost)
$160,300 $160,300 $160,300 $160,300 $160,300
Business agility - revenue impact (Lost
revenue opportunity)
$160,927 $160,927 $160,927 $160,927 $160,927
Total self-managed costs $1,768,032 $1,768,032 $1,768,032 $1,768,032 $1,768,032
Indirect benefit realization factor 20% 20% 20% 20% 20%
Total realized costs $353,606 $353,606 $353,606 $353,606 $353,606
Network Bandwidth Costs Appendix outlines how each server requires 350
Mbps of bandwidth . At that rate, ABC Company has to provision the equivalent
of 8 T-1 Lines, each with 1 .54 Mbps of bandwidth . Costing $375 per month,
these lines will add OpEx of $36,000 per year .
TABLE 12: INDIRECT BUSINESS COSTS
TABLE 11: ANNUAL NETWORK BANDWIDTH COSTS
14 Rackspace | Should I Outsource Infrastructure?
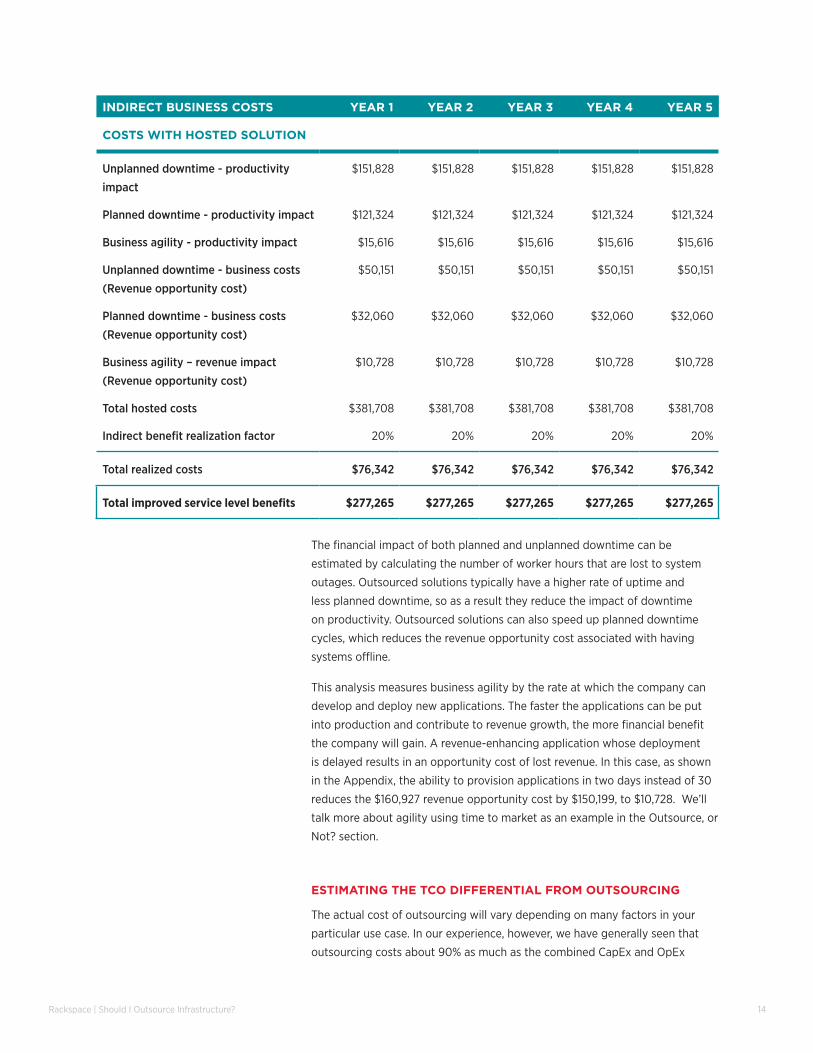
INDIRECT BUSINESS COSTS YEAR 1 YEAR 2 YEAR 3 YEAR 4 YEAR 5
COSTS WITH HOSTED SOLUTION
Unplanned downtime - productivity
impact
$151,828 $151,828 $151,828 $151,828 $151,828
Planned downtime - productivity impact $121,324 $121,324 $121,324 $121,324 $121,324
Business agility - productivity impact $15,616 $15,616 $15,616 $15,616 $15,616
Unplanned downtime - business costs
(Revenue opportunity cost)
$50,151 $50,151 $50,151 $50,151 $50,151
Planned downtime - business costs
(Revenue opportunity cost)
$32,060 $32,060 $32,060 $32,060 $32,060
Business agility – revenue impact
(Revenue opportunity cost)
$10,728 $10,728 $10,728 $10,728 $10,728
Total hosted costs $381,708 $381,708 $381,708 $381,708 $381,708
Indirect benefit realization factor 20% 20% 20% 20% 20%
Total realized costs $76,342 $76,342 $76,342 $76,342 $76,342
Total improved service level benefits $277,265 $277,265 $277,265 $277,265 $277,265
The financial impact of both planned and unplanned downtime can be
estimated by calculating the number of worker hours that are lost to system
outages . Outsourced solutions typically have a higher rate of uptime and
less planned downtime, so as a result they reduce the impact of downtime
on productivity . Outsourced solutions can also speed up planned downtime
cycles, which reduces the revenue opportunity cost associated with having
systems offline .
This analysis measures business agility by the rate at which the company can
develop and deploy new applications . The faster the applications can be put
into production and contribute to revenue growth, the more financial benefit
the company will gain . A revenue-enhancing application whose deployment
is delayed results in an opportunity cost of lost revenue . In this case, as shown
in the Appendix, the ability to provision applications in two days instead of 30
reduces the $160,927 revenue opportunity cost by $150,199, to $10,728 . We’ll
talk more about agility using time to market as an example in the Outsource, or
Not? section .
ESTIMATING THE TCO DIFFERENTIAL FROM OUTSOURCING
The actual cost of outsourcing will vary depending on many factors in your
particular use case . In our experience, however, we have generally seen that
outsourcing costs about 90% as much as the combined CapEx and OpEx

15 Rackspace | Should I Outsource Infrastructure?
for a particular infrastructure project . The outsourcing cost is OpEx . Table 13
summarizes the five-year outlook for in-house vs . outsourced using this 90%
comparison metric .
YEAR 1 YEAR 2 YEAR 3 YEAR 4 YEAR 5 TOTAL
In-house $5,575,981 $2,433,232 $2,557,408 $3,305,481 $2,910,999 $16,783,100
Outsourced $3,169,986 $3,169,986 $3,169,986 $3,169,986 $3,169,986 $15,849,930
For ABC Company, as shown in Table 14, outsourcing might save $1 million
over the three-year time horizon and $1 .6 million over five years . For the sake
of simplicity, we have set aside indirect business costs, but they too, favor
outsourcing due to efficiencies of administration at the outsourcing provider .
The annual OpEx outlay will be higher with outsourcing, but ABC Company will
save $3 .8 million in CapEx in year one .
THREE YEAR FIVE YEAR
IN-HOUSE OUTSOURCED IN-HOUSE OUTSOURCED
CapEx $4,944,009 $ - $6,889,028
OpEx $5,622,612 $9,509,958 $9,894,072 $15,104,790
Total $10,566,620 $9,509,958 $16,783,100 $15,104,790
Savings from outsourcing $1,056,662 $1,678,310
Year 1 CapEx savings $3,798,506
OUTSOURCE, OR NOT?
Outsourcing TCO tends to be lower than that needed for hosting in-house . That
is an argument in favor of outsourcing, though not in every case . The decision
to outsource should relate to many distinct factors that affect how your
business operates . In practical terms, some workloads will be more suitable
for outsourcing than others . Most organizations start with a good outsourcing
candidate and then migrate more workloads as the IT staff becomes more
familiar with the process . Read the Choosing a Workload to Outsource white
paper for guidance on migrating workloads .
Financially, the savings on CapEx is a compelling argument in favor of
outsourcing . ABC Company’s $3 .8 million capital savings in year one is
significant and will be meaningful to the people responsible for managing
ABC Company’s assets on behalf of its shareholders . That is $3 .8 million that
could be used for other business investment purposes . There’s also a risk
TABLE 13: TOTAL CAPEX AND OPEX OF IN-HOUSE HOSTING VS. OUTSOURCING (90% OF CAPEX/OPEX) OVER 5 YEARS
TABLE 14: IN-HOUSE VS. OUTSOURCE FINANCIAL COMPARISON
16 Rackspace | Should I Outsource Infrastructure?
reduction benefit to offloading the capital investment to a third party . Not only
is there the high opportunity cost of putting down large capital outlays on
infrastructure, but the risks associated with those purchases are high as well . If
the infrastructure does not deliver the desired business results, the capital will
have been wasted or put to sub-optimal use . These kinds of problems show up
indirectly in financial results and share prices .
Another way to look at the benefit of CapEx savings is to estimate the cost
of that capital to the company . Capital comes at a cost to the business . Most
financial executives evaluate capital expenses based on a “cost of equity
capital” criteria to determine if an investment is worth making . Cost of capital
varies by industry, but the average, according to the accounting firm KPMG, is
9 .1%5 . That means that most companies will assume that any CapEx is costing
them 9 .1% a year, as if they were paying interest on a loan . For ABC Company,
the $3 .8 million CapEx for the web application would accrue a capital cost
charge of $345,664 per year on top of the other costs . The cost of capital
charge further widens the gap between in-house and outsourced hosting . If
ABC Company has to borrow money to invest in the infrastructure, it would
probably use the average cost of debt of 4 .5%, which is the current average of
high-grade corporate bonds6 . At that rate, the web application would need to
tack about $170,000 a year onto its TCO for interest expense .
Finally, it’s worth pointing out a number of intangible benefits that arise from
outsourcing . These intangibles are difficult to quantify in dollar terms, but they
are meaningful to the business in any event . Time to market is an example of
subjective, intangible benefit of outsourcing . The ability to provision IT systems
that support new business initiatives rapidly can bring strong strategic and
financial rewards to a business . The opposite is also true . If IT contributes to a
lag in the launch of a new product or service, then that will be detrimental to
the bottom line .
The “asset value” of the IT staff is an intangible aspect of the outsourcing
question . While staffing is OpEx, it is also a useful exercise to think about IT
staff as an asset of the business . This goes beyond HR talk about “people
are an asset” and so forth – it’s about understanding that IT salaries are an
investment in the business . Like any investment, they can be analyzed for their
rates of return . What is the investment in IT salaries yielding for the business?
Is the investment being used to “keep the lights on,” as is the case with many
IT departments? Or, is the investment yielding valuable, strategic returns for
the business?
Capacity planning is another serious intangible factor to assess when making
the outsourcing decision . In today’s IT world, where new form factors, such as
tablets and mobile devices, can cause rapid, unpredictable growth in compute
demand, the ability to outsource capacity takes a lot of pressure off of IT
capacity planners . If your data center is already reaching its capacity, it can be
a major challenge to figure out how much new on-premise capacity you will

17 Rackspace | Should I Outsource Infrastructure?
need over the next few years . Given the high costs of data center construction,
having an outsource option can be a big advantage .
CONCLUSION
Making the decision to outsource infrastructure can be complex and
challenging . However, it can be a clear and informative process . With
an accurate TCO analysis, which Rackspace can provide you through its
customized Alinean methodology, you will be able to make the decision using
numbers that are true and relevant to your specific company situation . As this
paper has shown, the best outsourcing decisions arise from gaining a deep,
thorough understanding of your actual costs of running infrastructure in-house .
An appreciation for the differences between the CapEx and OpEx sides of
the TCO figure will also drive discussion about the best use of capital . The IT
manager is responsible for delivering the best possible return on IT assets to
shareholders . The approach to TCO analysis in this paper is designed to give
you the tools you need to become a great manager of the shareholders’ IT
assets that are under your control .
As one of the largest VMware Service Provider Program (VSPP) partners,
Rackspace has expert VMware Certified Professionals available and experience
that comes with managing over 45,000 VMs . For information about how
Rackspace can conduct the type of TCO analysis depicted in this paper,
please visit http://www .rackspace .com/enterprise-cloud-solutions/advisory-
services/#tco-workshop .
ABOUT RACKSPACE
Rackspace® (NYSE: RAX) is the global leader in hybrid cloud and founder of
OpenStack®, the open-source operating system for the cloud . Hundreds of
thousands of customers look to Rackspace to deliver the best-fit infrastructure
for their IT needs, leveraging a product portfolio that allows workloads to
run where they perform best—whether on the public cloud, private cloud,
dedicated servers, or a combination of platforms . The company’s award-
winning Fanatical Support® helps customers successfully architect, deploy
and run their most critical applications . Headquartered in San Antonio, TX,
Rackspace operates data centers on four continents Rackspace is featured on
Fortune’s list of 100 Best Companies to Work For .
For more information, visit www.Rackspace.com.

18 Rackspace | Should I Outsource Infrastructure?
AppendicesSERVER HARDWARE
SERVER TYPE UNITS AVERAGE COST PER
SERVER
TOTAL NEW SERVER
PURCHASE COSTS
ANNUAL HARDWARE
MAINTE-NANCE
HARDWARE MAINTE-
NANCE AS % OF HARD-
WARE COSTS
2 x hex-core processors and
256GB of RAM
10 $8,500 $85,000 $935 11%
4 x octa-core processors and
256GB of RAM
25 $20,000 $500,000 $2,200 11%
1 x hex-core processor and 32GB
of RAM
1 $5,500 $5,500 $605 11%
1 x hex-core processor and 32GB
of RAM
1 $5,500 $5,500 $605 11%
Management server (VMware
vCenter Server)
1 $2,500 $2,500 $275 11%
$ - $ - 11%
$ - $ - 11%
Total new server purchase costs
and annual maintenance
38 $15,750 $598,500 $65,835
Average annual costs for server spare and replacement parts $47,880 8% of total purchase
Average annual growth in server requirements 10% (Figure flows through whole sheet)
Average annual growth in server purchase costs 0%
Average server refresh period 36 months

19 Rackspace | Should I Outsource Infrastructure?
ANNUAL SERVER HARDWARE COSTS
YEAR 1 YEAR 2 YEAR 3 YEAR 4 YEAR 5
Number of servers (beginning of year) 0 38 42 46 51
Servers added for growth 38 4 4 5 5
Servers purchased for replacement 0 0 0 38 4
Average purchase price per new server $15,750 $15,750 $15,750 $15,750 $15,750
Annual server purchase costs $598,500 $63,000 $63,000 $677,250 $141,750
Annual costs for server spare and
replacement parts
$47,880 $52,920 $57,960 $64,260 $70,560
Annual server hardware costs (CapEx) $646,380 $115,920 $120,960 $741,510 $212,310
Annual server hardware maintenance
costs (OpEx)
$65,835 $72,765 $79,695 $88,358 $97,020
Total server hardware costs $712,215 $188,685 $200,655 $829,868 $309,330

20 Rackspace | Should I Outsource Infrastructure?
SERVER SOFTWARE
SERVER SOFTWARE LICENSES SERVERS LICENSES COST PER LICENSE
TOTAL LICENSE
COSTS
ANNUAL SUPPORT
OPERATING SYSTEM
> Windows Server Standard Edition 10 20 $1,209 $24,180 $6,045
> Windows Server Enterprise Edition $3,919 $ - $ -
> Windows Server Database Edition 25 100 $2,999 $299,900 $ 74,975
> Red Hat® Linux $1,819 $ - $ -
> CentOS $909 $ - $ -
VIRTUALIZATION SOFTWARE
> VMware vSphere (ESXi) 26 101 $2,875 $ 290,375 $72,594
> VMware vCenter Server
(Management)
1 1 $4,995 $4,995 $1,249
DATABASE
> SQL Server Standard $8,017 $ - $ -
> SQL Server Enterprise 10 20 $30,739 $614,780 $153,695
> Oracle® Standard $ - $ -
> Oracle Enterprise $ - $ -
> Oracle RAC $ - $ -
> MySQL $ - $ -
COLLABORATION SOFTWARE
> Microsoft Exchange (no CALs) 1 1 $1,000 $1,000 $250
> Microsoft SharePoint® (no CALs) 1 1 $5,995 $5,995 $1,499
Total $1,241,225 $310,306

21 Rackspace | Should I Outsource Infrastructure?
ANNUAL SERVER SOFTWARE COSTS
YEAR 1 YEAR 2 YEAR 3 YEAR 4 YEAR 5
Annual server software purchase costs
(CapEx)
$1,241,225 $124,123 $136,535 $150,188 $165,207
Annual server software support costs
(OpEx)
$310,306 $341,337 $375,471 $413,018 $454,319
Total server software costs $1,551,531 $465,459 $512,005 $563,206 $619,526
Average annual growth rate in server requirements 10%
NETWORK INFRASTRUCTURE
NETWORK INFRASTRUCTURE EQUIPMENT
QUANTITY AVERAGE COST PER
DEVICE
TOTAL PURCHASE
COSTS
ANNUAL HARDWARE
MAINTE-NANCE
FIREWALLS
ASA 5555-X 2 $ 1,373 $22,746 $1,820
Imperva WAF 1 5675 $5,675 $454
Load balancers
F5 BIG-IP 3600 2 14,540 $29,080 $2,326
Additional infrastructure
Intrusion Detection (IDS) 1 8,700 $8,700 $696
Network switches 4 1,800 $7,200 $576
Total 10 $73,401 $5,872
Average annual growth in server requirements 10%
ANNUAL NETWORK INFRASTRUCTURE COSTS
YEAR 1 YEAR 2 YEAR 3 YEAR 4 YEAR 5
Annual network equipment purchase
costs (CapEx)
$73,401 $7,340 $8,074 $8,882 $9,770
Annual network equipment
maintenance costs (OpEx)
$5,872 $6,459 $7,105 $7,816 $8,597
Total network infrastructure costs $79,273 $13,799 $15,179 $16,697 $18,367
22 Rackspace | Should I Outsource Infrastructure?
STORAGE
STORAGE TYPE CAPACITY (GBS)
AVERAGE COST PER GB
TOTAL STORAGE
PURCHASE COSTS
ANNUAL SUPPORT
FIREWALLS
EMC VNX5700 100,000 $4 .72 $472,000 $51,920
EMC Isilon NL400 250,000 $4 .16 $1,040,000 $114,400
IBM® DS3512 DAS 15,000 $2 .00 $30,000 $3,300
Total 365,000 $4.22 $1,542,000 $169,620
Average annual decrease in price per TB of storage 15%
Average annual growth in storage capacity 20%
ANNUAL STORAGE COSTS YEAR 1 YEAR 2 YEAR 3 YEAR 4 YEAR 5
Storage capacity (GBs at beginning of
year)
- 365,000 438,000 525,600 630,720
Storage capacity added for growth
(GBs)
365,000 73,000 87,600 105,120 126,144
Average price per GB $4 .22 $3 .59 $3 .05 $2 .59 $2 .21
Annual storage purchase costs $1,542,000 $62,140 $267,383 $272,730 $278,185
Storage networking costs $231,300 $39,321 $40,107 $40,910 $41,728
Annual storage equipment costs
(CapEx)
$1,773,300 $301,461 $307,490 $313,640 $319,913
Annual storage support costs (OpEx) $169,620 $198,455 $227,868 $257,868 $288,468
Total annual storage costs $1,942,920 $499,916 $535,358 $571,508 $608,381

23 Rackspace | Should I Outsource Infrastructure?
BACKUP
Total number of servers 38
Average number of servers per backup tape drive 5
Average purchase price per tape drive $2,500
Purchase costs for tape drives $20,000
Average backup software cost per server $250
Backup software license costs $2,000
Backup software support 20% per year
Average number of tapes per server 10
Average cost per tape $80 .00
Tape media costs $30,400
Is off-site tape storage required? Yes
Number of tapes stored off site 76 2 per server
Annual costs for off-site tape storage $11,400 @ $150 per tape
Average annual growth in server requirements 10%
ANNUAL BACKUP COSTS YEAR 1 YEAR 2 YEAR 3 YEAR 4 YEAR 5
Backup equipment costs (tape drives) $20,000
Backup software licenses $2,000
Annual backup software support costs $400 $400 $400 $400 $400
Annual tape media costs $30,400
Annual off-site tape storage costs $11,400 $11,400 $11,400 $11,400 $11,400
Total annual backup infrastructure
costs
$64,200 $11,800 $11,800 $11,800 $11,800

24 Rackspace | Should I Outsource Infrastructure?
POWER AND FACILITIES
DEVICE TYPE NUMBER OF DEVICES
AVERAGE RACK SPACE
(US)
TOTAL RACK SPACE
(US)
AVERAGE POWER
(WATTS)
TOTAL POWER
(WATTS)
FIREWALLS
2 x hex-core processors and
256GB of RAM
10 2 .00 20 .00 620 6,200
4 x octa-core processors and
256GB of RAM
25 4 .00 100 .00 1,000 25,000
1 x hex-core processor and
32GB of RAM
1 1 .00 1 .00 450 450
1 x hex-core processor and
32GB of RAM
1 1 .00 1 .00 450 450
Management server (VMware
vCenter Server)
1 1 .00 1 .00 250 250
NETWORK EQUIPMENT
ASA 5555-X 2 1 .00 2 .00 800 1,600
Imperva WAF 1 2 .00 2 .00 800 800
F5 BIG-IP 3600 2 1 .00 2 .00 350 700
Intrusion Detection (IDS) 1 1 .00 1 .00 350 350
STORAGE DEVICES
EMC VNX5700 8 5 .00 40 .00 1,200 9,600
EMC Isilon NL400 1 20 .00 20 .00 350 350
Total 53 3.55 190 863.21 45,750
ASSUMPTION
Average annual growth in server requirements 10% 40 Us of usable rack space per rack
20 Sq . feet of floor space per rack

25 Rackspace | Should I Outsource Infrastructure?
ANNUAL DATA CENTER FACILITIES COSTS
YEAR 1 YEAR 2 YEAR 3 YEAR 4 YEAR 5
DATA CENTER FLOOR SPACE COSTS
Data center requirements (Us) 190 .00 190 .00 190 .00 190 .00 190 .00
Square feet of data center floor space 100 .00 100 .00 100 .00 100 .00 100 .00
Average annual cost per square foot of
floor space
$62 $62 $ 62 $62 $62
Annual costs for data center floor
space
$6,200 $6,200 $6,200 $6,200 $6,200
DATA CENTER POWER AND COOLING COSTS
Average power consumption per hour 45,750 45,750 45,750 45,750 45,750
Operating hours per year 8,766 8,766 8,766 8,766 8,766
Annual power consumption (kWatts) 401,045 401,045 401,045 401,045 401,045
Data center PUE factor 2 .5 2 .5 2 .5 2 .5 2 .5
Total annual data center power and
cooling (kWatts)
1,002,611 1,002,611 1,002,611 1,002,611 1,002,611
Average cost per kWatt/hour $0 .090 $0 .090 $0 .090 $0 .090 $0 .090
Annual data center energy costs 90,235 90,235 90,235 90,235 90,235
Data center addition cost factor 4 .5 4 .5 4 .5 4 .5 4 .5
Annual data center facilities costs $433,958 $433,958 $433,958 $433,958 $433,958

26 Rackspace | Should I Outsource Infrastructure?
SYSTEM ADMIN LABOR
SYSTEMS ADMINISTRATION STAFF
NUMBER OF STAFF
(FTES)
AVERAGE ANNUAL SALARY
FULLY-BURDENED
COST PER FTE
TOTAL ANNUAL
COSTS (YEAR 1)
Server administrators 3 .00 $83,385 $110,485 $331,455 32 .5%
Network and security
administrators
0 .43 $83,385 $110,485 $47,509
Database administrators 1 .23 $93,195 $123,483 $151,885
Storage administrators 1 .20 $79,800 $105,735 $126,882
Backup administrators 0 .40 $67,000 $88,775 $35,510
Exchange/SharePoint
administrators
- $78,900 $104,543 $ -
Total 6.26 $83,578 $110,741 $693,241
Average annual increase in
system admin effort
0% Fully burdened labor rate $ 61 .52
Average annual increase in
system admin salaries
4%
Hours worked per year 1800
ANNUAL COSTS YEAR 1 YEAR 2 YEAR 3 YEAR 4 YEAR 5
Average fully-burdened salary $110,741 $115,171 $119,778 $124,569 $129,552
System admin labor costs $693,241 $720,970 $749,809 $779,801 $810,993
System admin staff (FTEs) 6 .26 6 .26 6 .26 6 .26 6 .26
System administration efforts (hours) 11,268 11,268 11,268 11,268 11,268

27 Rackspace | Should I Outsource Infrastructure?
IT TRAINING COSTS
SYSTEMS ADMINISTRATION STAFF
NUMBER OF STAFF (FTES)
AVERAGE HOURS OF TRAINING PER YEAR
AVERAGE ANNUAL
COURSE FEES AND
EXPENSES
TOTAL ANNUAL
TRAINING COSTS
(YEAR 1)
Server administrators 3 .00 80 .00 $7,000 $21,000
Network and security administrators 0 .43 80 .00 $7,000 $3,010
Database administrators 1 .23 80 .00 $7,000 $8,610
Storage administrators 1 .20 80 .00 $7,000 $8,400
Backup administrators 0 .40 40 .00 $3,500 $1,400
Total 6.26 484.80 $42,420
Average annual increase in system
admin effort
5%
ANNUAL COSTS YEAR 1 YEAR 2 YEAR 3 YEAR 4 YEAR 5
IT training costs $ 42,420 $ 42,420 $ 42,420 $ 42,420 $42,420
IT training hours 485 485 485 485 485

28 Rackspace | Should I Outsource Infrastructure?
STAFF TURNOVER COSTS
Number of IT systems admin staff 6 .26
Average annual turnover rate for IT staff 15%
Number of new IT staff per year 0 .94
Average annual fully burdened salary $83,578
Average recruitment cost per position $16,716 20%
Average on-boarding period for IT staff 3 .00 weeks
On-boarding costs $4,822
Total annual IT staff turnover costs (year 1) $20,224
Average annual increase in system admin effort 0%
ANNUAL COSTS YEAR 1 YEAR 2 YEAR 3 YEAR 4 YEAR 5
IT staff turnover costs $ 20,224 $ 20,224 $ 20,224 $ 20,224 $ 20,224
NETWORK BANDWIDTH COSTS
PREFERRED WAN CONNECTION TYPE T-1 (1.54 MBPS)
Available bandwidth per T-1 1 .54
Average cost per month per T-1 $375 .00
Number of servers 35
Average bandwidth requirements per server (Mbps) 350
Number of T-1 lines required (year 1) 8
Annual network bandwidth costs (year 1) $36,000
Average annual growth rate in server requirements 10%
ANNUAL COSTS YEAR 1 YEAR 2 YEAR 3 YEAR 4 YEAR 5
Number of T-1 lines required 8 .00 8 .00 8 .00 8 .00 8 .00
Total annual network bandwidth costs $36,000 $36,000 $36,000 $36,000 $36,000

29 Rackspace | Should I Outsource Infrastructure?
INDIRECT BUSINESS COSTS
INDIRECT BUSINESS COSTS YEAR 1 YEAR 2 YEAR 3 YEAR 4 YEAR 5
CURRENT SELF-MANAGED COSTS
Unplanned downtime - productivity
impact
$455,485 $455,485 $455,485 $455,485 $455,485
Planned downtime - productivity
impact
$606,620 $606,620 $606,620 $606,620 $606,620
Business agility - productivity impact $234,247 $234,247 $234,247 $234,247 $234,247
Unplanned downtime - business costs $150,453 $150,453 $150,453 $150,453 $150,453
Planned downtime - business costs $160,300 $160,300 $160,300 $160,300 $160,300
Business agility - revenue impact $160,927 $160,927 $160,927 $160,927 $160,927
Total self-managed costs $1,768,032 $1,768,032 $1,768,032 $1,768,032 $1,768,032
Indirect benefit realization factor 20% 20% 20% 20% 20%
Total realized costs $353,606 $353,606 $353,606 $353,606 $353,606
COSTS WITH HOSTED SOLUTION
Unplanned downtime - productivity
impact
$151,828 $151,828 $151,828 $151,828 $151,828
Planned downtime - productivity
impact
$121,324 $121,324 $121,324 $121,324 $121,324
Business agility - productivity impact $15,616 $15,616 $15,616 $15,616 $15,616
Unplanned downtime - business costs $50,151 $50,151 $50,151 $50,151 $50,151
Planned downtime - business costs $32,060 $32,060 $32,060 $32,060 $32,060
Business agility - revenue Impact $10,728 10,728 $10,728 $10,728 $10,728
Total hosted costs $381,708 $381,708 $381,708 $381,708 $381,708
Indirect benefit realization factor 20% 20% 20% 20% 20%
Total realized costs $76,342 $76,342 $76,342 $76,342 $76,342
Total improved service level benefits $277,265 $277,265 $277,265 $277,265 $277,265

30 Rackspace | Should I Outsource Infrastructure?
UNPLANNED DOWNTIME - PRODUCTIVITY IMPACT
UNPLANNED DOWNTIME SELF-MANAGED ENVIRONMENT
HOSTED SOLUTION EXPECTED BEN-EFITS WITH PRO-
POSED SOLUTION
Average annual system availability 99 .70% 99 .90% 67%
Average hours of annual unplanned
system downtime per year
26 .3 8 .8 17 .5
Average number of knowledge
workers impact per outage
1,000 1,000
Average productivity impact on
knowledge workers during outage
40% 40%
Annual productivity losses due to
availability issues (hours)
10,512 3,504 7,013
Average fully burdened hour wage for
knowledge workers
43 .33 $43 .33
Annual cost of productivity losses due
to availability issues
$455,485 $151,828 $303,900
PLANNED DOWNTIME - PRODUCTIVITY IMPACT
PLANNED DOWNTIME SELF-MANAGED ENVIRONMENT
HOSTED SOLUTION EXPECTED BEN-EFITS WITH PRO-
POSED SOLUTION
Annual hours of planned system
downtime per year
140 28 80%
Average number of knowledge
workers impact per outage
250 250
Average productivity impact on
knowledge workers during outage
40% 40%
Annual productivity losses due to
availability issues (hours)
14,000 2,800 11,200
Average fully burdened hour wage for
knowledge workers
43 .33 $43 .33
Annual cost of productivity losses due
to availability issues
$606,620 $121,324 $485,296

31 Rackspace | Should I Outsource Infrastructure?
ANNUAL COSTS YEAR 1 YEAR 2 YEAR 3 YEAR 4 YEAR 5
Current (as is) costs $606,620 $606,620 $606,620 $606,620 $606,620
Proposed (to be) costs $121,324 $121,324 $121,324 $121,324 $121,324
Reduction in productivity losses from
improved availability
$485,296 $485,296 $485,296 $485,296 $485,296
FTE productivity improvements 6.2 6.2 6.2 6.2 6.2
BUSINESS AGILITY - PRODUCTIVITY IMPACT
BUSINESS AGILITY SELF-MANAGED ENVIRONMENT
HOSTED SOLUTION EXPECTED BEN-EFITS WITH PRO-
POSED SOLUTION
New application projects per year 19 19
Average system provision time per
application (days)
30 2 93 .3%
Average annual value in productivity
improvement per app
$150,000 $150,000
Average lost productivity
improvement value per system
provisioning
$12,329 $822 $11,507
Annual value of productivity losses
due to system provisioning
$234,246 .58 $15,616 .44 $218,630 .14
BUSINESS AGILITY - PRODUCTIVITY IMPACT
YEAR 1 YEAR 2 YEAR 3 YEAR 4 YEAR 5
Current (as is) costs $234,247 $234,247 $234,247 $234,247 $234,247
Proposed (to be) costs $15,616 $15,616 $15,616 $15,616 $15,616
Reduction in productivity losses from
improved availability
$218,630 $218,630 $218,630 $218,630 $218,630

32 Rackspace | Should I Outsource Infrastructure?
UNPLANNED DOWNTIME - BUSINESS COSTS
UNPLANNED DOWNTIME SELF-MANAGED ENVIRONMENT
HOSTED SOLUTION EXPECTED BEN-EFITS WITH PRO-
POSED SOLUTION
Average annual system availability 99 .70% 99 .90% 67%
Average hours of annual unplanned
system downtime per year
26 .3 8 .8 17 .5
Estimated revenue or equivalent cost/
hour of unplanned downtime
$25,000 $25,000 $25,000
Annual business losses due to
availability issues
$657,000 $219,000 $438,000
Net incremental contribution 22 .90% 22 .90% 22 .90%
Annual incremental margin
contribution
$150,453 $50,151 $100,302
ANNUAL COSTS YEAR 1 YEAR 2 YEAR 3 YEAR 4 YEAR 5
Current (as is) costs $657,000 $657,000 $657,000 $657,000 $657,000
Incremental margin contribution $150,453 $150,453 $150,453 $150,453 $150,453
Proposed (to be) costs $219,000 $219,000 $219,000 $219,000 $219,000
Incremental margin contribution $50,151 $50,151 $50,151 $50,151 $50,151
Reduction in business loss from
improved availability
$438,000 $438,000 $438,000 $438,000 $438,000
Incremental margin contribution $100,302 $100,302 $100,302 $100,302 $100,302

33 Rackspace | Should I Outsource Infrastructure?
PLANNED DOWNTIME - BUSINESS COSTS
PLANNED DOWNTIME SELF-MANAGED ENVIRONMENT
EXPECTED PLANNED DOWN-
TIME FOR HOSTED SOLUTION
EXPECTED BEN-EFITS WITH PRO-
POSED SOLUTION
Average hours of annual planned
system downtime per year
140 .0 28 .0 80%
Estimated revenue or equivalent cost/
hour of planned downtime
$5,000 $5,000 $25,000
Annual business losses due to
availability issues
$700,000 $140,000 $560,000
Net incremental contribution 22 .90% 22 .90% 22 .90%
Annual incremental margin
contribution
$160,300 $32,060 $128,240
ANNUAL COSTS YEAR 1 YEAR 2 YEAR 3 YEAR 4 YEAR 5
Current (as is) costs $700,000 $700,000 $700,000 $700,000 $700,000
Incremental margin contribution $160,300 $160,300 $160,300 $160,300 $160,300
Proposed (to be) costs $140,000 $140,000 $140,000 $140,000 $140,000
Incremental margin contribution $32,060 $32,060 $32,060 $32,060 $32,060
Reduction in business loss from
improved availability
$560,000 $560,000 $560,000 $560,000 $560,000
Incremental margin contribution $128,240 $128,240 $128,240 $128,240 $128,240

34 Rackspace | Should I Outsource Infrastructure?
BUSINESS AGILITY - REVENUE IMPACT
BUSINESS AGILITY SELF-MANAGED ENVIRONMENT
EXPECTED PLANNED DOWN-
TIME FOR HOSTED SOLUTION
EXPECTED BEN-EFITS WITH PRO-
POSED SOLUTION
New application projects per year 19 19
Average system provision time per
application (days)
30 days 2 days 93 .3%
Average annual revenue value per app $450,000 $450,000
Average lost revenue per system
provisioning
36,986 2,466 $34,521
Annual value of potential revenue
losses due to system provisioning
$702,740 $46,849 $655,890
Net incremental contribution 22 .9% 22 .9% 22 .9%
Annual incremental margin
contribution
$160,927 $10,728 $150,199
BUSINESS AGILITY - REVENUE IMPACT
YEAR 1 YEAR 2 YEAR 3 YEAR 4 YEAR 5
Current (as is) costs $702,740 $702,740 $702,740 $702,740 $702,740
Incremental margin contribution $160,927 $160,927 $160,927 $160,927 $160,927
Proposed (to be) costs $46,849 $46,849 $46,849 $46,849 $46,849
Incremental margin contribution $10,728 $10,728 $10,728 $10,728 $10,728
Reduction in business loss from
system provisioning
$655,890 $655,890 $655,890 $655,890 $655,890
Incremental margin contribution $150,199 $150,199 $ 150,199 $150,199 $150,199

35 Rackspace | Should I Outsource Infrastructure?
Toll Free: 1.800.961.2888 | International: 1.210.312.4700 | Or Visit Us www.rackspace.com
Rackspace® | 1 Fanatical Place | City of Windcrest, San Antonio, Texas 78218 U.S.A | DATE MODIFIED: 08072014
This whitepaper is for informational purposes only and is provided “AS IS .” The information set forth is intended as a guide and not as a step-by-step process, and does not represent an assessment of any specific compliance with laws or regulations or constitute advice . We strongly recommend that you engage additional expertise in order to further evaluate applicable requirements for your specific environment .
RACKSPACE MAKES NO REPRESENTATIONS OR WARRANTIES OF ANY KIND, EXPRESS OR IMPLIED, AS TO THE ACCURACY OR COMPLETENESS OF THE CONTENTS OF THIS DOCUMENT AND RESERVES THE RIGHT TO MAKE CHANGES TO SPECIFICATIONS AND PRODUCT/SERVICES DESCRIPTION AT ANY TIME WITHOUT NOTICE . RACKSPACE RESERVES THE RIGHT TO DISCONTINUE OR MAKE CHANGES TO ITS SERVICES OFFERINGS AT ANY TIME WITHOUT NOTICE . USERS MUST TAKE FULL RESPONSIBILITY FOR APPLICATION OF ANY SERVICES AND/OR PROCESSES MENTIONED HEREIN . EXCEPT AS SET FORTH IN RACKSPACE GENERAL TERMS AND CONDITIONS, CLOUD TERMS OF SERVICE AND/OR OTHER AGREEMENT YOU SIGN WITH RACKSPACE, RACKSPACE ASSUMES NO LIABILITY WHATSOEVER, AND DISCLAIMS ANY EXPRESS OR IMPLIED WARRANTY, RELATING TO ITS SERVICES INCLUDING, BUT NOT LIMITED TO, THE IMPLIED WARRANTY OF MERCHANTABILITY, FITNESS FOR A PARTICULAR PURPOSE, AND NONINFRINGEMENT .
ALTHOUGH PART OF THE WHITEPAPER EXPLAINS HOW RACKSPACE SERVICES MAY WORK WITH THIRD PARTY PRODUCTS, THE INFORMATION CONTAINED IN THE WHITEPAPER IS NOT DESIGNED TO WORK WITH ALL SCENARIOS . ANY USE OR CHANGES TO THIRD PARTY PRODUCTS AND/OR CONFIGURATIONS SHOULD BE MADE AT THE DISCRETION OF YOUR ADMINISTRATORS AND SUBJECT TO THE APPLICABLE TERMS AND CONDITIONS OF SUCH THIRD PARTY . RACKSPACE DOES NOT PROVIDE TECHNICAL SUPPORT FOR THIRD PARTY PRODUCTS, OTHER THAN SPECIFIED IN YOUR HOSTING SERVICES OR OTHER AGREEMENT YOU HAVE WITH RACKSPACE AND RACKSPACE ACCEPTS NO RESPONSIBILITY FOR THIRD-PARTY PRODUCTS .
Except as expressly provided in any written license agreement from Rackspace, the furnishing of this document does not give you any license to patents, trademarks, copyrights, or other intellectual property .
Rackspace, Fanatical Support and RackConnect are either registered service marks or service marks of Rackspace US, Inc . in the United States and other countries .
Third-party trademarks and tradenames appearing in this document are the property of their respective owners . Such third-party trademarks have been printed in caps or initial caps and are used for referential purposes only . We do not intend our use or display of other companies’ tradenames, trademarks, or service marks to imply a relationship with, or endorsement or sponsorship of us by, these other companies .
© 2014 Rackspace US, Inc . All rights reserved .
NOTES
1 : Marcus Blosch and Saul Brand, “Gartner’s 2013 CIO Survey Provides Keys to
EA Success,” Gartner, 19 July 2013 .
2 : Jason Hiner, “IT’s new holy grail: Break out of the 70% maintenance loop,”
Tech Sanity Check blog, TechRepublic .com, 11 May 2010 .
3 : Robert Bogue, “How To Reduce Your Application Backlog with SharePoint,”
CIO .com, 3 August 2011 .
4 : Antony Savvas, “CIOs blind to 40 percent ‘shadow’ IT spending at their
firms,” ComputerWorldUK, 28 November 2013 .
5 : “IT Budgets, Salaries, and Priorities: 2013 SIM IT Trends Study”, CIO .com
retrieved 3 April 2014 from http://www .cio .com/slideshow/detail/128158 .
6 : “Findings from the 2013–2014 IT Budget Benchmark,” CEB, 14 November
2013, page 12 .
7 : Tom Loftus, “Forrester’s View of the Very Near Future,” CIO Journal blog,
The Wall Street Journal, 5 November 2013 .