Shotgun proteomic analysis of Yersinia ruckeri strains under normal ...
13
Kumar et al. Vet Res (2016) 47:100 DOI 10.1186/s13567-016-0384-3 RESEARCH ARTICLE Shotgun proteomic analysis of Yersinia ruckeri strains under normal and iron-limited conditions Gokhlesh Kumar 1* , Karin Hummel 2 , Maike Ahrens 3 , Simon Menanteau‑Ledouble 1 , Timothy J. Welch 4 , Martin Eisenacher 3 , Ebrahim Razzazi‑Fazeli 2 and Mansour El‑Matbouli 1 Abstract Yersinia ruckeri is the causative agent of enteric redmouth disease of fish that causes significant economic losses, particularly in salmonids. Bacterial pathogens differentially express proteins in the host during the infection process, and under certain environmental conditions. Iron is an essential nutrient for many cellular processes and is involved in host sensing and virulence regulation in many bacteria. Little is known about proteomics expression of Y. ruckeri in response to iron‑limited conditions. Here, we present whole cell protein identification and quantification for two motile and two non‑motile strains of Y. ruckeri cultured in vitro under iron‑sufficient and iron‑limited conditions, using a shotgun proteomic approach. Label‑free, gel‑free quantification was performed using a nanoLC‑ESI and high resolu‑ tion mass spectrometry. SWATH technology was used to distinguish between different strains and their responses to iron limitation. Sixty‑one differentially expressed proteins were identified in four Y. ruckeri strains. These proteins were involved in processes including iron ion capture and transport, and enzymatic metabolism. The proteins were con‑ firmed to be differentially expressed at the transcriptional level using quantitative real time PCR. Our study provides the first detailed proteome analysis of Y. ruckeri strains, which contributes to our understanding of virulence mecha‑ nisms of Y. ruckeri, and informs development of novel control methods for enteric redmouth disease. © 2016 The Author(s). This article is distributed under the terms of the Creative Commons Attribution 4.0 International License (http://creativecommons.org/licenses/by/4.0/), which permits unrestricted use, distribution, and reproduction in any medium, provided you give appropriate credit to the original author(s) and the source, provide a link to the Creative Commons license, and indicate if changes were made. The Creative Commons Public Domain Dedication waiver (http://creativecommons.org/ publicdomain/zero/1.0/) applies to the data made available in this article, unless otherwise stated. Introduction Enteric redmouth disease (ERM) is one of the most important diseases of salmonids, and causes significant economic losses in commercial aquaculture worldwide [1]. e disease is caused by Yersinia ruckeri, a Gram- negative rod-shaped enterobacterium. is bacterium has been reported in Europe, North and South America, Middle East and China [1–4]. Yersinia ruckeri strains are divided into two biotypes: biotype 1 strains are motile and lipase secretion positive, whereas strains of bio- type 2 are non-motile and test negative for lipase [5]. In the past, the majority of epizootic outbreaks in salmo- nids were caused by biotype 1 strains, against which an effective vaccine was developed [6]. However, biotype 2 strains have recently been responsible for outbreaks in both native and vaccinated rainbow trout (Oncorhynchus mykiss) in Europe and North America, suggesting that this biotype was able to overcome the protection granted by motile strains vaccines [3, 7, 8]. Iron is an essential nutrient for microorganisms and occurs as ferrous and ferric oxidation states. It influ- ences cell composition, secondary metabolism, enzyme activity, host cell interactions and pathogenicity of bac- teria [9]. During reduced availability of iron pathogens express differentially regulated proteins, several of which are involved in invasion and pathogenicity activities. Iron homeostasis systems and virulence mechanisms have not been thoroughly investigated in Y. ruckeri and little is known about its protein expression. e expres- sion of outer membrane proteins (OMPs) of Y. ruckeri isolates was examined by Davies [10] using SDS-PAGE, who observed four OMP bands at 72, 69.5, 68 and 66 kDa under iron-limited conditions. Tinsley et al. [11] also used Open Access *Correspondence: [email protected] 1 Clinical Division of Fish Medicine, Department for Farm Animals and Veterinary Public Health, University of Veterinary Medicine, Vienna, Austria Full list of author information is available at the end of the article
Transcript of Shotgun proteomic analysis of Yersinia ruckeri strains under normal ...

Kumar et al. Vet Res (2016) 47:100 DOI 10.1186/s13567-016-0384-3
RESEARCH ARTICLE
Shotgun proteomic analysis of Yersinia ruckeri strains under normal and iron-limited conditionsGokhlesh Kumar1* , Karin Hummel2, Maike Ahrens3, Simon Menanteau‑Ledouble1, Timothy J. Welch4, Martin Eisenacher3, Ebrahim Razzazi‑Fazeli2 and Mansour El‑Matbouli1
Abstract
Yersinia ruckeri is the causative agent of enteric redmouth disease of fish that causes significant economic losses, particularly in salmonids. Bacterial pathogens differentially express proteins in the host during the infection process, and under certain environmental conditions. Iron is an essential nutrient for many cellular processes and is involved in host sensing and virulence regulation in many bacteria. Little is known about proteomics expression of Y. ruckeri in response to iron‑limited conditions. Here, we present whole cell protein identification and quantification for two motile and two non‑motile strains of Y. ruckeri cultured in vitro under iron‑sufficient and iron‑limited conditions, using a shotgun proteomic approach. Label‑free, gel‑free quantification was performed using a nanoLC‑ESI and high resolu‑tion mass spectrometry. SWATH technology was used to distinguish between different strains and their responses to iron limitation. Sixty‑one differentially expressed proteins were identified in four Y. ruckeri strains. These proteins were involved in processes including iron ion capture and transport, and enzymatic metabolism. The proteins were con‑firmed to be differentially expressed at the transcriptional level using quantitative real time PCR. Our study provides the first detailed proteome analysis of Y. ruckeri strains, which contributes to our understanding of virulence mecha‑nisms of Y. ruckeri, and informs development of novel control methods for enteric redmouth disease.
© 2016 The Author(s). This article is distributed under the terms of the Creative Commons Attribution 4.0 International License (http://creativecommons.org/licenses/by/4.0/), which permits unrestricted use, distribution, and reproduction in any medium, provided you give appropriate credit to the original author(s) and the source, provide a link to the Creative Commons license, and indicate if changes were made. The Creative Commons Public Domain Dedication waiver (http://creativecommons.org/publicdomain/zero/1.0/) applies to the data made available in this article, unless otherwise stated.
IntroductionEnteric redmouth disease (ERM) is one of the most important diseases of salmonids, and causes significant economic losses in commercial aquaculture worldwide [1]. The disease is caused by Yersinia ruckeri, a Gram-negative rod-shaped enterobacterium. This bacterium has been reported in Europe, North and South America, Middle East and China [1–4]. Yersinia ruckeri strains are divided into two biotypes: biotype 1 strains are motile and lipase secretion positive, whereas strains of bio-type 2 are non-motile and test negative for lipase [5]. In the past, the majority of epizootic outbreaks in salmo-nids were caused by biotype 1 strains, against which an effective vaccine was developed [6]. However, biotype 2
strains have recently been responsible for outbreaks in both native and vaccinated rainbow trout (Oncorhynchus mykiss) in Europe and North America, suggesting that this biotype was able to overcome the protection granted by motile strains vaccines [3, 7, 8].
Iron is an essential nutrient for microorganisms and occurs as ferrous and ferric oxidation states. It influ-ences cell composition, secondary metabolism, enzyme activity, host cell interactions and pathogenicity of bac-teria [9]. During reduced availability of iron pathogens express differentially regulated proteins, several of which are involved in invasion and pathogenicity activities. Iron homeostasis systems and virulence mechanisms have not been thoroughly investigated in Y. ruckeri and little is known about its protein expression. The expres-sion of outer membrane proteins (OMPs) of Y. ruckeri isolates was examined by Davies [10] using SDS-PAGE, who observed four OMP bands at 72, 69.5, 68 and 66 kDa under iron-limited conditions. Tinsley et al. [11] also used
Open Access
*Correspondence: [email protected] 1 Clinical Division of Fish Medicine, Department for Farm Animals and Veterinary Public Health, University of Veterinary Medicine, Vienna, AustriaFull list of author information is available at the end of the article

Page 2 of 13Kumar et al. Vet Res (2016) 47:100
SDS-PAGE to show induction in OMPs of Y. ruckeri iso-lates at 90 and 100 kDa, under iron-restricted conditions; these proteins were not identified by mass spectrometry. An alternative protein analysis technology has emerged: label-free, gel-free shotgun proteomics, and this has been used in Y. pestis to identify whole cell proteins [12, 13]. Recently, a reference proteome map of Y. pestis has been created, and is leading to an understanding of the patho-genesis of this bacterium [12]. Additionally, differentially expressed proteins of Y. pestis and Y. enterocolitica have been identified and quantified under iron-limited condi-tions using both 2D-PAGE and MALDI TOF/TOF MS [14, 15].
The aim of the present study was to identify and quan-tify the whole cell proteomic expression profiles of bio-type 1 and biotype 2 strains of Y. ruckeri grown in vitro, under normal and iron-limited conditions using a label-free, gel-free shotgun proteomics approach. This study represents one of the first descriptive and comparative proteomic approaches of motile and non-motile Y. ruck-eri strains in response to iron-limited conditions.
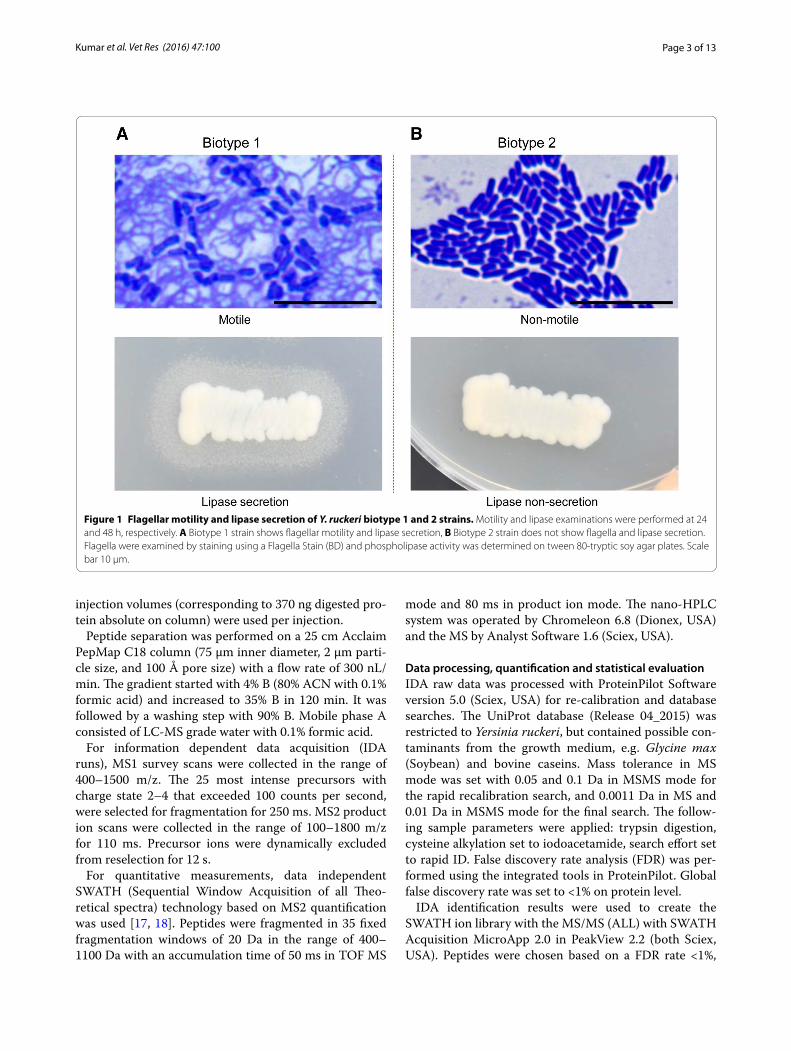
Materials and methodsYersinia ruckeri strainsFour strains (SP-05, CSF007-82, 7959-11 and YRNC-10) of Y. ruckeri were used for deep proteomic analysis. Strains SP-05 and 7959-11 were obtained from our bac-terial repository at the University of Veterinary Medi-cine, Vienna, Austria. The other two strains, CSF007-82 and YRNC-10, were obtained from the National Center for Cool and Cold Water Aquaculture, Kearneysville, West Virginia, USA. These strains were tested for sero-type, flagella motility and phospholipase activity [3] and their identity confirmed by PCR [16]. Strains, SP-05 and CSF007-82, belong to serotype 1 and biotype 1 (motile and lipase positive, Figure 1A), while strains 7959-11 and YRNC-10 belong to serotype 1 and biotype 2 (non-motile and lipase negative, Figure 1B).
Culture conditionsBacterial strains were grown on tryptic soy agar for 48 h at 22 °C. A single colony of each strain was inoculated into 10 mL of tryptic soy broth [Casein peptone (17 g), dipotassium hydrogen phosphate (2.5 g), glucose (2.5 g), sodium chloride (5 g), soya peptone (3 g) per liter, Sigma, Germany] and incubated for 17 h at 22 °C with shak-ing (150 rpm). These starter cultures were then diluted with fresh sterile tryptic soy broth to an optical den-sity (OD 600) of 0.10 ± 0.05. Five hundred microlitres of the diluted starter cultures were inoculated in dupli-cates, into 25 mL of tryptic soy broth with or without iron chelator, 2,2′-bipyridyl, MW 156.18 g/mol (Sigma, Germany). Iron depletion was attained by the addition
of 100 μM of 2,2′-bipyridyl to the broth. Cultures were grown overnight at 22 °C with shaking (150 rpm) until the late log phase. Cells were harvested by centrifugation at 4000 rpm for 10 min at 4 °C, then washed three times with phosphate buffered saline containing bacterial pro-tease inhibitor cocktail (Sigma, Germany) and stored at −80 °C.
Protein extraction and digestionBacterial pellets were resuspended in 800 µL pre-cooled denaturing lysis buffer (7 M urea, 2 M thiourea, 4% CHAPS and 1% DTT) containing bacterial protease inhibitor cocktail. Bacterial cell suspensions were dis-rupted by sonication on ice for 20 cycles of 10 s pulse-on and 30 s pulse-off. The lysates were centrifuged at 14 000 rpm for 30 min at 4 °C and supernatants were collected. Total protein concentration of each lysate was determined colorimetrically with a NanoDrop 2000c (Thermo Fisher Scientific, USA) spectrophotometer using a Pierce 660 nm Protein Assay according to the manufacturer’s instructions.
Protein digestion was performed using the standard two-step in-solution digestion protocol for Trypsin/LysC-Mix according to the user manual (Promega, USA). In summary, 10 µg of proteins was diluted with 8 M urea in 50 mM Tris–HCl (pH 8.0) to a total volume of 10 µL. Proteins were reduced in 5 mM dithiothreitol (final con-centration) for 30 min at 37 °C and alkylated with 15 mM iodoacetamide for 30 min at 25 °C. Trypsin/LysC mix was added in a ratio of 25:1 protein to protease (w/w). The first digestion step was performed for 4 h at 37 °C under high urea concentration. To enable protease activity of trypsin, urea was diluted afterwards with 50 mM Tris–HCl (pH 8.0) to a concentration below 1 mol/L. The sec-ond digestion step was performed for 8 h at 37 °C. Finally, digested samples were acidified with concentrated trif-luoroacetic acid.
NanoLC‑MS/MS analysisTryptic peptides were separated by a nano liquid chro-matography system (Dionex Ultimate 3000 RSLC, Thermo Fisher Scientific, USA) and analyzed with a high-resolution hybrid triple quadrupole time of flight mass spectrometer (TripleTOF 5600+, Sciex, USA) coupled via a nano-ESI interface.
Samples were pre-concentrated and desalted with a 5 mm Acclaim PepMap µ-Precolumn (300 µm inner diameter, 5 µm particle size, and 100 Å pore size) (Dionex, Thermo Fisher Scientific, USA). Samples were loaded and desalted using 2% acetonitrile (ACN, Chem-Lab, Belgium) in LC–MS grade water (Optima, Thermo Fisher Scientific, USA). 0.05% TFA was used as a mobile phase with a flow rate of 5 µL/min. Three microliter
Page 3 of 13Kumar et al. Vet Res (2016) 47:100
injection volumes (corresponding to 370 ng digested pro-tein absolute on column) were used per injection.
Peptide separation was performed on a 25 cm Acclaim PepMap C18 column (75 µm inner diameter, 2 µm parti-cle size, and 100 Å pore size) with a flow rate of 300 nL/min. The gradient started with 4% B (80% ACN with 0.1% formic acid) and increased to 35% B in 120 min. It was followed by a washing step with 90% B. Mobile phase A consisted of LC-MS grade water with 0.1% formic acid.
For information dependent data acquisition (IDA runs), MS1 survey scans were collected in the range of 400–1500 m/z. The 25 most intense precursors with charge state 2–4 that exceeded 100 counts per second, were selected for fragmentation for 250 ms. MS2 product ion scans were collected in the range of 100–1800 m/z for 110 ms. Precursor ions were dynamically excluded from reselection for 12 s.
For quantitative measurements, data independent SWATH (Sequential Window Acquisition of all Theo-retical spectra) technology based on MS2 quantification was used [17, 18]. Peptides were fragmented in 35 fixed fragmentation windows of 20 Da in the range of 400–1100 Da with an accumulation time of 50 ms in TOF MS
mode and 80 ms in product ion mode. The nano-HPLC system was operated by Chromeleon 6.8 (Dionex, USA) and the MS by Analyst Software 1.6 (Sciex, USA).
Data processing, quantification and statistical evaluationIDA raw data was processed with ProteinPilot Software version 5.0 (Sciex, USA) for re-calibration and database searches. The UniProt database (Release 04_2015) was restricted to Yersinia ruckeri, but contained possible con-taminants from the growth medium, e.g. Glycine max (Soybean) and bovine caseins. Mass tolerance in MS mode was set with 0.05 and 0.1 Da in MSMS mode for the rapid recalibration search, and 0.0011 Da in MS and 0.01 Da in MSMS mode for the final search. The follow-ing sample parameters were applied: trypsin digestion, cysteine alkylation set to iodoacetamide, search effort set to rapid ID. False discovery rate analysis (FDR) was per-formed using the integrated tools in ProteinPilot. Global false discovery rate was set to <1% on protein level.
IDA identification results were used to create the SWATH ion library with the MS/MS (ALL) with SWATH Acquisition MicroApp 2.0 in PeakView 2.2 (both Sciex, USA). Peptides were chosen based on a FDR rate <1%,
Figure 1 Flagellar motility and lipase secretion of Y. ruckeri biotype 1 and 2 strains. Motility and lipase examinations were performed at 24 and 48 h, respectively. A Biotype 1 strain shows flagellar motility and lipase secretion, B Biotype 2 strain does not show flagella and lipase secretion. Flagella were examined by staining using a Flagella Stain (BD) and phospholipase activity was determined on tween 80‑tryptic soy agar plates. Scale bar 10 µm.

Page 4 of 13Kumar et al. Vet Res (2016) 47:100
excluding shared and modified peptides. Up to 6 peptides per protein and up to 6 transitions per peptide were used.
MarkerView 1.2.1 (Sciex, USA) was used for calcula-tion of peak areas of SWATH samples after retention time alignment and normalization using total area sums. Resulting protein lists were then used for visualization of data after principal component analysis (PCA) in form of loadings plots and score plots to get a first impres-sion of the overall data structure, and to assess variability between technical and biological replicates.
To determine differentially regulated proteins, statis-tical evaluation was performed in R programming lan-guage [19]. Raw peak areas after normalization to total area sums were log2-transformed to approach a normal distribution. On a logarithmic scale, technical replicates were aggregated by arithmetic mean before application of statistical tests. This procedure is equivalent to the application of a hierarchical model in the subsequent ANOVA, as the same number of technical replicates was measured per biological replicate.
For each growing condition, differential expression of proteins in each Y. ruckeri strain was assessed using one-way ANOVA for each protein. To adjust for multiple testing, the method of Benjamini and Hochberg [20] was used to control the FDR. Differences were considered significant if adjusted p-values were smaller than the sig-nificance level of α = 0.001. For those proteins, Tukey’s honest significant difference (HSD) method was applied as post hoc test to assess the significance of the pairwise comparisons. Protein expression was considered differ-ential if the adjusted p value was below α and the abso-lute fold change was at least three (fold change < −3 or > +3).
In a second approach, significant differences between the two growing conditions were examined separately for each strain with unpaired two-sample t tests. All result-ing p values were adjusted for multiple comparisons by FDR [20]. Candidates of interest were chosen based on a p value of lower than 0.05 (corresponding to −log10 (p) of 1.3) and a fold change < −3 or > +3 (corresponding to log2 (rm) of <− 1.6 or >1.6). Results were summarized as Volcano plots (ratio of means vs. adjusted p value). Fold changes of all significant candidates were listed as tables for each comparison. Computations related to the statis-tical test procedures were performed in R. Afterwards, venn diagrams were used as a tool for data visualization.
GO annotation of differentially expressed proteinsWe used software tool for rapid annotation of proteins (STRAP version 1.5) for classification of biological pro-cess, cellular component and molecular function of dif-ferentially expressed proteins of Y. ruckeri [21].
qRT‑PCR analysisTotal RNA was extracted from Y. ruckeri strains grown under normal and iron-limited conditions using an RNe-asy Mini Kit (Qiagen) and included an on-column DNase digestion step. cDNA was synthesized using an iScript cDNA Synthesis Kit (BIO-RAD) with 1 µg total RNA according to the user’s manual.
PCR primers specific for the six selected genes were designed using NCBI Primer-BLAST software (Addi-tional file 1) and optimized using gradient PCRs to determine the annealing temperature and primer con-centration. qPCRs were performed in a final volume of 20 µL, which contained 4 µL of 1:20 fold diluted cDNA, 0.4 µM of each primer, 1X SYBR Green Supermix and sterile distilled water. After 5 min of cDNA denaturation at 95 °C, 38 cycles were performed at 95 °C for 30 s, 57 °C for 30 s and 72 °C for 30 s. Each qPCR was performed in biological replicates with three technical reactions using CFX96 Touch Real-Time PCR detection system (BIO-RAD).
Recombination protein A, signal recognition particle protein and 16S rRNA genes were tested to determine the suitable stability of them as reference genes. All raw Cq values from qPCR were used to assess the output of the four computational programs (geNorm, Normfinder, BestKeeper, and delta Ct method) using web-based Ref-Finder software tools [22]. Based on RefFinder, recombi-nation protein A and signal recognition particle protein were found to be most stable reference genes across normal and iron-limited samples, and thus were used for normalization of target genes. Relative quantity val-ues of each sample of each target gene were normalized with values of two reference genes (recombination pro-tein A and signal recognition particle protein) using CFX Manager Software version 3.1 (BIO-RAD) in normalized expression mode (∆∆Cq). Then, normalized values of each sample were used for statistical analysis and differ-ences between both growing conditions were analyzed using t-tests for samples with Bonferroni α-correction. All statistical analyses were conducted with SPSS ver-sion-20 software. The expression levels were considered statistically significant if p values were <0.05.
ResultsBacterial growth under iron‑limited conditionGrowth curves of Y. ruckeri strains were determined in tryptic soy broth. Three strains (CSF007-82, 7959-11 and YRNC-10) were shown to have growth culture patterns similar to each other. However, the yield of strain SP-05 was slightly lower compared to the other three strains. The iron chelator, 2,2′-bipyridyl reduced the growth and yield of all strains as the final optical density reading of
Page 5 of 13Kumar et al. Vet Res (2016) 47:100
iron-limited strains was always lower than under iron-sufficient conditions (Additional file 2).
Label‑free quantification of proteins by SWATH technologyIdentified proteins at FDR 1% with more than one pep-tide of each strain under normal and iron-limited con-ditions are given in Additional file 3. Results of t test comparisons (p < 0.05) between normal and iron-limited conditions for each strain are provided in Additional file 4. Proteins determined to be expressed differently among the four Y. ruckeri strains according to ANOVA and Tukey HSD analysis (p < 0.001) with a fold change of < −3 or > +3 are listed in supplementary data (Addi-tional files 5 and 6).
Additional file 7 shows a PCA graphical overview of the complex proteomics data of strains. PCA score plots confirmed high reproducibility of biological replicates by grouping the replicates together. The score plots of all strains under both growth conditions suggested that strain SP-05 in both conditions differs from the three strains (CSF007-82, 7959-11 and YRNC-10). However, these three strains showed minor proteomic differences between each other. Principal component scores for PC1 and PC2 were 63.5 and 14.7% (Additional file 7A) under normal condition and 60.4 and 9.8% (Additional file 7B) under iron-limited condition, respectively, showed that a major part of the overall variation in the data was cap-tured in the first two principal components. Volcano plots (Additional file 8) were used for joint visualization of effect size and corresponding significance of the differ-entially expressed proteins.
Differentially expressed proteins of Y. ruckeri strains under iron‑limited conditionIn Y. ruckeri, we identified 1395 proteins under normal and 1447 proteins under iron-limited growth conditions (Additional file 3). Sophisticated statistical evaluation revealed a total number of 61 differentially expressed proteins within the four analyzed Y. ruckeri strains (Tables 1, 2, 3). Of these, 35 proteins were upregulated and 26 proteins were downregulated. We found one uncharacterized (K7M2F1_SOYBN) soybean protein as a contaminant in our protein samples because of tryptic soy broth medium, which contains soya peptone.
As can be seen in Tables 1, 2, 3, most of the upregu-lated proteins were related to iron ion binding and trans-port and in particular to siderophore, oxidoreductase and glycolysis activities. The rest of the proteins were related to copper, nonribosomal peptide formation, protein fold-ing and lipoprotein. Similarly, most of the downregu-lated proteins were related to transport, flagellar motility, oxidoreductase, iron binding, translation and glycolysis activities.
Fifteen proteins in SP-05, nine proteins in CSF007-82, four proteins in 7959-11 and nine proteins in YRNC-10 were uniquely differentially expressed (Figure 2). When comparing all strains, we noted some proteins that were upregulated by fold changes between 10 and 96: iron(III)-binding periplasmic protein (YfuA), iron ABC transporter substrate-binding protein (YiuA), peri-plasmic chelated iron-binding protein (YfeA), hemin transport protein (HemS), ferrous iron transport pro-tein A (FeoA), ferrichrysobactin receptor, enterobac-tin synthetase component B & C (EntB and EntC) and 2,3-dihydro-2,3-dihydroxybenzoate dehydrogenase of siderophore biosynthesis (EntA) proteins, which were highly expressed in both motile and non-motile Y. ruckeri strains.
GO annotation of differentially expressed proteinsDifferentially expressed proteins of Y. ruckeri were clas-sified by Gene Ontology terms for biological processes, cellular components and molecular functions using the STRAP software. The identified proteins were associated with cellular process (50%), localization (17%), metabolic process (12%), regulation (10%), response to stimulus (5%), and interaction with cells and organisms (2%) (Fig-ure 3A). Most of the differentially expressed proteins were localized in the plasma membrane (25%), extracel-lular (6%) and cytoplasm (6%) (Figure 3B). Differentially expressed proteins were involved in catalytic (43%), binding (34%), structural molecule (5%) and molecular transducer activities; functions of 10% of the proteins remained others (Figure 3C).
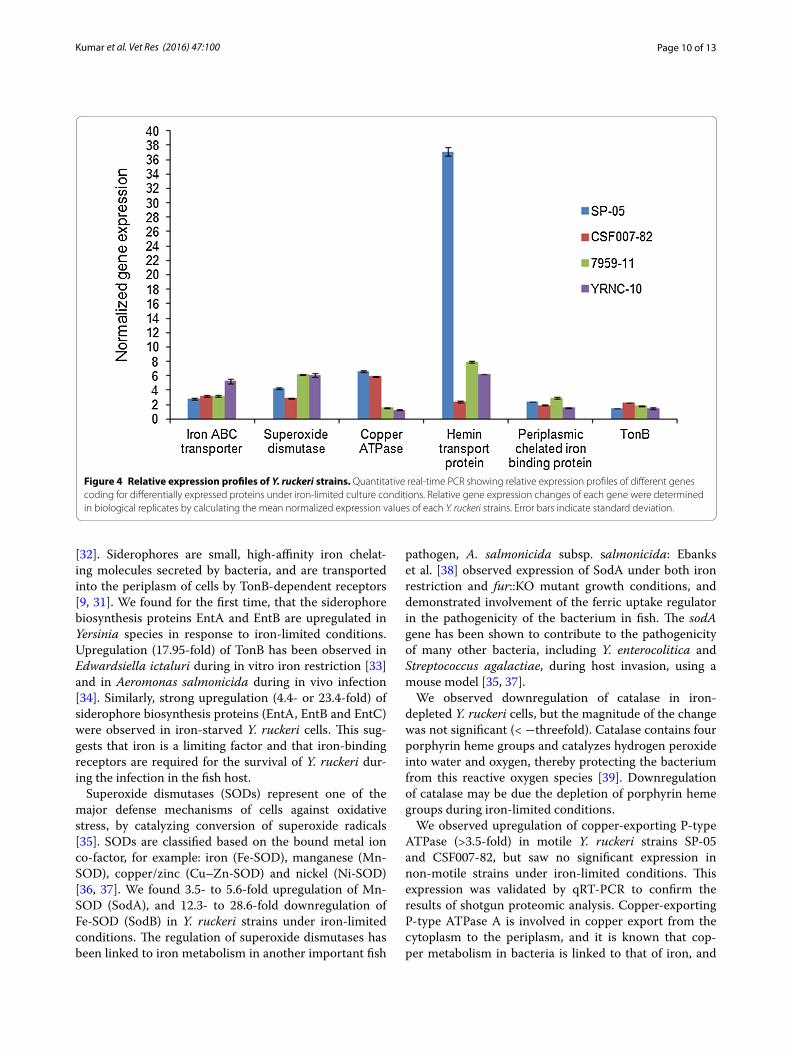
qRT‑PCRDifferentially expressed proteins identified by shotgun proteomics analysis were validated at the transcriptional level by qRT-PCR (Figure 4). We selected six genes cod-ing for differentially expressed proteins. The candidate proteins were selected on the basis of their differential expression as representative of iron binding protein, superoxide metabolic process, copper-exporting P-type ATPase, iron ion transport and siderophore biosynthe-sis. Selected genes were overexpressed (p < 0.0001) in the iron-limited samples, relative to the control samples (normal growth condition).
DiscussionLabel-free shotgun proteomics is a straightforward, fast, cost effective and broadly applicable approach to quantify proteins [23]. This approach has been used successfully for the identification and quantification of proteins in Y. pestis, the causative agents of bubonic plague [12, 13]. In the present study, we identified and quantified whole cell proteins of biotype 1 and biotype

Page 6 of 13Kumar et al. Vet Res (2016) 47:100
2 Y. ruckeri strains using a label-free, gel-free shot-gun proteomic method. We identified 1395 proteins in Y. ruckeri, with strains having between 1077 and 1161 proteins under normal growth conditions. This num-ber of proteins is consistent with that reported in other
members of the genus: 1074 proteins were identified in Y. pestis KIM5 isolated from human [12]; 1421 in Y. pes-tis 91 001 isolated from mice [13]; 1074–1078 in Y. pestis Yp1945/Yp2126 isolated from fleas [24]. In the present study, 61 differentially expressed proteins (35 up- and
Table 1 Differentially expressed proteins of Y. ruckeri strains (SP-05, CSF007-82, 7959-11 and YRNC-10)
Differentially expressed proteins of Y. ruckeri strains under iron-limited conditions (Normal versus iron-limited conditions) were sorted by function. * denotes statistically significant difference according to both t-test with FDR-adjusted p value <0.05 and fold change < −3 or > +3.
UniProt accession number
Ambiguous accession number
Protein Function SP‑05 CSF007‑82 7959‑11 YRNC‑10
Iron ion binding
C4UM10_YERRU A0A0A8VIR2_YERRU Iron(III)‑binding periplas‑mic protein
Iron ion binding 22.3* 26* 25.5* 28.5*
C4UKR8_YERRU A0A085U4N5_YERRU Iron ABC transporter substrate‑binding protein
Iron binding protein 17.4 35.0* 25.6* 18.8*
C4UFX7_YERRU A0A085U819_YERRU Periplasmic chelated iron‑binding protein yfeA
Iron ion binding 4.1* 3.8* 3.3* 3.1
C4UFT8_YERRU A0A085U7X7_YERRU Hemin receptor Iron receptor activity 4.4* 1.2 1.1 −1.0
C4UHA0_YERRU A0A085U6V7_YERRU Bacterioferritin Ferric iron binding −3.0* −10.2* −9.5* −12.5*
C4UGG9_YERRU A0A085UAC6_YERRU Iron‑sulfur cluster assem‑bly scaffold protein IscU
Iron‑sulfur cluster bind‑ing
−3.7* −3.8* −3.6* −3.6*
Transport
C4UFT9_YERRU A0A085U7X8_YERRU Hemin transport protein hemS
Iron ion transport 96.2* 20.6* 17.3 13.6*
C4UH16_YERRU A0A085U729_YERRU Ferrous iron transport protein A
Ferrous iron import 4.2 6.8* 7.9* 6.6*
C4UH15_YERRU A0A0A5FIY5_YERRU Ferrous iron transport protein B
Ferrous iron transport −1.1 2.5 5.1* 2.1
C4UFU0_YERRU A0A085U7X9_YERRU Hemin‑binding periplas‑mic protein hmuT
Iron transport 8.6 2.5 2.5 3.4*
A0A094SXA9_YERRU A0A085UBN5_YERRU Fe(3+) ions import ATP‑binding protein FbpC
Ferric‑transporting ATPase activity
2.7 3.4 3.1* 2.5
C4UKR5_YERRU A0A0A8VKF9_YERRU TonB‑dependent recep‑tor plug
Transport/Receptor activity
7.7 9.5* 4.5* 1.3
C4UJT7_YERRU A0A085U605_YERRU Bacterial extracellular solute‑binding s, 3 family protein
Transporter activity 2.5 2.4 3.2* 3.1*
A0A094TKG1_YERRU A0A085U820_YERRU ABC transporter family protein
Transmembrane trans‑port
3.9* 3.0 2.9 2.5
A0A094SUN9_YERRU A0A085U4N3_YERRU ABC transporter family protein
Transmembrane trans‑port
5.4 4.7* 5.8* 6.8*
A0A094SST2_YERRU A0A085U3C5_YERRU ABC transporter family protein
Transmembrane trans‑port
3.2* 2.8 4.8 2.9
C4UK69_YERRU A0A085U6M5_YERRU Sec‑independent protein translocase protein TatA
Transporter activity −1.4 −1.6 −6.2 −7.0*
C4UG32_YERRU A0A085U4W0_YERRU NADH dehydrogenase (Quinone), D subunit
Transport −3.5* −3.0* −1.6 −1.7
C4UHI5_YERRU A0A085U5C9_YERRU Acriflavine resistance protein A
Drug transmembrane transport
−3.7* −1.9 −1.3 −2.6
C4UMG6_YERRU A0A085U472_YERRU Cytochrome d ubiquinol oxidase subunit 1
Electron transport cou‑pled proton transport
−3.7* −1.6 1.2 −1.4
C4UEW4_YERRU A0A085U499_YERRU d‑Galactose‑binding periplasmic protein
Carbohydrate transport −1.2 −3.3* −2.6 −2.2

Page 7 of 13Kumar et al. Vet Res (2016) 47:100
26 down-regulated) were identified in vitro in Y. ruck-eri strains (FDR-adjusted p value <0.05 and fold change < −3 or > +3) in response to iron-restriction conditions. The function of these proteins included iron binding,
molecular transduction, as well as catalytic and struc-tural molecule activities.
In both motile and non-motile Y. ruckeri strains, we observed strong upregulation of iron-binding proteins
Table 2 Differentially expressed proteins of Y. ruckeri strains (SP-05, CSF007-82, 7959-11 and YRNC-10)
Differentially expressed proteins details as in Table 1.
UniProt accession number
Ambiguous accession number
Protein Function SP‑05 CSF007‑82 7959‑11 YRNC‑10
Siderophore
C4UM82_YERRU A0A085U3B8_YERRU Enterobactin synthetase component B
Siderophore biosyn‑thesis
23.4* 18.7* 19.2* 10.5*
C4UM84_YERRU A0A0A8VG89_YERRU Enterobactin synthetase component C
Biosynthetic process 4.4* 5.2* 6.2* 4.8
A0A0A8VLD7_YERRU A0A085U3B7_YERRU 2,3‑dihydro‑2,3‑di‑hydroxybenzoate dehydrogenase of siderophore biosynthe‑sis
Siderophore biosyn‑thesis
13.8* 19.2* 16.5* 22.7*
C4UM94_YERRU A0A085U3D0_YERRU Ferrichrysobactin recep‑tor
Siderophore transport 11.2* 10.1* 14.4* 14.9*
A0A0A8VMF7_YERRU A0A085U3B9_YERRU 2,3‑dihydroxybenzoate‑AMP ligase
Siderophore biosyn‑thesis
2.8 3.7 5.2* 3.9*
Copper
C4UHL3_YERRU A0A0A8VB61_YERRU Copper‑exporting P‑type ATPase A
Copper‑exporting ATPase activity
3.8* 3.5* 2.8 2.3
C4UI46_YERRU A0A085U353_YERRU Blue copper oxidase CueO
Copper ion binding 2.2 3* 2.7 2.8
Oxidation reduction
C4UGW6_YERRU A0A0A8VE22_YERRU Superoxide dismutase Mn
Superoxide dismutase activity
4.6 5.6* 5.5* 3.5*
C4UFR4_YERRU A0A085U7V3_YERRU Superoxide dismutase Fe Superoxide dismutase activity
−28.6* −13.9* −14.3* −12.3*
C4ULL1_YERRU A0A085U5T3_YERRU Glutaredoxin Electron carrier activity 16.6 3.5* 3.8* 7.4*
C4UJD2_YERRU A0A085U8M0_YERRU NAD(P)H nitroreductase ydjA
Oxidoreductase 2.5 3.2* 2.8 2.7
C4UFI5_YERRU A0A085U7N0_YERRU NAD(P) transhydroge‑nase subunit beta
NADP binding 2.1 3.4* 2.2 1.1
C4UKC5_YERRU A0A085U882_YERRU FAD‑binding 9 sidero‑phore‑interacting domain protein
Oxidoreductase 4.2 8.6 5.7* 5.8*
C4UNK9_YERRU A0A085U9C9_YERRU Peptide methionine sulfoxide reductase msrA
Peptide‑methionine (S)‑S‑oxide reductase activity
−1.1 3.3* 2.0 2.0
C4UMV1_YERRU A0A085U9H1_YERRU Fumarate reductase flavoprotein subunit
FAD binding −3.3* −2.5 −2.2 −2.0
C4UKS8_YERRU A0A085U4P6_YERRU Molybdopterin guanine dinucleotide‑contain‑ing S/N‑oxide reduc‑tases family protein
Molybdenum ion binding
−4.3* −2.6 −2.4 −1.9
Flagella
A0A094V4E9_YERRU A0A085U8W7_YERRU Flagellin Structural molecule activity
1.1 −4.2* 1.4 1.5
A0A0A8VDU4_YERRU R4NIZ0_YERRU Flagellar biosynthesis protein FliC
Structural molecule activity
−1.1 −5.3* 1.3 −1.1
C4UKI3_YERRU A0A085U8Z4_YERRU Flagellar L‑ring family protein
Motor activity −1.0 −2.7 −3.8 −4.7*
A0A094TLS7_YERRU A0A085U8Y5_YERRU Flagellar motor switch protein FliN
Motor activity 1.1 −1.2 −3.6* 1.2
Page 8 of 13Kumar et al. Vet Res (2016) 47:100
(YfuA, YiuA and YfeA; 3.3- to 35-fold) and iron-binding transporters (HemS and Feo: 6.6- to 96.2-fold) (Tables 1, 2, 3). Previous work has shown in Y. pestis in a mouse model that Yfu and Yiu function as part of an iron uptake system, but are not involved in virulence [25]. The YfeA system, which transports iron and manganese, is
required for the full virulent phenotype of Y. pestis [26]. Upregulation (1.6- to 4.5-fold) of iron-binding proteins YfuA, YiuA and YfeA, has been reported in Y. pestis and Y. enterocolitica in response to iron starvations [14, 15]. This is consistent with the results from our in vitro Y. ruckeri. Hemin transport protein HemS is involved in the
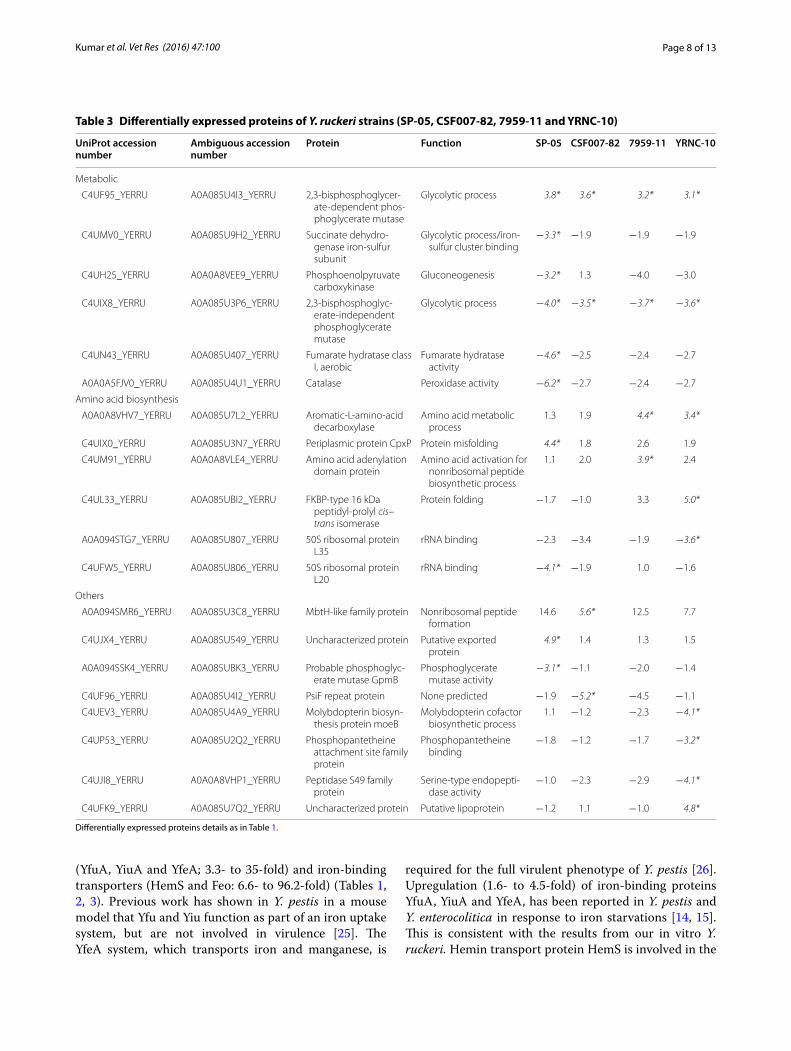
Table 3 Differentially expressed proteins of Y. ruckeri strains (SP-05, CSF007-82, 7959-11 and YRNC-10)
Differentially expressed proteins details as in Table 1.
UniProt accession number
Ambiguous accession number
Protein Function SP‑05 CSF007‑82 7959‑11 YRNC‑10
Metabolic
C4UF95_YERRU A0A085U4I3_YERRU 2,3‑bisphosphoglycer‑ate‑dependent phos‑phoglycerate mutase
Glycolytic process 3.8* 3.6* 3.2* 3.1*
C4UMV0_YERRU A0A085U9H2_YERRU Succinate dehydro‑genase iron‑sulfur subunit
Glycolytic process/iron‑sulfur cluster binding
−3.3* −1.9 −1.9 −1.9
C4UH25_YERRU A0A0A8VEE9_YERRU Phosphoenolpyruvate carboxykinase
Gluconeogenesis −3.2* 1.3 −4.0 −3.0
C4UIX8_YERRU A0A085U3P6_YERRU 2,3‑bisphosphoglyc‑erate‑independent phosphoglycerate mutase
Glycolytic process −4.0* −3.5* −3.7* −3.6*
C4UN43_YERRU A0A085U407_YERRU Fumarate hydratase class I, aerobic
Fumarate hydratase activity
−4.6* −2.5 −2.4 −2.7
A0A0A5FJV0_YERRU A0A085U4U1_YERRU Catalase Peroxidase activity −6.2* −2.7 −2.4 −2.7
Amino acid biosynthesis
A0A0A8VHV7_YERRU A0A085U7L2_YERRU Aromatic‑L‑amino‑acid decarboxylase
Amino acid metabolic process
1.3 1.9 4.4* 3.4*
C4UIX0_YERRU A0A085U3N7_YERRU Periplasmic protein CpxP Protein misfolding 4.4* 1.8 2.6 1.9
C4UM91_YERRU A0A0A8VLE4_YERRU Amino acid adenylation domain protein
Amino acid activation for nonribosomal peptide biosynthetic process
1.1 2.0 3.9* 2.4
C4UL33_YERRU A0A085UBI2_YERRU FKBP‑type 16 kDa peptidyl‑prolyl cis–trans isomerase
Protein folding −1.7 −1.0 3.3 5.0*
A0A094STG7_YERRU A0A085U807_YERRU 50S ribosomal protein L35
rRNA binding −2.3 −3.4 −1.9 −3.6*
C4UFW5_YERRU A0A085U806_YERRU 50S ribosomal protein L20
rRNA binding −4.1* −1.9 1.0 −1.6
Others
A0A094SMR6_YERRU A0A085U3C8_YERRU MbtH‑like family protein Nonribosomal peptide formation
14.6 5.6* 12.5 7.7
C4UJX4_YERRU A0A085U549_YERRU Uncharacterized protein Putative exported protein
4.9* 1.4 1.3 1.5
A0A094SSK4_YERRU A0A085UBK3_YERRU Probable phosphoglyc‑erate mutase GpmB
Phosphoglycerate mutase activity
−3.1* −1.1 −2.0 −1.4
C4UF96_YERRU A0A085U4I2_YERRU PsiF repeat protein None predicted −1.9 −5.2* −4.5 −1.1
C4UEV3_YERRU A0A085U4A9_YERRU Molybdopterin biosyn‑thesis protein moeB
Molybdopterin cofactor biosynthetic process
1.1 −1.2 −2.3 −4.1*
C4UP53_YERRU A0A085U2Q2_YERRU Phosphopantetheine attachment site family protein
Phosphopantetheine binding
−1.8 −1.2 −1.7 −3.2*
C4UJI8_YERRU A0A0A8VHP1_YERRU Peptidase S49 family protein
Serine‑type endopepti‑dase activity
−1.0 −2.3 −2.9 −4.1*
C4UFK9_YERRU A0A085U7Q2_YERRU Uncharacterized protein Putative lipoprotein −1.2 1.1 −1.0 4.8*

Page 9 of 13Kumar et al. Vet Res (2016) 47:100
uptake of hemin-containing iron. Hemolysin activator protein was identified as an in vivo induced extracellular cytolysin in Y. ruckeri [27] and was implicated in the vir-ulence and cytotoxicity of Y. ruckeri [28]. A ferrous iron transport system plays a role in the acquisition of ferrous
iron during intracellular growth of the bacterium and is composed of three proteins, FeoA, FeoB and FeoC [29]. Both FeoA and FeoB are essential components of the iron acquisition system in Y. pestis [30]. Upregulation of FeoA and FeoB proteins under iron-starvation conditions sug-gests that the Feo system is involved in the iron acqui-sition system of Y. ruckeri during the infection process, however, its significance for pathogenesis is unknown. Based on the results of the present study, it appears that the iron binding proteins/transporters are upregulated in response to iron-scarcity. Because iron is often the lim-iting factor during the infectious process, this has likely clinical implications regarding the survival of the bacte-rium inside the host and the establishment of disease by both motile and non-motile Y. ruckeri strains.
We found that ferrichrysobactin and TonB-dependent iron-binding receptors were upregulated 4.5- and 14.9-fold, respectively, in Y. ruckeri strains under iron-limited conditions. Notably, in Y. ruckeri, both of these receptors have been shown to be upregulated during the infection process in fish [27]. TonB-dependent receptors are outer membrane receptors of Gram-negative bacteria involved in active transport of a number of molecules, including the uptake of siderophores [9, 31]. The role of the tonB gene has been examined in Y. pestis, where utilization of siderophore and uptake of hemin are TonB-dependent
Figure 2 Venn diagram showing the number of differentially expressed proteins identified in Y. ruckeri strains. The number of unique or shared proteins of each strain is indicated in each set or subset.
Figure 3 Classification of differentially expressed proteins of Y. ruckeri. Proteins were classified by GO terms for biological processes, cellular components and molecular functions using STRAP. A Biological process, B cellular component, and C molecular function.
Page 10 of 13Kumar et al. Vet Res (2016) 47:100
[32]. Siderophores are small, high-affinity iron chelat-ing molecules secreted by bacteria, and are transported into the periplasm of cells by TonB-dependent receptors [9, 31]. We found for the first time, that the siderophore biosynthesis proteins EntA and EntB are upregulated in Yersinia species in response to iron-limited conditions. Upregulation (17.95-fold) of TonB has been observed in Edwardsiella ictaluri during in vitro iron restriction [33] and in Aeromonas salmonicida during in vivo infection [34]. Similarly, strong upregulation (4.4- or 23.4-fold) of siderophore biosynthesis proteins (EntA, EntB and EntC) were observed in iron-starved Y. ruckeri cells. This sug-gests that iron is a limiting factor and that iron-binding receptors are required for the survival of Y. ruckeri dur-ing the infection in the fish host.
Superoxide dismutases (SODs) represent one of the major defense mechanisms of cells against oxidative stress, by catalyzing conversion of superoxide radicals [35]. SODs are classified based on the bound metal ion co-factor, for example: iron (Fe-SOD), manganese (Mn-SOD), copper/zinc (Cu–Zn-SOD) and nickel (Ni-SOD) [36, 37]. We found 3.5- to 5.6-fold upregulation of Mn-SOD (SodA), and 12.3- to 28.6-fold downregulation of Fe-SOD (SodB) in Y. ruckeri strains under iron-limited conditions. The regulation of superoxide dismutases has been linked to iron metabolism in another important fish
pathogen, A. salmonicida subsp. salmonicida: Ebanks et al. [38] observed expression of SodA under both iron restriction and fur::KO mutant growth conditions, and demonstrated involvement of the ferric uptake regulator in the pathogenicity of the bacterium in fish. The sodA gene has been shown to contribute to the pathogenicity of many other bacteria, including Y. enterocolitica and Streptococcus agalactiae, during host invasion, using a mouse model [35, 37].
We observed downregulation of catalase in iron-depleted Y. ruckeri cells, but the magnitude of the change was not significant (< −threefold). Catalase contains four porphyrin heme groups and catalyzes hydrogen peroxide into water and oxygen, thereby protecting the bacterium from this reactive oxygen species [39]. Downregulation of catalase may be due the depletion of porphyrin heme groups during iron-limited conditions.
We observed upregulation of copper-exporting P-type ATPase (>3.5-fold) in motile Y. ruckeri strains SP-05 and CSF007-82, but saw no significant expression in non-motile strains under iron-limited conditions. This expression was validated by qRT-PCR to confirm the results of shotgun proteomic analysis. Copper-exporting P-type ATPase A is involved in copper export from the cytoplasm to the periplasm, and it is known that cop-per metabolism in bacteria is linked to that of iron, and
Figure 4 Relative expression profiles of Y. ruckeri strains. Quantitative real‑time PCR showing relative expression profiles of different genes coding for differentially expressed proteins under iron‑limited culture conditions. Relative gene expression changes of each gene were determined in biological replicates by calculating the mean normalized expression values of each Y. ruckeri strains. Error bars indicate standard deviation.

Page 11 of 13Kumar et al. Vet Res (2016) 47:100
that some siderophores interact with copper [40]. A link between copper and siderophores has been shown in Escherichia coli [41]. We are the first to report the upreg-ulation of copper-exporting P-type ATPase in Yersinia species in response to iron-limited conditions, however the relevance of this to pathogenicity is unknown as there is a paucity of knowledge on copper metabolism in Yers-inia species.
Under iron-limited conditions, we observed 3.1- to 5.8-fold upregulation of enzymes involved in glycolysis (2,3-bisphosphoglycerate-dependent phosphoglycerate mutase) and oxidoreduction (glutaredoxin and FAD-binding 9 siderophore-interacting domain protein), sug-gesting an increased role of these enzymes in metabolic processes when the cells are starved of iron. Furthermore, we saw down-regulation other metabolic enzymes (fuma-rate reductase, fumarate hydratase, phosphoenolpyruvate carboxykinase and molybdopterin). This was expected, as these enzymes are dependent on iron-sulfur clusters or other iron cofactors, and is consistent with previous observations of downregulation of metabolic proteins in iron-starved Y. pestis cells [14].
Cellular iron depletion can suppress expression levels of iron-dependent proteins [9, 31]. We observed strong downregulation of iron-dependent proteins, including bacterioferritin (−3 to −12.5-fold) and iron-sulfur clus-ter assembly scaffold protein IscU (−3.6 to −3.8-fold) in Y. ruckeri strains under iron starvation conditions. Bacte-rioferritin is a main cytoplasmic iron storage protein and IscU provides iron for iron-sulfur cluster assembly [9, 31]. These observations are consistent with a shift in bac-terial metabolic activities to iron-independent biochemi-cal pathways when the supply of iron ion is limited.
We observed −3.6 to −5.3-fold downregulation of fla-gellar proteins including FliC, FlgH and FliN in Y. ruckeri strains under iron-limited conditions. Previous muta-tional research conducted by Evenhuis et al. [42] showed that the absence of flagellar motility does not affect Y. ruckeri virulence, and that flagellin expression is not required for production of innate immune response in fish [43], as suggested by the clinical importance of non-motile isolates of the bacterium [44].
Shotgun proteomics revealed minor protein differ-ences among motile and non-motile Y. ruckeri strains under normal and iron-limited growth conditions, con-sistent with observations by Huang et al. [45, 46] who used pulsed-field gel electrophoresis and fatty acid pro-files. In the present study, PCA score plots (Additional file 7) highlight major protein differences between the European motile strain (SP-05) and USA motile strain (CSF007-82). These differences may be due to high genetic diversity and epidemic population structure as seen by multilocus sequence typing [47].
In conclusion, this is the first detailed description of dif-ferentially expressed proteins in Y. ruckeri strains cultured in iron limited conditions, as revealed by shotgun prot-eomic analysis. It is likely that the changes in expression of iron-binding proteins, iron ion transporters/receptors, siderophore biosynthesis proteins and manganese-bind-ing superoxide dismutase play an important role in the survival of Y. ruckeri inside the host. These findings might provide the basis for the development of novel control methods for enteric redmouth disease in fish.
AbbreviationsERM: enteric redmouth disease; OMPs: outer membrane proteins; 2D‑PAGE: two‑dimensional gel electrophoresis; MALDI‑TOF‑MS: matrix‑assisted laser desorption/ionization mass spectrometry; LC‑MS: liquid chromatography–mass spectrometry; FDR: false discovery rate; SWATH: sequential window acquisition of all theoretical spectra; IDA: information dependent data acquisi‑tion; PCA: principal component analysis; Feo: ferrous iron transport; SOD: superoxide dismutase.
Competing interestsThe authors declare that they have no competing interests.
Additional files
Additional file 1. List of quantitative real-time PCR primers. PCR primers specific for the selected genes were designed using NCBI Primer‑BLAST software and used in this study.
Additional file 2. Growth curves of Yersinia ruckeri strains. Duplicate bacterial strains were grown in tryptic soy broth under normal and iron‑limited conditions at 22 °C. Growth was monitored at different time points by determining the optical density at 600 nm. Error bars indicate standard deviation. ILC: Iron limited culture.
Additional file 3. Total number of identified proteins of Y. ruckeri strains. Number of proteins was identified at FDR 1% with more than one peptide.
Additional file 4. Total number of differentially expressed proteins of Y. ruckeri strains (strain versus strain). Differentially expressed proteins were assessed according to ANOVA and Tukey HSD (p < 0.001) with a fold change < −3 or > +3.
Additional file 5. Fold changes of differentially expressed proteins of Y. ruckeri strains compared to each other under normal culture conditions. ANOVA was performed for UniProt database searches. * denotes statistically significant difference according to t‑test with FDR‑adjusted p value < 0.05 and fold change < −3 or > +3.
Additional file 6. Fold changes of differentially expressed proteins of Y. ruckeri strains compared to each other under iron-limited con-ditions. ANOVA was performed for UniProt database searches. * denotes statistically significant difference according to t test with FDR‑adjusted p value <0.05 and fold change < −3 or > +3.
Additional file 7. Principal component analysis score plots of Yersinia ruckeri strains. Grouping of biological replicates shows good reproducibility of technical replicates for each sample. The score plots show that strain SP‑05 differs from the three strains under both normal and iron‑limited conditions, which show minor protein differences to each other. (A) PCA score plot under normal condition, (B) PCA score plot under iron‑limited condition.
Additional file 8. Volcano plots of Y. ruckeri strains. Volcano plots showing the distribution of the ratios (log2) versus the FDR adjusted p value (−log10) for all proteins identified under iron‑limited condition. Dif‑ferentially expressed proteins are shown as black circles. (A) Motile strain CSF007‑82, (B) Non‑motile strain 7959‑11.

Page 12 of 13Kumar et al. Vet Res (2016) 47:100
Authors’ contributionsGK and MEM conceived and designed the experiment. GK performed the experiment, extracted the whole cell proteins, synthesized the c‑DNA, designed and optimized the primers, performed the real time PCR, analyzed the data and drafted the manuscript. KH and ERF contributed in the LC–MS/MS and helped in quantification of proteins. MA and ME contributed in the R statistics analysis. SML, TW, ERF and MEM revised the manuscript. All authors read and approved the final manuscript.
AcknowledgementsThis study was funded by the Austrian Science Fund (FWF) project no. P 27489‑B22 to Gokhlesh Kumar.
Author details1 Clinical Division of Fish Medicine, Department for Farm Animals and Veteri‑nary Public Health, University of Veterinary Medicine, Vienna, Austria. 2 VetCore Facility for Research/Proteomics Unit, University of Veterinary Medicine, Vienna, Austria. 3 Medizinisches Proteom‑Center, Ruhr‑University Bochum, Bochum, Germany. 4 National Center for Cool and Cold Water Aquaculture, Kearneysville, USA.
Received: 18 July 2016 Accepted: 9 September 2016
References 1. Horne MT, Barnes AC (1999) Enteric redmouth disease (Yersinia ruckeri). In:
Woo PTK, Bruno DW (eds) Fish diseases and disorders. Viral, bacterial and fungal infections. CABI Publishing, Wallingford, pp 445–477
2. Ross AJ, Rucker RR, Ewing WH (1966) Description of a bacterium associ‑ated with redmouth disease of rainbow trout (Salmo gairdneri). Can J Microbiol 12:763–770
3. Welch TJ, Verner‑Jeffreys DW, Dalsgaard I, Wiklund T, Evenhuis JP, Cabrera JA, Hinshaw JM, Drennan JD, LaPatra SE (2011) Independent emergence of Yersinia ruckeri biotype 2 in the United States and Europe. Appl Environ Microbiol 77:3493–3499
4. Kumar G, Menanteau‑Ledouble S, Saleh M, El‑Matbouli M (2015) Yersinia ruckeri, the causative agent of enteric redmouth disease in fish. Vet Res 46:103
5. Davies RL, Frerichs GN (1989) Morphological and biochemical differences among isolates of Yersinia ruckeri obtained from wide geographical areas. J Fish Dis 12:357–365
6. Romalde JL, Toranzo AE (1993) Pathological activities of Yersinia ruckeri, the enteric redmouth (ERM) bacterium. FEMS Microbiol Lett 112:291–300
7. Austin DA, Robertson PAW, Austin B (2003) Recovery of a new biogroup of Yersinia ruckeri from diseased rainbow trout (Oncorhynchus mykiss, Walbaum). Syst Appl Microbiol 26:127–131
8. Strom‑Bestor M, Mustamaki N, Heinikainen S, Hirvela‑Koski V, Verner‑Jeffreys D, Wiklund T (2010) Introduction of Yersinia ruckeri biotype 2 into Finnish fish farms. Aquaculture 308:1–5
9. Messenger AJM, Barclay R (1983) Bacteria, iron and pathogenicity. Bio‑chem Mol Biol Educ 11:54–63
10. Davies RL (1991) Yersinia ruckeri produces four iron‑regulated outer mem‑brane proteins but does not produce detectable siderophores. J Fish Dis 14:563–570
11. Tinsley JW, Lyndon AR, Austin B (2011) Antigenic and cross‑protection studies of biotype 1 and biotype 2 isolates of Yersinia ruckeri in rainbow trout, Oncorhynchus mykiss (Walbaum). J Appl Microbiol 111:8–16
12. Hixson KK, Adkins JN, Baker SE, Moore RJ, Chromy BA, Smith RD, McCutchen‑Maloney SL, Lipton MS (2006) Biomarker candidate identifi‑cation in Yersinia pestis using organism‑wide semiquantitative proteom‑ics. J Proteome Res 5:3008–3017
13. Zhou L, Ying W, Han Y, Chen M, Yan Y, Li L, Zhu Z, Zheng Z, Jia W, Yang R, Qian XJ (2012) A proteome reference map and virulence factors analysis of Yersinia pestis 91001. Proteomics 75:894–907
14. Pieper R, Huang ST, Parmar PP, Clark DJ, Alami H, Fleischmann RD, Perry RD, Peterson SN (2010) Proteomic analysis of iron acquisition, metabolic and regulatory responses of Yersinia pestis to iron starvation. BMC Micro‑biol 10:30
15. Kanaujia PK, Bajaj P, Kumar S, Singhal N, Virdi JS (2015) Proteomic analysis of Yersinia enterocolitica biovar 1A under iron‑rich and iron‑poor condi‑tions indicate existence of efficiently regulated mechanisms of iron homeostasis. J Proteom 124:39–49
16. Gibello A, Blanco MM, Moreno MA, Cutuli MT, Domenech A, Domínguez L, Fernández‑Garayzábal JF (1999) Development of a PCR assay for detec‑tion of Yersinia ruckeri in tissues of inoculated and naturally infected trout. Appl Environ Microbiol 65:346–350
17. Domon B, Aebersold R (2006) Mass spectrometry and protein analysis. Science 312:212
18. McQueen P, Spicer V, Schellenberg J, Krokhin O, Sparling R, Levin D, Wilkins JA (2015) Whole cell, label free protein quantitation with data independent acquisition: quantitation at the MS2 level. Proteomics 1:16–24
19. R Core Team (2015) R: a language and environment for statistical com‑puting. R Foundation for Statistical Computing, Vienna. R version 3.2.2. https://www.R‑project.org/
20. Benjamini Y, Hochberg Y (1995) Controlling the false discovery rate: a practical and powerful approach to multiple testing. J R Stat Soc B 57:289–300
21. Bhatia VN, Perlman DH, Costello CE, McComb ME (2009) Software tool for researching annotations of proteins: open‑source protein annotation software with data visualization. Anal Chem 81:9819–9823
22. Xie F, Xiao P, Chen D, Xu L, Zhang B (2012) miRDeepFinder: a miRNA analysis tool for deep sequencing of plant small RNAs. Plant Mol Biol 80:75–84
23. Li Z, Adams RM, Chourey K, Hurst GB, Hettich RL, Pan C (2012) System‑atic comparison of label‑free, metabolic labeling, and isobaric chemical labeling for quantitative proteomics on LTQ Orbitrap Velos. J Proteome Res 11:1582–1590
24. Leiser OP, Merkley ED, Clowers BH, Deatherage Kaiser BL, Lin A, Hutchison JR, Melville AM, Wagner DM, Keim PS, Foster JT, Kreuzer HW (2015) Investigation of Yersinia pestis laboratory adaptation through a combined genomics and proteomics approach. PLoS One 10:e0142997
25. Kirillina O, Bobrov AG, Fetherston JD, Perry RD (2006) Hierarchy of iron uptake systems: Yfu and Yiu are functional in Yersinia pestis. Infect Immun 74:6171–6178
26. Bearden SW, Perry RD (1999) The Yfe system of Yersinia pestis transports iron and manganese and is required for full virulence of plague. Mol Microbiol 32:403–414
27. Fernandez L, Marquez I, Guijarro JA (2004) Identification of specific in vivo‑induced (ivi) genes in Yersinia ruckeri and analysis of ruckerbactin, a catecholate siderophore iron acquisition system. Appl Environ Micro‑biol 70:5199–5207
28. Fernández L, Prieto M, Guijarro JA (2007) The iron‑ and temperature‑reg‑ulated haemolysin YhlA is a virulence factor of Yersinia ruckeri. Microbiol‑ogy 153:483–489
29. Perry RD, Mier I Jr, Fetherston JD (2007) Roles of the Yfe and Feo trans‑porters of Yersinia pestis in iron uptake and intracellular growth. Biometals 20:699–703
30. Fetherston JD, Mier I Jr, Truszczynska H, Perry RD (2012) The Yfe and Feo transporters are involved in microaerobic growth and virulence of Yersinia pestis in bubonic plague. Infect Immun 80:3880–3891
31. Braun V (2001) Iron uptake mechanisms and their regulation in patho‑genic bacteria. Int J Med Microbiol 291:67–79
32. Perry RD, Shah J, Bearden SW, Thompson JM, Fetherston JD (2003) Yersinia pestis TonB: role in iron, heme, and hemoprotein utilization. Infect Immun 71:4159–4162
33. Dumpala PR, Peterson BC, Lawrence ML, Karsi A (2015) Identification of differentially abundant proteins of Edwardsiella ictaluri during iron restric‑tion. PLoS One 10:e0132504
34. Menanteau‑Ledouble S, Soliman H, Kumar G, El‑Matbouli M (2014) Use of in vivo induced antigen technology to identify genes from Aeromonas salmonicida subsp. salmonicida that are specifically expressed during infection of the rainbow trout Oncorhynchus mykiss. BMC Vet Res 10:298
35. Roggenkamp A, Bittner T, Leitritz L, Sing A, Heesemann J (1997) Contribu‑tion of the Mn‑cofactored superoxide dismutase (SodA) to the virulence of Yersinia enterocolitica serotype O8. Infect Immun 65:4705–4710
36. Benov LT, Fridovich I (1994) Escherichia coli expresses a copper‑ and zinc‑containing superoxide dismutase. J Biol Chem 269:25310–25314
Page 13 of 13Kumar et al. Vet Res (2016) 47:100
• We accept pre-submission inquiries
• Our selector tool helps you to find the most relevant journal
• We provide round the clock customer support
• Convenient online submission
• Thorough peer review
• Inclusion in PubMed and all major indexing services
• Maximum visibility for your research
Submit your manuscript atwww.biomedcentral.com/submit
Submit your next manuscript to BioMed Central and we will help you at every step:
37. Poyart C, Pellegrini E, Gaillot O, Boumaila C, Baptista M, Trieu‑Cuot P (2001) Contribution of Mn‑cofactored superoxide dismutase (SodA) to the virulence of Streptococcus agalactiae. Infect Immun 69:5098–5106
38. Ebanks RO, Goguen M, Knickle L, Dacanay A, Leslie A, Ross NW, Pinto DM (2013) Analysis of a ferric uptake regulator (Fur) knockout mutant in Aeromonas salmonicida subsp. salmonicida. Vet Microbiol 162:831–841
39. Chelikani P, Fita I, Loewen PC (2004) Diversity of structures and properties among catalases. Cell Mol Life Sci 61:192–208
40. Gaëlle P, Amélie G, Julie P, Mourad S, Charles MD (2013) Iron, copper, zinc, and manganese transport and regulation in pathogenic Enterobacteria: correlations between strains, site of infection and the relative importance of the different metal transport systems for virulence. Front Cell Infect Microbiol 3:90
41. Grass G, Thakali K, Klebba PE, Thieme D, Müller A, Wildner GF, Rensing C (2004) Linkage between catecholate siderophores and the multicopper oxidase CueO in Escherichia coli. J Bacteriol 186:5826–5833
42. Evenhuis JP, Lapatra SE, Verner‑Jeffreys DW, Dalsgaard I, Welch TJ (2009) Identification of flagellar motility genes in Yersinia ruckeri by transposon mutagenesis. Appl Environ Microbiol 75:6630–6633
43. Wiens GD, Vallejo RL (2010) Temporal and pathogen‑load dependent changes in rainbow trout (Oncorhynchus mykiss) immune response traits following challenge with biotype 2 Yersinia ruckeri. Fish Shellfish Immunol 29:639–647
44. Fouz B, Zarza C, Amaro C (2006) First description of non‑motile Yersinia ruckeri serovar I strains causing disease in rainbow trout, Oncorhynchus mykiss (Walbaum), cultured in Spain. J Fish Dis 29:339–346
45. Huang Y, Runge M, Michael GB, Schwarz S, Jung A, Steinhagen D (2013) Biochemical and molecular heterogeneity among isolates of Yersinia ruckeri from rainbow trout (Oncorhynchus mykiss, Walbaum) in North West Germany. BMC Vet Res 9:215
46. Huang Y, Ryll M, Walker C, Jung A, Runge M, Steinhagen D (2014) Fatty acid composition of Yersinia ruckeri isolates from aquaculture ponds in northwestern Germany. Berl Munch Tierarztl Wochenschr 127:123–128
47. Bastardo A, Ravelo C, Romalde JL (2012) Multilocus sequence typing reveals high genetic diversity and epidemic population structure for the fish pathogen Yersinia ruckeri. Environ Microbiol 14:1888–1897