
Short-term ï¬tness and long-term population trends in the orchid
13
Short-term fitness and long-term population trends in the orchid Anacamptis morio Gitte Hornemann • Stefan G. Michalski • Walter Durka Received: 19 January 2012 / Accepted: 13 August 2012 / Published online: 26 August 2012 Ó Springer Science+Business Media B.V. 2012 Abstract The conservation of endangered species critically depends on the understanding to which degree short-term fitness and long-term trends are affected by intrinsic local conditions and external global dynamics. However, studies combining long- term demographic data with population level analyses of site conditions, genetic variation, and reproduction as well as with climatic data are still rare. Here we studied the endangered orchid Anacamptis morio, representative for species with a sub-mediterranean distribution. For populations at the northern range edge, we combined long-term monitoring data (1977–2010) with climatic data and analyzed reproductive fitness components, genetic variation, and abiotic site condi- tions. Reproduction was generally low as expected from the deceptive pollination system, and was posi- tively influenced by population size and xerothermic site quality. The majority of populations showed a positive population trend, which was paralleled by an increase in spring temperature and positively affected by site quality. High levels of genetic variation were found in the populations which were at gene flow-drift equilibrium. A. morio may profit from increasing spring temperatures because of increased reproductive output. Nevertheless, whether climate change results in fitness increase or not may depend on the maintenance and provision of optimal site quality, i.e., xerothermic and nutrient poor conditions. Keywords Reproduction Fitness Genetic variation Site quality Climate change Weather Introduction The conservation of endangered plant species and declining populations critically depends on the under- standing of fitness determinants (Oostermeijer et al. 2003). However, fitness measures at population and individual level may vary among years depending on actual biotic and abiotic environmental conditions (Morris et al. 2008), cumulative fitness across larger time scales eventually determines the long-term population trend. Hence, the consequences of site and population characteristics, such as abiotic condi- tions, population size (Lienert et al. 2002) as well as long-term dynamics such as climatic changes (Feehan et al. 2009) need to be taken into account to assess the sustainability of a population (Magnuson 1990; Oostermeijer et al. 2003). Moreover, the relative contri- bution of different life-history processes and fitness determinants to long-term performance varies across species (Silvertown et al. 1993; Jongejans et al. 2010) Electronic supplementary material The online version of this article (doi:10.1007/s11258-012-0113-6) contains supplementary material, which is available to authorized users. G. Hornemann (&) S. G. Michalski W. Durka Department of Community Ecology, Helmholtz Centre for Environmental Research-UFZ, Theodor-Lieser-Str. 4, 06120 Halle, Germany e-mail: [email protected] 123 Plant Ecol (2012) 213:1583–1595 DOI 10.1007/s11258-012-0113-6
Transcript of Short-term ï¬tness and long-term population trends in the orchid

Short-term fitness and long-term population trendsin the orchid Anacamptis morio
Gitte Hornemann • Stefan G. Michalski •
Walter Durka
Received: 19 January 2012 / Accepted: 13 August 2012 / Published online: 26 August 2012
� Springer Science+Business Media B.V. 2012
Abstract The conservation of endangered species
critically depends on the understanding to which
degree short-term fitness and long-term trends are
affected by intrinsic local conditions and external
global dynamics. However, studies combining long-
term demographic data with population level analyses
of site conditions, genetic variation, and reproduction
as well as with climatic data are still rare. Here we
studied the endangered orchid Anacamptis morio,
representative for species with a sub-mediterranean
distribution. For populations at the northern range edge,
we combined long-term monitoring data (1977–2010)
with climatic data and analyzed reproductive fitness
components, genetic variation, and abiotic site condi-
tions. Reproduction was generally low as expected
from the deceptive pollination system, and was posi-
tively influenced by population size and xerothermic
site quality. The majority of populations showed a
positive population trend, which was paralleled by an
increase in spring temperature and positively affected
by site quality. High levels of genetic variation were
found in the populations which were at gene flow-drift
equilibrium. A. morio may profit from increasing
spring temperatures because of increased reproductive
output. Nevertheless, whether climate change results in
fitness increase or not may depend on the maintenance
and provision of optimal site quality, i.e., xerothermic
and nutrient poor conditions.
Keywords Reproduction � Fitness � Genetic
variation � Site quality � Climate change �Weather
Introduction
The conservation of endangered plant species and
declining populations critically depends on the under-
standing of fitness determinants (Oostermeijer et al.
2003). However, fitness measures at population and
individual level may vary among years depending on
actual biotic and abiotic environmental conditions
(Morris et al. 2008), cumulative fitness across larger
time scales eventually determines the long-term
population trend. Hence, the consequences of site
and population characteristics, such as abiotic condi-
tions, population size (Lienert et al. 2002) as well as
long-term dynamics such as climatic changes (Feehan
et al. 2009) need to be taken into account to assess
the sustainability of a population (Magnuson 1990;
Oostermeijer et al. 2003). Moreover, the relative contri-
bution of different life-history processes and fitness
determinants to long-term performance varies across
species (Silvertown et al. 1993; Jongejans et al. 2010)
Electronic supplementary material The online version ofthis article (doi:10.1007/s11258-012-0113-6) containssupplementary material, which is available to authorized users.
G. Hornemann (&) � S. G. Michalski � W. Durka
Department of Community Ecology, Helmholtz Centre
for Environmental Research-UFZ, Theodor-Lieser-Str. 4,
06120 Halle, Germany
e-mail: [email protected]
123
Plant Ecol (2012) 213:1583–1595
DOI 10.1007/s11258-012-0113-6
and needs to be quantified explicitly to reveal species-
specific patterns. Even if these different aspects are not
easy to disentangle due to correlation or multicausality
in observational studies on endangered species, the
potential determinants of fitness have to be addressed
to arrive at testable hypotheses.
Abiotic site conditions, such as the soil water
relations or nutrients affect plant growth directly or
may determine the strength of competitors (Chesson
and Huntly 1989). Thus different habitat types, in
particular soil type and water availability can strongly
affect reproductive performance, individual fitness,
and population viability (e.g., Csergo et al. 2011).
Also, the spatial relations within and among popula-
tions have been shown to be related to fitness (Lienert
et al. 2002). Habitat area is likely a proxy for habitat
suitability, as it may first be positively correlated to
heterogeneity of environmental conditions which may
represent a buffer during habitat changes; second
habitat area may be inversely related to edge effects,
like nutrient input and disturbance (Murcia 1995).
Spatial isolation among populations has been shown to
be related to plant fitness (Bizoux et al. 2008) as it
affects functional connectivity which may be a proxy
for similarity of environmental conditions. Finally,
landscape composition may affect individual fitness
due to habitat connectivity or distance to pollinators
(Steffan-Dewenter et al. 2001).
Population size has been shown to be a good
predictor of plant fitness and population viability
(Leimu et al. 2006). First, population size may be itself
related to habitat size and its associated buffering
properties mentioned above. Second, population size
strongly affects pollination and thus reproductive
fitness (Knight et al. 2005). Furthermore, genetic
variation often increases with population size which
can affect fitness (Ellstrand and Elam 1993; Leimu et al.
2006). For example, reduced genetic variation entails a
higher extinction risk when inbreeding has detrimental
effects on fitness (Young et al. 1996). Additionally,
genetic variation may reflect the inherent evolutionary
potential when environmental conditions change and
thus may affect long-term population development
(Frankham 2005). However, as genetic variation often
increases with population size, their independent
effects on fitness are difficult to disentangle.
Independent of specific local conditions, weather
and climate are additional factors acting on reproduc-
tion and survival and, hence, on short- and long-term
population dynamics (Hedhly et al. 2009). Weather
conditions during particular time periods, like late
frosts or drought may inhibit flowering or fruiting.
Moreover, weather conditions can influence the indi-
vidual resource status or the interactions with pollin-
ators and thus affect reproduction (Jacquemyn et al.
2009). Consequently, varying weather conditions may
result in annual fluctuations of reproductive success of
individuals or census size of populations (Bernhardt
and Edens-Meier 2010). Climate change, however,
operates at larger temporal scales upon plant popula-
tions and may affect both phenology and individual
fitness components, thus leading to altered long-term
population dynamics (Sparks and Menzel 2002;
Hedhly et al. 2009).
Anacamptis morio (Orchidaceae), representative
for species distributions centered in the Mediterra-
nean, has experienced drastic population extinctions
within the last century in Central Europe (Jersakova
et al. 2002; Jacquemyn et al. 2005; Kull and Hutchings
2006). In Central Europe, it is now restricted to
isolated grassland habitats and serves as a flagship
species for conservation (Bohnert et al. 1986). Like
many other orchids, A. morio is known to be pollen
limited which results in low fruit set (Jersakova and
Kindlmann 1998) and may profit from a large display
of conspecific or heterospecific flowers (Johnson et al.
2003; Knight et al. 2005). Furthermore, fitness decline
in offspring resulting from selfing, i.e., inbreeding
depression, suggests an important role of genetic
variation for reproduction (Smithson 2006). Although
a number of studies focused on pollination ecology,
management requirements and demography in A. mo-
rio, analyses of reproductive fitness in multiple
populations are lacking. Such analyses would provide
important indications for the formulation of conser-
vation actions. Additionally, the impact of genetic
variation, population size, and local site conditions on
reproduction and their importance for long-term
population dynamics has not been studied in A. morio.
In this study, we combine the assessment of
reproductive output, genetic variation, and site condi-
tions of remnant populations of A. morio with an
analysis of long-term monitoring data. We want to
elucidate (a) which abiotic, demographic, and genetic
population characteristics affect reproductive fitness
components in a single year and (b) whether and how
census sizes across multiple years are influenced by
weather and climatic conditions. We furthermore
1584 Plant Ecol (2012) 213:1583–1595
123

assess (c) the long-term trend in population size and its
determinants.
Materials and methods
Study species and study sites
Anacamptis morio (L) R. M. Bateman, Pridgeon and
Chase (syn. Orchis morio L.), the Green-winged
Orchid, is a small, perennial, wintergreen geophyte.
A. morio is food deceptive and is mainly visited by
early emerging bumblebee queens (Nilsson 1984).
The species is self-compatible but relies on pollinator
visits to set fruits (Jersakova and Kindlmann 1998).
Plants produce one inflorescence, with 15–20(–25)
flowers (Fay and Rankou 2010). Fruits contain
thousands of wind-dispersed dust-like seeds of which
only a small proportion is dispersed more than one
meter (Jersakova and Malinova 2007).
Anacamptis morio has a wide European distri-
bution centered in the Mediterranean. Across its
distribution range, it has a broad ecological range
and occurs in various types of grasslands and
prefers neutral or calcareous soils (Fay and Rankou
2010). We studied A. morio in central Germany
where the species has experienced drastic declines
in recent decades and is critically endangered
(MLRU 1996, Bohnert et al. 1986). In this area,
populations are exclusively found in xerothermic
grasslands mostly located on isolated porphyry
outcrops within the agricultural landscape and
most of them undergo conservation management
by occasional grazing. The climate of the study
area is characterized by low annual rainfall of
approximately 460 mm and mean annual tempera-
ture of 9.6 �C. Compared to the long-term mean,
values slightly higher than average values were
observed for precipitation (633 mm) and tempera-
ture (9.9 �C) in the study year 2009.
For a total of 31 populations in the study area, long-
term monitoring data of the number of flowering
A. morio plants during peak flowering is available
from 1977 onwards, by courtesy of the voluntary
working-group for native orchids (Arbeitskreis Heimi-
sche Orchideen, AHO Sachsen-Anhalt and AHO
Thuringen). The mean number of censuses per pop-
ulation was 21 years (range 9–33 years), as not all
populations were censused each year. Henceforward,
this monitoring data is called the long-term dataset.
In 2009, we studied a subset of 19 of these
populations for site conditions, genetic variation, and
reproductive fitness (Table 1; Fig. 1). We obtained
three descriptors of spatial and environmental site
conditions for each site. First, we estimated patch area
as proxy for edge effects and habitat heterogeneity.
Based on a topographical map (1:25000, Landesver-
messungsamt Sachsen-Anhalt) and additional digiti-
zation, habitat area (0.15–131 ha, Tab. 1) was assessed
with Arc GIS 10 (ESRI 2011. ArcGIS Desktop:
Release 10. Redlands, CA: Environmental Systems
Research Institute). Second, we calculated Hanski
(1994) connectivity index: CIi ¼ Ri 6¼j expð�adijÞAbj ,
where Aj is the census size 2009 of population j and dij
is the edge to edge distance (km) between populations
i and j. We chose a = 2 for the effect of distance to
migration (1/a is the average migration distance) and
b = 0.5 for the scaling parameter (Moilanen and
Nieminen 2002). Third, we computed a site quality
index summarizing local environmental conditions
based on occurrence data of vascular plant species at
the respective sites (D. Frank, pers. comm., Horne-
mann unpubl. data) and the species’ mean Ellenberg
indicator values for light, soil moisture, temperature,
soil mineral nitrogen, soil reaction (pH), and conti-
nentality (Ellenberg et al. 1992). In general, this
approach has proven suitable to indicate the prevailing
environmental site conditions (Dupre and Diekmann
1998; Schaffers and Sykora 2000). We performed a
principal component analysis (PCA) of the mean
indicator values. The first PCA axis accounted for
65 % of the variation and its scores were used as site
quality index (Table 1). The site quality index was
negatively correlated to nitrogen and moisture, and
positively correlated to light, temperature, continen-
tality, and soil reaction.
In each population, we assessed the total number of
flowering individuals in 2009 (census size 2009
hereafter). The number of flowering individuals in a
population varies across years and is affected first in
the short term by changes in the proportion of adult
individuals that actually come into flower and second
in the long term by demographic changes in the
number of adult individuals. Thus, the census size per
year is not an unbiased estimator of population size.
For A. morio, both management practices and weather
Plant Ecol (2012) 213:1583–1595 1585
123

Ta
ble
1S
amp
lin
gsi
tes,
cen
sus
size
,g
enet
icv
aria
tio
n,
and
rep
rod
uct
ive
fitn
ess
of
19
rem
nan
tp
op
ula
tio
ns
of
An
aca
mp
tis
mo
rio
ince
ntr
alG
erm
any
Sit
e
code
Lat
/Long
Hab
itat
area
(m2)
Sit
e
qual
ity
Connec
-
tivit
y
Mea
nce
nsu
s
size
(1977–2010)
Nr
of
censu
ses
Cen
sus
size
2009
ln
HE
PL
PB
RF
low
ers/
pla
nt
Shoot
surv
ival
(%)
Fru
it
set
(%)
See
d
wei
ght
(mg)
Em
bry
o
form
atio
n
(%)
Cum
ula
tive
fitn
ess
LB
S51.5
31/1
1.8
87
20,8
69
-0.6
81
57.5
81,6
13
22
8,3
75
0.0
95*
30
0.1
86
49.5
1.3
911.6
73.3
37.2
11.1
180.1
0207,0
14.9
0
LB
S2
51.5
31/1
1.8
88
2,6
95
-0.2
43
82.2
510
15
24
0.0
87*
23
0.1
58
38.8
1.3
38.8
43.5
26.6
4.2
267.3
021,5
69.1
6
LB
351.5
30/1
1.8
89
1,4
72
1.2
35
116.4
3208
21
1,2
92
0.0
77
30
0.1
68
47.6
1.3
89.8
86.7
39.7
8.9
476.1
0203,7
05.8
0
LB
651.5
30/1
1.8
92
20,6
99
-0.8
51
53.5
717
16
103
0.1
28*
29
0.1
93
49.5
1.4
09.7
60.0
50.6
6.5
473.6
091,9
84.7
5
LB
251.5
29/1
1.8
90
3,3
36
-0.4
87
154.8
718
12
58
0.1
11
28
0.1
69
42.7
1.3
58.1
60.0
36.4
5.2
178.5
065,3
51.8
6
GL
B51.5
28/1
1.8
91
18,3
12
0.8
47
67.3
5136
20
856
0.1
13
28
0.1
86
54.4
1.3
510.7
80.0
30.5
5.5
481.6
097,9
22.5
5
LE
T51.5
29/1
1.8
98
33,1
65
0.8
25
24.9
511
919
-0.0
29
16
0.1
35
34.0
1.3
08.0
68.8
46.7
5.5
377.2
092,9
18.9
1
LJ
51.6
34/1
1.9
24
13,9
00
-2.1
60
3.8
26
21
80.0
22
70.2
20
57.3
1.5
78.8
37.5
62.0
2.4
879.6
040,2
53.1
7
BB
51.5
86/1
1.9
40
30,6
88
1.9
29
4.7
03,2
97
27
5,0
12
0.0
92*
29
0.2
69
71.8
1.6
19.4
53.3
27.8
6.3
080.0
043,0
71.8
3
GB
51.5
62/1
1.8
49
3,0
55
0.9
84
9.5
2771
26
2,3
94
0.1
59*
27
0.2
57
74.8
1.6
810.6
83.3
40.3
5.8
778.1
0141,3
48.3
0
TL
51.5
55/1
1.8
54
21,6
36
-2.4
39
11.7
969
27
77
0.0
34
29
0.2
55
72.8
1.6
68.0
40.0
41.1
5.8
268.9
024,3
67.2
3
LH
51.5
51/1
1.8
74
6,5
05
-0.7
23
15.2
136
31
73
0.0
46*
28
0.2
82
76.7
1.6
76.7
66.7
48.0
6.0
570.9
065,2
76.9
8
BD
51.3
08/1
1.4
14
1,3
16,0
00
4.3
29
1.0
012,9
01
14
20,3
88
0.1
31
28
0.2
60
73.8
1.6
59.3
80.0
31.1
6.1
573.7
086,9
20.2
9
FS
51.5
49/1
1.8
66
20,4
85
0.4
51
15.0
132
25
49
0.0
41
27
0.2
53
61.2
1.5
37.5
51.6
52.9
4.2
967.1
047,2
23.0
3
LB
51.5
42/1
1.8
75
27,8
10
1.4
48
16.4
02,6
50
31
3,7
73
0.0
55*
27
0.2
63
69.9
1.6
110.2
73.3
40.8
7.0
869.0
0136,6
29.6
0
KB
51.5
45/1
1.8
86
2,4
64
0.1
28
18.7
559
28
17
-0.0
28
13
0.2
68
59.2
1.5
88.2
84.6
66.0
4.1
953.9
094,2
04.2
4
SK
B51.5
45/1
1.8
82
2,0
27
-0.8
19
19.5
447
27
76
0.0
76
29
0.2
87
71.8
1.6
48.0
63.3
37.8
4.5
668.2
043,7
41.9
7
GG
a51.6
43/1
1.8
88
2,3
94
1.0
21
3.4
427
25
30
-0.0
24
28
0.2
90
76.7
1.6
57.6
SB
51.5
20/1
2.1
25
12,5
00
-4.7
95
2.2
035
32
19
-0.0
22
16
0.2
59
64.1
1.6
310.2
42.1
23.2
4.4
763.3
020,3
83.4
4
Mea
n0.0
61
0.2
29
60.3
1.5
29.0
63.8
41.0
5.8
072.6
284,6
60.4
5
Sit
equal
ity
=P
CA
score
sof
axis
1of
Ell
enber
gin
dic
ator
val
ues
,co
nnec
tivit
y=
Han
ski’
sco
nnec
tivit
yin
dex
,ce
nsu
ssi
ze=
num
ber
of
flow
erin
gin
div
idual
s,l
=popula
tion
tren
d(a
ster
isks
show
signifi
cant
tren
ds)
,
HE
=ex
pec
ted
het
erozy
gosi
ty,
PL
P=
per
centa
ge
of
poly
morp
hic
loci
,B
R=
ban
dri
chnes
s,fl
ow
ers
=nr
of
flow
ers
per
pla
nt,
shoot
surv
ival
=per
centa
ge
indiv
idual
sth
atdid
not
wit
her
unti
lti
me
of
fruit
ripen
ing,
fruit
set
=fr
uit
s/fl
ow
ers,
seed
wei
ght
=se
edw
eight
per
fruit
(mg),
embry
ofo
rmat
ion
=per
centa
ge
seed
sw
ith
embry
o
aN
ore
pro
duct
ive
fitn
ess
esti
mat
edue
togra
zing
1586 Plant Ecol (2012) 213:1583–1595
123

conditions have been shown to affect the proportion of
individuals that produce flowers (Silvertown et al.
1994; Wells et al. 1998; Jersakova et al. 2002). Thus,
year-to-year variation in census size likely reflects the
impact of temporally varying weather conditions
rather than changes in population size. However,
assuming that variation in the proportion of flowering
individuals occurs randomly across years, census size
data across multiple years can be used to assess
temporal population trend.
Genetic variation and population structure
In each population, we arbitrarily selected and marked
30 flowering individuals, if available, and took a leaf
sample for genetic analysis. We studied genetic
variation with amplified fragment length polymor-
phisms (AFLP). DNA was extracted using the DNeasy
96 plant kit (Qiagen, Hilden, Germany). AFLP
analyses followed the AFLP plant mapping protocol
(Applied Biosystems, Foster City, CA) with minor
Fig. 1 Location of the 19
A. morio populations
studied. Pie charts denote
population level cluster
membership coefficients of
the Bayesian cluster
analysis. For five
populations that are located
outside of the main study
region, the direction from
(black arrows) and distance
(in km) to the main region is
given
Plant Ecol (2012) 213:1583–1595 1587
123

modifications. After screening of 60 primer combina-
tions, four were selected and used for selective
amplification with fluorescent labeled primers (ACT/
CAC, ACA/CTG, AAG/CTGT, AGG/CTG). Frag-
ment analysis was performed on an ABI 3130 genetic
analyzer (Applied Biosystems) with GeneScan 600
LIZ as internal size standard. Scoring of fragments
was done manually in GeneMapper (version 3.7) and
revealed a total of 103 polymorphic loci (PLP) in 515
individuals. Based on 22 replicate samples the error
rate was 3.7 %.
Overall genetic population structure was assessed
by Bayesian clustering to test for the existence of
spatio-genetic groups (see supplemental information
for details). In short, we used STRUCTURE v. 2.3 to
determine the most probable number of genetic groups
by taking into account sampling location (Hubisz et al.
2009). As two spatially structured genetic groups were
found (see below), we used, for each population, the
proportion of membership to the first group, Q, as a
measure of spatio-genetic affiliation in the later
analysis of fitness components. For each population,
we assessed genetic variation as percentage of PLP
and expected heterozygosity (HE) following (Lynch
and Milligan 1994) with AFLP-SURV 1.0 (Vekemans
2002) applying the square root method and assuming
Hardy–Weinberg equilibrium. Additionally, we cal-
culated band richness (Br), which is the mean number
of phenotypes expected at each locus standardized to
the smallest sample size (n = 7) by means of a
rarefaction method, using aflp-div 1.0 (Coart et al.
2005). We tested for correlation of genetic variation
with mean census size (1977–2010). Population
differentiation was determined as overall and pairwise
FST in AFLP-SURV. In order to test for isolation-by-
distance, we regressed pairwise genetic differentiation
FST/(1-FST) on log geographic distances. Signifi-
cance was tested by a Mantel test.
Short-term fitness components
In each of the 19 populations, we measured reproduc-
tive fitness components in 2009. For all marked
individuals we counted (1) the number of flowers per
plant. At the time of fruit ripening, we recorded (2)
shoot survival, as a part of the shoots withered and (3)
the number of fruits per plant. For surviving shoots,
fruit set was calculated as percentage of flowers that
turned into fruits. We arbitrarily collected one ripe
fruit per plant and determined (4) total seed weight. As
a measure of pollination success, we estimated (5) the
percentage of seeds containing an embryo. Therefore,
the percentage of fully developed seeds was deter-
mined by visually analyzing 120 seeds per fruit using a
binocular. As an integrative measure of fitness, we
calculated (6) cumulative fitness as the product of the
means of shoot survival, number of flowers, fruit set,
seed weight, and embryo formation.
We performed standardized multiple regression
analyses to explain fitness components and cumulative
fitness of populations as a function of demographic,
spatial, environmental, and genetic predictor vari-
ables. Prior to multiple regression analysis, we
performed a PCA of the descriptors census size
(2009), habitat area, connectivity (CI), site quality
index, PLP, HE, BR, and Q, and discarded highly
collinear variables. Minimum adequate models were
selected using AIC and the step-function in R.
Weather effects on census size
Using the long-term dataset, we assessed the impact of
weather conditions on census size across years in 31
populations. From data of the local weather station
Halle-Krollwitz (German Weather Service), we
extracted the mean monthly precipitation and temper-
ature during four time periods in a year which we
hypothesized to affect census size: September–Octo-
ber of the previous year (development of winter
leaves), December–February (persistence of winter
leaves), April (vegetative growth, bulb regeneration),
and May (flowering, fruit production). The log census
size was then explained by these weather variables
using a linear mixed-effect model (lme) for repeated
measurements. In order to account for temporal
pseudoreplication, the sampling unit (Year) was
included as random effect. We included the eight
weather variables and Year as main effects into the
model and successively removed non-significant terms
to obtain a minimal adequate model.
Population trend
Based on the long-term dataset we computed the long-
term trend in population size (l) for 31 populations
which had been censused in 9–33 years (mean 21) in
the period between 1977 and 2010. l, defined as the
average change in log-abundance per unit of time, was
1588 Plant Ecol (2012) 213:1583–1595
123

estimated as the slope of a log-linear regression of log
census size against year as implemented by Humbert
et al. (2009). We used a statistical model that takes into
account both, observational error, and environmental
stochasticity (EGSS-REML, Humbert et al. 2009).
The significance of the population trend is given by the
significance of the linear model.
For the subset of 19 populations studied in detail,
we performed a multiple regression analysis as
described above to explain the population trend l by
taking into account habitat area, site quality index, and
CI, assuming these explanatory variables to be con-
stant across years. Census size and other temporally
variable predictors were not included as independent
variable in this model.
If not stated otherwise, all analyses were performed
in R, version 2.13.0 (R Development Core Team 2011).
Results
Genetic variation and population structure
The Bayesian cluster analysis revealed two gene pools
and two groups of populations (Fig. S1). Group I
comprised a number of spatially close populations
harboring only one gene pool. Group II consisted of
spatially isolated populations and appeared admixed
with equal contributions of the two gene pools (Fig. 1,
Fig. S2). Genetic variation (HE) was higher in group II
than in group I (Welch two sample t test: t = -10.06,
d.f. = 11.93, p \ 0.001), which may indicate a
historical bottleneck in the latter. Overall, HE and BR
were not significantly correlated to mean census size
but a weak positive trend between PLP and mean
census size was found (p = 0.069). Populations were
moderately differentiated with an overall FST of
0.161 (SE 0.06, p \ 0.001). Population differentia-
tion followed an isolation-by-distance model and
increased with geographic distance (r = 0.458, Man-
tel-p \ 0.01) indicating an equilibrium of genetic drift
and gene flow. A Mantel test within the northern group
II (excluding population BD) also revealed a positive
significant relationship (r = 0.465, Mantel-p \ 0.05).
Short-term fitness
The 19 populations differed strongly in census size,
ranging from eight to more than 20.000 flowering
individuals in 2009. Population level data on compo-
nents of reproductive fitness are given in Table 1 and
indicate overall low reproductive success and large
differences among populations in most fitness com-
ponents. On average, shoot survival was 64 % and
fruit set of surviving shoots was 41 %. Thus, overall,
only 26 % of flowers developed into fruits. However,
embryo formation was high (73 %) and showed low
variation among populations.
In the PCA of demographic, spatial, environmental,
and genetic predictor variables, the first axis explained
56 % of variation and was strongly loaded by spatial
and spatio-genetic structure, (CI, Q) and by genetic
variation (PLP, HE, BR; Fig. S3). As CI, Q, and genetic
variation were highly collinear (R2 [ 0.450) reflecting
the spatio-genetic structuring present (see above), only
CI was used in the subsequent analyses. Multiple
regressions analyzing the combined effect of census
size 2009, CI, habitat area, and site quality on
components of reproductive fitness are shown in
Table 2. Census size was the most important factor
positively affecting several fitness components and
cumulative fitness. Strong effects were also found for
site quality which positively affected shoot survival
and had a negative effect on number of flowers and
seed weight.
In order to eliminate the effect of the spatio-genetic
structuring found, we performed separate analyses for
a reduced dataset including only populations of group
II. Here, PCA did not show collinearity between CI
and genetic diversity and hence, these variables were
entered as independent effects in the multiple regres-
sion analyses. Nevertheless, census size and site
quality still had the most prominent effects on several
fitness components (Table S1). Additional significant
effects were only found for site quality on shoot
survival, CI on embryo formation, and genetic diver-
sity on fruit set.
Weather effects on census size
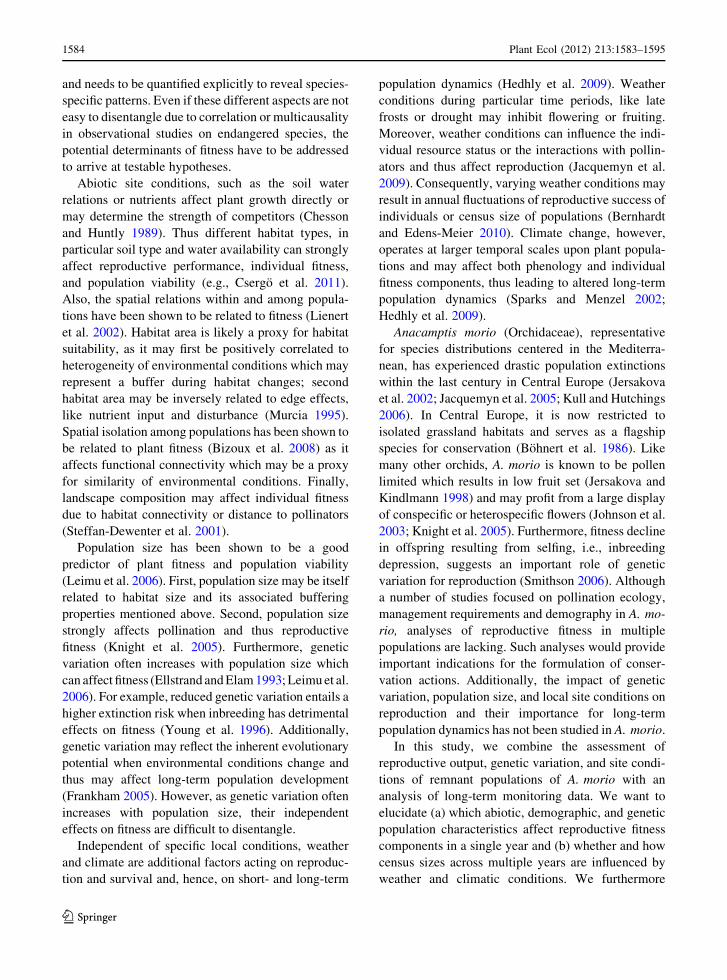
Several weather variables affected the annual census
size in the long-term dataset (Table 3). The number of
flowering individuals was positively related to higher
temperatures in April and to higher temperatures and
increased precipitation in the autumn of the previous
year, and was negatively related to temperatures in
May. Weather conditions during winter had no effect.
In the analyzed time period (1977–2010), April
Plant Ecol (2012) 213:1583–1595 1589
123

temperatures showed a linear temporal increase by
0.8 8C per decade (r = 0.586, p \ 0.001; Fig. 2).
Thus, when accounting for this temporal trend by
including the main effect Year into the model, the
positive effect of mean April temperatures on census
size was not significant anymore, but the effect of May
temperature remained, and additionally a negative
effect of high winter temperature was found (Table 3).
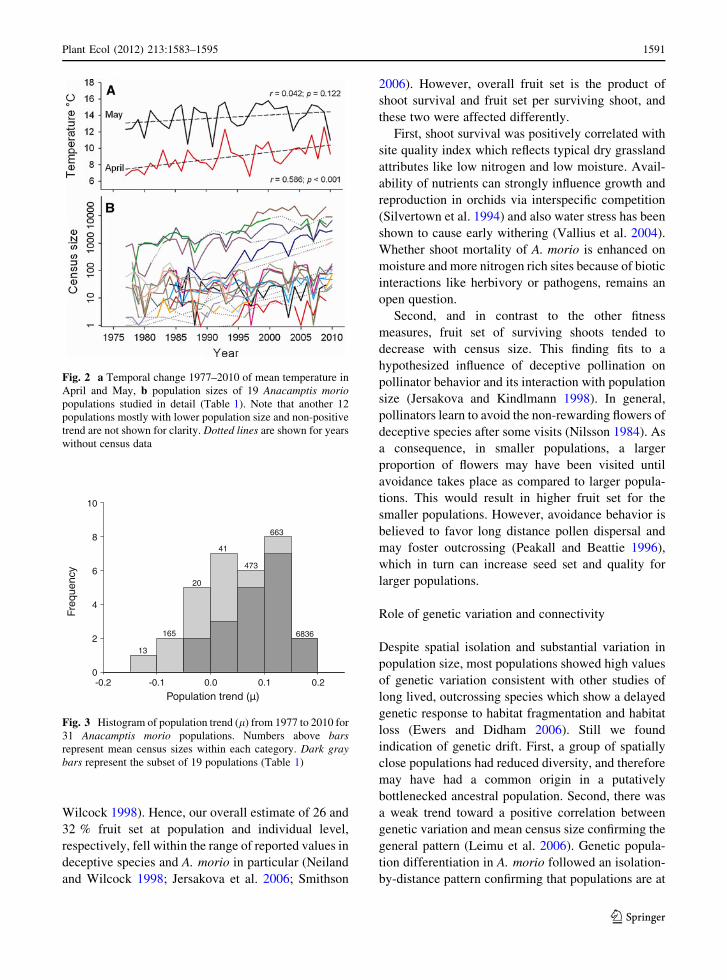
Population trend
In the long-term dataset, many populations showed
increasing census sizes. Population trend l was
positive for 23 (74 %) of the 31 populations, which
were mainly the large populations (Fig. 3). Population
trend was significantly positive for seven populations
and significantly negative for one of the 31 popula-
tions. The multiple regression analysis of the effects of
local site conditions and genetic variation on l in the
19 remnant populations revealed a significantly
positive effect of site quality (Table 2).
Discussion
Effects of site conditions on short-term fitness
components
Variation among populations in nearly all components
of reproductive fitness was most strongly linked to
census size and thus conforms to patterns found in
many species (Leimu et al. 2006). Such positive
relationships with population size can be attributed to
different mechanisms. First, large populations and
thus large flowering displays may be more attractive to
pollinators and can increase pollinator activity (Agren
1996). Second, there may be other effects of site
conditions (e.g., habitat quality or site heterogeneity)
that affect fitness (Leimu 2010; Lauterbach et al.
2011).
Fruit production is known to be low in deceptive
orchids due to pollen limitation. Thus, fruit set is
usually below 50 %; whereas nectariferous species
generally show much higher rates (Neiland and
Table 3 Results of the linear mixed-effect models (including and excluding the variable Year) for the effect of temperature and
precipitation on census size in 31 Anacamptis morio populations in 1977–2010
Year excluded Year included
Variable t p Variable t p
(Intercept) 7.544 \0.001 (Intercept) -9.956 \0.001
Temp April 3.981 \0.001 Year 10.300 \0.001
Temp May -3.598 \0.001 Temp May -4.430 \0.001
Prec Sep–Oct 3.492 0.001 Temp Dec–Feb -2.144 0.033
Temp Sep–Oct 2.318 0.021
Table 2 Effects of census size, CI, and local habitat conditions on components of reproductive fitness and population trend analyzed
in 19 Anacamptis morio populations
Flowers Shoot
survival
Fruit set Seed
weight
Embryo
formationCumulative
fitness
Population
trend (l)
Census size 2009 0.992*** 0.348 -0.432� 0.966*** 0.446� 0.778** –a
CI 0.008� 0.007� 0.009
Habitat area -0.397� -0.406�
Site quality -0.563* 0.567* -0.209� 0.285*
R2 (final model) 0.580*** 0.565** 0.187� 0.669** 0.281� 0.495** 0.438*
Standardized regression coefficients and significance level of a multiple regression analysis are shown� p \ 0.1; * p \ 0.05; ** p \ 0.01; *** p \ 0.001a Census size not included
1590 Plant Ecol (2012) 213:1583–1595
123
Wilcock 1998). Hence, our overall estimate of 26 and
32 % fruit set at population and individual level,
respectively, fell within the range of reported values in
deceptive species and A. morio in particular (Neiland
and Wilcock 1998; Jersakova et al. 2006; Smithson
2006). However, overall fruit set is the product of
shoot survival and fruit set per surviving shoot, and
these two were affected differently.
First, shoot survival was positively correlated with
site quality index which reflects typical dry grassland
attributes like low nitrogen and low moisture. Avail-
ability of nutrients can strongly influence growth and
reproduction in orchids via interspecific competition
(Silvertown et al. 1994) and also water stress has been
shown to cause early withering (Vallius et al. 2004).
Whether shoot mortality of A. morio is enhanced on
moisture and more nitrogen rich sites because of biotic
interactions like herbivory or pathogens, remains an
open question.
Second, and in contrast to the other fitness
measures, fruit set of surviving shoots tended to
decrease with census size. This finding fits to a
hypothesized influence of deceptive pollination on
pollinator behavior and its interaction with population
size (Jersakova and Kindlmann 1998). In general,
pollinators learn to avoid the non-rewarding flowers of
deceptive species after some visits (Nilsson 1984). As
a consequence, in smaller populations, a larger
proportion of flowers may have been visited until
avoidance takes place as compared to larger popula-
tions. This would result in higher fruit set for the
smaller populations. However, avoidance behavior is
believed to favor long distance pollen dispersal and
may foster outcrossing (Peakall and Beattie 1996),
which in turn can increase seed set and quality for
larger populations.
Role of genetic variation and connectivity
Despite spatial isolation and substantial variation in
population size, most populations showed high values
of genetic variation consistent with other studies of
long lived, outcrossing species which show a delayed
genetic response to habitat fragmentation and habitat
loss (Ewers and Didham 2006). Still we found
indication of genetic drift. First, a group of spatially
close populations had reduced diversity, and therefore
may have had a common origin in a putatively
bottlenecked ancestral population. Second, there was
a weak trend toward a positive correlation between
genetic variation and mean census size confirming the
general pattern (Leimu et al. 2006). Genetic popula-
tion differentiation in A. morio followed an isolation-
by-distance pattern confirming that populations are at
Fig. 2 a Temporal change 1977–2010 of mean temperature in
April and May, b population sizes of 19 Anacamptis moriopopulations studied in detail (Table 1). Note that another 12
populations mostly with lower population size and non-positive
trend are not shown for clarity. Dotted lines are shown for years
without census data
Population trend (µ)-0.2 -0.1 0.0 0.1 0.2
Freq
uenc
y
0
2
4
6
8
10
13
165
20
41
473
663
6836
Fig. 3 Histogram of population trend (l) from 1977 to 2010 for
31 Anacamptis morio populations. Numbers above barsrepresent mean census sizes within each category. Dark graybars represent the subset of 19 populations (Table 1)
Plant Ecol (2012) 213:1583–1595 1591
123

gene flow-drift equilibrium (Hutchison and Templeton
1999) and indicating that despite the dust-like seeds,
gene flow by seed is spatially limited.
Deceptive orchids generally show low levels of
population differentiation compared to rewarding
orchids (Scopece et al. 2010), which is attributed to
high outcrossing rates in the former. For A. morio, low
differentiation (GST = 0.064 and 0.055) has been
reported in allozyme studies of Italian populations
(Scacchi et al. 1990; Rossi et al. 1992). Genetic
differentiation in our study (FST = 0.165) was higher
than previous estimates but still in the range of other
deceptive species (Scopece et al. 2010). More pro-
nounced differentiation in our study region might be
attributed to the location at the northern range
margin and putatively stronger spatial isolation of
populations.
The populations studied clustered genetically into
two groups. Group I (Fig. S2) comprised seven, very
closely situated populations that showed significant
lower genetic diversity than populations of group II.
As a consequence, for the complete dataset, the effects
of genetic diversity and CI on fitness components
could not be separated. However, using a restricted
dataset for which genetic diversity and CI were more
or less orthogonal, we found a positive effect of CI on
fruit set and seed weight. While this finding is well
expected (cf. Bizoux et al. 2008), the negative effect of
genetic diversity on fruit set is counterintuitive and
cannot be explained easily. However, due to the
limited data, our finding for CI and genetic diversity
should be treated with caution.
Short-term weather effects on census size
Anacamptis morio populations showed strong annual
fluctuations in census sizes which could partly be
attributed to weather conditions. High temperature in
April, one month prior to flowering, had positive
effects whereas high temperature during peak flower-
ing in May had negative effects. Warmer April
temperatures may enhance photosynthesis rate thus
promoting the development of inflorescences. In
contrast, high temperature in May, the main flowering
month, may result in water stress on the shallow soils
and thus may lead to withering of already developed
inflorescences. Our results thus confirm earlier reports
of high sensitivity of A. morio to spring temperatures
(Wells et al. 1998). In addition to flowering and fruit
ripening, bulb formation for the nutrient supply in the
next season also takes place in this sensitive phase.
Nevertheless, although optimal weather conditions
may be important for individual performance, single
years of adverse weather may have little long-term
effect as dormant individuals may flower in more
favorable years (Jersakova et al. 2002).
Winter temperature has been supposed to affect
flowering of A. morio because of frost damage to
winter leaves (Wells et al. 1998). Mild winters on the
other hand may enhance flowering as has been found
in Himantoglossum hircinum, another winter green
orchid that reaches its northern distribution range in
central Europe (Pfeifer et al. 2006). In contrast, we
found that higher winter temperature had either no
effect or a negative effect. High winter temperature
may be connected with loss of storage carbohydrates
due to increased respiration (Bruelheide and Lieberum
2001).
Long-term effects on population trend
Our evaluation of long-term population trend showed
that the majority of populations increased since the
late 1970s. As discussed above, although changes in
the proportion of vegetative to reproductive plants
contribute to variation of census size, this should have
minor effects when considering long time periods,
allowing assessment of changes in population size.
The population trend was positive in particular for the
large populations. This may be attributed to the fact
that the small and decreasing populations are under-
represented because they were already extinct. More-
over, if large population sizes result from positive
population trend these two measures are not indepen-
dent of each other. Still, the positive effect of
population size on short-term fitness estimates shown
above is consistent with the long-term trend. Popula-
tion trend was also found to increase with site quality.
This suggests that nutrient poor and dry conditions,
i.e., typical xerothermic grasslands, best fulfill the
requirements of A. morio both in the short and in the
long term. Habitat management should maintain these
site conditions to allow for positive population growth.
It is known that habitat deterioration is a major reason
for decline and extinction of A. morio populations.
The abandonment of sheep grazing leads to shrub
encroachment which is not tolerated by the weak
competitor A. morio (Silvertown et al. 1994). Also,
1592 Plant Ecol (2012) 213:1583–1595
123

nutrient input from adjacent agricultural fields or
transformation of meadows into arable land leads to
habitat deterioration (Kretzschmar et al. 2007), puta-
tively with more severe effects on population sizes.
Climate change was evident as a strong increase of
April temperatures, in line with the general pattern of
rising spring temperatures in central Europe, resulting
in advanced onset of flowering (Menzel et al. 2001).
In Ophrys spegodes, for example, a shift of 6 days
per �C rise has been observed within the last four
decades (Robbirt et al. 2011). Thus, climate change
may drive changes in phenology and subsequently a
northward range shift in A. morio. However, spring-
flowering insect pollinated plants, including A. morio
are often dependent on a small group of early
emerging insects (Nilsson 1984). Although similar
shifts have been observed for insect emergence, earlier
onset of flowering may lead to a disruption of plant-
pollinator interactions with subsequent consequences
for reproduction (Bartomeus et al. 2011).
Implications for conservation
Overall, our results showed that remnant populations
of A. morio are mostly demographically stable or
increasing. They harbor high levels of genetic varia-
tion and reproductive fitness, which are positively
affected by nutrient poor and dry habitat conditions. In
particular, the findings suggest that climatic change
could be beneficial for established populations of
A. morio. A necessary precondition, however, is the
maintenance of typical xerothermic grassland condi-
tions because A. morio is intolerant to shade and is
outcompeted by larger growing herbs. Climate change
may lead to a transformation of semi-dry grasslands-
which rely to some extent on management to prevent
succession to forest-into naturally open xerothermic
grassland. It is thus an open question whether histor-
ical management like grazing or mowing is still nec-
essary to prevent succession and shrub encroachment.
The dust-like orchid seeds may allow colonization of
new sites. However, the genetic isolation-by-distance
pattern found indicates at least some degree of dis-
persal limitation. Thus, the likely success of future
colonizations will be determined by both, the potential
for gene flow (i.e., by seed and pollen dispersal) and
the quality of available habitats as a prerequisite for
sustainable population sizes and thus, minimized
effects of genetic drift.
Acknowledgments We thank the working-groups for native
orchids (AHO) of Saxony-Anhalt and Thuringia, for monitoring
data, and for help with locating the populations. D. Frank made
available species lists of many of the porphyry outcrops. We
thank I. Geier and M. Herrmann for assistance with laboratory
work. We thank J. Hanspach for help with statistical analyses
and A. Kolb for helpful comments. This study was supported by
the Federal Ministry of Education and Research (BMBF-FKz
01LC0618C) within the framework of BIOLOG-SUBICON
(Successional Change and Biodiversity Conservation). Addi-
tionally, kind support was given by Helmholtz Impulse and
Networking Fund through Helmholtz Interdisciplinary Graduate
School for Environmental Research (HIGRADE).
References
Agren J (1996) Population size, pollinator limitation, and seed
set in the self-incompatible herb Lythrum salicaria. Ecol-
ogy 77:1779–1790
Bartomeus I, Ascher JS, Wagner D, Danforth BN, Colla S,
Kornbluth S, Winfree R (2011) Climate-associated phe-
nological advances in bee pollinators and bee-pollinated
plants. Proc Nat Acad Sci 108:20645–20649
Bernhardt P, Edens-Meier R (2010) What we think we know vs.
what we need to know about orchid pollination and con-
servation: Cypripedium L. as a model lineage. Bot Rev
76:204–219
Bizoux JP, Dainou K, Raspe O, Lutts S, Mahy G (2008) Fitness
and genetic variation of Viola calaminaria, an endemic
metallophyte: implications of population structure and
history. Plant Biol 10:684–693
Bohnert W, Hecht G, Stapperfenne H-J (1986) Orchideen des
Bezirkes Halle. einst und jetzt, Dessau
Bruelheide H, Lieberum K (2001) Experimental tests for
determining the causes of the altitudinal distribution of
Meum athamanticum Jacq. in the Harz Mountains. Flora
196:227–241
Chesson P, Huntly N (1989) Short-term instabilities and long-
term community dynamics. Trends Ecol Evol 4:293–298
Coart E, Van Glabeke S, Petit RJ, Van Bockstaele E, Roldan-
Ruiz I (2005) Range wide versus local patterns of genetic
diversity in hornbeam (Carpinus betulus L.). Conserv
Genet 6:259–273
Csergo AM, Molnar E, Garcia MB (2011) Dynamics of isolated
Saponaria bellidifolia Sm. populations at northern range
periphery. Popul Ecol 53:393–403
Dupre C, Diekmann M (1998) Prediction of occurrence of
vascular plants in deciduous forests of South Sweden by
means of Ellenberg indicator values. Appl Veg Sci
1:139–150
Ellenberg H, Weber HE, Dull R, Wirth V, Werner W, Paulißen
D (1992) Zeigerwerte von Pflanzen in Mitteleuropa. Gol-
tze, Gottingen
Ellstrand NC, Elam DR (1993) Population genetic conse-
quences of small population size - implications for plant
conservation. Annu Rev Ecol Syst 24:217–242
Ewers RM, Didham RK (2006) Confounding factors in the
detection of species responses to habitat fragmentation.
Biol Rev Camb Philos Soc 81:117–142
Plant Ecol (2012) 213:1583–1595 1593
123

Fay MF, Rankou H (2010) 670. Anacamptis morio. Curtis’s Bot
Mag 27:100–108
Feehan J, Harley M, van Minnen J (2009) Climate change in
Europe. 1. Impact on terrestrial ecosystems and biodiver-
sity. A review. Agron Sustain Dev 29:409–421
Frankham R (2005) Genetics and extinction. Biol Conserv
126:131–140
Hanski I (1994) A practical model of metapopulation dynamics.
J Anim Ecol 63:151–162
Hedhly A, Hormaza JI, Herrero M (2009) Global warming and
sexual plant reproduction. Trends Plant Sci 14:30–36
Hubisz MJ, Falush D, Stephens M, Pritchard JK (2009) Inferring
weak population structure with the assistance of sample
group information. Mol Ecol Resour 9:1322–1332
Humbert J-Y, Scott MillsL, Horne JS, Dennis B (2009) A better
way to estimate population trends. Oikos 118:1940–1946
Hutchison DW, Templeton AR (1999) Correlation of pairwise
genetic and geographic distance measures: Inferring the
relative influences of gene flow and drift on the distribution
of genetic variability. Evolution 53:1898–1914
Jacquemyn H, Brys R, Hermy M, Willems JH (2005) Does
nectar reward affect rarity and extinction probabilities of
orchid species? An assessment using historical records
from Belgium and the Netherlands. Biol Conserv 121:257
Jacquemyn H, Brys R, Adriaens D, Honnay O, Roldan-Ruiz I
(2009) Effects of population size and forest management
on genetic diversity and structure of the tuberous orchid
Orchis mascula. Conserv Genet 10:161–168
Jersakova J, Kindlmann P (1998) Patterns of pollinator-gener-
ated fruit set in Orchis morio (Orchidaceae). Folia Geobot
33:377–390
Jersakova J, Malinova T (2007) Spatial aspects of seed dispersal
and seedling recruitment in orchids. New Phytol 176:
237–241
Jersakova J, Kindlmann P, Stritesky M (2002) Population
dynamics of Orchis morio in the Czech Republic under
human influence. In: Kindlmann P, Willems JH, Whigham
DF (eds) Trends and fluctuations and underlying mecha-
nisms in terrestrial orchid populations. Backhuys, Leiden,
pp 224–299
Jersakova J, Johnson SD, Kindlmann P (2006) Mechanisms and
evolution of deceptive pollination in orchids. Biol Rev
Camb Philos Soc 81:219–235
Johnson SD, Peter CI, Nilsson LA, Agren J (2003) Pollination
success in a deceptive orchid is enhanced by co-occurring
rewarding magnet plants. Ecology 84:2919–2927
Jongejans E, Jorritsma-Wienk LD, Becker U, Dostal P, Milden
M, de Kroon H (2010) Region versus site variation in the
population dynamics of three short-lived perennials. J Ecol
98:279–289
Knight TM, Steets JA, Vamosi JC, Mazer SJ, Burd M, Campbell
DR, Dudash MR, Johnston MO, Mitchell RJ, Ashman TL
(2005) Pollen limitation of plant reproduction: pattern and
process. Annu Rev Ecol Evol Syst 36:467–497
Kretzschmar H, Eccarius W, Dietrich H (2007) The orchid
genera Anacamptis, Orchis and Neotinea. Phylogeny,
taxonomy, morphology, biology, distribution, ecology and
hybridisation. EchinoMedia Verlag, Burgel
Kull T, Hutchings MJ (2006) A comparative analysis of decline
in the distribution ranges of orchid species in Estonia and
the United Kingdom. Biol Conserv 129:31
Lauterbach D, Ristow M, Gemeinholzer B (2011) Genetic
population structure, fitness variation and the importance
of population history in remnant populations of the
endangered plant Silene chlorantha (Willd.) Ehrh.
(Caryophyllaceae). Plant Biol 13:667–677
Leimu R (2010) Habitat quality and population size as deter-
minants of performance of two endangered hemiparasites.
Ann Bot Fenn 47:1–13
Leimu R, Mutikainen P, Koricheva J, Fischer M (2006) How
general are positive relationships between plant population
size, fitness and genetic variation? J Ecol 94:942–952
Lienert J, Fischer M, Schneller J, Diemer M (2002) Isozyme
variability of the wetland specialist Swertia perennis(Gentianaceae) in relation to habitat size, isolation, and
plant fitness. Am J Bot 89:801–811
Lynch M, Milligan BG (1994) Analysis of population genetic-
structure with RAPD markers. Mol Ecol 3:91–99
Magnuson JJ (1990) Long-term ecological research and the
invisible present. Bioscience 40:495–501
Menzel A, Estrella N, Fabian P (2001) Spatial and temporal
variability of the phenological seasons in Germany from
1951 to 1996. Glob Change Biol 7:657–666
Moilanen A, Nieminen M (2002) Simple connectivity measures
in spatial ecology. Ecology 83:1131–1145
Morris WF, Pfister CA, Tuljapurkar S, Haridas CV, Boggs CL,
Boyce MS, Bruna EM, Church DR, Coulson T, Doak DF,
Forsyth S, Gaillard JM, Horvitz CC, Kalisz S, Kendall BE,
Knight TM, Lee CT, Menges ES (2008) Longevity can
buffer plant and animal populations against changing cli-
matic variability. Ecology 89:19–25
Murcia C (1995) Edge effects in fragmented forests: implica-
tions for conservation. Trends Ecol Evol 10:58–62
Neiland MRM, Wilcock CC (1998) Fruit set, nectar reward, and
rarity in the Orchidaceae. Am J Bot 85:1657–1671
Nilsson LA (1984) Anthecology of Orchis morio (Orchidaceae)
at its outpost in the north Nov. Act Reg Soc Sci Ups
3:167–179
Oostermeijer JGB, Luijten SH, den Nijs JCM (2003) Integrating
demographic and genetic approaches in plant conservation.
Biol Conserv 113:389–398
Peakall R, Beattie AJ (1996) Ecological and genetic conse-
quences of pollination by sexual deception in the orchid
Caladenia tentactulata. Evolution 50:2207–2220
Pfeifer M, Wiegand K, Heinrich W, Jetschke G (2006) Long-
term demographic fluctuations in an orchid species driven
by weather: implications for conservation planning. J Appl
Ecol 43:313–324
R Development Core Team (2011) R: a language and environ-
ment for statistical computing. R Foundation for Statistical
Computing, Vienna
Robbirt KM, Davy AJ, Hutchings MJ, Roberts DL (2011)
Validation of biological collections as a source of pheno-
logical data for use in climate change studies: a case study
with the orchid Ophrys sphegodes. J Ecol 99:235–241
Rossi W, Corrias B, Arduino P, Cianchi R, Bullini L (1992)
Gene variation and gene flow in Orchis morio (Orchida-
ceae) from Italy. Plant Syst Evol 179:43–58
Scacchi R, Deangelis G, Lanzara P (1990) Allozyme variation
among and within 11 Orchis species (Fam Orchidaceae),
with special reference to hybridizing aptitude. Genetica
81:143–150
1594 Plant Ecol (2012) 213:1583–1595
123

Schaffers AP, Sykora KV (2000) Reliability of Ellenberg indi-
cator values for moisture, nitrogen and soil reaction: a
comparison with field measurements. J Veg Sci 11:
225–244
Scopece G, Cozzolino S, Johnson SD, Schiestl FP (2010) Pol-
lination efficiency and the evolution of specialized
deceptive pollination systems. Am Nat 175:98–105
Silvertown J, Franco M, Pisanty I, Mendoza A (1993) Com-
parative plant demography—relative importance of life-
cycle components to the finite rate of increase in woody and
herbaceous perennials. J Ecol 81:465–476
Silvertown J, Wells DA, Gillman M, Dodd ME, Robertson H,
Lakhani KH (1994) Short-term effects and long-term after-
effects of fertilizer application on the flowering population
of green-winged orchid Orchis morio. Biol Conserv 69:191
Smithson A (2006) Pollinator limitation and inbreeding
depression in orchid species with and without nectar
rewards. New Phytol 169:419–430
Sparks TH, Menzel A (2002) Observed changes in seasons: an
overview. Int J Climatol 22:1715–1725
Steffan-Dewenter I, Munzenberg U, Tscharntke T (2001) Pol-
lination, seed set and seed predation on a landscape scale.
Proc R Soc Lond B Biol Sci 268:1685–1690
Vallius E, Salonen V, Kull T (2004) Factors of divergence in
co-occurring varieties of Dactylorhiza incarnata (Orchid-
aceae). Plant Syst Evol 248:177–189
Vekemans X (2002) AFLP-SURV version 1.0. Distributed by
the author. Laboratoire de Genetique et Ecologie Vegetale,
Universite Libre de Bruxelles
Wells TCE, Rothery P, Cox R, Bamford S (1998) Flowering
dynamics of Orchis morio L. and Herminium monorchis(L.) R.Br. at two sites in eastern England. Bot J Linn Soc
126:39–48
Young A, Boyle T, Brown T (1996) The population genetic
consequences of habitat fragmentation for plants. Trends
Ecol Evol 11:413–418
Plant Ecol (2012) 213:1583–1595 1595
123