SHORT-TERM FORECAST OF GOLD PRICE USING...
23
1 SHORT-TERM FORECAST OF GOLD PRICE USING GENERALIZED AUTOREGRESSIVE CONDITIONAL HETEROSCEDASTIC MODELS SITI NOR HAZANAH BINTI MOHAMED A Dissertation submitted in partial fulfillment of the requirements for the award of the degree of Master of Science (Mathematics) Faculty of sciences University Technology Malaysia DISEMBER 2011
Transcript of SHORT-TERM FORECAST OF GOLD PRICE USING...

1
SHORT-TERM FORECAST OF GOLD PRICE USING GENERALIZED
AUTOREGRESSIVE CONDITIONAL HETEROSCEDASTIC
MODELS
SITI NOR HAZANAH BINTI MOHAMED
A Dissertation submitted in partial fulfillment of the requirements for the
award of the degree of Master of Science (Mathematics)
Faculty of sciences
University Technology Malaysia
DISEMBER 2011

iii
gÉ Åç uxÄÉäxw {âuuç? ytÅ|Äç tÇw yÜ|xÇwáA
iv
ACKNOWLEDGEMENT
First of all, thanks to Allah s.w.t, for His mercy I can finish this dissertation.
In completing this dissertation, I have been helped by many people that support me
to finish this dissertation. I would like to give my big appreciation to my supervisor,
Assoc. Prof. Dr. MaizahHurabinti Ahmad and my co-supervisor, Dr. Ani bin Sabri
for their guidance and help in completing this dissertation.
To my parents, beloved hubby and family, thanks for their advice and support
during the completing of this study. I am also grateful to a number of friends and
colleagues who always give me support to complete this study.
A big appreciation to everyone who cannotbe mention their names here that
involve in the completion of this study.

v
ABSTRACT
Gold is used in many industries and it is popular as a good investment.
However, its price can fluctuate widely. There are many mathematical
models that can be used to forecast gold prices. In this study, the
Generalised Autoregressive Conditional Heteroscedastic (GARCH) and
Autoregressive Integrated Moving Average (ARIMA) models are
developed to produce short term forecasts of gold prices. GARCH model
is developed due to it is ability to capture the volatility by the non-
constant of conditional variance while forecasts produced by the ARIMA
model are used as a benchmark. Comparison of forecasts produced by
GARCH and ARIMA models are based on two performance measures:
mean absolute percentage error (MAPE) and root mean square error
(RMSE). In this study, analyses are done by using Minitab and E-Views
software. In general, it can be concluded that the GARCH model is a
potential method for forecasting trading day data of gold prices.
vi
ABSTRAK
Emas digunakan dalam banyak industry dan terkenal sebagai pelaburan yang
baik. Walau bagaimanapun, harga emas adalah sentiasa berubah. Model
matematik kerap digunakan dalam telahan harga emas. Dalam kajian ini, model
Autoregresi Umum Bersyarat Heteroskedastik (GARCH) dan Autoregresi
Terkamir Purata Bergerak (ARIMA) akan di bangunkan untuk menghasilkan
telahan jangka pendek bagi harga emas. Model GARCH dibangunakan kerana
ia boleh menguasai volatility melalui varians bersyarat yang tidak tetap
sementara telahan yang dihasilkan oleh model ARIMA digunakan sebagai
penanda aras. Perbezaan telahan yang dihasilkan daripada model GARCH dan
ARIMA adalah berdasarkan kepada dua ukuran pencapaian: peratus purata
ralat mutlak (MAPE) dan punca kuasa dua purata ralat (RMSE). Dalam kajian
ini, analisis dijalankan dengan menggunakan sofwer Minitab dan E-views.
Secara amnya, dapat disimpulkan bahawa model GARCH adalah kaedah yang
boleh digunakan untuk penelahan harga emas.

4
CHAPTER ITEM PAGE TITLE i DECLARATION ii
DEDICATION iii ACKNOLEDGEMENTS iv ABSTRACT v ABSTRAK vi
TABLE OF CONTENTS vii LIST OF TABLES xi LIST OF FIGURES xii LIST OF SYMBOLS xiv LIST OF APPENDICES xvi I INTRODUCTION
1.1 Introduction 1
1.2 Background of the Study 4
1.3 Statement of the problem 3
1.4 Objectives of the Study 3
1.5 Scope of the Study 4
1.6 Significance of the Study 4
1.7 Summary and Outline of the Proposal Report 4
II LITERATURE REVIEW
2.1 Introduction 6
2.2 Gold and its Importance 6
2.3 Gold Forecasting Techniques 7
5
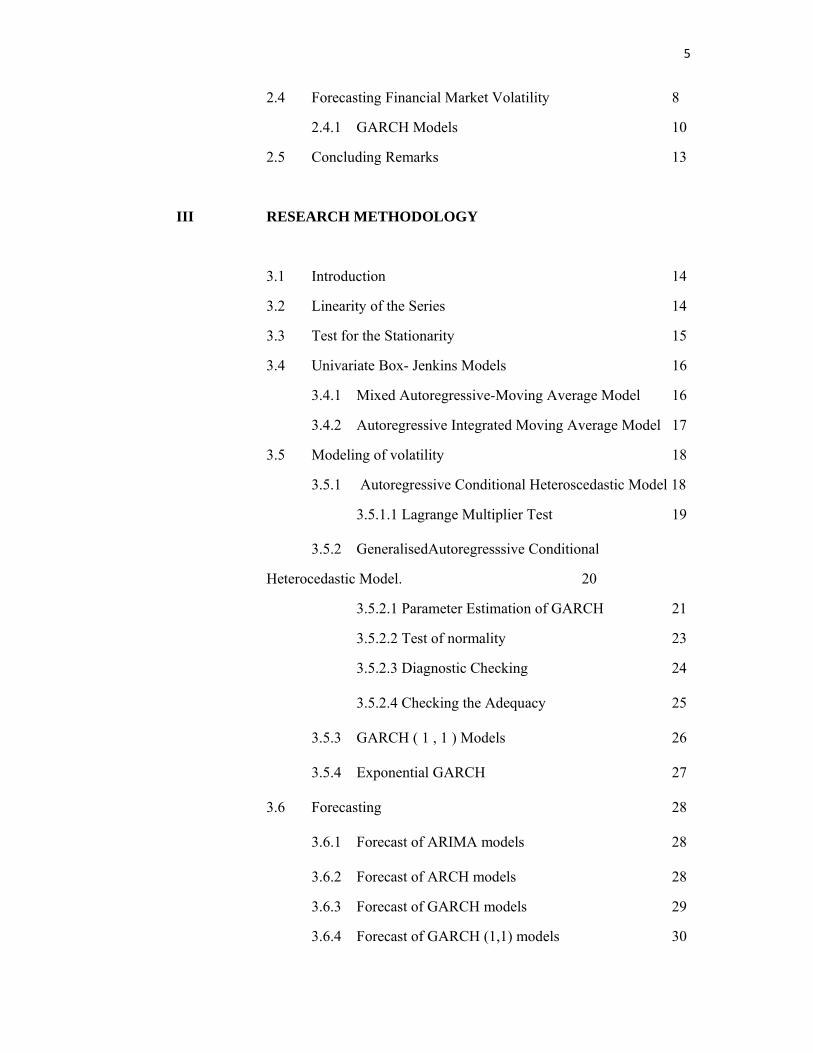
2.4 Forecasting Financial Market Volatility 8
2.4.1 GARCH Models 10
2.5 Concluding Remarks 13
III RESEARCH METHODOLOGY
3.1 Introduction 14
3.2 Linearity of the Series 14
3.3 Test for the Stationarity 15
3.4 Univariate Box- Jenkins Models 16
3.4.1 Mixed Autoregressive-Moving Average Model 16
3.4.2 Autoregressive Integrated Moving Average Model 17
3.5 Modeling of volatility 18
3.5.1 Autoregressive Conditional Heteroscedastic Model 18
3.5.1.1 Lagrange Multiplier Test 19
3.5.2 GeneralisedAutoregresssive Conditional
Heterocedastic Model. 20
3.5.2.1 Parameter Estimation of GARCH 21
3.5.2.2 Test of normality 23
3.5.2.3 Diagnostic Checking 24
3.5.2.4 Checking the Adequacy 25
3.5.3 GARCH ( 1 , 1 ) Models 26
3.5.4 Exponential GARCH 27
3.6 Forecasting 28
3.6.1 Forecast of ARIMA models 28
3.6.2 Forecast of ARCH models 28
3.6.3 Forecast of GARCH models 29
3.6.4 Forecast of GARCH (1,1) models 30

6
3.6.5 Forecast of EGARCH models 31
3.7 Measures of performance 31
3.8 Operational Framework 32
IV DATA ANALYSIS
4.1 Introduction 34
4.2 Data analyses 34
4.3 Data Modeling 35
4.3.1 Analyses of Data using Box-Jenkins Model 35
4.3.2 Testing for Stationarity 37
4.3.3 Model Identification 38
4.3.4 Parameter Estimations of ARIMA Model 40
4.3.5 Analyses of Data using GARCH Model 41
4.3.5.1 Testing for volatility 41
4.3.5.2 Parameter Estimation of ARCH Model 44
4.3.5.3 Parameter Estimation of GARCH Model 44
4.3.5.4 Parameter Estimation of EGARCH Model 45
4.4 Performance Measure 46
4.5 Concluding Remarks 47
V DISCUSSION OF RESULTS
5.1 Introduction 48
5.2 Prediction of Gold Prices using the GARCH model 48
5.3 Forecast gold price using ARIMA Models 48
5.4 Forecast gold price using GARCH Models 50
5.5 Comparison between GARCH and ARIMA
Models in Forecasting Gold Prices 54

7
5.6 Concluding Remarks 55
VI CONCLUSIONS AND SUGGESTIONS
6.1 Introduction 56
6.2 Summary and Conclusions of the study 56
6.3 Suggestion for Future Study 57
REFERENCES 59
APPENDICES Appendix A 64
LIST OF FIGURES
8
FIGURE NO. ITEM PAGE
3.1 Linear Trend 15
4.1 Gold Prices from 4 Jan 2000 until 12 March 2010. 35
4.2 Graph of stationary 37
4.3 Autocorrelation Function (ACF) for d=1 38
4.4 Partial Autocorrelation Function (PACF) for d=1 39
4.5 Graph of forecasting gold price of ARIMA (1,1,3) 41
4.6 Variance not constant 41
4.7 Volatility clustering 42
4.8 Normality Graph 43
4.9 Forecasting Graph of variance of ARCH (1) 44
4.10 Forecasting Graph of variance of GARCH (1,3) 45
4.11 Forecasting Graph of variance of EGARCH (1,3) 46
5.1 Graph of forecasting ARIMA (1, 1, 3) 50
5.2 Graph of forecasting GARCH (1,3) 52
5.3 Graph of forecast of variance of GARCH (1,3) 52
5.4 Graph of forecasting EGARCH (1,3) 53
5.5 Graph of forecast of variance of EGARCH (1,3) 53

9
LIST OF SYMBOL

10
t - time
- conditional variance
p - lag order of the autoregressive
q - lag order of the moving average
d - difference of model
α - parameter equation
β - parameter equation
(B) - autoregressive operator of order p
(B) - moving average operator of order q
- equation in time
- mean
- delta
1 - dth difference
- shock at time t
B - backward shift operator
- conditional mean
- residual error
- likelihood of .
- pi
S ‐ skewness
n ‐ number of observations
- kurtosis
- sample mean
- variance
- portmanteau test
11
T - number of observations in portmanteau test
log - log conditional variance
- gamma
- forecast of a t time
LIST OF APPENDICES

12
APPENDIX TITLE PAGE
A Gold price data in Australian dollar from 4 January 64
2000 until 14 March 2010.
CHAPTER 1
13
INTRODUCTION
1.1 Introduction
Sequences of data points is a time series, typically the measurement at
successful times spaced at uniform time intervals. Time series analysis comprises of
methods for analyzing time series data in order to get meaningful statistics and other
characteristics of the data.Many types of data are collected over time such as stock
prices, sales volumes, interest rates, and quality measurements.
Forecasting is a planningtool which helps management to deal with the
uncertainty of the future. Forecasts or estimation are made for several days, weeks,
months or years ahead using models such asBox-Jenkins, neural network and fuzzy
models. In time series forecasting, the model used to forecast future events are based
on known past events to predict data points before they are measured. This
requirement has maintained a high rate of activity in various research fields
dedicated to temporal prediction methodologies. Two important application domains
are financial markets and environmental systems. Predicting such systems has been
attempted for decades but it remains such a challenging task for a wide array of
modeling paradigms. Modeling real world systems is a demanding task where many
factors must be taken into account.
Price forecasting has become a very valuable tool in the currently abruptly
change of deregulation in gold markets. The companies that trade in gold markets
make extensive use of price prediction to see future investments. Price forecasting
includes cost forecasting and forecasting the components that make up the price. In
competitive markets, prices are less predictable and forecasting prices involves
understanding the uncertainties surrounding the drivers of price as well as results of
forecasting models.
14
In gold forecasting, financial data is used to predict the price of gold in
market where it is subjected to uncertainties. Today, forecasting of gold price is
made by collecting data that describe its current price in market. Then, physically-
based mathematical models are used to determine how the price of gold is expected
to change in the future.
In financial time series the emphasis has been given on forecasting the
volatility or the time-varying conditional variance of the series under studied.
Volatility forecasts are important for many financial decisions made by policy
makers, option traders and investors. The ARCH class of models, pioneered by Engle
in 1982 (Ser-Huang Poon, 2005) and generalized by Bollerslev in 1986 (Ser-Huang
Poon, 2005), is by far the most popular class of econometric models for describing a
series with time-varying conditional variance.
1.2 Background of the Study
Gold prices are posted on daily trading days, which are weekdays except
major holidays. There are consequently about 255 trading days each year. A
forecasted price can be produced for every day of the year but gold prices are given
only on trading days. The “missing” gold prices can be ignored or the price in
weekend is assumed to be the same with the price on Friday. The value of gold price
in the market is volatile where the variance is not constant. Volatility is one of the
most important concepts in the whole of the finance field. Measuring volatility by the
standard deviation variance of returns is often used as a crude measure of the total
risk in financial assets. Many values in risk models used for measuring market risk
require the forecast of the volatility parameters.
All pricing models for financial options require a volatility estimate or
forecast as an input. One of the purposes for studying the forecast of gold prices it to
attract more new investment money since such activity is reducing. The recent global
turmoil has reaffirmed the significance of gold as a safe and good investment
alternative. Other precious metals such as platinum have not been able to take the
position of gold, due to its high value and price volatility. In addition to retail
15
investors, central banks, institutions and pension funds also take large positions in
gold and drive its prices.
In the case of volatile market conditions and a weakening currency, people
start replacing their dollar investments with gold. This ensures that the investors do
not lose their purchasing power by the day. The demand for gold is increasing and
this consequently drives the prices of gold to go up. Gold prices are not dependent
upon the political or economic conditions. Natural calamities, political disturbances
or wartime have also been reported not to affect the value of gold. In other words, the
value of gold is always increasing regardless of what is happening around the world.
1.3 Statement of the problem
The recent global turmoil has reaffirmed the significance of gold as a safe and
good investment alternative. As the price of gold is highly volatile throughout the
time and volatility forecasts are important for many financial decisions, this study
will explore the following question:
Setting a Box-Jenkins model as the benchmark model, does GARCH model
perform better as a method for forecasting gold prices, which is of high volatility.
1.4 Objectives of the Study
The objectives of the study are stated as follows:
(i) To explore volatility by using GARCH models.
(ii) To develop ARCH, GARCH, Box-Jenkins models for gold prices
(iii) To forecast gold prices using ARCH, GARCH and Box-Jenkins
models.
(iii) To compare the forecasting performances of the ARCH, GARCH and
Box-Jenkins models in forecasting gold prices.
16
1.5 Scope of the Study
The scopes and limitations of this study are as follows. This research will
investigate a generalized autoregressive conditional heterocedastics(GARCH) model
and will use the data of gold prices. The results of Box- Jenkins model will be used
as a benchmark. The forecasting performances of the models will be evaluated using
mean absolute percentage error (MAPE) and root mean square error (RMSE).
1.6 Significance of the Study
Since the gold market is highly volatile, the estimation of the time series
model must be able to detect its volatility. This study will determine the precise Box-
Jenkins and GARCH models for forecasting the volatility of gold prices. The process
will be done with the aid of software. As a result of this study, models and software
that can be used to forecast volatile time series can be proposed.The ability to
forecast gold price will greatly affect the financial market of gold.
1.7 Summary
The purpose of this study is to conduct a study on handling the volatility of
time series data using Generalised autoregressive conditional heteroscedastics
(GARCH). For this purpose, the data used is gold prices. Chapter 1 discusses the
research framework. It begins with the introduction to gold prices and the
background of the study. The objectives, scope and the significance of this study are
also presented.
In chapter 2, forecasting and time series are presented. The discussion starts
with gold forecasting in general. Development in time series analysis and technical
advances of the methodology are also discussed. Chapter 3 begins with a discussion
on the types of time series models. In this chapter, the research methodology of the
17
current study is also described. Chapter 4 presents analyse of the data of the research.
Chapter 5 discusses the results of study and chapter 6 is the conclusion.
CHAPTER II

71
REFERRENCES
Adrienne, A. K. and Raymond, E. L. (2007). Gold and platinum: Toward solving the
price puzzle. The Quarterly Review of Economics and Finance.49, 884-892.
Aftar, M. (2008).Short-term Forecast of Rainfalls in Lembah Kelang Using
Multivariate Autoregressive Integrated Moving Average Model.
Master.Dissertation.University Technology Malaysia.
Angelidies, T. and Degiannakis, S. (2008). Forecasting one-day-ahead VaR and
intra-day realized volatility in the Athens Stock Exchange Market. Managerial
Finance. 34(7), 489-497.
Ashley, R.A. and Patterson, D.M. (2000).A Nonlinear time series workshop : A
Toolkit for Detecting and Identifying Nonlinear Serial Dependent. Kluwer
Academic Publisher. 39-50. http://books.google.com.my
Bollerslev, T. (1986).Generalized Autoregressive Conditional
Heteroskedasticity.Journal of Econometrics. 31, 307-327.
Bollerslev, T., Chou, R.Y. and Kroner, K.F. (1992). ARCH modeling in finance: A
review of the theory and empirical evidence. Journal of Econometrics. 52, 5-
59.
Bollerslev, T., Engle, R.F. and Nelson, D.B.(1994). ARCH Models.Handbook of
Econometrics. 4, 2977-2984.
Brailsford, T.J. and Faff, R.W. (1996).An evaluation of volatility forecasting
techniques.Journal of Banking & Finance. 20, 419-438.
Brooks, C. (2008). Introductory Econometrics for Finance.Second
edition.Cambridge University Press Cambridge, New York, Melbourne,
Madrid, Cape Town, Singapore, Sao Paulo. 380-399
Brooks, C. and Burke, S.P. (1998). Forecasting Exchange Rate Volatility Using
Conditional Variance Models Selected by Information Criteria. Economics
Letters. 61, 273–278.
72
Byun, S.J. and Rhee, D.W (2011).Intraday Volatility Forecasting From Implied
Volatility.Internatinal Journal of Managerial Finance. 2, 83-100.
David A. Dickey and Wayne A. Fuller (1979). Distribution of the Estimators for
Autoregressive Time Series With a Unit Root. Journal of the American
Statisticial Association. 74(366) . http://books.google.com.my.
Degiannakis, S. and Xekalaki, E. (2010). ARCH models for Financial Applications.
John Wiley & Sons.Page, 31, 66, and 67. http://books.google.com.my.
Dorina, L. and Simina, U. (2006).Testing Efficiency of the Stock Market in
Emerging Economies.Economics.827-830.
Engle, R. (1982), Autorregressive Conditional Heteroskedasticity with Estimates of
United Kingdom Inflation, Econometrica, 50, 987-1008.
Engel, R. and Ng, V. (1993). Measuring and testing the impact of news on volatility.
The Journal of Finance 5.1749-1778.
Engle, R. (2001). GARCH 101: The Use of ARCH/GARCH Models in Applied
Econometrics. Journal of Economic Perspectives.15 (4), 157-168.
Francq, C. and Zakoian, J.N. (2004). Maximum likelihood estimation of pure
GARCH and ARMA-GARCH processes. Bernoulli. 10(4), 605–637.
Garcia, R.C., Contreras, J., Akkeren, M.V. and Joao Batista, C. G. (2003).A GARCH
Forecasting Model to Predict Day-Ahead Electricity Prices.IEEE Power
Systems Journal.Workshop of Applied Infrastructure .Berlin, Germany,
October 11, 2003
Ghahramani, M. and Thavaneswaran, A. (2006).Financial applications of ARMA
models with GARCH errors.The Journal of Risk Finance. 7, 525-543.
Ismail, Z., Yahya, A. and Shabri, A. (2009).Forecasting Gold Prices Using Multiple
Linear Regression Method.American Journal of Applied Sciences. (8), 1509-
1514.
Karanasos, M. and Kim, J. (2003).Moments of the ARMA–EGARCH
model.Econometrics Journal.6, 146–166.
73
Kaufmann, T.D. and Winters, R.A. (1989) .The price of gold: A simple model.
Resources Policy.309-313.
Krauth, P. (2011). Gold price forecast: Four reasons the “Yellow Metal” will Hit
$1,900 an ounce 2011. http://moneymorning.com
Lee, K.Y. (1991). Are the GARCH models next term best in out-of-sample
performance?.Journal of Econometrics. 37 (3), 305-308.
Melike, B. and Ozgur, O.E. (2009). Improving forecasts of GARCH family models
with the artificial neural networks: An application to the daily returns in
Istanbul Stock Exchange. Expert Systems with Applications. 36, 7355-7362.
Minovic, J. (2008). Application and Diagnostic Checking of Univariate and
Multivariate GARCH Models in Serbian Financial Market.Belgrade Banking
Academy.40, 73-87.
Ng, V., Engle, R.F. and Rothschild, M. (1992). A Multi-Dynamic-Factor Model For
Stock Returns. Journal of Econometrics. 52, 245-266.
Nyamongo, M.E. and Misawati, R. (2010).ModellingThe Time-Varying Volatility of
Equities Return in Kenya. African Journal of Economics and Management
Studies. 1, 183-196.
Pantelidis, T. and Pittis, N. (2003). Forecasting Volatility with a GARCH(1,1)
Model: Some New Analytical and Monte Carlo Results.Preliminary Version.1-
33.
Paresh, K.N., Seema, N. and Zheng, X. (2010). Gold and oil futures markets: Are
markets efficient?.Applied Energy. 87, 3299-3303.
Perrelli.R. (2001).Introduction to ARCH & GARCH models.Economics. 472
Poon, S.H. (2005).A practical guide to Forecasting financial market volatility.John
Wiley and Sons.1-43.
Posedel, P. (2005). Properties and Estimation of GARCH(1,1).
Metodoloskizvezki.2(2), 243-257.
74
Rockerbie, D.W. (1999). Gold prices and gold production: Evidence for South
Africa. Resources Policy. 25, 69–76
Rosa, L. (2010). Market forecasting: the predictive power of price patterns.
http://www.advancedmcode.org.
Ross, S. G. and Ian, M.M. (2001).The volatility of the socially optimal level of
investment.Journal of Policy Modeling. 23, 901–928.
Shahriar, S. and Erkan, T. (2010). An Overview of Global Gold Market and Gold
Price Forecasting.Resources Policy. 35, 178-189.
Tanizaki, H. and Hamori, S (2009). Volatility Transmission Between Japan, UK and
USA in Daily Stock Returns. Empir Econ. 36, 27-54.
Taylor S. J. (1987). Forecasting The Volatility of Currency Exchange Rates.Journal
of Econometrics. 3 (1), 159-170.
Teräsvirta.T (2006).An Introduction to Univariate GARCH Models.Economics and
Finance, 646.
Tsay, A.A. (2001). Managing Retail Channel Overstock: Markdown Money and
Return Policies.Journal of Retailing. 77, 457–492.
Tully, E. andLucey, B.M. (2006). A power GARCH examination of the gold market
.Research in International Business and Finance. 21, 316–325
West, K.D. and Cho, D. (1995) The predictive ability of several models of exchange
rate volatility. Journal of Econometrics. 69, 367-391.
Wiggins, J.B. (1987). Option values under stochastic volatility: Theory and empirical
estimates. Journal of Econometrics. 19(2), 351-372.
Zaidi, I.danNorhayati, A.J. (2004). TabiatKemeruapanPerubahanHargaGetahAsli
Malaysia.JurnalEkonomi Malaysia. 38, 63-79.


![[PPT]Perencanaan dan Keuangan Jangka Pendek - …peni.staff.gunadarma.ac.id/Downloads/files/7617/Peren... · Web viewPendanaan Jangka Pendek Materi ke- 9 Manajemen Keuangan AP 2 Magister](https://static.fdocuments.in/doc/165x107/5c79d1aa09d3f2c9458c9fd2/pptperencanaan-dan-keuangan-jangka-pendek-penistaff-web-viewpendanaan.jpg)
