Short- and long-run tax elasticities: the case of the ... · The short-term elasticity, measuring...
43
WORKING PAPER SERIES NO 763 / JUNE 2007 SHORT- AND LONG-RUN TAX ELASTICITIES THE CASE OF THE NETHERLANDS by Guido Wolswijk
Transcript of Short- and long-run tax elasticities: the case of the ... · The short-term elasticity, measuring...

ISSN 1561081-0
9 7 7 1 5 6 1 0 8 1 0 0 5
WORKING PAPER SER IESNO 763 / JUNE 2007
SHORT- AND LONG-RUN TAX ELASTICITIES
THE CASE OF THE NETHERLANDS
by Guido Wolswijk

In 2007 all ECB publications
feature a motif taken from the €20 banknote.
WORK ING PAPER SER IE SNO 763 / JUNE 2007
This paper can be downloaded without charge from http://www.ecb.int or from the Social Science Research Network
of tax measures, and colleagues at an ECB seminar for their comments, in particular M. Mohr. The views expressed are those of the author and do not necessarily represent those of the ECB.
SHORT- AND LONG-RUN TAX ELASTICITIES
THE CASE OF THE NETHERLANDS 1
by Guido Wolswijk 2
electronic library at http://ssrn.com/abstract_id=989727.
1 The author would like to thank the Dutch Ministry of Finance for kindly providing data on tax receipts and on revenue effects
2 European Central Bank, Kaiserstrasse 29, 60311 Frankfurt am Main, Germany; email: [email protected]

© European Central Bank, 2007
AddressKaiserstrasse 2960311 Frankfurt am Main, Germany
Postal addressPostfach 16 03 1960066 Frankfurt am Main, Germany
Telephone +49 69 1344 0
Internethttp://www.ecb.int
Fax +49 69 1344 6000
Telex411 144 ecb d
All rights reserved.
Any reproduction, publication and reprint in the form of a different publication, whether printed or produced electronically, in whole or in part, is permitted only with the explicit written authorisation of the ECB or the author(s).
The views expressed in this paper do not necessarily reflect those of the European Central Bank.
The statement of purpose for the ECB Working Paper Series is available from the ECB website, http://www.ecb.int.
ISSN 1561-0810 (print)ISSN 1725-2806 (online)

3ECB
Working Paper Series No 763 June 2007
CONTENTS
Abstract 4
Non-technical summary 5
1. Introduction 7
2. Defining the elasticity of taxes 9
3. Tax revenues in the Netherlands 14
4. Estimation results 17
5. Conclusions 26
Tables 28
Annex 1: Data sources and methods 33
34
References 37 European Central Bank Working Paper Series 40
Annex 2: Unit root test results

Abstract
This paper provides estimates for the base elasticities of Dutch taxes, paying
particular attention to differences between short-and long-term elasticities,
and allowing for asymmetric adjustment. Estimates are presented for five tax
categories for the period 1970-2005, after making appropriate corrections for
effects of discretionary tax measures. The empirical results indicate that short-
term elasticities often are lower than long-term ones, notably when taxes are
subdued. Consequently, shocks to tax revenues tend to be aggravated by the
dynamics of short-term elasticities. Ignoring differences between short- and
long-term elasticities contributes to revenue ‘surprises’ and an incorrect
assessment of the fiscal stance.
Keywords: Tax revenue, income elasticity, fiscal indicators, The Netherlands JEL classification: H2, H62, H68
4ECB Working Paper Series No 763June 2007

Non-technical summary
The responsiveness of government tax revenues to macroeconomic
developments is an important variable in forecasting tax revenues in
preparation of next year’s fiscal budget. It is also a key input for cyclically-
adjusting budgetary variables. In the European context, cyclically-adjusted
balances are used frequently for assessing whether countries progress
sufficiently quickly towards a sound budgetary position or have already
reached such level. The relevance of accurate tax elasticities was recently
highlighted when tax receipts in many European countries improved by much
more than could be accounted for by combining economic growth rates with
standard tax elasticities.
Tax elasticities usually are considered constant over time although there are
good grounds to expect it to fluctuate over time. As an example, short-term
fluctuations in household income may have a more-than-proportional effect on
consumption of luxury items (being highly-taxed), which would be reflected in
higher VAT-revenues. The short-term elasticity, measuring the percentage
change in tax receipts in case of a 1% change in the tax base, in that case
would exceed the long-term one. Short-term elasticities may not only vary
over time but may also behave in an asymmetrical manner.
This paper considers short- and long-term elasticities of tax revenues with
regard to their bases, a distinction usually ignored in European tax research.
In estimating long-term elasticities, we take into account possible sources of
bias and inconsistency in estimating co-integrated relations in levels, via
DOLS-estimation and Newey-West correction. As to the short-term
elasticities, which are estimated in changes-in-logs form, we include error-
correction terms reflecting deviations of actual tax receipts form the long-term
equilibrium level. In doing so, we allow for asymmetries in the tax revenue
response to the base.
Estimates refer to the Netherlands, being one of the very few countries to
publish long series on discretionary tax measures. This allows for deriving tax
5ECB
Working Paper Series No 763 June 2007

revenue series that are cleaned of discretionary measures, and thus reflect
endogenous tax revenue growth. This proves to be important as discretionary
measures over the estimation period of 1971-2005 on balance increased
indirect tax receipts and lowered direct tax receipts. Not correcting the series
would result in biased estimates of the elasticities. We not only take account
of the impact of such measures on tax receipts in the current year but also in
other years.
The outcomes for the 5 central government tax categories distinguished
confirm differences between short-term and long-term tax elasticity values,
especially for direct taxes (personal income tax, corporate income tax, and
other direct taxes). Differences are especially large in “bad times” (tax receipts
below the long-run equilibrium). The outcomes in most cases also indicate
asymmetry in tax-to-base elasticities. When tax receipts are above the long-
term value, elasticities tend to be higher, likely indicating shifts in consumption
patterns towards more luxury (higher-taxed) goods and services, reduced
possibilities for corporations to compensate profits with past losses, and less
cautious dividend pay-out policies. The error-correction term is significant in
all short-term equations, but there is only evidence of an asymmetric effect of
the error-correction term for VAT-receipts. While error-correction terms may
not be interpreted directly as cyclical indicators, some correlation seems to be
in place, pointing to pro-cyclical elasticities.
Failure to distinguish between short-term and long-term revenue elasticities
therefore add to ‘budget surprises’, which in fact rather reflect forecast
inadequacies. Such appears to be the case particularly in times of negative
surprises (tax receipts being below the long-term value), especially for direct
taxes. Ignoring such aspects may also contribute to inaccurate calculations of
the (cyclically-adjusted) fiscal indicators on which policy actions or
recommendations are often based in Europe.
6ECB Working Paper Series No 763June 2007
1. Introduction
The responsiveness of government tax revenues to macroeconomic
developments is a key variable for fiscal policy, used for instance by
governments in forecasting revenue growth when preparing budgets. In the
European context, the tax elasticity plays a role in setting minimum
benchmarks for budget balances that reduce chances of deficits surpassing
the 3% of GDP limit in cyclical downturns. It also is used in estimating
cyclically-adjusted balances, which in the European context are used
intensively, e.g. for assessing progress towards sound public finances. The
relevance of accurate tax elasticities was demonstrated in 2005 and 2006
when tax receipts in many European countries improved more than could be
accounted for by combining economic growth rates with standard elasticities.
The tax elasticities used for the purposes above is often a constant over time
although there are good grounds to expect it to fluctuate over time. For
instance, short-term household income fluctuations may affect luxury
consumption items, being highly-taxed, more than proportional, causing a
higher short-term elasticity. Another example could be that firms attempt to
avoid cuts in distributed dividend in economic downturns to uphold
shareholders’ confidence, with changes in dividend policies and thus in tax
revenues mainly occurring in good economic times. The latter example not
only shows that short-term elasticities may vary over time, but also that
asymmetries can be at play.
Ignoring short-term behaviour of elasticities leads to biased fiscal indicators. It
may be a source of systematic over- and underestimation of tax receipts2,
which may induce unwarranted fiscal policy responses, e.g. government
overspending in case of tax overestimation. In addition, using incorrect
2 Such applies in particular if in the short-run elasticities are pro-cyclically, thus reinforcing the tax revenue effect of a positive growth shock via a higher value of the elasticity.
7ECB
Working Paper Series No 763 June 2007

elasticity values can lead to an inaccurate assessment of the fiscal stance.3
Finally, from a longer-term perspective, differences in short- and long-term
elasticities allow circumventing a trade-off between tax revenue growth and
stability of tax revenues: in principle, high (long-term) growth rates can be
combined with short-term stability in taxes, and vice versa. An appropriate
selection of taxes may deliver a tax portfolio closer to the tax frontiers, taking
account of preferences regarding tax revenue growth and stability (see
Seyfried and Pantuosco, 2003, for an application to US state taxes).
This paper focuses on both long- and short-run elasticities for the
Netherlands. Apart from paying attention to long-term elasticities that measure
the growth of tax receipts over time, we focus on estimating short-term
elasticities, being an ignored aspect in European tax-research. Another
contribution of this paper is that we take into account possible sources of bias
and inconsistency in long-run estimates of co-integrated relations. In the
short-run estimates, apart from including error-correction terms, we allow for
asymmetries in the tax revenue response to the base. This is applied to the
Netherlands, being one of the very few countries publishing long series on
discretionary tax measures. This series allows for deriving tax revenue series
that are cleaned of discretionary measures, and thus reflect endogenous tax
revenue growth.
The outline of this paper is as follows. Section 2 sets out the importance of
distinguishing between short-term and long-term elasticities of tax receipts.
Furthermore, it highlights the merits of correcting tax series for discretionary
tax measures to avoid biased estimates. Section 3 describes main features of
the tax system in the Netherlands. Section 4 contains the estimation
outcomes, while the final section contains our conclusions.
3 The fiscal stance usually is measured by the change in the cyclically-adjusted primary balance. Using too low a value of the elasticity would lead to underestimating the cyclical budgetary component, with too large a part of the budgetary outcome being allocated to the structural or “policy-related” part of the fiscal change.
8ECB Working Paper Series No 763June 2007

2. Defining the elasticity of taxes
We focus in this paper on the base elasticity of taxes, measuring the
endogenous growth in tax receipts following a 1% change in the tax base.
Two key elements in this definition requiring further elaboration are the time-
period over which the 1% change in the base is measured, and the concept of
endogenous tax growth.
As to the time-frame, figure 1 shows two hypothetical tax series that co-move
with long-term growth of the base and with the business cycle.4 Regressions
of tax receipt levels on the tax base will deliver the same value for the (long-
term) elasticity, given identical trends. However, their short-run responses
differ, the cyclically-sensitive one fluctuating much more in line with the
business cycle or, in other words, acting more strongly as an automatic
stabiliser. The short-term elasticity measures the immediate change in tax
receipts if the tax base changes by 1 percent.
Figure 1. Long- and short-run base elasticities of taxes
time
tax
reve
nue
cyclically-insensitive tax cyclically-sensitive tax
Views on whether high or low values of the short-term tax revenue elasticities
are preferable seem to differ across the Atlantic. US-oriented literature points
to large cyclical tax variability as a nuisance for complying with state fiscal
rules which often require annual balanced (current) budgets. In such a 4 The example is close to the one shown in Sobel and Holcombe (1996).
9ECB
Working Paper Series No 763 June 2007

context, countercyclical elasticities are preferred, giving rise to relatively
stable tax revenue growth (Fox and Campbell, 1984).5 In Europe, however,
swaying tax receipts with the cycle is regarded as an important
macroeconomic stabilisation tool as countries in the euro area face
centralised monetary policy, limitations on the size of the budget deficit, no
European cyclical cross-country transfer system, and limited price and wage
flexibility. This is recognised in the Stability and Growth Pact which commits
countries to aim for small deficits or even surpluses so that there is room for
the automatic stabilisers to operate freely without surpassing the 3% of GDP
deficit threshold in a ‘normal’ downturn.
Derivation of elasticity values is most commonly done via macroeconomic
models, via theoretical considerations regarding income elasticities, and via
time-series analysis (Van den Noord, 2000).6 Our approach focuses on the
latter given the emphasis we want to give to the time-varying properties of the
elasticities. Apart from standard fixed coefficient regression analysis, time-
series approaches can also include the random coefficient approach (Otsuka
and Braun, 1999) and the variable elasticity approach (Fox and Campbell,
1984). However, doing so requires more detailed data over a long period than
are available in the Dutch case at hand.
Time-series analysis also allows for econometrically taking into account the
analytical distinction between long- and short-term elasticities. Many tax
revenue series have a unit root and require differencing once to obtain
stationarity. Long-term elasticities then can be estimated as follows:
log T05,t = θ + δ log Bt + γt [1]
With T05,t = tax revenue in year t adjusted for discretionary measures
θ = intercept
Bt= tax base in year t
5 Many US states have rainy day-funds in place to further reduce the impact of tax variability on the budget. 6 See Creedy and Gemmell, 2004, for a good example for the UK.
10ECB Working Paper Series No 763June 2007

γ = error
while for the short-term elasticity, a difference-equation is taken to arrive at
stationary series:
∆ log T05,t = α + β.∆ log Bt + εt [2]
Making this distinction is a correct procedure provided the levels of tax
receipts and the bases are co-integrated, and the difference equation is
stationary. The error-correction term derived from long-term equation [1], i.e.
the one-year lagged difference between the actual tax revenue and the
longer-run equilibrium value of taxes, then can be added to the short-term
equation, reflecting that deviations from the long-run path may have an impact
on short-term tax receipts:
∆ log T05,t = α + β.∆ log Bt + λ. γt-1 + εt [3]
with λ referred to as the adjustment parameter, indicating the percentage of
last year’s deviation being corrected in the current period.
Short-term changes in tax revenues thus may come from two channels:
directly, via changes in the tax base, and indirectly, via deviations from the
longer-term path. This can lead to a situation where the tax base declines but,
due to the effect of the error-correction, tax revenues nevertheless increase.
Ignoring the error-correction term may result in rather poor estimation results
and biased coefficients.
A further refinement allows for the strength of the attraction to be different on
both sides of the attractor in the short-run tax response. One way of testing
this is to distinguish between positive and negative values of the error-
correction term (Granger and Lee,1989).
∆ log T05,t = α + β. ∆ log Bt + λ1. γ t -1+ + λ2. γ t -1
- + ε t [4]
11ECB
Working Paper Series No 763 June 2007
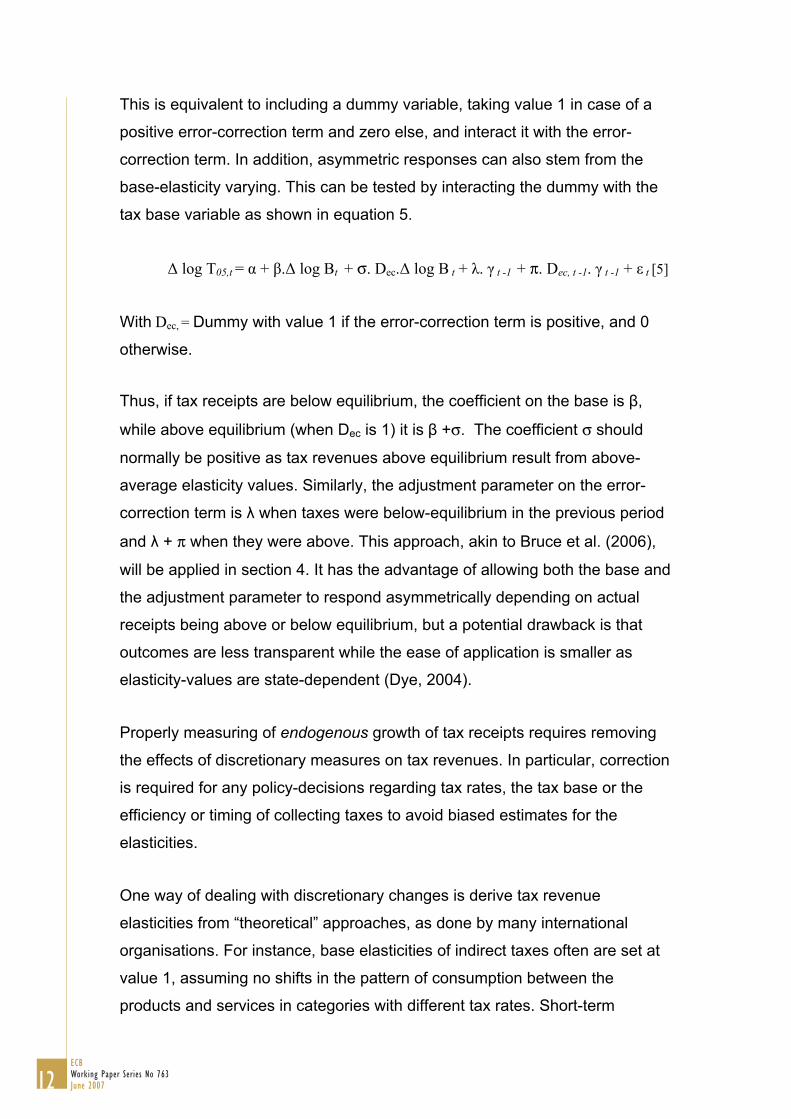
This is equivalent to including a dummy variable, taking value 1 in case of a
positive error-correction term and zero else, and interact it with the error-
correction term. In addition, asymmetric responses can also stem from the
base-elasticity varying. This can be tested by interacting the dummy with the
tax base variable as shown in equation 5.
∆ log T05,t = α + β.∆ log Bt + σ. Dec.∆ log B t + λ. γ t -1 + π. Dec, t -1. γ t -1 + ε t [5]
With Dec, = Dummy with value 1 if the error-correction term is positive, and 0
otherwise.
Thus, if tax receipts are below equilibrium, the coefficient on the base is β,
while above equilibrium (when Dec is 1) it is β +σ. The coefficient σ should
normally be positive as tax revenues above equilibrium result from above-
average elasticity values. Similarly, the adjustment parameter on the error-
correction term is λ when taxes were below-equilibrium in the previous period
and λ + π when they were above. This approach, akin to Bruce et al. (2006),
will be applied in section 4. It has the advantage of allowing both the base and
the adjustment parameter to respond asymmetrically depending on actual
receipts being above or below equilibrium, but a potential drawback is that
outcomes are less transparent while the ease of application is smaller as
elasticity-values are state-dependent (Dye, 2004).
Properly measuring of endogenous growth of tax receipts requires removing
the effects of discretionary measures on tax revenues. In particular, correction
is required for any policy-decisions regarding tax rates, the tax base or the
efficiency or timing of collecting taxes to avoid biased estimates for the
elasticities.
One way of dealing with discretionary changes is derive tax revenue
elasticities from “theoretical” approaches, as done by many international
organisations. For instance, base elasticities of indirect taxes often are set at
value 1, assuming no shifts in the pattern of consumption between the
products and services in categories with different tax rates. Short-term
12ECB Working Paper Series No 763June 2007

13
ECB Working Paper Series No 763
June 2007
fluctuations in the tax elasticities therefore are not taken into account. Another
approach is to ignore or circumvent the issue. An example of the first is given
by Ginebri et al. (2005), estimating tax buoyancy rather than a tax elasticity,
while the second one is often applied in US-related literature (e.g. Sobel and
Holcombe, 1996), focussing on the tax base-to-GDP elasticity rather than the
base elasticity of tax receipts .
The tax series used in this paper are cleaned for discretionary measures
using the proportional adjustment method (see Prest, 1962). Mathematically,
the proportional adjustment method can be expressed as follows:
T05,05 = T05 [6]
T05,04, = T04 * T05 [7]
T04,05
T05,t = Tt * T t+1 * ..…* T05
Tt,t+1 * …. .*T04,05 [8]
with T05,t = tax revenue in year t if tax structure of year 2005 would prevail
Tt = actual tax revenue in year t
Tt,t+1 = Tt+1 - Dt+1
Dt = amount of discretionary measures taken in year t
We set the base-year at the most recent year in our sample, 2005, so that
derived elasticities reflect recent tax structures. Equation 8 gives the more
general formula. One advantage of using this approach is that in principle it
results in a constant long-term elasticity, which facilitates the estimation
process.
The usefulness of applying this method depends crucially on the availability
and quality of estimates of revenue losses or gains from discretionary
measures. We use estimates from the Dutch ministry of finance, which refer
to ex-ante forecasts of the effect of measures on tax receipts in the year of
implementation. This series has the advantage of going back relatively far
(1970) and of being consistent but some drawbacks should also be listed.
Lacking ex-post adjustments, it inevitably includes forecast errors.

Furthermore, endogenous behavioural responses are usually not taken into
account as are cross-tax effects (the effect of a tax rate increase for one tax
category for the revenue of another tax). Finally, the focus on revenue losses
or gains in the initial year in some cases may imply that only part of the total
effect is captured, e.g. if it takes time for measures to really take off. Despite
such limitations, it is an indispensable source of information for time-series
analysis.
3. Tax revenues in the Netherlands
The tax revenues taken into account in our study refer to Dutch central
government tax receipts, excluding social security contributions and other
current revenues as data on discretionary measures for these latter
categories were not available.7 Data on tax revenues and on revenue effects
of discretionary measures refer to accrual-based revenues. Annex 1 contains
details on characteristics of the series and their sources.
We separate the three main taxes, being value-added tax (VAT), personal
income tax (PIT) and corporate income tax (CIT). The PIT includes the wage
tax, which is a withholding tax for the personal income tax, taxation of non-
wage income of individuals, as well as business income from retail business.
The corporate income tax includes profits from all (large) corporations,
including those from natural gas-exploitation. In 2005, the VAT, the PIT and
the CIT accounted for 32, 26 and 16% of total central government tax
revenues respectively. All other central government taxes are included in
‘other indirect taxes’ (22% of total tax receipts, mainly excise and stamp
duties, a special tax on new cars, environmental taxes and taxes on judicial
matters) and ‘other direct taxes’ (4% of total tax receipts, mainly dividend
withholding tax and inheritance tax).
7 Central government tax revenues account for around 50% of total general government, the other items being social security contributions, regional and local tax receipts, and non-tax receipts, representing about 30%, 15% and 5% of total general government income, respectively.
14ECB Working Paper Series No 763June 2007

Figure 2 shows that the overall tax burden has remained fairly stable over
time in the Netherlands, hovering around 24% of GDP. Its composition has
changed, however, with indirect taxes gaining weight and personal income
taxes becoming less important in the tax mix. Such reflects discretionary
decisions as well as, more recently, the endogenous growth of personal
income tax allowances and deductions (e.g. deductibility of mortgage interest
payments and of private pension premiums).
Figure 2. Tax level and composition in the Netherlands, 1971-2005
As % of GDP
0
5
10
15
20
25
30
1970 1975 1980 1985 1990 1995 2000 2005
Oth. IndirectCITPITOth. IndirectVAT
Table 1 presents information on the sources of growth of tax receipts as
percentage of GDP over the sample 1971-2005, decomposed in the effect of
discretionary measures and the effect of growth, the latter calculated
residually. At the aggregate level, revenue effects of discretionary measures
have been relatively limited over the years 1971-2005. For indirect taxes, the
revenue-raising measures more than compensated the endogenous decrease
in tax receipts as percentage of GDP. The picture for direct taxes is
distinctively different, with the tax-to-GDP ratio increasing without measures,
but discretionary measures on average lowering tax receipts. Only in the case
of the personal income taxes did the combination of measures and
endogenous growth on balance result in a (much) lower tax-to-GDP ratio.
15ECB
Working Paper Series No 763 June 2007

Table 1. 1971-2005 tax revenue growth: endogenous and discretionary effects, % (-point) of GDP
1971 tax ratio level
(1)
Effect of measures*
(2)
Endogenous growth effect
(3)
2005 tax ratio level
(1)+(2)+(3)=(4)
Value-added tax 5.8 3.3 -1.5 7.6 Other indirect taxes 4.2 8.1 -7.1 5.2 Personal income tax 10.1 -6.2 2.4 6.4 Corporate income tax 2.8 -0.1 1.1 3.9 Other direct taxes 0.8 -0.2 0.6 1.2 Total 23.7 5.0 -4.4 24.3 * Including the effect of economic growth on the revenue changes from discretionary measures.
Specifically as to the discretionary measures, these boosted VAT receipts on
average by some 1¼% of the VAT revenue (rather than as percentage of
GDP as in the table), and increasing excise duties and higher special car
taxation made other indirect taxes even rise faster. On the other hand,
changes to direct taxes on net had a revenue-decreasing effect, especially as
regards the PIT (-3% of PIT receipts). These changes reflect a shift from
taxation of labour to indirect taxation and environmental levies (indirect tax),
as well as income tax reforms (e.g. to simplify the tax code) and income tax
reductions introduced to soften adverse income consequences of structural
reform measures.
The nominal GDP elasticity of total taxes, also labelled the macroeconomic
progression factor, on average equals around 1.1. Annual numbers are shown
in Figure 3. For comparison, we also included the buoyancy, i.e., overall tax
growth not corrected for discretionary measures, divided by nominal GDP
growth. The figure shows that correcting for discretionary measures on
average tends to reduce volatility of the tax series by adjusting for most of the
‘extreme’ values.
16ECB Working Paper Series No 763June 2007

Figure 3. Overall buoyancy and income elasticity of Dutch taxes to GDP, 1972-2005
-2
0
2
4
6
1972 1978 1984 1990 1996 2002
elasticity buoyancy
A noteworthy feature of the tax-to-GDP elasticity is its more volatile behaviour
since the middle of the 1980s, and especially towards the end of the period.
This may reflect increases in the number of major tax reforms, where effects
are hard to forecast. In addition, higher volatility may reflect that GDP
nowadays is less an indicator for the overall tax base than it used to be. Asset
price developments (bonds, equity, real estate) play an increasingly important
role in determining tax receipts, e.g. via stamp duties and deduction of
mortgage interest payments (see Wolswijk, 2006).8 The relatively high 1987-
value of the overall elasticity reflects the very low nominal GDP growth in that
year (just above 1%).
4. Estimation results
All tax variables, which are in log-form, were tested for unit roots using the
Augmented Dickey-Fuller (ADF) test (see annex 2). For the majority of tax
categories, stationarity was achieved after first-differencing. For two tax
categories, this was only the case after shortening the sample, namely for the
8 See Eschenbach and Schuknecht (2002) for an analysis of these effects, Tujula and Wolswijk (2007) for empirical evidence on the deficit impact, and Morris and Schuknecht (2007) for the impact of asset prices on tax receipts in a number of OECD countries.
17ECB
Working Paper Series No 763 June 2007

VAT (1980-2002) and the PIT (1975-2005). This finding supports making a
distinction between long-term and short-term elasticities.
As regards the long-run tax elasticity estimates, we start with OLS-estimations
with all data transformed to logs as is standard in this field of research. As
levels of tax revenues and bases often are non-stationary, estimating the
long-run equations in levels can give rise to biased estimates and inconsistent
standard errors. Following Stock and Watson (1993), adding leads and lags of
the change in the independent variables, leading to Dynamic OLS estimates
(DOLS), corrects the coefficient bias.
log T05,t = θ + δ log Bt + Σ1j=-1 ø ∆log Bt+j + γt [9]
Furthermore, Newey-West correction (Newey and West, 1987) was applied to
reduce inconsistency of the estimates of the standard errors. Thus, as regards
the long-run estimations, besides results on the basis of OLS we also present
results using DOLS in combination with the Newey-West technique, which we
take to be more informative.9 Generally, we use the current value and one
lead and one lag of the change in the independent variables to save on
degrees of freedom. Endogeneity of the tax base should not be problematic in
this set-up as the tax receipts have been corrected for discretionary measures
that could have an impact on the tax bases.
After estimating the long-term relation, we tested whether non-stationary
variables are integrated by a stationarity test on the residuals from the long-
term equations. Results as reported in annex 2 broadly confirm the existence
of co-integrating relationships.
The results of our estimates for the long-term and the short-term base
elasticities are presented below for the five tax categories. Where available,
we also add information on estimated values of elasticities from other
sources. This relates in particular to the OECD (Van den Noord, 2000), the
9 For applications of these methods on US tax series, see Sobel and Holcombe (1996) and Bruce et al (2006).
18ECB Working Paper Series No 763June 2007

ECB (Bouthevillain, C., et al., 2001), the Netherlands Bureau for Economic
Policy Analysis (CPB, 2004) and the IMF (2004).
Value-added tax
The log of endogenous VAT receipts first was related to private consumption,
government investment and private residential investment, being the main
expenditure items on which VAT is levied. While it could make sense to
distinguish real from purely nominal developments,10 the ADF-stationarity test
on inflation gave unsatisfactory results (see Annex 2), so this path was not
pursued further. Government investment was included but was not significant.
Private consumption entered the equation for the 1980-2002 sample with
coefficient 0.82, somewhat below the (theory-based) assumptions of the
OECD, ECB and CPB. The below-unity elasticity could partially reflect the
upward effect of higher excise duties levied on some products on inflation.
While these increases are fully reflected in the price index, consumption may
decrease in response, leading to less VAT receipts. Estimating with DOLS
and the Newey-West correction results in a higher coefficient on private
consumption (0.90) but still significantly different from unity, while residential
investment seizes to be significant.
<table 2a>
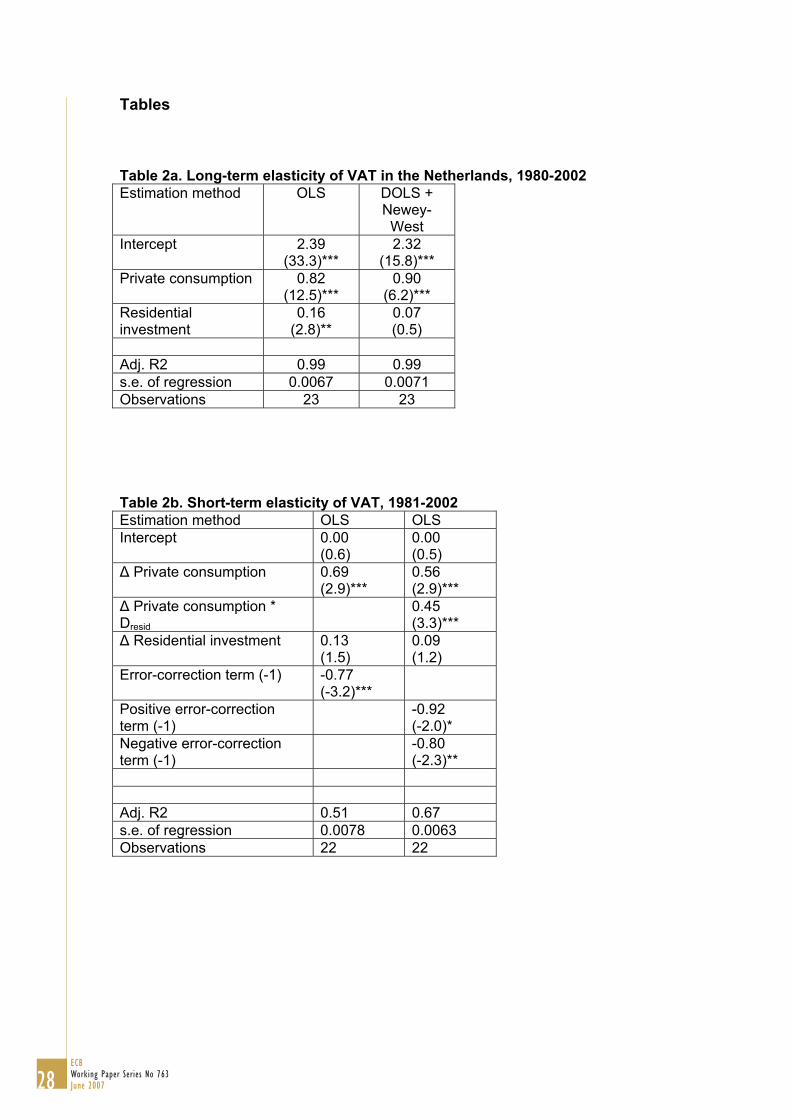
As regards short-term effects (table 2b), the error-correction term was
included as an explanatory variable, which proved to be significant with a
coefficient of 0.77. Thus, actual revenues deviating from their long-run value
are corrected for ¾ in the next period.11 The coefficient on private
consumption is only 0.69. In the final column, we allow for an asymmetric
response, by including the dummy taking value 1 when the error-correction
term is positive and interacting it with private consumption, and by splitting the
error-correction terms in positive and negative values. Results indicate that
10 Ginebri et al (2005) show this to be relevant in the case of Italy. 11 Correlations with OECD and Commission estimates of the output gap and the errors from this and following equations for other taxes range between 0.20 and 0.65. Correlations between the errors all being positive with one exception gives some but no decisive support to a cyclical interpretation of the error-correction term.
19ECB
Working Paper Series No 763 June 2007
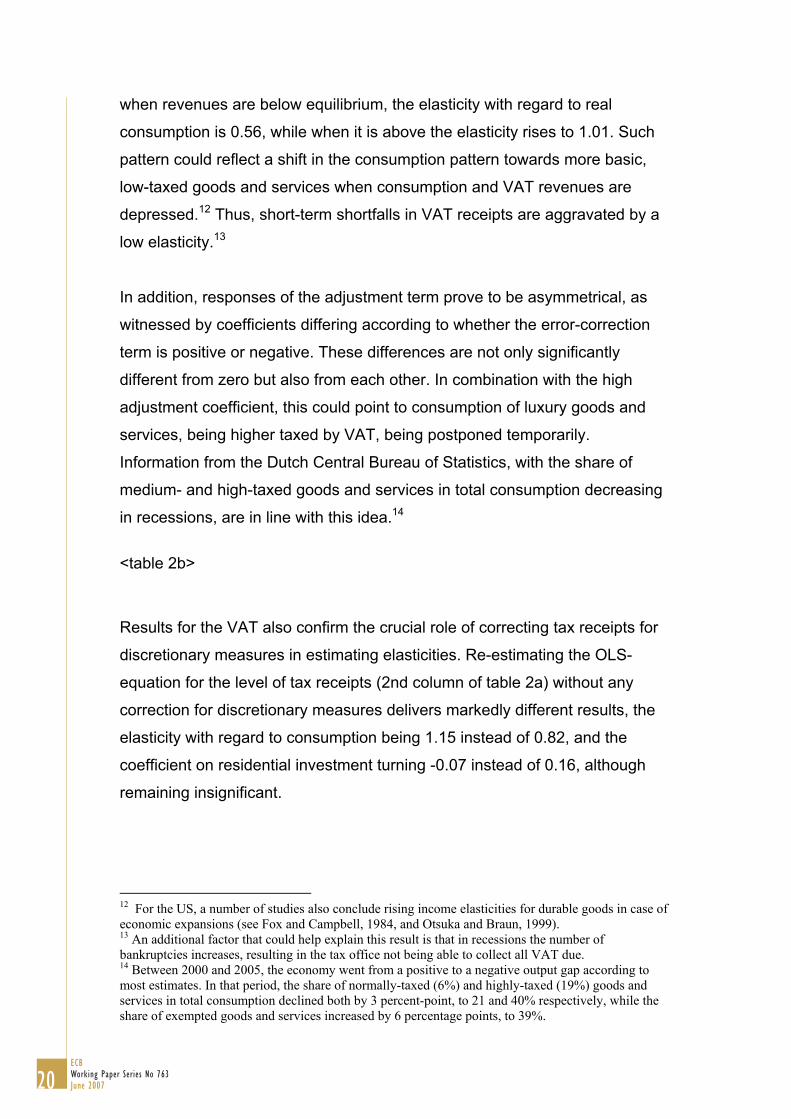
when revenues are below equilibrium, the elasticity with regard to real
consumption is 0.56, while when it is above the elasticity rises to 1.01. Such
pattern could reflect a shift in the consumption pattern towards more basic,
low-taxed goods and services when consumption and VAT revenues are
depressed.12 Thus, short-term shortfalls in VAT receipts are aggravated by a
low elasticity.13
In addition, responses of the adjustment term prove to be asymmetrical, as
witnessed by coefficients differing according to whether the error-correction
term is positive or negative. These differences are not only significantly
different from zero but also from each other. In combination with the high
adjustment coefficient, this could point to consumption of luxury goods and
services, being higher taxed by VAT, being postponed temporarily.
Information from the Dutch Central Bureau of Statistics, with the share of
medium- and high-taxed goods and services in total consumption decreasing
in recessions, are in line with this idea.14
<table 2b>
Results for the VAT also confirm the crucial role of correcting tax receipts for
discretionary measures in estimating elasticities. Re-estimating the OLS-
equation for the level of tax receipts (2nd column of table 2a) without any
correction for discretionary measures delivers markedly different results, the
elasticity with regard to consumption being 1.15 instead of 0.82, and the
coefficient on residential investment turning -0.07 instead of 0.16, although
remaining insignificant.
12 For the US, a number of studies also conclude rising income elasticities for durable goods in case of economic expansions (see Fox and Campbell, 1984, and Otsuka and Braun, 1999). 13 An additional factor that could help explain this result is that in recessions the number of bankruptcies increases, resulting in the tax office not being able to collect all VAT due. 14 Between 2000 and 2005, the economy went from a positive to a negative output gap according to most estimates. In that period, the share of normally-taxed (6%) and highly-taxed (19%) goods and services in total consumption declined both by 3 percent-point, to 21 and 40% respectively, while the share of exempted goods and services increased by 6 percentage points, to 39%.
20ECB Working Paper Series No 763June 2007

Indirect taxes other than VAT
Indirect taxes other than VAT nowadays mainly includes taxes on new cars,
excises on mineral oils and tobacco, legal taxes (e.g. stamp duties) and
environmental levies. Private consumption was used as a rough tax base for
these taxes, which resulted in a coefficient of 0.43. Given the heterogeneous
nature of the taxes involved, no a priori expectation of the value of the
elasticity can be formulated. In addition, the results show that house prices
exert a significant effect on indirect tax revenues, reflecting stamp duties
(3.5% of total tax receipts in 2005) increasing when activity on the housing
market increases. This is in line with findings of the CPB (CPB, 2004). We
also included oil prices in view of excise duties on mineral oil products (5.5%
of total tax receipts in 2005) but this did not produce satisfactory results. The
same equation was estimated with DOLS and the Newey-West correction,
with the coefficient on private consumption going up (0.55), and the coefficient
on the housing price effect going down (0.10).
<table 3a>
In the short-run equations, adding the error-correction term produces strong
and statistically satisfactory results, indicating that around half of the error-
correction is adjusted in the next period. Results also show a relatively weaker
effect of private consumption and a stronger effect of house prices than in the
long-run. The IMF (2004) also finds indications of a short-term impact of
house prices on tax receipts.15 In the final equation, we included the dummy
taking value 1 in case actual receipts of other indirect taxes are above the
long-run value and zero otherwise. This has an impact on the coefficient on
private consumption, being around 0.3 if taxes are below-equilibrium and 0.6
if taxes are above-equilibrium. The higher responsiveness when above-
equilibrium presumably could reflect car purchases increasing more rapidly,
being taxed by a special levy. The error-correction term indicates that some
2/3 of the long-term disequilibrium is removed in the next period. No
15 The IMF estimates an increase in the base elasticity of total indirect taxes from 1.0 to 1.3 from 1970-1989 to 1990-2003, which it connects to a larger impact of boom-bust cycles in asset prices.
21ECB
Working Paper Series No 763 June 2007

significant difference in response of the error-correction term when being
above- or below-equilibrium values is found.
<table 3b>
Personal income tax (PIT)
As to personal income taxes, which include wage taxation, we use wages as
a base.16 While a decomposition of the wage-sum into in real wage per
employee, the number of employees, and inflation in principle would be
preferable17, the results form the stationarity-test for inflation did not allow this.
The OLS results for the period 1975-2005 (table 4a) show an overall elasticity
of 1.4 with regard to the wage-sum income taxation due to increasing
marginal rates as household wage income increases. House prices have
been included in view of the deductibility of mortgage interest payments from
the tax base, and show the expected negative effect. A 2001 dummy
measures ex-post corrections of revenues lost on account of the 2001 tax
reform. Results with DOLS and Newey-West correction indicate a somewhat
larger elasticity of the wage-sum (1.6). Stock market growth had no significant
impact on the personal income tax revenue, although it is part of the base of
the personal income tax since 2001. We also did not find satisfactory results
for the 1990 tax reform having a downward effect on the elasticity (Caminada
and Goudswaard, 1996).
<table 4a>
Comparing the outcomes with estimates from others is complicated by the
fact that the latter usually distinguish between the effects of employment and
of wage per employee, and may also include general insurance contributions
16 Income of self-employed is also taxed via the personal income tax. As income of self-employed is not available for a long period, it was approximated by multiplying the number of self-employed by average wage income. However, estimations where imputed income of self-employed was taken out of corporate profits and allocated to the personal income tax base did not materially deviate from those mentioned in the main text and therefore are not reported here. 17 Inflation and the number of employees usually are assumed to have unity elasticity, while the elasticity of real wages per employee should be much higher reflecting the progressive nature of income taxation.
22ECB Working Paper Series No 763June 2007

that nowadays are collected simultaneously by the tax collector. Commonly,
these studies impose a unitary elasticity with regard to employment (ECB,
OECD, and CPB). The elasticity with regard to income per employee (of the
private sector) ranges form 1.9 by the CPB to 2.6 by the ECB and the OECD.
The IMF reports a rather low elasticity of 1.1 to the nominal wage sum over
the period 1970-2003 but does not correct for (overall revenue-decreasing)
discretionary measures, which depresses the estimated elasticity value.
In the short-run equation, the coefficient on wage per employee is higher than
in the long-run equation (2.0 against 1.57), which could reflect that
employment in the short run is less flexible than in the long-run.18 Short-term
adjustment thus falls more than proportionally on earned wage per person,
which has a progressive impact on tax receipts. The error-correction term
proved marginally significant, at close to 50%, while no evidence of
asymmetry was detected.
<table 4b>
Corporate income tax (CIT)
Analysing and forecasting corporate income tax receipts is complicated
because of lags in the effect of corporate profits on tax receipts, possibilities
for carrying back and forward losses, fiscal profits only being very roughly
approximated by profits in national accounts19, and – specific to the
Netherlands - sizeable tax receipts from natural gas-exploitation (see De
Boer, 1996). In our OLS estimation, one-year lagged corporate profits gave
unity elasticity, which is in line with the findings of OECD, the ECB and the
CPB, the latter allowing for lags up to 2 years. Estimates using DOLS and
Newey-West correction indicate a value 1.07, significantly different from one,
which could well reflect its slightly progressive nature resulting from somewhat
18 Short-term economic fluctuations may have relatively little effect on employment, e.g. due to complex dismissal procedures or because employers use natural attrition. The standard deviation of the log of employment being about 4 times as low as that of the log of wage per person could support this view. 19 For instance, profits in the national accounts are defined on a net basis (profits minus losses) while for estimating corporate tax receipts gross profits matter as losses do not immediately lead to negative tax assessments.
23ECB
Working Paper Series No 763 June 2007

lower rates for small companies. Oil prices – to which the natural gas prices
are linked – capture corporate tax receipts from the natural-gas sector but do
not turn out to be significant.20
<table 5a>
The short-term elasticity with regard to lagged profits is 0.74. The IMF (2004)
estimates the elasticity at 0.9 but notices an upward trend, possibly related to
boom-and-bust periods. The coefficient on the error-correction term is around
0.5. Finally, we tested for asymmetric behaviour (last column), and indeed
found evidence that profits spur taxation in case profit taxation is above its
equilibrium, likely reflecting a strong reduction in possibilities to carry-back or
carry-forward losses in good times. The lack of a significant effect in case of
below-equilibrium tax receipts could reflect the possibilities for loss
compensation.
< table 5b>
Other direct taxes
Other direct taxes, finally, have been related to corporate profits as dividend
withholding taxes are the main component. Results indicate a rather strong
progression effect, the long-term elasticity value being around 1.4, which
could reflect exemption thresholds. A dummy for the tax reform in 2001 was
added to reflect a change in dividend pay-out policies towards more cash but
this did not prove successful. The same applies to the stock market index that
was included as explanatory variable as other direct taxes included capital
taxation until 2000. No direct comparison with other estimates is around as
these taxes usually are lumped together with corporate taxes.
<table 6a>
20 Although this approach foregoes many other elements that may have an impact on corporate tax receipts, adding more detail does not always deliver better results. In this respect, it can be noted that the CPB a few years ago switched back to a simple equation for predicting corporate tax receipts rather than trying to capture many of the factors described above (CPB, 2004).
24ECB Working Paper Series No 763June 2007

The error-correction term was included in the short-term equation but apart
from the intercept, none of the variables turned out to be significant. Improved
results were obtained when including the interaction of the dummy for positive
error-correction terms and profits. Results indicate above-unity elasticity with
regard to profits in case of positive errors, which may reflect corporations’
practice of short-term stabilisation of dividend pay-outs, resulting in stable
dividend taxes. Only when long-term revenues are above trend do corporate
profits translate into higher distributed dividend and thus more tax receipts.21
However, given the poor fit of the equation, results should be interpreted with
great caution.
<table 6b>
Table 7 summarises the results as discussed before, showing the elasticity of
the five tax categories with regard to the main base element, thus foregoing
other factors that impact on tax revenues.
Table 7. Summary of base elasticities of tax categories¶
VAT Other indirect taxes
Personal Income tax
Corporate income tax
Other direct taxes
Long-term elasticity
0.90 0.55 1.57 1.07 1.43
Below equilibrium
0.56 0.33 0.12¶ -0.52¶ Short-term elasticity Above
equilibrium 1.01 0.61
2.01
0.90 1.24
Below equilibrium
-0.80 Adjustment parameter Above
equilibrium
-0.92
-0.67
-0.49
-0.49
-0.31
¶ Not significant at the 10%-level.
The table shows that long-term elasticities are within the range for the short-
term elasticities except for the corporate income tax. Noteworthy is the high
value of the short-term elasticity of the personal income tax, above the long-
term value, which can be explained by slow employment adjustment. Short-
term elasticities differ markedly from long-term values. Another conclusion 21 Brav et al (2003) confirm this dividend payout policy for the US.
25ECB
Working Paper Series No 763 June 2007

from his overview is that adjustment parameters for indirect taxes are
relatively high compared to those for direct taxes.
5. Conclusions This paper considered the short- and long-term base elasticity of taxes in the
Netherlands. Apart from showing the importance of correcting tax revenue
series for discretionary policy changes in estimating tax elasticities, it presents
evidence that short-term elasticities deviate from long-term ones, especially
for direct taxes. Differences are especially large in “bad times” (tax receipts
below the long-run equilibrium), which may indicate cautious or lagged
responses of economic agents, taking short-term developments less-than-fully
into account on a real-time basis. The outcomes in most cases also indicate
asymmetry in tax-to-base elasticities. When tax receipts are above the long-
term value, elasticities tend to be higher, likely indicating shifts in consumption
patterns towards more luxury (higher-taxed) goods and services, reduced
possibilities for loss-compensation and less cautious dividend pay-out
policies. The error-correction term is significant in all short-term equations, but
there is only evidence of an asymmetric effect of the error-correction term for
VAT-receipts. While error-correction terms may not be interpreted directly as
cyclical indicators, some correlation seems to be in place, pointing to pro-
cyclical elasticities.
Ignoring that short-term tax elasticities may differ from long-term tax
elasticities adds to creating ‘budget surprises’ which in fact reflect forecast
inadequacies. Such appears to be particularly important in times of negative
surprises (tax receipts being below the long-term value), notably for direct
taxes where the adjustment path is relatively flat. Ignoring such aspects may
also contribute to inaccurate (cyclically-adjusted) fiscal indicators on which
policy actions or recommendations may be based, although it needs to be
realised that errors in forecasting actual or potential output on average appear
to be bigger source of forecasting errors.
26ECB Working Paper Series No 763June 2007

The gradual shift in Dutch taxes towards more indirect taxation (especially
VAT) and less personal income taxation implies a shift to a lower short-term
and long-term elasticity, implying more short-run stability in receipts and – as
a counterpart – some decrease in the automatic stabilisation function of the
tax system, which brings it more in line with the European average.
While this paper has provided insight in the question of short-term and long-
term elasticities, and of asymmetrical short-term elasticities for the case of the
Netherlands, further work in this area could be foreseen. Open issues that
deserve attention in follow-up research include possibilities for application of
this approach to other countries, notably in the EU where cyclically-adjusted
balances play a major role in the policy debate. Another topic where additional
work would be beneficial is on ways to turn the analytical tool developed in
this paper into a forecasting tool that allows an ex-ante calculation of the
cyclical component of the tax elasticity.
27ECB
Working Paper Series No 763 June 2007
Tables
Table 2a. Long-term elasticity of VAT in the Netherlands, 1980-2002 Estimation method OLS DOLS +
Newey-West
Intercept
2.39 (33.3)***
2.32 (15.8)***
Private consumption 0.82 (12.5)***
0.90 (6.2)***
Residential investment
0.16 (2.8)**
0.07 (0.5)
Adj. R2 0.99 0.99 s.e. of regression 0.0067 0.0071 Observations 23 23 Table 2b. Short-term elasticity of VAT, 1981-2002 Estimation method OLS OLS Intercept 0.00
(0.6) 0.00 (0.5)
∆ Private consumption 0.69 (2.9)***
0.56 (2.9)***
∆ Private consumption * Dresid
0.45 (3.3)***
∆ Residential investment 0.13 (1.5)
0.09 (1.2)
Error-correction term (-1) -0.77 (-3.2)***
Positive error-correction term (-1)
-0.92 (-2.0)*
Negative error-correction term (-1)
-0.80 (-2.3)**
Adj. R2 0.51 0.67 s.e. of regression 0.0078 0.0063 Observations 22 22
28ECB Working Paper Series No 763June 2007

Table 3a. Long-term elasticity of other indirect taxes, 1970-2005 Estimation method OLS DOLS +
Newey-West Intercept
3.01 (144.5)***
2.88 (83.3)***
Private consumption 0.43 (21.6)***
0.55 (17.8)***
House prices 0.18 (8.7)***
0.10 (3.8)***
Adj. R2 0.99 0.99 s.e. of regression 0.0148 0.0099 Observations 36 33 Table 3b. Short-term elasticity of other indirect taxes, 1973-2005 Estimation method OLS OLS Intercept -0.00
(-0.5) -0.00 (-0.9)
∆ Private consumption 0.43 (3.9)***
0.33 (2.9)***
∆ Private consumption * Dresid 0.28 (2.6)**
∆ House prices 0.24 (5.7)***
0.26 (6.7)***
Error-correction term(-1) -0.54 (-2.9)***
-0.67 (-3.9)***
Adj. R2 0.67 0.74 s.e. of regression 0.0090 0.0081 Observations 33 32
29ECB
Working Paper Series No 763 June 2007

Table 4a. Long-term elasticity of personal income taxes, 1975-2005 Estimation method OLS DOLS +
Newey-West Intercept
1.54 (21.0)***
1.40 (11.0)***
Wage-sum 1.41 (22.3)***
1.57 (16.0)***
House price -0.20 (-4.3)***
-0.33 (-5.4)***
2001 tax reform dummy 0.09 (3.6)***
0.08 (9.5)***
Adj. R2 0.99 0.99 s.e. of regression 0.016 0.020 Number of observations 31 30 Table 4b. Short-term elasticity of personal income taxes, 1976-2005 Estimation method OLS Intercept -0.02
(-1.9)* Wage-sum 2.01
(4.8)*** House price -0.08
(-0.6) 2001 tax reform dummy 0.08
(3.3)*** Error-correction term(-1) -0.49
(-1.9)* Adj. R2 0.59 s.e. of regression 0.022 Observations 30
30ECB Working Paper Series No 763June 2007

Table 5a. Long-term elasticity of corporate income tax, 1971-2005 Estimation method OLS DOLS +
Newey-West Intercept 2.11
(40.3)*** 2.00 (27.7)***
Corporate profits (-1) 1.00 (23.8)***
1.07 (21.4)***
Oil prices 0.07 (1.8)*
0.03 (0.6)
Adj. R2 0.97 0.97 s.e. of regression 0.046 0.045 Number of observations 35 35 Table 5b. Short-term elasticity of corporate income tax, 1972-2005 Estimation method OLS OLS Intercept 0.01
(0.7) 0.01 (1.4)
∆ corporate profits (-1) 0.74 (2.9)***
0.12 (0.4)
∆ corporate profit (-1) * Dresid - 0.90 (2.6)***
∆ oil price 0.15 (3.0)***
0.11 (2.3)**
Error-correction term (-1) -0.43 (-3.1)***
-0.49 (-3.8)***
Adj. R2 0.46 0.55 s.e. of regression 0.034 0.031 Number of observations 34 34
31ECB
Working Paper Series No 763 June 2007

Table 6a. Long-term elasticity of other direct taxes, 1971-2005 Estimation method OLS DOLS +
Newey-West Intercept
0.80 (9.5)***
0.74 (4.5)***
Corporate profits 1.40 (28.7)***
1.43 (16.1)***
Adj. R2 0.96 0.96 s.e. of regression 0.075 0.074 Number of observations
36 35
Table 6b. Short-term elasticity of other direct taxes, 1972-2005 Estimation method OLS OLS Intercept
0.03 (3.0)***
0.03 (3.1)***
∆ Corporate profits 0.13 (0.4)
-0.52 (-1.4)
∆ Corporate profits * Dresid 1.24 (2.8)***
Error-correction term (-1)
-0.15 (-1.5)
-0.31 (-2.9)***
Adj. R2 0.01 0.19 s.e. of regression 0.041 0.037 Number of observations 34 34
32ECB Working Paper Series No 763June 2007

Annex 1: Data sources and methods Data on discretionary measures (cash basis) and on tax receipts (cash basis,
partly accrual basis) have kindly been obtained from the Ministry of Finance in
the Netherlands. We have derived tax series on an approximated accrual
basis as follows:
o For indirect taxes, tax receipts and discretionary measures on a cash
basis are taken, given limited delay in paying these taxes (nowadays
usually one month).
o As for corporate taxes, we have used available accrual-based receipts
data and half a year lagged cash data on discretionary measures.
o Regarding personal income tax, data refer to accrual-based data as far as
possible, supplemented by half-a-year lagged cash data where necessary.
Cash data on discretionary measures have been lagged by half a year.
o For other direct taxes, both revenue series and the series on measures
have been lagged by one year.
o Tax base for wage and personal income tax: wage income for government
and business employees.
o Tax base for corporate income tax: net exploitation income of the business
sector
o Long-term interest rate, exchange rate Dutch guilder/euro vs. US dollar;
OECD Main Economic Indicators.
o Dutch stock market index: Global Financial Data
o Oil price: OECD Economic Outlook
o National accounts data: nominal and real gross domestic product, private
consumption, wage compensation, private consumption, government
investment, private residential investment, employment: CPB.
o Consumer price index: Dutch Central Bureau for Statistics (CBS)
o Housing prices: ECB and BIS
o Output gap: Commission AMECO database and OECD Main Economic
Indicators.
33ECB
Working Paper Series No 763 June 2007
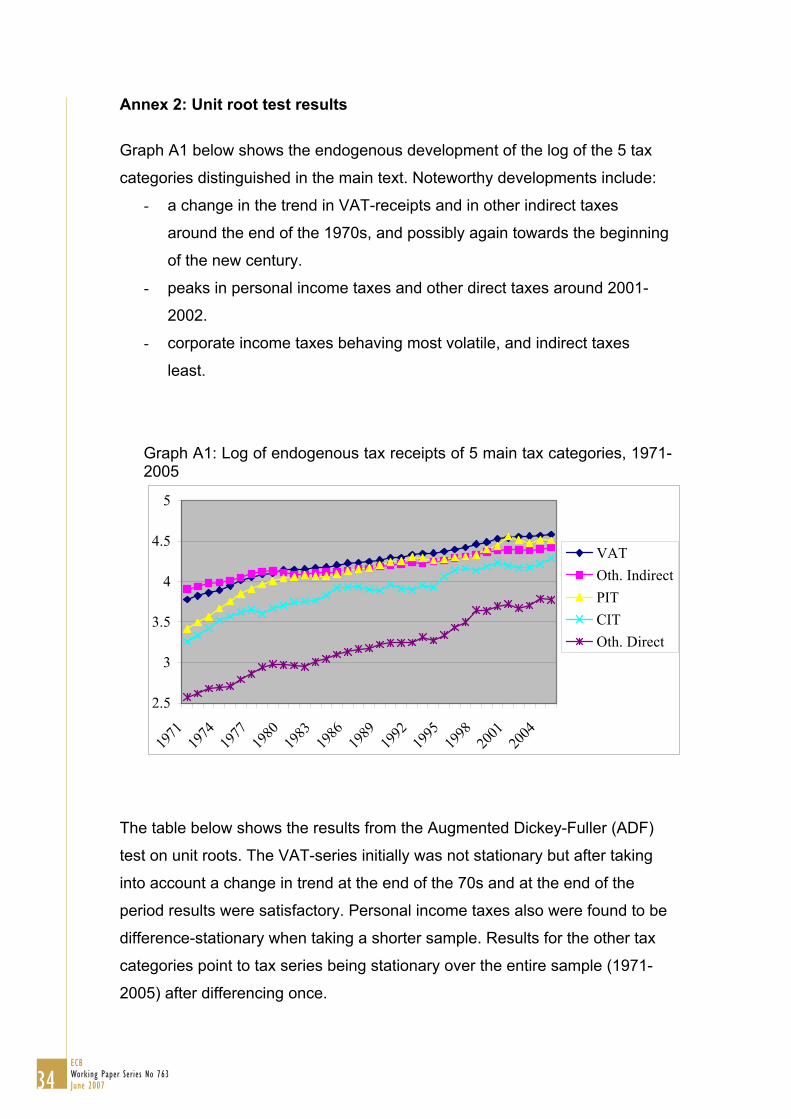
Graph A1 below shows the endogenous development of the log of the 5 tax
-
around the end of the 1970s, and possibly again towards the beginning
of the new century.
- peaks in personal income taxes and other direct taxes around 2001-
2002.
- corporate income taxes behaving most volatile, and indirect taxes
least.
Graph A1: Log of endogenous tax receipts of 5 main tax categories, 1971-2005
2.5
3
3.5
4
4.5
5
1971
1974
1977
1980
1983
1986
1989
1992
1995
1998
2001
2004
VATOth. IndirectPITCITOth. Direct
The table below shows the results from the Augmented Dickey-Fuller (ADF)
test on unit roots. The VAT-series initially was not stationary but after taking
into account a change in trend at the end of the 70s and at the end of the
period results were satisfactory. Personal income taxes also were found to be
difference-stationary when taking a shorter sample. Results for the other tax
categories point to tax series being stationary over the entire sample (1971-
2005) after differencing once.
34ECB Working Paper Series No 763June 2007
a change in the trend in VAT-receipts and in other indirect taxes
Annex 2: Unit root test results
categories distinguished in the main text. Noteworthy developments include:

Table A2.1 Augmented Dickey-Fuller tests for endogenous tax levels, 1971-2005 Level Level with
trend First
difference VAT# 1.08 -1.18 -5.04*** Other indirect taxes -0.98 -3.13 -3.43** Corporate income tax -2.13 -3.33* -4.89*** Personal income tax§ -2.90* -3.76** -3.96*** Other direct taxes -0.54 -2.29 -5.51*** *, **, *** = significant at 10%, 5%, and 1% level respectively. All estimates include an intercept. # 1980-2002. § 1975-2005.
As to the explanatory variables, most exhibited stationarity after first
differencing. Inflation is the notable exception, possible related to a trend-
break around the start of the 1980s. Indeed, using shorter time periods
delivered more satisfactory results, although it reduces the power of the ADF-
test.
Table A2.2 Augmented Dickey-Fuller tests for independent variables
Level Level
with
trend
First
difference
Private consumption# 1.18 -1.48 -2.79*
Residential investment# 0.95 -1.75 -4.28***
Inflation -3.44** -4.18** -1.37
Government investment# 2.34 0.52 -3.88***
Corporate profits -2.05 -2.27 -4.42***
Wages§ -0.98 -3.89*** -2.94**
House price 2.40 -1.83 -2.92*
House price§ -0.54 -1.61 -3.48**
Oil price -1.97 -2.07 -5.35***
Long-term interest rate -1.48 -3.48* -4.67***
Stock market index -0.47 -2.68 -3.84**
# Over the sample 1980-2002. § Over the sample 1975-2005.
35ECB
Working Paper Series No 763 June 2007

The errors from the long-run equations were tested for stationarity using the
ADF-test, which revealed satisfactory results (see table below). In view of the
limited size of our sample and possible non-linear adjustment that are known
to reduce the power of the test (see e.g. Endes and Siklos, 2001), we did not
opt for the Johansen cointegration test. Instead, there is a strong theoretical
presumption of cointegration by the fact that the equations, while including
behavioural elements, mostly are of an arithmetic nature as there is only
limited possibility to avoid taxation if the taxable event that increases the tax
base occurs.
Table A2.3 Augmented Dickey-Fuller tests on residuals from long-term DOLS equations with Newey-West correction. Level
Value-added tax -3.12***
Other indirect taxes -4.73***
Personal income tax -5.34***
Corporate income tax -4.08***
Other direct taxes -1.98**
Results without intercepts (all insignificant)
36ECB Working Paper Series No 763June 2007

Bouthevillain, C., et al. (2001), “Cyclically Adjusted Budget Balances: An
Alternative Approach”, ECB Working Paper, No. 77.
Braconier, H., and S. Holden (1999), “The Public Budget Balance - Fiscal
Indicators and Cyclical Sensitivity in Nordic Countries”, NIER Working Paper,
No. 67.
Brav, A. et al (2003), “Payout Policy in the 21st Century”, NBER Working Paper, No. 9657.
Bruce, D., W. Fox and M. Tuttle (2006), “Tax Base Elasticities: A Multi-State
Analysis of Long-Run and Short Run-Dynamics”, Southern Economic Journal,
73, No. 2, pp. 315-341.
Caminada, K., and K. Goudswaard (1996), “Progression and Revenue Effects
of Income Tax Reform", International Tax and Public Finance, Vol. 3 (1), pp.
57-66.
CPB (Netherlands Bureau for Economic Policy Analysis) (2004), “Collectieve
Sector in SAFE (Government Sector in the SAFE model)”, CPB
Memorandum, No. 106.
CPB (2006), Central Economic Plan 2006, The Hague.
Creedy, J., and N. Gemmell (2004), “The Income Elasticity of Tax Revenue:
Estimates for Income and Consumption Taxes in the United Kingdom, Fiscal
Studies, 25 (1), pp. 55-77.
De Boer, S. (1996), “Estimating Corporate Tax Revenues in the Netherlands”,
CPB Report, No. 4.
Dye, R. (2004), “State Revenue Cyclicality”, National Tax Journal, Vol. 57 (1),
pp. 133-145.
37ECB
Working Paper Series No 763 June 2007
References

38
ECB Working Paper Series No 763June 2007
Enders, W., and P. Siklos (2001), “Cointegration and Threshold Adjustment”,
Journal of Business & Economic Statistics, 19, No. 2, pp. 166-176,
Eschenbach, F., and L. Schuknecht (2002), "Asset Prices and Fiscal
Balances“, ECB Working Paper, No. 141.
Fox, W., and C. Campbell (1984), “Stability of the State Sales Tax Income
Elasticity”, National Tax Journal, Vol. 37, pp. 201-212.
Ginebri, S., B. Maggi, and M. Turco (2005), “The Automatic Reaction of the
Italian Government Budget to Fundamentals: An Econometric Analysis”,
Applied Economics, 37, pp. 67-81
Granger, C., and T. Lee (1989), “Investigation of Production, Sales and
Inventory Relationships using Multicointegration and Non-symmetric Error
Correction Models”, Journal of Applied Econometrics, 4, pp. 145-159.
IMF (2004), “Kingdom of the Netherlands - Netherlands: Selected Issues”,
IMF Country Report, No. 04/301
Morris, R., and L. Schuknecht (2007), “Structural Balances and Revenue
Windfalls: the role of asset prices revisited, ECB Working Paper, No. 737
Newey, W., and K. West (1987), “A Simple, Positive Semi-Definite
Heteroskedasticity and Autocorrelation Consistent Covariance Matrix”,
Econometrica, 55, pp. 703-708.
Otsuka, Y., and B. Braun (1999), “The Random Coefficient Approach for
Estimating Tax Revenue Stability and Growth”, Public Finance Review, 27 (6),
pp. 665-676.
Prest, A (1962), “The Sensitivity of the Yield of Personal Income Tax in the
United Kingdom”, Economic Journal, 72, No. 287 (Sept.), pp. 576-596.

Seyfried, W., and L. Pantuosco (2003), “Estimating the Sensitivity of State
Tax Revenue To Cyclical and Wealth Effects”, Journal of Economics and
Finance, 27, pp. 114-124.
Sobel, R., and R. Holcombe (1996), “Measuring the Growth and Variability of
Tax Bases over the Business Cycle”, National Tax Journal, 49 (4), pp. 535-
552.
Stock, J., and M. Watson (1993), “A Simple Estimator of Cointegrating
Vectors in Higher Order Integrated Systems”, Econometrica, 61, 4 (July), pp.
783-820.
Tujula, M., and G. Wolswijk (2007), “Budget Balances in OECD Countries:
What Makes Them Change?” Empirica, 34, No. 1, pp. 1-14.
Van den Noord, P. (2000), “The Size and Role of Automatic Fiscal Stabilisers
in the 1990s and Beyond”, OECD Working Paper, no. 230.
Wolswijk G. (2006), “Determinants of Mortgage Debt Growth in EU
Countries”, European Journal of Housing Policy, Vol. 6, No. 2, 131-149.
39ECB
Working Paper Series No 763 June 2007

40ECB Working Paper Series No 763June 2007
European Central Bank Working Paper Series
For a complete list of Working Papers published by the ECB, please visit the ECB’s website(http://www.ecb.int)
737 “Structural balances and revenue windfalls: the role of asset prices revisited” by R. Morris and L. Schuknecht, March 2007.
738 “Commodity prices, money and inflation” by F. Browne and D. Cronin, March 2007.
739 “Exchange rate pass-through in emerging markets” by M. Ca’ Zorzi, E. Hahn and M. Sánchez, March 2007.
740 “Transition economy convergence in a two-country model: implications for monetary integration” by J. Brůha and J. Podpiera, March 2007.
741 “Sectoral money demand models for the euro area based on a common set of determinants” by J. von Landesberger, March 2007.
742 “The Eurosystem, the US Federal Reserve and the Bank of Japan: similarities and differences” by D. Gerdesmeier, F. P. Mongelli and B. Roffia, March 2007.
743 “Credit market and macroeconomic volatility” by C. Mendicino, March 2007.
744 “International financial linkages of Latin American banks: the effects of political risk and deposit dollarisation” by F. Ramon-Ballester and T. Wezel, March 2007.
745 “Market discipline, financial integration and fiscal rules: what drives spreads in the euro area government bond market?” by S. Manganelli and G. Wolswijk, April 2007.
746 “U.S. evolving macroeconomic dynamics: a structural investigation” by L. Benati and H. Mumtaz, April 2007.
747 “Tax reform and labour-market performance in the euro area: a simulation-based analysis using the New Area-Wide Model” by G. Coenen, P. McAdam and R. Straub, April 2007.
748 “Financial dollarization: the role of banks and interest rates” by H. S. Basso, O. Calvo-Gonzalez and M. Jurgilas, May 2007.
749 “Excess money growth and inflation dynamics” by B. Roffia and A. Zaghini, May 2007.
750 “Long run macroeconomic relations in the global economy” by S. Dees, S. Holly, M. H. Pesaran and L. V. Smith, May 2007.
751 “A look into the factor model black box: publication lags and the role of hard and soft data in forecasting GDP” by M. Bańbura and G. Rünstler, May 2007.
752 “Econometric analyses with backdated data: unified Germany and the euro area” by E. Angelini and M. Marcellino, May 2007.
754 “Euro area inflation persistence in an estimated nonlinear DSGE model” by G. Amisano and O. Tristani,
753 “Trade credit defaults and liquidity provision by firms” by F. Boissay and R. Gropp, May 2007.
May 2007.

41ECB
Working Paper Series No 763 June 2007
May 2007.
757 “The cyclicality of consumption, wages and employment of the public sector in the euro area” by A. Lamo, J. J. Pérez and L. Schuknecht, May 2007.
758 “Red tape and delayed entry” by A. Ciccone and E. Papaioannou, June 2007.
759 “Linear-quadratic approximation, external habit and targeting rules” by P. Levine, J. Pearlman and R. Pierse, June 2007.
760 “Modelling intra- and extra-area trade substitution and exchange rate pass-through in the euro area” by A. Dieppe and T. Warmedinger, June 2007.
761 “External imbalances and the US current account: how supply-side changes affect an exchange rate adjustment” by P. Engler, M. Fidora and C. Thimann, June 2007.
762 “Patterns of current account adjustment: insights from past experience” by B. Algieri and T. Bracke, June 2007.
763 “Short- and long-run tax elasticities: the case of the Netherlands” by G. Wolswijk, June 2007.
756 “Maintaining low inflation: money, interest rates, and policy stance” by S. Reynard, May 2007.
755 “Durable goods and their effect on household saving ratios in the euro area” by J. Jalava and I. K. Kavonius,

ISSN 1561081-0
9 7 7 1 5 6 1 0 8 1 0 0 5