Shoreline City Council Strategic Planning Workshop Friday...
123
Shoreline City Council Strategic Planning Workshop Friday and Saturday, March 1-2, 2019 Brightwater Center (March 1) 22505 State Route 9 SE, Woodinville, WA 98072 Shoreline City Hall, Council Chambers (March 2) 17500 Midvale Avenue N, Shoreline, WA 98133 Friday, March 1, 2019 – City Council and Leadership Team Facilitator: Brian Murphy Brightwater Center Time Agenda Item Presenter 8:00-8:30 Breakfast 8:30-8:45 Welcome, Introduction & Purpose Mayor 8:45-9:00 Review Agenda, Ground Rules & Introductory Exercise Brian Murphy 9:00-9:15 Significant 2018 Accomplishments John Norris 9:15-10:15 Vision 2050 for the Puget Sound Region Paul Inghram, AICP Director of Growth Management Puget Sound Regional Council 10:15-10:30 Break 10:30-11:30 Vision 2029/Framework Goal Review 10 Year Review of City Vision and Framework Goal Accomplishments 10 Year Projection of Future Goals Brian/Debbie/All 11:30-12:00 City Council Goals and Action Steps Current 2018-2020 Goals and Action Steps Brian/Debbie/All 12:00-12:30 Lunch Break 12:30-1:15 City Council Goals and Action Steps (Cont.) Proposed 2019-2021 Goals and Action Steps Additions/Subtractions/Modifications Brian/Debbie/All 1:15-1:45 Break (and Short Trail Walk) 1:45-3:15 2019 Potential Ballot Measure - Community and Aquatics Center and Priority Park Investments Brian/Debbie/Eric Friedli/All 3:15-3:25 Break 3:25-4:15 Financial Reserve Policy Discussion Brian/Debbie/Sara Lane/All 4:15-4:30 Day 1 Wrap Up and Reflections All 4:30 Adjourn 6:00 Dinner Council/Debbie/John and Spouses/Partners
Transcript of Shoreline City Council Strategic Planning Workshop Friday...

Shoreline City Council Strategic Planning Workshop Friday and Saturday, March 1-2, 2019
Brightwater Center (March 1) 22505 State Route 9 SE, Woodinville, WA 98072
Shoreline City Hall, Council Chambers (March 2) 17500 Midvale Avenue N, Shoreline, WA 98133
Friday, March 1, 2019 – City Council and Leadership Team Facilitator: Brian Murphy Brightwater Center
Time Agenda Item Presenter
8:00-8:30 Breakfast
8:30-8:45 Welcome, Introduction & Purpose Mayor
8:45-9:00 Review Agenda, Ground Rules & Introductory Exercise
Brian Murphy
9:00-9:15 Significant 2018 Accomplishments John Norris
9:15-10:15 Vision 2050 for the Puget Sound Region Paul Inghram, AICPDirector of Growth Management Puget Sound Regional Council
10:15-10:30 Break
10:30-11:30 Vision 2029/Framework Goal Review
10 Year Review of City Vision and Framework Goal Accomplishments
10 Year Projection of Future Goals
Brian/Debbie/All
11:30-12:00 City Council Goals and Action Steps
Current 2018-2020 Goals and Action Steps
Brian/Debbie/All
12:00-12:30 Lunch Break
12:30-1:15 City Council Goals and Action Steps (Cont.)
Proposed 2019-2021 Goals and Action Steps
Additions/Subtractions/Modifications
Brian/Debbie/All
1:15-1:45 Break (and Short Trail Walk)
1:45-3:15 2019 Potential Ballot Measure - Community and Aquatics Center and Priority Park Investments
Brian/Debbie/Eric Friedli/All
3:15-3:25 Break
3:25-4:15 Financial Reserve Policy Discussion Brian/Debbie/Sara Lane/All
4:15-4:30 Day 1 Wrap Up and Reflections All
4:30 Adjourn
6:00 Dinner Council/Debbie/John andSpouses/Partners

Saturday, March 2, 2019 – City Council, City Manager, Assistant City Manager Facilitator: Brian Murphy Shoreline City Hall, Council Chambers
Time Agenda Item Presenter
8:15-8:30 Breakfast
8:30-8:35 Welcome Mayor
8:35-8:40 Review Agenda Brian
8:40-9:15 Working Breakfast
Friday Review and Update
Review of Revised Council Goals and Action Steps
Council/Debbie/John/Brian
9:15-10:15 Council Policy Issues
Car, Bike, and Scooter Share Policies and Regulations
Neighborhood Commercial Center Development and Activation
Requiring 1st Floor Commercial Occupancy in Mixed-use Development
Council/Debbie/John/Brian
10:15-10:30 Break
10:30-11:45 Council Policy Issues Cont.
Diversity and Inclusion Commission
Sustainability and Environmental Work Plan
Tree Code Regulations Review
Attracting the Film Industry Through Adapting Model Code for Use in Shoreline
Council/Debbie/John/Brian
11:45-12:30 Working Lunch (Jerseys) - Workshop Reflections/Takeaways
Council/Debbie/John/Brian
12:30 Adjourn

1
City of Shoreline
2018 Accomplishments
Goal 1: Strengthen Shoreline’s economic climate and opportunities
Completed implementation of the 10 Year Financial Sustainability strategies by implementing the Business and Occupation (B&O) Tax and identifying a revenue source to replace the ongoing General Fund contribution to Roads Cap.
Issued 2,494 development permits worth $3.13 million in permit revenue and roughly $169.5 million in construction valuation.
Conducted 4,846 inspections.
Implemented online scheduling of inspection requests in the City’s TRAKiT permit system.
Completed accelerated review and issuance of the Shoreline School District school construction building permits.
Held periodic developer stakeholder meetings.
Completed the Westminster Street Vacation in support of the Aurora Square CRA.
Actively advocated for the national model building code development effort to successfully
approve Tall Wood Buildings.
Successfully held or supported many place-making activities and events in Shoreline, including, among others:
o Celebrate Shoreline Jazz Walk, Festival and Concert, o Earth Day Event, o National Night Out, o Third annual Seattle International Film Festival (SIFF) screenings in Shoreline, o 7th season of the Shoreline Farmers Market, o Diversity and Inclusion Welcoming Week Events, o Swinging Summer Eve, o Monster Mash Dash, o Hamlin Haunt, o Shoreline Veteran’s Day Event, o Holliday Craft Market, o Breakfast with Santa, o Richmond Beach Saltwater Park Christmas Ships, and o Kruckeberg Botanic Garden Solstice Stroll, among others.
Goal 2: Improve Shoreline’s infrastructure to continue the delivery of highly-valued public services
Received $6,510,171 in new grant funding awards for utility, transportation and environmental infrastructure improvements, including $3,616,471 from the Transportation Improvement Board, $2,426,000 from WSDOT’s City Safety Program, and $467,700 from WSDOT’s Safe Routes to School Program; closed out TIB Complete Streets Grant for $250,000 with the implementation of 195th Street Ped/Bike Gap Filler.
001

2
Updated Sidewalk Prioritization Plan and identified funding strategy.
Completed the Sidewalk Citizen Advisory Committee process and adopted the Sidewalk
Prioritization Plan.
Increased the Vehicle License Fee or sidewalk maintenance.
Placed a Sales and Use Tax Ballot Measures for sidewalk expansion and maintenance on the November 6th General Election Ballot and received 52% support.
Earned a Bronze Bicycle Friendly Community designation from the League of American Bicyclists.
Completed construction of the Police Station at City Hall Project and new Clerk’s Office space and moved all Police personnel into the new Police Station.
Began implementing the 2017-2022 Parks, Recreation, and Open Space Master Plan, including completing conceptual designs for a potential Community Aquatics Center and priority park improvements at eight park sites.
Launched the Parks Funding Advisory Committee to evaluate potential funding strategies for the Community Aquatics Center and priority park investments.
Continued to implement the Urban Forest Strategic Plan, including completion of the first year of the Northwest Native Plant Stewardship program, which involves invasive species removal, habitat and understory restoration, and native plant and tree planting in the park system.
Updated the City’s tree canopy assessment, showing an increase in tree canopy citywide.
Integrated Ronald Wastewater District permitting coordination and customer assistance into the
P&CD lobby.
Continued to respond to legal challenges of Ronald Wastewater District’s assumption in
Snohomish County.
Formally adopted the City’s Surface Water Master Plan and completed Surface Water Small
Projects at eight (8) sites.
Continued to evaluate alternatives for City Maintenance Facility needs.
Continued to refine the Cityworks Asset Management Program and implemented the
Wastewater Utility into the program.
Executed a transportation mitigation agreement with Shoreline Community College.
Completed the Street Light Master Plan.
Constructed nearly one mile of a new trail system in Hamlin Park.
Completed the plan to bring right-of-way landscape maintenance services in-house.
Complete the following capital projects: o Richmond Beach Road Rechannelization Project, o Shoreline Park Fields A & B Turf Replacement Project, and o Annual street Bituminous Surface Treatments (BST) and asphalt overlay program.
Goal 3: Continue preparation for regional mass transit in Shoreline
Partnered with Sound Transit to conduct the In-Progress 90% Design Open House for the Lynnwood Link Extension (LLE) project and provided In-Progress 90% design comment letter to Sound Transit in accordance with Council-adopted Guiding Principles for Light Rail Stations.
Continued to participate in Sound Transit Task Force Design Review meetings, over the shoulder permit review and milestone design review for the In-Progress 90% and 100% Early Work design submittals.
002

3
Negotiated and adopted the LLE Transit Way Agreement and Funding and Intergovernmental Cooperative Agreement, which includes $2 million per station in mitigation funding for non-motorized access improvements around each station.
Achieved design concurrence for Ridgecrest Park impact mitigation for the LLE project.
Updated the City’s Noise Code and provided interdepartmental staff training on the new regulations.
Began the 185th Multimodal Modal Corridor Strategy.
Developed administrative procedures to implement green building and affordable housing mandates in the light rail station subareas.
Began preliminary design and environmental analysis on the 148th Street Non-motorized Bridge Project and Trail Along the Rail Project.
Goal 4: Expand the City’s focus on equity and inclusion to enhance opportunities for community engagement
Collaborated with King County to complete RFP process for an affordable housing project on the City-owned N 198th Street and Aurora Ave property, identified Community Psychiatric Clinic and Catholic Housing Services as the project team, and initiated community outreach and engagement.
Continued to implement the Diversity and Inclusion program, including sponsoring Culture Share events and the Shoreline Social Justice Book Group.
Conducted the second Shoreline CityWise citizen academy.
Conducted a right-of-way ADA condition assessment.
Established an ADA complaint procedure for citizen ADA complaints and appointed an ADA
coordinator.
Conducted 2 Nurturing Trust workshops in Spanish.
Updated the City’s Website to improve access for all residents and the public.
Continued City’s presence through Twitter, Facebook and other social media efforts.
Goal 5: Promote and enhance the City’s safe community and neighborhood programs and initiatives
Continued to coordinate law enforcement efforts with various partners to address criminal activity and quality of life issues as part of the City’s goal to work towards data driven policing.
Continued special emphasis Police patrols on the south and north end of the Interurban Trail.
Held 41 crime prevention and community safety neighborhood meetings.
Continued the cross-departmental Safe Neighborhoods/Safe Community team.
Continued implementation of the Risk Analysis De-escalation and Referral (RADAR) program.
Implemented Crime Prevention through Environmental Design (CPTED) plan for Darnell Park and along the Interurban Trail, including vegetation management and debris cleanup.
Supported over 79 National Night Out block parties.
Collected and analyzed traffic data and presented the Annual Traffic Report to the Council.
Conducted 21 Civilian Response to Active Shooter Events (CRASE) trainings.
Implemented new Shoreline records management system.
Researched information on regional circumstances related to homelessness and opioid addiction to create a context within which Shoreline’s problems can be effectively analyzed.
003

4
Other 2018 Accomplishments
Adopted the City’s First Biennial Budget (2019-2020).
Awarded the GFOA Distinguished Budget Award.
Received clean financial and Community Development Block Grant (CDBG) audits.
Continued to implement the Technology Strategic Plan including continued City technology stabilization, redesign and replacement of network infrastructure, migration of email to Office 365, upgrade of the Cityworks application and the City’s GIS, and upgrade to Windows 10/Office 2016.
Upgraded the City’s phone system, desktop operating system, and migrated cellular phone providers.
Adopted the annual batch of Development Code amendments.
Adopted the docket of annual Comprehensive Plan amendments.
Continued to monitor development of the Snohomish County Draft Environmental Impact Statement for the proposed Point Wells development.
Completed the Point Wells Phase I tolling study.
Increased annual human service funding in accordance with the adopted Human Services
Funding Policy.
Stimulated the creation of 58 affordable housing units through Shoreline’s PTE program.
Continued to partner with King County, Community Psychiatric Clinic and Catholic Housing Services on development of an affordable housing project on City-owned property at 198th Street and Aurora Avenue, including hosting and facilitating many community meetings regarding the project.
Cleaned-up/removed 29 unsanctioned homeless encampments in Shoreline parks.
Continued the Home Improvement Workshops.
Held the 2018 State of the City Breakfast: “Love Shoreline”.
Accomplished the “Million Stair Challenge” at Richmond Beach Saltwater Park and "Million Step Challenge" at Paramount School Park.
Earned the 2018 WellCity Award, which resulted in receiving a 2% premium discount on one of the medical plans offered.
Held the annual Volunteer Soiree recognition event.
Conducted 120 staff recruitment and hiring processes.
Hosted a Reasonable Accommodation Training for all managers and supervisors.
Conducted the second staff performance appraisal process in the refined the online employee performance management system.
Held leadership training for over 60% of City’s full-time staff.
Held three Home Improvement Workshops & Vendor Fairs in March, April and May.
004

VISION 2029Imagine for a moment that it is the year
2029 and you are in the City of Shoreline. This vision statement describes what
you will see.
005

Shoreline in 2029 is a thriving, friendly city where people of all ages, cultures, and economic backgrounds love to live, work, play and, most of all, call home. Whether you are a first-time visitor or long-term resident, you enjoy spending time here.
There always seems to be plenty to do in Shoreline -- going to a concert in a park, exploring a Puget Sound beach or dense
forest, walking or biking miles of trails and sidewalks throughout the city, shopping at local businesses or the farmer’s market, meeting friends for a movie and meal, attending a street fes-tival, or simply enjoying time with your family in one of the city’s many unique neighborhoods.
People are first drawn here by the city’s beautiful natural setting and abundant trees; afford-able, diverse and attractive housing; award-winning schools; safe, walkable neighborhoods; plentiful parks and recreation opportunities; the value placed on arts, culture, and history; con-venient shopping, as well as proximity to Seattle and all that the Puget Sound region has to offer.
The city’s real strengths lie in the diversity, talents and character of its people. Shoreline is culturally and economically diverse, and draws on that variety as a source of social and eco-nomic strength. The city works hard to ensure that there are opportunities to live, work and play in Shoreline for people from all backgrounds.
Shoreline is a regional and national leader for living sustainably. Everywhere you look there are examples of sustainable, low impact, climate-friendly practices come to life – cutting edge energy-efficient homes and businesses, vegetated roofs, rain gardens, bioswales along neigh-borhood streets, green buildings, solar-powered utilities, rainwater harvesting systems, and local food production to name only a few. Shoreline is also deeply committed to caring for its seashore, protecting and restoring its streams to bring back the salmon, and to making sure its children can enjoy the wonder of nature in their own neighborhoods.
VISION2029
Shoreline is a city of neighborhoods, each with its own charac-ter and sense of place. Residents take pride in their neighborhoods, working together to retain and improve their distinct identities while embracing connections to the city as a whole. Shoreline’s neighbor-
hoods are attractive, friendly, safe places to live where residents of all ages, cultural backgrounds and incomes can enjoy a high quality of life and sense of community. The city offers a wide diversity of hous-ing types and choices, meeting the needs of everyone from newcomers to long-term residents.
Newer development has accommodated changing times and both blends well with established neighborhood character and sets new standards for sustainable building, energy efficiency and envi-ronmental sensitivity. Residents can leave their car at home and walk or ride a bicycle safely and easily around their neighborhood or around the whole city on an extensive network of sidewalks and trails.
No matter where you live in Shoreline there’s no shortage of convenient destinations and cultural activities. Schools, parks, libraries, restaurants, local shops and services, transit stops, and indoor and outdoor community gathering places are all easily accessible, attractive and well maintained. Getting around Shoreline and living in one of the city’s many unique, thriving neighborhoods is easy, interesting and satisfying on all levels.
A CITY OFNeighborhoods
The city has several vibrant neighborhood “main streets” that feature a diverse array of shops, restaurants and services. Many of the neighborhood businesses have their roots in Shoreline, estab-lished with the help of a local business incubator, a long-term col-
laboration between the Shoreline Community College, the Shoreline Chamber of Commerce and the city.
Many different housing choices are seamlessly integrated within and around these commercial districts, providing a strong local customer base. Gathering places - like parks, plazas, cafes and wine bars - provide opportunities for neighbors to meet, mingle and swap the latest news of the day.
Neighborhood main streets also serve as transportation hubs, whether you are a cyclist, pedes-trian or bus rider. Since many residents still work outside Shoreline, public transportation provides a quick connection to downtown, the University of Washington, light rail and other regional destina-tions. You’ll also find safe, well-maintained bicycle routes that connect all of the main streets to each other and to the Aurora core area, as well as convenient and reliable local bus service throughout the day and throughout the city. If you live nearby, sidewalks connect these hubs of activity to the sur-rounding neighborhood, bringing a car-free lifestyle within reach for many.
NeighborhoodCENTERS
006

Aurora Avenue is Shoreline’s grand boulevard. It is a thriving corridor, with a variety of shops, businesses, eat-eries and entertainment, and includes clusters of some mid-rise buildings, well-designed and planned to transi-
tion to adjacent residential neighborhoods gracefully. Shoreline is recognized as a busi-ness-friendly city. Most services are available within the city, and there are many small businesses along Aurora, as well as larger employers that attract workers from throughout the region. Here and elsewhere, many Shoreline residents are able to find family-wage jobs within the City.
Housing in many of the mixed-use buildings along the boulevard is occupied by singles, couples, families, and seniors. Structures have been designed in ways that transition both visually and physically to reinforce the character of adjacent residential neighborhoods.
The improvements put in place in the early decades of the 21st century have made Aurora an attractive and energetic district that serves both local residents and people from nearby Seattle, as well as other communities in King and Snohomish counties. As a major transportation corridor, there is frequent regional rapid transit throughout the day and eve-ning. Sidewalks provide easy access for walking to transit stops, businesses, and connec-tions to adjacent neighborhoods.
Aurora has become a green boulevard, with mature trees and landscaping, public pla-zas, and green spaces. These spaces serve as gathering places for neighborhood and city-wide events throughout the year. It has state-of-the-art stormwater treatment and other sustainable features along its entire length.
As you walk down Aurora you experience a colorful mix of bustling hubs – with well-designed buildings, shops and offices – big and small – inviting restaurants, and people enjoying their balconies and patios. The boulevard is anchored by the vibrant Town Center, which is focused between 175th and 185th Street. This district is characterized by com-pact, mixed-use, pedestrian-friendly development highlighted by the Shoreline City Hall, the Shoreline Historical Museum, Shorewood High School, and other civic facilities. The interurban park provides open space, recreational opportunities, and serves as the city’s living room for major festivals and celebrations.
The SignatureBOULEVARD
Shoreline residents, city government and leaders care deeply about a healthy community. The city’s commitment to community health and wel-fare is reflected in the rich network of programs and organizations that provide human services throughout the city to address the needs of all its residents.
Shoreline is a safe and progressive place to live. It is known region wide for the effectiveness of its police force and for programs that encourage troubled people to pursue positive activities and provide alternative treatment for non-violent and non-habitual offenders.
A HEALTHYCommunity
In Shoreline it is believed that the best decisions are in-formed by the perspectives and talents of its residents. Com-munity involvement in planning and opportunities for input are vital to shaping the future, particularly at the neighbor-
hood scale, and its decision making processes reflect that belief. At the same time, elected leaders and city staff strive for efficiency, transparency and consistency to ensure an effective and responsive city government.
Shoreline continues to be known for its outstanding schools, parks and youth services. While chil-dren are the bridge to the future, the city also values the many seniors who are a bridge to its shared history, and redevelopment has been designed to preserve our historic sites and character. As the population ages and changes over time, the City continues to expand and improve senior services, housing choices, community gardens, and other amenities that make Shoreline such a desirable place to live.
Whether for a 5-year-old learning from volunteer naturalists about tides and sea stars at Richmond Beach or a 75-year-old learning yoga at the popular Senior Center, Shoreline is a place where people of all ages feel the city is somehow made for them. And, maybe most importantly, the people of Shore-line are committed to making the city even better for the next generation.
BETTER FOR THENext Generation
007

The original framework goals for the city were developed through a series of more than 300 activities held in 1996-1998. They were updated through another series of community visioning meetings and open houses in 2008-2009. These Framework Goals provide the overall policy foundation for the Comprehensive Plan
and support the City Council’s vision. When implemented, the Framework Goals are intended to preserve the best qualities of Shoreline’s neighborhoods today and protect the City’s future. To achieve balance in the City’s development the Framework Goals must be viewed as a whole and not one pursued to the exclusion of others.
Shoreline is committed to being a sustainable city in all respects.
FG 1: Continue to support exceptional schools and opportunities for lifelong learning.
FG 2: Provide high quality public services, utilities, and infrastructure that accommodate anticipated levels of growth, protect public health and safety, and enhance the quality of life.
FG 3: Support the provision of human services to meet community needs.
FG 4: Provide a variety of gathering places, parks, and recreational opportunities for all ages and expand them to be consistent with population changes.
FG 5: Encourage an emphasis on arts, culture and history throughout the community.
FG 6: Make decisions that value Shoreline’s social, economic, and cultural diversity.
FG 7: Conserve and protect our environment and natural resources, and encourage restora-tion, environmental education and stewardship.
FG 8: Apply innovative and environmentally sensitive development practices.
FG 9: Promote quality building, functionality, and walkability through good design and de-velopment that is compatible with the surrounding area.
FG 10: Respect neighborhood character and engage the community in decisions that affect them.
FG 11: Make timely and transparent decisions that respect community input.
FG 12: Support diverse and affordable housing choices that provide for Shoreline’s popula-tion growth, including options accessible for the aging and/or developmentally dis-abled.
FG 13: Encourage a variety of transportation options that provide better connectivity within Shoreline and throughout the region.
FG 14: Designate specific areas for high density development, especially along major trans-portation corridors.
FG 15: Create a business friendly environment that supports small and local businesses, at-tracts large businesses to serve the community and expand our jobs and tax base, and encourages innovation and creative partnerships.
FG 16: Encourage local neighborhood retail and services distributed throughout the city.
FG 17: Strengthen partnerships with schools, non-governmental organizations, volunteers, public agencies and the business community.
FG 18: Encourage Master Planning at Fircrest School that protects residents and encourages energy and design innovation for sustainable future development.
Adopted 2009
Framework GOALS
008

2018-2020 Council Goals Related Comp Plan Framework Goals 2009-2018 AccomplishmentsFG 15 - Create a business-friendly environment that supports small and
local businesses, attracts large businesses to serve the community,
expands our jobs and tax base, and encourages innovation and creative
partnerships.
• Adopted the Community Renewal Area (CRA) for Aurora Square including a Planned Action EIS
• Launched the Shoreline Film Office in collaboration with the Shoreline Community College
• Launched the Surprised by Shoreline Promotional Campaign
• Conducted business education and networking (Quick Start) workshops for local Shoreline businesses
• Launched Shoreline Farmer's Market at City Hall, which then relocated to Aurora Square
• Business Exemption for Transportation Impact Fee
FG 16 - Encourage local neighborhood retail and services distributed
throughout the city.
• Support for "Downtown Ridgecrest" placemaking and improvement projects, including a Port of Seattle grant to support planning to this
neighborhood commercial hub
• Food Truck Shoreline Events
FG 17 - Strengthen partnerships with schools, non-governmental
organizations, volunteers, public agencies, and the business community.
• Continued to coordinate and support an Emergency Management Council
• Participated in the Joint Committee of Elected Officials (CEO) between the Ronald Wastewater District Board and the City Council
• Renegotiated the Joint Use Agreement between Parks and Recreation and the Shoreline School District
• Coordinated joint City Council Dinner Meetings with governmental and non-governmental agencies
• Developed the 198th Affordable Housing Partnership for 80-100 units of permanent affordable housing
• Supported the development Ronald Commons to create 60 unites of affordable housing and a 12,000 sq. ft. service center
• Supported the siting of Mary's Place, a night shelter for 40 mothers and children each night
• Partnered with the Church Council of Greater Seattle to facilitate faith communities hosting tent encampments
• Partnered with the King Conservation District and Washington Native Plant Society to implement the urban forest stewards program
FG 18 - Encourage Master Planning at Fircrest School that protects
residents and encourages energy and design innovation for sustainable
future development.
• Participated in Phase I, Phase II and Phase III of Fircrest Master Planning with the State
FG2 - Provide high quality public services, utilities, and infrastructure that
accommodate anticipated levels of growth, protect public health and
safety, and enhance the quality of life.
• Adopted the 10 Year Financial Sustainability Plan and implemented all the Plan strategies
• Completed all phases of the Aurora Corridor Improvement Project
• Completed the Interuban Trail
• Completed construction of numerous right-of-way capital improvement projects for motorized and non-motorized transportation
• Completed numerous capital improvement projects to improve utility service and infrastructure
• Received millions of dollars in grant funding for capital projects to fund their design and construction
• Implemented the Ronald Wastewater District Assumption Transition Plan, including receiving approval of assumption from the King
County Boundary Review Board, and began operating the Wastewater Utility
• Completed the Utility Unification and Efficiency Study for acquisition of the Seattle Public Utilities water system, resulting in the Franchise
Amendment outlining additional capital investments and fire hydrant management in the Shoreline territory
• Adopted Transportation, Surface Water, and Parks, Recreation and Open Space Plan Master Plan Updates
• Completed the Comprehensive Plan Update
• Adopted a Transportation Impact Fee, Parks Impact Fee and Fire Impact Fee
• Implemented an Asset Management System and Program
• Implemented the Bike Master Plan
• Received American Public Works Association (APWA) accreditation
• Completed the Richmond Beach Road Re-Channelization project which included extensive public outreach.
• Executed transportation mitigation agreement with Shoreline Community College.
• Completed Street Light Master Plan.
• Awarded over 2.5M in 2018 for transportation safety improvements through WSDOT’s City Safety Program.
• Received Complete Streets Program grant funding and successfully completed pedestrian and bicycle improvements on a section of N
195th Street.
• Completed and adopted the Sidewalk Prioritization Plan which provided the groundwork for a voter approved November 2018 ballot
measure to implement a Sales & Use Tax for construction of new sidewalk.
FG 3 - Promote quality building, functionality, and walkability through
good design and development that is compatible with the surrounding
area.
• Adopted the 145th Street and 185th Street subarea plans
• Adopted annual amendments to the development code
• Completed the Sidewalk Prioritization and ADA Transition Plans
• Completed the Town Center Subarea Plan
• Adopted the Community Renewal Area (CRA) for Aurora Square
• Completed two east-west connections between the Interurban and Burke Gillman Trails
Goal 1: Strengthen Shoreline’s
economic climate and opportunities
Goal 2: Improve Shoreline’s
009

2018-2020 Council Goals Related Comp Plan Framework Goals 2009-2018 AccomplishmentsFG 5 - Provide a variety of gathering places, parks, and recreational
opportunities for all ages and expand them to be consistent with
population changes.
• Completed all projects and park acquisitions as part of the 2006 Park Bond, including the creation of 2 off-leash dog parks
• Constructed and inaugurated a highly successful community garden program at Twin Ponds Park and Sunset School Park
• Launched and supported the Shoreline Farmer's Market in partnership with the Shoreline Farmers Market Association
• Encouraged people to exercise by challenging the community to climb one million steps at Richmond Beach Saltwater Park
• Made all parks in Shoreline tobacco free
• Improved Kruckeberg Botanic Garden with new parking, signage and handicap accessibility improvements
• Dedicated Sunset School Park
• Completed other park capital improvement projects, including the creation of an East-side Off leash Dog Park, improvements at Echo
Lake Park, trail development and restoration and field turf replacement, and major maintenance and repairs at the Shoreline Pool
• Developed a Healthy City Strategy, held the Kids Move Challenge, and continue to host the Monster Mash Dash
• Completed and dedicated the Veteran's Recognition Plaza at City Hall
• Expanded various recreation programming, including older adult programming, outdoor camps for kids, and art in the park
FG 8 - Conserve and protect our environment and natural resources, and
encourage restoration, environmental education, and stewardship.
• Adopted Tree City USA Ordinance and established a Tree Board; named as a Tree City USA by the Arbor Day Foundation
• Worked with Seattle City Light to replace the City's high-pressure sodium streetlight lamps with LED lamps, reducing energy used
• Created the environmental sustainability indicators webpage to track the City's progress in achieving sustainability goals outlined in the
City's Environmental Sustainability Strategy
• Adopted a Climate Action Plan and Climate Wedge Analysis
• Awarded King County Green Globe Award for being a leader in pesticide reduction
• Implemented the 2016-2019 Priority Environmental Strategies, including adoption of incentives for environmentally sustainable
buildings, exploration of district energy, update of the City's Forevergreen website, and continued focus on effective stormwater
management practices including restoration of salmon habitat
• Adopted an Urban Forest Strategic Plan and conducted a citywide tree canopy assessment
• Adopted the Surface Water Master Plan, which transitioned to implementing a proactive management strategy addressing high priority
long-term needs
• Updated the Critical Areas regulations
• Hosted Green Building Speaker’s Series
• Adopted the Shoreline Master Program
• Received many environmental awards, such as the Built Green Hammer Award, Futurwise Livable Communities Award, APA/PAW
Sustainability Award
FG 9 - Apply innovative and environmentally sensitive development
practices.
• Received King County's 2014 Outstanding Leadership in Green Building award
• Adopted tree regulations, including citywide goals for urban forest canopy
• Opened a newly built City Hall that was awarded LEED Gold by the U.S. Green Building Council
• 4-Star Built Green Construction required in all MUR Zones
• Adopted the Deep Green Incentive Program
• Adopted regulations to facilitate greener development
FG 13 - Encourage a variety of transportation options that provide better
connectivity within Shoreline and throughout the region.
• Advocated successfully for two light rail stations to service Shoreline - Shoreline South/145th Station and Shoreline North/185th Station
• Designated Shoreline's preferred light rail alignment and light rail station area locations, adopted guiding principles for light rail station
area planning
• Engaged with Sound Transit on environmental review, a public design review process and milestone and over the shoulder design review
of the light rail project
• Partnered with Sound Transit and other North King County cities to include a Bus Rapid Transit Project along SR 522/523 connecting to
the Shoreline South/145th Street light rail station as part of the ST3 ballot measure
• Conducted the 145th Street Corridor Study
• Updated the Development Code for the Special Use Permit (SUP) Process
• Established various regulations to support the light rail and light rail stations
• Advocated for future transit investments to serve Shoreline during King County Metro's Long Range Planning Process
• Implemented the Bicycle System Plan and Wayfinding Program with a combination of bicycle lanes, sharrows, and route signage.
• Completed Safe Routes to School projects, which included $467K by WSDOT's Safe Routes to School Program.
• Developed concept for design of a Woonerf as an extension of 3rd Ave NE near the future Shoreline South/145th Station.
• Completed the Trail Along the Rail feasibility study to analyze the possibility of constructing a pedestrian/bicycle shared-use path along
the Sound Transit light rail alignment.
FG 14 - Designate specific areas for high-density development, especially
along major transportation corridors.
• Adopted the 145th and 185th Street Light Rail Station Area Subarea Plan and Development Code
• Partnered with the Urban Land Institute to study bus rapid transit and transit-oriented developments in Shoreline
FG 4 - Support the provision of human services to meet community needs. • Increased Human Service Funding so that funding is in alignment with 1% of General Fund Operating Revenues (5-year implementation)
• Reviewed City Codes regarding homeless encampments and vehicle residency in the right-of-way
• Partnered with Lake City Partners to fund an Outreach Worker to engage with persons experiencing homelessness
• Provided access to showers at Spartan Recreation Center and Pool
• Increased recreation scholarship amount
• Partnered with Shoreline Fire to create Interim Use Emergency Shelters (Mary’s Place model)
Goal 2: Improve Shoreline’s
infrastructure to continue the
delivery of highly-valued public
services
Goal 3: Continue preparation for
regional mass transit in Shoreline
010

2018-2020 Council Goals Related Comp Plan Framework Goals 2009-2018 AccomplishmentsFG 7 - Make decisions that value Shoreline’s social, economic, and cultural
diversity.
• Developed and implemented the City's Diversity and Inclusion Program
• Broadened the Nurturing Trust Program to reach additional underrepresented members of the Shoreline community
• Conducted public outreach using an equity lens, which included an increased use of interpreters at public meetings and increasing
outreach to historically underrepresented communities
FG 10 - Respect neighborhood character and engage the community in
decisions that affect them.
• Adopted the Southeast Area Neighborhoods Subarea Plan
• Implemented a variety of communication tools such as Council meeting "e-comment" and social media such as Facebook and YouTube
• Partnered with Sound Transit to host local public meetings for project design milestones
• Identified anticipated impacts to Shoreline neighborhoods from future construction and operation of the Lynnwood Link Extension and
worked proactively with Sound Transit to develop plans to minimize, manage and mitigate these impacts
• Implemented the Shoreline Citywise Project to help the community build familiarity with the many aspects of Shoreline government and
its role in providing services
• Developed a communication and marketing plan for Parks and Recreation
• Adopted transition standards to provide a buffer for low density residential adjacent to higher intensity development
FG 11 - Make timely and transparent decisions that respect community
input.
• Successfully communicated with the community and received community support for two Levy Lid Lift Ballot Measures
• Conducted community outreach and visioning for the 145th and 185th station subarea plans
• Conducted community outreach for major City policies and plans
• Authorized Placement of Sidewalk Ballot Measure
• Engaged with community to study possible Seattle Public Utilities water district acquisition
• Amended the Development Code to identify the Hearing Examiner as the decision maker for certain quasi-judicial permits
• Redesigned City's website
FG 12 - Support diverse and affordable housing choices that provide for
Shoreline’s population growth, including options accessible for older
adults and people with disabilities.
• Expanded the City's property tax exemption (PTE) program to encourage more multi-family and affordable housing choices
• Awarded Housing Development Consortium's Municipal Champion Award for leadership in supporting affordable housing opportunities
• Partnered on the Ronald Commons and 198th and Aurora Affordable Housing Projects
• Adopted a mandatory affordable housing provision within the station areas
• Amended the Development Code to include Residential Care Facilities in low density zones
• Amended the Development Code to allow for unit lot subdivisions
Goal 5: Promote and enhance the
City’s safe community and
neighborhood programs and
initiatives
• Conducted public safety forum workshops to hear from residents about their public safety concerns
• Awarded Association of Washington Cities Municipal Excellence Award for shared police command model
• Constructed the Shoreline Police Station at City Hall
• Adopted a Chronic Nuisance Ordinance
• Adopted a Stay Out of Drug Area (SODA) Ordinance
• Conducted multiple Crime Prevention Through Environmental Design (CPTED) reviews of Shoreline parks
• Established the Safe Neighborhood/Safe Community Team to share public safety information
• Continued strong participation and management of National Night Out Block Parties and other crime prevention efforts
• Established the Risk Analysis, De-escalation and Referral (RADAR) Program partnered to support a mental health navigator
FG1 - Continue to support exceptional schools and opportunities for
lifelong learning.
• Partnered with the Shoreline School District to update the Joint Use Agreement
• Supported School District Ballot Measures for capital and operating investments from the community
• Collaborated with Shoreline and Lake Forest Park Senior Center for the Aging Adult Services Study
• Accelerated Permit processing agreement with the School District for 2017-2019
FG 6 - Encourage an emphasis on arts, culture, and history throughout the
community.
• Enhanced and expanded the City's Celebrate Shoreline offerings, including revamping the Celebrate Shoreline Festival and supporting
other placemaking events
• Conducted an update of the City's historic properties inventory
• Revise the public art policy and updated the Enhanced the City's Public Art Plan
• Expanded the City Hall rotating art gallery
• Created the temporary sculpture program at the Park at Town Center
• Maintained a partnership with the Shoreline Historic Museum
• Implemented local neighborhood art programs, including piano time, utility box wraps, and murals
• Supported a number of neighborhood-based murals throughout the city
Goal 4: Expand the City’s focus on
equity and inclusion to enhance
opportunities for community
engagement
Non-Goal Related
011

2019 2020 2021 2022 2023 2024 2025 2026 2027 2028 2029 20302nd Q - Light Rail
Project Construction
Starts; Urban Growth
Capacty Study
25% Reduction in
2007 Greenhouse Gas
Emissions; PSRC
Vision 2050 adoption:
Washington State
Public Health Lab
Master Plan Review;
CRISTA Master Plan
Review
185th Street Station
Area Phase II Zoning
Unlocks; 185th Street
Station Area Plan 1st
review; Shoreline
Place 1st review
Potential Levy Lid Lift
Ballot Measure; 145th
Street Station Area
Plan 1st review
2nd Q - Light Rail
Project Construction
Complete; 2nd Q -
Required Major
Update of the
Comprehensive Plan;
New Growth Targets
Light Rail Project
Service Starts; 145th
BRT Project Service
Starts; Shoreline
Community College
Master Plan Review
North City Water
District Franchise
Expires; Shoreline
Master Plan
Update
Potential Levy Lid
Lift Ballot Measure50% Reduction in
2007 Greenhouse
Gas Emissions
2018-2020 Council Goals Related Comp Plan Framework GoalsFG 15 - Create a business-friendly environment that supports small and
local businesses, attracts large businesses to serve the community,
expands our jobs and tax base, and encourages innovation and creative
partnerships.
FG 16 - Encourage local neighborhood retail and services distributed
throughout the city.
FG 17 - Strengthen partnerships with schools, non-governmental
organizations, volunteers, public agencies, and the business community.
FG 18 - Encourage Master Planning at Fircrest School that protects
residents and encourages energy and design innovation for sustainable
future development.
FG2 - Provide high quality public services, utilities, and infrastructure that
accommodate anticipated levels of growth, protect public health and
safety, and enhance the quality of life.
FG 3 - Promote quality building, functionality, and walkability through
good design and development that is compatible with the surrounding
area.
FG 5 - Provide a variety of gathering places, parks, and recreational
opportunities for all ages and expand them to be consistent with
population changes.
FG 8 - Conserve and protect our environment and natural resources, and
encourage restoration, environmental education, and stewardship.
FG 9 - Apply innovative and environmentally sensitive development
practices.
FG 13 - Encourage a variety of transportation options that provide better
connectivity within Shoreline and throughout the region.
FG 14 - Designate specific areas for high-density development, especially
along major transportation corridors.
FG 4 - Support the provision of human services to meet community
needs.
FG 7 - Make decisions that value Shoreline’s social, economic, and
cultural diversity.
FG 10 - Respect neighborhood character and engage the community in
decisions that affect them.
FG 11 - Make timely and transparent decisions that respect community
input.
FG 12 - Support diverse and affordable housing choices that provide for
Shoreline’s population growth, including options accessible for older
adults and people with disabilities.
Goal 5: Promote and enhance the
City’s safe community and
neighborhood programs and
initiatives
FG1 - Continue to support exceptional schools and opportunities for
lifelong learning.
FG 6 - Encourage an emphasis on arts, culture, and history throughout
the community.
Work on Major Update to the Comprehensive Plan; Begin sidewalk repair and
construction program
Adopt Updated Economic Development Strategic Plan
Partner with the DSHS, DNR and WA State Legislature on Fircrest Master Planning
Work on Economic Development Strategic Plan Update; Complete a series of
improvements in the Community Renewal Area (CRA) through the Westminster and
N 155th Improvements Project
Longer Term Work Projects - 2023/2024, 2025/2026, 2027/2028 Biennia
Work on Surface Water Master Plan Update; Adopt current Transportation Master
Plan Update; Design of the 145th Corridor between SR99 to I-5; Design of 175th
Corridor between Midvale to I-5
Work on PROS Plan Update
Adopt Surface Water Master Plan; Work on and Adopt Wastewater Master Plan Update; Work on Transportation
Master Plan Update
Adopt Major Update to the Comprehensive Plan; Continue sidewalk repaire and construction program
Adopt PROS Plan Update
Goal 4: Expand the City’s focus on
equity and inclusion to enhance
opportunities for community
engagement
Goal 2: Improve Shoreline’s
infrastructure to continue the
delivery of highly-valued public
services
Goal 1: Strengthen Shoreline’s
economic climate and
opportunities
Non-Goal Related
Major Events
Timeline
145th Street and 185th Street Station Areas Planned Action Review
Complete the 185th Street Multimodal Corridor Strategy and adopt a vision for the
corridor and future improvements; Complete Sound Transit funded light rail access
improvements near the 145th (1st Ave NE) and 185th (5th Ave NE) StationsGoal 3: Continue preparation for
regional mass transit in Shoreline
Near Term Work Projects - 2019/2020 & 2021/2022 Biennia
012

Shoreline Indicators:
Covered Employment
Administrative Services Department
Budget & Tax Office
January 2019
SECTION PAGE Demographics 2
Education 3 Median Income 3
Poverty 4
Shoreline Employment 5 Total Employment 5
Unemployment 6 Workforce/Employment 7
Regional Comparison 8 King County Comparison 8
Other Cities Comparisons 10
Shoreline Employment Sectors
12
Changes in Sectors 12 Regional Comparison 14
King County Comparison 15 Construction/Resources 17
Finance, Insurance, and Real Estate
18
Manufacturing 19 Retail Sector 20
Services 21 Wholesale, Transportation,
Utilities 22
Government 23 Education (public) 24
013

DRAFT Shoreline Indicators Budget & Tax Office: January 2019
2
Demographics
Source: US Census Bureau – 2012-2017 American Community Survey (ACS) 5-year Average
*According to Washington Office of Financial Management, Shoreline has an estimated population of 55,730 in
2018.
2017 %
Population (WA
OFM) 55,730
Male 48.1%
Female 51.9%
Median Age 41.7
18 years and over 81.5%
Education
population over 25
Less than high
school
diploma 8.4%
High school
graduate 15.4%
Some college,
no degree 20.3%
Associate's
degree 10.4%
Bachelor's
degree 29.8%
Graduate or
professional
degree 15.7%
014

DRAFT Shoreline Indicators Budget & Tax Office: January 2019
3
Source: US Census Bureau – American Community Survey (ACS) 2012-2017 5-year Estimates for Populations 25 and
above
Median Income
Source: US Census Bureau – American Community Survey (ACS) 2012-2017 5-year Estimates
No Degree60.7%
No Degree, 55.6%
No Degree44.1%
Associate's Degree or Above, 39.2%
Associate's Degree or Above, 44.3%
Associate's Degree or Above, 55.9%
0% 10% 20% 30% 40% 50% 60% 70% 80% 90% 100%
U.S.
WA
Shoreline
Educational Attainment: Population Over 25 Years Old
2009 2010 2011 2012 2013 2014 2015 2016 2017
Median
Household
Income $65,389 $67,076 $66,774 $66,160 $64,096 $64,096 $66,020 70,398$ $76,271
YOY Change $1,687 -$302 -$614 -$2,064 $0 $1,924 $4,378 $5,873
YOY % Change 2.6% -0.5% -0.9% -3.1% 0.0% 3.0% 6.6% 8.3%
015

DRAFT Shoreline Indicators Budget & Tax Office: January 2019
4
Source: US Census Bureau - American Community Survey (ACS) 5-year Estimates
Shoreline Poverty: 2012-2017
Source: US Census Bureau - American Community Survey (ACS) 5-year Estimates
$10,000
$20,000
$30,000
$40,000
$50,000
$60,000
$70,000
2010 2011 2012 2013 2014 2015 2016 2017
Median Earnings by Education Level
Less than high school diploma High school graduate
Some college, or Associates degree Bachelor's degree
Graduate or professional degree
10.0%
11.0%
10.5%10.6%
9.9%
9.0%
8.0%
8.5%
9.0%
9.5%
10.0%
10.5%
11.0%
11.5%
4,000
4,200
4,400
4,600
4,800
5,000
5,200
5,400
5,600
5,800
6,000
2012 2013 2014 2015 2016 2017
Shoreline Poverty Level
# of People Below Poverty Level As a % of Population
016
DRAFT Shoreline Indicators Budget & Tax Office: January 2019
5
Total Shoreline Employment
Number of Jobs Located in Shoreline: 2008-2017
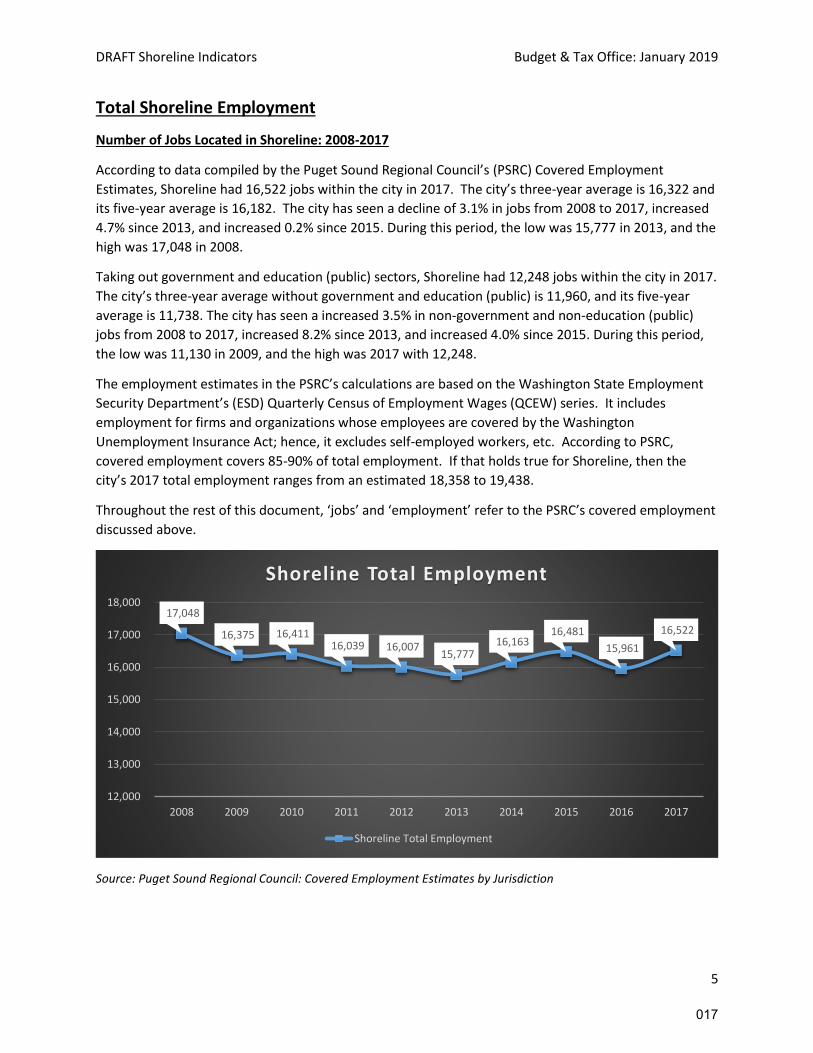
According to data compiled by the Puget Sound Regional Council’s (PSRC) Covered Employment
Estimates, Shoreline had 16,522 jobs within the city in 2017. The city’s three-year average is 16,322 and
its five-year average is 16,182. The city has seen a decline of 3.1% in jobs from 2008 to 2017, increased
4.7% since 2013, and increased 0.2% since 2015. During this period, the low was 15,777 in 2013, and the
high was 17,048 in 2008.
Taking out government and education (public) sectors, Shoreline had 12,248 jobs within the city in 2017.
The city’s three-year average without government and education (public) is 11,960, and its five-year
average is 11,738. The city has seen a increased 3.5% in non-government and non-education (public)
jobs from 2008 to 2017, increased 8.2% since 2013, and increased 4.0% since 2015. During this period,
the low was 11,130 in 2009, and the high was 2017 with 12,248.
The employment estimates in the PSRC’s calculations are based on the Washington State Employment
Security Department’s (ESD) Quarterly Census of Employment Wages (QCEW) series. It includes
employment for firms and organizations whose employees are covered by the Washington
Unemployment Insurance Act; hence, it excludes self-employed workers, etc. According to PSRC,
covered employment covers 85-90% of total employment. If that holds true for Shoreline, then the
city’s 2017 total employment ranges from an estimated 18,358 to 19,438.
Throughout the rest of this document, ‘jobs’ and ‘employment’ refer to the PSRC’s covered employment
discussed above.
Source: Puget Sound Regional Council: Covered Employment Estimates by Jurisdiction
17,048
16,375 16,411 16,039 16,007
15,777 16,163
16,481
15,961
16,522
12,000
13,000
14,000
15,000
16,000
17,000
18,000
2008 2009 2010 2011 2012 2013 2014 2015 2016 2017
Shoreline Total Employment
Shoreline Total Employment
017

DRAFT Shoreline Indicators Budget & Tax Office: January 2019
6
Source: Puget Sound Regional Council: Covered Employment Estimates by Jurisdiction
Unemployment: 2007-2018
Source: Washington State Employment Security Department (ESD): Local area unemployment statistics (LAUS) (not
seasonally adjusted)
11,830
11,130
11,534 11,325
11,444 11,317
11,495
11,774 11,858
12,248
10,000
11,000
12,000
13,000
2008 2009 2010 2011 2012 2013 2014 2015 2016 2017
Shoreline Total Employment (excluding Gov't & Ed (public)
Shoreline Total Employment
3.2%3.8%
7.7%
9.1%
8.1%
6.4%
5.0%4.7%
4.2% 4.0%3.7% 3.6%
2.0%
3.0%
4.0%
5.0%
6.0%
7.0%
8.0%
9.0%
10.0%
11.0%
2007 2008 2009 2010 2011 2012 2013 2014 2015 2016 2017 2018ThurSept
Unemployment Rate(not seasonaly adjusted)
Washington King County Shoreline
018

DRAFT Shoreline Indicators Budget & Tax Office: January 2019
7
Workforce/Number of Jobs in Shoreline: 2008-2017
From 2008 to 2017, Shoreline saw an increase of 3.0% in its population. During that time, its civilian
labor1 force, the number of civilians employed and unemployed, increased by 5.5% while at the same
time the total amount of covered employment within the city decreased by 3.1%.
The total amount of covered employment, excluding government and education (public), between 2009
and 2011 increased by 1.8%, and the unemployment rate increased by 0.4%. From 2012 to 2014, the
number of non-government and non-education (public) jobs increased by 0.4%, and the unemployment
rate decreased by 1.7%. Between 2015 and 2017, Shoreline gained 4.0% of its covered employment,
excluding government and education (public), the unemployment rate decreased by 0.5%.
Sources: Washington State Employment Security Department (ESD): Local area unemployment statistics (LAUS) (not seasonally adjusted) and
Puget Sound Regional Council: Covered Employment Estimates by Jurisdiction
1 Civilian labor are the people, both employed and unemployed, who live in Shoreline no matter in which jurisdiction they work. Covered employed are the number of jobs that are within Shoreline no matter in which jurisdiction the person filling the position lives.
10000
15000
20000
25000
30000
35000
2008 2009 2010 2011 2012 2013 2014 2015 2016 2017
Civilian Labor Force &Total City Employment
Sum of Civilian Labor Force Sum of Total City Employment
019

DRAFT Shoreline Indicators Budget & Tax Office: January 2019
8
Total Jobs in Shoreline Compared to Region
According to data compiled by the PSRC’s estimates, which covers King, Pierce, Snohomish, and Kitsap
County, there were 2.0 million jobs in the region in 2017. Shoreline employment made up 0.8% of these
jobs, which has declined by 0.12% since 2008.
From 2008 to 2017, the region employment grew by 11.4% compared to Shoreline’s decrease of 3.1%.
Looking over the last five years, the region’s employment grew by 11.5%, while Shorelines increased by
4.7%. Over the last three years, the region’s employment grew by 6.0% while Shoreline’s increased by
0.2%.
Source: Puget Sound Regional Council: Covered Employment Estimates by Jurisdiction
Total Jobs in Shoreline Compared to King County
According to data compiled by the PSRC’s estimates, there were 1.3 million jobs in King County in 2017.
Shoreline employment made up 1.2% of those jobs, which has declined by 0.20% since 2008.
From 2008 to 2017, employment in King County grew by 12.7% compared to Shoreline’s 3.1% decline in
employment. Looking at the five-year trends, the county’s employment grew by 12.8%, while Shorelines
increased by 4.7%. Over the last three years, the county’s employment grew by 6.6% while Shoreline’s
increased by 0.2%.
2008 2009 2010 2011 2012 2013 2014 2015 2016 2017
10-Year % of KC
Change % Change Since 2008
Shoreline Covered
Employment as a % of Total
Region 0.95% 0.95% 0.98% 0.94% 0.92% 0.88% 0.88% 0.87% 0.82% 0.83% -0.12% -13.0%
-6.00%
-4.00%
-2.00%
0.00%
2.00%
4.00%
6.00%
2008 2009 2010 2011 2012 2013 2014 2015 2016 2017
Shoreline / Region Employment YOY Change
Shoreline YOY %Change Region YOY %Change
2008 2009 2010 2011 2012 2013 2014 2015 2016 2017
10-Year % of KC
Change % change since 2007
Shoreline as a % of Total KC
Jobs 1.44% 1.44% 1.49% 1.43% 1.40% 1.33% 1.33% 1.32% 1.23% 1.24% -0.20% -13.97%
020

DRAFT Shoreline Indicators Budget & Tax Office: January 2019
9
Factoring out Seattle, employment in King County grew by 9.5% from 2008 to 2016, 10.7 % from 2013 to
2017, and 5.1% from 2015 to 2017.
Source: Puget Sound Regional Council: Covered Employment Estimates by Jurisdiction
-6.0%
-4.0%
-2.0%
0.0%
2.0%
4.0%
6.0%
2008 2009 2010 2011 2012 2013 2014 2015 2016 2017
Shorline / King County Employment YOY Change
Shoreline YOY %Change King County YOY %Change King County W/O Seattle YOY % Change
021

DRAFT Shoreline Indicators Budget & Tax Office: January 2019
10
Total Jobs in Shoreline Compared to Other Cities – All Sectors
The table below compares Shoreline’s employment growth from 2008 to 2017 to that of our comparable
cities. Over that period, Shoreline ranks 10th out of the 12 comparable cities in employment growth.
Shoreline ranks eight since 2013, and 11th since 2015.
On a per capita basis, Shoreline has 0.30 jobs per capita in 2017. Shoreline ranks 10th out of the 12
comparable cities on a per capita basis.
Source: Puget Sound Regional Council: Covered Employment Estimates by Jurisdiction
Source: Puget Sound Regional Council: Covered Employment Estimates by Jurisdiction
City 2008 2017 Difference % Change 2017Jobs Per Capita
Kirkland 32,742 46,804 14,062 42.9% 0.54
Kent 64,219 74,445 10,226 15.9% 0.59
Auburn 40,429 46,759 6,330 15.7% 0.59
Edmonds 11,588 12,912 1,324 11.4% 0.31
Renton 56,391 61,920 5,529 9.8% 0.60
Burien 11,376 12,307 931 8.2% 0.24
University Place 5,942 6,293 351 5.9% 0.19
Lynnwood 25,859 27,161 1,302 5.0% 0.74
Redmond 89,570 94,059 4,489 5.0% 1.51
Shoreline 17,048 16,522 (526) -3.1% 0.30
Lakewood 26,671 25,829 (842) -3.2% 0.44
Federal Way 31,066 29,976 (1,090) -3.5% 0.311
-10.0%
0.0%
10.0%
20.0%
30.0%
40.0%
50.0%
Percentage Change in Covered Employment: 2008-2017
022
DRAFT Shoreline Indicators Budget & Tax Office: January 2019
11
Total Jobs in Shoreline Compared to Other Cities – Excluding Government and Education (public)
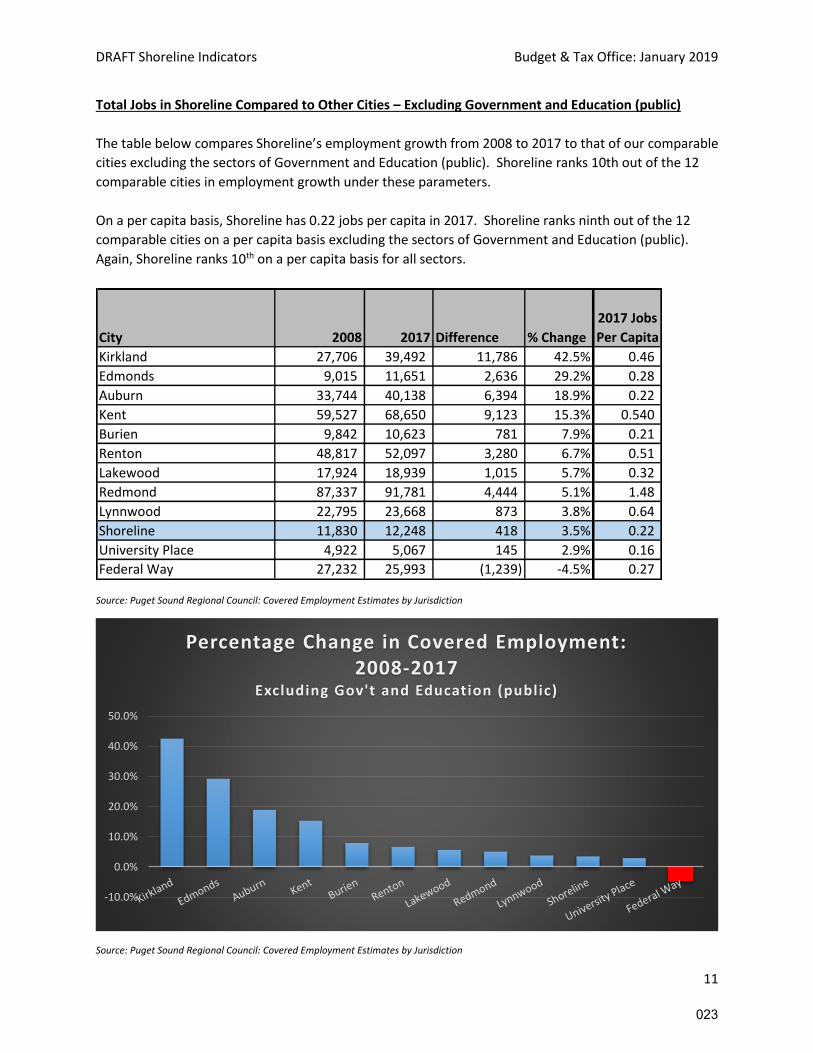
The table below compares Shoreline’s employment growth from 2008 to 2017 to that of our comparable
cities excluding the sectors of Government and Education (public). Shoreline ranks 10th out of the 12
comparable cities in employment growth under these parameters.
On a per capita basis, Shoreline has 0.22 jobs per capita in 2017. Shoreline ranks ninth out of the 12
comparable cities on a per capita basis excluding the sectors of Government and Education (public).
Again, Shoreline ranks 10th on a per capita basis for all sectors.
Source: Puget Sound Regional Council: Covered Employment Estimates by Jurisdiction
Source: Puget Sound Regional Council: Covered Employment Estimates by Jurisdiction
City 2008 2017 Difference % Change
2017 Jobs
Per Capita
Kirkland 27,706 39,492 11,786 42.5% 0.46
Edmonds 9,015 11,651 2,636 29.2% 0.28
Auburn 33,744 40,138 6,394 18.9% 0.22
Kent 59,527 68,650 9,123 15.3% 0.540
Burien 9,842 10,623 781 7.9% 0.21
Renton 48,817 52,097 3,280 6.7% 0.51
Lakewood 17,924 18,939 1,015 5.7% 0.32
Redmond 87,337 91,781 4,444 5.1% 1.48
Lynnwood 22,795 23,668 873 3.8% 0.64
Shoreline 11,830 12,248 418 3.5% 0.22
University Place 4,922 5,067 145 2.9% 0.16
Federal Way 27,232 25,993 (1,239) -4.5% 0.27
-10.0%
0.0%
10.0%
20.0%
30.0%
40.0%
50.0%
Percentage Change in Covered Employment: 2008-2017
Excluding Gov't and Education (public)
023

DRAFT Shoreline Indicators Budget & Tax Office: January 2019
12
Shoreline Employment Sectors
PSRC estimates breakdown employment into eight major sectors, which include:
• Construction and Resources
• Finance, Insurance, and Real Estate
• Manufacturing
• Retail
• Services
• Wholesale Trade, Transportation, and Utilities
• Government (public sector)
• Education (public sector)
Source: Puget Sound Regional Council: Covered Employment Estimates by Jurisdiction
Note: Percentages may not foot due to rounding.
Changes in Shoreline Sector Employment
The 10-year history of the City employment broken down by major sectors is found below2.
Throughout the 10-year period, the Services sector had the highest number of employees in Shoreline
with 7,796. That is, the Services sector made up 47.2% of jobs in Shoreline in 2017. Looking closer at
2 PSRC’s estimates break the data down to “major sector” categories, which utilize the North American Industry Classification System (NAICS) and divide between public and private sectors. Shoreline totals of each sector may not foot with previously reported amounts. This is due to protections of confidential employer information. As stated by PSRC:
The Puget Sound Regional Council protects confidential employer information through data suppression, as stipulated by ESD. Data from individual employers is not shared; where aggregate employment values represent fewer than three reporting firms, or when a single employer accounts for more than 80 percent of jobs, the value is withheld…
Construction/Resources
5.9%
Finance, Insurance, Real Estate2.2%Manufacturing
1.1%
Retail16.5%
Services47.2%
Wholesale Trade, Tranportation, and
Utilities1.4%
Government13.0%
Education12.9%
Shoreline Sectors - 2017TOTAL: 16,522 jobs
024

DRAFT Shoreline Indicators Budget & Tax Office: January 2019
13
the Services sector, the category of health care and social assistance contributes the largest number of
jobs for the sector and makes up 18.6% of the total jobs in Shoreline.
Source: Puget Sound Regional Council: Covered Employment Estimates by Jurisdiction
Source: Puget Sound Regional Council: Covered Employment Estimates by Jurisdiction
YEAR Const/Res FIRE Manufacturing Retail Services WTU Government Education
2008 875 621 316 2,698 7,174 146 3,132 2,086
2009 607 483 158 2,620 7,110 152 3,125 2,120
2010 558 498 160 2,629 7,533 156 2,751 2,126
2011 593 434 148 2,648 7,324 178 2,631 2,083
2012 611 441 140 2,645 7,427 180 2,581 1,982
2013 736 408 107 2,610 7,284 172 2,551 1,909
2014 779 402 118 2,609 7,369 218 2,599 2,069
2015 855 373 130 2,747 7,461 208 2,581 2,126
2016 921 361 144 2,622 7,578 232 1,967 2,136
2017 967 358 176 2,724 7,796 227 2,144 2,130
0
2000
4000
6000
8000
10000
12000
14000
16000
18000
2008 2009 2010 2011 2012 2013 2014 2015 2016 2017
Shoreline by Sector
Const/Res FIRE Manufacturing Retail Services WTU Government Education
025

DRAFT Shoreline Indicators Budget & Tax Office: January 2019
14
Changes in Sectors
Sectors in Shoreline Compared to Region
A look at the growth of each sector and its comparison with the rest of the region is seen in the chart
below.
Chart explained:
X Axis: Employment Change in Sector comparing 2017 to 2008.
Y Axis: Location Quotient (LQ) – shows Shoreline’s sectors as it relates to the Puget Sound’s total
employment. When LQ = 1, the employment is equal to the sector for the regional economy. If LQ<1, it
means Shoreline has a lower than average concentration of the sector compared to the Puget Sound
region. If LQ>1, it mean that Shoreline has a higher than average concentration compared to the Puget
Sound region.
Bubble Size: Estimated 2017 Number Employed in Sector in Shoreline.
% Change
2015-2017
% Change
2013-2017
% Change
2008-2017
Const/Resources 13.1% 31.4% 10.5%
Finance, Insurance, Real Estate -4.0% -12.3% -42.4%
Manufacturing 35.4% 64.5% -44.3%
Retail -0.8% 4.4% 1.0%
Services 4.5% 7.0% 8.7%Wholesale, Transportation, and
Utilities 9.1% 32.0% 55.5%
Government -16.9% -16.0% -31.5%
Education 0.2% 11.6% 2.1%
026

DRAFT Shoreline Indicators Budget & Tax Office: January 2019
15
Source: Puget Sound Regional Council: Covered Employment Estimates by Jurisdiction
Sectors in Shoreline Compared to King County
While the graph comparing Shoreline sectors to King County looks very similar to the comparison of the
whole region, it is important to look at the Location Quotient scale.
Const/Resources921
Finance, Insurance, Real Estate
361
Manufacturing144
Retail2,622
Services7,578
Whole Sale, Transportation,
and Utilities232
Government1,967
Education2,136
0.00
0.50
1.00
1.50
2.00
2.50
-50% -40% -30% -20% -10% 0% 10% 20% 30% 40% 50% 60% 70% 80% 90%
Loca
tio
n Q
uo
tie
nt
(Re
gio
n A
vera
ge =
1.0
)
Employment Change: 2008 - 2017
SHORELINE'S SECTORS
027

DRAFT Shoreline Indicators Budget & Tax Office: January 2019
16
Source: Puget Sound Regional Council: Covered Employment Estimates by Jurisdiction
Looking at the location quotient of Shoreline for the region and King County, the biggest difference is
how much more the Government sector is above the King County average. It is worth noting that the
Services sector is slightly above average for the whole region but then shifts to slightly below average
when focused to just King County. Furthermore, the Construction/Resources moves from slightly below
average for the region to slightly above average for just King County.
Const/Resources921
Finance, Insurance, Real Estate
361
Manufacturing144
Retail2,622
Services7,578
Wholesale, Transportation, and
Utilities232
Government1,967
Education2,136
0.00
0.50
1.00
1.50
2.00
2.50
3.00
-50% -40% -30% -20% -10% 0% 10% 20% 30% 40% 50% 60% 70% 80% 90%
Loca
tio
n Q
uo
tie
nt
(KC
Ave
rage
= 1
.0)
Employment Change: 2008 - 2017
SHORELINE'S SECTORSGROWTH & KING COUNTY LOCATION QUOTIENT
Shoreline
Region
Location
Quotient
King County
Location
Quotient
Const/Resources 0.97 1.10Finance, Insurance, Real
Estate 0.45 0.44
Manufacturing 0.12 0.14
Retail 1.45 1.54
Services 1.02 0.94Wholesale,
Transportation, and
Utilities 0.18 0.16
Government 1.51 1.90
Education 2.01 2.17
028

DRAFT Shoreline Indicators Budget & Tax Office: January 2019
17
Review of Sectors
The details of each of the major sectors is made up of more specific categories. Because of the company
confidentiality, the specific categories may be redacted in the details; hence, the total of the categories
may not equal the major sector totals. When this is the case, it has been noted with an asterisks (*). If
data in those categories were available in prior years, comments have been added analyzing older data
trends.
Construction/Resources Sector
Source: Puget Sound Regional Council: Covered Employment Estimates by Jurisdiction
Category 2017 Number of
Jobs % Change 2008-2017
Agriculture * *
Mining 0 0%
Construction * * Source: Puget Sound Regional Council: Covered Employment Estimates by Jurisdiction
The Construction/Resource sector made up 5.9% of Shoreline’s employment base in 2017.
From 2008 to 2017, Shoreline saw a growth of 92 jobs, or 10.5%, in the Construction/Resources sector.
It has seen a 73.3% increase since its lowest point in 2010. This is compared to the region’s decrease of
4.0% over the 2008 to 2017 period. The region has grown 44.2% since 2010.
In 2015, there were 15 jobs in agriculture and 840 jobs in construction within Shoreline.
0
200
400
600
800
1000
1200
2008 2009 2010 2011 2012 2013 2014 2015 2016 2017
Shoreline Construction/Resources Sector
029

DRAFT Shoreline Indicators Budget & Tax Office: January 2019
18
Finance, Insurance, and Real Estate Sector
Source: Puget Sound Regional Council: Covered Employment Estimates by Jurisdiction
Category 2017 Number of
Jobs % Change 2008-2017
Finance and Insurance 206 -38.9%
Real Estate and Rental 152 -46.5%
Source: Puget Sound Regional Council: Covered Employment Estimates by Jurisdiction
The sector of Finance, Insurance, and Real Estate made up 2.2% of Shoreline’s employment base in
2017.
From 2008 to 2017, the sector of Finance, Insurance, and Real Estate saw a 42.4% decrease in Shoreline.
The region saw a decrease of 15.0% during the same period.
0
100
200
300
400
500
600
700
2008 2009 2010 2011 2012 2013 2014 2015 2016 2017
Shoreline Finance, Insurance, and Real Estate Sector
030

DRAFT Shoreline Indicators Budget & Tax Office: January 2019
19
Manufacturing Sector
Source: Puget Sound Regional Council: Covered Employment Estimates by Jurisdiction
Category 2017 Number
of Jobs % Change 2008-2017
Manufacturing (mainly food) * *
Manufacturing (mainly wood, oil, plastic, concrete) * *
Manufacturing (mainly metal, machine shops, tools) 125 23.8%
Source: Puget Sound Regional Council: Covered Employment Estimates by Jurisdiction
The Manufacturing sector made up 1.1% of Shoreline’s employment base in 2017.
The whole sector of Manufacturing saw a decrease of 44.3% from 2008 to 2017, which is higher than the
region’s 23.3% decrease. Since its low point of 2013, the sector has seen an increase of 64.5%.
In 2015, Manufacturing (mainly food) had 21 employees and Manufacturing (mainly wood, oil, plastic,
concrete) had nine employees.
0
50
100
150
200
250
300
350
2008 2009 2010 2011 2012 2013 2014 2015 2016 2017
Shoreline Manufacturing Sector
031

DRAFT Shoreline Indicators Budget & Tax Office: January 2019
20
Retail Sector
Source: Puget Sound Regional Council: Covered Employment Estimates by Jurisdiction
Category 2017 Number
of Jobs % Change 2008-2017
Retail (Vehicles, hardware, building, grocery, gas stations) 1,868 3.8%
Retail (bookstore, department store, tobacco stores) 856 -4.8%
Source: Puget Sound Regional Council: Covered Employment Estimates by Jurisdiction
The Retail sector made up 16.5% of Shoreline’s employment base in 2017.
In Shoreline, the sector of Retail saw an increase of 1.0% from 2008 to 2017. In the same sector, the
region saw an increase of 21.3% over the same period.
0
500
1000
1500
2000
2500
3000
2008 2009 2010 2011 2012 2013 2014 2015 2016 2017
Shoreline Retail Sector
032

DRAFT Shoreline Indicators Budget & Tax Office: January 2019
21
Services Sector
Source: Puget Sound Regional Council: Covered Employment Estimates by Jurisdiction
Category 2017
Number of Jobs
% Change 2008-2017
Information * *
Professional, Scientific, and Technical Services 600 73.4%
Management of Companies/ Enterprises * *
Admin/Support/WasteMgmt/ Remediation Services 646 -11.4%
Educational Services (Private) 572 23.0%
Health Care and Social Assistance 3,074 25.9%
0
1000
2000
3000
4000
5000
6000
7000
8000
9000
2008 2009 2010 2011 2012 2013 2014 2015 2016 2017
Shoreline Service Sector
033

DRAFT Shoreline Indicators Budget & Tax Office: January 2019
22
Category 2017
Number of Jobs
% Change 2008-2017
Arts, Entertainment, and Recreation 598 -29.0%
Accommodation and Food Services 1,221 -6.2%
Other Services 986 0.4% Source: Puget Sound Regional Council: Covered Employment Estimates by Jurisdiction
The Services sector made up 47.2% of Shoreline’s employment base in 2017, which makes it the largest
sector in Shoreline.
From 2008 to 2017, the Services sector saw an increase of 8.7% in Shoreline. Regionally, over the same
period, the sector saw an increase of 20.2%.
Wholesale, Transportation, Utilities
Source: Puget Sound Regional Council: Covered Employment Estimates by Jurisdiction
Category 2017 Number
of Jobs % Change 2008-2017
Utilities 0 0
Wholesale Trade 136 21.4%
0
50
100
150
200
250
2008 2009 2010 2011 2012 2013 2014 2015 2016 2017
Shoreline Wholesale, Transportation, Utilities Sector
034

DRAFT Shoreline Indicators Budget & Tax Office: January 2019
23
Category 2017 Number
of Jobs % Change 2008-2017
Transportation * *
Warehousing * * Source: Puget Sound Regional Council: Covered Employment Estimates by Jurisdiction
The Wholesale, Transportation, and Utilities sector made up 1.4% of Shoreline’s employment in 2017.
From 2008 to 2017, the Wholesale, Transportation, and Utilities sector saw an increase of 35.7%, which
outpaced the region’s 5.7% increase.
Government Sector
Source: Puget Sound Regional Council: Covered Employment Estimates by Jurisdiction
Category
2017 Number of
Jobs % Change 2008-2017
Government 2,144 -31.5% Source: Puget Sound Regional Council: Covered Employment Estimates by Jurisdiction
The Government sector made up 13.0% of Shoreline’s employment in 2017.
The Government sector saw a decrease of 2008 to 2017 of 31.5%. For the region, the sector saw a 6.5%
decrease over the same period.
0
500
1000
1500
2000
2500
3000
3500
2008 2009 2010 2011 2012 2013 2014 2015 2016 2017
Government Sector
035

DRAFT Shoreline Indicators Budget & Tax Office: January 2019
24
Education (Public) Sector
Source: Puget Sound Regional Council: Covered Employment Estimates by Jurisdiction
Category 2017 Number
of Jobs % Change 2008-2017
Education 2,130 2.1% Source: Puget Sound Regional Council: Covered Employment Estimates by Jurisdiction
The Education (public) sector made up 12.9% of employment in Shoreline in 2017.
In Shoreline, the Education sector saw a decrease of 2.1% from 2008 to 2017. In the region, the sector
saw an increase of 11.6% over the same period.
0
500
1000
1500
2000
2500
2008 2009 2010 2011 2012 2013 2014 2015 2016 2017
Education Sector
036

DRAFT Shoreline Indicators Budget & Tax Office: January 2019
25
Sources:
US Census Bureau: American Community Survey (ACS) via American Fact Finder:
https://factfinder.census.gov/faces/nav/jsf/pages/index.xhtml
Puget Sound Regional Council: Covered Employment Estimates: https://www.psrc.org/covered-
employment-estimates
Employment Security Department: Local Area Unemployment Statistics (LAUS) (not seasonally
adjusted): https://esd.wa.gov/labormarketinfo/labor-force
037

2018-2020 City Council Goals and Work Plan
The Council is committed to fulfilling the community’s long-term vision – Vision 2029 – and being a sustainable city in all respects:
Sustainable neighborhoods—ensuring they are safe and attractive;
Sustainable environment—preserving our environmental assets and enhancing our built environment so that it protects our natural resources; and
Sustainable services—supporting quality services, facilities and infrastructure.
The City Council holds an annual Strategic Planning Workshop to monitor progress and determine priorities and action steps necessary to advance Vision 2029. This workplan, which is aimed at improving the City’s ability to fulfill the community’s vision, is then reflected in department work plans, the City’s budget, capital improvement plan, and through special initiatives.
Goal 1: Strengthen Shoreline’s economic climate and opportunities Robust private investment and economic opportunities help achieve Council Goals by enhancing the local economy, providing jobs and housing choices, and supporting the public services and lifestyle amenities that the community desires and expects.
ACTION STEPS: 1. Implement the Community Renewal Plan for Shoreline Place, including a review of
recommendations for a regional stormwater detention/retention system and construction of intersection improvements at N 155th Street and Westminster Way N – IN PROGRESS
2. Enhance the attractiveness of Shoreline as a place for private investment, including investment by small and medium sized developments, by ensuring that the permit process is predictable, timely and competitive, and by constantly evaluating and improving the quality of regulations for the City and other local permitting organizations – IN PROGRESS
3. Continue to implement the 10-year Financial Sustainability Plan strategies to achieve sufficient fiscal capacity to fund and maintain priority public services, facilities, and infrastructure, with specific focus on implementing a Business and Occupation tax and replacing the General Fund support of the Roads Capital Fund with another dedicated funding source – COMPLETE/ON-GOING
4. Continue to foster innovative, community-supported place-making efforts that help create diverse communities with a mix of residential and commercial uses and promote economic development – IN PROGRESS
5. Encourage affordable housing development in Shoreline, including continued promotion of the Property Tax Exemption program, partnership with King County in the development of affordable housing on the City’s property at Aurora Avenue and N 198th Street, and identify opportunities for integration of affordable housing at the future community and aquatic center facility – IN PROGRESS
6. Facilitate collaboration with and between members of the business community in order to remove barriers to starting and growing businesses, increase commerce and profitability, and to identify appropriate new industries for Shoreline – IN PROGRESS
PROGRESS INDICATORS: 2014 2015 2016 2017 2018
a. Annual growth of assessed property value from new construction
0.42% 0.73% 0.79% 0.57% 1.09%
b. Percent of assessed property value that is commercial (business)
20.02% 17.50% 15.49% 17.00% 17.00%
c. Retail sales tax per capita
$139.05 $143.66 $151.69 $151.69 $151.82
038

PROGRESS INDICATORS: 2014 2015 2016 2017 2018d. Number of licensed
businesses 5,045 5,166 5,285 5,351 5,443
e. Number of housing units
23,493 23,581 23,650 23,838 24,250
f. Vacancy and rental rates of commercial and multi-family properties
Retail: 4.6%;
$20.80/sf;Office: 4.2%;
$23.00/sf;Resid: 1.3%;
$1.36/sf
Retail: 5% $19.2/sf
Office: 4% $24/sf
Residential: 3%; $1.45/sf (all), $2.00/sf
(new)
Retail: 4.5% $19.92/sf
Office: 1.9% $22.33/sf
Residential: 2%; $1.5/sf
(all), $2.10/sf (new)
Retail: 4.5% $20,50/sf
Office: 2.0% $24.00/sf
Residential: 2.5%; $1.7/sf (all), $2.25/sf
(new)
Retail: 1.1% $23.87/sf
Office: 2.5% $25.42/sf
Residential:7.0%; $1.80/sf
(all), $2.05/sf (new)1
1 Data source for 2017 and prior (Dupree+Scott) out of business; 2018 data from CoStar.
Goal 2: Improve Shoreline’s infrastructure to continue the delivery of highly-valued public servicesShoreline inherited an aging infrastructure system when it incorporated in 1995. The City has identified needed improvements to strengthen its municipal infrastructure to maintain public services the community expects through its 20-year planning documents, including the Comprehensive Plan, Surface Water Master Plan, Transportation Master Plan and Parks, Recreation and Open Space Master Plan. Improvements are not limited to infrastructure investments. The City is also interested in improving coordination, planning, and overall information sharing among all service providers. As capital improvements are made, it is important to include efforts that will enhance Shoreline’s natural environment, ultimately having a positive impact on the Puget Sound region.
ACTION STEPS: 1. Identify and advocate for funding, including grant opportunities, to support construction of new and
maintenance of existing sidewalks and other non-motorized facilities – PARTIALLY COMPLETE2. Implement the Parks, Recreation, and Open Spaces Plan, including development of a strategy for a
new community and aquatic center and priority park improvements and acquisitions – PARTIALLY COMPLETE
3. Continue to Implement the Urban Forest Strategic Plan – IN PROGRESS4. Implement the 2018-2020 Priority Environmental Strategies, including achievement of citywide
Salmon-Safe certification, consideration of expanding green building mandates, and appointment of a stakeholder committee to evaluate and develop a recommendation on the implementation of recommendations from the Climate Action Analysis for the 185th Street Station Subarea – PARTIALLY COMPLETE
5. Continue to implement a comprehensive asset management system, including asset inventory, condition assessment and lifecycle/risk analysis, for the City's streets, facilities, trees, parks, and utilities – IN PROGRESS
6. Evaluate alternatives for City maintenance facility needs – IN PROGRESS 7. Implement the Surface Water Master Plan with a focus on completing the 2018-2019 small projects,
completing the design of pump station improvements and improving education and outreach about the Plan – PARTIALLY COMPLETE
8. Update the Transportation Master Plan (TMP) Pedestrian System Plan and sidewalk prioritization process and move the Master Street Plan from the TMP to Title 12 of the Shoreline Municipal Code – IN PROGRESS
9. Initiate environmental review and design for the N 175th Street Corridor Project from Interstate-5 to Stone Avenue N – IN PROGRESS
039

PROGRESS INDICATORS: 2014 2015 2016 2017 2018
a. Number of linear feet of non-motorized facilities constructed
1,198 19,912 2,480 22,280 20,7122
b. Number of trees planted in the public right-of-way and on City property (net)
-61 319 10 81 332
c. Tons of street sweeping waste removed
Data not available
323.04 398.53 391.19 687.93
d. Grant funds received for utility, transportation, and environmental infrastructure improvements
$7,404,884 $294,525 $8,026,289 $412,859 $6,510,171
e. Percent of all work orders in Cityworks Asset Management System that are proactive versus reactive in nature
94.97% 76.1% 60% 63% 58%
f. Number of work orders completed (or similar) in the Cityworks Asset Management System Implementation
2,348 3,121 3,432 3,615 5,869
2 Includes some new sidewalk construction, but primarily new bike lane striping and bike sharrow markings.
Goal 3: Continue preparation for regional mass transit in Shoreline In 2008, Shoreline voters supported the Sound Transit 2 (ST2) funding package with 61%, and in 2016, Shoreline voters supported the Sound Transit 3 (ST3) package with 59%. Our community looks forward to increasing mobility options and reducing environmental impacts through public transit services. The ST2 light rail extension from Northgate to Lynnwood includes investment in two stations in Shoreline, which are planned to open in 2024. The ST3 package includes funding for corridor improvements and Bus Rapid Transit service along State Route 523 (N 145th Street) from Bothell Way connecting to the 145th Street Light Rail Station. Engaging our community in planning for the two Shoreline light rail stations and improved transportation options and infrastructure along N 145th Street in Shoreline continues to be an important Council priority.
ACTION STEPS: 1. Work with the City of Seattle, King County, Sound Transit, the Washington State Department of
Transportation, and federal agencies on a plan that will improve safety and efficiency for all users of 145th Street, including a design for the 145th Street and Interstate-5 interchange, design of the 145th
Street corridor west of the Interstate-5 interchange, and coordination with Sound Transit for design and construction of 145th Street improvements from Highway 522 to Interstate-5 as part of ST3 – IN PROGRESS
2. Work collaboratively with Sound Transit to review and permit the Lynnwood Link Extension Project, including over the shoulder review of architectural, engineering and construction plans of the light rail stations, garages and associated facilities, review of Sound Transit’s Special Use Permit, and providing comment on the design in accordance with the Council-adopted Guiding Principles for Light Rail Station Design – PARTIALLY COMPLETE
3. Partner with Sound Transit in hosting local public meetings for the In-Progress 90% and 90% design milestones to support identification of anticipated impacts to Shoreline neighborhoods from future construction and operation of the Lynnwood Link Extension and work proactively with Sound Transit to develop plans to minimize, manage, and mitigate these impacts, including construction management planning and neighborhood traffic impact management – PARTIALLY COMPLETE
4. Conduct the 185th Street Corridor Study between Aurora Avenue N and 10th Avenue NE to identify multi-modal transportation improvements necessary to support growth associated with the 185th Street Station Subarea Plan and the Sound Transit Light Rail Station – IN PROGRESS
5. Continue to coordinate design elements of the Trail Along the Rail, 148th Street Non-Motorized Bridge and 3rd Avenue NE Woonerf projects with Sound Transit and seek funding through federal,
040

state and regional opportunities to complete the designs and construction of these projects – IN PROGRESS
PROGRESS INDICATORS: 2014 2015 2016 2017 2018
a. Number of City and Sound Transit opportunities provided for public input in the light rail planning process
60+ 14 40 9 12
Goal 4: Expand the City’s focus on equity and inclusion to enhance opportunities for community engagement The Council values all residents and believes they are an important part of the Shoreline community, including those who have been historically marginalized and underrepresented. The Council believes it is important to improve inclusion, equity, and participation among all members of the Shoreline community in the development and implementation of policies and programs in a meaningful and impactful way.
ACTION STEPS: 1. Implement the City’s Diversity and Inclusion Program – IN PROGRESS2. Continue to engage in efforts to address homelessness on a regional and local level – IN
PROGRESS 3. Ensure continued compliance with federal and state anti-discrimination laws, including Title VI of the
Civil Rights Act, the Civil Rights Restoration Act, Title II of the Americans with Disabilities Act, and Washington’s Law Against Discrimination, so as to ensure all Shoreline residents benefit from the City’s programs and activities – PARTIALLY COMPLETE
4. Conduct community meetings with residents to discuss current issues, City policy and other changes that may impact the community – COMPLETE
5. Continue to build relationships that support community policing with all members of the Shoreline community – IN PROGRESS
6. Continue to use technology and social media to expand reach in the broader community and to solicit input and ideas on City business, events and policy issues – IN PROGRESS
7. Improve the accessibility of the City’s website and the information contained within by working to conform to Web Content Accessibility Guidelines (WCAG) 2.0 Level AA – PARTIALLY COMPLETE
PROGRESS INDICATORS: 2014 2015 2016 2017 2018
a. Percent of residents who believe the City is moving in the right direction3
65% 65% 61% 61% 62%
b. Percent of residents somewhat/very satisfied with overall effectiveness of City communication with the public.3
65% 65% 59% 59% 61%
c. Number of resident volunteer hours 12,794 9,629 8,615 7,149 9,892
d. Number of annual website visits; number of Facebook “likes”; number of Twitter followers
320,7351,052
512
390,2381,4441,031
358,3521,8961,476
374,7032,1941,883
346,1176,7022,207
e. Number of service requests responded to through the City’s See Click Fix app
170 231 449 726 957
f. Number of Community Meetings with Police/Crime Prevention
52 42 47 46 41
g. Number of Alert Shoreline subscribers 1,892 2,891 3,547 3,950 2,856
h. Number of public record requests (excludes routine requests)
217 307 322 344 344
3 Indicator taken from biennial resident survey; most recent survey occurred in 2018.
041

Goal 5: Promote and enhance the City’s safe community and neighborhood programs and initiatives Maintaining a safe community is the City’s highest priority. The 2016 Resident Survey reflected that 93% of respondents felt safe in their neighborhood during the day and 80% had an overall feeling of safety in Shoreline. These results are reflective of statistics from medium-sized cities across the United States, and the former measure was a slight increase from previous resident surveys conducted by the City. The City is continuing a concentrated workplan to enhance our public safety communication and crime prevention efforts to ensure that our residents and businesses continue to find Shoreline a safe place to live, work, and play.
ACTION STEPS:1. Use data driven policing to address crime trends and quality of life concerns in a timely manner – IN
PROGRESS2. Continue quarterly meetings of the City's cross-department safe community team to address public
safety problems and implement solutions – IN PROGRESS3. Continue the partnership between the Parks Department and Police, focusing on park and trail
safety through Crime Prevention Through Environmental Design (CPTED), Problem Solving Projects (PSPs) and police emphasis to improve safety and the feeling of safety – IN PROGRESS
4. Continue to partner with Shoreline schools and the Shoreline Fire Department to implement best practice school safety measures – IN PROGRESS
5. Continue to address traffic issues and concerns in school zones and neighborhoods using the City’s speed differential map and resident traffic complaints – IN PROGRESS
6. Continue to coordinate efforts between the Community Outreach Problem Solving (COPS) officer and the City's Neighborhoods Program to work on crime prevention education and outreach – IN PROGRESS
7. Conduct trainings, and community programs to promote personal safety, awareness and response – IN PROGRESS
8. Continue to implement the Risk Analysis De-escalation And Referral (RADAR) program to create a systematic policing approach to deal with mental illness in the community – IN PROGRESS
9. Engage in an analysis with service providers to identify what services and processes exist to connect those experiencing homelessness and/or opioid addiction with supportive services and identify gaps that may exist – PARTIALLY COMPLETE
PROGRESS INDICATORS: 2014 2015 2016 2017 2018
a. Percent of residents who have an overall feeling of safety in Shoreline3
80% 80% 80% 80% 81%
b. Percent of residents who feel safe in City parks and trails3
58% 58% 53% 53% 58%
c. Number of CPTED reviews completed or safety emphasis initiatives implemented on City parks or parks facilities
4 3 2 2 3
d. Number of neighborhood traffic safety improvement efforts
Phase 1 (resident involvement/minor traffic control device installation or revisions)/
Phase 2 (installed engineering solution)
16/0 21/1 22/6 25/1 22/2
e. Number of community outreach events/activities attended by Police and Emergency Management4
4 22 6 35 41
3 Indicator taken from biennial resident survey; most recent survey occurred in 2018. 4 National Night Out is counted as one event; police crime prevention community meetings counted separately.
042

2/19/2019 2018‐2020 Citywide WorkplanAll Department Goal Data
1
Council Goal Action Step # Action Step Implementation Step Implementation Sub‐Step Implementation Project Manager
Start Finish Project Status Notes/Comments
CG‐1: Strengthen Shoreline's Economic Climate and Opportunties
1 Implement the Community Renewal Plan for Shoreline Place, including a review of recommendations for a regional stormwater detention/retention system and construction of intersection improvements at N 155th Street and Westminster Way N
Boeing Creek Regional Stormwater Facility Study
John Featherstone 01/01/19 06/01/19 In Progress Boeing Creek RSF Feasibility Study is being finalized. Study will likely be finalized within the first half of 2019.
CG‐1: Strengthen Shoreline's Economic Climate and Opportunties
1 Implement the Community Renewal Plan for Shoreline Place, including a review of recommendations for a regional stormwater detention/retention system and construction of intersection improvements at N 155th Street and Westminster Way N
Design of Westminster and 155th St Intersection Improvements
Alisa Arment 06/01/17 02/28/19 In Progress
CG‐1: Strengthen Shoreline's Economic Climate and Opportunties
1 Implement the Community Renewal Plan for Shoreline Place, including a review of recommendations for a regional stormwater detention/retention system and construction of intersection improvements at N 155th
Construction of Westminster and 155th St Intersection Improvements
Alisa Arment 04/01/20 12/31/20 In Progress
CG‐1: Strengthen Shoreline's Economic Climate and Opportunties
1 Implement the Community Renewal Plan for Shoreline Place, including a review of recommendations for a regional stormwater detention/retention system and construction of intersection improvements at N 155th Street and Westminster Way N
Development Agreement Implementation
Paul Cohen 12/21/18 06/30/19 In Progress
CG‐1: Strengthen Shoreline's Economic Climate and Opportunties
1 Implement the Community Renewal Plan for Shoreline Place, including a review of recommendations for a regional stormwater detention/retention system and construction of intersection improvements at N 155th Street and Westminster Way N
Rebranding Aurora Square CRA; signage changes / requirements for businesses based on Code Requirement
Nathan Daum 04/01/15 06/30/19 In Progress
CG‐1: Strengthen Shoreline's Economic Climate and Opportunties
1 Implement the Community Renewal Plan for Shoreline Place, including a review of recommendations for a regional stormwater detention/retention system and construction of intersection improvements at N 155th Street and Westminster Way N
SMC update for late comers agrement Margaret King 10/01/18 04/01/19 In Progress
CG‐1: Strengthen Shoreline's Economic Climate and Opportunties
2 Enhance the attractiveness of Shoreline as a place for private investment, including investment by small and medium sized developments, by ensuring that the permit process is predictable, timely and competitive, and by constantly evaluating and improving the quality of regulations for the City and other local permitting organizations
Annual Update of the Engineering Development Manual
2018/2019 EDM Update Tricia Juhnke 07/01/17 03/31/19 In Progress
CG‐1: Strengthen Shoreline's Economic Climate and Opportunties
2 Enhance the attractiveness of Shoreline as a place for private investment, including investment by small and medium sized developments, by ensuring that the permit process is predictable, timely and competitive, and by constantly evaluating and improving the quality of regulations for the City and other local permitting organizations
Improve zoning and plan review processes
Implement electronic plan review Jarrod Lewis 01/01/19 06/30/19 In Progress
CG‐1: Strengthen Shoreline's Economic Climate and Opportunties
2 Enhance the attractiveness of Shoreline as a place for private investment, including investment by small and medium sized developments, by ensuring that the permit process is predictable, timely and competitive, and by constantly evaluating and improving the quality of regulations for the City and other local permitting organizations
Improve zoning and plan review processes
Launch e‐TRAKiT Jarrod Lewis 01/01/19 12/31/19 In Progress
CG‐1: Strengthen Shoreline's Economic Climate and Opportunties
2 Enhance the attractiveness of Shoreline as a place for private investment, including investment by small and medium sized developments, by ensuring that the permit process is predictable, timely and competitive, and by constantly evaluating and improving the quality of regulations for the City and other local permitting organizations
Improve zoning and plan review processes
Update the Development Code with specific design standards for Attached Single Family (Townhouses)
Catherine Lee 01/01/19 12/31/19 In Progress
CG‐1: Strengthen Shoreline's Economic Climate and Opportunties
2 Enhance the attractiveness of Shoreline as a place for private investment, including investment by small and medium sized developments, by ensuring that the permit process is predictable, timely and competitive, and by constantly evaluating and improving the quality of regulations for the City and other local permitting organizations
Improve zoning and plan review processes
Update the Development Code to address emergeing housing trends and expand housing choices
Paul Cohen 01/01/20 12/31/20 Not Started
CG‐1: Strengthen Shoreline's Economic Climate and Opportunties
2 Enhance the attractiveness of Shoreline as a place for private investment, including investment by small and medium sized developments, by ensuring that the permit process is predictable, timely and competitive, and by constantly evaluating and improving the quality of regulations for the City and other local permitting organizations
Improve zoning and plan review processes
Conduct quarterly development stakeholder meetings
Jarrod Lewis 01/01/19 12/31/19 In Progress
043

2/19/2019 2018‐2020 Citywide WorkplanAll Department Goal Data
2
CG‐1: Strengthen Shoreline's Economic Climate and Opportunties
3 Continue to implement the 10‐year Financial Sustainability Plan strategies to achieve sufficient fiscal capacity to fund and maintain priority public services, facilities, and infrastructure, with specific focus on implementing a Business and Occupation tax and replacing the General Fund support of the Roads Capital Fund with another dedicated funding source
Implement B&O Tax Rick Kirkwood 01/01/18 03/31/19 In Progress
CG‐1: Strengthen Shoreline's Economic Climate and Opportunties
4 Continue to foster innovative, community‐supported place‐making efforts that help create diverse communities with a mix of residential and commercial uses and promote economic development
Measure and maintain promotional efforts, such as Surprised by Shoreline and Shoreline Farmer's Market
Nathan Daum 04/08/16 12/31/19 In Progress
CG‐1: Strengthen Shoreline's Economic Climate and Opportunties
5 Promotion of the Property Tax Exemption Program Promotion of the Property Tax Exemption Program
Nathan Daum 01/01/18 12/31/20 In Progress
CG‐1: Strengthen Shoreline's Economic Climate and Opportunties
5 Develop partnership with King County in the development of affordable housing on the City's property at Aurora Avenue and N 198th Street
Develop partnership with King County in the development of affordable housing on the City's property at Aurora Avenue and N 198th Street
James Hammond 08/01/18 06/28/19 In Progress
CG‐1: Strengthen Shoreline's Economic Climate and Opportunties
5 coordinate with King County's redevelopment of 192nd Park and Ride for possible affordable housing development
coordinate with King County's redevelopment of 192nd Park and Ride for possible affordable housing development
Nathan Daum 01/01/17 12/31/20 In Progress
CG‐1: Strengthen Shoreline's Economic Climate and Opportunties
5 Identify opportunities for integration of affordable housing at the future community and aquatic center facility
Identify opportunities for integration of affordable housing at the future community and aquatic center facility
Nathan Daum 01/01/13 06/30/19 In Progress
CG‐1: Strengthen Shoreline's Economic Climate and Opportunties
6 Facilitate collaboration with and between members of the business community in order to remove barriers to starting and growing businesses, increase commerce and profitability, and to identify appropriate new industries for Shoreline
Meet with prospective investors Nathan Daum 05/01/17 12/31/20 In Progress
CG‐2: Improve Shoreline's infrastructure to continue the delivery of highly‐valued public services
1 Identify and advocate for funding, including grant opportunities, to support construction of new and maintenance of existing sidewalks and other non‐motorized facilities
Continue to seek grant opportunities for new and maintenance of existing non‐motorized facilities
Nytasha Walters 01/01/14 12/31/20 In Progress
CG‐2: Improve Shoreline's infrastructure to continue the delivery of highly‐valued public services
2 Implement the Parks, Recreation, and Open Spaces Plan, including development of a strategy for a new community and aquatic center and priority park improvements and acquisitions
Develop concept designs and cost estimates for priority parks as specified in PROS Plan
Eric Friedli 01/01/18 10/31/18 Complete
CG‐2: Improve Shoreline's infrastructure to continue the delivery of highly‐valued public services
2 Implement the Parks, Recreation, and Open Spaces Plan, including development of a strategy for a new community and aquatic center and priority park improvements and acquisitions
Finalize community and aquatics center concept design
Eric Friedli 06/01/18 12/31/18 Complete
CG‐2: Improve Shoreline's infrastructure to continue the delivery of highly‐valued public services
2 Implement the Parks, Recreation, and Open Spaces Plan, including development of a strategy for a new community and aquatic center and priority park improvements and acquisitions
Establish & Support Park Funding Advisory Committee to recommend funding strategy for PROS Plan implementation
Eric Friedli 07/01/18 06/30/19 In Progress
CG‐2: Improve Shoreline's infrastructure to continue the delivery of highly‐valued public services
2 Implement the Parks, Recreation, and Open Spaces Plan, including development of a strategy for a new community and aquatic center and priority park improvements and acquisitions
Complete aging adults services study Eric Friedli 01/01/18 12/31/18 Complete
CG‐2: Improve Shoreline's infrastructure to continue the delivery of highly‐valued public services
2 Implement the Parks, Recreation, and Open Spaces Plan, including development of a strategy for a new community and aquatic center and priority park improvements and acquisitions
Select and install major art sculpture Eric Friedli 10/31/17 06/28/20 In Progress
CG‐2: Improve Shoreline's infrastructure to continue the delivery of highly‐valued public services
3 Continue to Implement the Urban Forest Strategic Plan Engage in Urban Forest Carbon Credit Program at Ballinger Open Space
Eric Friedli 08/01/18 06/30/20 In Progress
CG‐2: Improve Shoreline's infrastructure to continue the delivery of highly‐valued public services
3 Continue to Implement the Urban Forest Strategic Plan Join the Green Cities Partnership Eric Friedli 01/01/19 12/31/19 In Progress
CG‐2: Improve Shoreline's infrastructure to continue the delivery of highly‐valued public services
3 Continue to Implement the Urban Forest Strategic Plan Maintain urban forest restoration program
Eric Friedli 12/31/18 12/31/20 In Progress
CG‐2: Improve Shoreline's infrastructure to continue the delivery of highly‐valued public services
4 Implement the 2018‐2020 Priority Environmental Strategies, including achievement of citywide Salmon‐Safe certification, consideration of expanding green building mandates, and appointment of a stakeholder committee to evaluate and develop a recommendation on the implementation of recommendations from the Climate Action Analysis for the 185th Street Station Subarea
Salmon Safe Certification Miranda Redinger 05/01/18 10/31/19 In Progress Currently scheduled for Council Study Session on April 1 and decision on April 22.
044

2/19/2019 2018‐2020 Citywide WorkplanAll Department Goal Data
3
CG‐2: Improve Shoreline's infrastructure to continue the delivery of highly‐valued public services
4 Implement the 2018‐2020 Priority Environmental Strategies, including achievement of citywide Salmon‐Safe certification, consideration of expanding green building mandates, and appointment of a stakeholder committee to evaluate and develop a recommendation on the implementation of recommendations from the Climate Action Analysis for the 185th Street Station Subarea
Expand Commercial Green Building Incentives Program
Miranda Redinger 06/01/18 03/25/19 In Progress Council discussed this issue on January 14, 2019 and is slated to adopt Ordinance No. 839 on March 25
CG‐2: Improve Shoreline's infrastructure to continue the delivery of highly‐valued public services
4 Implement the 2018‐2020 Priority Environmental Strategies, including achievement of citywide Salmon‐Safe certification, consideration of expanding green building mandates, and appointment of a stakeholder committee to evaluate and develop a recommendation on the implementation of recommendations from the Climate Action Analysis for the 185th Street Station Subarea
Task Force to Implement 185th Climate Action Analysis
Environmental Services Coordinator
01/01/21 12/31/21 On‐Hold If funded, the work will start in 2021.
CG‐2: Improve Shoreline's infrastructure to continue the delivery of highly‐valued public services
5 Implement a comprehensive asset management system, including asset inventory, condition assessment and lifecycle/risk analysis, for the City's streets, facilities, trees, parks, and utilities
Standardize overall business processes for asset management
Cityworks Steering Committee 10/01/16 12/31/20 In Progress
CG‐2: Improve Shoreline's infrastructure to continue the delivery of highly‐valued public services
5 Implement a comprehensive asset management system, including asset inventory, condition assessment and lifecycle/risk analysis, for the City's streets, facilities, trees, parks, and utilities
Optimize Cityworks Application Cityworks Steering Committee 12/01/16 12/31/2020
In Progress
Executive Committee is focusing on reporting that will help ensure that the system is being used and data captured is accurate.
CG‐2: Improve Shoreline's infrastructure to continue the delivery of highly‐valued public services
6 Evaluate alternatives for City maintenance facility needs Analysis of City Properties for City Maintenance Facility needs
John Featherstone 01/01/19 12/31/19 In Progress Results of CMF Distributed Facilities Analysis are currently being finalized and prepared for outreach and Council presentation in 2019 Q1. This is somewhat behind original schedule, but on track to be completed soon.
CG‐2: Improve Shoreline's infrastructure to continue the delivery of highly‐valued public services
7 Implement the Surface Water Master Plan with a focus on completing the 2018‐2019 small projects, completing the design of pump station improvements and improving education and outreach about the Plan
Adoption of SW Master Plan with Comprehensive Plan Amendments
Uki Dele 01/01/18 12/31/18 Complete
CG‐2: Improve Shoreline's infrastructure to continue the delivery of highly‐valued public services
7 Implement the Surface Water Master Plan with a focus on completing the 2018‐2019 small projects, completing the design of pump station improvements and improving education and outreach about the Plan
Implement the re‐issued 2019‐2024 Western Washington Phase II Municipal Stormwater Permit (NPDES Phase II Permit)
Uki Dele 01/01/18 12/31/19 In Progress
CG‐2: Improve Shoreline's infrastructure to continue the delivery of highly‐valued public services
7 Implement the Surface Water Master Plan with a focus on completing the 2018‐2019 small projects, completing the design of pump station improvements and improving education and outreach about the Plan
Complete the development of a Utility Communications Plan to provide effective outreach about Utility activities, projects, and initiatives and to meet re‐issued NPDES permit requirements for public education and outreach
Uki Dele 01/01/18 12/31/18 Complete
CG‐2: Improve Shoreline's infrastructure to continue the delivery of highly‐valued public services
7 Implement the Surface Water Master Plan with a focus on completing the 2018‐2019 small projects, completing the design of pump station improvements and improving education and outreach about the Plan
Complete design for the Hidden Lake Dam Removal Project
John Featherstone 01/01/19 12/31/19 In Progress Design is 30% complete as of 1/30/2019. This is somewhat behind the original schedule, but on track for 2021 Hidden Lake Dam Removal (previous target for 2020 dam removal has been revised)
CG‐2: Improve Shoreline's infrastructure to continue the delivery of highly‐valued public services
8 Update the Transportation Master Plan (TMP) Pedestrian System Plan and sidewalk prioritization process and move the Master Street Plan from the TMP to Title 12 of the Shoreline Municipal Code
Master Street Plan Update Nytasha Walters 11/01/17 12/31/20 In Progress
CG‐2: Improve Shoreline's infrastructure to continue the delivery of highly‐valued public services
8 Update the Transportation Master Plan (TMP) Pedestrian System Plan and sidewalk prioritization process and move the Master Street Plan from the TMP to Title 12 of the Shoreline Municipal Code
TMP document update Nytasha Walters 10/01/19 12/31/18 Complete
CG‐2: Improve Shoreline's infrastructure to continue the delivery of highly‐valued public services
8 Update the Transportation Master Plan (TMP) Pedestrian System Plan and sidewalk prioritization process and move the Master Street Plan from the TMP to Title 12 of the Shoreline Municipal Code and the Engineering Design Manual.
Multimodal Level of Service Nytasha Walters 10/01/18 11/30/19 In Progress
CG‐2: Improve Shoreline's infrastructure to continue the delivery of highly‐valued public services
9 Initiate environmental review and design for the N 175th Street Corridor Project from Interstate‐5 to Stone Avenue N
Design for the N 175th Street Corridor Project
Consultant Design Contract Awarded 1/28/2019 ‐ Perteet, Inc.
Don Ranger 09/03/18 12/31/20 In Progress
CG‐2: Improve Shoreline's infrastructure to continue the delivery of highly‐valued public services
9 Initiate environmental review and design for the N 175th Street Corridor Project from Interstate‐5 to Stone Avenue N
Environmental Review for the N 175th Street Corridor Project
Consultant Design Contract Awarded 1/28/2019 ‐ Perteet, Inc.
Don Ranger 09/02/19 12/31/20 In Progress
045

2/19/2019 2018‐2020 Citywide WorkplanAll Department Goal Data
4
CG‐3: Continue preparation for regional mass transit in Shoreline
1 Work with the City of Seattle, King County, Sound Transit, the Washington State Department of Transportation, and federal agencies on a plan that will improve safety and efficiency for all users of 145th Street, including a design for the 145th Street and Interstate‐5 interchange, design of the 145th Street corridor west of the Interstate‐5 interchange, and coordination with Sound Transit for design and construction of 145th Street improvements from Highway 522 to Interstate‐5 as part of ST3
Design and Environmental Review (I‐5 to SR99)
Don Ranger 12/01/16 12/30/19 In Progress
CG‐3: Continue preparation for regional mass transit in Shoreline
1 Work with the City of Seattle, King County, Sound Transit, the Washington State Department of Transportation, and federal agencies on a plan that will improve safety and efficiency for all users of 145th Street, including a design for the 145th Street and Interstate‐5 interchange, design of the 145th Street corridor west of the Interstate‐5 interchange, and coordination with Sound Transit for design and construction of 145th Street improvements from Highway 522 to Interstate‐5 as part of ST3
Design and Environmental Review (145th Street/I‐5 interchange)
Don Ranger 01/01/19 08/12/21 In Progress The projectis working with partners to determine a concept that is acceptable to the various partners (WSDOT, SDOT, Sound Transit, Shoreline, KC Metro). Additionally, funding for the project is incomplete.
CG‐3: Continue preparation for regional mass transit in Shoreline
1 Work with the City of Seattle, King County, Sound Transit, the Washington State Department of Transportation, and federal agencies on a plan that will improve safety and efficiency for all users of 145th Street, including a design for the 145th Street and Interstate‐5 interchange, design of the 145th Street corridor west of the Interstate‐5 interchange, and coordination with Sound Transit for design and construction of 145th Street improvements from Highway 522 to Interstate‐5 as part of ST3
ST SR‐522/523 BRT ST SR‐522/523 BRT Partnering Agreement
Nytasha Walters 10/01/18 11/30/19 In Progress
CG‐3: Continue preparation for regional mass transit in Shoreline
1 Work with the City of Seattle, King County, Sound Transit, the Washington State Department of Transportation, and federal agencies on a plan that will improve safety and efficiency for all users of 145th Street, including a design for the 145th Street and Interstate‐5 interchange, design of the 145th Street corridor west of the Interstate‐5 interchange, and coordination with Sound Transit for design and construction of 145th Street improvements from Highway 522 to Interstate‐5 as part of ST3
ST SR‐522/523 BRT ST SR‐522/523 BRT Coordination Nytasha Walters 01/01/18 12/31/20 In Progress
CG‐3: Continue preparation for regional mass transit in Shoreline
2 Work collaboratively with Sound Transit to review and permit the Lynnwood Link Extension Project, including over the shoulder review of architectural, engineering and construction plans of the light rail stations, garages and associated facilities, review of Sound Transit’s Special Use Permit, and providing comment on the design in accordance with the Council‐adopted Guiding Principles for Light Rail Station Design
Participate in Milestone Design Review Juniper Nammi 01/01/18 12/31/18 Complete
CG‐3: Continue preparation for regional mass transit in Shoreline
2 Work collaboratively with Sound Transit to review and permit the Lynnwood Link Extension Project, including over the shoulder review of architectural, engineering and construction plans of the light rail stations, garages and associated facilities, review of Sound Transit’s Special Use Permit, and providing comment on the design in accordance with the Council‐adopted Guiding Principles for Light Rail Station Design
Special Use Permit review and public hearing
Juniper Nammi 06/01/18 03/31/19 In Progress
CG‐3: Continue preparation for regional mass transit in Shoreline
2 Work collaboratively with Sound Transit to review and permit the Lynnwood Link Extension Project, including over the shoulder review of architectural, engineering and construction plans of the light rail stations, garages and associated facilities, review of Sound Transit’s Special Use Permit, and providing comment on the design in accordance with the Council‐adopted Guiding Principles for Light Rail Station Design
Conduct permit review Juniper Nammi 01/01/18 03/30/19 In Progress
CG‐3: Continue preparation for regional mass transit in Shoreline
3 Partner with Sound Transit in hosting local public meetings for the In‐Progress 90% and 90% design milestones to support identification of anticipated impacts to Shoreline neighborhoods from future construction and operation of the Lynnwood Link Extension and work proactively with Sound Transit to develop plans to minimize, manage, and mitigate these impacts, including construction management planning and neighborhood traffic impact management
Subareas on‐street parking monitoring report
Kendra Dedinsky 10/01/18 11/29/19 In Progress Draft expected by late Summer 2019.
046
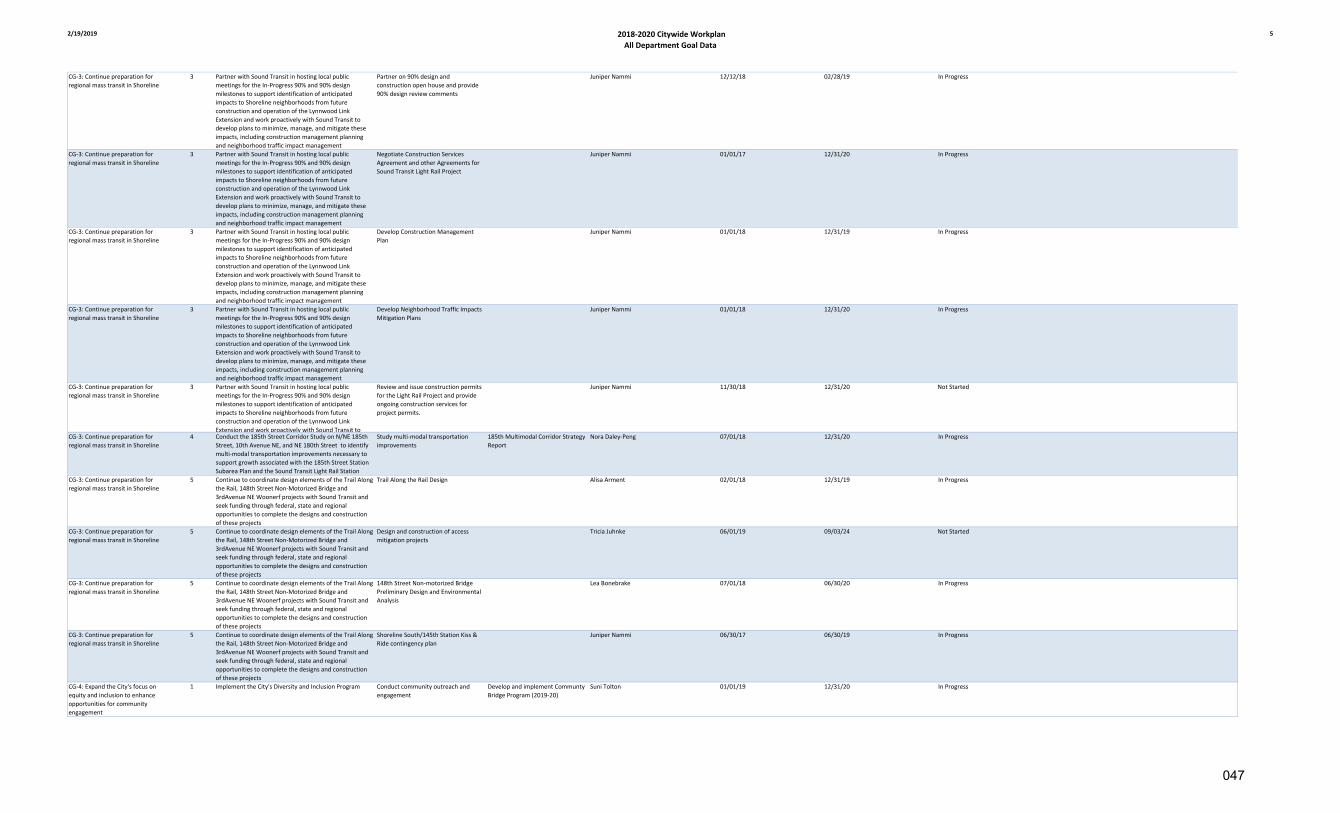
2/19/2019 2018‐2020 Citywide WorkplanAll Department Goal Data
5
CG‐3: Continue preparation for regional mass transit in Shoreline
3 Partner with Sound Transit in hosting local public meetings for the In‐Progress 90% and 90% design milestones to support identification of anticipated impacts to Shoreline neighborhoods from future construction and operation of the Lynnwood Link Extension and work proactively with Sound Transit to develop plans to minimize, manage, and mitigate these impacts, including construction management planning and neighborhood traffic impact management
Partner on 90% design and construction open house and provide 90% design review comments
Juniper Nammi 12/12/18 02/28/19 In Progress
CG‐3: Continue preparation for regional mass transit in Shoreline
3 Partner with Sound Transit in hosting local public meetings for the In‐Progress 90% and 90% design milestones to support identification of anticipated impacts to Shoreline neighborhoods from future construction and operation of the Lynnwood Link Extension and work proactively with Sound Transit to develop plans to minimize, manage, and mitigate these impacts, including construction management planning and neighborhood traffic impact management
Negotiate Construction Services Agreement and other Agreements for Sound Transit Light Rail Project
Juniper Nammi 01/01/17 12/31/20 In Progress
CG‐3: Continue preparation for regional mass transit in Shoreline
3 Partner with Sound Transit in hosting local public meetings for the In‐Progress 90% and 90% design milestones to support identification of anticipated impacts to Shoreline neighborhoods from future construction and operation of the Lynnwood Link Extension and work proactively with Sound Transit to develop plans to minimize, manage, and mitigate these impacts, including construction management planning and neighborhood traffic impact management
Develop Construction Management Plan
Juniper Nammi 01/01/18 12/31/19 In Progress
CG‐3: Continue preparation for regional mass transit in Shoreline
3 Partner with Sound Transit in hosting local public meetings for the In‐Progress 90% and 90% design milestones to support identification of anticipated impacts to Shoreline neighborhoods from future construction and operation of the Lynnwood Link Extension and work proactively with Sound Transit to develop plans to minimize, manage, and mitigate these impacts, including construction management planning and neighborhood traffic impact management
Develop Neighborhood Traffic Impacts Mitigation Plans
Juniper Nammi 01/01/18 12/31/20 In Progress
CG‐3: Continue preparation for regional mass transit in Shoreline
3 Partner with Sound Transit in hosting local public meetings for the In‐Progress 90% and 90% design milestones to support identification of anticipated impacts to Shoreline neighborhoods from future construction and operation of the Lynnwood Link Extension and work proactively with Sound Transit to
Review and issue construction permits for the Light Rail Project and provide ongoing construction services for project permits.
Juniper Nammi 11/30/18 12/31/20 Not Started
CG‐3: Continue preparation for regional mass transit in Shoreline
4 Conduct the 185th Street Corridor Study on N/NE 185th Street, 10th Avenue NE, and NE 180th Street to identify multi‐modal transportation improvements necessary to support growth associated with the 185th Street Station Subarea Plan and the Sound Transit Light Rail Station
Study multi‐modal transportation improvements
185th Multimodal Corridor Strategy Report
Nora Daley‐Peng 07/01/18 12/31/20 In Progress
CG‐3: Continue preparation for regional mass transit in Shoreline
5 Continue to coordinate design elements of the Trail Along the Rail, 148th Street Non‐Motorized Bridge and 3rdAvenue NE Woonerf projects with Sound Transit and seek funding through federal, state and regional opportunities to complete the designs and construction of these projects
Trail Along the Rail Design Alisa Arment 02/01/18 12/31/19 In Progress
CG‐3: Continue preparation for regional mass transit in Shoreline
5 Continue to coordinate design elements of the Trail Along the Rail, 148th Street Non‐Motorized Bridge and 3rdAvenue NE Woonerf projects with Sound Transit and seek funding through federal, state and regional opportunities to complete the designs and construction of these projects
Design and construction of access mitigation projects
Tricia Juhnke 06/01/19 09/03/24 Not Started
CG‐3: Continue preparation for regional mass transit in Shoreline
5 Continue to coordinate design elements of the Trail Along the Rail, 148th Street Non‐Motorized Bridge and 3rdAvenue NE Woonerf projects with Sound Transit and seek funding through federal, state and regional opportunities to complete the designs and construction of these projects
148th Street Non‐motorized Bridge Preliminary Design and Environmental Analysis
Lea Bonebrake 07/01/18 06/30/20 In Progress
CG‐3: Continue preparation for regional mass transit in Shoreline
5 Continue to coordinate design elements of the Trail Along the Rail, 148th Street Non‐Motorized Bridge and 3rdAvenue NE Woonerf projects with Sound Transit and seek funding through federal, state and regional opportunities to complete the designs and construction of these projects
Shoreline South/145th Station Kiss & Ride contingency plan
Juniper Nammi 06/30/17 06/30/19 In Progress
CG‐4: Expand the City's focus on equity and inclusion to enhance opportunities for community engagement
1 Implement the City's Diversity and Inclusion Program Conduct community outreach and engagement
Develop and implement Communty Bridge Program (2019‐20)
Suni Tolton 01/01/19 12/31/20 In Progress
047

2/19/2019 2018‐2020 Citywide WorkplanAll Department Goal Data
6
CG‐4: Expand the City's focus on equity and inclusion to enhance opportunities for community engagement
2 Continue to engage in efforts to address homelessness on a regional and local level
Support the Street Outreach Worker with Lake City Partners
Rob Beem 08/01/18 12/31/20 In Progress
CG‐4: Expand the City's focus on equity and inclusion to enhance opportunities for community engagement
2 Continue to engage in efforts to address homelessness on a regional and local level
Engage with King County All Home Initiative, including serving on Funders Alignment Committee and funding review teams
Rob Beem 01/04/16 12/31/20 In Progress
CG‐4: Expand the City's focus on equity and inclusion to enhance opportunities for community engagement
3 Ensure continued compliance with federal and state anti‐discrimination laws, including Title VI of the Civil Rights Act, the Civil Rights Restoration Act, Title II of the Americans with Disabilities Act, and Washington’s Law Against Discrimination, so as to ensure all Shoreline residents benefit from the City’s programs and activities
Create ADA ROW Transition Plan Tricia Juhnke 01/01/19 03/31/19 In Progress
CG‐4: Expand the City's focus on equity and inclusion to enhance opportunities for community engagement
3 Ensure continued compliance with federal and state anti‐discrimination laws, including Title VI of the Civil Rights Act, the Civil Rights Restoration Act, Title II of the Americans with Disabilities Act, and Washington’s Law Against Discrimination, so as to ensure all Shoreline residents benefit from the City’s programs and activities
Title VI 2018 Transportation Report Nytasha Walters 09/03/18 12/31/18 Complete
CG‐4: Expand the City's focus on equity and inclusion to enhance opportunities for community engagement
3 Ensure continued compliance with federal and state anti‐discrimination laws, including Title VI of the Civil Rights Act, the Civil Rights Restoration Act, Title II of the Americans with Disabilities Act, and Washington’s Law Against Discrimination, so as to ensure all Shoreline residents benefit from the City’s programs and activities
Conduct Parks Facilities ADA Condition Assessment
Eric Friedli 01/01/19 12/31/19 In Progress
CG‐4: Expand the City's focus on equity and inclusion to enhance opportunities for community engagement
3 Ensure continued compliance with federal and state anti‐discrimination laws, including Title VI of the Civil Rights Act, the Civil Rights Restoration Act, Title II of the Americans with Disabilities Act, and Washington’s Law Against Discrimination, so as to ensure all Shoreline residents benefit from the City’s programs and activities
Create Parks Facilities Transition Plan Eric Friedli 01/01/20 12/31/20 Not Started
CG‐4: Expand the City's focus on equity and inclusion to enhance opportunities for community engagement
3 Ensure continued compliance with federal and state anti‐discrimination laws, including Title VI of the Civil Rights Act, the Civil Rights Restoration Act, Title II of the Americans with Disabilities Act, and Washington’s Law Against Discrimination, so as to ensure all Shoreline residents benefit from the City’s programs and activities
Establish and implement a communication strategy procedure for citizen ADA complaints
John Norris 01/01/18 12/31/18 Complete
CG‐4: Expand the City's focus on equity and inclusion to enhance opportunities for community engagement
4 Conduct community meetings with residents to discuss current issues, City policy and other changes that may impact the community
198th Affordable Housing Project (Echo Lake NA Board, Echo Lake NA Members, Community Meetings/Open Houses)
James Hammond 08/01/18 12/31/18 Complete
CG‐4: Expand the City's focus on equity and inclusion to enhance opportunities for community engagement
4 Conduct community meetings with residents to discuss current issues, City policy and other changes that may impact the community
Prop. 1 Informational Meetings (Council of Neighborhoods, Richmond Beach Community Association, Echo Lake NA, Meridian Park NA)
Debbie Tarry 09/01/18 10/31/18 Complete
CG‐4: Expand the City's focus on equity and inclusion to enhance opportunities for community engagement
5 Continue to build relationships that support community policing with all members of the Shoreline community
Provide outreach to Shoreline's Muslim community
Shawn Ledford 01/01/19 12/31/20 In Progress
CG‐4: Expand the City's focus on equity and inclusion to enhance opportunities for community engagement
6 Continue to use technology and social media to expand reach in the broader community and to solicit input and ideas on City business, events and policy issues
Use online open houses to encourage more community participation
Eric Bratton 01/01/19 12/31/19 In Progress
CG‐4: Expand the City's focus on equity and inclusion to enhance opportunities for community engagement
6 Continue to use technology and social media to expand reach in the broader community and to solicit input and ideas on City business, events and policy issues
Use more video in social media to encourage increased engagement
Eric Bratton 07/01/18 12/31/20 In Progress
CG‐4: Expand the City's focus on equity and inclusion to enhance opportunities for community engagement
6 Continue to use technology and social media to expand reach in the broader community and to solicit input and ideas on City business, events and policy issues
Increase use of Instagram with focus on parks
Eric Bratton 07/01/18 12/31/20 In Progress
CG‐4: Expand the City's focus on equity and inclusion to enhance opportunities for community engagement
7 Improve the accessibility of the City’s website and the information contained within by working to conform to Web Content Accessibility Guidelines (WCAG) 2.0 Level AA
Web accessibility evaluation and training
Eric Bratton 01/01/18 06/30/19 In Progress
CG‐5: Promote and enhance the City's safe community and neighborhood programs and initiatives
1 Use data driven policing to address crime trends and quality of life concerns in a timely manner
Discuss crime trends on a quarterly basis with the City Manager
Shawn Ledford 01/01/18 12/31/20 In Progress
048

2/19/2019 2018‐2020 Citywide WorkplanAll Department Goal Data
7
CG‐5: Promote and enhance the City's safe community and neighborhood programs and initiatives
2 Continue quarterly meetings of the City's cross‐department safe community team to address public safety problems and implement solutions
Conduct quarterly Safe Neighborhood/Safe Community meetings with City staff to share information, track traffic safety trends, identify crime trends, and focus resources to address criminal activity
d lit f lif i
Rob Beem 07/06/15 12/31/20 In Progress
CG‐5: Promote and enhance the City's safe community and neighborhood programs and initiatives
3 Continue the partnership between the Parks Department and Police, focusing on park and trail safety through Crime Prevention Through Environmental Design (CPTED), Problem Solving Projects (PSPs) and police emphasis to improve safety and the feeling of safety
Conduct special emphasis project at S. Interurban Trail and Echo Lake Park
Paula Bates 01/04/16 12/31/19 In Progress
CG‐5: Promote and enhance the City's safe community and neighborhood programs and initiatives
3 Continue the partnership between the Parks Department and Police, focusing on park and trail safety through Crime Prevention Through Environmental Design (CPTED), Problem Solving Projects (PSPs) and police emphasis to improve safety and the feeling of safety
Conduct CPTED review of Darnell Park Paula Bates 01/01/17 12/31/19 Complete
CG‐5: Promote and enhance the City's safe community and neighborhood programs and initiatives
3 Continue the partnership between the Parks Department and Police, focusing on park and trail safety through Crime Prevention Through Environmental Design (CPTED), Problem Solving Projects (PSPs) and police emphasis to improve safety and the feeling of safety
Implement Darnell Park CPTED recommendations
Eric Friedli 01/01/17 12/31/19 In Progress
CG‐5: Promote and enhance the City's safe community and neighborhood programs and initiatives
4 Continue to partner with Shoreline schools and the Shoreline Fire Department to implement best practice school safety measures
Ongoing active shooter and patrol training
Shawn Ledford 07/07/15 12/31/20 In Progress
CG‐5: Promote and enhance the City's safe community and neighborhood programs and initiatives
5 Continue to address traffic issues and concerns in school zones and neighborhoods using the City’s speed differential map and citizen traffic complaints
Develop annual traffic safety evaluation report & update traffic data for police use
Kendra Dedinsky 04/01/19 06/30/19 Not Started Mid‐year speed differential map expected by end of Feb 2019.
CG‐5: Promote and enhance the City's safe community and neighborhood programs and initiatives
6 Continue to coordinate efforts between the Community Outreach Problem Solving (COPS) officer and the City's Neighborhoods Program to work on crime prevention education and outreach
Conduct ongoing crime prevention meetings between Shoreline neighborhoods
Paula Bates 01/16/15 12/31/19 In Progress
CG‐5: Promote and enhance the City's safe community and neighborhood programs and initiatives
6 Continue to coordinate efforts between the Community Outreach Problem Solving (COPS) officer and the City's Neighborhoods Program to work on crime prevention education and outreach
Conduct annual National Night Out Celebration
Constance Perenyi 05/01/19 08/31/19 Not Started
CG‐5: Promote and enhance the City's safe community and neighborhood programs and initiatives
7 Conduct trainings, and community programs to promote personal safety, awareness and response
Provide Personal Safety, Awareness, & Response Training; Provide Civilian Response to Active Shooter Events Training
Paula Bates 01/01/18 12/31/20 In Progress
CG‐5: Promote and enhance the City's safe community and neighborhood programs and initiatives
8 Continue to implement the Risk Analysis De‐escalation And Referral (RADAR) program to create a systematic policing approach to deal with mental illness in the community
Analysis / Assessment Phase: RADAR continues in the field, research partners will conduct data analysis and submit final report to DOJ / BJA
Shawn Ledford 01/01/18 10/31/19 In Progress
CG‐5: Promote and enhance the City's safe community and neighborhood programs and initiatives
8 Continue to implement the Risk Analysis De‐escalation And Referral (RADAR) program to create a systematic policing approach to deal with mental illness in the community
Promote accessiblity of RADAR among local jurisdictions by partnering with Bothell, LFP, Kirkland, and Kenmore
Shawn Ledford 01/01/13 12/31/19 In Progress
CG‐5: Promote and enhance the City's safe community and neighborhood programs and initiatives
8 Continue to implement the Risk Analysis De‐escalation And Referral (RADAR) program to create a systematic policing approach to deal with mental illness in the community
Develop and implement Navigator/Mental Health Strategy for North Sound Radar
Shawn Ledford 01/01/18 12/31/20 In Progress
CG‐5: Promote and enhance the City's safe community and neighborhood programs and initiatives
9 Engage in an analysis with service providers to identify what services and processes exist to connect those experiencing homelessness and/or opioid addiction with supportive services and identify gaps that may exist
Conduct interviews with Shoreline‐area providers of services relating to both homelessness and addiction to understand programs currently being delivered, identify gaps or emerging needs, and develop a more complete on‐the‐ground picture of challenges f
James Hammond 06/01/18 08/15/18 Complete
CG‐5: Promote and enhance the City's safe community and neighborhood programs and initiatives
9 Engage in an analysis with service providers to identify what services and processes exist to connect those experiencing homelessness and/or opioid addiction with supportive services and identify gaps that may exist
Capture ideas for potential investments, both regional and local, that could be made by the City of Shoreline to help address these issues
James Hammond 07/02/18 02/25/19 In Progress Task will be completed with report to Council on 2/25/2019.
CG‐5: Promote and enhance the City's safe community and neighborhood programs and initiatives
9 Engage in an analysis with service providers to identify what services and processes exist to connect those experiencing homelessness and/or opioid addiction with supportive services and identify gaps that may exist
With direction/feedback, analyze selected potential investments more closely for cost/benefit; feasibility; and other attributes.
James Hammond 09/17/18 12/31/19 In Progress We won't know if there is a task to be undertaken, in terms of next steps, until after the Council meeting and the following work session. But that would likely kick it into the next year's work plan?
049

2/19/2019 2018‐2020 Citywide WorkplanAll Department Goal Data
8
Organizational Performance and Capacity Building Projects: Priority projects that are intended to enhance organizational performance and strengthen the organization for long‐term success
1 Implement 2015‐2017 Technology Strategic Plan and technology projects that improve organizational efficiency
Conduct needs assessment for capital project management software
Bob Earl 10/01/18 03/30/19 On‐Hold This implementation step was not funded in the 2017, 2018 or 2019‐2020 budgets.
Organizational Performance and Capacity Building Projects: Priority projects that are intended to enhance organizational performance and strengthen the organization for long‐term success
1 Implement 2018‐2020 Technology Strategic Plan and technology projects that improve organizational efficiency
IT Maturity Katherine Moriarty 10/07/14 12/31/19 In Progress Good progress on work order intake and update process
Organizational Performance and Capacity Building Projects: Priority projects that are intended to enhance organizational performance and strengthen the organization for long‐term success
1 Implement 2018‐2020 Technology Strategic Plan and technology projects that improve organizational efficiency
Data Needs Analysis Katherine Moriarty 07/01/18 12/31/19 Not Started The delay of the OneSolution impeded the progress of this work plan item. J. Frey is committed to develop a project charter.
Organizational Performance and Capacity Building Projects: Priority projects that are intended to enhance organizational performance and strengthen the organization for long‐term success
1 Implement 2018‐2020 Technology Strategic Plan and technology projects that improve organizational efficiency
Financial System replacement implementation ‐ Phase I
Katherine Moriarty 04/01/17 05/30/19 In Progress Time card software (Timecards Plus) contract executed. Software to be installed in 2/2019. Implementation scheduled for 4/19.
Organizational Performance and Capacity Building Projects: Priority projects that are intended to enhance organizational performance and strengthen the organization for long‐term success
1 Implement 2018‐2020 Technology Strategic Plan and technology projects that improve organizational efficiency
Financial System replacement implementation ‐ Phase 2
Katherine Moriarty 06/01/19 06/30/20 In Progress Phase II of this project was initiated because of the original plan to implement only core functionality of the Financial/HR System in 11/2018. This did not occur because we could not move forward with core functionality without electronic time cards. The intent is to go live with the functionality planned for Phase II concurrent with the new date for implementation for Phase I (4/29/19).
Organizational Performance and Capacity Building Projects: Priority projects that are intended to enhance organizational performance and strengthen the organization for long‐term success
1 Implement 2018‐2020 Technology Strategic Plan and technology projects that improve organizational efficiency
System Integration Katherine Moriarty 12/01/18 12/31/19 Not Started This project is not a part of the 2018‐2020 Strategic Technology Plan. Item should be removed.
Organizational Performance and Capacity Building Projects: Priority projects that are intended to enhance organizational performance and strengthen the organization for long‐term success
1 Implement 2018‐2020 Technology Strategic Plan and technology projects that improve organizational efficiency
New web hosting implementation Katherine Moriarty 01/01/19 12/31/19 Not Started Communications determined to remain with Vision (Granicus) after the 2017/2018 Web Redesign project.
Organizational Performance and Capacity Building Projects: Priority projects that are intended to enhance organizational performance and strengthen the organization for long‐term success
1 Implement 2018‐2020 Technology Strategic Plan and technology projects that improve organizational efficiency
Open Data Implementation Katherine Moriarty 01/01/21 12/31/22 Not Started This project is included in the Strategic Technology Plan, but not prioritized to start in 2020 as planned
Organizational Performance and Capacity Building Projects: Priority projects that are intended to enhance organizational performance and strengthen the organization for long‐term success
2 Commission for Accreditation of Park and Recreation Agencies (CAPRA)
Achieve CAPRA Accredidation Lynn Gabrieli 01/06/17 12/31/19 In Progress
Organizational Performance and Capacity Building Projects: Priority projects that are intended to enhance organizational performance and strengthen the organization for long‐term success
3 Organizational continuous improvement efforts 2019 Process Walk Intake Process for New Construction Single Family Permits
Katherine Moriarty 12/01/18 03/31/19 In Progress Project charter complete. Gathering data on pre‐intake interactions with PCD and PW personnel
Organizational Performance and Capacity Building Projects: Priority projects that are intended to enhance organizational performance and strengthen the organization for long‐term success
3 Organizational continuous improvement efforts 2019 Process Walk Staff Report Process John Norris 06/01/19 12/31/19 Not Started
Organizational Performance and Capacity Building Projects: Priority projects that are intended to enhance organizational performance and strengthen the organization for long‐term success
3 Organizational continuous improvement efforts Implement Biennial Budgeting Rick Kirkwood 01/01/18 12/31/18 Complete
050

2/19/2019 2018‐2020 Citywide WorkplanAll Department Goal Data
9
Organizational Performance and Capacity Building Projects: Priority projects that are intended to enhance organizational performance and strengthen the organization for long‐term success
3 Organizational continuous improvement efforts Explore performance/outcome based budgeting
Rick Kirkwood 01/07/19 01/07/20 In Progress Early work/research in progress. Goal to discuss with Council in 2020 in advance of the 2021/2022 biennial budget process.
Organizational Performance and Capacity Building Projects: Priority projects that are intended to enhance organizational performance and strengthen the organization for long‐term success
3 Organizational continuous improvement efforts 2018 Process Walk Contract Routing Process Ariana Grlj 09/01/18 12/31/18 Complete Continued improvements, but the actual process is in production
Organizational Performance and Capacity Building Projects: Priority projects that are intended to enhance organizational performance and strengthen the organization for long‐term success
3 Organizational continuous improvement efforts 2018 Process Walk Timesheet Process Gaylene Dunphy‐Hill 01/01/18 12/31/18 Complete Process walk is complete. The implementation of the process changes will occur in 2019 with sysem upgrade.
Priority Community Issues: Issues that have potential long‐term Shoreline community impact and support adopted Council policies
4 Address issues related to proposed development of Point Wells site located within Snohomish County
Phase II Tolling Study 08/01/18 12/31/18 On‐Hold
Priority Community Issues: Issues that have potential long‐term Shoreline community impact and support adopted Council policies
4 Address issues related to proposed development of Point Wells site located within Snohomish County
Participate and monitor the Snohomish County EIS process
Rachael Markle 01/01/14 12/31/19 Complete
Priority Community Issues: Issues that have potential long‐term Shoreline community impact and support adopted Council policies
4 Address issues related to proposed development of Point Wells site located within Snohomish County
Manage & coordinate information for Point Wells
Debbie Tarry 01/01/13 12/31/19 In Progress
Priority Community Issues: Issues that have potential long‐term Shoreline community impact and support adopted Council policies
4 Address issues related to proposed development of Point Wells site located within Snohomish County
Monitor legal proceedings including the GMHB
Margaret King 01/01/13 12/31/19 In Progress
Priority Community Issues: Issues that have potential long‐term Shoreline community impact and support adopted Council policies
4 Address issues related to proposed development of Point Wells site located within Snohomish County
Complete negotiations with BSRE, Sno. Co., and Town of Woodway
Debbie Tarry 01/01/15 12/31/19 In Progress
Priority Community Issues: Issues that have potential long‐term Shoreline community impact and support adopted Council policies
4 Address issues related to proposed development of Point Wells site located within Snohomish County
Monitor BSRE appeal to Snohomish County Council
Margaret King 07/31/18 12/31/18 Complete
Priority Community Issues: Issues that have potential long‐term Shoreline community impact and support adopted Council policies
Continue to deliver daily municipal services to the Shoreline community
The majority of City employees and resources are focused on the provision of daily services to Shoreline residents, businesses, and potential investors
12/01/12 12/31/20 In Progress
051

2019-2021 City Council Goals and Work Plan
The Council is committed to fulfilling the community’s long-term vision – Vision 2029 – and being a sustainable city in all respects:
Sustainable neighborhoods—ensuring they are safe and attractive;
Sustainable environment—preserving our environmental assets and enhancing our built environment so that it protects our natural resources; and
Sustainable services—supporting quality services, facilities and infrastructure.
The City Council holds an annual Strategic Planning Workshop to monitor progress and determine priorities and action steps necessary to advance Vision 2029. This workplan, which is aimed at improving the City’s ability to fulfill the community’s vision, is then reflected in department work plans, the City’s budget, capital improvement plan, and through special initiatives.
Goal 1: Strengthen Shoreline’s economic climate and opportunities Robust private investment and economic opportunities help achieve Council Goals by enhancing the local economy, providing jobs and housing choices, and supporting the public services and lifestyle amenities that the community desires and expects.
ACTION STEPS: 1. Implement the Community Renewal Plan for Shoreline Place, including execution of a development
agreement for the former Sears site and construction of intersection improvements at N 155th Street and Westminster Way N
2. Enhance the attractiveness of Shoreline as a place for private investment, including investment by small and medium sized developments, by ensuring that the permit process is predictable, timely and competitive, and by constantly evaluating and improving the quality of regulations for the City
3. Continue to foster innovative, community-supported place-making efforts that help create diverse communities with a mix of residential and commercial uses and promote economic development
4. Encourage affordable housing development in Shoreline and engage the community to determine which additional housing types and policies may be appropriate for Shoreline and codify standards for selected styles
5. Facilitate collaboration with and between members of the business community in order to remove barriers to starting and growing businesses, increase commerce and profitability, and to identify appropriate new industries for Shoreline
6. Redefine in partnership with the State, specific land uses on the property identified by the State as underutilized on the Fircrest Campus in support of State and local goals and policies
Goal 2: Continue to deliver highly-valued public services through management of the City’s infrastructure and stewardship of the natural environment. The City has identified needed improvements to strengthen its municipal infrastructure to maintain public services the community expects through adoption of the Comprehensive Plan, Surface Water Master Plan, Transportation Master Plan, and Parks, Recreation and Open Space Master Plan. As capital improvements are made, it is important to include efforts that will enhance Shoreline’s natural environment, ultimately having a positive impact on the Puget Sound region.
ACTION STEPS: 1. Implement the Sidewalk Repair and Construction Program 2. Implement the Parks, Recreation, and Open Spaces Plan, including development of a strategy for a
new community and aquatic center and priority park improvements and acquisitions 3. Continue to Implement the Urban Forest Strategic Plan
052

4. Implement the 2019-2021 Priority Environmental Strategies, including citywide Salmon-Safe certification and develop a recommendation on the implementation of recommendations from the Climate Action Analysis for the 185th Street Station Subarea
5. Continue to implement a comprehensive asset management system, including condition assessment and lifecycle/risk analysis for the City's streets, facilities, trees, parks, and utilities
6. Establish a plan to address the City’s long-term maintenance facility needs 7. Continue to implement the proactive strategy of the adopted 2017-2022 Surface Water Master Plan
Continue update to the Master Street Plan including developing cross-sections for different street typologies/classification in support of the Transportation Master Plan (TMP) update
8. Design the N 175th Street Corridor Project from Interstate-5 to Stone Avenue N 9. Implement the in-house City Grounds Maintenance program
Goal 3: Continue preparation for regional mass transit in Shoreline Our community looks forward to increasing mobility options and reducing environmental impacts through public transit services. The ST2 light rail extension from Northgate to Lynnwood includes investment in the Shoreline North/185th Street Station and the Shoreline South/145th Street Station, which are planned to open in 2024. The ST3 package includes funding for corridor improvements and Bus Rapid Transit service along State Route 523 (N 145th Street) from Bothell Way connecting to the Shoreline South/145th Street Station. Engaging our community members and regional transit partners in plans to integrate local transit options into the future light rail service continues to be an important Council priority.
ACTION STEPS: 1. Work with the City of Seattle, King County, Sound Transit, the Washington State Department of
Transportation, and federal agencies on a plan that will improve safety and efficiency for all users of 145th Street, including a design for the 145th Street and Interstate-5 interchange, design of the 145th
Street corridor west of the Interstate-5 interchange, and coordination with Sound Transit for design and construction of 145th Street improvements from Highway 522 to Interstate-5 as part of ST3
2. Work collaboratively with Sound Transit to permit the Lynnwood Link Extension Project and coordinate on project construction and work proactively with Sound Transit to develop plans to minimize, manage, and mitigate anticipated impacts to Shoreline neighborhoods from construction and operation of the Lynnwood Link Extension project
3. Complete the 185th Street Corridor Study between Aurora Avenue N and 10th Avenue NE to identify multi-modal transportation improvements necessary to support growth associated with the 185th Street Station Subarea Plan and the Shoreline North/185th Street Station
4. Continue to coordinate design elements of the Trail Along the Rail, 148th Street Non-Motorized Bridge and 3rd Avenue NE Woonerf projects with Sound Transit and seek funding through federal, state and regional opportunities to complete the designs and construction of these projects
5. Continue to work with regional transit providers to completely fund and implement long range regional transit plans including Sound Transit’s ST3 Plan, King County Metro’s Metro Connects Long Range Plan, and Community Transit’s Long Range Plan for the City of Shoreline
Goal 4: Expand the City’s focus on equity and inclusion to enhance opportunities for community engagement The Council values all residents and believes they are an important part of the Shoreline community, including those who have been historically marginalized and underrepresented. The Council believes it is important to improve inclusion, equity, and participation among all members of the Shoreline community in the development and implementation of policies and programs in a meaningful and impactful way.
ACTION STEPS: 1. Continue to implement the City’s Diversity and Inclusion Program 2. Continue to engage in efforts to address homelessness on a regional and local level
053

3. Ensure all Shoreline residents have access to and benefit from the City’s programs and activities through continued compliance with federal and state anti-discrimination laws, including Title VI of the Civil Rights Act, the Civil Rights Restoration Act, Title II of the Americans with Disabilities Act, and Washington’s Law Against Discrimination
4. Conduct meaningful and intentional community engagement to ensure all Shoreline residents, especially those whom have been historically marginalized or underrepresented, are included in the City’s decision-making processes
5. Continue to build relationships that support community policing within the Shoreline community
Goal 5: Promote and enhance the City’s safe community and neighborhood programs and initiatives Maintaining a safe community is the City’s highest priority. The 2018 Citizen Survey reflected that 93% of respondents felt safe in their neighborhood during the day and 81% had an overall feeling of safety in Shoreline. The City is continuing a concentrated workplan to enhance our public safety communication and crime prevention efforts to ensure that our residents and businesses continue to find Shoreline a safe place to live, work, and play.
ACTION STEPS:1. Use data driven policing to address crime trends and quality of life concerns in a timely manner 2. Continue quarterly meetings of the City's cross-department safe community team to address public
safety problems and implement solutions 3. Continue the partnership between the Parks Department and Police, focusing on park and trail
safety through Crime Prevention Through Environmental Design (CPTED), Problem Solving Projects (PSPs) and police emphasis to improve safety and the feeling of safety
4. Continue to partner with Shoreline schools and the Shoreline Fire Department to implement best practice school safety measures
5. Continue to address traffic issues and concerns in school zones and neighborhoods using the City’s speed differential map and citizen traffic complaints
6. Continue to coordinate efforts between the Community Outreach Problem Solving (COPS) officer and the City's Neighborhoods Program to work on crime prevention education and outreach
7. Conduct trainings, and community programs to promote personal safety, awareness and response 8. Fully implement the Risk Analysis De-escalation And Referral (RADAR) program to effectively
serve individuals with mental health needs, including partnering with Mental Health Professional Navigators to connect those individuals with services
9. Engage in an analysis with service providers to identify what services and processes exist to connect those experiencing homelessness and/or opioid addiction with supportive services and identify gaps that may exist
10. Partner with King County Municipal District Court to explore a Community Court in Shoreline for defendants who conduct “crimes of poverty” with the goal of connecting them with services to address the underlying challenges that may contribute to further criminal activity
054

20182019-20212020 City Council Goals and Work Plan
The Council is committed to fulfilling the community’s long-term vision – Vision 2029 – and being a sustainable city in all respects:
Sustainable neighborhoods—ensuring they are safe and attractive;
Sustainable environment—preserving our environmental assets and enhancing our built environment so that it protects our natural resources; and
Sustainable services—supporting quality services, facilities and infrastructure.
The City Council holds an annual Strategic Planning Workshop to monitor progress and determine priorities and action steps necessary to advance Vision 2029. This workplan, which is aimed at improving the City’s ability to fulfill the community’s vision, is then reflected in department work plans, the City’s budget, capital improvement plan, and through special initiatives.
Goal 1: Strengthen Shoreline’s economic climate and opportunities Robust private investment and economic opportunities help achieve Council Goals by enhancing the local economy, providing jobs and housing choices, and supporting the public services and lifestyle amenities that the community desires and expects.
ACTION STEPS: 1. Implement the Community Renewal Plan for Shoreline Place, including execution of a development
agreement, implementation of a compliant sign package, a review of recommendations for a regional stormwater detention/retention system andagreement for the former Sears site andconstruction of intersection improvements at N 155th Street and Westminster Way N
2. Enhance the attractiveness of Shoreline as a place for private investment, including investment by small and medium sized developments, by ensuring that the permit process is predictable, timely and competitive, and by constantly evaluating and improving the quality of regulations for the City and other local permitting organizations
3.2. Continue to implement the 10-year Financial Sustainability Plan strategies to achieve sufficient fiscal capacity to fund and maintain priority public services, facilities, and infrastructure, with specific focus on implementing a Business and Occupation tax and replacing the General Fund support of the Roads Capital Fund with another dedicated funding source
4.3. Continue to foster innovative, community-supported place-making efforts that help create diverse communities with a mix of residential and commercial uses and promote economic development
5.4. Encourage affordable housing development in Shoreline and Eengage the community in conversation to determine which additional housing stylestypes and policies may be appropriate for Shoreline and codify standards for selected styles, including continued promotion of the Property Tax Exemption program, partnership with King County in the development of affordable housing on the City’s property at Aurora Avenue and N 198th Street, and identify opportunities for integration of affordable housing at the future community and aquatic center facility
6.5. Facilitate collaboration with and between members of the business community in order to remove barriers to starting and growing businesses, increase commerce and profitability, and to identify appropriate new industries for Shoreline
6. Redefine in partnership with the State, specific land uses on the property identified by the State as underutilized on the Fircrest Campus in support of State and local goals and policies8. Engage the community in conversation to determine which additional housing styles and policies
may be appropriate for Shoreline and codify standards for selected styles
055

Goal 2: Continue to deliver highly-valued public services through management of the City’s infrastructure and stewardship of the natural environment. Improve Shoreline’s infrastructure to continue the delivery of highly-valued public servicesShoreline inherited an aging infrastructure system when it incorporated in 1995. The City has identified needed improvements to strengthen its municipal infrastructure to maintain public services the community expects through its 20-year planning documents, including theadoption of theComprehensive Plan, Surface Water Master Plan, Transportation Master Plan, and Parks, Recreation and Open Space Master Plan. Improvements are not limited to infrastructure investments. The City is also interested in improving coordination, planning, and overall information sharing among all service providers. As capital improvements are made, it is important to include efforts that will enhance Shoreline’s natural environment, ultimately having a positive impact on the Puget Sound region.
ACTION STEPS: 1. Identify and advocate for funding, including grant opportunities, to support construction of new and
maintenance of existing sidewalks and other non-motorized facilitiesImplement the Sidewalk Repair and Construction Program
2. Implement the Parks, Recreation, and Open Spaces Plan, including development of a strategy for a new community and aquatic center and priority park improvements and acquisitions
3. Continue to Implement the Urban Forest Strategic Plan4. Implement the 2018-20202019-2021 Priority Environmental Strategies, including achievement of
citywideincluding citywide Salmon-Safe certification, consideration of expanding green building mandates, and appointment of a stakeholder committee to evaluate and develop a recommendation on the implementation of recommendations from the Climate Action Analysis for the 185th Street Station Subarea
5. Continue to implement a comprehensive asset management system, including asset inventory, condition assessment and lifecycle/risk analysis, for the City's streets, facilities, trees, parks, and utilities
6. Evaluate alternatives for City maintenance facility needsEstablish a plan to address the City’s long-term maintenance facility needs
7. Continue to implement the proactive strategy of the adopted 2017-2022 Surface Water Master Plan Implement the Surface Water Master Plan with a focus on completing the 2018-2019 small projects, completing the design of pump station improvements and improving education and outreach about the Plan
8.7. Update the Transportation Master Plan (TMP) Pedestrian System Plan and sidewalk prioritization process and move the Master Street Plan from the TMP to Title 12 of the Shoreline Municipal CodeContinue update to the Master Street Plan including developing cross-sections for different street typologies/classification in support of the Transportation Master Plan (TMP) update
8. Initiate environmental review and designDesign for the N 175th Street Corridor Project from Interstate-5 to Stone Avenue N
9. Implement the in-house City Grounds Maintenance program
Goal 3: Continue preparation for regional mass transit in Shoreline In 2008, Shoreline voters supported the Sound Transit 2 (ST2) funding package with 61%, and in 2016, Shoreline voters supported the Sound Transit 3 (ST3) package with 59%. Our community looks forward to increasing mobility options and reducing environmental impacts through public transit services. The ST2 light rail extension from Northgate to Lynnwood includes investment in two stations in Shorelinethe Shoreline North/185th Street Station and the Shoreline South/145th Street Station, which are planned to open in 2024. The ST3 package includes funding for corridor improvements and Bus Rapid Transit service along State Route 523 (N 145th Street) from Bothell Way connecting to the Shoreline South/145th Street Light Rail Station. Engaging our community in planning for the two Shoreline light rail stations and improved transportation options and infrastructure along N 145th Street
056

in Shoreline continues to be an important Council priority. Engaging our community members and regional transit partners in plans to integrate local transit options into the future light rail service continues to be an important Council priority.
ACTION STEPS: 1. Work with the City of Seattle, King County, Sound Transit, the Washington State Department of
Transportation, and federal agencies on a plan that will improve safety and efficiency for all users of 145th Street, including a design for the 145th Street and Interstate-5 interchange, design of the 145th
Street corridor west of the Interstate-5 interchange, and coordination with Sound Transit for design and construction of 145th Street improvements from Highway 522 to Interstate-5 as part of ST3
2. Work collaboratively with Sound Transit to review and permit the Lynnwood Link Extension Projectand coordinate on project construction, including over the shoulder review of architectural, engineering and construction plans of the light rail stations, garages and associated facilities, review of Sound Transit’s Special Use Permit, and providing comment on the design in accordance with the Council-adopted Guiding Principles for Light Rail Station Design
3.2. Partner with Sound Transit in hosting local public meetings for the In-Progress 90% and 90% design milestones to support identification of anticipated impacts to Shoreline neighborhoods from future construction and operation of the Lynnwood Link Extension and and Continue to work proactively with Sound Transit to develop plans to minimize, manage, and mitigate these anticipated impacts to Shoreline neighborhoods from future construction and operation of the Lynnwood Link Extension project, including construction management planning and neighborhood traffic impact management
4.3. Conduct Complete the 185th Street Corridor Study between Aurora Avenue N and 10th Avenue NE to identify multi-modal transportation improvements necessary to support growth associated with the 185th Street Station Subarea Plan and the Sound Transit Light Rail StationShoreline North/185th Street Station
4. Continue to coordinate design elements of the Trail Along the Rail, 148th Street Non-Motorized Bridge and 3rd Avenue NE Woonerf projects with Sound Transit and seek funding through federal, state and regional opportunities to complete the designs and construction of these projects
5. Continue to work with regional transit providers to completely fund and implement long range regional transit plans including Sound Transit’s ST3 Plan, King County Metro’s Metro Connects Long Range Plan, and Community Transit’s Long Range Plan for the City of Shoreline.
Goal 4: Expand the City’s focus on equity and inclusion to enhance opportunities for community engagement The Council values all residents and believes they are an important part of the Shoreline community, including those who have been historically marginalized and underrepresented. The Council believes it is important to improve inclusion, equity, and participation among all members of the Shoreline community in the development and implementation of policies and programs in a meaningful and impactful way.
ACTION STEPS: 1. Continue to Iimplement the City’s Diversity and Inclusion Program 2. Continue to engage in efforts to address homelessness on a regional and local level 3. Ensure all Shoreline residents have access to and benefit from the City’s programs and activities
through continued compliance with federal and state anti-discrimination laws, including Title VI of the Civil Rights Act, the Civil Rights Restoration Act, Title II of the Americans with Disabilities Act, and Washington’s Law Against Discrimination, so as to ensure all Shoreline residents benefit from the City’s programs and activities
4. Conduct community meetings with residents to discuss current issues, City policy and other changes that may impact the communityConduct meaningful and intentional community engagement to ensure all Shoreline residents, especially those whom have been historically marginalized or underrepresented, are included in the City’s decision-making processes
057

5. Continue to build relationships that support community policing within all members of the Shoreline community
6. Continue to use technology and social media to expand reach in the broader community and to solicit input and ideas on City business, events and policy issues
7. Improve the accessibility of the City’s website and the information contained within by working to conform to Web Content Accessibility Guidelines (WCAG) 2.0 Level AA
Goal 5: Promote and enhance the City’s safe community and neighborhood programs and initiatives Maintaining a safe community is the City’s highest priority. The 2016 2018 Citizen Survey reflected that 93% of respondents felt safe in their neighborhood during the day and 8081% had an overall feeling of safety in Shoreline. These results are reflective of statistics from medium-sized cities across the United States, and the former measure was a slight increase from previous citizen surveys conducted by the City. The City is continuing a concentrated workplan to enhance our public safety communication and crime prevention efforts to ensure that our residents and businesses continue to find Shoreline a safe place to live, work, and play.
ACTION STEPS:1. Use data driven policing to address crime trends and quality of life concerns in a timely manner 2. Continue quarterly meetings of the City's cross-department safe community team to address public
safety problems and implement solutions 3. Continue the partnership between the Parks Department and Police, focusing on park and trail
safety through Crime Prevention Through Environmental Design (CPTED), Problem Solving Projects (PSPs) and police emphasis to improve safety and the feeling of safety
4. Continue to partner with Shoreline schools and the Shoreline Fire Department to implement best practice school safety measures
5. Continue to address traffic issues and concerns in school zones and neighborhoods using the City’s speed differential map and citizen traffic complaints
6. Continue to coordinate efforts between the Community Outreach Problem Solving (COPS) officer and the City's Neighborhoods Program to work on crime prevention education and outreach
7. Conduct trainings, and community programs to promote personal safety, awareness and response 8. Continue to implement the Risk Analysis De-escalation And Referral (RADAR) program to create a
systematic policing approach to deal with mental illness in the communityFully implement the Risk Analysis De-escalation And Referral (RADAR) program to effectively serve individuals with mental health needs, including partnering with Mental Health Professional Navigators to connect those individuals with services
9. Engage in an analysis with service providers to identify what services and processes exist to connect those experiencing homelessness and/or opioid addiction with supportive services and identify gaps that may exist
9.10. Partner with King County Municipal District Court to explore a Community Court in Shoreline for defendants who conduct “crimes of poverty” with the goal of connecting them with services to address the underlying challenges that may contribute to further criminal activity
058

2018-2023 Economic Development Strategic Plan
The City of Shoreline’s economic development strategy is based on Placemaking Projects. Fred Kent calls Placemaking the thing that “turns a City from a place you can’t wait to get through into one you never want to leave.” Organizing economic development efforts into Placemaking Projects provides the flexibility needed to tailor efforts to achieve both the goals articulated in Vision 2029 and the annually updated Council Goals and Workplans.
Four specific areas possess the potential to dramatically strengthen the economic vitality of Shoreline. These four City-Shaping Areas shall be the focus of concerted Placemaking Projects designed to trigger large-scale redevelopment and growth.
• Strengthen Shoreline’s Signature Boulevard – leveraging the city’s $140 million Aurora CorridorProject by facilitating constant investment along its six miles of improved frontage
• Catalyze Shoreline Place – encouraging intensive private redevelopment of the former Searscenter into an exemplary lifestyle destination
• Unlock the Fircrest Surplus Property – establishing new uses and industries that createhundreds of new Shoreline-based jobs and economic opportunities
• Ignite Station Area Growth – parlaying the extraordinary public investment that will bring lightrail service to Shoreline’s two rezoned station areas
Additional commercial nodes can influence the economic vitality of the surrounding neighborhoods. Placemaking Projects in these Neighborhood Commercial Centers shall seek to create identity, encourage walkability, expand housing options, and provide needed goods and services.
• Shoreline Town Center• Echo Lake at Aurora & N 192nd• North City Business District
• Four Corners at NW Richmond Beach Rd• Downtown Ridgecrest• Ballinger Commercial Center
Non-geographic Placemaking Projects enrich the overall economic climate of the city and make Shoreline an even more attractive place to live, to invest, and to conduct business.
• Growing a Media Production Industry• Promoting Shoreline to Investors• Serving Home-based Businesses• Increasing Inventory of Business Spaces• Expanding Events & Festivals
• Supporting the Community College• Attracting Artists & Trendsetters• Continually Improving Code & Policies• Facilitating Collaboration With &
Between Businesses
Both inputs and outcomes shall be tracked to Monitor the Effectiveness of Shoreline’s economic development efforts. Inputs shall be tracked through regular Placemaking Project updates; outputs shall be tracked through annual updates of economic metrics such as assessed values, sales tax generation, vacancy and rental rates, Shoreline-based jobs, and new market-rate and affordable housing units.
Office of Economic Development 206.801.2218 059

MISSION Fulfilling the community’s vision through highly valued public services.
Integrity: Act with honesty, openness, and accountability.
Teamwork: Accomplish goals, resolve issues through quality communication and collaboration.
Respect: Listen, value others, and treat everyone with fairness and dignity.
Innovation: Learn from experience, explore new ideas, and implement creative solutions.
Sustainability: Exemplify and encourage sustainable practices in our organization andcommunity.
VALUES
Delivery of Public Services: Continue to make Shoreline a desirable place to live and invest by providing public services that are valued by our community.
Organizational Strength: Enhance the effectiveness of our organization through development of employee skills and knowledge.
Fiscal Sustainability: Secure and sustain long-term financial sustainability to ensure delivery of public services to ourcommunity.
Achieve Council Goals: Complete action steps included in the adopted City Council Goals.
ORGANIZATIONAL GOALS
Shoreline is a thriving, friendly city where people of all ages, cultures, and
economic backgrounds love to live, work ,and play, and most of all, call home. VISION
SHORELINE: IN FORWARD MOTION
035060

City of Shoreline 5-Year Organizational Goals & Action Steps
1. Delivery of Public Services: Continue to make Shoreline a desirable place to live and invest by providing public services that are valued by our community. Establish an organizational standard for process documentation and a strategy to
document key organizational processes Develop a framework for process review and improvement and integrate into the
organizational culture Make strategic technology investments that enhance our ability to deliver public
services Establish key performance indicators used to evaluate effectiveness and guide
resource allocation decisions
2. Organizational Strength: Enhance the effectiveness of our organization through development of employee skills and knowledge. Provide development opportunities for supervisors, managers and directors that
align with key supervisor competencies Refine the City’s performance evaluation system to include a focus on
responsibilities and feedback related to service delivery Align employee development plans to meet long-term organizational needs and
support these training opportunities
2. Fiscal Sustainability: Secure and sustain long-term financial sustainability to ensure delivery of public services to our community. Engage key stakeholders to advance the seven key strategies adopted in the 10
Year Financial Sustainability Plan Explore biennial budget and performance based budget implementation
4. Achieve Council Goals: Complete action steps included in the adopted City Council Goals. Establish city-wide workplans that identify project manager, timelines, and cross-
functional work teams needed to accomplish Council Goal action steps
061

1
Parks, Recreation, and Open Space Plan Implementation Funding
City Council Retreat
March 1, 2019
Contents Introduction .................................................................................................................................................. 2
Policy Questions and Decisions ..................................................................................................................... 2
Additional Information Being Compiled ....................................................................................................... 3
Survey Results ........................................................................................................................................... 3
Alternative Site Analysis............................................................................................................................ 3
Park Funding Advisory Committee Recommendations (PFAC)................................................................. 3
City Manager Recommendation ............................................................................................................... 3
Alternative Funding Sources ......................................................................................................................... 4
Background ................................................................................................................................................... 5
Build a Community/Aquatics Center ............................................................................................................ 5
Financial Impact ........................................................................................................................................ 6
Expand Availability of Recreation Amenities ................................................................................................ 7
Financial Impact ........................................................................................................................................ 8
Ensure Adequate Park Land for Future Generations .................................................................................... 9
Financial Impact ...................................................................................................................................... 10
Attachment A: Secure Sustainable Funding ............................................................................................... 12
Park Funding Advisory Committee ............................................................................................................. 20
Attachment B: Park Concept Design Summaries ....................................................................................... 22
062
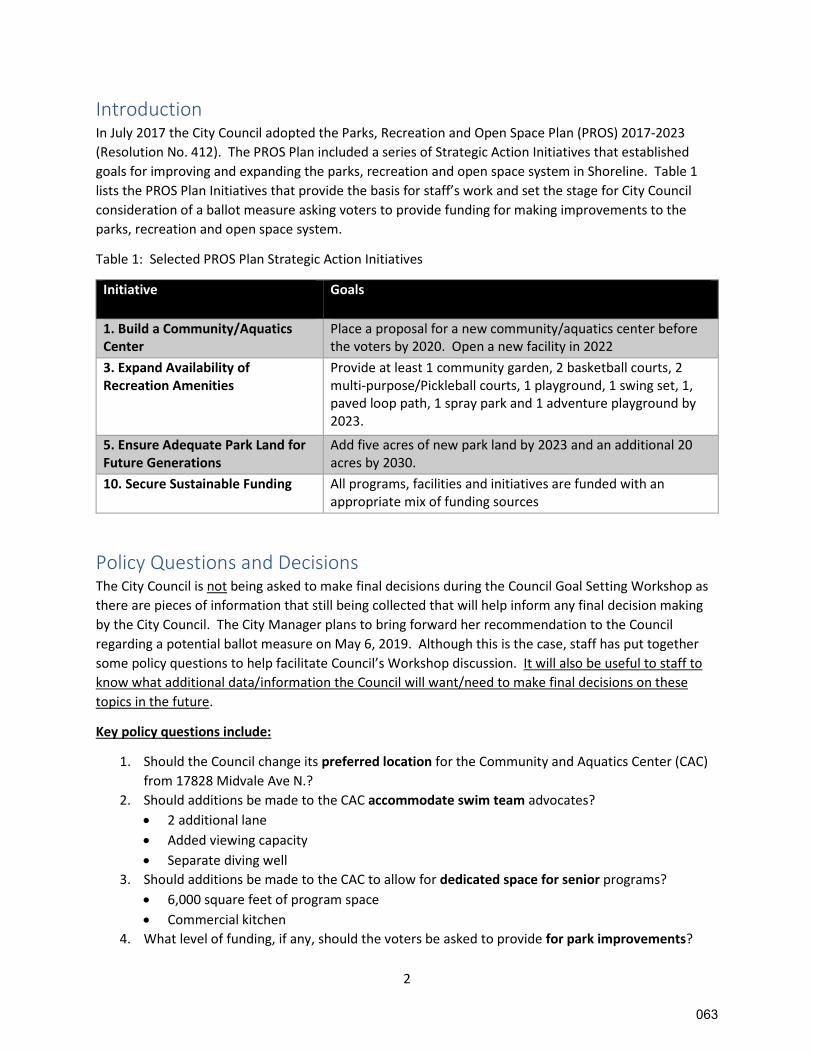
2
Introduction In July 2017 the City Council adopted the Parks, Recreation and Open Space Plan (PROS) 2017-2023
(Resolution No. 412). The PROS Plan included a series of Strategic Action Initiatives that established
goals for improving and expanding the parks, recreation and open space system in Shoreline. Table 1
lists the PROS Plan Initiatives that provide the basis for staff’s work and set the stage for City Council
consideration of a ballot measure asking voters to provide funding for making improvements to the
parks, recreation and open space system.
Table 1: Selected PROS Plan Strategic Action Initiatives
Initiative Goals
1. Build a Community/AquaticsCenter
Place a proposal for a new community/aquatics center before the voters by 2020. Open a new facility in 2022
3. Expand Availability of Recreation Amenities
Provide at least 1 community garden, 2 basketball courts, 2 multi-purpose/Pickleball courts, 1 playground, 1 swing set, 1, paved loop path, 1 spray park and 1 adventure playground by 2023.
5. Ensure Adequate Park Land for Future Generations
Add five acres of new park land by 2023 and an additional 20 acres by 2030.
10. Secure Sustainable Funding All programs, facilities and initiatives are funded with an appropriate mix of funding sources
Policy Questions and Decisions The City Council is not being asked to make final decisions during the Council Goal Setting Workshop as
there are pieces of information that still being collected that will help inform any final decision making
by the City Council. The City Manager plans to bring forward her recommendation to the Council
regarding a potential ballot measure on May 6, 2019. Although this is the case, staff has put together
some policy questions to help facilitate Council’s Workshop discussion. It will also be useful to staff to
know what additional data/information the Council will want/need to make final decisions on these
topics in the future.
Key policy questions include:
1. Should the Council change its preferred location for the Community and Aquatics Center (CAC)
from 17828 Midvale Ave N.?
2. Should additions be made to the CAC accommodate swim team advocates?
2 additional lane
Added viewing capacity
Separate diving well
3. Should additions be made to the CAC to allow for dedicated space for senior programs?
6,000 square feet of program space
Commercial kitchen
4. What level of funding, if any, should the voters be asked to provide for park improvements?
063

3
5. What level of funding, if any, should the voters be asked to provide for park land acquisition?
6. Should a funding request be put to the voters?
If yes, when should it occur?
Additional Information Being Compiled There are several pieces of important information that will be collected over the next six-eight weeks
that will help inform the City Councils final decisions.
Survey Results Staff have engaged a consultant to conduct a statistically valid survey of Shoreline residents asking
about various topics related to parks and recreation. The survey asks about general satisfaction with
parks and recreation services, familiarity with the community and aquatics center project, priorities for
amenities to include in a community and aquatics center and other parks improvements, and level of
support for various bond funding scenarios.
The survey has been finalized and is currently being administered. Results should be made available to
the City in late March.
Alternative Site Analysis Given the potential interest in changing the preferred site for the CAC to school district property at
Shoreline Center, staff have worked with the CAC design team (WRNS Studios) to develop a schedule
and scope of work for them to help assess the feasibility and cost estimates of developing the CAC on
the site of the current pool and tennis courts at Shoreline Center. Should the School Board express an
interest/willingness in having the CAC located at the site staff would engage WRNS is conducting a site
analysis. Staff would also work with the School District to better understand the terms of an agreement.
The School Board is scheduled to consider this topic on February 25th.
The alternative site analysis, including an assessment of the terms of an agreement with the school
district, would be completed in early April.
Park Funding Advisory Committee Recommendations (PFAC) The PFAC is nearing completion of its recommendation to the City Manager. They are expected to make
recommendations related to the CAC, park improvements and land acquisition. They have developed
preliminary recommendations and have two remaining meetings. The PFAC final recommendations are
expected by March 27th.
City Manager Recommendation The City Manager anticipates compiling all of this, and any other, information to make her
recommendation to the City Council on May 6, 2019.
064
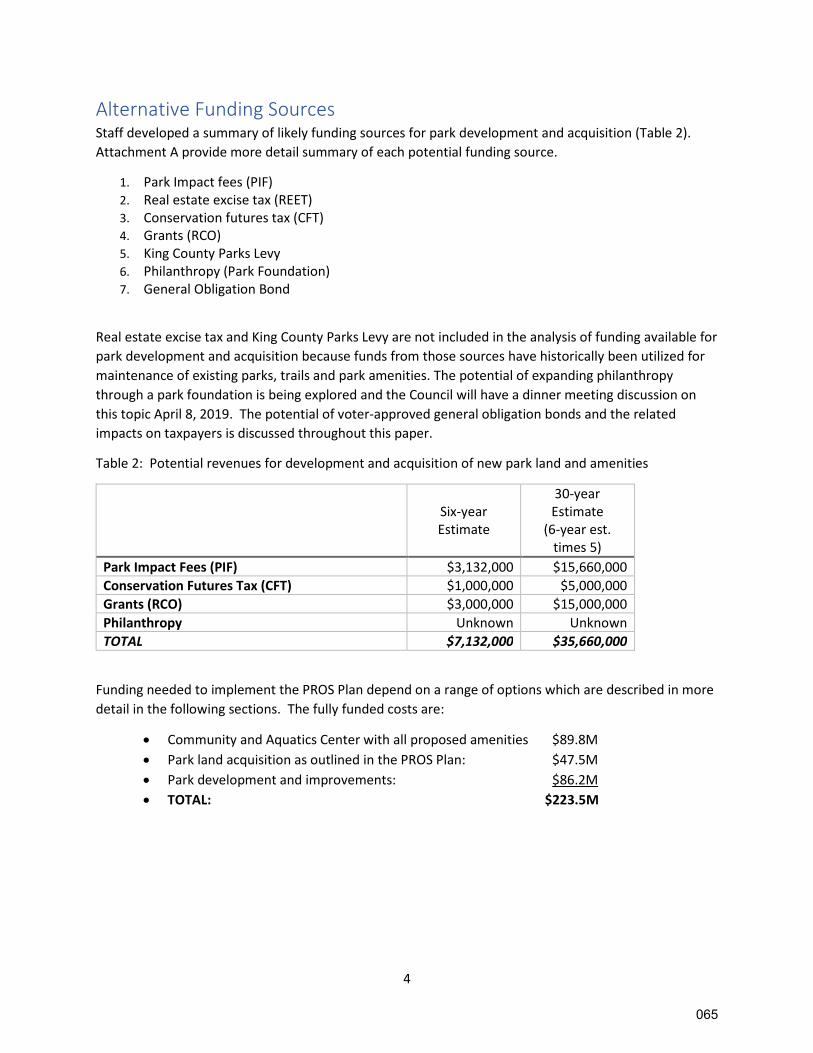
4
Alternative Funding Sources Staff developed a summary of likely funding sources for park development and acquisition (Table 2).
Attachment A provide more detail summary of each potential funding source.
1. Park Impact fees (PIF) 2. Real estate excise tax (REET) 3. Conservation futures tax (CFT) 4. Grants (RCO) 5. King County Parks Levy 6. Philanthropy (Park Foundation) 7. General Obligation Bond
Real estate excise tax and King County Parks Levy are not included in the analysis of funding available for
park development and acquisition because funds from those sources have historically been utilized for
maintenance of existing parks, trails and park amenities. The potential of expanding philanthropy
through a park foundation is being explored and the Council will have a dinner meeting discussion on
this topic April 8, 2019. The potential of voter-approved general obligation bonds and the related
impacts on taxpayers is discussed throughout this paper.
Table 2: Potential revenues for development and acquisition of new park land and amenities
Six-year Estimate
30-year Estimate
(6-year est. times 5)
Park Impact Fees (PIF) $3,132,000 $15,660,000
Conservation Futures Tax (CFT) $1,000,000 $5,000,000
Grants (RCO) $3,000,000 $15,000,000
Philanthropy Unknown Unknown
TOTAL $7,132,000 $35,660,000
Funding needed to implement the PROS Plan depend on a range of options which are described in more
detail in the following sections. The fully funded costs are:
Community and Aquatics Center with all proposed amenities $89.8M
Park land acquisition as outlined in the PROS Plan: $47.5M
Park development and improvements: $86.2M
TOTAL: $223.5M
065

5
Background
Build a Community/Aquatics Center Key Policy questions
1. Should the Council change its preferred location from 17828 Midvale Ave N.?
2. Should additions be made to accommodate swim team advocates?
2 additional lane
Added viewing capacity
Separate diving well
3. Should additions be made to allow for dedicated space for senior programs?
6,000 square feet of program space
Commercial kitchen
Background A Community and Aquatics Center Feasibility Study was prepared as part of the preparation of the PROS
Plan. The Feasibility Study was completed in March 2017. The Feasibility study provided preliminary
information on programing for a new facility, location options for a new facilities and design and cost
estimates. Following adoption of the PROS Plan the City Council identified 17828 Midvale Ave N as the
preferred site for the new Community and Aquatics Center (CAC). Staff engaged WRNS Studios to assist
with the development of a refined concept design and construction cost estimates tailored to the
selected site. The public was asked to participate in the development of the concept design through a
series of engagement opportunities through the summer and fall of 2018. The CAC Concept Design
Booklet was finalized in December 2018. It includes a summary of the public process, detailed design
summaries, the evolution of the design ideas and construction cost estimates. The 141-page booklet is
available at www.Shorelinewa.gov/cac.
The new CAC is proposed to be located at 17828 Midvale Avenue North, between North 178th and 180th
Streets, on a 4.5-acre site that is currently the home of the Storage Court of Shoreline. The site was
chosen for its central location, access to public transportation, access to pedestrian and bikers, and due
to its high level of visibility.
The proposed building will be approximately 63,000 gross square feet (GSF), based on approximately
52,000 assignable square feet (ASF). Summary as follows:
Fitness/Sports: 25,255 ASF Aquatics: 13,800 ASF Community Spaces: 3,785 ASF Support Spaces: 9,385 ASF Total ASF: 52,225 ASF
Net/Gross Efficiency: .83%
Total GSF: 63,036 GSF
Current project include land acquisition, the demolition of the existing facility, and a facility constructed
to meet the equivalency of Gold certification from the Leadership in Energy and Environmental Design
066

6
(LEED) green building certification program. The total construction cost estimate for the new building is
approximately $42.5 million. With contingencies, project management, design and permitting, and
inflation expectations the total project costs is estimated at $60.8 million. Acquisition (including
required renters relocation costs) of the preferred site is estimated to be $19 million.
The proposed schedule anticipates the beginning of Schematic Design in January 2020 and the beginning
of Construction Documents in August 2020. Construction is anticipated to begin June 2021 with
occupancy in January 2023.
Financial Impact
Project Development/Construction Table 3a: Projected Impact of various CAC options on a median valued home
Estimated Cost
(in millions)
15 Year Bonds 30 Year Bonds
Annual Impact
Monthly impact
Annual Impact
Monthly impact
Community and Aquatics Center $60.8 $219 $18 $151 $13
CAC Land Acquisition $19.0 $69 $6 $47 $4
Potential Changes:
Two additional swim lanes $1.2 $4 $0.33 $3 $0.25
Expanded viewing space forpool
$0.4 $1 $0.08 $1 $0.08
Add diving capacity to lap pool (NOT a separate diving well)
$2.7 $10 $1 $7 $0.58
Dedicated senior space with commercial kitchen
$5.7 $21 $2 $14 $1
TOTAL $89.8 $324 $27 $223 $19
Operations and Maintenance Table 3b: Estimated O&M Costs and general fund subsidy
General Fund Subsidy Estimated Change in General Fund Subsidy 2018 actual Projected
Community and Aquatics Center
$1.1M $.9M -$200,000
Two additional swim lanes 0 $15,500 $15,500
Expanded viewing space for pool
0 $5,000 $5,000
067

7
Add diving capacity to lap pool (NOT a separate diving well)
0 $34,700 $34,700
Dedicated senior space with commercial kitchen
0 $59,300 $59,300
TOTAL $0.9M $1.0M -$100,000
Additional Information. www.Shorelinewa.gov/cac
Public comments received since the 11/28 Open House
CAC Concept Design Booklet 2018 (141 pages)
Aquatics and Community Center Feasibility Study 2017 (112 pages)
Expand Availability of Recreation Amenities Key Policy questions
1. What level of funding, if any, should the voters be asked to provide for park improvements?
Background Building on the 2017-2023 PROS Plan, HBB Landscape Architects were hired to evaluate nine parks throughout the City to determine how the identified needs from the PROS Plan best fit into the parks. The purpose was to gather public input regarding priority parks, improvements, and activities; and to develop concept plans based on City and public input that will guide future development. The goal of this process was to develop concept plans for priority parks that can be used by the City in generating funding and creating implementation plans for future improvements. Priority parks were identified as those that did not receive improvements from the 2006 park bond and have bot had significant investment since. Shoreview and Hamlin Parks were included due to unique amenities and opportunities in those large regional parks.
Based on community input and the PROS Plan, the priorities guiding park programs include: a. Increase active and passive programming. b. Expand opportunities to connect to nature. c. Increase the amount of public art. d. Improve and expand tree canopy. e. Increase the number of trails and loop paths.
Parks included are listed in Table 4. The project resulted in a concept design for each park along with
cost estimates. In addition to estimating costs for the full development of the concept design, staff have
estimated the cost for partial development for each park. Attachment A provides a summary of the
amenities included in each park concept design. The cost estimates include construction, design,
permitting, contingency and inflation allowances (Table 4).
068
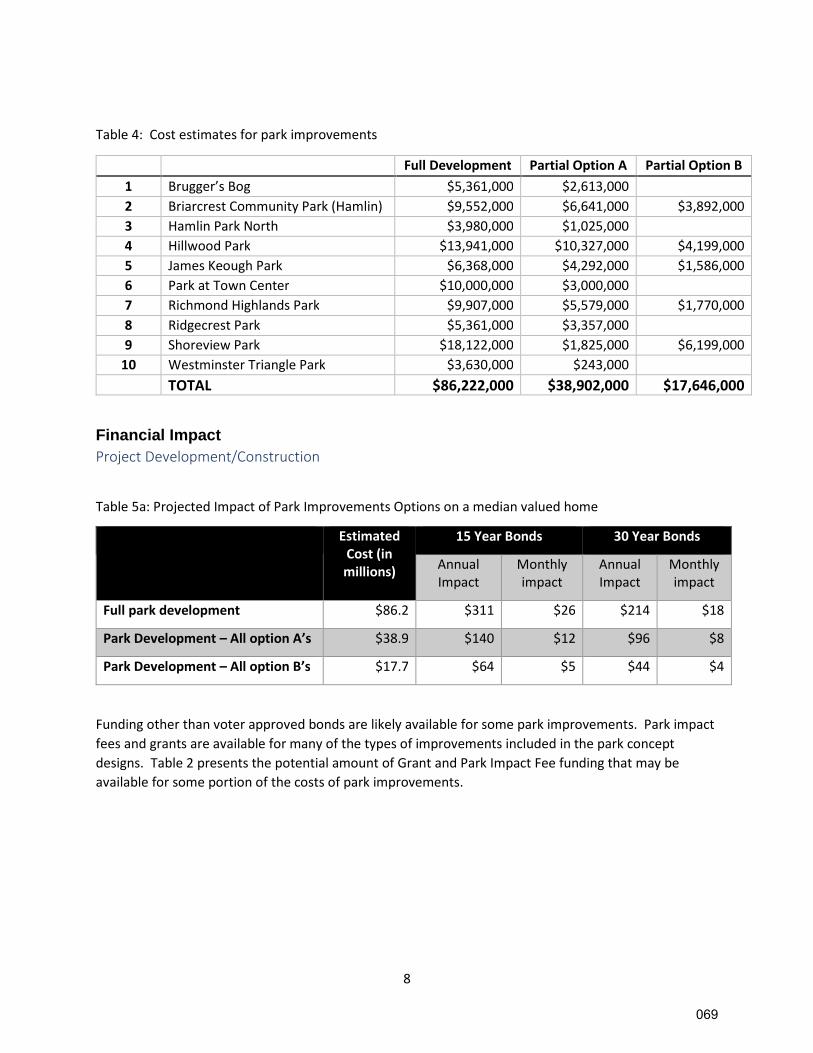
8
Table 4: Cost estimates for park improvements
Full Development Partial Option A Partial Option B
1 Brugger’s Bog $5,361,000 $2,613,000
2 Briarcrest Community Park (Hamlin) $9,552,000 $6,641,000 $3,892,000
3 Hamlin Park North $3,980,000 $1,025,000
4 Hillwood Park $13,941,000 $10,327,000 $4,199,000
5 James Keough Park $6,368,000 $4,292,000 $1,586,000
6 Park at Town Center $10,000,000 $3,000,000
7 Richmond Highlands Park $9,907,000 $5,579,000 $1,770,000
8 Ridgecrest Park $5,361,000 $3,357,000
9 Shoreview Park $18,122,000 $1,825,000 $6,199,000
10 Westminster Triangle Park $3,630,000 $243,000
TOTAL $86,222,000 $38,902,000 $17,646,000
Financial Impact
Project Development/Construction
Table 5a: Projected Impact of Park Improvements Options on a median valued home
Estimated Cost (in millions)
15 Year Bonds 30 Year Bonds
Annual Impact
Monthly impact
Annual Impact
Monthly impact
Full park development $86.2 $311 $26 $214 $18
Park Development – All option A’s $38.9 $140 $12 $96 $8
Park Development – All option B’s $17.7 $64 $5 $44 $4
Funding other than voter approved bonds are likely available for some park improvements. Park impact
fees and grants are available for many of the types of improvements included in the park concept
designs. Table 2 presents the potential amount of Grant and Park Impact Fee funding that may be
available for some portion of the costs of park improvements.
069

9
Operations and Maintenance
Table 5b: Estimated additional annual general fund O&M costs
Estimated Cost (in millions)
Full park development $270,000
Park Development – All option A’s $182,000
Park Development – All option B’s $-13,000*
*Option B for Shoreview Park include improved soccer field which is estimated
to provide $100,000 of new revenue, offsetting new expenses.
Additional Information. The concept design for each park can be found on the city’s website.
http://www.shorelinewa.gov/government/projects-initiatives/park-concept-designs-2018
Ensure Adequate Park Land for Future Generations Key Policy questions
1. What level of funding, if any, should the voters be asked to provide for park land acquisition?
Background One of the key outcomes of the PROS Plan 2017-2023 was to consider acquisition of property for park,
recreation and open space purposes. The adopted PROS Plan Strategic Action Initiative 5 sets limited
targets for acquisition at five acres of new park land by 2023 and an additional 20 acres by 2030.
Analysis done for the PROS Plan indicates that to maintain the same ratio of population to parkland
(excluding community/aquatics center property) there will be a need for an additional 95 acres of
parkland in Shoreline of which approximately 43 acres should be in and around the two light rail station
subareas (Table 6). The increase of 95 acres is almost 20% larger than the size of Hamlin Park, which is
80 acres.
Table 6: Current and Future demand for Acres of Parkland
Current Acres per 1,000 population
2016 Total Acres
2035 Projected Demand
Acres Needed to maintain current LOS
Citywide 7.38 409 504 95
Light rail station Subareas 4.06 66 109 43
070

10
Finding and acquiring 95 acres of additional parkland will be a challenge. It will be necessary to develop park designs and implement maintenance practices that will accommodate more intense use of smaller park spaces. Priority areas for acquisition are identified in the PROS Plan (Table 7). Cost estimates include acquisition and development with allowance for inflation. Development costs are for minimal improvements to the property to prepare it for general use not including substantial park amenities.
Table 7: PROS Plan Acquisition Priorities
Site Estimated Acquisition Cost
Estimated Development Cost
Rotary Park Acquisition $3,992,000 $1,406,000
145th Station Area Acquisition $6,291,000 $1,113,000
185th & Ashworth Acquisition $1,203,000 $520,000
5th & 165th Acquisition $7,041,000 $4,456,000
Paramount Open Space Acquisition $3,734,000 $257,000
Cedarbrook Acquisition © (1/4 of full property cost estimate)
$2,779,000 $503,000
Aurora-I-5 155th-165th Acquisition $9,931,000 $1,615,000
DNR Open Space Access Acquisition $2,027,000 $616,000
TOTAL Costs $36,998,000 $10,570,000
Financial Impact
Project Development Implementation
Table 8: Projected Impact of Park Acquisition on a median valued home
Estimated Cost (in millions)
15 Year Bonds 30 Year Bonds
Annual Impact
Monthly impact
Annual Impact
Monthly impact
Acquisition $37.0 $134 $11 $92 $8
Development $10.6 $38 $3 $26 $2
Total $47.6 $172 $14 $118 $10
Funding other than voter approved bonds are likely available for park acquisition. Park impact fees,
grants and conservation futures tax are available for acquisitions. Table 2 presents the potential
amount of Conservation futures tax, grants and Park Impact Fee funding that may be available for some
portion of the costs of park land acquisitions.
071

11
Operations and Maintenance Estimated additional annual general fund O&M costs associated with acquisition is $112,000. This only
includes basic maintenance of undeveloped park land.
Additional Information. The PROS Plan is available at:
http://cosweb.ci.shoreline.wa.us/uploads/attachments/par/prosplan/Final/2017-2023PROSPLAN.pdf
Chapter 4 provides demand and needs assessment
Table 6.6 provides recommendations and implementations for acquisition
072

12
Attachment A: Secure Sustainable Funding
Background Staff have analyzed funding options available for parks and recreation facilities and have developed
estimates of likely revenue anticipated from each source.
Funding options 8. Park Impact fees (PIF) 9. Real estate excise tax (REET) 10. Conservation futures tax (CFT) 11. Grants (RCO) 12. King County Parks Levy 13. Philanthropy 14. General obligation bond
Park Impact Fees
Park Impact fees are charges assessed against newly-developing residential property that attempt to recover the cost incurred by a local government in providing the public facilities required to serve the new development.
The City of Shoreline adopted Park Impact Fees (PIF) by Ordinance No. 786 effective January 1, 2018. This ordinance is found in Shoreline Municipal Code (SMC) Chapter 3.70. The Growth Management Act, 36.70c RCW, requires cities to plan and provide parks and recreation facilities that are adequate to accommodate growth.
A park impact fee is a one-time payment by new development to pay for capital costs of facilities needed to support the new development. Park impact fees are charged during the building permitting process and used to fund projects to maintain levels of service of Shoreline's park system. The intent is to share the financial responsibility of providing for recreation facilities, such as new parks, open space and recreation facilities that support future growth with the development that grows our population and economy.
Fees collected will be applied toward recreation facilities, such as new parks, open space and recreation facilities that support future growth with the development that grows our population and economy. Park impact fees can only be used for “system improvements” included in an adopted six-year Capital Improvement Plan (CIP), and that are improvements reasonably related to and benefit the new development.
The fee is proportionate to the size of the development or change in use. Fees are adjusted biennially during the budget process by the same percentage changes as in the most recent annual change of the Construction Cost Index published in the Engineering News-Record (ENR) for the Seattle area. The following table shows the actual 2018 fees and proposed fees for the upcoming 2019-2020 biennial budget.
073

13
Real Estate Excise Tax
A real estate excise tax (REET) is levied on all real estate sales measured by the full selling price, including the amount of any liens, mortgages, and other debts given to secure the purchase. (See Ch. 82.46 RCW.)
All real estate property sales in the county are taxed at a rate of 1.28%. A portion of these revenues, equal to a 0.5% tax rate, is distributed by King County to the cities monthly. The use of REET funds is restricted by State law. The first 0.25% of the REET tax rate must be spent on capital projects listed in the City’s Comprehensive Plan. These projects could include local capital improvements, including streets, parks, pools, municipal buildings, etc. The second 0.25% of the REET tax rate must be spent on public works projects for planning, acquisition, construction, reconstruction, repair, replacement, or improvement of streets roads, highways, sidewalks, street lighting, etc. Council has historically programmed 50% of the City’s REET collections to the General Capital fund and 50% to the Roads Capital Fund.
REET is the primary revenue source in the City’s General Capital Fund. The great recession resulted in a significant decrease in REET collections. However, collections have since rebounded and in recent history the baseline annual budget for the General Capital Fund has returned to approximately $1.2 million and forecast to increase to $1.4 million. Collections in recent years have significantly exceeded the projected budget forecast due to significant one-time market activity. This one-tine activity is excluded from the forecast. In 2009, the City Council authorized the use of up to $750,000 of General Capital Fund REET annually towards the debt service costs of City Hall. In 2019, General Capital REET is contributing approximately $677,000 and General Fund is contributing $679,000 with the balance being supported by the federal Build America Bond Subsidy at $320,000. The dedication of REET revenues to debt service reduces the amount of budgeted REET available for projects each year. However, overcollections from the prior year become fund balance and are available to be programmed in the future CIPs during the budget process and CIP updates.
The City Council allocates REET funding to specific projects with the adoption of the City’s budget based on its priorities for investment in city infrastructure. City Council could choose to change the allocation of REET funding between the capital funds, recognizing that this would change the make-up of general and transportation projects that could be funded. City Council could also direct the use of any overcollections to increase funding for specific priority projects in a stated policy rather than through the biennial budget process.
2018 2019 2020
Use Category Unit Impact Fee Impact Fee Impact Fee
Single Family Residential per dwelling 3,979 4,090 4,205
Multi-Family Residential per dwelling 2,610 2,683 2,758
074

14
Conservation Futures Tax (CFT)
For more than 30 years government and nonprofit groups across King County have used the CFT to protect from development 111,000 acres of land, forests, shorelines, greenways and trails. Funding has supported such diverse projects as Seattle's Duwamish Head Greenbelt, development rights on the Snoqualmie Forest and Puget Sound shoreline in Burien. Parks have been built, salmon habitat restored, and our quality of life improved. See RCW 84.34.200 - 84.34.250
CFT awards can fund the conservation of open space lands used for low-impact passive recreational activities, including natural areas, urban green spaces, passive parks, regional trails, farms, and forests. CFT awards require a dollar-for-dollar local match.
Applications are due in early March each year. Proposals are reviewed by the King County Conservation Futures Citizen Oversight Committee, including field trips to each of the applicant project sites in late March and April. The Committee makes its recommendations in a report to the King County Council and Executive in late June. Final funding awards are made in November as part of King County’s budget process.
Sample of prior CFT awards to the City of Shoreline
Grants
The City intends to aggressively seek outside funding to maximize the impact of the City’s programs and policies. The submission of a grant application is the first step towards the City’s commitment for a program being supported by grant funding.
In seeking grants and other outside funding the City will balance the value of additional resources with the City’s ability to effectively manage the funds and sustain any activities begun with outside funding. Specifically, the City will analyze grant opportunities considering:
1. Match 2. Cost/Benefit 3. Consistency with Work Plan 4. Sustainability of Activity
Year
Amount
Awarded Project
2014 34,997 Paramount Open Sapace Acquisitoin
2007/2008 457,000 Kruckeberg Property Acquisition
2007 550,000 North Hamlin Park Addition
2006/2007 450,000 South Woods Addition
2002/2006 71,500 Paramount Park Addition
075

15
5. Consistency with Council Goals 6. Consistency with City Roles and Responsibilities
The City Manager is charged with the responsibility of determining which grants to seek provided that these grants will support programs and policies that are consistent with the City’s overall policy and budget direction.
The City of Shoreline has grant development program. As part of that, there is a grants administrator that coordinates city-wide grant funding opportunities, determines grant needs, develops strategies and coordinates efforts with the appropriate City staff and elected officials.
Recreation & Conservation Office (RCO)
RCO is a small state agency that manages grant programs to create outdoor recreation opportunities, protect the best of the state's wildlife habitat and farmland, and help return salmon from near extinction. The office staff, under the guidance of a director appointed by the Governor and the boards, administers grants for recreation, habitat conservation, farmland preservation, and salmon recovery.
RCO administers a dozen state and federal grant programs for a range of activities from developing parks to providing boating facilities to creating trails to saving salmon. Most of these grant programs require applicants to complete a comprehensive plan and then apply in the spring of even-numbered years. The grants are reviewed by panels of experts and ranked. The ranked projects are submitted to the board for funding approval.
There are several grant programs for building and renovating outdoor parks or for buying land for future parks. These grants provide funding for buying land, building or renovating local and state parks, developing and renovating public waterfront areas, creating access to the water, building athletic fields. Applications for these grants are accepted on even years, require a 50% match from the City and they range from $25,000 to $1,000,000.
Grant Program Description Eligible Applicants Applications
Accepted Match
LWCF- Land and Water Conservation Fund
Funding to preserve and develop outdoor recreation resources, including parks, trails, and wildlife lands.
Local agencies* State agencies
Mid-February to
May 1
In even-numbered years only
50%
WWRP -Washington Wildlife and Recreation Program
Funding for local and state parks, trails, water access, state land conservation and restoration, farmland and forestland preservation, and habitat conservation
Local agencies* State agencies ** Tribes Nonprofits*** Salmon recovery lead entities
Mid-February to
May 1
In even-numbered years only
50%
YAF - Youth Athletic Facilities
Funding to buy land and develop or renovate outdoor athletic facilities
Local agenciesMid-February
to May 1
50%
076

16
NCLI - No Child Left Inside
Funding for outdoor environmental, ecological, agricultural, or other natural resource-based education and recreation programs serving youth
Public agencies, (cities, counties, special purpose districts) Native American tribes Non-profit organizations Formal school programs, Informal after school programs Community-based programs
November To
mid-January None
ALEA - Aquatic Lands Enhancement Account
Funding to buy, protect, and restore aquatic lands habitat and to provide public access to the waterfront
Local agencies* State agencies Tribes
Mid-February to
May 1
In even-numbered years only
50%
King County Parks Levy
On August 21, 2007, the voters of King County approved Proposition 2, the Open Space and Trails Levy, a new $0.05, six-year, inflation adjusted property tax lid lift to expand park and recreation opportunities. One cent of the five-cent levy proceeds is to be distributed to cities in King County for specific purposes. The terms and conditions for receiving and expending levy funds are governed by a contract between each city and King County. Ordinance 15760 defines the projects eligible for Prop 2 funds as follows: "'City projects' means the acquisition of open space and natural lands, and the acquisition and development of county regional trails or city trails that are regional in nature and may specifically include local trails in underserved areas linking to city or county trails that connect to regional trails."
On August 6, 2013, King County voters approved Proposition No. 1 Parks Levy that authorized an additional six-year property tax levy with 7% of proceeds, net an administrative fee, to be used for repairing, replacing, and improving local parks and trails in King County’s cities. The City shall only use the transferred City Proceeds for its City Projects.
The table below shows the funding received and projects that benefited from the funding.
077

17
2008-2013
&
2014-2019
KC Parks
Levy
Amount
Received
by
Shoreline Projects
2008 100,983
2009 105,719
2010 104,908
2011 108,766
2012 108,542
2013 107,410
2014 114,100
2015 116,807
2016 120,428
2017 124,162
2018 120,000
Park at Town Center
Echo Lake Park Improvement
Regional Trail Signage
Saltwater Park Pedestrian Bridge Major Repair
Park Ecological Restoration Program
078

18
Philanthropy
Shoreline PRCS has not benefitted greatly from philanthropic gifts. Other than our donated bench program there is no formal outreach or mechanism for people to contribute to park improvements. The most recent example was the development of the Veteran’s Recognition Plaza led by the Shoreline Veteran’s Association. Some local governments have assisted with the development of park foundations whose purpose is to raise funds for supporting the development of the community’s parks and open space system.
General Obligation Bonds
These would be general obligation bonds, either limited tax general obligation - also called councilmanic bonds - which may be issued by a vote of the city council or unlimited general obligation bonds, which must be approved by 60 percent of the voters, with a voter turnout that is at least 40 percent of those voting in the most recent general election.
General Obligation Bonds provide funds for capital projects that can be either for repair of existing city facility or construction of a new facility. The Bonds must be repaid with interest like a mortgage on someone’s home. The city must have a revenue stream to pay back the bonds such as property tax revenue.
Staff have developed a excel-based tool to assist with analyzing the impacts of general obligation bonds. This tool has been used by the PFAC as one component for developing its recommendations.
079

19
080

20
Funding Scenario
PROS Plan Implementation Funding Demands Chapter 6 of the PROS Plan identifies the need for a new Community and Aquatics Center and provides a
list of property acquisition and development projects. Updated estimates for implementing those
projects is presented in the tables below. As cost estimates are refined and the Park Funding Advisory
Committee prioritizes projects the funding needs list can be updated with different possible phasing
options.
Proposed Community and Aquatics Center
Full Implementation
Six Year Need
Site Acquisition $19,000,000 $19,000,000
Development $60,800,000 $60,800,000
Total $79,800,000 $79,800,000
Park and Open Space Acquisition/Development $47,500,000 TBD
Park Development $86,222,000 TBD
Total 213,522,000 TBD
Potential Revenues
30-year Estimate
(6-year est. times 5)
Six-year Estimate
Park Impact Fees (PIF) $15,660,000 $3,132,000
Conservation Futures Tax (CFT) $5,000,000 $1,000,000
Recreation & Conservation Office (RCO) $15,000,000 $3,000,000
TBD
TOTAL $35,660,000 $7,132,000
Unfunded
TOTAL $177,862,000 TBD
Park Funding Advisory Committee Background The Park Funding Advisory Committee has been working diligently to prepare recommendations for the
City Manager. An update on the work of the PFAC will be presented at the Retreat.
081
21
Additional Information. www.Shorelinewa.gov/pfac
Agenda’s notes and background materials for the Park Funding Advisory Committee
PROS Plan Implementation Funding Strategy and presentation
Financing Options Presentation
082
22
Attachment B: Park Concept Design Summaries
083

23
Investment Opportunity # 1: Brugger’s
Bog Park
Category: Recreation Facility Opportunities
Full estimated cost = $4,633,000
Description Brugger’s Bog Park would be substantially upgraded to provide enhanced and added amenities. The playground in this park is substandard, located in relatively hidden place and is frequently flooded. The concept design relocates the active features closer to the front of the park along 25th Ave NE where they would be visible to the community. This Opportunity provides environmental stewardship in the interior of the Park along the stream and bog. It provides trails through the park connecting to Ballinger Way and a loop around the natural areas of the Park.
Options
Option A. Cost = $2,613,000
Relocate the playground, add multi-sport court, add picnic shelter, and reduce plantings and number of trails added.
PROJECTED O&M COSTS
FULL DEVELOPMENT = $29,000
OPTION A = $9,000
084

24
Investment Opportunity # 2: Briarcrest
Community Park (Hamlin Park)
Category: Recreation Facility Opportunities
Full estimated cost = $9,552,000
Description A new community park would be created to provide a community anchor for the Briarcrest neighborhood. The portion of Hamlin Park facing 25th Ave NE would be redeveloped with a mix of park amenities to be oriented towards the east and create a presence in the Briarcrest neighborhood. The concept design retains restrooms and trees, enhances one of the existing diamond fields, and adds an entry plaza, community garden, perimeter trail, picnic shelters, playground, open lawn, skate and/or fitness features along the trail, splash pad, amphitheater and public art.
Options
Option A. Cost = $6,641,000
Splash pad, playground, picnic shelter, lesser landscaping improvements, improvements to entrance from 25th, small community garden, perimeter path, minor landscape improvement.
Option B. Cost = $3,892,000
Splash pad, smaller playground, picnic shelter, minor landscaping improvements, improvements to entrance from 25th, minor landscape improvement.
PROJECTED O&M COSTS
FULL DEVELOPMENT = $44,000
OPTION A = $30,000
OPTIN B = $28,000
085

25
Investment Opportunity # 3: Hamlin Park –
North
Category: Recreation Facility Opportunities
Full estimated cost = $3,980,000
Description The Concept Design would create a full adventure playground with extensive paths, boardwalk, and parking improvements.
Options
Option A. Cost = $1,025,000
Smaller adventure playground, benches, path improvements.
PROJECTED O&M COSTS
FULL DEVELOPMENT = $13,000
OPTION A = $6,000
086

26
Investment Opportunity # 4: Hillwood Park
Category: Recreation Facility Opportunities
Full estimated cost = $13,941,000
Description Hillwood Park would remain in the same basic configuration but with added amenities. The environmental restoration area would remain in place. The concept design adds a Splash Pad, multi-sport court, replacement playground, two picnic shelters, benches, picnic tables, restroom replacement, landscape improvements, perimeter path, enhanced landscaping, rain garden, public art, renovated ballfield/open lawn and improved entrance from 3rd Ave NW.
Options
Option A. Cost = $10,327,000
Splash Pad, multi-sport court, replacement playground, picnic shelters, benches, picnic tables, restroom replacement, landscape improvements, perimeter path, enhanced landscaping, rain garden, public art, renovated ballfield/open lawn.
Option B. Cost = $4,199,000
Splash Pad, multi-sport court, replacement playground, picnic shelters, benches, picnic tables, restroom replacement, moderate landscape improvements.
PROJECTED O&M COSTS
FULL DEVELOPMENT = $46,000
OPTION A = $37,000
OPTION B = $34,000
087

27
Investment Opportunity # 5: James Keough
Park
Category: Recreation Facility Opportunities
Full estimated cost = $6,368,000
Description James Keough Park once had a multisport court and playground. Both have fallen into disrepair. The concept deign would restore both of those amenities as well as add new features including Off-leash area, community garden, natural play elements, public art restroom, perimeter trail, landscape improvements, picnic shelter, picnic tables restroom and parking.
Options
Option A. Cost = $5,579,000
Off-leash area, minor landscape improvements, parking improvements, partial perimeter trail, play area, picnic shelter, kids garden, picnic tables
Option B. Cost = $1,770,000
Play area, picnic shelter, kids garden, picnic tables.
PROJECTED O&M COSTS
FULL DEVELOPMENT = $47,000
OPTION A = $29,000
OPTION B = $11,000
088

28
Investment Opportunity # 6:
Park at Town Center
Category: Recreation Facility
Opportunities
Full estimated cost = $10,000,000 (not verified)
Description The Park at Town Center site is located between North 175th Street and North 185th Street, and Aurora Avenue North and Midvale Avenue North. The approximately five-acre project area includes parcels owned by the City of Shoreline, Seattle City Light (SCL). It is located across Midvale from the site of the proposed Community and Aquatics Center. The City adopted the Park at Town Center Master Plan in 2012. The Master Plan calls for public gathering places, a water feature, art plaza, formal and informal landscape areas. The adjacency of this park with the Community and Aquatics provides the opportunity to create civic center for Shoreline.
Option A. Cost = $3,000,000 Enhanced landscape areas, gathering places and art plaza.
PROJECTED O&M COSTS
FULL DEVELOPMENT = $41,000
OPTION A = $9,000
089

29
Investment Opportunity # 7: Richmond Highlands
Park
Category: Recreation Facility Opportunities
Full estimated cost = $9,907,000
Description Perimeter trail, landscape improvements, sensory trail, picnic shelters, picnic tables, ballfield renovation, site access improvements, ADA accessible play area, multi-sport court, picnic tables, community garden, streetscape and parking improvements, synthetic turf infield, extensive landscape improvements.
Options
Option A. Cost = $5,579,000
Perimeter trail, landscape improvements, sensory trail, picnic shelter, picnic tables, ballfield renovation, site access improvements, ADA accessible play area, multi-sport court, picnic tables.
Option B. Cost = $1,770,000
ADA accessible play area, multi-sport court, picnic tables. PROJECTED O&M COSTS
FULL DEVELOPMENT = $30,000
OPTION A = $9,000
OPTION B = $5,000
090

30
Investment Opportunity # 8: Ridgecrest
Park
Category: Recreation Facility Opportunities
Full estimated cost = $5,361,000
Description Ridgecrest Park would be substantially upgraded to provide enhanced and added amenities. The playground in this park been removed due to age and severe deterioration. A review of recent usage and demand determined that the existing diamond field is no longer needed. There is an outdoor handball court that, while unique gets relatively little use and would be replaced. The concept design provides for an off-leash area, perimeter trail, picnic shelter, playground, open lawn, multi-sport court, public restroom and public art. A new parking lot will be provided by Sound Transit. This park is adjacent to the proposed trail along the rail.
Options
Option A. Cost = $3,357,000
New playground, off-leash area, perimeter path, picnic table and shelter, benches, open lawn.
PROJECTED O&M COSTS
FULL DEVELOPMENT = $48,000
OPTION A = $27,000
091
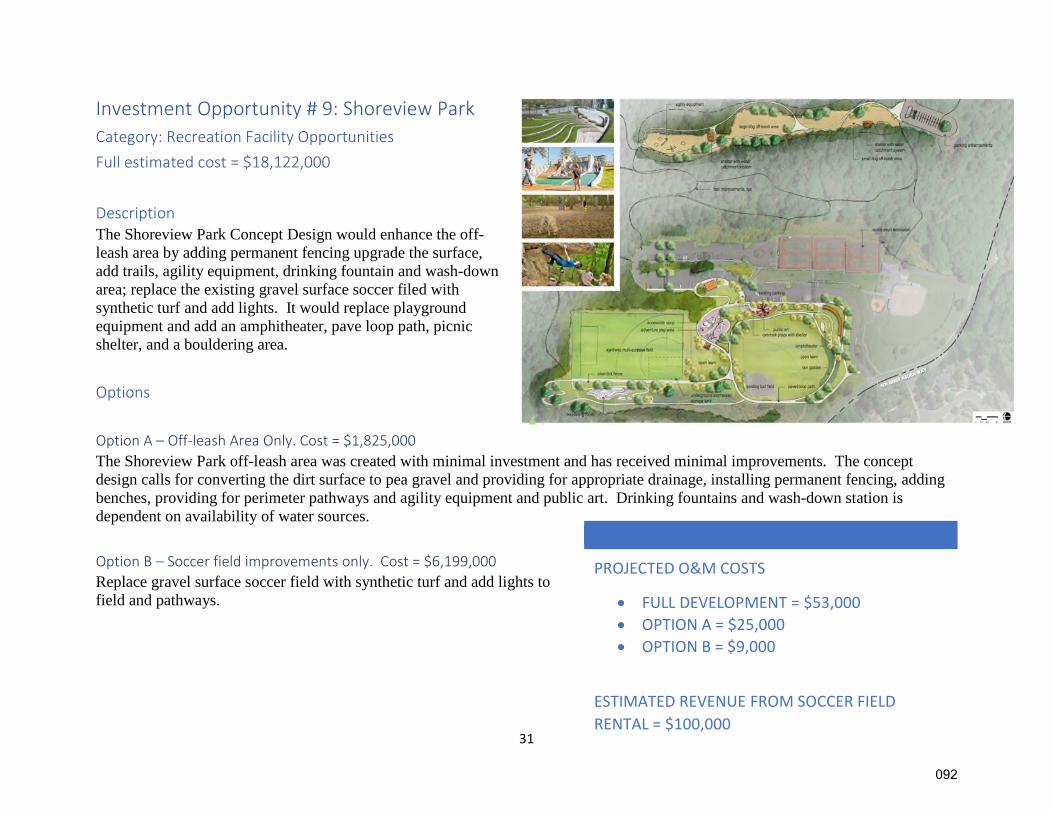
31
Investment Opportunity # 9: Shoreview Park
Category: Recreation Facility Opportunities
Full estimated cost = $18,122,000
Description The Shoreview Park Concept Design would enhance the off-leash area by adding permanent fencing upgrade the surface, add trails, agility equipment, drinking fountain and wash-down area; replace the existing gravel surface soccer filed with synthetic turf and add lights. It would replace playground equipment and add an amphitheater, pave loop path, picnic shelter, and a bouldering area.
Options
Option A – Off-leash Area Only. Cost = $1,825,000
The Shoreview Park off-leash area was created with minimal investment and has received minimal improvements. The concept design calls for converting the dirt surface to pea gravel and providing for appropriate drainage, installing permanent fencing, adding benches, providing for perimeter pathways and agility equipment and public art. Drinking fountains and wash-down station is dependent on availability of water sources.
Option B – Soccer field improvements only. Cost = $6,199,000
Replace gravel surface soccer field with synthetic turf and add lights to field and pathways.
PROJECTED O&M COSTS
FULL DEVELOPMENT = $53,000
OPTION A = $25,000
OPTION B = $9,000
ESTIMATED REVENUE FROM SOCCER FIELD
RENTAL = $100,000
092

32
Investment Opportunity # 10: Westminster
Triangle
Category: Recreation Facility Opportunities
Full estimated cost = $3,630,000
Description Westminster Triangle Park would be redeveloped to become a more active park with interactive, playful art and sitting areas as a central feature. To make this a successful park, substantial improvements would be needed along the street frontage. Adding crosswalks, sidewalks, parking and making N150th St. one-way are all features of this design.
Options
Option A. Cost = $243,000
Install moderate size art sculpture to make this an interesting welcoming feature for Shoreline and point of interest for the neighborhood.
PROJECTED O&M COSTS
FULL DEVELOPMENT = $19,000
OPTION A = $1,000
093

Weighted
Score
Raw
Score
Highest to
Smallest
Highest to
Smallest
General Areas List Total
Weighted Total RawRaw Weighted Raw Weighted Raw Weighted Raw Weighted Raw Weighted Raw Weighted Raw Weighted Raw Weighted
Town Center Subarea 24 30 5 5 2 2 5 5 5 2.5 5 5 3 1.5 4 2 1 1
Aurora Av Mid (170th-160th St) 21.5 27 4 4 1 1 5 5 5 2.5 5 5 3 1.5 3 1.5 1 1
Richmond Highlands Park 21.5 26 3 3 1 1 4 4 3 1.5 4 4 1 0.5 5 2.5 5 5
Aurora Square CRA 20.5 27 1 1 2 2 5 5 5 2.5 5 5 3 1.5 5 2.5 1 1
Shoreline Center/Shoreline Park 20 25 1 1 2 2 5 5 3 1.5 4 4 2 1 5 2.5 3 3
Aurora Av North (205th-188th St) 19.5 25 2 2 1 1 5 5 5 2.5 5 5 3 1.5 3 1.5 1 1
Aurora Av South (160th-145th St) 19 25 1 1 1 1 5 5 5 2.5 5 5 3 1.5 4 2 1 1
Hamlin Park 18.5 24 1 1 1 1 3 3 5 2.5 3 3 1 0.5 5 2.5 5 5
185th Street Station Subarea
(excludes Shoreline Center)17.5 23 1 1 2 2 5 5 5 2.5 3 3 5 2.5 1 0.5 1 1
Fircrest Campus 17.5 23 1 1 1 1 3 3 5 2.5 4 4 1 0.5 5 2.5 3 3
145th Street Station Subarea 16.5 22 1 1 2 2 5 5 5 2.5 2 2 5 2.5 1 0.5 1 1
Shoreview Park 13.5 18 1 1 1 1 1 1 3 1.5 1 1 1 0.5 5 2.5 5 5
7. Ease of Land
Assembly
Large Sized Parcels/Least
owners = 5
Medium sized/Less
owners = 3
Small Parcels/Multiple
owners = 1
0.5
Draft General Areas Evaluation Tool/Rating System
8. Ownership
Parcel is City Owned = 5;
Other Publicly Owned =
3;
Non-Publicly Owned = 1
1
Distance from Interurban
or other trail < 0.25 mile =
5
< 0.5 mile = 4
< 0.75 mile = 3
< 1 mile = 2
+1 mile = 1
155th St, 185th St, or
195th St < 0.25 mile = 4
< 0.5 mile = 3
< 0.75 mile = 2
1
6. Visibility
Visually adjacent to I-5 /
light rail = 5
Visually adjacent to
arterial inersection = 3
Along an arterial = 1
0.5
3. Frequent Transit
Opportunties
Within 0.25 of
existing/planned
BRT/Light Rail = 5 0.5m
w/in BRT/LR = 4
w/in 0.25 mile of local
bus = 3 w/in
0.5 mile of Local bus = 2
Not along transit = 1
1
4. Vehicular
Accessibility
Highest Immediately
Adjacent Roadway
Classification
Highway/Principal
Arterials = 5
Minor Arterials = 4
Collector Arterials = 3
Local Streets = 1
0.5
5. Pedestrian/ Bike
Access
Weighted: 0.5=less important; 1=important
1. Central Location
Proximity from Town
Center Sub-Area
< 0.25 mile = 5
< 0.5 mile = 4
< 0.75 mile = 3
< 1 mile = 2
+1 mile = 1
1
2. City Development
Goals
Can the development
anchor commercial
growth Town Center
Subarea, Light Rail, CRA
1
Tath
ble 1: The evaluation of the potential pool location sites revealed the Town Center Sub Area, Aurora Avenue Mid (160th - 170th Streets), and Richmond Highlands Park as e three highest potential locations.
094
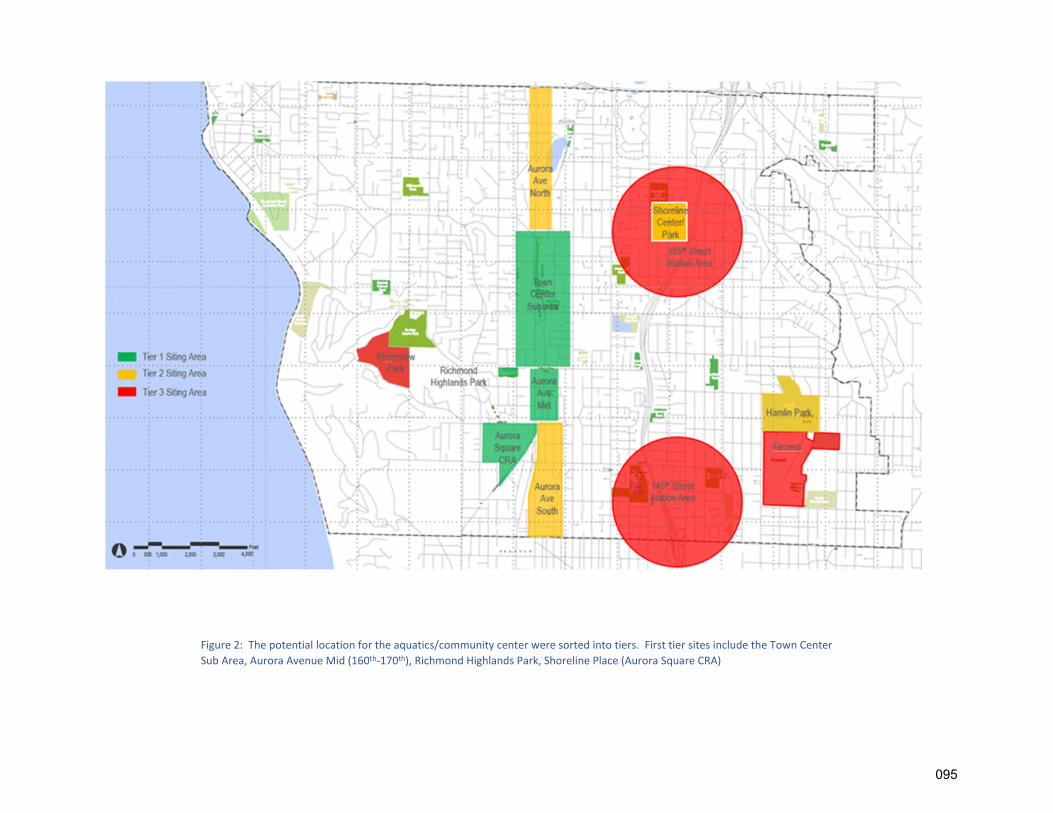
Fig
Su
ure 2: The potential location for the aquatics/community center were sorted into tiers. First tier sites include the Town Center
b Area, Aurora Avenue Mid (160th-170th), Richmond Highlands Park, Shoreline Place (Aurora Square CRA)
095

Timeline of Possible Levy/Sales Tax Votes
January 2017
Levy/Bond/Sales Tax Ballot Measures 2019 Rate 2014 2015 2016 2017 2018 2019 2020 2021 2022 2023 2024 2025 2026 2027 Comments
City of Shoreline Levy Lid Lift $1.24/$1,000 AV
Possible Aquatic/Community Center
Bond Levy Not established
Sidewalk BondSales Tax 0.2% Sales Tax
Fire Department Fire Benefit Charge
Charge based on calculation depending
on use and square footage.
Fire Department Capital Bond $0.12/$1,000 AV Fire Dept total levy is $1.06/$1,000 AV
Sound Transit - ST3 $0.21/ $1,000 AV 25 Year Levy. Also includes a sales and use tax, motor-vehicle excise tax
I-976: $30 Car Tabs Limit Car Tabs to $30
KC Pudget Sound Emergency Radio $0.05/$1,000 AV
KC Best Start for Kids $0.11/$1,000 AV Annual Levy Increases Limited to 3% in the five succeeding years.
King County -Veterans and Human
Services Levy $0.09/$1,000 AV Rate increases annualy by 3.5% each year. Estiamted 2023 rate of $0.12/$1,000 AV
King County - Automated Fingerprinting $0.04/$1,000 AV
King County Land Conservation Initiative $0.03 /$1,000 AV
King County EMS $0.22/$1,000 AV Has not officially been placed on a 2019 ballot yet.
King County - Parks, Trails, and Open
Space Replacement Levy $0.13/$1,000 AV Will apper on August 2019 ballot. Estimated to be $0.16 to $0.19 per $1,000 AV.
King County Children/Family Justice
Center $0.04/$1,000 AV
School District - Replacement Levy for
Educational Programs, Maintenance, and
Operations $1.50/$1,000 AV 2018 Rate: $2.02/$1,000 AV
School District -Tech Levy $0.23/$1,000 AV
2018 Rate: $0.23/$1,000 AV
Estimated Rates per Ballot Measure: 2020=$0.21 / 2021=$0.19 / 2022 = $0.17
School District - Facilities Bond $2.43/$1,000 AV 2018 Rate: $1.56/$1,000 AV
KC Library (Capital Bond) $0.04/$1,000 AV
Per Nicholas Lee email to Sara Lane on 2/14/19, Library will be making decisions regarding
furture funding strategies in 2020.
Possible KC Library Operating Levy Lid Lift
(Last one ended)
Not established (regular levy currently at
$0.33)
Per Nicholas Lee email to Sara Lane on 2/14/19, Library will be making decisions regarding
furture funding strategies in 2020.
Port of Seattle (regular levy) $0.12/$1,000 AV The Port is permitted to levy up to $0.45 per $1,000 AV for general purpose.
= Previous/Scheduled Vote
= Possible Renewal
= Possible Renewal with increase
096
Grant Raupp
Grant Raupp:8 year levy: http://www.kingcounty.gov/council/news/2015/March/PSERNballot.aspx

Memorandum
DATE: March 1, 2019
TO: City Council
FROM: Sara Lane, Administrative Services Director
RE: Reserve and Contingency Fund Policies
CC: Debbie Tarry, City Manager John Norris, Assistant City Manager Mark Gregg, Finance Manager Rick Kirkwood, Budget & Tax Manager Grant Raupp, Budget Analyst
As part of Council’s deliberations of the Proposed 2019-2020 Biennial Budget and the 2019-2024 Capital Improvement Plan, the City Council raised questions about the size and the “right size” of the City’s reserves. Council determined that this should be a topic for a future broader discussion during the Council Goal Setting Workshop. To provide framing for that discussion this memorandum reviews some of the recommended and best practices documented by the Governmental Finance Officers Association (GFOA) that speak to:
building of reserves to soften the landing during an economic pull back; the adequacy of unrestricted fund balance in the General Fund; and, communicating to the City Council and public any intended use of fund balance
that exceed policy reserve requirements.
The City Council adopted the most recent iteration of the City’s Financial Policies along with the 2019-2020 Biennial Budget by Ordinance No. 841 (Attachment A). This memorandum includes options for Council’s consideration and staff’s recommendations on changes to the City’s current policies.
Background The City’s Financial Policies have provided overall guidance for financial practices related to budgeting, accounting and financial reporting, investments, fixed asset management, and purchasing since adoption of the 2001 budget. These policies support the City’s long-term financial sustainability goals.
The Reserve and Contingency Fund Policies are a component of the City’s Financial Policies. Adequate fund balance and reserve levels are a necessary component of the City’s overall financial management strategy and a key factor in external agencies’ measurement of the City’s financial strength.
097

Council Goal Setting Workshop Memo: Reserve and Contingency Fund Policies
In addition, the Financial Policies address three other important elements of a comprehensive fund balance policy:
1. Resources (fund-balance) greater than budget estimates in any fund shall be considered “one-time” resources and shall not be used to fund ongoing service delivery programs;
2. That all expenditures drawn from reserve accounts shall require prior Council approval unless previously authorized by the City Council for expenditure within the City’s biennial budget; and,
3. If reserves and/or fund balances fall below required levels as set by the policy, the City shall include within its biennial budget a plan to restore reserves and/or fund balance to the required levels.
Reserve and Contingency Fund Policies The City needs to maintain operating reserves and contingency funds for several purposes as discussed below:
A Buffer for Unexpected Economic Changes: GFOA recommends that reserves be established and available to soften the landing during an economic pull back and buy time for other financial recovery strategies to be implemented. This fiscal first aid treatment works best when it is guided by a fund balance policy that has been adopted by the City Council. A good policy will set forth the portion of unreserved fund balance that is available for fiscal first aid purposes (often termed “rainy day” or “budgetary stabilization” reserves), versus other purposes such as responding to extreme events like natural disasters.
The last major change to the City’s “rainy-day” reserve policy was adopted in 2007. This change replaced the “General Reserve Fund”, which had a legal cap on the amount of funds that could be accumulated, with the current “Revenue Stabilization Fund”, which sets aside reserves to provide a buffer for unexpected economic changes in order to cover revenue shortfalls during a recessionary period. The City’s Revenue Stabilization Fund provides the City the ability to respond to economic impacts or make budgetary adjustments necessary during a long-term economic downturn.
The adopted policy states that the Revenue Stabilization Fund should equal 30% of budgeted economically sensitive revenues. Economically sensitive revenues include sales tax, gambling tax, utility tax, business and occupation tax, investment interest, state-shared revenues, permit fees, and recreation fees. Current projections are that the Revenue Stabilization Fund balance will be $5.825 million at the end of 2020.
Managing the City’s Cash Flow Needs: In order to adequately manage the cash flows within the City’s General Fund the City maintains a Cash Flow Reserve as a component of the City’s Operating Reserves. The General Fund’s expenditures tend to occur on a relatively equal basis each month throughout the year. This is in contrast to revenues which tend to accrue on a less regular basis. While some revenues are received monthly (e.g., sales tax), many of the
098

Council Goal Setting Workshop Memo: Reserve and Contingency Fund Policies
substantial revenue sources are received quarterly (e.g., gambling tax, utility tax, business and occupation tax) or semi-annually (e.g., property tax). Cash Flow Reserves allow the City to manage cash flow and avoid borrowing monies and paying interest during times of the year when outflows are greater than inflows. The 2007 policy was based on analysis that was completed in 2005 and 2006. In reviewing the General Fund cash flow for 2005 and 2006 it appeared that the largest negative cash flow balance during the year was $2.5 million. This led to the establishment of the $3.0 million Cash Flow Reserve in 2007. The Cash Flow Reserve is not appropriated in the City’s budget.
Providing Flexibility to Pay Unexpected Expenditures or Insurance Deductibles: The City recognizes the need to budget for unanticipated operating costs. The last major change to the City’s policies adopted in 2007 accomplished this by requiring appropriation of:
a budget operating contingency calculated each year at 2% of budgeted operating revenues, and
an insurance deductible reserve appropriated each year at $255,000.
Appropriations in the 2019-2020 Biennial Budget for the Budget Operating Contingency and Insurance Deductible Reserve total $1.774 million and $0.510 million, respectively. The budget assumes that the Budget Operating Contingency and Insurance Deductible Reserve will be spent each year, thereby drawing down fund balance from a budgetary perspective. However, in practice the Budget Operating Contingency and Insurance Deductible Reserve are rarely used and lapse to fund balance at the end of the year. Essentially, the forecast for the 2020 ending fund balance will assume any unspent Budget Operating Contingency and Insurance Deductible Reserve appropriations for 2019 will not be spent in 2020 and will lapse into fund balance.
General Fund Reserves The 2019 beginning fund balance is estimated to total $13.2 million. Of that the amount required for the General Fund Operating Reserves (cash flow, budget contingency and insurance deductible) totals $4.145 million. The table below shows the estimated beginning fund balance and lays out the intended uses of fund balance that have been identified:
Committed for the General Fund Operating Reserve ($4.2 million comprised of $3.0 million for the Cash Flow Reserve and $1.145 million appropriated for the Budget Contingency and Insurance Reserve);
Assigned ($4.2 million appropriated in the 2019-2020 adopted budget) for one-time outlays and to provide resources to other funds (e.g., capital contributions); and,
Designated per the adopted budget ($4.0 million) for future improvements for the City’s Maintenance Facility.
099

Council Goal Setting Workshop Memo: Reserve and Contingency Fund Policies
Required by Policy
Estimated Actual
Estimated General Fund Beginning Fund Balance $13.234MLess Required General Fund Operating Reserves:
Cash Flow Reserve $3.000M $3.000MBudget (Operating) Contingency $0.890M $0.890MInsurance Reserve $0.255M $0.255M
Less Assigned for One-Time Outlays $4.234MLess Designated for City Maintenance Facility $4.000M Unassigned and Undesignated Beginning Fund Bal. $0.855M
It is important to note that the amount shown as Assigned for One-Time Outlays represents the use of fund balance to support high priority one-time needs discussed in detail in the adopted budget. For reference, these are the budgeted use of fund balance for this purpose:
Supplemental Request Category: AmountImplementation of Council Goals $0.437MCity Asset Maintenance $0.319MEfficiency & Effectiveness $0.785MTechnology Investments $0.403MContingency and Transfer to Revenue Stabilization Fund $0.916MCapital Support $1.374M
Total Assigned for One-Time Outlays $4.234M
What is the minimum amount of unrestricted fund balance that a government should maintain in the General Fund? Best PracticesGFOA’s publication What Everyone Needs to Know About the New Fund Balance notes that many governments express their desired level of unrestricted fund balance as a function of operating revenues or operating expenditures (whichever is less volatile).
As a general rule, unrestricted fund balance in the General Fund should represent no less than two months of operating revenues or operating expenditures (whichever is less volatile). A minimum of as little as 5 percent, however, may be appropriate for larger governments for two reasons. First, larger governments normally find it easier to predict contingencies than do smaller ones…Second, operating revenues and operating expenditures of larger governments often are more diversified and less volatile than those of the smaller counterparts.
GFOA’s best practice Fund Balance Guidelines for the General Fund recommends that the City consider its own unique circumstances when determining the adequacy of unrestricted fund balance in the General Fund. In addition to considering the factors related to the volatility of revenues, which the Revenue Stabilization Fund addresses, the
100

Council Goal Setting Workshop Memo: Reserve and Contingency Fund Policies
tables above illustrate the City also considers its exposure to significant one-time outlays (e.g., one-time supplemental requests) and potential drain upon General Fund resources from other funds if resources are not available in those other funds (e.g., General Fund contributions to deliver capital projects).
When the City is in a position with an amount of unrestricted fund balance over the formal policy reserve requirement, staff reviews whether or not these amounts reflect a structural trend. In the event they do, the City Manager will entertain proposals to address that issue. These priorities were articulated by the City Council in the 10-Year Financial Sustainability Plan, accepted by the City Council on June 16, 2014:
“…The City Council states that the City’s first priority is to ensure adequate reserves. If reserves are below policy levels, then (budget) surpluses should be used to restore reserves to mandated levels. If reserves meet or exceed policy requirements the surpluses should be used to fund economic development investment in Shoreline, fund infrastructure improvements, fund other high priority one-time needs or be held to fund future deficits if they are forecast in the Financial Sustainability Model. If it appears that surpluses are sustainable on a recurring basis, the City Council will review and consider funding for new on-going operational needs…”
A challenge noted in the Transmittal Letter of the 2019-2020 Proposed Biennial Budget and 2019-2024 Capital Improvement Plan (CIP) book is community support for projects and services beyond our current level of service. In November, voters decided they support an increase to the local sales and use tax rate to fund the City’s Sidewalk Program – primarily the construction of new sidewalks. The Parks Funding Advisory Committee is working to identify options for funding the Parks Recreation and Open Space Plan (PROS) adopted in 2017 with a focus around funding to replace and expand the City’s aquatics and community center and funding of park property acquisitions and improvements.
While both projects identified above have the ability to create dedicated revenue sources for these projects, the Capital Improvement Plan section of the budget identifies underfunded/unfunded needs in each of the capital funds. The Transmittal Letter highlighted the following significant areas with capital demand that are currently underfunded:
Transportation: Several transportation improvement projects located along N. 145th Street, N. 175th Street, N. 160th Street, N. 185th Street, and Westminster Way N. & N. 155th Street are not fully funded. While the 2019-2024 CIP makes significant investment in the City’s transportation system and takes advantage of granting opportunities, the need still outpaces the available resources.
Facilities Repair and Maintenance: In 2017, staff began the work of creating a long-range facilities repair and maintenance plan. The plan will be completed in 2019-2020 but clearly indicates the current level of deferred maintenance in the City’s facilities is grossly underfunded.
101

Council Goal Setting Workshop Memo: Reserve and Contingency Fund Policies
City Maintenance Facility: The City Maintenance Facility (CMF) Analysis will evaluate improvements required to utilize existing City facilities for long-term maintenance operations and prepare cost estimates and conceptual layouts for alternatives. A preferred alternative and implementation plan will be developed. While the City has $4 million designated to support planning, design and early phases, the full cost of this facility is significantly larger than this amount and additional funding will be needed to move to the construction phase.
Staff’s Recommendation GFOA’s best practice Fund Balance Guidelines for the General Fund suggests that governments may deem it appropriate to exclude from consideration resources that have been committed or assigned to some other purpose and focus on unassigned/undesignated fund balance. The unassigned/undesignated fund balance, available to fund high priority one time needs, at the end of the biennium is forecast to total $0.9 million.
Since one of the main priorities of Reserve and Contingency Fund Policies is to reserve an amount necessary to manage cash flow, staff believes it would be appropriate to evaluate the $3.0 million Cash Flow Reserve as a percentage of forecast annual recurring General Fund revenues (annual revenues less one-time sources such as grants). For the next biennium this reserve equals more than 6% of the recurring revenues. Throughout the next four biennia these reserves equal more than 5%.
Staff could also consider the sum of the amounts committed for the Cash Flow Reserve and Unassigned, which equals $3.9 million, or 8.6%, of the recurring revenues budgeted in 2020. Staff recommends that these formulae be used to comply with the biennial review of the amount required to comply with the Cash Flow Reserve policy.
2020 Recurring General Fund Revenues $45.007MAs a % of Recurring Revenues:
Cash Flow Reserve ($3.0 million) 6.7%Unassigned 1.9%
Cash Flow Reserve ($3.0 million) + Unassigned
8.6%
Staff recommends that the City Council direct staff to revise the Reserve and Contingency Fund Policies as reflected in Attachment B and present them for adoption by motion during the mid-biennium review of the 2019-2020 Biennial Budget.
6.8% 6.7% 6.6% 6.4% 6.3% 6.2% 6.1% 6.0% 5.9% 5.8%
5.0%
6.0%
7.0%
2019 2020 2021 2022 2023 2024 2025 2026 2027 2028
CASH FLOW RESERVE AS A
PERCENTAGE OF RECURRING REVENUES
102

Council Goal Setting Workshop Memo: Reserve and Contingency Fund Policies
Attachments
Attachment A: Adopted Reserve and Contingency Fund Policies Attachment B: Proposed Reserve and Contingency Fund Policies
103

Attachment A: Adopted Reserve and Contingency Fund Policies
RESERVE AND CONTINGENCY FUND POLICIES
Adequate fund balance and reserve levels are a necessary component of the City’s overall financial management strategy and a key factor in external agencies’ measurement of the City’s financial strength.
Maintenance of fund balance for each accounting fund assures adequate resources for cash flow and to mitigate short-term effects of revenue shortages. Reserve funds are necessary to enable the City to deal with unforeseen emergencies or changes in condition.
A. General Policy The City shall maintain reserves required by law, ordinance and/or bond covenants.
All expenditures drawn from reserve accounts shall require prior Council approval unless previously authorized by the City Council for expenditure within the City’s biennial budget.
If reserves and/or fund balances fall below required levels as set by this policy, the City shall include within its biennial budget a plan to restore reserves and/or fund balance to the required levels.
All reserves will be presented in the City’s biennial budget.
B. Revenue Stabilization Fund The City will establish a Revenue Stabilization Fund and shall accumulate a reserve equal to thirty percent (30%) of annual economically sensitive revenues within the City’s operating budget to cover revenue shortfalls resulting from unexpected economic changes or recessionary periods.
C. General Fund Operating Reserves The City shall maintain a General Fund Operating Reserve to provide for adequate cash flow, budget contingencies, and insurance reserves. The General Fund Operating Reserves will be determined as follows:
1. Cash Flow Reserve: The City shall maintain a cash flow reserve within the General Fund in an amount equal to $3,000,000. This is approximately equal to 1.5 months of operating expenditures. The City will review biennially the required cash flow reserve level that is necessary to meet the City’s cash flow needs. If it is determined that $3,000,000 is not adequate, the Finance Director shall propose an amendment to these policies.
2. Budget Contingency: The City shall maintain a budget contingency reserve within the General Fund equal to 2% of budgeted operating revenues.
104

Attachment A: Adopted Reserve and Contingency Fund Policies
3. Insurance Deductible Reserve: The City shall maintain an insurance reserve within the General Fund to be used for potential substantial events that cause damage to the City’s fixed assets and/or infrastructure.
105

Attachment B: Proposed Reserve and Contingency Fund Policies
RESERVE AND CONTINGENCY FUND POLICIES
Adequate fund balance and reserve levels are a necessary component of the City’s overall financial management strategy and a key factor in external agencies’ measurement of the City’s financial strength.
Maintenance of fund balance for each accounting fund assures adequate resources for cash flow and to mitigate short-term effects of revenue shortages. Reserve funds are necessary to enable the City to deal with unforeseen emergencies or changes in condition.
D. General Policy The City shall maintain reserves required by law, ordinance and/or bond covenants.
All expenditures drawn from reserve accounts shall require prior Council approval unless previously authorized by the City Council for expenditure within the City’s biennial budget.
If reserves and/or fund balances fall below required levels as set by this policy, the City shall include within its biennial budget a plan to restore reserves and/or fund balance to the required levels.
All reserves will be presented in the City’s biennial budget.
E. Revenue Stabilization Fund The City will establish a Revenue Stabilization Fund and shall accumulate a reserve equal to thirty percent (30%) of annual economically sensitive revenues within the City’s operating budget to cover revenue shortfalls resulting from unexpected economic changes or recessionary periods.
F. General Fund Operating Reserves The City shall maintain a General Fund Operating Reserve to provide for adequate cash flow, budget contingencies, and insurance reserves. The General Fund Operating Reserves will be determined as follows:
4. Cash Flow Reserve: The City shall maintain a cash flow reserve within the General Fund in an amount equal to $3,000,000. This is approximately equal to 1.5 months of operating expenditures. but no less than 5 percent of the recurring revenues budgeted in the General Fund. The City will review biennially the required cash flow reserve level that is necessary to meet the City’s cash flow needs. If it is determined that $3,000,000 is not adequate, the FinanceAdministrative Services Director shall propose an amendment to these policies increase to an appropriate amount to be committed for this purpose in the next biennium.
106

Attachment B: Proposed Reserve and Contingency Fund Policies
5. Budget Contingency: The City shall maintain a budget contingency reserve within the General Fund equal to 2% of budgeted operating revenues.
6. Insurance Deductible Reserve: The City shall maintain an insurance reserve within the General Fund to be used for potential substantial events that cause damage to the City’s fixed assets and/or infrastructure.
107

Car, Bike/E-Bike, and Scooter Share Policies and Regulations City Council Strategic Planning Workshop, March 1 and 2, 2019
Discussion question: What opportunities and challenges exist for the City to support “Shared Use Mobility” companies within Shoreline?
Background: The City Council requested staff to outline the opportunities and challenges for the City to support the operations of one or more companies, such as Lime (bike/e-bike), Jump (e-bike), car2go (car), Zipcar (car) or ReachNow (car), that provide shared use car, bike and/or scooter services within City limits. These services are part of a growing sector of transportation services often referred to as “Shared Use Mobility.” Currently the City does not officially support or regulate any of these types of services. However, Lime, Jump, car2go, Zipcar and ReachNow are located in the City of Seattle and in a few other cities in Washington State.
What is Shared Use Mobility? As noted above, Lime, Jump, car2go and ReachNow are examples of what is called in the transportation industry a “Shared Use Mobility” service. Shared Use Mobility can be defined as a transportation service(s) and resource that is shared among users, either concurrently or one after another. This includes public transit; taxis; bike sharing; car sharing; ridesharing (i.e., non-commercial services like carpooling and vanpooling); ride sourcing; scooter sharing (now often grouped with bike sharing under the heading of “micro mobility”); shuttle services; “micro transit”; and more.
Why Should it be of Interest to the City of Shoreline? Shifting travel trends and new technologies are changing the way people use Shoreline’s right-of-way. The City’s biennial resident satisfaction survey presents strong and growing support for alternatives to driving. Moreover, the City’s recent upzoning in the light rail station subareas will accelerate the need for a more flexible, multimodal system that reduces the need for parking and minimizes impacts on the City’s infrastructure. National user data demonstrates an increased demand for shared use services as it reduces traffic congestion, mitigates various forms of pollution, reduces transportation costs, and provides convenient mobility for those who cannot afford to buy and maintain a vehicle. Shared use services also create accessible mobility options for those with limited physical ability.
What are the Perceived Risks of Supporting Shared Use Mobility? Potential risks and concerns to the City of the shared use mobility options include equipment vandalism and disruptive uses of the City right-of-way (e.g. stacking a group bikes into a pyramid on a sidewalk), user safety (e.g. riders choosing not to wear bike helmets and vandals cutting bike brake lines) and the safety of others in proximity to its operations, equitable low-income access, protection of user data privacy, data sharing with the City and administration and enforcement costs.
Considerations: Before allowing one or more shared use mobility services to operate in the City, staff would recommend the City develop a workplan identifying how to evaluate and implement one or more shared use mobility services. This workplan would include an evaluation of the operation, administration,
108

maintenance, and enforcement costs of a service’s implementation, as well as the what applicable policies, plans, programs, and codes the City would need to create or modify to support the desired services. The evaluation of potential services would also likely include a stakeholder engagement element. City codes (a preliminary list is found below) would need to be reviewed and potentially updated to support the evaluation of one or more services.
Staff is seeking guidance on whether Council is interested in having staff develop a workplan to further evaluate and potentially implement one or more shared use programs in the city. Depending on the ultimate scope of a Share Use Mobility Workplan, the evaluation and implementation of one or more shared use mobility services would take approximately six to twelve months. This effort would require approximately a quarter of a senior to management level staff position as well as technical support from a consultant knowledgeable of these types of service programs. This effort is not currently included in the Transportation Division’s workplan for 2019 or 2020, which are at capacity.
With additional resources, the development and implementation of a Share Use Mobility Workplan could be initiated in 2020. However, if Council desired conducting this effort in 2019, it could be accomplished with substantial consultant support and some rebalancing and potential reprioritization of staff work assignments. The work assignment restructuring in 2019 could include reallocating resources that would go to supporting regional transportation planning meetings and slowing down the 185th
corridor study for a revised completion from the fall of 2019 to 2020. These actions would reduce our ability to pursue collaborative planning work with our regional partners and limit our ability to compete for grant funding on transportation projects as well as reduce our presence and leadership in regional planning efforts.
Additional Information – City of Seattle More information about the City of Seattle’s approach to shared use mobility (New Mobility Playbook) and regulations for Shared Use Mobility services can be found at the following links:
https://www.seattle.gov/Documents/Departments/SDOT/NewMobilityProgram/NewMobility_Playbook_9.2017.pdf
http://www.seattle.gov/transportation/projects-and-programs/programs/bike-program/bike-share
https://www.seattle.gov/transportation/projects-and-programs/programs/parking-program/parking-regulations/car-sharing-and-parking-regulations
Applicable sections of the Shoreline Municipal Code
As part of the proposed Shared Use Mobility Workplan, the following sections of the municipal code
(potentially among others) would need to be reviewed for potential updates that support desired
Shared Use Mobility services by the City:
Title 5. Business Licenses and Regulations
Title 8. Health and Safety
Title 9. Public Peace, Morals and Welfare
Title 10. Vehicles and Traffic (10.07 Motorized Foot Scooters and Similar Devices; 10.20 Speed Limits)
Title 12. Streets, Sidewalks and Public Places (12.15 Use of Right-of-Way for City permitted or
contracted operations)
Title 20. Development Code (20.30.750 Junk vehicles a public nuisance; 20.40 Zoning and Use
Provisions)
109

Neighborhood Commercial Center Development and Activation City Council Strategic Planning Workshop, March 1 and 2, 2019
Discussion question: Should the City explore new ways to increase Economic Development activity in
Neighborhood Commercial Centers?
Background:
The City’s 2018-2023 Economic Development Strategic Plan
outlines efforts to create identity, encourage walkability,
expand housing options, and provide needed goods and
services in six Neighborhood Commercial Centers. There is no
current policy directing funding to Neighborhood Commercial
Centers nor is there a dedicated source of funding if there was
policy direction to do so.
Traditionally the City’s primary role is funding and
constructing infrastructure improvements. For example, the
City supported the revitalization of North City Neighborhood
Commercial Center from 2003 to 2004. Capital Improvement
Plan dollars totaling $5.96 million were dedicated to
revitalizing the North City commercial district as well as re-
channelizing and improving pedestrian safety along the entire
15th Ave NE Corridor. Private investments that have followed
included the $19-million Polaris Apartments and the $9.2-million Ara
Monka Brewing Company opened in 2018 in a former spay-and-neut
and there has been other commercial investments such as Easy Mon
and Costello’s. Under construction now are the $11.8-million Arabe
Co./Katerra project, which will add to the vibrancy of this developing
The City’s recent passage of Proposition No. 1 to fund new sidewalks
Sidewalk Rehabilitation Program currently do not prioritize projects
centers over other community areas.
Hanging baskets, bicycle racks, benches, and other “off the shelf” str
relatively little design and capital expense, and then turned over to a
manage through an association or Local/Business Improvement Dist
operational costs that come with these types of investments and it i
stopped providing watering and management of hanging baskets in
there were a willingness on the part of commercial business district
management of investments, there may yet be opportunities for suc
Ne
No
ec
ne
ighborhood Commercial Centers:
des that can influence the
onomic vitality of the surrounding
ighborhoods.
North City Business District
Downtown Ridgecrest
Shoreline Town Center
Echo Lake at Aurora & N
192nd
Four Corners at NW
Richmond Beach Rd
Ballinger Commercial
Center
bella Apartments. Locally-owned
er clinic on 15th just south of 175th
key Tap House, Vanity Hair Studio,
lla 2, and the $34.5-million Wolff
urban village.
and the implementation of the
in neighborhood commercial
eet furniture can be installed with
renewed business community to
rict. There are maintenance and
s for that reason that the City
North City years ago. However, if
stakeholders to partner in costs and
h improvements in the future.
110

Next Step Resource Needs:
If Council would like to pursue this further, staff would anticipate resources devoted to:
1. Explore infrastructure investment as a tool for Neighborhood Commercial Center Development
and Activation and other options the Council may like staff to investigate, such as business
recruitment and retention programs
2. Identify appropriate funding mechanisms for capital investments and maintenance including
some or all of the following:
a. A targeted infrastructure investment program of City funding sources such as existing
capital funds and grants
b. Combine Neighborhood Commercial Center goals with other programs
c. Local/Business Improvement Districts
d. Other
111

Requiring 1st Floor Commercial Occupancy in Mixed Use Development City Council Strategic Planning Workshop, March 1 and 2, 2019
Discussion question: Should the ground floor of new developments constructed in commercial zones be
required to be occupied by commercial uses?
Background:
The City does not require commercial occupancy of the first floor in mixed use development. The City
does require per SMC Subchapter 4 Commercial Zone Design 20.50.240(C)(1)(c): “Minimum space
dimension for building interiors that are ground-level and fronting on streets shall be 12-foot height and
20-foot depth and built to commercial building code. These spaces may be used for any permitted land
use. This requirement does not apply when developing a residential only building in the MUR-35' and
MUR-45' zones”.
SMC Subchapter 4 applies to development in the neighborhood business (NB), community business (CB),
mixed business (MB) and town center (TC-1, 2 and 3), the MUR-45', and MUR-70' zones and the MUR-
35' zone when located on an arterial street. These zones are considered the City’s “commercial zones”.
The purpose of this requirement is to create the space for commercial uses but allowing the property
owner to determine when the market can support the commercial use.
Some Cities require commercial uses on the ground floor in commercial zones. Based on observations
over time and confirmation from developers, staff concluded that these commercial spaces are difficult
to lease and can remain vacant for years. When they do become leased, they are rarely occupied by the
types of development residents envision such as quaint coffee shops, restaurants/public houses,
boutiques or book stores. Developers have commented to staff, and to Council as part of previous Goal
Setting Workshop panels, that they appreciate the City’s approach to creating space for commercial uses
in commercial cores while relying on the market and the property owner’s discretion to determine when
the commercial use should be activated.
From the small business owner’s perspective, we have heard that the cost to lease new commercial
space can be too expensive when compared to leasing an older space. The new commercial spaces are
also typically left unfinished to allow for initial customization and require an investment for the tenant
to improve the space prior to its use. Older spaces also may require tenant improvements to
accommodate a use, but sometimes improvements are minor (ex. paint, lighting and a sign).
The City previously required ground floor retail/commercial uses in the North City Plan and Ridgecrest
Planned Area. In 2013, the Planning Commission and City Council discussed whether to require ground
floor retail/commercial uses in all commercial zones as part of a project authorized by the City Council to
consolidate the City’s commercial zones and standards to improve and simplify the Code. The Town
Center Subarea Plan included the standard we use today.
112

Considerations:
If the Council would like to pursue this issue/concept further staff would anticipate devoted resources
to:
1) Identify jurisdictions in the Puget Sound area that are requiring the ground floor/street level
floor of development in commercial zones to be occupied with commercial uses. A cursory look
confirmed that Kirkland, Redmond and Mercer Island require ground floor commercial uses in
defined areas. Contact these jurisdictions to discuss the success of this provision and to obtain
data, if available regarding leasing of the spaces;
2) Solicit feedback from the Developer Stakeholder Group and other commercial/multi-family
developer contacts about the possibility of Shoreline requiring occupancy of the ground
floor/street level floor with commercial uses in commercial zones.
3) Contact commercial leasing agents especially those people working in Shoreline and other
similarly sized areas to learn more about leasing commercial spaces in mixed use buildings.
4) Verify that the current standard of requiring twelve (12) foot ceilings for a 20-foot depth on the
portion of commercial buildings’ fronting on streets is sufficient to support the future
commercial uses envisioned.
113

Diversity and Inclusion Commission City Council Strategic Planning Workshop, March 1 and 2, 2019
Overview:
Several local cities have adopted various types of commissions and advisory groups to gather input and
build relationships with diverse communities. In a brief review of Bellevue, Edmonds, Kent, Lynnwood,
Renton, and Seattle, there is a wide range in the purpose, structure, and resources available (both staff
support and budget). Some are less formal, some are more prescribed, and all have different scopes.
Purpose:
The general purpose of diversity commissions is to provide input and advice to the mayor, city councils,
and city departments, on how to serve diverse communities. Some commissions are asked to actively
support public engagement opportunities and facilitate relationship building with underserved and
underrepresented communities. Others are focused primarily on influencing city policies and
discouraged from planning events. The overall community impact is to promote an environment that is
welcoming, inclusive, and supports diversity.
Structure:
Most cities have established commissions with a city ordinance and adopted by-laws. The City of
Renton is an exception with the Mayor’s office overseeing three task forces related to diversity. One is
specifically on building positive relationships between law enforcement and African American
communities and another is focused on Latino communities. The City of Bellevue’s Diversity Advisory
Network (BDAN) is under the city manager’s office and is described as a “community-led organization”.
Most commission members are volunteers appointed by the mayor and/or city council and are
representatives of diverse resident populations. Group size ranges from seven to 23 members, serving
one-, two-, or three-year terms, and may or may not include term limits. Some include one or two
youth representatives. Most groups require participation on subcommittees or ad hoc committees.
Eligibility requirements may include being a city resident, or working in the city, or seen as a “well-
respected” member of the community.
Organizational Support:
Most groups are housed in the mayor’s or city manager’s office and staffed by either city staff or
consultants. The City of Edmonds’ commission is under the Economic Development and Community
Services department and the Seattle Immigrant and Refugee Commission is under the City of Seattle’s
Office of Immigrant and Refugee Affairs. Staffing support ranges from 10 hours per week to 10 hours
per month, or more, depending on the activity in a given month. The variance may be more of a
reflection of limited resources, rather than need. In the last budget process, Lynnwood’s commission
requested the addition of a 1.0FTE staff member to oversee the commission and the city’s diversity,
equity, and inclusion work, but it was not filled.
114

Budget:
Some cities have a small dedicated budget for the commission ($5,000-$7,000) to fund the commission-
sponsored events and activities, but most commission funding is incorporated in the department’s
overall budget that provides oversight.
Considerations:
There is a clear need for cities to increase their capacity to build relationships and serve diverse
communities in more inclusive and equitable ways. In exploring commissions, it would be important to
understand what are the goals and desired outcomes; what resources and expertise are needed to
accomplish these goals; and how will the commission be supported to be successful.
115

Environmental Sustainability Workplan City Council Strategic Planning Workshop, March 1 and 2, 2019
Discussion question: Is there additional policy direction that the City Council would like staff to consider
in developing the City’s Environmental Sustainability Workplan for the next three to five-year period?
Background:
The City is committed to being a sustainable city in all respects. This is reflected in the community's long-term vision - Vision 2029 - which includes supporting:
Sustainable neighborhoods - ensuring they are safe and attractive; Sustainable environment - preserving our environmental assets and enhancing our built
environment so that it is protects our natural resources; and Sustainable services - supporting quality services, facilities and infrastructure.
Environmental Sustainability Strategy The City's Environmental Sustainability Strategy outlines how the City will meet its Sustainability goals. This Strategy was developed and adopted by the City Council in 2008 in response to a 2007-2008 Council Goal. The plan defines sustainability as “meeting the needs of the present without compromising the ability of future generations to meet their own needs, while working to regenerate and restore the environment where it has been damaged by past practices."
Climate Protection The Climate Action Plan, which was adopted by Council in 2013, includes a summary of Shoreline's 2012 Greenhouse Gas Emissions Inventory, as well as an action plan highlighting how residents, businesses, and the City can help address climate change. Through adoption of the Climate Action Plan (CAP), the City committed to reducing emissions 50% by 2030 and 80% by 2050. To better understand how to accomplish this goal, the City worked with Climate Solutions to develop a Carbon Wedge Analysis. The City actively participates in the King County-Cities Climate Collaboration (K4C) to protect the climate throughout King County.
In late 2017 the City Council received an update on the implementation status of the various recommendations within the CAP. At that time, 78% of the recommendations were either complete, in process, or on-going. Only 22%, or ten recommendations, had not been addressed in some manner. Of those ten remaining recommendations, two were in reference to policies that could be implemented once the City acquired the SPU water system in Shoreline. Given that this acquisition has not moved forward it is unlikely that those two recommendations would be implemented, leaving eight remaining recommendations.
Staffing Changes The City’s Environmental Services Analyst retired in 2018. Before refilling this position, the City Manager requested the Public Works Director and the Planning & Community Development Director to review how environmental services, sustainability, and climate action initiatives have been delivered historically and if there were opportunities to improve the City’s processes. This review resulted in the City Manager initiating the following changes:
116

Environmental Services will become part of the Community Services Division. Historically Environmental Services was part of the Surface Water Utility division, even though much of the work was broader and more expansive than environmental issues associated with surface water.
Retitled the Environmental Services Analyst to Environmental Services Coordinator and clarified roles and responsibilities for the Coordinator to work across department lines addressing city-wide sustainability projects/policies and serving as Project Manager for the City’s Climate Protection and Environmental Sustainailbity strategies. This position will continue to have primary responsiblity for implementation of the City’s solid waste contract.
Clarified roles and responsibilities for the Environmental Program Specialist in this position’s support of surface water and environmental activies.
Increased s hours to a total of 1.2 to 1.4 FTE from 1.0 FTE to implement the City’s Climate Protection and Environmental Sustainability strategies, including implementation of the City’s solid waste contract.
Staff anticipates filling the Environmental Services Coordinator position by early March.
Status of 2018-2020 Priority Recommendations Council Goal 2, Action Step No. 4 states: “Implement the 2018-2020 Priority Environmental Strategies including achievement of citywide Salmon-Safe certification, consideration of expanding green building mandates and appointment of a stakeholder committee to evaluate and develop a recommendation on the implementation of recommendations from the Climate Action Analysis for the 185th Street Station Subarea.”
Salmon Safe Certification: Miranda Redinger has served as the Project Manager for Salmon Safe certification. Staff will provide Council with an update on the status of this project on April 1, 2019. It is likely that Salmon Safe will provide the City with a “conditional” certification for a five year period during which time the City agrees to address certain policy and practices to meet the conditions of certification, which will likely result in additional workplan items. In the future, a project such as this would be managed by the Environmental Services Coordinator, with cross-departmental participation.
Green Building Mandates: The Council is scheduled to adopt Ordinance No. 832, Amending the Development Code for the Expansion of Deep Green Incentive Program on March 25, 2019.
Climate Action Analysis for the 185th Street Station Subarea: This work item has not been programmed at this time. This could be an item considered for 2020/2021, once the Environmental Services Coordinator is fully on-board, if it reflects the Council’s priorities. During Council’s last discussion regarding this item, in late 2017, this work would include convening a task force to make recommendations about the five (5) strategies included in the Analysis:
1. No Use of Combustion or Natural Gas Heating in New Buildings 2. Increased Energy Efficiency in New Buildings 3. Retrofit Existing Buildings for Greater Energy Efficiency and to Fuel-Switch from
Combustion/Natural Gas Heating 4. Utilize Onsite Renewable Energy 5. Develop District Energy Systems
117

Evolution of the City’s Tree Regulations and Summary of Current Regulations City Council Strategic Planning Workshop, March 1 and 2, 2019
Background When the City incorporated in 1995 it wholly adopted the 1993 King County Zoning Title 21A into the City of Shoreline Municipal Code Title 18. In 2000, the City adopted an entirely new SMC 20 Development Code. In SMC 20.50.290, the City established the Tree Conservation, Land Clearing and Site Grading Standards. This code section, commonly referred to as the Tree Code, included tree retention, replacement and protection standards that remain as the basis for our current code. Since the year 2000, the City has amended the Tree Code eleven times. The cumulation of these amendments have become our current Tree Code.
Current Code Simplified Significant-Sized Trees The City’s tree regulations, SMC 20.50.290-370, only apply to significant-sized trees on private property, except in critical areas. Significant-sized trees include conifer trees eight inches or more and deciduous trees 12 inches or more in diameter measured 4.5 feet from the ground. Eight inches diameter and 12 inches diameter translate to 25 inches and 28 inches in circumference respectively.
Tree Removal Exempt from Permit
Non-significant Sized Trees Trees that are smaller in diameter than a significant tree may be removed without a permit unless they are in a Critical Area and its buffer or the area cleared exceeds 1,500 square feet.
Commercial Zones Trees removed on properties zoned Community Business, Mixed Business, Neighborhood Business, MUR- 70’, or Town Center are exempt from the Tree Code, unless existing, significant trees were included as required landscaping within the previous three years.
Partially Exempt Trees Some significant trees may be removed during a 3-year period based on the parcel sizes. Parcels that are 7,200 square feet may remove 3 significant trees. For each additional 7,200 square feet a parcel may remove one additional tree. Trees over 30 inches in diameter (94.2” in circumference) are not exempt and will need a permit to remove.
Pruning Pruning less than 25% of the canopy is allowed without a permit. Tree pruning does not include coppicing (cutting back to roots to regrow), topping, or damaging the health of the tree. When the tree(s) are in a critical area, the pruning must be completed by a Tree Risk Assessment Qualified (TRAQ) professional arborist using best practices consistent with Shoreline Development Code section 20.50.350(E).
118
2
Regulating Trees in Critical Areas If a tree of any size is in or near an area such as a stream, wetland, or steep slope, then the tree may be in a Critical Area or its buffer. City review is required to determine whether these trees may be removed or pruned through a Clearing and Grading Permit. To remove hazardous trees in the Critical Areas, they must be hazardous to life or property as determined by a qualified arborist. Hazardous trees that are an active threat (falling or about to fall) to life or property may be removed as described below. H azardous trees that are not an active threat may be removed after submitting a Tree Evaluation Form for approval. This form must be completed by a certified arborist (SMC 20.80.030).
Hazardous Trees A tree that is an active threat to life or property (falling or about to fall) can be removed immediately without permit. However, documentation of the hazardous condition prior to removal, such as photos, an arborist evaluation, or similar documentation, is required. After removal of the tree, documentation must be submitted to the Planning & Community Development Department for review to determine whether a Clearing and Grading – Tree Removal Permit and possibly replacement trees are required (SMC 20.50.310(A)(1)(c)).
Permit Required A Clearing and Grading – Tree Removal Permit is required if your trees are not listed under “Exempt from Permit.” If your tree is a hazard but is not an active threat, then it is regulated like a healthy tree through this permit. If the removal is a part of a larger construction or development project, then trees will be reviewed as a part of that permit. You will need to provide a site map showing the location and size of all significant trees and those proposed to be removed and replaced with replacement trees.
Rights-of-Way Trees located in the City rights-of-way are classified as street trees and are subject to different regulations than trees on private property. A permit is required for removal of trees in the rights-of-way.
Tree Retention Tree removal requires the retention of a percentage of the total number of significant trees on a parcel (SMC 20.50.350). If a parcel’s significant trees are to be damaged or removed by an adjoining City street improvement project, then those trees, by Director approval, may not need to be included in the site’s retention requirements.
Tree Replacement Trees removed beyond the exempt “First Three to Six Trees” (above) will require replacement trees (SMC 20.50.360). Except for single family lots, replacement trees must have a three-year maintenance bond and agreement with the City. Again, tree replacement may not be required, by Director approval, if significant trees are not required to be retained because of removal or damage by a City street improvement project.
119

Attracting Film Industry Through Model Code Development City Council Strategic Planning Workshop, March 1 and 2, 2019
Discussion question: Shall the City modify existing ordinances and/or develop new ordinances to better
attract and support filmmaking in Shoreline?
Background:
The independent films, commercials, short films and other video content totaling approximately $1
million per year in production value represent a significant and growing economic cluster in Shoreline.
The Council-adopted 2018-2023 Economic Development Strategic Plan prioritized “Growing a Media
Production Industry” among the nine non-geographic Placemaking Projects intended to enrich the
overall economic climate of the city. However, there are currently no ordinances specifically supporting
and regulating the filmmaking activities within the city. The existing permitting processes were not
designed with filmmaking in mind. Filmmakers typically must acquire permits, permission, or services
from several departments including Public Works (ROW), Parks, and Police. As the permits are not
designed for the filmmaking industry, various work-arounds need to be employed, leading to an
inconsistent process.
In the past, permit exemptions were given to filmmakers on an ad-hoc basis, resulting in some confusion
for both the City and the filmmaker, which potentially exposed the city to risk.
In the summer and fall of 2018, an independent film was shot mostly in Shoreline (on city streets, in
parks, and at Fircrest) and contributed at least $500,000 to the local (WA) economy. This was a high-
profile project in the State of Washington, with the film receiving the highly prestigious 2018 Film
Production Grant from the State. While this activity provided many benefits to the city, permitting
activities were a pain-point for the production. This was not because of any flaw with the existing
permits system as designed, but because the existing code did not address the specific type of activities
requested or the specific needs of the requester.
For example, a “baseline” simple film shoot, requiring one shot at a public park and one street ROW
permit, would currently cost about $600-$800 in Shoreline, $25 in Seattle, and would be free in Everett.
Film Industry Feedback:
Discussions with filmmakers identified some essential requirements to attract and support filmmaking in
Shoreline:
1. Centralized permits coordination. Filmmakers are typically working on strict timetables and
limited budgets with a limited ability to learn the various intricacies of the permit process within
any given city. A “single point of coordination” is essential if the City wishes to support growth in
this industry.
2. Permit design. Permits required of filmmakers should be designed to fit their industry.
120

3. Permit fees. Fees have likewise not been developed with the filmmaking industry in mind. The
impacts and work required of the city to support a road closure for a large developer might be
significantly greater than the impacts for a road closure to film a car scene in the city, and the
fee structure should reflect this. In addition to looking at actual cost to the city of the permit
process, permit fees for filmmakers should be normalized with fees charged in neighboring,
competing cities. Financial benefit to the City from allowing these types of activities should also
be considered.
Considerations:
If Council would like to pursue this issue/concept further, staff anticipates devoting resources to the
following tasks:
1. Explore model codes.
a. California Model Film Ordinance
b. Washington Film Works
c. Nearby, similar city codes with film-friendly policies
2. Explore converting the filmmaker interest form (required to be submitted to the film office via
print, scan, and email/fax/US Mail) to “push-button” electronic submission directly on website.
This can be linked with our database system for tracking film activities in the city.
3. Review permit for ROW usage, similar to streamlined Parks usage permit.
4. Review policies related to Businesses (B&O related code).
5. Review permit for Parks usage; gather feedback on implementation of streamlined permit.
6. Obtain additional input to complement already collected information.
a. Get additional input from filmmakers.
b. Get input from local businesses that might be impacted.
c. Get input from Public Works, Parks, and the Police Department in the City.
d. Get input from residents, if deemed necessary for this code development. Consider
ways for residents to provide input on specific filming projects.
7. Develop a set of “best practices” for the City to interact with filmmakers, borrowing from work
already done by other municipalities.
8. Explore developing an MOU with DSHS for filmmaking at Fircrest.
121