Fragments Shored against Ruins - University of Technology ...

Central Federal Lands Highway Division 12300 West Dakota Avenue
Lakewood, CO 80228
Shored Mechanically Stabilized Earth (SMSE) Wall Systems Design Guidelines
Publication No. FHWA-CFL/TD-06-001 February 2006
Pre-constructionslope
MSE WallFacing
Shoring wall
Existingslope
MSE wall
Existingtraffic lanes
Newtraffic lane
LevelingPad
FoundationMaterials
Embedment
ReinforcingElements

FOREWORD Federal Lands Highway (FLH) is responsible for design and construction of roadways in rugged, mountainous terrain. MSE walls are frequently used to accommodate widening of existing roads or construction of new roadways. However, in steep terrain, excavation is required to establish a flat bench on which to construct the MSE wall. Shoring has often been employed to stabilize the backslope (or back-cut) for the MSE wall, and an MSE wall has been designed and constructed in front of it. Where a shored MSE wall system is determined to be the best alternative for wall construction, design of the MSE wall component should take into consideration the retaining benefits provided by the shoring component, as well as the long-term behavior of each individual wall system. The purpose of this design guideline is to serve as the FLH standard reference for highway projects involving shored MSE walls.
Notice This document is disseminated under the sponsorship of the U.S. Department of Transportation in the interest of information exchange. The U.S. Government assumes no liability for the use of the information contained in this document. This report does not constitute a standard, specification, or regulation. The U.S. Government does not endorse products or manufacturers. Trademarks or manufacturers' names appear in this report only because they are considered essential to the objective of the document.
Quality Assurance Statement The Federal Highway Administration (FHWA) provides high-quality information to serve Government, industry, and the public in a manner that promotes public understanding. Standards and policies are used to ensure and maximize the quality, objectivity, utility, and integrity of its information. FHWA periodically reviews quality issues and adjusts its programs and processes to ensure continuous quality improvement.
Technical Report Documentation Page
1. Report No. FHWA-CFL/TD-06-001
2. Government Accession No.
3. Recipient's Catalog No.
5. Report Date February 2006
4. Title and Subtitle Shored Mechanically Stabilized Earth (SMSE) Wall Systems Design Guidelines
6. Performing Organization Code 023-2436
7. Author(s) Kimberly Finke Morrison, P.E., R.G.; Francis E. Harrison, P.E.; James G. Collin, Ph.D., P.E.; Andrew Dodds, Ph.D.; and Ben Arndt, P.E.
8. Performing Organization Report No.
10. Work Unit No. (TRAIS)
9. Performing Organization Name and Address Golder Associates Inc. The Collin Group, Ltd. Yeh and Associates, Inc. 44 Union Blvd., Suite 300 7445 Arlington Road 5700 E. Evans Ave Lakewood, CO 80228 Bethesda, MD 20814 Denver, CO 80222
11. Contract or Grant No. DTFH68-02-R-00001 13. Type of Report and Period Covered Final, Oct. 2002 – Feb. 2006
12. Sponsoring Agency Name and Address Federal Highway Administration Central Federal Lands Highway Division 12300 W. Dakota Avenue, Suite 210 Lakewood, CO 80228
14. Sponsoring Agency Code HFTS-16.4
15. Supplementary Notes Contracting Officer’s Technical Representative (COTR): Scott A. Anderson, Ph.D., P.E., FHWA-FLH; Advisory Panel
Members: Mike Adams, FHWA-TFHRC; Rich Barrows, FHWA-WFLHD; and Daniel Alzamora and Roger Surdahl, FHWA-CFLHD. This project was funded under the FHWA Federal Lands Highway Coordinated Technology Implementation Program (CTIP).
16. Abstract As an FHWA design reference for highway projects, this report was prepared to enable the engineer to identify and evaluate potential applications of shored mechanically stabilized earth (SMSE) walls. Included in this design guideline are a literature review on similar construction and the results and interpretation of field-scale testing, centrifuge modeling, and numerical modeling of an SMSE wall system. Results of the centrifuge modeling and field-scale testing show that reduction of the reinforcement length to as little as 25 percent of the wall height (0.25H) provides sufficient wall stability, even under a considerably high degree of surcharge loading. Using the results of the modeling and field testing research, this design guideline recommends a minimum reinforcement length equivalent to as little as 30 percent of the wall height (0.3H) for the MSE wall component, provided that the MSE reinforcement length is greater than 1.5 m. The benefit of attaching reinforcement to the shoring wall is found to be small and is generally not recommended except by way of the upper two layers of reinforcement. If possible, these layers of reinforcement should overlap the shoring wall and have a total length of 0.6H. If this is not possible, then these layers should be attached to the shoring wall. Internal design requirements of the MSE wall component for an SMSE wall system differ from that of a traditional MSE wall. Equations presented in this design guideline have been developed specifically to address these requirements. The benefits of increased retaining abilities provided by the shoring wall, such as reduction in lateral load acting on the MSE wall component and contribution to global stability, are considered in the design process. 17. Key Words DESIGN, MECHANICALLY STABILIZED EARTH (MSE) WALLS, SHORING WALLS, RETAINING WALLS, HIGHWAY CONSTRUCTION, HIGHWAY WIDENING
18. Distribution Statement No restriction. This document is available to the public
from the sponsoring agency at the Website: http://www.cflhd.gov.
19. Security Classif. (of this report) Unclassified
20. Security Classif. (of this page) Unclassified
21. No. of Pages 230
22. Price
Form DOT F 1700.7 (8-72) Reproduction of completed page authorized
ii
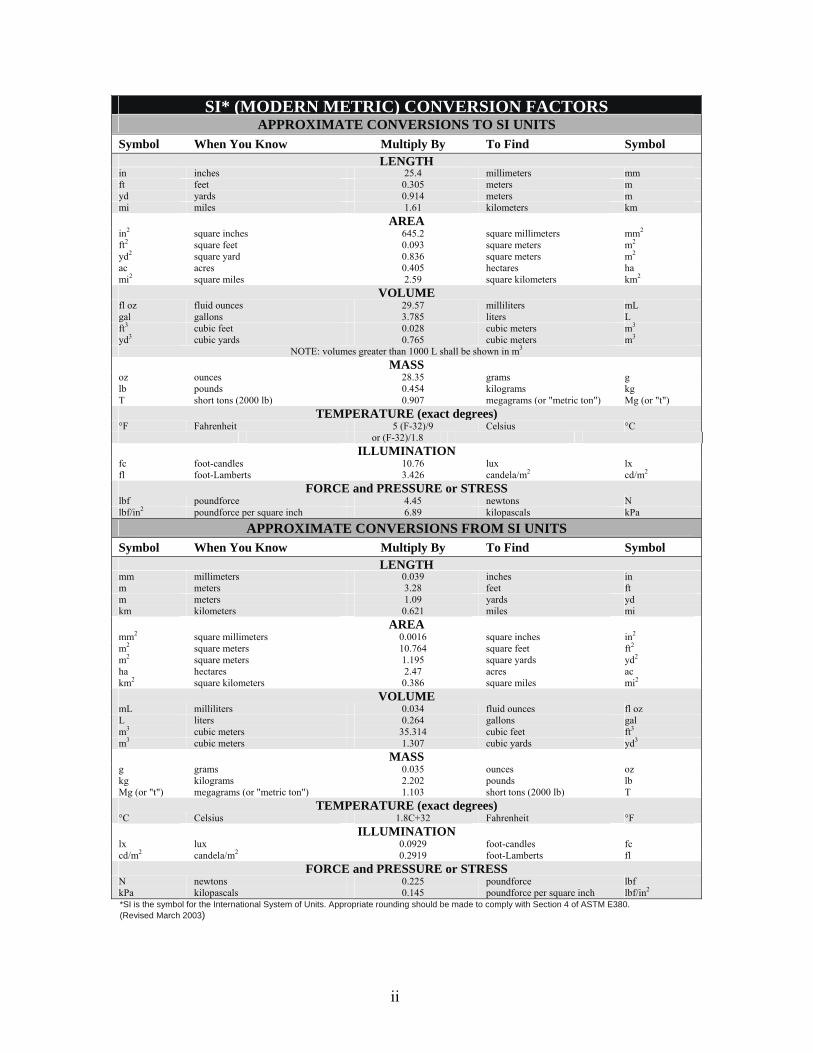
SI* (MODERN METRIC) CONVERSION FACTORS APPROXIMATE CONVERSIONS TO SI UNITS
Symbol When You Know Multiply By To Find Symbol LENGTH
in inches 25.4 millimeters mm ft feet 0.305 meters m yd yards 0.914 meters m mi miles 1.61 kilometers km
AREAin2 square inches 645.2 square millimeters mm2 ft2 square feet 0.093 square meters m2 yd2 square yard 0.836 square meters m2 ac acres 0.405 hectares ha mi2 square miles 2.59 square kilometers km2
VOLUMEfl oz fluid ounces 29.57 milliliters mL gal gallons 3.785 liters L ft3 cubic feet 0.028 cubic meters m3 yd3 cubic yards 0.765 cubic meters m3
NOTE: volumes greater than 1000 L shall be shown in m3 MASS
oz ounces 28.35 grams g lb pounds 0.454 kilograms kg T short tons (2000 lb) 0.907 megagrams (or "metric ton") Mg (or "t")
TEMPERATURE (exact degrees)°F Fahrenheit 5 (F-32)/9 Celsius °C
or (F-32)/1.8 ILLUMINATION
fc foot-candles 10.76 lux lx fl foot-Lamberts 3.426 candela/m2 cd/m2
FORCE and PRESSURE or STRESS lbf poundforce 4.45 newtons N lbf/in2 poundforce per square inch 6.89 kilopascals kPa
APPROXIMATE CONVERSIONS FROM SI UNITS Symbol When You Know Multiply By To Find Symbol
LENGTHmm millimeters 0.039 inches in m meters 3.28 feet ft m meters 1.09 yards yd km kilometers 0.621 miles mi
AREAmm2 square millimeters 0.0016 square inches in2 m2 square meters 10.764 square feet ft2 m2 square meters 1.195 square yards yd2 ha hectares 2.47 acres ac km2 square kilometers 0.386 square miles mi2
VOLUMEmL milliliters 0.034 fluid ounces fl oz L liters 0.264 gallons gal m3 cubic meters 35.314 cubic feet ft3 m3 cubic meters 1.307 cubic yards yd3
MASSg grams 0.035 ounces oz kg kilograms 2.202 pounds lb Mg (or "t") megagrams (or "metric ton") 1.103 short tons (2000 lb) T
TEMPERATURE (exact degrees) °C Celsius 1.8C+32 Fahrenheit °F
ILLUMINATION lx lux 0.0929 foot-candles fc cd/m2 candela/m2 0.2919 foot-Lamberts fl
FORCE and PRESSURE or STRESSN newtons 0.225 poundforce lbf kPa kilopascals 0.145 poundforce per square inch lbf/in2 *SI is the symbol for the International System of Units. Appropriate rounding should be made to comply with Section 4 of ASTM E380. (Revised March 2003)

TABLE OF CONTENTS
iii
TABLE OF CONTENTS
EXECUTIVE SUMMARY .....................................................................................................1
CHAPTER 1 — INTRODUCTION.......................................................................................3 1.1 BACKGROUND .........................................................................................................3 1.2 OBJECTIVE................................................................................................................3
1.2.1 Scope .................................................................................................................4 1.2.2 Source Documents.............................................................................................5 1.2.3 Terminology ......................................................................................................5
1.3 PRELIMINARY RESULTS........................................................................................6
CHAPTER 2 — EVALUATION OF SMSE WALL SUITABILITY.................................7 2.1 PRE-DECISION EVALUATION STUDIES..............................................................7
2.1.1 MSE Feasibility Assessment .............................................................................7 2.1.2 Determination of Shoring Requirements...........................................................9 2.1.3 Feasibility Design of SMSE Wall System.........................................................9
2.2 DECISION POINT....................................................................................................10 2.2.1 FHWA Experience with SMSE Walls ............................................................10 2.2.2 SMSE Wall Selection Process.........................................................................12
CHAPTER 3 — SMSE WALL DESIGN BASIS................................................................15 3.1 SMSE WALL RESEARCH REVIEW......................................................................15
3.1.1 Literature Review Summary............................................................................15 3.1.2 Centrifuge Modeling Summary.......................................................................15 3.1.3 Field-Scale Test Summary ..............................................................................16 3.1.4 Numerical Modeling Summary .......................................................................17
3.2 APPLICATION OF RESEARCH RESULTS TO DESIGN OF SMSE WALLS ....17 3.3 SMSE WALL DESIGN CONSIDERATIONS.........................................................19
3.3.1 Backfill Selection ............................................................................................19 3.3.2 Geometric Considerations ...............................................................................21 3.3.3 Drainage Considerations .................................................................................28
CHAPTER 4 — SITE INVESTIGATION OVERVIEW ..................................................29 4.1 FIELD RECONNAISSANCE...................................................................................29 4.2 GEOTECHNICAL INVESTIGATION.....................................................................29
CHAPTER 5 — DESIGN OF MSE WALL COMPONENT.............................................33 5.1 POTENTIAL FAILURE MODES ............................................................................34
5.1.1 Global Failure..................................................................................................34 5.1.2 Compound Failure of Shoring System and Foundation ..................................34 5.1.3 Failure Across Interface ..................................................................................35 5.1.4 Interface Shear Failure ....................................................................................35 5.1.5 Compound Failure of MSE Wall and Foundation...........................................35 5.1.6 Internal Failure of the MSE Wall ....................................................................35
TABLE OF CONTENTS
iv
5.2 FACTORS OF SAFETY ...........................................................................................36 5.3 INTERNAL STABILITY DESIGN..........................................................................36 5.4 EXTERNAL STABILITY DESIGN.........................................................................48
5.4.1 Bearing Capacity .............................................................................................48 5.4.2 Settlement ........................................................................................................51
5.5 GLOBAL STABILITY DESIGN..............................................................................52 5.5.1 General ............................................................................................................52 5.5.2 MSE Wall/Shoring Interface ...........................................................................54 5.5.3 External to SMSE Wall System ......................................................................57
5.6 SEISMIC STABILITY..............................................................................................58 5.7 CONNECTION STRENGTH DESIGN....................................................................59 5.8 MSE WALL BEHAVIOR.........................................................................................59
CHAPTER 6 — SHORING COMPONENT DESIGN CONSIDERATIONS.................61 6.1 COMMON TYPES OF SHORING WALLS............................................................61 6.2 SOIL NAIL WALL DESIGN FOR SMSE WALLS.................................................62 6.3 SHORING WALL BEHAVIOR ...............................................................................64
CHAPTER 7 — DESIGN EXAMPLE.................................................................................67 7.1 INTERNAL STABILITY DESIGN..........................................................................67 7.2 EXTERNAL STABILITY DESIGN.........................................................................70
7.2.1 Bearing Capacity Check ..................................................................................70 7.2.2 Settlement Check.............................................................................................71
7.3 GLOBAL STABILITY DESIGN..............................................................................71 7.3.1 MSE Wall/Shoring Interface Stability Check .................................................71 7.3.2 Stability External to SMSE Wall System........................................................72
CHAPTER 8 — PROCUREMENT AND CONSTRUCTABILITY ISSUES..................77 8.1 PROCUREMENT ISSUES .......................................................................................77
8.1.1 General ............................................................................................................77 8.1.2 SCR Considerations.........................................................................................78
8.2 CONSTRUCTABILITY ISSUES .............................................................................79 8.2.1 Confined Space for MSE Fill ..........................................................................79 8.2.2 Reinforcement Connections and Overlaps ......................................................79 8.2.3 Rock or Difficult Excavation...........................................................................79 8.2.4 Geometric Tolerances......................................................................................80 8.2.5 Foundation Preparation ...................................................................................80 8.2.6 Interface Friction .............................................................................................80 8.2.7 Groundwater ....................................................................................................81
CHAPTER 9 — CONCLUSIONS AND RECOMMENDATIONS ..................................83 9.1 CONCLUSIONS .......................................................................................................83 9.2 RECOMMENDATIONS...........................................................................................84
9.2.1 Implementation................................................................................................85

TABLE OF CONTENTS
v
9.2.2 Wall Monitoring ..............................................................................................85 9.2.3 Future Research ...............................................................................................87
APPENDIX A — LITERATURE REVIEW.......................................................................89 A.1 REINFORCEMENT SPACING...............................................................................89 A.2 REINFORCEMENT LENGTH................................................................................89
A.2.1 Geosynthetic-Reinforced Soil Retaining Walls..............................................90 A.2.2 Constrained Reinforced Fill Zones.................................................................91 A.2.3 Other Constructed Cases of Short Reinforcement Lengths............................92 A.2.4 Numerical Analyses Evaluating Short Reinforcement Lengths .....................94 A.2.5 Summary.........................................................................................................95
A.3 NON-RECTANGULAR REINFORCEMENT GEOMETRY.................................95 A.3.1 North American Practice ................................................................................95 A.3.2 European Practice ...........................................................................................97 A.3.3 Asian Practice .................................................................................................97
A.4 DESIGN EARTH PRESSURES ..............................................................................97 A.4.1 North American Practice ................................................................................97 A.4.2 European Practice ...........................................................................................98 A.4.3 Asian Practice .................................................................................................98
A.5 FULL-SCALE TESTING OF MSE WALLS...........................................................99 A.6 PERTINENT LITERATURE REVIEW FINDINGS.............................................101
APPENDIX B — CENTRIFUGE MODELING OF SHORED MSE WALL ...............103 B.1 CENTRIFUGE MODELING .................................................................................103 B.2 MODELING PARAMETERS................................................................................103
B.2.1 Materials .......................................................................................................103 B.2.2 Testing Apparatus .........................................................................................106
B.3 TESTING PROGRAM ...........................................................................................107 B.3.1 Phase I...........................................................................................................108 B.3.2 Phase II .........................................................................................................108
B.4 RESULTS ...............................................................................................................112 B.4.1 Phase I...........................................................................................................112 B.4.2 Phase II .........................................................................................................116
APPENDIX C — FIELD-SCALE TESTING OF SMSE WALL....................................119 C.1 PURPOSE ...............................................................................................................119 C.2 TEST WALL DESIGN...........................................................................................119 C.3 TEST WALL CONSTRUCTION...........................................................................122 C.4 INSTRUMENTATION AND MONITORING......................................................127 C.5 WALL LOADING..................................................................................................132 C.6 RESULTS ...............................................................................................................134
C.6.1 Visual Observations......................................................................................134 C.6.2 Strain Gages..................................................................................................134 C.6.3 Pressure Cells................................................................................................137 C.6.4 Inclinometer Measurements..........................................................................142 C.6.5 Survey Measurements...................................................................................144
TABLE OF CONTENTS
vi
C.6.6 LVDT Measurements ...................................................................................147 C.6.7 Potentiometer Measurements........................................................................148
C.7 INSTRUMENTATION SUMMARY.....................................................................149 C.8 COMPARISON OF CENTRIFUGE AND FIELD-SCALE MODELING ............150 C.9 FACTOR OF SAFETY CALCULATION .............................................................154
C.9.1 Internal Stability Calculation ........................................................................154 C.9.2 Summary.......................................................................................................161
C.10 CONCLUSIONS...................................................................................................161
APPENDIX D — NUMERICAL MODELING ................................................................163 D.1 PRELIMINARY WORK........................................................................................163
D.1.1 Geogrid Pullout Simulation ..........................................................................163 D.1.2 Modeling Issues............................................................................................165
D.2 ANALYSIS DETAILS...........................................................................................166 D.2.1 Soil................................................................................................................166 D.2.2 Structures ......................................................................................................168 D.2.3 Model Configuration ....................................................................................169 D.2.4 Initial Stress State and Modeling Sequence .................................................171
D.3 ANALYSIS RESULTS ..........................................................................................172 D.3.1 Geogrid Strain Behavior...............................................................................172 D.3.2 MSE/Shoring Interface Pressure Behavior...................................................172 D.3.3 Failure Characteristics ..................................................................................178
D.4 CONCLUSIONS ....................................................................................................178
APPENDIX E — RESULTS OF GEOGRID PULLOUT SIMULATION ....................183 E.1 MEDIUM MESH COARSENESS..........................................................................183 E.2 VERY FINE MESH COARSENESS .....................................................................190
GLOSSARY OF TERMS....................................................................................................197
ACKNOWLEDGEMENTS ................................................................................................205
REFERENCES.....................................................................................................................207

TABLE OF CONTENTS
vii
LIST OF FIGURES Figure 1. Diagram. Generic cross section of an SMSE wall system........................................ 6 Figure 2. Flow chart. Design methodology for SMSE wall systems. ...................................... 8 Figure 3. Photo. El Portal Road re-construction. ................................................................... 11 Figure 4. Photo. Compound wall construction at Zion National Park. .................................. 12 Figure 5. Flow chart. Flow chart for assistance in SMSE wall selection............................... 13 Figure 6. Diagram. Proposed geometry of MSE wall component of an SMSE wall
system. ..................................................................................................................... 22 Figure 7. Diagram. Alternate proposed geometry for MSE wall component of an
SMSE wall system. .................................................................................................. 23 Figure 8. Diagram. Frictional connection options for an SMSE wall system........................ 25 Figure 9. Diagram. Mechanical connection options for an SMSE wall system..................... 26 Figure 10. Diagram. Stepped shoring wall interface................................................................ 27 Figure 11. Diagram. Conceptual internal drainage for SMSE wall system. ............................ 28 Figure 12. Diagram. Ideal boring layout for SMSE wall system design.................................. 30 Figure 13. Diagram. SMSE wall system failure modes. .......................................................... 34 Figure 14. Diagram. Location of potential failure surface for internal stability design
of MSE wall component with extensible reinforcements. ....................................... 38 Figure 15. Diagram. Location of potential failure surface for internal stability design
of MSE wall component with inextensible reinforcements. .................................... 38 Figure 16. Chart. Variation in lateral stress ratio coefficients with depth in an MSE
wall.(1)....................................................................................................................... 40 Figure 17. Diagram. Battered MSE wall facing....................................................................... 41 Figure 18. Diagram. Distribution of stress from concentrated vertical load FV for
internal and external stability calculations............................................................... 42 Figure 19. Diagram. Free-body diagram for calculation of required tensile capacity
in the resistant zone.................................................................................................. 44 Figure 20. Diagram. Calculation of vertical stress at foundation level. ................................... 49 Figure 21. Chart. Modified bearing capacity factors for footing adjacent to sloping
ground.(1) .................................................................................................................. 50 Figure 22. Diagram. Conceptual failure surface and design methodology assuming
zero interface shear strength. ................................................................................... 55 Figure 23. Diagram. Conceptual failure surface to evaluate stability along shoring/
MSE interface. ......................................................................................................... 57 Figure 24. Diagram. Conceptual global stability failure surface. ............................................ 58 Figure 25. Illustration. Illustration of design example. ............................................................ 67 Figure 26. Calculation. Reinforcement rupture calculation for the design example................ 73 Figure 27. Calculation. Required total tensile capacity of MSE reinforcements for
design example......................................................................................................... 74 Figure 28. Calculation. Pullout resistance calculation for design example.............................. 75 Figure 29. Screenshot. Interface stability check for the design example. ................................ 76 Figure 30. Illustration. Staged construction procedures for the GRS-RW system.(43) ............. 90 Figure 31. Illustration. Profile of a multi-anchored wall (A) and plan view of the
reinforcement (B).(45) ............................................................................................... 93
TABLE OF CONTENTS
viii
Figure 32. Illustration. A multi-nailing shoring system combined with MSE construction.(46) ........................................................................................................ 94
Figure 33. Diagram. Dimensioning for MSE wall with variable reinforcement lengths.(2) .................................................................................................................. 96
Figure 34. Graph. Particle size distribution for Monterey No. 30 sand used for Phase I centrifuge modeling.(49) ............................................................................. 105
Figure 35. Graph. Gradation of mortar sand used for Phase II centrifuge testing. ................ 106 Figure 36. Schematic. Schematic of centrifuge model test set-up.(49) .................................... 107 Figure 37. Illustration. Phase II centrifuge model configuration. .......................................... 111 Figure 38. Photo. Centrifuge test series 2 at 37g acceleration. .............................................. 113 Figure 39. Photo. Centrifuge test series 2 at 38g acceleration. .............................................. 113 Figure 40. Photo. Centrifuge test series 2 at 41g acceleration. .............................................. 114 Figure 41. Schematic. Test wall plan view. ........................................................................... 120 Figure 42. Schematic. Typical field-scale test wall cross section with unconnected
system. ................................................................................................................... 121 Figure 43. Schematic. Typical field-scale test wall cross section with connected
system. ................................................................................................................... 122 Figure 44. Schematic. Connection detail for connected wall system..................................... 123 Figure 45. Photo. Reinforced fill compaction and retained fill placement. ........................... 123 Figure 46. Photo. Nuclear density gage testing of reinforced fill zone.................................. 124 Figure 47. Schematic. Plan view of shoring beam connection to pit wall. ............................ 125 Figure 48. Photo. Installation of shoring beam. ..................................................................... 125 Figure 49. Schematic. Tensar® welded wire facing unit. ...................................................... 126 Figure 50. Photo. Geogrid installation. .................................................................................. 126 Figure 51. Schematic. Instrumented wall section................................................................... 128 Figure 52. Photo. Strain gage installed on uniaxial geogrid. ................................................. 129 Figure 53. Photo. Earth pressure cells, Model 4800 (left) and Model 4810 (right). .............. 129 Figure 54. Photo. Inclinometers installed at the face of the MSE wall. ................................. 130 Figure 55. Photo. Total station surveying of footing deflection. ........................................... 130 Figure 56. Photo. LVDT instrumentation installation............................................................ 131 Figure 57. Photo. Potentiometer installation showing connection to vertical
reference................................................................................................................. 131 Figure 58. Photo. Potentiometer wire connection to welded wire facing. ............................. 132 Figure 59. Graph. Footing settlement measurements recorded during dead loading............. 133 Figure 60. Photo. Field-scale test wall load frame and jack set-up........................................ 133 Figure 61. Photo. Development of slack in geogrid reinforcement during wall
loading.................................................................................................................... 134 Figure 62. Graph. Strain measurements in geogrid, connected wall system.......................... 135 Figure 63. Graph. Strain measurements in geogrid, unconnected wall system...................... 136 Figure 64. Graph. Average measured strain versus applied surcharge pressure. ................... 137 Figure 65. Graph. Measured lateral earth pressures for the connected and
unconnected wall systems...................................................................................... 138 Figure 66. Graph. Measured vertical pressures for the connected and unconnected
wall systems. .......................................................................................................... 140 Figure 67. Graph. Measured versus applied vertical pressures excluding overburden.......... 141 Figure 68. Graph. Calculated lateral earth pressure coefficient. ............................................ 142

TABLE OF CONTENTS
ix
Figure 69. Graph. Measured cumulative displacement of MSE wall face............................. 143 Figure 70. Graph. Measured cumulative displacement of shoring wall................................. 144 Figure 71. Graph. Measured settlement of load footings using total station.......................... 145 Figure 72. Graph. Measured horizontal displacement of load footings using total
station..................................................................................................................... 146 Figure 73. Graph. Comparison of settlement measurements obtained using total
station and level. .................................................................................................... 147 Figure 74. Graph. Average vertical settlement of load footings measured using
LVDT..................................................................................................................... 148 Figure 75. Graph. Potentiometer measurements for the connected and unconnected
wall systems. .......................................................................................................... 149 Figure 76. Graph. Comparison of centrifuge reinforcement tears to field-scale test
wall strain gage locations....................................................................................... 152 Figure 77. Graph. Comparison of theoretical active failure wedge to actual failure
geometry. ............................................................................................................... 153 Figure 78. Calculation. Calculation of vertical stress due to footing load for test
wall......................................................................................................................... 156 Figure 79. Calculation. Reinforcement rupture calculation for test wall. .............................. 157 Figure 80. Calculation. Calculation of required pullout capacity for test wall. ..................... 159 Figure 81. Calculation. Calculation of pullout resistance for test wall. ................................. 160 Figure 82. Diagram. Geogrid pullout simulation model set-up. ............................................ 164 Figure 83. Graph. Stress-strain comparison over small strain range...................................... 167 Figure 84. Graph. Stress-strain comparison over large strain range. ..................................... 167 Figure 85. Diagram. PLAXIS field-scale test wall model configuration............................... 170 Figure 86. Screenshot. PLAXIS model mesh discretization. ................................................. 171 Figure 87. Graph. Calculated strains in geogrid layers over field-scale test load
range....................................................................................................................... 173 Figure 88. Graph. Calculated strains in geogrid layers over model load range. .................... 174 Figure 89. Graph. Lateral pressures recorded at tracking points for footing
pressures up to 350 kPa.......................................................................................... 175 Figure 90. Graph. Vertical pressures recorded at tracking points for footing
pressures up to 350 kPa.......................................................................................... 176 Figure 91. Graph. Lateral pressures recorded at pressure tracking points. ............................ 177 Figure 92. Graph. Vertical pressures recorded at pressure tracking points............................ 177 Figure 93. Screenshot. Principal stress directions at footing loading of 50 kPa. ................... 179 Figure 94. Screenshot. Principal stress directions prior to failure (footing loading =
1,050 kPa). ............................................................................................................. 180 Figure 95. Screenshot. Relative shear contours at footing loading of 50 kPa........................ 181 Figure 96. Screenshot. Relative shear contours prior to failure (footing loading =
1,050 kPa). ............................................................................................................. 182 Figure 97. Screenshot. Plastic point development at displacement of 0.005 m,
medium mesh. ........................................................................................................ 183 Figure 98. Screenshot. Geogrid development length at displacement of 0.005 m,
medium mesh. ........................................................................................................ 183 Figure 99. Screenshot. Plastic point development at displacement of 0.010 m,
medium mesh. ........................................................................................................ 184
TABLE OF CONTENTS
x
Figure 100. Screenshot. Geogrid development length at displacement of 0.010 m, medium mesh. ........................................................................................................ 184
Figure 101. Screenshot. Plastic point development at displacement of 0.015 m, medium mesh. ........................................................................................................ 185
Figure 102. Screenshot. Geogrid development length at displacement of 0.015 m, medium mesh. ........................................................................................................ 185
Figure 103. Screenshot. Plastic point development at displacement of 0.02 m, medium mesh. ........................................................................................................ 186
Figure 104. Screenshot. Geogrid development length at displacement of 0.02 m, medium mesh. ........................................................................................................ 186
Figure 105. Screenshot. Plastic point development at displacement of 0.05 m, medium mesh. ........................................................................................................ 187
Figure 106. Screenshot. Geogrid development length at displacement of 0.05 m, medium mesh. ........................................................................................................ 187
Figure 107. Screenshot. Plastic point development at displacement of 0.10 m, medium mesh. ........................................................................................................ 188
Figure 108. Screenshot. Geogrid development length at displacement of 0.10 m, medium mesh. ........................................................................................................ 188
Figure 109. Screenshot. Plastic point development at displacement of 0.20 m, medium mesh. ........................................................................................................ 189
Figure 110. Screenshot. Geogrid development length at displacement of 0.20 m, medium mesh. ........................................................................................................ 189
Figure 111. Screenshot. Plastic point development at displacement of 0.005 m, very fine mesh........................................................................................................ 190
Figure 112. Screenshot. Geogrid development length at displacement of 0.005 m, very fine mesh........................................................................................................ 190
Figure 113. Screenshot. Plastic point development at displacement of 0.010 m, very fine mesh........................................................................................................ 191
Figure 114. Screenshot. Geogrid development length at displacement of 0.010 m, very fine mesh....................................................................................................... 191
Figure 115. Screenshot. Plastic point development at displacement of 0.015 m, very fine mesh........................................................................................................ 192
Figure 116. Screenshot. Geogrid development length at displacement of 0.015 m, very fine mesh........................................................................................................ 192
Figure 117. Screenshot. Plastic point development at displacement of 0.02 m, very fine mesh........................................................................................................ 193
Figure 118. Screenshot. Geogrid development length at displacement of 0.02 m, very fine mesh........................................................................................................ 193
Figure 119. Screenshot. Plastic point development at displacement of 0.05 m, very fine mesh........................................................................................................ 194
Figure 120. Screenshot. Geogrid development length at displacement of 0.05 m, very fine mesh........................................................................................................ 194
Figure 121. Screenshot. Plastic point development at displacement of 0.1 m, very fine mesh........................................................................................................ 195
Figure 122. Screenshot. Geogrid development length at displacement of 0.1 m, very fine mesh........................................................................................................ 195

TABLE OF CONTENTS
xi
Figure 123. Screenshot. Plastic point development at displacement of 0.2 m, very fine mesh........................................................................................................ 196
Figure 124. Screenshot. Geogrid development length at displacement of 0.2 m, very fine mesh........................................................................................................ 196

TABLE OF CONTENTS
xii
LIST OF TABLES
Table 1. Select granular fill gradation example specification................................................... 20 Table 2. Embedment depths (d) for MSE walls.(2).................................................................... 26 Table 3. Interface friction angles.(27) ......................................................................................... 56 Table 4. Recommended SMSE wall construction tolerances. .................................................. 80 Table 5. Summary of SMSE wall system design recommendations ........................................ 84 Table 6. Centrifuge scaling relations.(57,58).............................................................................. 104 Table 7. Unconfined tensile strengths of the reinforcement. .................................................. 104 Table 8. Summary of Phase I centrifuge test models.............................................................. 109 Table 9. Centrifuge model parameters compared to prototype parameters. ........................... 110 Table 10. Comparison of centrifuge model and prototype footing pressures. .......................... 110 Table 11. Summary of Phase I centrifuge test results............................................................... 112 Table 12. Specification summary for test wall instrumentation. .............................................. 127 Table 13. Results of geogrid pullout simulation. ...................................................................... 164 Table 14. Soil model parameters............................................................................................... 168 Table 15. Modeling parameters for geogrid.............................................................................. 168 Table 16. Modeling parameters for MSE facing units.............................................................. 168 Table 17. Modeling parameters for loading footing. ................................................................ 169

TABLE OF CONTENTS
xiii
LIST OF ABBREVIATIONS AND SYMBOLS
AASHTO – American Association of State Highway and Transportation Officials Af – area of load footing AM – maximum horizontal acceleration ASTM – American Society for Testing and Materials b – gross width of the strip, sheet or grid; or bench width bf – length of load footing measured perpendicular to wall face B – width of MSE wall measured from wall face cf – cohesion of foundation soil C – reinforcement effective unit perimeter Cc – coefficient of consolidation Cu – uniformity coefficient (D60/D10) Cv – compression index d – foundation or toe embedment depth of MSE wall Df – footing embedment depth Dr – relative density D1 – diameter of influence from footing load D10 – particle size which 10 percent of material passes D30 – particle size which 30 percent of material passes D60 – particle size which 60 percent of material passes DOT – Department of Transportation e – eccentricity EA – axial stiffness EI – bending stiffness
refE50 – reference secant modulus for deviatoric loading refoedE – reference secant modulus for primary compression refurE – reference secant modulus for unloading/reloading
F – maximum tensile force F* – pullout resistance factor FH – concentrated horizontal load FV – concentrated vertical load Fq – embedment bearing capacity factor FPO – pullout resistance FHWA – Federal Highway Administration FLH – Federal Lands Highway FS – factor of safety to account for uncertainties FSbc – factor of safety against bearing capacity failure FSc – factor of safety against compound failure FScs – factor of safety with regard to connection strength

TABLE OF CONTENTS
xiv
FSex – factor of safety against external instability FSg – factor of safety against global failure FSis – factor of safety against interface shear instability FSot – factor of safety against overturning failure FSp – factor of safety against MSE reinforcement pullout failure FSPO – factor of safety against soil nail pullout FSr – factor of safety against reinforcement rupture FSsc – factor of safety against internal shear failure FSsl – factor of safety against base sliding FSt – nail tensile capacity factor of safety g – gravitational acceleration H – horizontal distance H – vertical wall height Hs – slope height for bearing calculation HDPE – high density polyethylene i – slope inclination angle kN – kiloNewton K – the horizontal force coefficient acting on the back of the wall face Ka – active lateral earth pressure coefficient Kr – lateral earth pressure coefficient Kr/Ka – lateral stress ratio kPa – kiloPascal L – length of reinforcement LB – reinforcement length at base of MSE wall Lei – length of embedment in the resisting zone at the ith reinforcement level Lf – length of load footing LT – reinforcement length at top of MSE wall Lw – length of truncated failure wedge; wall length Lz – nail length at depth, z LRFD – load and resistance factor design LVDT – linear variable displacement transducer m – meter(s) mm – millimeter(s) m – power for stress-level dependency of stiffness M – mass of active soil MSE – mechanically stabilized earth N – coefficient of gravitational acceleration N1 – reaction force normal to failure surface N2 – reaction force normal to shoring wall

TABLE OF CONTENTS
xv
Ncq – dimensionless bearing capacity factor Nγq – dimensionless bearing capacity factor Ns – slope stability factor NCMA – National Concrete Masonry Association OSHA – Occupational Safety and Health Association PAE – dynamic horizontal thrust PD – driving force PIR – horizontal inertia force Po – lateral reactionary force PR – resisting force pref – reference pressure PI – plasticity index PVC – polyvinyl chloride q – uniform surcharge load Q – ultimate nail pullout resistance qa – allowable bearing capacity qult – ultimate bearing capacity Rc – reinforcement coverage ratio (b/sh) Rf – failure ratio S1 – shear resistance along the failure surface S2 – shear resistance along the shoring wall sh – center-to-center horizontal spacing between strips, sheets or grids for MSE
wall SH – center-to-center horizontal spacing between nails for soil nail wall SP – poorly-graded sand sv – vertical spacing between MSE reinforcements SV – center-to-center vertical spacing between nails for soil nail wall St – spacing of transverse bar of grid reinforcements SCR – Supplemental Contract Requirement SMSE – shored mechanically stabilized earth t – thickness of the transverse bar of grid reinforcement T – reinforcement tensile strength Tallowable – allowable strength (force per unit width) of reinforcement Ti – maximum tension per unit width at ith reinforcement level Tn – nominal or ultimate nail tendon tensile strength Tmax – required pullout resistance TFHRC – Turner Fairbanks Highway Research Center USCS – Unified Soil Classification System

TABLE OF CONTENTS
xvi
V – vertical distance v – vertical component of shoring wall batter w – width of load footing measured parallel to wall face W – weight of the active wedge or reinforced block Wf – width of load footing x – distance to center of footing measured from face of MSE wall z – depth below top of wall γ – unit weight γf – unit weight of foundation soil φ – friction angle φ' – effective friction angle φf – friction angle of foundation soil φPS – plane strain friction angle φTX – triaxial shear friction angle α – scale effect correction factor; aspect ratio αβ – bearing factor for passive resistance β – internal angle of truncated failure wedge βs – slope angle measured from horizontal δ – inclination of MSE wall facing measured from horizontal starting in front of the wall δi – interface friction angle ψ – angle of the failure surface measured from horizontal ψd – dilatancy angle νur – Poisson’s ratio for unloading/reloading ρ – soil-reinforcement interaction friction angle ∆σh – concentrated horizontal surcharge load ∆σv – concentrated vertical surcharge load σh – horizontal stress σv – vertical stress σvi – overburden pressure at the ith reinforcement level σz – horizontal pressure at depth, z σtension – tensile strength σ3 – confining stress

EXECUTIVE SUMMARY
1
EXECUTIVE SUMMARY The Federal Lands Highway (FLH) Program of the Federal Highway Administration (FHWA) is responsible for design and construction of roadways in rugged, mountainous terrain. Where the terrain is steep, retaining walls are frequently required to accommodate widening of existing roads or construction of new roadways. In the last 20 years, use of various types of mechanically stabilized earth (MSE) retaining walls has increased on FLH projects, proving to be reliable, constructible, and cost effective. MSE walls, which are essentially a fill strengthening process, facilitate construction of a new road or widening of an existing narrow road by constructing the MSE wall on the outboard or “fill side” of the roadway. However, in steep terrain, excavation is required to establish a flat bench on which to construct the MSE wall. Existing state-of-practice suggests a minimum bench width and MSE reinforcement length equivalent to seventy percent of the design height of the MSE wall (i.e., 0.7H).(1,2) Additionally, the required toe embedment depths for MSE walls are proportional to the steepness of the slope below the wall toe. In some cases, the excavation requirements for construction of an MSE wall become substantial, and unshored excavation for the MSE wall is not practical, particularly if traffic must be maintained during construction of the MSE wall. Shoring, most often in the form of soil nail walls, has been employed to stabilize the backslope (or back-cut), with an MSE wall being designed and constructed in front of it. However, to date, the long-term stabilizing effect of the shoring system is not typically accounted for in the design. Where the two wall types are appropriate to use together, a design procedure that rationally considers both the stabilizing effect of the shoring wall with regard to reduction of lateral loads acting on the MSE wall mass as well as the significant contributions to global stability is beneficial, both to FLH and to other agencies. For this report, shored construction of an MSE wall is termed a Shored Mechanically Stabilized Earth (SMSE) wall system. The purpose of this report is to serve as an FHWA reference for highway projects involving SMSE wall systems. The current design practice for MSE walls used by FHWA is Elias et al.(2) This report does not replace that work, but instead expands that work where SMSE wall systems are deemed viable. Where an SMSE wall system is determined to be the best alternative for wall construction, design of the MSE wall component should take into consideration the retaining benefits provided by the shoring component, as well as the long-term behavior of each wall component. Due to the long-term lateral restraint provided by the shoring wall component of an SMSE wall system, as observed from field-scale testing conducted to assist in development of this report, design of the MSE wall component should augment the traditional approach for MSE wall design. Design of the MSE wall component of an SMSE wall system should include the following components: • Internal stability of the reinforced soil mass (i.e., rupture and pullout of reinforcements). • External stability along the MSE wall/shoring system interface. • Bearing capacity and settlement of the MSE wall foundation. • Global stability of the composite SMSE wall system.

EXECUTIVE SUMMARY
2
With regard to internal stability design of the MSE wall component, the pullout design equations presented were developed specifically for SMSE wall systems. No modification to the reinforcement rupture calculations currently in use for traditional MSE walls is needed. This report has been developed specifically for use of soil nail walls as the shoring wall component. The soil nail wall should be designed and constructed as a permanent feature instead of as a temporary, or “throw away,” feature, including such considerations as incorporation of a permanent drainage system, use of corrosion resistant nails (i.e., epoxy-coated or encapsulated steel bars), and adequate concrete cover to provide corrosion resistance. Geotechnical investigations conducted for SMSE wall systems should evaluate site conditions (soil/rock, groundwater) for both the MSE wall component as well as the shoring component. This includes evaluation of the foundation conditions for the MSE wall, as well as the alignment of the shoring wall and anchorage of the shoring wall (i.e., soil nails), where appropriate. This report presents design methodology for SMSE wall systems. The methodology is based on findings from a literature review, centrifuge modeling, field-scale testing, and numerical modeling. The comprehensive literature review included the state-of-practice with regard to shored construction of fill-side retaining walls as well as the use of short MSE reinforcements and nontraditional wall geometries. The centrifuge modeling, field-scale testing, and numerical modeling efforts were performed sequentially to answer specific questions on anticipated performance. Based on the results of centrifuge modeling and field-scale testing, reduction of the reinforcement length to as little as 25 percent of the wall height (0.25H) provided sufficient wall stability, even under a considerably high degree of surcharge loading. Using the results of this research, a minimum reinforcement length equivalent to 30 percent of the wall height (0.3H), as measured from the top of the leveling pad, is recommended for design of the MSE wall component of an SMSE wall system. It is recommended, however, that the reinforcement length not be less than 1.5 m, which is less than the 2.4 m minimum reinforcement length set forth in AASHTO and Elias et al. for traditional MSE walls.(1,2) This report is not written for design of MSE veneers on shoring walls, which are typically applied to provide an aesthetic improvement to the face of the shoring wall. Such walls are fundamentally different from SMSE walls in that they are typically “cut side” veneers, not supporting vehicle traffic or contributing significantly to global stability of the roadway.

CHAPTER 1 — INTRODUCTION
3
CHAPTER 1 — INTRODUCTION 1.1 BACKGROUND Federal Lands Highway (FLH), a program of the Federal Highway Administration (FHWA), is responsible for design and construction of roadways in rugged, mountainous terrain. Where the terrain is steep, retaining walls are frequently required in order to accommodate widening of existing roads, or construction of new roadways. In the last 20 years, use of various types of mechanically stabilized earth (MSE) retaining walls has increased on FLH projects, proving to be reliable, constructible, and cost effective. MSE walls are typically used to allow construction of a new road or widening of an existing narrow road by constructing the MSE wall on the outboard or “fill side” of the roadway. MSE walls behave as a flexible coherent block able to sustain significant loading and deformation due to the interaction between the backfill material and the reinforcing elements. Since MSE walls are essentially used to strengthen fills, this approach is generally ideal for such fill-side retaining walls. However, in steep terrain, a flat bench must be excavated on which the MSE wall is constructed. Existing state-of-practice design methods for MSE walls in the public sector suggests a minimum bench width equivalent to seventy percent of the design height (i.e., 0.7H).(1,2) Additionally, required toe embedment depths for MSE walls are proportional to the steepness of the slope below the wall toe. In some cases, the excavation requirements for construction of an MSE wall become substantial and unshored excavation for the MSE wall is not practical, particularly if traffic must be maintained during construction of the MSE wall. Shoring walls, often soil nail walls, have been employed to stabilize the backslope (or back-cut) for construction of the MSE wall, with the MSE wall being designed and constructed in front of the shoring wall. When a composite MSE and shoring wall system is proposed for use on a project, the MSE wall component of the system should consider the long-term retaining benefits provided by the shoring wall, including reduction of lateral loads on the MSE wall mass and significant contributions to global stability. Therefore, this investigation is based on the hypothesis that using current MSE wall design methods are conservative for Shored Mechanically Stabilized Earth (SMSE) wall systems. Where data are not present to show otherwise, the design methodology presented in this report generally refers back to current design practices.(1,2) 1.2 OBJECTIVE The purpose of this report is to present a design procedure for SMSE wall systems that rationally considers the stabilizing effect of the shoring wall on the long-term stability of the MSE wall mass. This report has been developed to serve as an FLH reference for projects involving the use of SMSE wall systems. State Departments of Transportation (DOT) and others may also find the results and recommendations useful for the design of more cost effective wall systems. Current design practice for MSE walls used by FHWA is Elias et al.(2) This report does not replace that work, but instead expands that work for projects where SMSE wall systems are

CHAPTER 1 — INTRODUCTION
4
viable and may provide cost advantages. The design methodology and recommendations presented in this report were developed based on a literature review (presented in appendix A), results of laboratory-scale centrifuge modeling (presented in appendix B), field-scale testing (presented in appendix C), and numerical modeling (presented in appendix D). This report is not written for design of MSE veneers on shoring walls. Such walls are fundamentally different from SMSE walls in that they are typically “cut side” veneers. The MSE veneer is applied typically to provide an aesthetic improvement to the face of the shoring wall, and does not support vehicle traffic or contribute significantly to global stability of the roadway. 1.2.1 Scope This report addresses the following items: • Considerations to evaluate regarding when to use an SMSE wall system. • Field investigation for an SMSE wall system. • Failure mechanisms of an SMSE wall system. • Internal stability design of the MSE wall component of an SMSE wall system. • External stability design of the MSE wall component of an SMSE wall system. • Global stability of the SMSE wall system. • SMSE wall system design details. • Shoring wall component, specifically soil nail wall, design details and considerations. • Items to include in a Supplemental Contract Requirement (SCR). • A discussion on procurement and constructability issues related to SMSE wall systems. The details of the pre-decision evaluation studies and the decision to use an SMSE wall system are presented in chapter 2. Chapter 3 presents results of the literature review, centrifuge modeling, field-scale testing, and numerical modeling; summarizes the design basis for SMSE wall systems; and presents design considerations for SMSE wall systems. Chapter 4 provides a discussion regarding site investigations for SMSE wall systems. The design of the MSE wall component of an SMSE wall system is presented in chapter 5. Design considerations for the shoring wall component, specifically a soil nail wall, are discussed in chapter 6. A design example is presented in chapter 7. Issues regarding procurement and constructability of SMSE wall systems are presented in chapter 8. Chapter 9 provides conclusions and recommendations.

CHAPTER 1 — INTRODUCTION
5
1.2.2 Source Documents Where design of the MSE wall component of an SMSE wall system is similar to that of a traditional MSE wall, design methodology was extracted from Elias et al., Mechanically Stabilized Earth Walls and Reinforced Soil Slopes, Design and Construction Guidelines and the American Association of State Highway and Transportation Officials (AASHTO) Standard Specifications for Highway Bridges.(1,2) Reference to other documents used for development of this report are provided in the literature review in appendix A. 1.2.3 Terminology Certain terms will be used throughout this report, defined as follows: • Aspect ratio is the term given to the ratio of the length (L) of reinforcing elements to the
height (H) of the wall for an MSE wall system. • Facing is a generic term given to the face of a retaining wall, used to prevent the backfill soil
from escaping out from between the rows of reinforcement. • Geosynthetic is a term for a planar product manufactured from polymeric material used with
soil, rock, earth, or other geotechnical engineering related material as an integral part of a man-made project, structure or system.
• Mechanically Stabilized Earth (MSE) wall is a generic term used when multiple layers of
tensile inclusions act as reinforcement in soils placed as fill for construction of a wall having a vertical or near-vertical face.
• Reinforcing elements (or reinforcements) is a generic term that encompasses all man-made
elements incorporated in soil (as in an MSE wall) to improve its behavior (i.e., geotextile sheets, geogrids, steel strips, steel grids, etc.).
• Reinforced fill is the fill material in which the MSE wall reinforcements are placed. • Retained backfill is the fill material behind the reinforced backfill zone on a conventional
MSE wall system. • Shoring system is a generic term for a retaining wall used to provide vertical or near-vertical
support of an excavation. A glossary presented at the end of this report defines other terminology used throughout this report. A generic cross section of an SMSE wall system illustrating several of the above terms is shown in figure 1.

CHAPTER 1 — INTRODUCTION
6
Pre-constructionslope
MSE WallFacing
Shoring wall
Existingslope
MSE wall
Existingtraffic lanes
Newtraffic lane
LevelingPad
FoundationMaterials
Embedment
ReinforcingElements
Figure 1. Diagram. Generic cross section of an SMSE wall system.
1.3 PRELIMINARY RESULTS Based on the results of centrifuge modeling (appendix B) and field-scale testing (appendix C) of an SMSE wall system employing short reinforcements, reduction of the reinforcement length to as little as 25 percent of the wall height (0.25H) provide sufficient wall stability, even under a considerably high degree of surcharge loading. Using the results of this research, a minimum reinforcement length equivalent to 30 percent of the wall height (0.3H) as measured from the top of the leveling pad is recommended for design of the MSE wall component of an SMSE wall system. Reinforcement length is recommended to be not less than 1.5 m for SMSE walls, which is less than the 2.4 m minimum reinforcement length set forth in AASHTO and Elias et al. for traditional MSE walls.(1,2)
CHAPTER 2 — EVALUATION OF SMSE WALL SUITABILITY
7
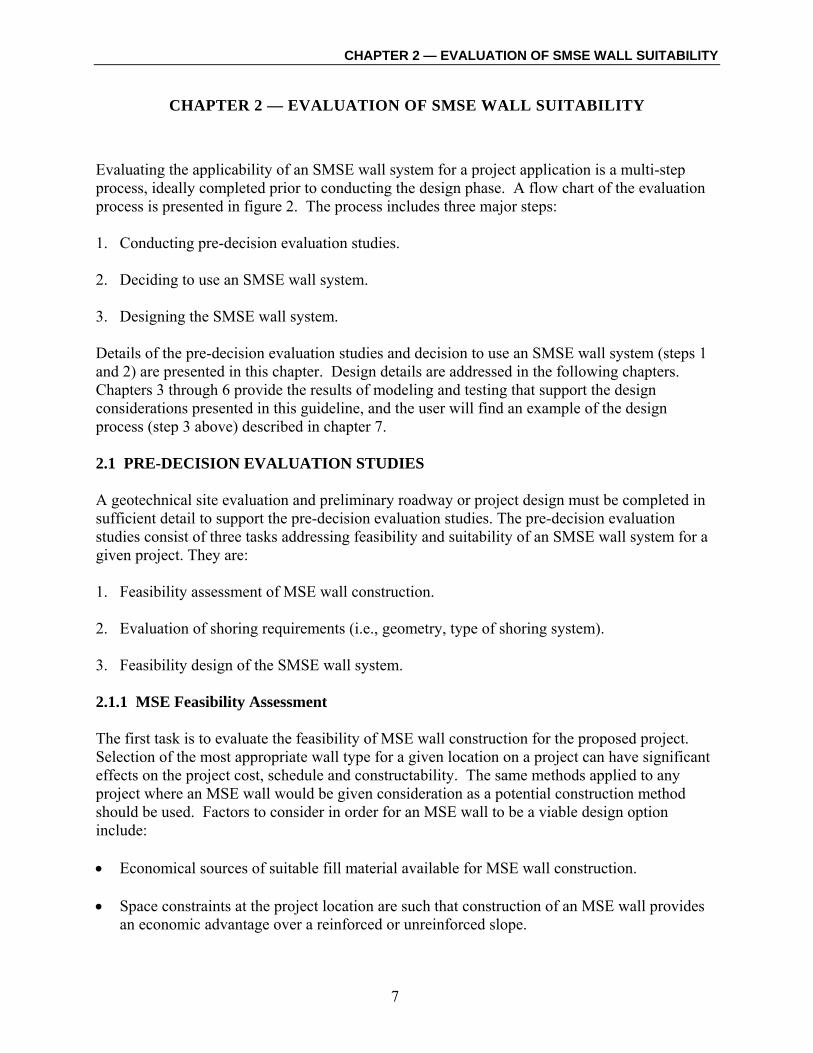
CHAPTER 2 — EVALUATION OF SMSE WALL SUITABILITY Evaluating the applicability of an SMSE wall system for a project application is a multi-step process, ideally completed prior to conducting the design phase. A flow chart of the evaluation process is presented in figure 2. The process includes three major steps: 1. Conducting pre-decision evaluation studies. 2. Deciding to use an SMSE wall system. 3. Designing the SMSE wall system. Details of the pre-decision evaluation studies and decision to use an SMSE wall system (steps 1 and 2) are presented in this chapter. Design details are addressed in the following chapters. Chapters 3 through 6 provide the results of modeling and testing that support the design considerations presented in this guideline, and the user will find an example of the design process (step 3 above) described in chapter 7. 2.1 PRE-DECISION EVALUATION STUDIES A geotechnical site evaluation and preliminary roadway or project design must be completed in sufficient detail to support the pre-decision evaluation studies. The pre-decision evaluation studies consist of three tasks addressing feasibility and suitability of an SMSE wall system for a given project. They are: 1. Feasibility assessment of MSE wall construction.
2. Evaluation of shoring requirements (i.e., geometry, type of shoring system).
3. Feasibility design of the SMSE wall system. 2.1.1 MSE Feasibility Assessment The first task is to evaluate the feasibility of MSE wall construction for the proposed project. Selection of the most appropriate wall type for a given location on a project can have significant effects on the project cost, schedule and constructability. The same methods applied to any project where an MSE wall would be given consideration as a potential construction method should be used. Factors to consider in order for an MSE wall to be a viable design option include: • Economical sources of suitable fill material available for MSE wall construction. • Space constraints at the project location are such that construction of an MSE wall provides
an economic advantage over a reinforced or unreinforced slope.

CHAPTER 2 — EVALUATION OF SMSE WALL SUITABILITY
8
• Geotechnical foundation conditions are suitable to support the MSE structure, or special
measures for foundation improvement can be reasonably and economically applied.
Conduct preliminary supporting studies: (1) Develop preliminary roadway or project design
(Pre-Decision Evaluation Studies, section 2.1) (2) Conduct site geotechnical evaluation (chapter 4)
Is MSE wall construction feasible?(MSE Feasibility Assessment, section 2.1.1)
Design alternatestructure
If MSE wall constructionis used, is shoring of the excavation required?
(Determination of Shoring Requirements,section 2.1.2)
Evaluate feasibility of SMSE wall construction to alternate structure types (i.e., costs, constructability)
(Feasibility Design of SMSE Wall System,section 2.1.3)
Use conventional MSE walldesign methodology
(ref. (1)(2))
NO
YES
NO
Is constructionof an SMSE wall system feasible for the project?
(Decision Point, section 2.2)
Determine preliminary geometric configuration of SMSE wall system
(Geometric Considerations, section 3.3.2)
NO
Design shoring wall component to accommodate requirements of project (i.e., access, stabilization)
(Chapter 6 - Shoring Component Design Considerations)Generally conducted by Agency
Conduct internal design of MSE wall component(Internal Stability Design, section 5.3)
Generally conducted by Contractor with input from Agency
Consider sloped, stepped, orpartial-height shoring wall.
PRELIMINARY SUPPORTING STUDIES
PRE-DECISION EVALUATION
DECISION TO USE SMSE WALL SYSTEM
RECOMMENDED DESIGN PROCEDURE
Includes analysis ofpullout and rupture ofMSE reinforcements.
Design for external stability of MSE wall component(External Stability Design, section 5.4)
Generally conducted by Contractor with input from Agency
Includes analysis of bearingcapacity and settlement ofthe MSE wall component.
Develop design drawings, details (i.e., MSE facing design, wall internal drainage, surface drainage, shoring wall,
reinforcement types and lengths), andproject-specific specifications.
DESIGN COMPLETE
Analyze global stability of compound wall system(Global Stability Design, section 5.5)
Generally conducted by AgencyIncludes analysis of shear at theMSE/shoring interface, and globalstability of the compound wall system.
YES
YES
Design shoring componentfor permanent construction(i.e., corrosion protection of steel).Design for temporary stability(i.e., FS=1.2 for non-criticalstructures and FS=1.35 for criticalstructures, ref. (26)).
Figure 2. Flow chart. Design methodology for SMSE wall systems.

CHAPTER 2 — EVALUATION OF SMSE WALL SUITABILITY
9
After examining the above factors, a conceptual design for the MSE structure should be completed, sufficient in detail to support evaluation of shoring requirements and feasibility design of the SMSE wall system. This portion of the study includes developing the performance criteria for the structure, such as surcharge loads, design heights, settlement tolerances, foundation bearing capacity, required toe embedment depth, and others as outlined in Elias et al.(2) 2.1.2 Determination of Shoring Requirements Where a conventional MSE wall (i.e., minimum reinforcement length of 0.7H) can be constructed without shoring the excavation, the wall can be designed and constructed using conventional design methodology and practices. FLH has adopted Elias et al. as their current standard practice for design of conventional MSE walls.(2) These guidelines closely follow AASHTO.(1) If space constraints dictate that construction of the MSE wall will impact traffic, several options should be considered before implementing shoring requirements. These options include temporary road closures, detours, or temporary lowering of the road grade to facilitate MSE wall construction. If MSE wall construction is deemed viable, but space constraints at the project location are such that the MSE wall excavation cannot be made at an appropriate slope angle, a preliminary estimate of the shoring requirements should be made.
2.1.3 Feasibility Design of SMSE Wall System Where shoring is required for MSE wall construction to be feasible, investigate the feasibility of combining the two wall components into an SMSE wall system. Keep in mind that the total cost for design and construction of an SMSE wall system should always be compared to the total cost for design and construction of other wall types and construction methods. Examples of instances where selection of an SMSE wall system may prove viable are: • Fill wall constructed in steep terrain where required bench excavation for traditional MSE
wall construction is not feasible. • Space unavailable to excavate for MSE reinforcement lengths due to need to maintain traffic
during wall construction. • Stabilization of existing slope required prior to construction of fill wall to remediate a
landslide or excessive erosion (i.e., achieve global stability). An SMSE wall system is often feasible when global stability controls the design, or when only a small additional roadway width is required. Construction of an SMSE wall system addresses global stability concerns using the shoring wall where, in addition to providing temporary excavation support, shoring provides stability of the earth mass behind the MSE wall component.

CHAPTER 2 — EVALUATION OF SMSE WALL SUITABILITY
10
In the case where a narrow width of additional roadway is required, existing traffic lanes may remain open while a shoring wall is constructed to facilitate construction of an MSE wall with relatively short reinforcement lengths (i.e., SMSE wall system). Once it is determined that construction of a fill-side retaining wall requires construction of a shoring wall, the design of the shoring structure should consider the following questions: • What type of shoring wall is most cost effective for the conditions at the site? • Is shoring required for the full height of the proposed wall, or is it possible to excavate an
unsupported soil or rock slope for a portion of the height? • Can the shoring wall be constructed at a batter or be a stepped structure? Because shoring is typically required for MSE wall construction in cases where insufficient construction right-of-way prevents construction of a temporary slope, top-down construction methods such as soil nailing are often used. If soils are not conducive to soil nailing, other options for shoring include driven piles, drilled piers, tie-backs, sheet piles, micropiles, etc. 2.2 DECISION POINT The results of the pre-decision evaluation studies are used to answer the question:
Is construction of an SMSE wall system the best alternative for the proposed project? The decision will be based on the relative costs and speed of construction, but may incorporate other considerations such as aesthetics and compatibility with other project construction or structures. The decision to use an SMSE wall system should involve a collaborative effort among the design team members. FLH has had experience with SMSE-type wall construction in recent years, as discussed in the next section. Section 2.2.2 describes the process used to assist in the selection of an SMSE wall system for a project application. 2.2.1 FHWA Experience with SMSE Walls FLH has recent experience with compound wall systems, including El Portal Road in Yosemite National Park, California; Sentinel Slide remediation in Zion National Park, Utah; and Ice House Road in Eldorado National Forest, California. All of these projects involved repair of roadways in steep mountainous terrain by construction of fill-side retaining walls after fill failures or excessive erosion as a result of landslides and/or flooding. El Portal Road re-construction in Yosemite National Park, California, involved outboard widening of 12.3 km of roadway damaged during El Ninõ flooding in 1997. Design drawings for the El Portal Road project included four compound wall construction options:

CHAPTER 2 — EVALUATION OF SMSE WALL SUITABILITY
11
1. Traditional MSE wall constructed in front of a partial-height soil nail wall with no connection between the MSE and shoring components.
2. MSE wall with shortened reinforcements (0.4H minimum) constructed in front of a permanent full-height soil nail wall with mechanical connection between the MSE and shoring components.
3. Traditional MSE wall constructed in front of a temporary full-height soil nail wall with no connection between the MSE and shoring components.
4. MSE wall with shortened lower reinforcements and stabilizing rock bolts where bedrock materials are encountered.
Of the design alternatives provided for the El Portal Road project, option 3 was constructed. Figure 3 is a photo of the roadway reconstruction.
Figure 3. Photo. El Portal Road re-construction.
In 1995, Sentinel landslide reactivated and formed a temporary dam in the North Fork of the Virgin River in Zion National Park, Utah, which runs parallel to the park’s main access road. The dam ultimately breached causing complete erosion of approximately 180 meters of the highway. In an effort to limit disturbance to the landslide slope while maintaining a two-lane access road adjacent to the river, a compound retaining wall, which included shoring via soil nailing to facilitate T-wall® installation, was constructed.(3) The T-wall, consisting of pre-cast concrete T-shaped units, resembles a crib-type wall with its design and function based partially on MSE principles. However, design of the T-wall did not incorporate the retaining benefits provided by the shoring wall. Figure 4 is a photo of T-wall construction in front of the soil nail

CHAPTER 2 — EVALUATION OF SMSE WALL SUITABILITY
12
wall at Zion National Park. Scour resistance was provided by constructing a secant pile wall adjacent to the river at the foundation level of the compound wall.
Figure 4. Photo. Compound wall construction at Zion National Park.
Ice House Road in Eldorado National Forest, California, required repair after a fill failure occurred in 1997. Repair of the roadway included retaining wall construction and reinforced slope repair. Due to project constraints and to limit the required amount of excavation, MSE walls were constructed in front of partial-height shoring walls. Though partial shoring was employed, the minimum aspect ratio for the full-height of the MSE walls was specified as 70 percent of the wall height, in accordance with traditional MSE wall design approaches. Though potential SMSE wall applications have been evaluated for other FLH projects, few have been constructed, likely due to lack of guidance on such wall systems. Designing cost effective wall systems for these applications provided the impetus for this study. 2.2.2 SMSE Wall Selection Process A flow chart developed to assist in evaluation of the proper wall type for a given project application is illustrated as figure 5, with emphasis on SMSE wall applications. Once a difference in grade has been identified as part of the design process, the decision must be made to construct a slope (reinforced or unreinforced) or a retaining wall. If adequate space exists, construction of a slope should first be considered. With regard to wall selection, the following general criteria require consideration: cut or fill situation, constructability, and aesthetics. First consider whether the wall will be built in cut, fill, or a combination thereof. Though fill-type walls may be constructed in cut situations, the opposite is not true for all types of cut walls (i.e., soil nail walls). However, the construction of fill walls in cuts requires additional excavation behind the face of the wall, and possibly shoring, depending on the space available for excavation. When shoring is required for construction of an MSE wall in a cut situation,

CHAPTER 2 — EVALUATION OF SMSE WALL SUITABILITY
13
construction of an SMSE wall is likely more economical than a traditional MSE wall with temporary shoring; however, a more appropriate cut-type wall should first be considered.
Identify Grade Change
No space constraints Space limitations
SMSE Wall3
Reinforced Slope
MSE Wall2 MSE Wall
Slope2
Retaining Wall
Fill Cut Cut/Fill
Slope stabilization required for
global stability
Traffic or access
constraints
Steep side slopes or terrain
Fill
Sheet Piling1
SMSE Wall3
SMSE Wall3
SMSE Wall3
Sheet Piling1
MSE Wall
Notes: 1 Verify suitable soil conditions. 2 Most economical alternative. 3 Consider use of partial height shoring wall to reduce required shoring area.
Soil Nail Wall1
SMSE Wall
Cantilever Wall
Tie-Back Wall
Drilled Shaft
MSE Wall
Cut
Drilled Shaft MSE Wall
Likely a good SMSE application
Likely not a good SMSE application
LEGEND
Other applications
Figure 5. Flow chart. Flow chart for assistance in SMSE wall selection.
Fill wall construction is on either level or sloping ground. For level ground situations, construction of an MSE wall is generally most economical. MSE walls on slopes require an excavated bench for construction. Excavation of the bench is accomplished either through construction of a temporary slope or a shoring wall. Excavation procedures should follow those outlined by the Occupational Safety and Health Administration (OSHA).(4) SMSE wall systems require the use of permanent shoring, but allow shorter MSE reinforcements than a traditional MSE wall, and consequently, potentially reduced excavation quantity. Where temporary shoring is employed, MSE walls should be designed using conventional methods.(1,2) Cut/fill conditions involve placing fill on the upper portion of a slope and cut in the lower portion of the slope. Construction of a traditional MSE wall requires that adequate space is available for excavation. When provided with space limitations, an SMSE wall may be

CHAPTER 2 — EVALUATION OF SMSE WALL SUITABILITY
14
constructed; again, other wall types may be more economical such as soldier pile, secant or tangent pile walls, tie-back walls, or sheet pile walls. SMSE walls may be the most economical or practical solution for sites requiring fill wall construction with one or more of the special circumstances presented in section 2.1.3, especially where the terrain is steep, space constraints are present or global stability is a concern. Determination of SMSE applicability requires an analysis based on the pre-evaluation studies performed early in the design phase. A geotechnical site evaluation and preliminary roadway or project design provide the detailed information required to make the evaluation.

CHAPTER 3 — SMSE WALL DESIGN BASIS
15
CHAPTER 3 — SMSE WALL DESIGN BASIS This chapter provides a discussion of the basis for SMSE wall design, based on model testing (centrifuge and field-scale), numerical modeling, and a review of available literature. Recommended general design requirements for SMSE walls follow later in this chapter. 3.1 SMSE WALL RESEARCH REVIEW Research conducted to assist in development of these design guidelines included review of available literature, scaled centrifuge model testing, instrumented load testing of a field-scale (prototype) test wall, and numerical modeling of the field-scale test wall. The literature review is presented in appendix A, and the procedures and results of the centrifuge modeling, field-scale testing, and numerical modeling are presented in detail in appendices B, C, and D, respectively. The following sections summarize the conclusions judged significant from a design standpoint for each of the various research efforts. 3.1.1 Literature Review Summary The literature review, summarized in appendix A, provided the following results pertinent to SMSE wall design: • MSE walls have been successfully constructed with reinforcement lengths shorter than
70 percent of the wall height (<0.7H), and use of MSE reinforcements on the order of 0.6H are common in the private sector.
• MSE reinforcement lengths considerably less than 0.7H have been successfully employed
where the earth pressures are less than active earth pressures (K<Ka), as with MSE walls constructed in front of rock outcrops.(5)
• For narrow or confined walls, the vertical overburden stress may be less than the unit weight
of the overburden multiplied by the wall height (σv<γ H) due to arching effects; where these effects occur consider the use of narrow or stepped walls.(6)
3.1.2 Centrifuge Modeling Summary A discussion of centrifuge modeling procedures and results is presented in appendix B. The centrifuge method was effective for economically evaluating many different geometric configurations of SMSE walls. The following conclusions from that work are pertinent to the design of SMSE walls: • Aspect ratios greater than 0.6 exhibited internal failures (all reinforcement layers intersected
the failure plane) under increasing gravitational levels. • Aspect ratios in the range of 0.25 to 0.6 generally produced stable wall systems that required
a high gravity level for failure. These walls generally exhibited outward deformation

CHAPTER 3 — SMSE WALL DESIGN BASIS
16
followed by compound wedge failure as gravity increased. The “toe” of the failure wedge was typically about one-third the wall height above the base of the MSE mass.
• Aspect ratios of 0.25 and smaller generally produced outward deformation followed by an
overturning collapse of the MSE mass under increasing gravitational levels. • At aspect ratios less than 0.6, deformation produced a “trench” at the shoring interface,
interpreted to be the result of tension. The “trench” was not observed with aspect ratios of 0.6 or greater.
• A conventional MSE wall with retained fill and an aspect ratio of 0.3 was observed to be
stable up to an acceleration level of 80g, which represents a prototype height of approximately 27 meters.
• The wedge failure geometries of SMSE walls were observed to be flatter than the traditional
Rankine failure wedge assumption (i.e., 245 φ+o ). • Wrapped-back MSE reinforcements (where the MSE reinforcements in contact with the
shoring wall are wrapped around the reinforced soil mass) resisted the tendency for toppling or overturning failure exhibited with other short MSE reinforcement configurations.(5)
• Smaller reinforcement vertical spacings provided increased stability. • Moderate batter of the shoring interface appeared to improve stability. • Qualitative agreement was apparent between the centrifuge test results and the numerical
modeling results presented in appendix D. Based on the centrifuge test results, details of the field-scale test were developed. Centrifuge testing was then conducted on a model of the field-scale test to predict its behavior. 3.1.3 Field-Scale Test Summary Procedures and findings of the field-scale test are presented in appendix C. The following conclusions from this work are pertinent to design of SMSE wall systems: • The constructed test wall was extremely stable, even under unrealistically high footing
surcharge loads. • Measured vertical stresses in the MSE mass appeared to reasonably approximate hydrostatic
pressures (γH). However, some evidence of arching was apparent in the lower portions of the MSE mass near the shoring wall interface. This was most apparent in comparison of the two pressure cells at the base of the MSE mass, where measured vertical stress was consistently lower near the shoring wall.

CHAPTER 3 — SMSE WALL DESIGN BASIS
17
• The “2:1 method” of estimating vertical stresses imposed by a surcharge was reliable for low stresses. At high stresses, this method was not reliable, so measurements of vertical and horizontal stress (σv and σh) were different than expected.
• The apparent earth pressure coefficient (Kr) at the interface between the shoring wall and the
MSE wall was not a constant, becoming smaller as surcharge was applied. • Reinforcement strains were similar between connected and unconnected wall systems. 3.1.4 Numerical Modeling Summary Results of numerical modeling conducted to further evaluate the behavior of the field-scale test wall are presented in appendix D. The following conclusions from this work are pertinent to design of SMSE wall systems: • The numerical model provided reasonable qualitative agreement with the field-scale and
centrifuge testing. • The numerical model predicted that SMSE walls constructed according to these design
guidelines are stable. • Quantitative prediction of wall behavior using the numerical model was very sensitive to
compaction effects and related soil properties. • The model predicted mobilization of shear stress along the shoring wall interface. This
phenomenon was not directly observed in the field or laboratory testing; however, it may be inferred from the difference in vertical stresses measured at the base of the MSE mass.
• Predicted strains in the MSE reinforcements for the numerical model were qualitatively
similar to the strains measured during field-scale testing. • The numerical model predicted possible tension along the shoring interface. 3.2 APPLICATION OF RESEARCH RESULTS TO DESIGN OF SMSE WALLS Based on centrifuge modeling, field-scale testing, and numerical modeling, a minimum MSE reinforcement length equivalent to 30 percent of the wall height (aspect ratio of 0.3) has been selected for design of SMSE walls. Centrifuge modeling of SMSE wall systems indicated that aspect ratios on the order of 0.25 to 0.6 produced stable wall configurations. The field-scale test was stable at an aspect ratio ranging from 0.25 at the base to approximately 0.39 at the top under excessive surcharge loading. Additionally, centrifuge modeling indicated that a conventional MSE wall with a retained backfill and an aspect ratio of 0.3 was stable under high levels of gravitational acceleration. The literature review further supports design of SMSE walls with a minimum aspect ratio of 0.3 when supported by permanent shoring wall construction. Centrifuge testing indicated that SMSE walls with aspect ratios less than 0.6 exhibited deformation in the form of “trench” at the shoring interface, believed to be indicative of tension
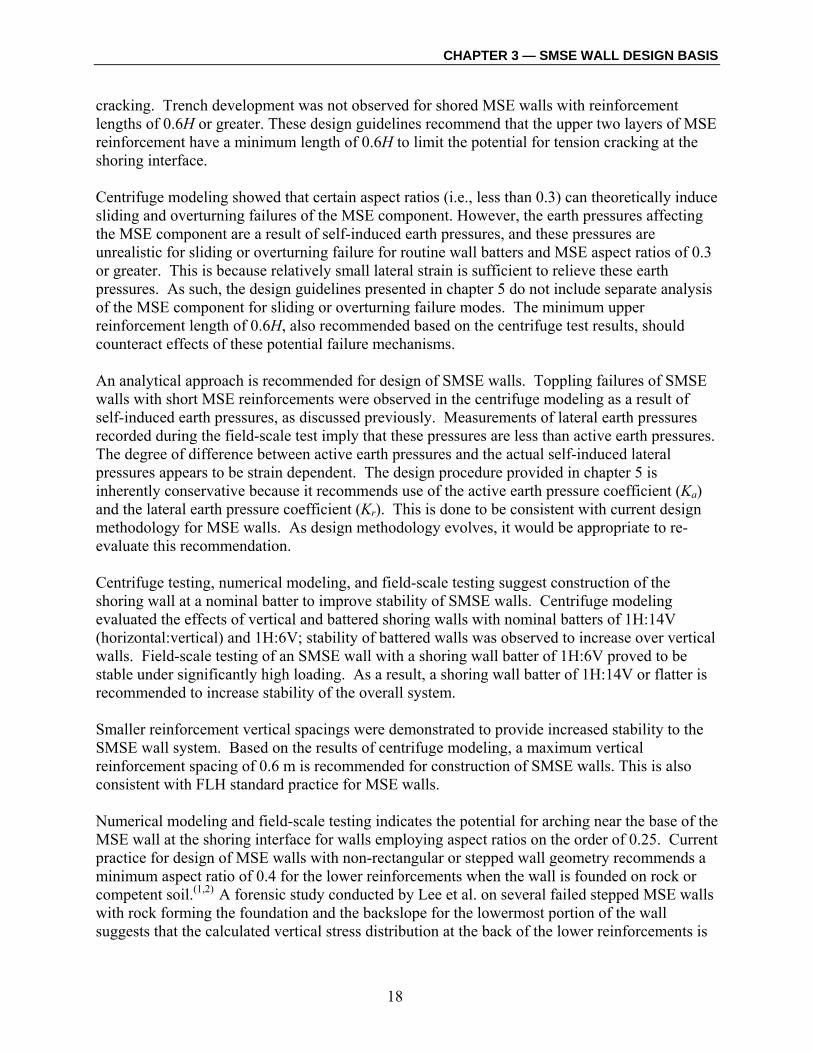
CHAPTER 3 — SMSE WALL DESIGN BASIS
18
cracking. Trench development was not observed for shored MSE walls with reinforcement lengths of 0.6H or greater. These design guidelines recommend that the upper two layers of MSE reinforcement have a minimum length of 0.6H to limit the potential for tension cracking at the shoring interface. Centrifuge modeling showed that certain aspect ratios (i.e., less than 0.3) can theoretically induce sliding and overturning failures of the MSE component. However, the earth pressures affecting the MSE component are a result of self-induced earth pressures, and these pressures are unrealistic for sliding or overturning failure for routine wall batters and MSE aspect ratios of 0.3 or greater. This is because relatively small lateral strain is sufficient to relieve these earth pressures. As such, the design guidelines presented in chapter 5 do not include separate analysis of the MSE component for sliding or overturning failure modes. The minimum upper reinforcement length of 0.6H, also recommended based on the centrifuge test results, should counteract effects of these potential failure mechanisms. An analytical approach is recommended for design of SMSE walls. Toppling failures of SMSE walls with short MSE reinforcements were observed in the centrifuge modeling as a result of self-induced earth pressures, as discussed previously. Measurements of lateral earth pressures recorded during the field-scale test imply that these pressures are less than active earth pressures. The degree of difference between active earth pressures and the actual self-induced lateral pressures appears to be strain dependent. The design procedure provided in chapter 5 is inherently conservative because it recommends use of the active earth pressure coefficient (Ka) and the lateral earth pressure coefficient (Kr). This is done to be consistent with current design methodology for MSE walls. As design methodology evolves, it would be appropriate to re-evaluate this recommendation. Centrifuge testing, numerical modeling, and field-scale testing suggest construction of the shoring wall at a nominal batter to improve stability of SMSE walls. Centrifuge modeling evaluated the effects of vertical and battered shoring walls with nominal batters of 1H:14V (horizontal:vertical) and 1H:6V; stability of battered walls was observed to increase over vertical walls. Field-scale testing of an SMSE wall with a shoring wall batter of 1H:6V proved to be stable under significantly high loading. As a result, a shoring wall batter of 1H:14V or flatter is recommended to increase stability of the overall system. Smaller reinforcement vertical spacings were demonstrated to provide increased stability to the SMSE wall system. Based on the results of centrifuge modeling, a maximum vertical reinforcement spacing of 0.6 m is recommended for construction of SMSE walls. This is also consistent with FLH standard practice for MSE walls. Numerical modeling and field-scale testing indicates the potential for arching near the base of the MSE wall at the shoring interface for walls employing aspect ratios on the order of 0.25. Current practice for design of MSE walls with non-rectangular or stepped wall geometry recommends a minimum aspect ratio of 0.4 for the lower reinforcements when the wall is founded on rock or competent soil.(1,2) A forensic study conducted by Lee et al. on several failed stepped MSE walls with rock forming the foundation and the backslope for the lowermost portion of the wall suggests that the calculated vertical stress distribution at the back of the lower reinforcements is

CHAPTER 3 — SMSE WALL DESIGN BASIS
19
greater than the actual stresses because the stiffer rock behind the reinforcements encourage the formation of arching above the reinforcements.(51) As a result, design calculations likely overestimate the resistance to pullout, translation, and wedge failure for stepped structures adjacent to rock or other self-supporting backslopes (i.e., shoring). Based on these observations, the factor of safety against reinforcement pullout should be increased from 1.5 to 2.0 for wall aspect ratios less than or equal to 0.4. 3.3 SMSE WALL DESIGN CONSIDERATIONS The following sections provide general details and recommendations for design of SMSE walls. Many of the recommendations were developed as a result of the literature review, centrifuge modeling, field-scale testing, and numerical modeling discussed previously. Others are based on current MSE wall practice as referenced below. 3.3.1 Backfill Selection The design recommendations provided in this report are valid only where select granular fill material is used for the reinforced fill zone of the MSE component. Use of select granular fill for MSE wall construction is generally consistent with current transportation practice. However, careful selection of fill is particularly critical because of the shorter reinforcement lengths and a potential for reduced vertical stress due to soil arching near the shoring wall. Select granular fill for an SMSE wall should meet the following minimum specifications: • The fill should be free from organic or other deleterious materials because the presence of
these items enhances corrosion of steel reinforcements and results in excessive MSE wall settlements.
• The fill should be free draining and have a minimum friction angle of 34 degrees, as
determined by laboratory direct shear (AASHTO T-236) or triaxial shear (ASTM D4767) testing.(7, 8) An example specification for select granular fill for SMSE walls is presented in table 1. However, the frictional strength of the specific material gradation provided requires verification for the available material source. Gradation analyses should be conducted using the AASHTO T-27 and T-11 methods, and the backfill should have a plasticity index (PI) as determined by AASHTO T-90 less than or equal to five.(7)
• The backfill materials should be free of shale or other soft, poor durability particles, and have
a sodium sulfate soundness loss of less than 15 percent after five cycles. Testing should be in accordance with AASHTO T-104.(7)

CHAPTER 3 — SMSE WALL DESIGN BASIS
20
Table 1. Select granular fill gradation example specification.
U.S. Sieve Size Percent Passing1
100 mm1,2 100 75 mm 75 – 100 No. 4 20 - 70
No. 200 (0.075 mm) 0 – 10 1 In order to apply default pullout resistance factor (F* ) values (see chapter 5), the uniformity coefficient (Cu)
should be greater than or equal to 4. 2 The maximum particle size for use with geosynthetics and epoxy-coated reinforcements should be reduced to 19
mm unless full-scale installation damage tests have been conducted in accordance with ASTM D5818 to evaluate the extent of construction damage anticipated for the specific fill material and reinforcement combination.(9) This also applies to epoxy-coated steel reinforcements.
The specifications provided in Standard Specifications for Construction of Roads and Bridges on Federal Highway Projects (FP-03) address construction of MSE walls in section 255.(10) However, modification to these specifications is typically accomplished for FLH projects through Special Contract Requirements (SCRs) and likely is also justified for construction of SMSE walls due to their unique nature. Section 209.11 of FP-03 does not provide an allowable range of moisture content for compaction of reinforced backfill, but instead states that the moisture content should be adjusted such that the material is suitable for compaction; this is considered acceptable due to the granular nature of the backfill material. The maximum compacted lift thickness specified in section 209.10 of 150 millimeters is recommended to be maintained for SMSE wall construction. According to section 209.11 reinforced backfill should be placed and compacted to at least 95 percent of the maximum density as determined by AASHTO T-99 method C.(7, 10) However, where the stabilized volume supports spread footings for bridges or other structural loads, the upper 1.5 m should be compacted to at least 100 percent of the maximum density, per section 255.05.(10) The compaction requirements for backfill close to the wall facing (within 1 m) differ because lighter compaction equipment may be used to limit lateral pressures and facing movement. A backfill material having good frictional and drainage characteristics, such as a crushed stone, is generally recommended close to the face of the wall to provide adequate strength, ease of compaction, and tolerable settlements.(2) Often, wire-faced MSE walls are constructed with nominal 0.1 to 0.2 m rock material manually-rodded into place at the wall face; such practices are appropriate to SMSE walls. Granular fill containing just a few percent fines may not be free draining. As such, drainage requirements of the SMSE wall should be carefully evaluated. Backfill specifications for traditional MSE walls may differ from the backfill specifications for SMSE walls due to differing performance requirements or construction methods and constraints. Suppliers of MSE wall systems have their own criteria for reinforced backfills, but these criteria should be carefully evaluated for use with an SMSE wall system. Project backfill specifications which apply to all MSE wall systems should be provided by FLH or any other contracting agency.

CHAPTER 3 — SMSE WALL DESIGN BASIS
21
Peak shear strength parameters are used in design of the MSE wall component. A lower bound frictional strength of 34 degrees is generally consistent with the select backfill specification provided in table 1, but should be verified through strength testing. Higher shear strength values may be used for design if substantiated by laboratory direct shear (AASHTO T-236) or triaxial shear (ASTM D4767) testing.(7, 8) However, caution is advised for design use of friction angles above 40 degrees due to lack of field performance data.(2) Electrochemical tests (i.e., pH, resistivity, chloride content and sulfate content) should be conducted on the backfill to enable evaluation of reinforcement and facing connection degradation. Refer to FP-03 specifications or AASHTO Division I section 5.8.6.1 and Division II section 7.3.6.3 for guidance regarding recommended electrochemical properties of select granular backfill for use with steel and geosynthetic reinforcements.(1, 10) 3.3.2 Geometric Considerations This section discusses geometric considerations for the MSE wall component of an SMSE wall system, including recommended minimum reinforcement lengths, shoring interface geometry, interface connections, and foundation or toe embedment. MSE Reinforcement Lengths Current public transportation engineering practice in the U.S. prescribes a minimum reinforcement length of 70 percent of the wall height (i.e., 0.7H) for MSE wall construction, with longer reinforcement lengths possible for structures subject to surcharge loading, sloping toe conditions, or a slope above the top of the wall.(1,2) For the private sector, NCMA prescribes a minimum reinforcement length of 0.6H.(11) Where an SMSE wall system is provided, MSE reinforcement lengths shorter than the generally accepted minimum of 0.6H to 0.7H are considered appropriate due to the reduction in lateral earth pressures acting behind the wall, as well as the contribution to global stability provided by the shoring system. A reduction in reinforcement length for the MSE wall component is appropriate whether or not the MSE reinforcements are connected to the shoring wall. In general, lengths for the MSE wall component should be designed primarily to provide internal stability of the MSE mass, whereas global stability should be evaluated for the entire SMSE wall system. Centrifuge modeling (appendix B) and field-scale testing (appendix C) indicate reinforcement lengths as little as 0.25H provide sufficient wall stability, even under a considerably high degree of surcharge loading. Using these results, a minimum reinforcement length of 0.3H, as measured from the top of the leveling pad, is recommended for design of the MSE wall component of an SMSE wall system. It is also recommended that the reinforcement length not be less than 1.5 m, which is less than the 2.4 m minimum reinforcement length set forth in AASHTO and Elias et al. for traditional MSE walls.(1,2) Specification of a uniform reinforcement length is not recommended for SMSE walls with battered shoring walls. Instead, it is critical that the MSE reinforcements extend to the shoring wall interface. A tolerance of 50 mm is recommended for this interface. Note that

CHAPTER 3 — SMSE WALL DESIGN BASIS
22
reinforcements may be bent upwards along the shoring wall interface, within the 50 mm tolerance. Where adequate construction space is available (or can be made temporarily available), it is recommended that the upper two layers of reinforcement are extended to a minimum length of 0.6H or a minimum of 1.5 m beyond the shoring wall interface, whichever is greater, as illustrated in figure 6. This feature limits the potential for tension cracks to develop at the shoring/MSE interface, and resists lateral loading effects. If extension of the upper reinforcements is not feasible, a positive connection between the upper two or more reinforcements and the shoring wall is recommended, as discussed in the next section.
H
Shoring Wall
0.3H min.MSE Reinforcement
MSE WallFacing
0.6H min.
1.5 m min.
Figure 6. Diagram. Proposed geometry of MSE wall component of an SMSE wall system. Extension of the upper two layers is intended to result in a wall cross section as depicted on figure 6, where the height of the shoring wall is at least 2/3 the MSE wall height (H). These guidelines should only be applied to wall designs that meet this constraint over the majority of their length. Walls with short shoring walls (less than 2/3H) over most of their length are outside the scope of these guidelines. It should be noted that near the ends of the retaining wall the height usually tapers, and the shoring wall height may be less than 2/3 of the MSE height for a short distance. However, application of these guidelines will result in MSE reinforcements not less than 3 m long at the top of the MSE wall (1.5 m minimum plus 1.5 m minimum). Where the shoring wall is less than 2/3 of the height of the MSE wall, as may occur as the wall ends taper, the engineer should check to assure that reinforcement lengths in the upper part of the MSE mass is greater than the conventional 0.7H directed by AASHTO and Elias, et al.(1,2) Generally, this will be satisfied, as long as the total retaining wall height in such sections is less than about 4 m.

CHAPTER 3 — SMSE WALL DESIGN BASIS
23
Interface Connections Connection of the upper two or more MSE reinforcements to the shoring wall is recommended when extension of the upper MSE reinforcements beyond the limits of the shoring wall is not feasible. This concept is illustrated in figure 7. Though field-scale testing of an SMSE wall system demonstrated little benefit of a connected versus an unconnected wall system (see appendix C), this recommendation is made based on MSE wall experience with cracks forming at the back of the reinforced fill mass and observation of the “trench” during the centrifuge tests. Incorporation of interface connections may limit differential movement between the shoring wall and MSE wall components, as a result limiting development of a tension crack, especially if the slack in the MSE reinforcements can be effectively removed. This could potentially be accomplished through the fastening mechanism or by surcharge loading. Extension of the upper MSE reinforcements is considered superior to mechanical connection of the reinforcements. Similar performance (lack of separation or cracking) may not be achieved if connections are used in lieu of extended reinforcements.
H
Shoring Wall
0.3HMinimum
MSE Reinforcement
MSE WallFacing
Upper layers of MSE reinforcementconnected to shoring wall
Figure 7. Diagram. Alternate proposed geometry for MSE wall component of an
SMSE wall system.

CHAPTER 3 — SMSE WALL DESIGN BASIS
24
Options for interface connections include two general types—mechanical and frictional. Several possibilities for connection of the shoring and MSE wall systems are summarized as follows: • Frictional connection options – (1) wrapped-back MSE reinforcements, (2) stepped wall
interface, and (3) MSE reinforcements bent upward at shoring interface. Figure 8 conceptually illustrates these frictional connection options.
• Mechanical connection options – (1) connect MSE reinforcement layers to the shoring wall
using bodkin joints or other means, and (2) install short MSE reinforcements near reinforcement levels in the shoring wall, and extend or overlap the reinforcement “tails” into the MSE wall component during MSE construction. Figure 9 conceptually illustrates these mechanical connection options.
Frictional connections are likely simpler to construct than mechanical connections. By wrapping the back of the MSE reinforcements as shown in figure 8, increased pullout resistance of the MSE reinforcements would result.(5) Centrifuge modeling (see appendix B) of wrapped-back MSE reinforcements indicated improved stability of the MSE mass compared to an unconnected SMSE wall system. Based on the geometry of a stepped wall interface, an increase in the shearing resistance along the interface is achieved. Construction of a stepped interface is further discussed in section 3.3.2. Mechanical connections require detailed design and construction oversight to ensure that the connections are constructed appropriately. Foundation Embedment Design toe embedment (i.e., the depth to the top of the leveling pad from the adjacent finished grade elevation) for the MSE wall component should be based on geotechnical design requirements for bearing capacity, global stability, and settlement. The embedment depths summarized in table 2 are commonly followed.(2) However, table 2 should not be a substitute for evaluating the geotechnical design requirements for bearing or global stability, but instead considered a starting point for the calculations. The effects of frost heave, scour, proximity to slopes, erosion, and potential future excavation in front of the wall should be considered when designing the embedment depth.(1) For walls constructed adjacent to rivers and streams, the embedment depth should be a minimum of 0.6 m below the potential scour depth.(1)

CHAPTER 3 — SMSE WALL DESIGN BASIS
25
Stepped shoring wall
MSE wall
Bend up nominal lengthof reinforcing element at
shoring interface.
MSE reinforcement
A. Wrapped-back MSE reinforcements
B. Stepped shoring wall and reinforcements bent at shoring interface
MSE wall
MSE reinforcement
Shoring wall
Figure 8. Diagram. Frictional connection options for an SMSE wall system.

CHAPTER 3 — SMSE WALL DESIGN BASIS
26
MSE reinforcement
Face ofMSE wall
Remove slack from connection
Shotcrete or concrete shoring wall
50 mm (or larger) galvanized standard pipe
Galvanized carriage bolt set indrilled hole with bonded epoxy
Bodkin joint
MSE reinforcement
Face ofMSE wall
Shotcrete or concrete shoring wall
MSE reinforcement extendingfrom shoring wall face
Figure 9. Diagram. Mechanical connection options for an SMSE wall system.
Table 2. Embedment depths (d) for MSE walls.(2)
Slope in Front of Wall Minimum to Top of Leveling Pad1
Horizontal (walls) H/20 Horizontal (abutments) H/10
3H:1V H/10 2H:1V H/7 3H:2V H/5
1 H is the height of the MSE wall excluding embedment.

CHAPTER 3 — SMSE WALL DESIGN BASIS
27
Geometry of MSE/Shoring Interface The face of the shoring wall defines the geometry of the MSE/shoring interface. The shoring system, and hence the MSE/shoring interface, may be constructed at a batter, vertically, or stepped. Where shoring is necessary, the interface surface between the two wall systems will generally be steep or vertical. The wall designer should consider designing the shoring wall with a nominal batter (up to 10 degrees from vertical) to reduce the risk of tension crack development, as discussed previously in section 3.2. Another option, where adequate working room is available, is construction of a stepped interface to strengthen the system against shear failure along the interface, illustrated in figure 10. Qualitatively, offsetting the steps of the stepped shoring wall a small amount (i.e., by as little as 0.5 m) may increase the resistance of the SMSE wall system to instability along the interface. A slope (2H:1V or flatter) may be incorporated between shoring wall steps to nominally reduce the shoring wall area. Whether or not a batter or stepped geometry is employed, extension of the upper MSE reinforcements to a minimum length of 0.6H is recommended to mitigate tension crack development, as discussed previously in this report.
H
L
MSE Reinforcements
MSE WallFacing
SteppedShoring Wall
Figure 10. Diagram. Stepped shoring wall interface.

CHAPTER 3 — SMSE WALL DESIGN BASIS
28
3.3.3 Drainage Considerations Because the SMSE wall system is designed based on long-term performance of both the shoring wall and the MSE wall components, wall drainage provisions for both components are crucial. Drainage for the shoring component should be connected to the drainage system of the MSE component, or extended through the face of the MSE wall. Because the reinforced fill zone of SMSE walls is specified as free-draining granular material, drainage at the back of the MSE portion of the wall may not be required. Where modular block units or other relatively impermeable facing type is used, drainage directly behind the wall facing should also be incorporated. Figure 11 illustrates a concept for SMSE wall internal drainage (assuming a soil nail shoring wall) with an outlet for shoring wall drainage through the MSE component. For SMSE wall construction in areas with high groundwater levels, the engineer may consider a drainage blanket both behind and beneath the reinforced fill zone.
MSE wallFacing
Shoring walldrainage
(i.e., geocompositedrain board strips)
Provide laterals and weep holes at every drain strip location with
nominal positive slope (i.e., 3%)
Weep hole
Face drainage employedwhen facing comprisedof impermeable units
Shoring wall facing
Figure 11. Diagram. Conceptual internal drainage for SMSE wall system. Surface water infiltration into an SMSE wall system should be limited. This is particularly important for deicing chemicals on roadways which may cause degradation of steel reinforcements or connections. For MSE components with metallic reinforcements supporting roadways that are chemically deiced, an impervious geomembrane should be placed below the pavement and above the first row of reinforcements to intercept flows containing the aggressive chemicals.(1)

CHAPTER 4 — SITE INVESTIGATION OVERVIEW
29
CHAPTER 4 — SITE INVESTIGATION OVERVIEW
The purpose of this chapter is to provide an overview of geotechnical site characterization issues for design of SMSE wall systems. Site reconnaissance, subsurface investigation, and a combination of in situ and laboratory testing should be conducted. Evaluation of the engineering properties of the local soil and rock is required because these materials provide both loading and support for the shoring system, as well as foundation support for the MSE wall component. Site investigations and testing programs are necessary to evaluate the technical and economic feasibility of an SMSE wall system for a project application. The extent of the site investigation should be consistent with the scope of the specific project (i.e., critical nature of the structure, project location, size and budget) and the project constraints (i.e., geometry, constructability, and performance). 4.1 FIELD RECONNAISSANCE Prior to conducting a geotechnical investigation involving drilling and sampling, a field reconnaissance of the proposed wall alignment should be completed. Also, available documents should be reviewed to obtain information regarding site conditions (i.e., geology, known hazards, location of utilities). The field reconnaissance and literature review assists in the decision process regarding use of an SMSE wall system, as discussed in chapter 2. 4.2 GEOTECHNICAL INVESTIGATION The purpose of the geotechnical investigation is to characterize soil/rock and groundwater conditions, conduct in situ field testing (i.e., standard penetration tests), and obtain samples for laboratory testing. Data obtained during the geotechnical investigation is used to estimate material parameters required for the MSE wall design, such as strength, bearing capacity and unit weight of foundation soils; estimate material parameters for design of the shoring wall such as pullout resistance and frictional characteristics of retained soils; evaluate chemical properties of earth materials; and develop design sections including phreatic or groundwater conditions, depth to bedrock, and soil stratigraphy. Figure 12 illustrates recommendations for preferred locations of subsurface borings for an SMSE wall system. The investigation program illustrated in figure 12 may be revised (reduced or increased) at the discretion of the geotechnical engineer based on site access, available budget, project schedule, etc. Detailed information and guidance on subsurface investigations is provided in other references. (See references 12, 13, and 14.)

CHAPTER 4 — SITE INVESTIGATION OVERVIEW
30
Figure 12. Diagram. Ideal boring layout for SMSE wall system design.
The soil and rock stratigraphy at the project site, including lateral extent, thickness, and elevations, as well as groundwater conditions, including perched zones and seasonal fluctuations, may be evaluated from the project-specific geotechnical investigation. Several site conditions may be identified during the subsurface investigation that could significantly affect the SMSE wall system selection and design, including: • Weak soil or rock layers susceptible to sliding instability which affect global and/or local
stability. • High plasticity, soft, or organic soils susceptible to excessive settlement or bearing capacity
failure (affecting MSE wall component) and long-term creep (affecting shoring component).

CHAPTER 4 — SITE INVESTIGATION OVERVIEW
31
• Lack of locally-available or cost effective import soils for use as reinforced fill. • Obstructions, boulders, and cemented layers that may impact drilling (if required for shoring
component) and wall excavation. • Cohesionless soils that exhibit poor stand-up time and hole instability (influences type of
shoring system). • High groundwater table or perched groundwater zones which may necessitate dewatering of
excavations during construction and influence design and constructability of the SMSE wall system.
• Soil materials with a high potential for corrosion or chemical attack which would affect
design of walls incorporating steel and concrete components.


CHAPTER 5 — DESIGN OF MSE WALL COMPONENT
33
CHAPTER 5 — DESIGN OF MSE WALL COMPONENT
Current design practice for MSE walls does not incorporate the long-term retaining effects of a shoring wall on the design of the MSE wall component.(1,2) Retaining benefits provided by the shoring wall include reduction of lateral loads on the MSE component and contribution to global stability. This chapter presents design methodology for the MSE wall component of an SMSE wall system. Where the design method differs from current MSE wall design practice and is an original contribution of this report, boxes are placed around equations and text is in italics; methodology drawn from Elias et al. are cited with the superscript (2). The most significant contribution of a shoring wall system constructed in conjunction with an MSE wall is its effect on global and external stability. If adequate space is available at the project, the MSE wall component of an SMSE wall system may be designed using standard design procedures with a minimum aspect ratio of 0.7.(1,2) However, where a shoring system is designed to remain permanently, external and global stability of the composite wall system should take both wall systems into consideration. Design of the MSE wall component of an SMSE wall system should consider: • Internal stability of the reinforced soil mass with regard to rupture and pullout of reinforcing
elements. • External stability along the MSE wall/shoring wall interface. • Bearing capacity and settlement of the MSE wall foundation materials. • Global stability of the composite SMSE wall system. In contrast to design of a traditional MSE wall, the resistance to sliding and overturning are not evaluated as these are not critical for SMSE wall systems. In addition, a different method is recommended for design of the MSE reinforcements to resist pullout for SMSE wall systems. When an SMSE wall system is selected as the preferred alternative, the design process is iterative between defining the geometric constraints of the structure and analysis of stability. A number of geometric factors for design of the SMSE wall system should be considered, including reinforcement lengths, toe embedment, and interface geometry. These factors are interrelated, and have a combined effect on the stability of the structure. The optimum combination will provide the most economical construction while meeting the necessary stability criteria.

CHAPTER 5 — DESIGN OF MSE WALL COMPONENT
34
5.1 POTENTIAL FAILURE MODES Stability analysis of an SMSE wall system must consider failure modes associated with conventional MSE walls and shoring walls, plus internal failure modes specific to the compound nature of the SMSE wall system. Figure 13 illustrates the various failure modes of the composite SMSE wall system.
1
Failure Modes:1. Global stability failure2. Compound failure through shoring
wall, beneath MSE wall3. Compound failure across interface
through both shoring and MSE walls4. External failure of MSE wall along interface5. Compound failure of the MSE wall and
foundation6. Internal failure of the MSE wall
3 4 652
Figure 13. Diagram. SMSE wall system failure modes. 5.1.1 Global Failure Global failure occurs when a failure surface passes behind and underneath all elements of the compound structure (figure 13, mode 1). In analyzing this type of failure, the SMSE wall system is assumed to act as an intact, impenetrable unit, forcing the shear surface completely outside of the structure. Stability against this type of failure depends on conditions of the foundation and slope below and behind the structure. It is virtually independent of the SMSE wall system strength and structural characteristics, but rather on the geometry of the structure envelope and hillside. In most instances, evaluation must also be made of seismic effects on global stability. Discussion of the global stability evaluation for SMSE wall systems is provided in section 5.5, presented later in this chapter. 5.1.2 Compound Failure of Shoring System and Foundation Compound failure of the shoring system and foundation occurs when the shear surface intersects the shoring wall, and continues through the foundation below the MSE wall (figure 13, mode 2).

CHAPTER 5 — DESIGN OF MSE WALL COMPONENT
35
This type of failure may be analyzed using limit equilibrium software which includes elements to model the various wall components, such as Slide 5.0.(15) Analysis programs specific to soil nail wall design such as GoldNail and Snailz do not typically model failure surfaces that exit beneath the shoring wall.(68,69) Instead, these programs typically model failure surfaces through the toe of the shoring wall, and they do not model the surcharge that is applied by the MSE wall. 5.1.3 Failure Across Interface Specific to the composite SMSE wall system is a failure across the interface (figure 13, mode 3). In this failure mode, the shear failure surface intersects both the MSE wall and the shoring system. The failure surface may or may not intersect the foundation. Normally, a structurally sound permanent shoring wall face will effectively preclude such failures. A soil nail shoring wall with a reinforced permanent shotcrete face would be unlikely to experience shear through the shotcrete, if it is properly designed and constructed. In many cases, this failure mode may be excluded from analysis at the discretion of the engineer. However, this may not be the case for some shoring types, such as a tie-back shoring wall with discrete facing panels. Where this failure mode needs to be checked, it can be checked using limit equilibrium software such as Slide 5.0.(15) 5.1.4 Interface Shear Failure Interface shear failure is defined as a failure occurring along the interface between the MSE wall and the shoring system (figure 13, mode 4). This failure mode includes connection failure when connections of the MSE reinforcements to the shoring wall are applied. This failure may extend through the foundation, or it may result in differential deformations between the two wall systems. Similar to a failure across the interface, this failure mode is specific to an SMSE wall system. This failure mode may be checked using limit equilibrium methods. 5.1.5 Compound Failure of MSE Wall and Foundation Compound failure of the MSE wall and foundation occurs when the shear surface intersects both the MSE wall and the foundation (figure 13, mode 5). This type of failure is representative of the bearing capacity of the foundation materials, and is analyzed using limit equilibrium software such as that discussed above in section 5.1.2. 5.1.6 Internal Failure of the MSE Wall Internal failure of the MSE component (figure 13, mode 6) is addressed with appropriate backfill materials, suitable vertical spacing of reinforcement, and adequate reinforcement strength and lengths. Evaluation of the internal failure mode of the MSE wall component of an SMSE wall system was one of the primary focuses of the research presented in this report, and design of the MSE wall component to resist internal failure is presented later in this chapter.

CHAPTER 5 — DESIGN OF MSE WALL COMPONENT
36
5.2 FACTORS OF SAFETY The recommended minimum factors of safety (FS) for design of the SMSE wall system were modified where appropriate from AASHTO, and are provided below:
• Global stability, FSg: 1.3 to 1.5. • Compound stability, FSc: 1.3. • Bearing capacity, FSbc: 2.5. • Seismic stability, FSsei: 75 percent of static FSg.. • Internal shear capacity, FSsc: 1.5. • Interface shear stability (evaluated along the MSE/shoring wall interface), FSis: 1.5. • Rupture of reinforcements, FSr: 1.5. • Pullout of reinforcements, FSp: 1.5 to 2.0 (range of FS to allow the engineer to account for
potential reduction in vertical stress in the resistant zone due to arching at the shoring wall/foundation interface, per section 3.2).
• Connection strength, FScs: 1.5. Factors of safety with regard to sliding, overturning, and eccentricity are not provided, as these failure modes are not considered valid for SMSE walls. As discussed in chapter 3, lateral pressures acting on the MSE component are self-induced because the shoring wall effectively reduces external loading, and these self-induced pressures would not realistically induce these modes of failure in walls designed in accordance with the guidelines. Analyses for sliding, overturning, and eccentricity modes of failure, though conducted for traditional MSE walls are not required for SMSE wall design. Refer to AASHTO for a broader discussion of global failure mechanisms acting outside the SMSE wall system.(1) 5.3 INTERNAL STABILITY DESIGN Internal stability design of the MSE component of an SMSE wall system should address the following potential internal failure mechanisms: • Soil reinforcement rupture (elongation or breakage of the reinforcements). • Soil reinforcement pullout.

CHAPTER 5 — DESIGN OF MSE WALL COMPONENT
37
The step-by-step process for internal design of the MSE component is summarized as follows: • Select the reinforcement type (inextensible or extensible reinforcements) and trial geometry
for the MSE wall. • Estimate the location of the critical failure surface. • Calculate the maximum tensile force at each reinforcement level for evaluation of
reinforcement rupture. • Calculate the required total tensile capacity of reinforcements in the resistant zone. • Calculate the pullout capacity at each reinforcement level within the resistant zone with
regard to pullout. Step 1 – Select MSE wall type and trial wall geometry. The MSE wall system type, including facing, must be selected to complete design. The calculations for internal stability of the MSE component differ somewhat for extensible (geogrid or geotextile) and inextensible (steel) reinforcements, as discussed later in this chapter. Select vertical reinforcement spacing consistent with the type of MSE facing intended for the application. Keeping in mind that closer reinforcement spacing increases internal stability, as evidenced in centrifuge modeling (appendix B), do not use vertical reinforcement spacing greater than 600 mm. For ease of construction, consider constant vertical reinforcement spacing. Step 2 – Estimate the location of the critical failure surface. The critical failure surface can be approximated using Rankine’s active earth pressure theory within the reinforced soil mass, assuming the remaining portion lies along the shoring/MSE interface. Use of the theoretical active failure surface is consistent with current practice for design of MSE walls with extensible reinforcements, and is considered sufficiently conservative for design of SMSE wall systems, based on observations in appendix B. Figure 14 illustrates the conceptualized failure surface for extensible reinforcements. Design for inextensible reinforcements should be conducted using the failure surface illustrated in figure 15, consistent with current design practice.(2) As shown in both the extensible and inextensible reinforcement cases, the critical failure surface has been assumed to be bilinear with the lower point passing through the toe of the wall. This assumption is conservative compared to observations from centrifuge modeling (appendix B). Design for internal stability should conservatively neglect the additional retaining benefits provided by longer upper reinforcement layers (refer to figure 6), and for that reason they are excluded from figures 14 and 15.

CHAPTER 5 — DESIGN OF MSE WALL COMPONENT
38
45 + φ/2
H
Shoring Wall Design Failure Surface(parallel to shoring wall at interface)
“Active”Zone
“Resistant”Zone
L
ExtensibleReinforcement
Figure 14. Diagram. Location of potential failure surface for internal stability design of
MSE wall component with extensible reinforcements.
H
“Active”Zone
“Resistant”Zone
H/2
H/2
InextensibleReinforcement
Design Failure Surface
L
0.3H
59o
Figure 15. Diagram. Location of potential failure surface for internal stability design of
MSE wall component with inextensible reinforcements.
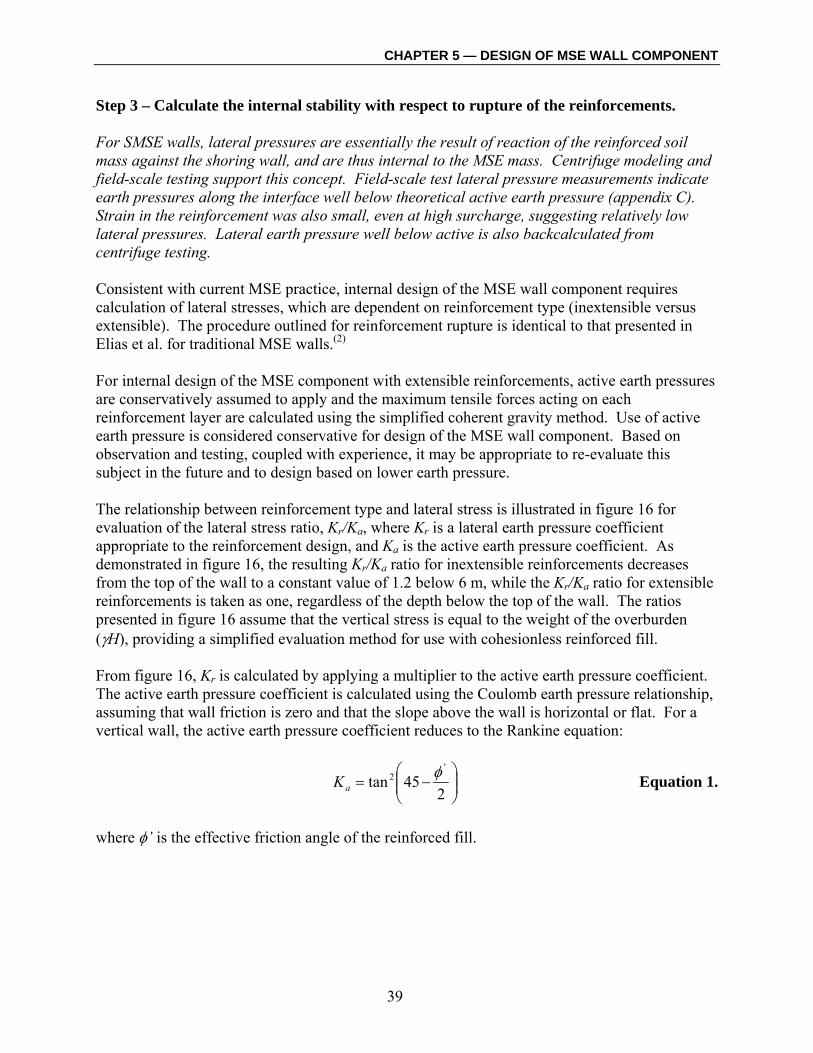
CHAPTER 5 — DESIGN OF MSE WALL COMPONENT
39
Step 3 – Calculate the internal stability with respect to rupture of the reinforcements. For SMSE walls, lateral pressures are essentially the result of reaction of the reinforced soil mass against the shoring wall, and are thus internal to the MSE mass. Centrifuge modeling and field-scale testing support this concept. Field-scale test lateral pressure measurements indicate earth pressures along the interface well below theoretical active earth pressure (appendix C). Strain in the reinforcement was also small, even at high surcharge, suggesting relatively low lateral pressures. Lateral earth pressure well below active is also backcalculated from centrifuge testing. Consistent with current MSE practice, internal design of the MSE wall component requires calculation of lateral stresses, which are dependent on reinforcement type (inextensible versus extensible). The procedure outlined for reinforcement rupture is identical to that presented in Elias et al. for traditional MSE walls.(2)
For internal design of the MSE component with extensible reinforcements, active earth pressures are conservatively assumed to apply and the maximum tensile forces acting on each reinforcement layer are calculated using the simplified coherent gravity method. Use of active earth pressure is considered conservative for design of the MSE wall component. Based on observation and testing, coupled with experience, it may be appropriate to re-evaluate this subject in the future and to design based on lower earth pressure. The relationship between reinforcement type and lateral stress is illustrated in figure 16 for evaluation of the lateral stress ratio, Kr/Ka, where Kr is a lateral earth pressure coefficient appropriate to the reinforcement design, and Ka is the active earth pressure coefficient. As demonstrated in figure 16, the resulting Kr/Ka ratio for inextensible reinforcements decreases from the top of the wall to a constant value of 1.2 below 6 m, while the Kr/Ka ratio for extensible reinforcements is taken as one, regardless of the depth below the top of the wall. The ratios presented in figure 16 assume that the vertical stress is equal to the weight of the overburden (γH), providing a simplified evaluation method for use with cohesionless reinforced fill. From figure 16, Kr is calculated by applying a multiplier to the active earth pressure coefficient. The active earth pressure coefficient is calculated using the Coulomb earth pressure relationship, assuming that wall friction is zero and that the slope above the wall is horizontal or flat. For a vertical wall, the active earth pressure coefficient reduces to the Rankine equation:
⎟⎟⎠
⎞⎜⎜⎝
⎛−=
245tan
'2 φ
aK Equation 1.
where φ’ is the effective friction angle of the reinforced fill.

CHAPTER 5 — DESIGN OF MSE WALL COMPONENT
40
Dep
th B
elow
Top
of W
all,
z
00
6 m
1.0 1.2 1.7 2.5
1.0 1.2
Geo
synt
hetic
s1
Met
al S
trips
Weld
ed W
ire G
rids
Metal B
ar M
ats &
Notes:1. Does not include polymer strip reinforcement.
Kr / Ka
Figure 16. Chart. Variation in lateral stress ratio coefficients with depth
in an MSE wall.(1) For wall face batters greater than 8 degrees from vertical, use the following simplified form of the Coulomb equation:
2'3
'2
sinsin1sin
)(sin
⎥⎦
⎤⎢⎣
⎡+
+=
θφθ
φθaK Equation 2.
where θ is the inclination of the MSE wall facing as defined in figure 17.(2)

CHAPTER 5 — DESIGN OF MSE WALL COMPONENT
41
θ
H
Shoring Wall
L
MSEReinforcement
MSE WallFacing
Figure 17. Diagram. Battered MSE wall facing.
At each reinforcement level, calculate the horizontal stresses, σh, along the potential failure line from the weight of the reinforced fill (γz), plus uniform surcharge loads (q), and concentrated surcharge loads (∆σv and ∆σh): hvrh K σσσ ∆+= Equation 3. where the vertical stress, σv, is calculated: ( ) vv qz σγσ ∆++⋅= Equation 4. and Kr is a function of depth (z) below the top of the wall as shown in figure 16. Use of Kr (greater than or equal to active earth pressure) for computing horizontal stress is considered conservative. The increment of vertical stress (∆σv) due to concentrated vertical loads may be calculated at each reinforcement level using a modified version of the 2:1 method illustrated in figure 18. Figure 18 illustrates a simplified case where the shoring and MSE walls are constructed without a batter, and where the load footing does not straddle the shoring wall. When wall batters are employed, as recommended by these guidelines, the vertical stresses can be estimated by geometrically calculating D1 at each reinforcement depth. In the case where the footing straddles the shoring wall, D1 is always greater than z2, as defined in the figure. Based on results of field-scale testing (appendix C), the 2:1 method appears to predict the vertical stresses adequately for relatively low footing loads, as would be expected in practice. For high loading situations, the wall designer is cautioned that this method may not produce conservative vertical stresses, as discussed in appendix C.

CHAPTER 5 — DESIGN OF MSE WALL COMPONENT
42
The increment of horizontal stress (∆σh) due to concentrated horizontal loads may be calculated as demonstrated in Elias et al.(2) Concentrated horizontal loads result from lateral earth pressures and traffic surcharges acting on footings constructed above the MSE wall component, and lateral forces due to superstructure or other concentrated lateral loads.
z1
FV
x1
bf
Footingw x bf
Shoring Wall D1
L
2 21 1
z2
z3D1
D1
For strip load:
For isolated footing load:
For point load (bf = 0):
11 zbD f +=:For 21 zz ≤
:For 213 zzz >>
xzb
D f ++
=2
11
:For 31 zz ≥
LD =1
Note:1 The measurement of x may be from either the face of the MSE wall or the shoring wall,
depending on the location of the load footing and the slopes of the various walls.
1DFv
v =∆σ
)( 11 zwDFv
v +=∆σ
21D
Fvv =∆σ
Figure 18. Diagram. Distribution of stress from concentrated vertical load FV for
internal and external stability calculations. In each reinforcement layer, calculate the maximum tension per unit width of wall (Ti) based on the vertical reinforcement spacing, sv: vhi sT ⋅= σ Equation 5. For discrete reinforcements (i.e., metal strips, bar mats, etc.), Ti is calculated by dividing the result of equation 5 by the reinforcement coverage ratio (Rc). Rc is defined by:
h
c sbR = Equation 6.
where b is the gross width of the strip, sheet or grid and sh is the center-to-center horizontal spacing between strips, sheets or grids. Rc is equal to one for full coverage of reinforcement.

CHAPTER 5 — DESIGN OF MSE WALL COMPONENT
43
Next, calculate the internal stability with respect to rupture of the MSE reinforcements. Stability with respect to rupture of each layer requires that:
iallowable TT ≥ Equation 7. where Tallowable is the allowable tension force per unit width of the reinforcement. For guidance on determining the long-term allowable strength of the reinforcement, see Elias et al.(2) Step 4 – Calculate the required total tensile capacity of MSE reinforcements. Internal design differs from design of a conventional MSE wall with regard to pullout of the reinforcements. Conventional MSE design requires that each layer of reinforcement resist pullout by extending beyond the estimated failure surface.(2) In the case of an SMSE wall system, only the lower reinforcement layers (i.e., those that extend into the resistant zone) are designed to resist pullout for the entire “active” MSE mass. The required pullout resistance (Tmax) of the MSE reinforcements within the resistant zone is calculated as the pullout force derived using the simplified free-body diagram presented in figure 19. Figure 19 represents the typical case where the MSE wall component has horizontal backfill and is subjected to a traffic surcharge, q (force per unit length units). Regardless of whether or not the shoring wall is battered, the engineer should assume development of a tension crack at the MSE/shoring wall interface and that the upper wedge (shown in gray in figure 19) is in equilibrium. As such, the forces N2 and S2 shown in figure 19 are ignored. Further, this analysis conservatively excludes extension of the upper layers of reinforcement. For simplicity, the remaining parameters should be assumed the same as represented in figure 19. Concentrated vertical and horizontal loads (FV and FH, respectively) are assumed to apply at the centroid of the truncated active failure wedge. The weight of the upper wedge is insignificant and may also be ignored in the pullout calculation. Therefore, the weight of the active wedge, W, can be calculated as:
ψγ tan21 2
WW LHLW −= Equation 8.
where H is the height of the MSE wall, γ is the unit weight of the reinforced fill, ψ is the angle defined in figure 19, and LW is the maximum length of the truncated failure wedge, i.e., reinforced length at the intersection of the shoring wall and active wedge. Assuming that the MSE wall facing is near-vertical, LW may be estimated as follows:
ψtan−
=v
vLL BW Equation 9.

CHAPTER 5 — DESIGN OF MSE WALL COMPONENT
44
where LB is width of the MSE wall at the base and v is the vertical component of the shoring wall batter, i.e., 1H:vV.
W
Tmax
ψ1
Notes:1. For extensible reinforcements, ψ = 45+φ/2; for
inextensible reinforcements, ψ = 59 degrees.2. Assume tension crack development and neglect
forces N2 and S2.3. Assume upper wedge (shown as gray) is in
equilibrium.
N1
S1
β
N2
S2
H
qLW
(Distributedsurcharge load)
FV
FH
TruncatedFailureWedge
Figure 19. Diagram. Free-body diagram for calculation of required tensile capacity in the
resistant zone. Summing force components perpendicular and parallel to the failure surface gives: βββββ coscossinsinsin max1 HVW FTFqLWN −+++= Equation 10. and βββββ sinsincoscoscos max1 HVW FTFqLWS +−++= Equation 11. where W is the weight of the active wedge defined in equation 8, N1 represents the reaction force perpendicular to the failure surface, S1 represents the shear resistance along the failure surface, Tmax is the resultant pullout force mobilized by the reinforcement in the resistant zone, and β is the angle as defined in figure 19. At failure, the Mohr-Coulomb failure state defined by:

CHAPTER 5 — DESIGN OF MSE WALL COMPONENT
45
'
1
1 tanφ=NS
Equation 12.
is applied to the reinforced soil, where φ’ is the effective friction angle for the reinforced soil. When LW is less than βtanH , the weight of the truncated “active” wedge is given by:
β
γγtan2
2W
WLHLW −= Equation 13.
where γ is the unit weight of the reinforced soil and H is the height of the MSE wall. Substitution of the expressions for S1, N1, and W and simplification for Tmax leads to:
H
VW
W
FFqLHL
T ++
+⎟⎟⎠
⎞⎜⎜⎝
⎛+⎟⎟
⎠
⎞⎜⎜⎝
⎛−
=)'tan(
tan2max βφ
βγ
for βtanHLW ≤ Equation 14.
For the case where HLW 3.0= , the equation may be written:
H
V
FFqHHH
T ++
+⎟⎟⎠
⎞⎜⎜⎝
⎛+⎟⎟
⎠
⎞⎜⎜⎝
⎛−
=)'tan(10
tan2033
max βφβ
γ for HLW 3.0= Equation 15.
For the case where βtanHLW ≥ , the full active wedge would develop and the forces S2 and N2 are zero. In this case, the weight of the “active” wedge is:
βγ tan21 2HW = Equation 16.
and the expression for Tmax is:
( )
)'tan(222tan
max βφγβ
+++
= VFqHHT for βtanHLW ≥ Equation 17.
For the above situation, select granular fill having a friction angle of 35 degrees or greater provides an MSE wall section with a minimum aspect ratio of 0.7. Therefore, either the design method presented herein or conventional MSE wall design methods may be employed for internal design of the MSE wall.(1,2)
CHAPTER 5 — DESIGN OF MSE WALL COMPONENT
46
Step 5 – Calculate the pullout resistance of MSE reinforcements in the resistant zone. Calculation of the pullout resistance generally follows traditional design methods.(1,2) The primary difference between calculation of pullout resistance for conventional MSE walls and SMSE walls is in the factor of safety. The factor of safety against pullout, FSp, should be increased from 1.5 to 2.0 for aspect ratios of 0.4 or less due to the potential for arching to develop, as discussed in section 3.2. Based on the reinforcement spacing(s) selected, calculate the length of embedment (Lei) of each reinforcement layer within the resistant zone:
ψtan
zHLLei−
−= Equation 18.
where L is the length of the MSE reinforcement at the corresponding reinforcement level, z is the depth to the reinforcement layer from the top of the wall, and ψ is the angle defined in figure 19. When wall batters are employed, geometric evaluation of Lei is required. At each reinforcement layer within the resistant zone, calculate the pullout resistance, FPO:
allowableceivip
PO TCRLFFS
F ≤= ασ '*1 Equation 19.
where: FSp = Factor of safety against pullout (range of FS to allow engineer to account for potential reduction in vertical stress in the resistant zone due to arching at the shoring wall/foundation interface, per
section 3.2). F* = Pullout resistance factor, discussed later in this section. C = Reinforcement effective unit perimeter (i.e., 2 for strips, grids, and sheets). α = Scale effect correction factor to account for a nonlinear stress
reduction over the embedded length of highly extensible reinforcements, based on laboratory data, generally 1.0 for inextensible reinforcements and 0.6 to 1.0 for geosynthetic reinforcements. In the absence of test data, use 0.8 for geogrids and 0.6 for geotextiles.
Rc = Coverage ratio (i.e., unity for full coverage). σvi = Effective overburden pressure (γz) at the ith reinforcement level,
including distributed dead load surcharges, but neglecting traffic live loading.
Lei = Length of embedment in the resisting zone at the ith reinforcement level.
The calculated pullout resistance, FPO, is less than or equal to the allowable strength (Tallowable) of the specified MSE reinforcement.

CHAPTER 5 — DESIGN OF MSE WALL COMPONENT
47
The pullout resistance factor (F*) can be estimated using the following general equation, or from laboratory pullout tests: ( ) ρα β tan* +⋅= qFF Equation 20. where Fq is an embedment bearing capacity factor, αβ is a bearing factor for passive resistance based on the thickness per unit width of the bearing member, and ρ is the soil-reinforcement interaction friction angle. Refer to Elias et al. and AASHTO for more information regarding evaluation of F*.(1,2) In the absence of laboratory test data, F* is commonly estimated as ( ) 'tan32 φ for geotextile reinforcement in granular soil, and 'tan8.0 φ for geogrid reinforcement in granular soil.(16) For steel ribbed reinforcement, F* is commonly taken as:
uCF log2.1tan* +== ρ or 2.0 Equation 21. whichever is lesser, at the top of the structure, and 'tan* φ=F Equation 22. for depths greater than or equal to 6 meters. In these equations, Cu is the uniformity coefficient of the backfill (D60/D10). If the specific Cu for the wall backfill is unknown, a Cu of four should be assumed for backfills meeting the requirements of this design guideline (section 3.3.1). For steel grid reinforcements with transverse spacing (St) greater than or equal to 150 mm (St ≥ 150 mm), F* can be calculated:
⎟⎟⎠
⎞⎜⎜⎝
⎛=⎟⎟
⎠
⎞⎜⎜⎝
⎛===
ttq S
tStFF 20
24040*
ββ αα Equation 23.
at the top of the structure, and
⎟⎟⎠
⎞⎜⎜⎝
⎛=⎟⎟
⎠
⎞⎜⎜⎝
⎛===
ttq S
tStFF 10
22020*
ββ αα Equation 24.
for depths greater than or equal to 6 meters. In these equations, t is the thickness of the transverse bar of the grid reinforcement. The transverse spacing should be uniform throughout the length of the reinforcement, and not just concentrated within the resistant zone. The pullout resistance of the MSE wall component of an SMSE wall system is considered adequate if: ∑≤ POFTmax Equation 25. where Tmax is calculated as presented in step 4.
CHAPTER 5 — DESIGN OF MSE WALL COMPONENT
48
5.4 EXTERNAL STABILITY DESIGN External stability design of the MSE wall component should address bearing capacity and settlement of the foundation materials. Overturning and sliding are not included as failure mechanisms due to stabilization provided by the shoring wall. Hydrostatic forces are eliminated by incorporating internal drainage into the design. 5.4.1 Bearing Capacity The MSE wall component should be designed for stability against bearing capacity failure. Two modes of bearing capacity failure exist: general shear and local shear failure. General Shear To prevent general shear bearing capacity failure, the vertical stress (σv) at the base of the wall should not exceed the allowable bearing capacity of the foundation soils:
bc
ultav FS
qq =≤σ Equation 26.
The vertical stress at the base of the wall is calculated for the MSE wall component of a shored MSE wall using figure 20 for loading from the weight of the reinforced wall and surcharge pressures. Where applicable, the influence of concentrated vertical loading (∆σv) should be added, calculated as illustrated in figure 18. The calculation illustrated by figure 20 includes transfer of vertical stress to the shoring wall, where battered. However, it conservatively neglects arching effects near the shoring wall at the base. Based on the field-scale testing, this simplified method of calculating the vertical stress should be conservative for bearing capacity analysis. The vertical stress, σv, acting at the base of the MSE wall component for the case presented in figure 20 with horizontal backfill and traffic surcharge is given by:
( )
B
Bv L
LqW ⋅+= 1σ Equation 27.
For relatively thick facing elements (e.g., segmental concrete facing blocks), the facing dimension and weight may be included in the bearing capacity calculations (i.e., use B as defined in figure 20 instead of LB).
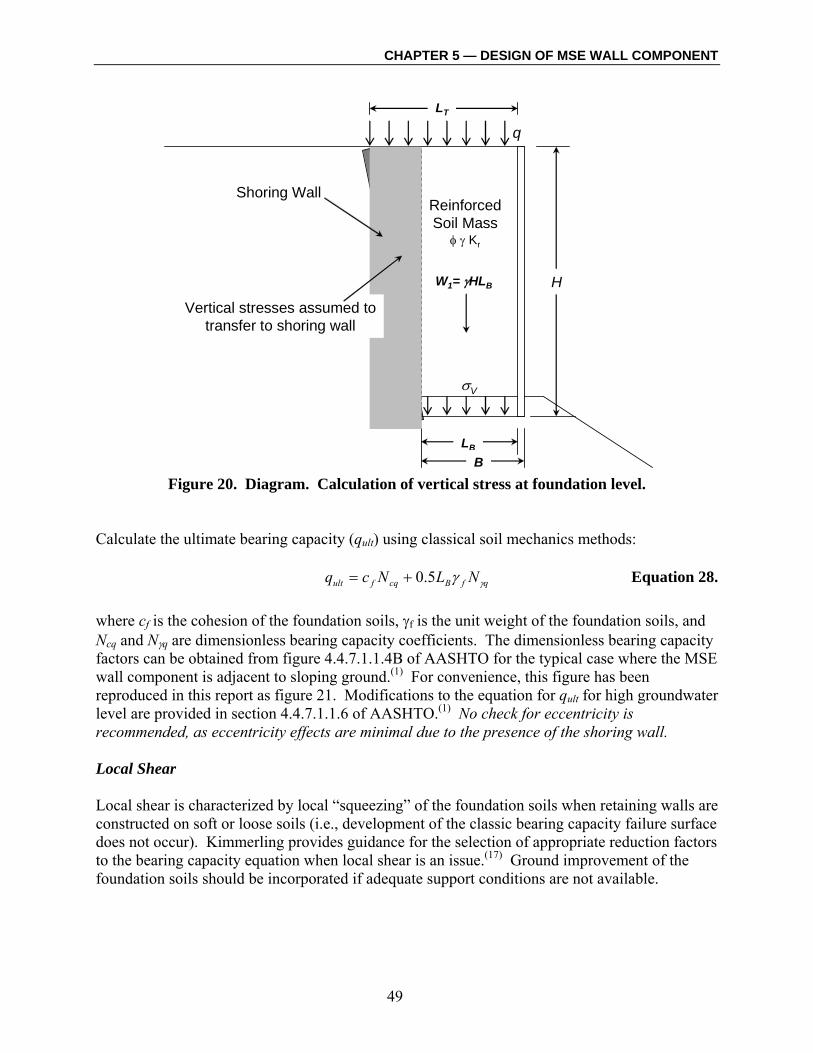
CHAPTER 5 — DESIGN OF MSE WALL COMPONENT
49
H
LB
Shoring WallReinforcedSoil Mass
φ γ Kr
B
W1= γHLB
q
σV
LT
Vertical stresses assumed totransfer to shoring wall
Figure 20. Diagram. Calculation of vertical stress at foundation level.
Calculate the ultimate bearing capacity (qult) using classical soil mechanics methods: qfBcqfult NLNcq γγ5.0+= Equation 28. where cf is the cohesion of the foundation soils, γf is the unit weight of the foundation soils, and Ncq and Nγq are dimensionless bearing capacity coefficients. The dimensionless bearing capacity factors can be obtained from figure 4.4.7.1.1.4B of AASHTO for the typical case where the MSE wall component is adjacent to sloping ground.(1) For convenience, this figure has been reproduced in this report as figure 21. Modifications to the equation for qult for high groundwater level are provided in section 4.4.7.1.1.6 of AASHTO.(1) No check for eccentricity is recommended, as eccentricity effects are minimal due to the presence of the shoring wall. Local Shear Local shear is characterized by local “squeezing” of the foundation soils when retaining walls are constructed on soft or loose soils (i.e., development of the classic bearing capacity failure surface does not occur). Kimmerling provides guidance for the selection of appropriate reduction factors to the bearing capacity equation when local shear is an issue.(17) Ground improvement of the foundation soils should be incorporated if adequate support conditions are not available.

CHAPTER 5 — DESIGN OF MSE WALL COMPONENT
50
Figu
re 2
1. C
hart
. M
odifi
ed b
eari
ng c
apac
ity fa
ctor
s for
foot
ing
adja
cent
to sl
opin
g gr
ound
.(1)
CHAPTER 5 — DESIGN OF MSE WALL COMPONENT
51
5.4.2 Settlement Discussion of settlement mechanics and analyses is beyond the scope of this document. For guidance on settlement analysis, see Kimmerling.(17) Unique aspects of SMSE walls in regard to settlement behavior are identified below. Settlement within the MSE mass itself must be considered. Significant settlement of the MSE mass is not likely to occur where compacted select granular fill is used for the reinforced fill zone. However, a tension crack behind the MSE mass at the top of the wall may result if the reinforced fill zone is constructed of material that does not meet recommended specifications for reinforced fill, as discussed in section 3.3.1. Settlements external to the MSE mass should be considered. The MSE wall base width, L, may be considerably shorter for the MSE wall component of an SMSE wall system than for a conventional MSE wall. The narrow MSE wall component may be more vulnerable to differential settlement if the foundation is compressible, thus producing an exaggerated outward rotation of the MSE mass and development of a tension crack above the interface. Extended upper reinforcement layers (figure 6) are recommended to mitigate this effect. Providing nominal facing batters for both the shoring wall interface and MSE wall face are expected to help mitigate differential settlement of the MSE mass. The MSE face should be specified at a practical batter for the type of system and facing contemplated. As discussed in chapter 3, battered construction of the shoring wall at 1H:14V or flatter is recommended. As discussed in chapter 3, one or more of the following are recommended for SMSE wall design: • Overlap at least two upper MSE reinforcement layers over the shoring wall section to a
minimum length of 0.6H or 1.5 m beyond the shoring, whichever is greater. Additional constraints regarding the geometry of the overlapped layers and related guidance are provided in chapter 3.
• Employ mechanical connection between the upper MSE wall reinforcing layers and shoring
wall components. • Use partial shoring construction when only the lower portion of the MSE wall is retained by
shoring with longer MSE reinforcements at the upper extent of the wall. The following additional details may be considered to reduce effects from differential wall settlement behavior: • Construction of a stepped shoring wall or interface. • Foundation improvement prior to construction of the MSE component.

CHAPTER 5 — DESIGN OF MSE WALL COMPONENT
52
5.5 GLOBAL STABILITY DESIGN As part of the design of the individual MSE wall and shoring components, stability internal to these individual components will have been achieved. However, a global stability evaluation of the SMSE wall system as a compound structure must also be evaluated. Stability analyses for the SMSE wall system should use conventional limit equilibrium analysis methods. As with any earth stability evaluation, selection of appropriate material parameters is of utmost importance in obtaining a realistic evaluation. In addition, the compound nature of the SMSE wall system requires defining other factors which affect its behavior. For many applications in steep or mountainous terrain, initial efforts at global stability analysis may produce inadequate factors of safety. A comprehensive treatise on slope stability analyses in these cases is beyond the scope of this report. (Refer to reference 21 for more information.) The following should be considered for projects with difficult global stability issues: • Confirm the accuracy of soil or rock strength parameters. Consider back-analysis of existing
slopes at the site or in the area to check strength parameters. • If back analysis of empirically stable slopes at the site produces apparent inadequate safety
factors, the strength parameters may be overly conservative. • Consider records or known slope stability experience in the area in conducting back analysis. • Avoid imposing unrealistic global stability factors of safety on a site with marginally stable
slopes. Global stability factors of safety should be consistent with other slope stability factors of safety at the site.
5.5.1 General Limit equilibrium stability analyses should be conducted to evaluate the stability of the SMSE wall system for the following global failure mechanisms: • Failure along the shoring/MSE interface. • Global stability external to the SMSE wall system. A limit equilibrium computer program such as Slide, UTEXAS, SLOPE/W, ReSSA, or others should be used to conduct global stability analyses. (See references 15, 18, 19, and 20.) Some design codes allow a rigorous approach to modeling stabilizing effects of embedded elements, while others will require the user to apply an effective “cohesion” to model reinforcement effects. The latter should be avoided, except for preliminary designs.

CHAPTER 5 — DESIGN OF MSE WALL COMPONENT
53
When selecting a method of analysis for a particular wall geometry, it is important to consider the likely shape of the failure surface, and thus whether a circular or noncircular method of analysis is the most appropriate.(21) Modeling of strength and behavior properties of foundation materials follows conventional practice. Foundations may be composed of soil, rock, or a combination of these, and modeling of the foundation must consider the effects of geologic structure and/or layering conditions. In some cases, special measures may be included to strengthen or improve poor quality foundation conditions. The following sections briefly discuss selection of appropriate foundation parameters. More comprehensive treatment of these topics can be found in Collin et al.(22) Soil Foundations The character of soil foundations can vary dramatically. As such, the appropriate assumptions for soil behavior are site-specific. Selection of soil parameters for SMSE wall design should be based on the results of a suitably-scoped foundation investigation. The scope of such a study depends on the type and size of the structure and expected variability of foundation conditions. Some general guidelines for geotechnical investigations prior to design of SMSE wall systems are provided in chapter 4. Soil strength is generally modeled using Mohr-Coulomb criteria, which defines soil strength in terms of the internal friction angle (φ) and cohesion (c). These properties are generally derived from laboratory testing of shear strength by using either direct shear or triaxial shear test methods.(8, 23) In most cases, peak strength is used in the stability analysis. However, in cases where foundation soils have been disturbed, such as by ground movement, a residual friction angle and zero cohesion may be appropriate. Rock Foundations Rock foundations can be highly variable in character and the assumptions for strength and stability behavior must be tailored to the specific conditions. Stability analysis of a rock foundation must include consideration of failure along rock discontinuities and within the rock mass itself. Kinematic stability analysis is used to evaluate the potential for failures due to sliding along joints, fractures, or bedding planes. For this type of failure, stability is dependent on the friction along the joint planes and the attitudes of the discontinuities relative to geometry of the foundation slope and structure. Methods such as Markland analysis, using stereographic projection techniques, or commercially available computer programs for block failure analysis are generally used to evaluate these failures.(24) Overall rock mass stability can be evaluated using a limit-equilibrium model. In most cases, rock mass strength is characterized by Hoek-Brown criteria, which defines a nonlinear relationship between shear and normal stress.(25) Hoek-Brown parameters are generally determined from the information gathered during rock coring and/or detailed rock surface mapping. This type of approach applies to brittle, fractured rock masses. Where the rock mass is weak and more soil-like, a Mohr-Coulomb criterion is generally preferred.
CHAPTER 5 — DESIGN OF MSE WALL COMPONENT
54
Combined Soil and Rock Foundations Analysis of a foundation which includes both soil and rock may require a combination of all of the approaches discussed previously. Failure through the foundation may include more than one failure mechanism. For example, in a soil over rock foundation, failure of the foundation could be a combination of a rotational failure in the soil, and kinematic wedge failure in the rock. Most limit equilibrium stability analysis computer programs have the flexibility to model such complex geometries. However, effective use of such models requires a thorough knowledge of the foundation geology and nature of the materials. 5.5.2 MSE Wall/Shoring Interface A specific characteristic of the SMSE wall system is the creation of an interface between the MSE wall and shoring portions of the composite structure. This interface provides a potential plane of weakness (or failure surface) through the structure. This interface may be constructed in such a way as to increase the resistance to shear along the interface by one of the following methods (discussed in chapter 3): • Extend upper MSE reinforcements over the top of the shoring wall. • Construct the shoring wall at a batter or as a stepped structure. • Provide a mechanical connection between the MSE wall and shoring wall components. The steps for evaluation of stability along the interface are summarized as follows: Step 1 – As a first evaluation of interface shear stability, assume zero shear strength along the shoring/MSE interface (i.e., full development of a tension crack). Evaluate stability of the failure mechanism illustrated conceptually in figure 22. If the factor of safety is adequate (i.e., FSis ≥ 1.5), no further analysis of this failure mechanism is required. Step 2 – If the factor of safety is not adequate assuming zero shear resistance along the interface, incorporate shear resistance along the interface and re-evaluate. The shear resistance should be estimated as follows: 1. Estimate the interface friction angle, �i, between the reinforced soil and the shoring wall
using table 3. 2. Model the interface with a nominal thickness having an effective friction angle of �i, (see
table 3) and zero cohesion. 3. Conduct limit equilibrium stability analysis forcing failure along the interface, illustrated in
figure 23.

CHAPTER 5 — DESIGN OF MSE WALL COMPONENT
55
Failure surface
Assume zero shearstrength at interface
Model MSE wall andsurcharge loads as
distributed load
Shoring wallMSE wall
Figure 22. Diagram. Conceptual failure surface and design methodology assuming
zero interface shear strength.
Step 3 – If an acceptable factor of safety is still not achieved by considering shear resistance along the interface, then consider the effect of extending the upper reinforcement layers over the shoring wall. 1. Model the MSE wall component, including the geometry of the extended reinforcements.
The MSE wall component may be modeled simplistically as a coherent block with cohesion and friction, or rigorously using a sophisticated stability analysis program which enables the use of elements representing the reinforcements
2. Continue modeling the remainder of the interface as indicated in step 2, above. If adequate stability is not achieved based on this analysis, one or several of the following measures must be taken: • Employ foundation stabilization measures (e.g., micropiles, stone columns, jet grouting,
remove and replace, etc.) to strengthen the foundation. • Modify SMSE wall system geometry (e.g., wall batter, stepped wall geometry, longer MSE
reinforcements, greater setback or embedment, etc.). • Improve shearing resistance along interface by selecting a different shoring wall surface with
higher roughness coefficient or built in irregularities, or using higher strength fill. • Connect the MSE reinforcement to the shoring system.
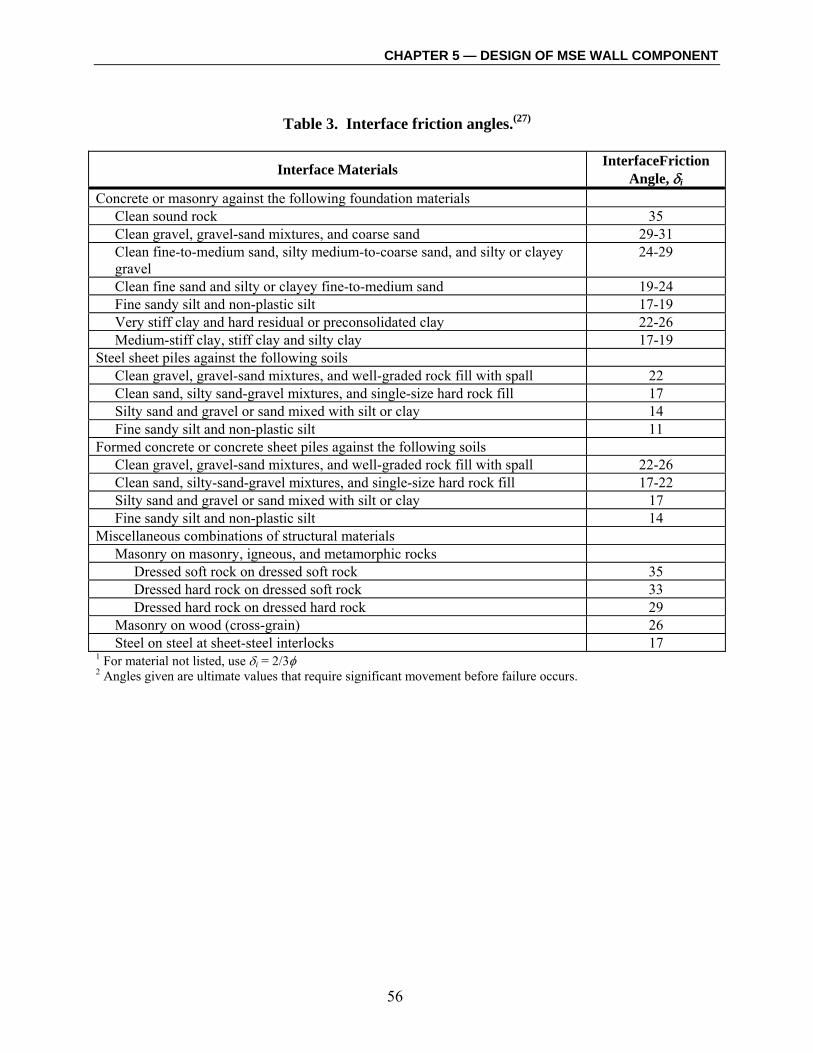
CHAPTER 5 — DESIGN OF MSE WALL COMPONENT
56
Table 3. Interface friction angles.(27)
Interface Materials InterfaceFriction Angle, δi
Concrete or masonry against the following foundation materials Clean sound rock 35 Clean gravel, gravel-sand mixtures, and coarse sand 29-31 Clean fine-to-medium sand, silty medium-to-coarse sand, and silty or clayey gravel
24-29
Clean fine sand and silty or clayey fine-to-medium sand 19-24 Fine sandy silt and non-plastic silt 17-19 Very stiff clay and hard residual or preconsolidated clay 22-26 Medium-stiff clay, stiff clay and silty clay 17-19
Steel sheet piles against the following soils Clean gravel, gravel-sand mixtures, and well-graded rock fill with spall 22 Clean sand, silty sand-gravel mixtures, and single-size hard rock fill 17 Silty sand and gravel or sand mixed with silt or clay 14 Fine sandy silt and non-plastic silt 11
Formed concrete or concrete sheet piles against the following soils Clean gravel, gravel-sand mixtures, and well-graded rock fill with spall 22-26 Clean sand, silty-sand-gravel mixtures, and single-size hard rock fill 17-22 Silty sand and gravel or sand mixed with silt or clay 17 Fine sandy silt and non-plastic silt 14
Miscellaneous combinations of structural materials Masonry on masonry, igneous, and metamorphic rocks
Dressed soft rock on dressed soft rock 35 Dressed hard rock on dressed soft rock 33 Dressed hard rock on dressed hard rock 29
Masonry on wood (cross-grain) 26 Steel on steel at sheet-steel interlocks 17
1 For material not listed, use δi = 2/3φ 2 Angles given are ultimate values that require significant movement before failure occurs.
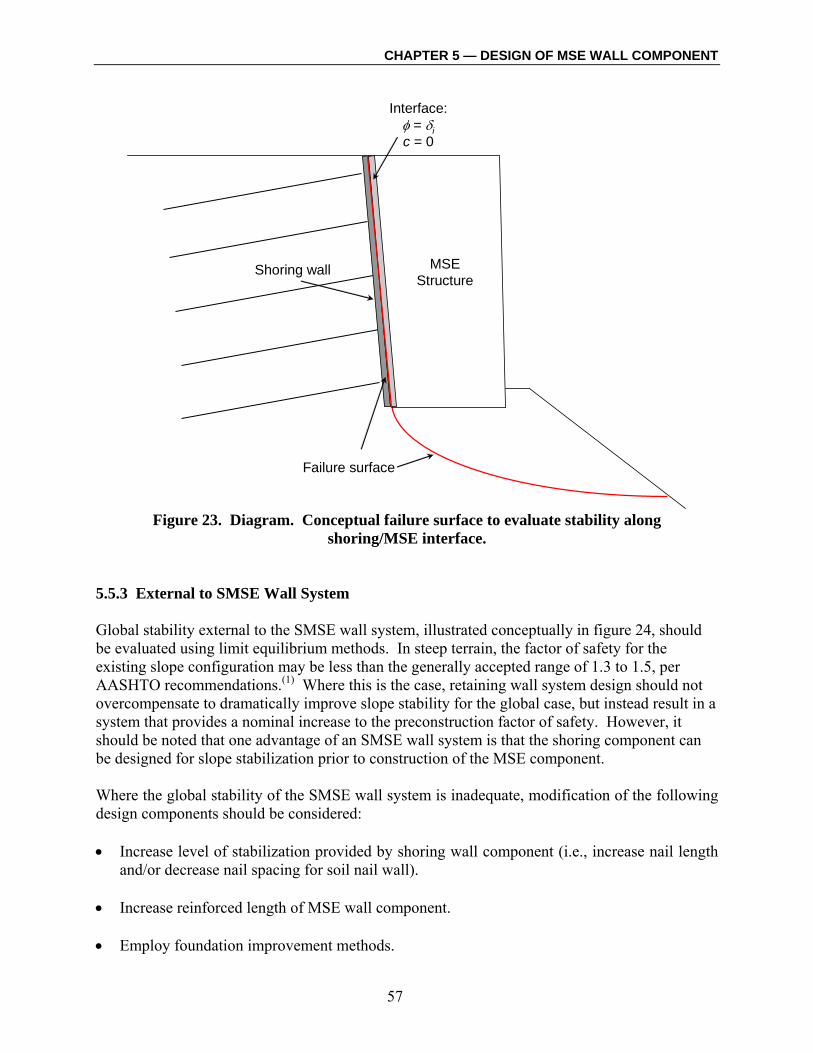
CHAPTER 5 — DESIGN OF MSE WALL COMPONENT
57
Failure surface
Interface:φ = δic = 0
Shoring wall MSEStructure
Figure 23. Diagram. Conceptual failure surface to evaluate stability along
shoring/MSE interface. 5.5.3 External to SMSE Wall System Global stability external to the SMSE wall system, illustrated conceptually in figure 24, should be evaluated using limit equilibrium methods. In steep terrain, the factor of safety for the existing slope configuration may be less than the generally accepted range of 1.3 to 1.5, per AASHTO recommendations.(1) Where this is the case, retaining wall system design should not overcompensate to dramatically improve slope stability for the global case, but instead result in a system that provides a nominal increase to the preconstruction factor of safety. However, it should be noted that one advantage of an SMSE wall system is that the shoring component can be designed for slope stabilization prior to construction of the MSE component. Where the global stability of the SMSE wall system is inadequate, modification of the following design components should be considered: • Increase level of stabilization provided by shoring wall component (i.e., increase nail length
and/or decrease nail spacing for soil nail wall). • Increase reinforced length of MSE wall component. • Employ foundation improvement methods.

CHAPTER 5 — DESIGN OF MSE WALL COMPONENT
58
Figure 24. Diagram. Conceptual global stability failure surface.
5.6 SEISMIC STABILITY Design of both the MSE wall component and the shoring wall component of an SMSE wall system must consider seismic loading. Seismic design of the MSE wall portion should follow the guidelines presented in Elias et al. and AASHTO.(1,2) A brief discussion is provided in this section. During an earthquake, the retained fill exerts a dynamic horizontal thrust, PAE, on the SMSE wall system in addition to the static thrust. The reinforced soil mass is subjected to a horizontal inertia force, PIR, equivalent to:
MIR AMP ⋅= Equation 29. where M is the mass of the active portion of the MSE portion of the SMSE system and AM is the maximum horizontal acceleration in the reinforced soil wall. The force, PAE, can be evaluated by the pseudo-static Mononobe-Okabe analysis and added to the static forces acting on the SMSE system.(60) The dynamic stability with respect to external stability is evaluated considering both the static and dynamic forces. The allowable minimum dynamic factor of safety for external stability is 75 percent of the required static factor of safety.

CHAPTER 5 — DESIGN OF MSE WALL COMPONENT
59
The internal design of the SMSE system under seismic loads includes an inertial force, PIR, acting horizontally, in addition to the existing static forces. The inertial force will result in increased tensile force on the reinforcement. It is assumed that the location and slope of the maximum tensile force line does not change during seismic loading. Both the tensile strength and pullout capacity of the reinforcement should be evaluated considering both the static and dynamic internal forces. The factor of safety for pullout should be reduced to 75 percent of the static required factor of safety. The allowable strength of the reinforcement is also adjusted to account for the short term duration of the seismic load. See Elias et al. for further guidance.(2) 5.7 CONNECTION STRENGTH DESIGN Design of the MSE wall facing connections should be conducted according to AASHTO.(1) Walls designed in accordance with these guidelines will usually not require connection of the MSE mass to the shoring wall. However, where such connections are used, the engineer should consider connection strength, all possible failure modes, corrosion protection, and removal of slack in connection components and MSE reinforcements. Current practice does not provide the engineer with a rigorous method for calculating the strength of connections between the MSE wall mass and the shoring wall. Research conducted in conjunction with development of these guidelines did not include quantitative strength testing of such connections. However, where connections to the shoring wall are utilized, full strength connections are not likely to be necessary (i.e., connections that develop the full strength of the MSE reinforcing layer). Consideration of failure modes for the wall system that involve connections (such as failure mode 4 from figure 13) may provide the engineer with the connection strength needed. Corrosion should be considered in the connection design, with protection consistent with similar permanent applications, in accordance with AASHTO.(1) Both design and construction methods should be implemented to minimize slack in the connection. 5.8 MSE WALL BEHAVIOR When designing an SMSE wall system, consideration should be given to the long-term behavior of each of the individual wall systems. In this section, the behavior of the MSE wall is discussed. Most lateral displacements occur during construction for MSE walls, and are a function of compaction efforts, vertical reinforcement spacing, reinforcement length, facing connection, facing type, and construction means and methods.(2) Anticipated deformations are theoretically greater for MSE walls constructed with extensible (i.e., polymeric) reinforcements than for walls constructed using inextensible (i.e., steel) reinforcements. With regard to settlement behavior, MSE walls constructed on medium dense to dense granular soils generally exhibit small foundation settlement, occurring mostly during wall construction. Differential settlement is usually only a fraction of the total settlement, but exceptions may occur
CHAPTER 5 — DESIGN OF MSE WALL COMPONENT
60
where the foundation is highly variable, for example, along the contact between soil and bedrock, or over large boulders. Differential settlement can also occur along steep slopes, where the foundation soils near the face of the wall are significantly less confined than beneath the heel of the wall. Adequate embedment and setback minimize this tendency. Saturated cohesive soils, however, may exhibit large time-dependent deformations.(11) It may be appropriate to wait for most of this settlement to occur prior to placement of final pavement or facing. If the MSE wall and the shoring system do not employ mechanical connections, or if upper MSE reinforcements do not extend over the shoring wall component, then behavior of the MSE portion of the SMSE wall system will be similar to a conventional MSE wall in many ways. If the foundation is prone to differential settlement, the wall may rotate outward slightly, causing cracking parallel to or along the MSE/shoring interface. The abrupt and relatively rigid interface will tend to focus differential settlement to the area immediately above the shoring, and cracking will likely result. The extended upper reinforcements (to 0.6H or longer) will minimize this, as will connections between the reinforcements and the shoring. Connections should be free of slack so that the displacement necessary to mobilize their strength is considerably less than that associated with unacceptable performance at the ground surface or wall face.
CHAPTER 6 — SHORING COMPONENT DESIGN CONSIDERATIONS
61
CHAPTER 6 — SHORING COMPONENT DESIGN CONSIDERATIONS
The shoring component of the SMSE wall system must be compatible with the MSE wall component. This is primarily a geometric concern, but global stability considerations may also govern the design, and may even require adjustment of either the shoring component or the MSE component to provide for an effective wall system design. This chapter provides an overview of design considerations regarding shoring walls for SMSE wall systems, with an emphasis on soil nailing. The design methodology presented in this report is based on soil nail walls as the shoring component, because soil nailing is a common shoring method for sites where SMSE wall systems are applicable. Soil nail walls also have an advantage with respect to global stability in that they reinforce the soil behind the shoring wall in much the same way that MSE reinforcements do for the MSE mass. As a result, soil nail walls are advantageous as the shoring method for use with SMSE systems. However similar construction considerations apply if other shoring systems are selected, and these guidelines are a useful starting point for design of SMSE systems with other shoring methods. Where soil nailing is selected as the shoring wall component, design methodology should generally follow that outlined in Geotechnical Engineering Circular No. 7 – Soil Nail Walls.(26) The wall designer is referred to this resource, and other available information on soil nail technology, for understanding, evaluating, and designing the shoring portion of the SMSE wall system when a soil nail wall is anticipated. 6.1 COMMON TYPES OF SHORING WALLS Several shoring techniques are available for SMSE wall systems, including: • Soldier pile and lagging wall with or without tie-backs(33) – Soldier pile and lagging walls are
constructed by driving/drilling piles through the proposed excavation depth, and lagging is placed in between the piles as the soil is excavated in stages downward. This wall system may not be feasible for construction in hard ground conditions, where obstructions exist, or where noise and vibrations must be limited. Tie-backs may be utilized to avoid overstress of cantilevered soldier piles.
• Sheet-pile wall with or without tie-backs(34) – Sheet-pile walls are constructed in one phase
where interlocking sheet-piles are driven to the final design elevation (below the proposed excavation). This wall type has similar limitations to the soldier pile and lagging wall, discussed above. As with soldier piles, tie-backs may be used to avoid overstress due to large cantilever lengths.
• Soil nail wall(26,32) – Soil nail walls are constructed using top-down techniques and involve
installation of closely-spaced steel bars drilled and grouted in place to reinforce and strengthen the existing ground behind the excavation. Soil nail walls allow more construction flexibility than certain other shoring systems with regard to construction in

CHAPTER 6 — SHORING COMPONENT DESIGN CONSIDERATIONS
62
heterogeneous soil/rock conditions, overhead access, reduced right-of-way requirements (i.e., soil nails are typically shorter in length than tie-back anchors), and reduction of embedment depth.
• Tangent or secant pile wall(29) – Tangent or secant pile walls are constructed by installing one
or more rows of closely spaced (tangent or slightly overlapping) steel reinforced drilled caissons along the wall alignment, with required embedment. This wall type may be constructed where sensitivity to vibration renders sheet-pile or soldier beam construction not feasible, or where the shoring wall component cannot extend laterally behind the wall (i.e., in the case of tie-backs or soil nails).
6.2 SOIL NAIL WALL DESIGN FOR SMSE WALLS Soil nails function as a reinforcing system working in association with the strength of the soil to form a coherent gravity mass capable of resisting lateral forces. The soil nail system is very flexible in its application, and any number of variations can be devised to meet specific project requirements. However, a typical soil nail wall application for an SMSE wall system would consist of: • Soil Nails –Corrosion-protected (permanent) rigid steel bars centered in drilled holes and
grouted over their entire length. Typical drill hole diameters are 125 to 200 millimeters (mm). The steel bars are capable of carrying tensile and shear stresses, as well as bending moments.
• Facing – A relatively thin (100 mm to 150 mm) permanent reinforced shotcrete facing is
applied to the excavation face and connected to the soil nail heads after the nails are installed. For SMSE wall system applications, construction of a single facing layer is adequate, though corrosion protection of the nail heads, bearing plates and reinforcing elements is required for long-term sustainability of the structure. The shotcrete is placed in the appropriate thickness and reinforced with either a wire mesh (with waler and bearing bars) or mats of tied reinforcing bars according to nail head strength requirements.
• Drainage – Strips of drainage fabric extending vertically behind the facing connected to
weepholes, consisting of 5 cm (plus or minus) diameter polyvinyl chloride (PVC) pipe extending through the shotcrete facing, are used for wall drainage. The drainage fabric should begin a minimum of 150 mm below the top of the excavation to prevent surface water infiltration behind the wall.
• Sequencing – For shoring applications, the soil nails are installed in a lift-by-lift sequence as
the excavation progresses. A lift of soil is excavated (generally limited to 1.8 m in height), holes are drilled at a nominal declination (i.e., 15 degrees) at each soil nail location, nails are installed and grouted in-place, wall reinforcing steel and drainage provisions are installed, shotcrete is placed on the face of the excavation, and immediately thereafter (while the shotcrete is wet) bearing plates are placed and hand-tightened.

CHAPTER 6 — SHORING COMPONENT DESIGN CONSIDERATIONS
63
Several criteria should be met for the site soils to be considered appropriate for soil nail construction, including: • Adequate stand-up time to allow preparation of the wall face (typically 24 to 36 hours)
without excessive deformation or sloughing of the near-vertical excavation. • Acceptable bearing capacity to preclude a bearing failure at the full height of excavation and
at each construction phase. • Sufficient soil strength and stiffness to meet the deformation criteria imposed for the project
shoring system. • The regional water table should occur below the base of the excavation, or should be drawn
down beneath the base of the excavation. If the onsite soil and groundwater conditions do not meet these criteria, alternative shoring systems should be considered, as mentioned previously (i.e., soldier pile, sheet-pile, etc.) In order to provide long-term support of the excavation for SMSE wall construction, the soil nail shoring component should incorporate provisions for a permanent structure, as follows: • Provide corrosion protection for soil nails, consisting of epoxy coating or high density
polyethylene (HDPE) double corrosion protection, based on the aggressiveness or corrosivity of the onsite soils.(26)
• Install drainage components which are either connected to permanent wall drainage for the
MSE wall or with outlets through the face of the MSE wall, preventing build-up of hydrostatic pressures behind the shoring component, discussed in section 3.3.3.
• Construct only one layer of shotcrete facing when the nail heads and bearing plates are
protected from corrosion (i.e., encapsulation of nail head in the shotcrete construction facing or application of epoxy coating on exposed steel), or construct two layers of shotcrete facing to provide cover for all steel components.
It is also recommended that the shotcrete facing be left as an “as-shot” or “gun” finish enhancing the shearing resistance between the two walls. In addition to the above, soil nail reinforcements for SMSE wall system construction should satisfy the following minimum requirements: • Nails should extend to a minimum of 0.7H behind the face of the proposed MSE wall,
comparable to an equivalent conventional MSE wall. (See references 1, 2, and 35.) • Nail length, Lz, at any depth (z) should satisfy:

CHAPTER 6 — SHORING COMPONENT DESIGN CONSIDERATIONS
64
Q
SSFSL hvhPO
Zσ
≥ Equation 30.
where Q is the ultimate nail pullout resistance, FSPO is the factor of safety against nail pullout (equal to 1.35 for permanent shoring construction of non-critical structures and 1.5 for critical structures), Sh and Sv are the horizontal and vertical nail spacing, respectively, and σh is the design horizontal pressure for a conventional MSE wall at the nail head location.(26) The design horizontal pressure is calculated using equations 3 and 4 in chapter 5, but the retained fill unit weight (γr) is substituted for the reinforced fill unit weight (γ).
• Nail tensile capacity (Tn) at any depth should satisfy: vvhtn SSFST σ≥ Equation 31.
where FSt is the nail tensile capacity factor of safety (equal to 1.8), and vσ is the design vertical pressure at the nail head location.(26) The design vertical pressure is calculated using equation 4 in chapter 5, but the retained fill unit weight (γr) is substituted for the reinforced fill unit weight (γ).(26) Design of the soil nail wall shoring system should otherwise be conducted according to procedures outlined in available design guidelines.(26,32)
6.3 SHORING WALL BEHAVIOR Consideration should be given to the long-term behavior of each of the individual wall components, which may influence project design details. For instance, the shoring wall should be designed for a life of 75 years to be compatible with the MSE wall design life. In this section, the behavior of the shoring wall is discussed, with recommendations to reduce the potential for differential behavior between the soil nail and MSE wall types. The fundamental mechanics behind soil nailing involves development of tensile forces in the passive reinforcements (or nails) resulting from the restraint provided by the nails and facing to lateral deformation of the structure.(26) Because soil nail walls involve top-down construction, the reinforced zone has a tendency to rotate outward about the toe as lateral support is removed during excavation. This outward rotation is part of the process mobilizing tensile loads within the nails and is expected to be very small, ranging from 0.4 percent of the wall height for fine-grained clay type soils to 0.1 percent or less of the wall height for weathered rock and competent dense soil.(32) As a result, maximum horizontal movements for soil nail walls occur at the top of the wall, decreasing toward the base of the wall. In order to reduce deformations at the top of the wall, use of minimum No. 25 Grade 520 bar for the top row of nails is recommended. Settlement of the soil nail wall facing also occurs. Settlement is a function of construction rate, nail spacing, excavation lift heights, nail and soil stiffness, global factor of safety, nail inclination, bearing capacity of foundation soils, and magnitude of facing and surcharge loading.(26)

CHAPTER 6 — SHORING COMPONENT DESIGN CONSIDERATIONS
65
Once the soil nail wall is constructed to its full height, construction of the MSE wall will follow in a bottom-up fashion. The MSE wall component will provide restraint to the shoring wall, impeding additional lateral deflections. Therefore, most of the lateral deformation of the shoring wall is expected to occur during excavation and prior to MSE construction. In contrast, settlement may continue during and beyond the construction of the MSE wall component. With regard to SMSE walls systems, the unique issues are: • Soil nail wall movement will generally happen before the MSE wall is constructed and is
inelastic (i.e., soil and nails have mobilized their strength and will not be pushed “back into place”).
• The MSE mass will provide normal and shear forces to the soil nail facing during
construction and long-term. • The facing and nails need to be able to handle external loading from the MSE mass and
transfer it to the soil behind and below the wall, which may be accomplished by ensuring intimate contact between the facing and the cut slope, and possibly incorporating a shotcrete footing for the bottom lift.


CHAPTER 7 — DESIGN EXAMPLE
67
CHAPTER 7 — DESIGN EXAMPLE
A typical application for design of the MSE wall component of an SMSE wall system with extensible geogrid reinforcements and wire facing units is presented in this chapter using the sequential design procedure outlined in chapter 5. This design example is illustrated in figure 25.
6 m
1.51
ψ
LB
d
H
β
14
1
Figure 25. Illustration. Illustration of design example.
7.1 INTERNAL STABILITY DESIGN Step 1 – Select MSE wall type and trial wall geometry. The geometry of the MSE wall and details of the preliminary design, including applied loading, are: • Exposed wall height, Hd = 6 m. • Slope at toe of wall = 1.5H:1V = 3H:2V. Depth of embedment, d = Hd/5 = (6 m)/5 = 1.2 m
per table 2 in chapter 3. Verification of this depth of embedment will come later through bearing capacity and global stability analyses. Therefore, the total wall height (H) is 7.2 m.

CHAPTER 7 — DESIGN EXAMPLE
68
• MSE facing unit height = 0.46 m. Given the facing unit size, assign a trial vertical spacing of 0.46 m, allowing for the height of one facing unit per each reinforcement, and considering the maximum recommended vertical reinforcement spacing of 0.6 m for SMSE walls.
• Based on the geometrical constraints and need to keep traffic lanes open for construction of
the MSE wall, a shoring wall is required. The shoring wall will consist of a soil nail wall with a batter of 1H:14V and a shotcrete facing. The shoring wall will be constructed for partial back-slope shoring, where the upper two MSE reinforcements will extend over the shoring wall interface.
• The MSE wall facing will be installed near-vertically. • Provide a minimum horizontal bench of 1.2 m wide in front of the wall since it is founded on
a slope.(2) • Based on site access restrictions and trial wall geometry, a base width of 2.2 m for the MSE
wall component is selected, which is approximately equivalent to the minimum required reinforcement length of 0.3H.
• Geogrid reinforcements will have 100 percent coverage. • Wall to be designed for traffic surcharge, q = 12 kPa. Step 2 – Estimate the location of the critical failure surface. Per figure 14 in section 5.3, the critical failure surface may be approximated using the theoretical active failure surface within the reinforced soil mass at the base of the wall, with the remaining portion intersecting the interface of the shoring and MSE wall components. In order to estimate the location of the critical failure surface, the engineering properties of the reinforced fill and foundation soils must be established, as follows, based on the results of a site-specific geotechnical investigation: • Reinforced fill parameters: φ' = 34o, γ = 18.5 kN/m3 for reinforced backfill meeting the
specifications presented in section 3.3.1. • For extensible reinforcements, ψ = 45 o + φ'/2 = 62o. • Foundation parameters: '
fφ = 35o (colluvial clayey gravel, dense), cf = 10 kPa, and γf= 19 kN/m3.
Step 3 – Calculate internal stability with respect to rupture of the reinforcements. The calculation for reinforcement rupture is as follows: • Lateral stress ratio (Kr/Ka) is one for extensible reinforcements, per figure 16 in chapter 5.

CHAPTER 7 — DESIGN EXAMPLE
69
• Calculate the active earth pressure coefficient, Ka:
283.02'45tan 2 =⎟⎠⎞
⎜⎝⎛ −=
φaK
• At each reinforcement level, calculate the horizontal stress, σh, along the potential failure line
from the weight of the reinforced fill, plus uniform surcharge loads, and concentrated surcharge loads (∆σh, ∆σv) using equations 3 and 4 in chapter 5. The horizontal stress at each reinforcement level is presented in figure 26. Using the horizontal stress, σh, calculate the maximum tension per unit width of wall at each reinforcement level based on the vertical reinforcement spacing, sv (0.46 m), using equation 5 in chapter 5. Figure 26 summarizes the reinforcement rupture calculations conducted for this design example.
Based on reinforcement rupture calculations, the lowermost reinforcement requires an allowable strength of approximately 19 kN/m. Geogrid with a lower allowable strength may be installed near to the top of the wall. However, for this example, assume use of a geogrid with an allowable tensile strength of 25 kN/m (Geogrid 25) for all reinforcement layers. Step 4 – Calculate the required total tensile capacity of MSE reinforcements. Calculate the required pullout force, Tmax, for MSE reinforcements in the resistant zone per equation 14 in chapter 5. The pullout force calculation for this design example is presented in figure 27. The required pullout force per unit width of wall is approximately 136 kN/m. Step 5 – Calculate the pullout resistance of MSE reinforcements in the resistant zone. Calculate the total pullout resistance of the designed MSE reinforcements, and compare the result to the required pullout capacity, Tmax, calculated in step 4, above: • Based on the designed reinforcement vertical spacing of 0.46 m, calculate the length of
embedment, Lei, of each reinforcement layer within the resistant zone using equation 18 in chapter 5, modified geometrically due to the shoring wall batter. The embedment length calculations are provided in figure 28.
• At each reinforcement layer within the resistant zone, calculate the pullout resistance, FPO,
per equation 19 in chapter 5:
allowableceivip
PO TCRLFFS
F ≤= ασ*1
o Due to the narrow wall width and potential for arching at the wall base, the factor of
safety against reinforcement pullout, FSp, is taken as 2.0, per section 3.2. o Assume 'tan8.0* φ=F = 0.8 tan (34°) = 0.54, for geogrid reinforcement in granular soil.

CHAPTER 7 — DESIGN EXAMPLE
70
o Reinforcement effective unit perimeter, C = 2.
o Scale effect correction factor, α, to account for a nonlinear stress reduction over the
embedded length of highly extensible reinforcements. Use 0.8 for geogrids.
o Coverage ratio, Rc = 1.
o The vertical stress, σvi, excludes surcharge loading.
The calculated pullout resistance at each reinforcement level is summarized in figure 28. The total pullout capacity of the reinforcements, sum of FP0 at each reinforcement level, of 221 kN/m is greater than Tmax (136 kN/m), calculated above in step 4. Therefore, the reinforcement design for the MSE wall component of the shoring wall is considered adequate to achieve internal stability (e.g., FS > 1.5). 7.2 EXTERNAL STABILITY DESIGN After internal design of the MSE wall portion of the SMSE wall system is complete per steps 1 through 5 outlined in section 7.1, then design of the MSE wall component with regard to external stability is conducted. This includes evaluation of the wall with regard to bearing capacity and settlement. 7.2.1 Bearing Capacity Check • Check the MSE wall for bearing capacity stability by calculating the vertical stress at the
base of the wall, σv, using equation 27 in chapter 5.
( ) ( ) kPa 145m 2.2
m) 2.2kPa 12m 2.2m 7.2kN/m 18.5 3
=⋅+⋅⋅
=⋅+
=1
11v L
LqWσ
• Calculate the ultimate bearing capacity of the soil using classical soil mechanics according to
equation 28 in chapter 5. Use figure 21 in chapter 5 to estimate the bearing capacity factors, Ncq and Nγq, for a footing adjacent to sloping ground:
o Slope stability factor: Ns = 0 for base width less than height of slope.
o Distance of foundation from edge of slope: b/B = 1.2 m/2.2 m = 0.55.
o Foundation depth divided by width: Df/B = 1.2 m/2.2 m = 0.55.
o Inclination of slope: ( ) oi 7.335.11tan 1 == − .
o Bearing capacity factors Ncq and Nγq are estimated as 5.5 and 40, respectively, using
figure 21.

CHAPTER 7 — DESIGN EXAMPLE
71
o The ultimate bearing capacity is calculated as:
kPa 891)(40)kN/m m)(19 0.5(2.25.5)kPa (10 3 =+⋅=ultq
• Apply a factor of safety to the ultimate bearing capacity, qult, to calculate the allowable bearing capacity, qa:
kPa 3562.5
kPa 891===
bc
ulta FS
• Compare the allowable bearing pressure to the calculated vertical stress. If the vertical stress
is less than the allowable bearing capacity, the MSE wall is stable with regard to bearing capacity of the foundation:
kPa 145=vσ ≤ 356 kPa = qa, therefore O.K. If the recommended bearing capacity is not achieved, the base width of the MSE wall component should be increased or foundation improvement measures implemented. 7.2.2 Settlement Check Check settlement of the wall and foundation using guidelines presented in other references.(17) 7.3 GLOBAL STABILITY DESIGN
Global stability design of the SMSE wall system includes checking the following failure mechanisms: failure along the shoring/MSE interface and global stability external to the SMSE wall system under static and pseudo-static loading conditions. 7.3.1 MSE Wall/Shoring Interface Stability Check As a first evaluation, assume zero shear strength along the interface (i.e., full development of a tension crack). This may be approximated by applying a distributed load in place of the MSE wall component. The distributed load, vσ , is calculated in step 6 above in section 7.1 (i.e., 145 kPa). Figure 29 presents results of interface shear stability for this design example, evaluated using Slide, a limit equilibrium stability software program.(15) The factor of safety against failure for this mechanism is about 1.5, which is considered acceptable. Therefore, no further analysis of this failure mechanism is required. If the factor of safety calculated above is less than acceptable for the specific project, additional analyses should be conducted to evaluate the interface stability. First, the interface should be modeled with a nominal width using an interface friction angle corresponding to the estimated friction angle between the reinforced fill and the shoring wall, as summarized in table 3 (chapter 5). For a rough shotcrete surface against clean gravel or gravel-sand mixtures, as anticipated for

CHAPTER 7 — DESIGN EXAMPLE
72
the reinforced fill zone of the MSE wall, the interface friction angle is in the range of 29 to 31 degrees. The interface should then be analyzed using the failure surface illustrated in figure 23 presented in chapter 5. If an adequate factor of safety is still not achieved, consider modifications to the shoring wall geometry (i.e., stepped interface), or implementing foundation improvement measures. 7.3.2 Stability External to SMSE Wall System Once a design is developed for the shoring wall component, stability analysis of the combined SMSE wall system is required to check the various global failure mechanisms. Analyses should include pseudo-static analysis of the SMSE wall system under the design seismic acceleration, where a factor of safety greater than 75 percent of the static factor of safety for the same failure mechanism is considered acceptable. This analysis has not been included in this report, as it follows common practice and is not unique to SMSE wall systems.

CHAPTER 7 — DESIGN EXAMPLE
73
Input FieldsCalculated Fields
Wall height (m): 6Embedment depth (m): 1.2Soil unit weight (kN/m3): 18.5MSE wall batter (deg): 0Inclination of MSE facing (degrees 90Friction angle (degrees): 34
Reinforcement spacing (s)1 (m): 0.46Coverage Ratio (Rc): 1Reinforcement type: Geogrid
Uniform surcharge, q (kPa): 12
Ka = 0.283
Layer (Bottom-upward): z (m) Kr/Ka
2 Kr ∆σv3
σv at reinforcement
level (kPa) ∆σh4
σh at reinforcement
level (kPa)
Τi at reinforcement level (kN/m)
1 7.2 1.00 0.283 0.0 145.2 0.0 41.1 18.92 6.74 1.00 0.283 0.0 136.7 0.0 38.6 17.83 6.28 1.00 0.283 0.0 128.2 0.0 36.2 16.74 5.82 1.00 0.283 0.0 119.7 0.0 33.8 15.65 5.36 1.00 0.283 0.0 111.2 0.0 31.4 14.56 4.9 1.00 0.283 0.0 102.7 0.0 29.0 13.37 4.44 1.00 0.283 0.0 94.1 0.0 26.6 12.28 3.98 1.00 0.283 0.0 85.6 0.0 24.2 11.19 3.52 1.00 0.283 0.0 77.1 0.0 21.8 10.010 3.06 1.00 0.283 0.0 68.6 0.0 19.4 8.911 2.6 1.00 0.283 0.0 60.1 0.0 17.0 7.812 2.14 1.00 0.283 0.0 51.6 0.0 14.6 6.713 1.68 1.00 0.283 0.0 43.1 0.0 12.2 5.614 1.22 1.00 0.283 0.0 34.6 0.0 9.8 4.515 0.76 1.00 0.283 0.0 26.1 0.0 7.4 3.416 0.3 1.00 0.283 0.0 17.6 0.0 5.0 2.3
Notes:1. Vertical reinforcement spacing to be consistent with selection of wall facing.2. Ratio to be input based on type of reinforcement selected and use of figure above.3. Calculate the increment of vertical stress due to concentrated loads at the surface using the 2:1 method at each reinforcement layer.4. Calculate the increment of horizontal stress (if any) due to concentrated loads at the surface.
Earth Pressure Calculation:
REINFORCEMENT RUPTURE CALCULATION
Wall Parameters:
Reinforcement Input Parameters:
Loading Input Parameters:
Dep
th B
elow
Top
of W
all,
z
00
6 m
1.0 1.2 1.7 2.5
1.0 1.2
Geo
synt
hetic
s1
Met
al S
trips
Weld
ed W
ire G
rids
Metal B
ar M
ats &
Notes:1. Does not include polymer strip reinforcement.
Kr / Ka
Figure 26. Calculation. Reinforcement rupture calculation for the design example.
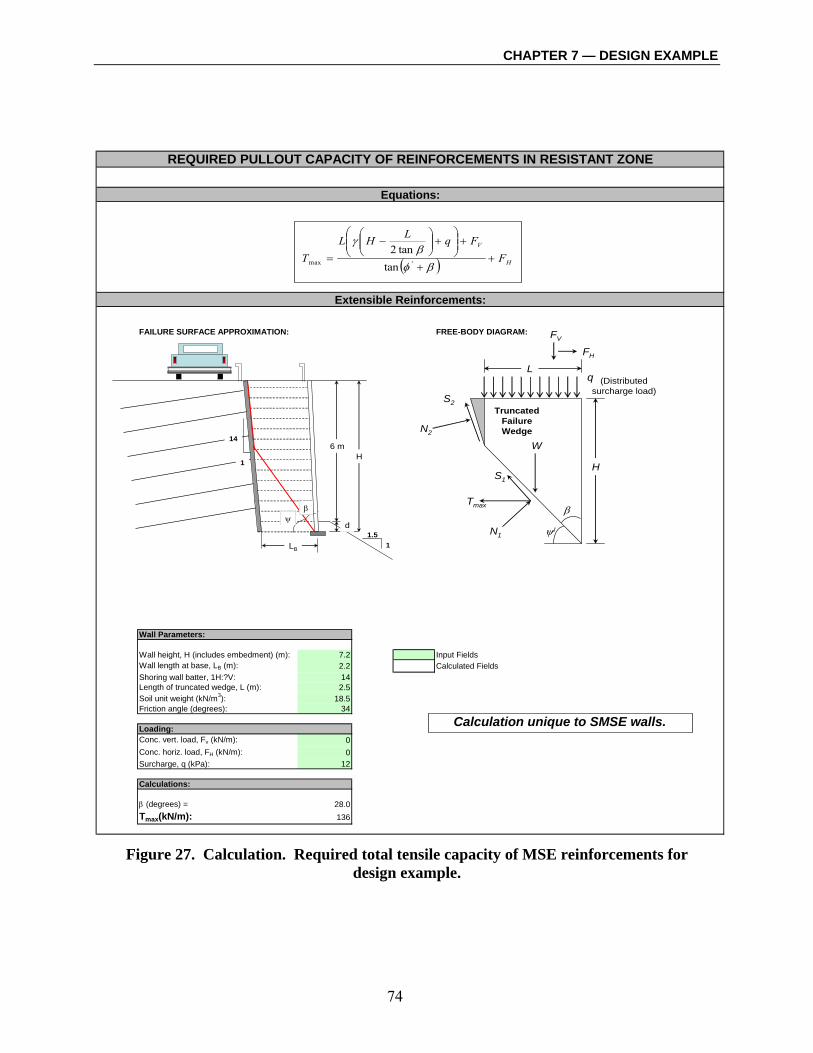
CHAPTER 7 — DESIGN EXAMPLE
74
FAILURE SURFACE APPROXIMATION: FREE-BODY DIAGRAM:
Wall Parameters:
Wall height, H (includes embedment) (m): 7.2 Input FieldsWall length at base, LB (m): 2.2 Calculated FieldsShoring wall batter, 1H:?V: 14Length of truncated wedge, L (m): 2.5Soil unit weight (kN/m3): 18.5Friction angle (degrees): 34
Loading:Conc. vert. load, Fv (kN/m): 0Conc. horiz. load, FH (kN/m): 0Surcharge, q (kPa): 12
Calculations:
β (degrees) = 28.0Tmax(kN/m): 136
Extensible Reinforcements:
Equations:
REQUIRED PULLOUT CAPACITY OF REINFORCEMENTS IN RESISTANT ZONE
( ) H
V
FFqLHL
T ++
+⎟⎟⎠
⎞⎜⎜⎝
⎛+⎟⎟
⎠
⎞⎜⎜⎝
⎛−
=βφ
βγ
'max tantan2
6 m
1.51
ψ
LB
d
H
β
14
1
Calculation unique to SMSE walls.
W
Tmax
ψ1N1
S1
β
N2
S2
H
qL
(Distributedsurcharge load)
FV
FH
TruncatedFailureWedge
Figure 27. Calculation. Required total tensile capacity of MSE reinforcements for
design example.

CHAPTER 7 — DESIGN EXAMPLE
75
Extensible Reinforcements:
FAILURE SURFACE APPROXIMATION:
Wall Parameters: Input FieldsCalculated Fields
Wall height (m): 6Embedment depth (m): 1.2Min. reinforcement length, L (m): 2.2Shoring wall batter, 1H:?V: 14Soil unit weight (kN/m3): 18.5Friction angle (degrees): 34
Reinforcement Input Parameters:
Reinforcement spacing (s)1 (m): 0.46Reinforcement type: 1 Type 1 = geogrid; Type 2 = geotextileScale effect factor, α: 0.8Effective unit perimeter,C: 2 Taken as 2 for strips, grids, and sheets.Pullout resistance factor,F*: 0.54Factor of safety, FSp: 2.0Coverage ratio, Rc: 1 Taken as 1 for full coverage. Calculate for strips, etc.
Layer (Bottom-upward): z (m) Lei2 (m) σvi (kPa)
Specified Pullout
Capacity (kN/m)
Actual Pullout
Capacity3
(kN)Reinforcement
Type1 7.2 2.20 133.2 25 25.0 Geogrid 252 6.74 1.99 124.69 25 25.0 "3 6.28 1.78 116.18 25 25.0 "4 5.82 1.56 107.67 25 25.0 "5 5.36 1.35 99.16 25 25.0 "6 4.9 1.14 90.65 25 25.0 "7 4.44 0.93 82.14 25 25.0 "8 3.98 0.72 73.63 25 22.8 "9 3.52 0.51 65.12 25 14.2 "
10 3.06 0.29 56.61 25 7.2 "11 2.6 0.08 48.1 25 1.7 "12 2.14 0.00 39.59 25 0.0 "13 1.68 0.00 31.08 25 0.0 "14 1.22 0.00 22.57 25 0.0 "15 0.76 0.00 14.06 25 0.0 "16 0.3 0.00 5.55 25 0.0 "
Total pullout capacity (kN): 221Notes:1. Vertical reinforcement spacing to be consistent with selection of wall facing.2. Length of reinforcement in resistant zone.3. If required pullout capacity not achieved, consider lengthening reinforcements, decreasing reinforcement spacing, or using reinforcements with higher strength.
CALCULATED PULLOUT RESISTANCE
45 + φ/2
H
Shoring Wall Design Failure Surface(parallel to shoring wall at interface)
“Active”Zone
“Resistant”Zone
L
ExtensibleReinforcement
z
Calculation unique to SMSE walls.
Figure 28. Calculation. Pullout resistance calculation for design example.

CHAPTER 7 — DESIGN EXAMPLE
76
Figure 29. Screenshot. Interface stability check for the design example.

CHAPTER 8 — PROCUREMENT AND CONSTRUCTABILITY ISSUES
77
CHAPTER 8 — PROCUREMENT AND CONSTRUCTABILITY ISSUES
This chapter provides an overview of issues with regard to procurement of wall materials and project constructability for SMSE wall systems. 8.1 PROCUREMENT ISSUES Within the FHWA procurement process, SMSE applications pose some initial challenges. This section identifies potential issues and provides suggestions to assist in the implementation of SMSE wall systems. 8.1.1 General SMSE retaining walls are a recent innovation for public transportation projects. Initially, most agencies, including FHWA, will have limited experience in their application. Similarly, general contractors, specialty contractors, and consultants will have limited or no experience with procurement, bidding, and installation of SMSE wall systems as complete packages. It is recommended that agencies procuring SMSE wall systems in accordance with this guideline initially procure these retaining walls as follows: • The procuring agency will decide to implement an SMSE wall system in accordance with
these guidelines. • The procuring agency will develop roadway and wall geometry, and conduct necessary field
and laboratory investigations in accordance with the recommendations presented in this report, and their experience.
• The agency will provide the contractor with the location of the proposed SMSE wall system,
and specify requirements for materials (i.e., facing type, reinforcement type, fill properties) and requirements for stability of the MSE wall component and shoring wall component. The current Special Contract Requirements (SCRs) (section 255) and FP-O3 section 255 (available at www.cflhd.gov/design) should be modified in accordance with these recommendations.(10)
• The agency will provide preliminary global stability analysis to demonstrate SMSE
feasibility. This should be included in the geotechnical report or memorandum. • Using the guidelines presented in this report and other methods as necessary, the contractor
will design the MSE wall component for internal stability, as a result obtaining the geometry of the shoring wall component.
• The agency will design the shoring wall component for internal stability. • The contractor will provide design (analyses and shop drawings) of the MSE wall component
to the agency for review and subsequent global stability evaluation.
CHAPTER 8 — PROCUREMENT AND CONSTRUCTABILITY ISSUES
78
• Shop drawing review for compliance with project SCRs will be conducted by the agency. Ultimately, with greater experience and confidence in SMSE wall applications, FHWA and other agencies may desire to implement SMSE wall systems as complete systems, where a specification is developed either specifying the use of SMSE wall systems or explicitly allowing their construction. It is recommended that deployment of this technology in this manner be deferred until greater experience is developed, which will support development of appropriate specifications. With appropriate experience and specification tools in place, the agency may elect to either require an SMSE wall system to be bid in accordance with the plans and SCRs, or explicitly allow an SMSE wall system to bid in competition with other acceptable and approved retaining wall systems. 8.1.2 SCR Considerations In procuring SMSE wall systems for projects, the following paragraphs should be included in section 255 (www.cflhd.gov/design/scr.cfm) of the Supplemental Contract Requirements (SCR)(71):
“The contractor is responsible for design of the MSE wall component of the SMSE wall system. The contractor shall refer to FHWA Publication No. FHWA-CFL/TD-06-001 [this document] for design methodology and general design requirements. FLH will design the shoring wall system. Design analyses and shop drawings for the MSE wall component will be issued by the contractor to FLH for subsequent global stability analyses.” “The factor of safety against reinforcement pullout should be increased to 2.0 for wall aspect ratios of 0.4 and less. For aspect ratios greater than 0.4, reinforcements may be designed for a pullout factor of safety of 1.5.”
Additional items to provide in the SCR for SMSE wall systems include: • Construction tolerances (discussed in section 8.2.4). • Specifications for high quality reinforced backfill (discussed in section 3.3.1). • Recommendations for performance monitoring (discussed in section 9.2.3). The SMSE wall system should be constructed to the tolerances provided in table 4, which were modified from Section 255 of the SCR for wire faced wall construction. Table 4 should be reproduced, as provided herein, in the SCR. Reinforced backfill for the MSE wall component shall consist of high quality backfill, as discussed in section 3.3.1 and presented in table 1. Table 1, which provides the recommended gradation specification for SMSE select granular fill, should be reproduced in the SCR.

CHAPTER 8 — PROCUREMENT AND CONSTRUCTABILITY ISSUES
79
The SCR should provide details for a wall monitoring program, including instrumentation to be installed and identification of the monitoring periods. Monitoring should be conducted during the installation and construction phases, and post-construction initial readings should be obtained. Upon completion of construction, instrumentation should be monitored periodically (i.e., quarterly) until satisfactory wall performance is confirmed.
8.2 CONSTRUCTABILITY ISSUES Constructability issues for SMSE wall systems include, among others, confined space for fill placement, connections, overlaps, and difficult excavation, as described in this section. 8.2.1 Confined Space for MSE Fill SMSE wall systems with narrow MSE wall components pose constructability concerns with regard to proper compaction of the reinforced fill zone. Reinforcement lengths less than 2.4 m may pose access difficulties for construction equipment. Contractors should use appropriate equipment for work in tight spaces and anticipate the effects on earthwork productivity. 8.2.2 Reinforcement Connections and Overlaps Mechanical connections between the MSE and shoring wall components of an SMSE system may prove challenging for contractors to construct. It is recommended that mechanical connections be avoided and the upper two layers of MSE reinforcements be overlapped over the shoring wall, where feasible. Construction of the recommended MSE reinforcement overlap (over the top of the shoring wall) will likely pose issues with regard to construction sequencing and maintenance of traffic. To address this issue, the shoring wall component may be constructed with a steep temporary slope above the top of the wall, and then construction of the MSE wall component may begin from bottom upward. Once the contractor is at the level ready to construct the MSE reinforcement overlap, the contractor may close the traffic lane to excavate the cut, and then may run traffic over the cut until ready to place the reinforcement and backfill, temporarily close the traffic lane again, and construct a lift of the MSE wall. This sequence can be repeated for the two (or more) layers of MSE reinforcement overlap. Generally, for roads with light traffic, 15- to 20-minute lane closures may be acceptable. However, heavily traveled roadways may render this technique inapplicable. Also, experience with this technology may dictate a decrease in the recommended length of MSE reinforcement overlap, currently proposed as 60 percent of the wall height (0.6H) or a minimum of 1.5 meters, whichever is greater. 8.2.3 Rock or Difficult Excavation In some cases, the shoring wall installation and related excavation may encounter rock or other difficult excavation conditions. The engineer should evaluate the situation in regard to potential impacts to stability. It is likely acceptable to eliminate the shoring wall when rock is encountered and where the engineer judges the rock to be of sufficient strength. The MSE component of the wall should then be constructed to the design geometry, within the tolerances

CHAPTER 8 — PROCUREMENT AND CONSTRUCTABILITY ISSUES
80
indicated in table 4, even if rock excavation is necessary.(71) Where such excavation would have unacceptable impacts to the project, at the discretion of the engineer, re-evaluation of the retaining wall geometry, with consideration to the geometric requirements of these guidelines, may be in order.
Table 4. Recommended SMSE wall construction tolerances.
Description Requirement
Wall Batter ±50 mm per 3.0 m of wall height and 1 percent for the overall wall height.
Wall Height ±25 mm per 3.0 m of wall height and a maximum of 100 mm.
Horizontal and Vertical Alignment ±50 mm at any point in the wall when measured with a 3.0-m straightedge.
Separation of Facing Mat Outside of facing mat shall be within 40 mm from MSE facing fill at all locations.
Reinforcement Elevation
Within 50 mm above the design elevation and within 50 mm above the corresponding connection elevation at the wall face. Reinforcement shall not be placed below corresponding connection elevation.
Reinforcement Inclination Within 2 percent from horizontal. MSE Reinforcement to Shoring Wall Face ±50 mm
8.2.4 Geometric Tolerances The finished construction of the MSE portion of the SMSE wall system should meet the construction tolerances provided in table 4. The length of the MSE reinforcing elements should extend to within 50 mm of the shoring wall, as indicated. MSE reinforcing layers may be bent upwards where they otherwise would conflict with the shoring wall. The length of the reinforcing elements should not be less than shown on the approved drawings. Where irregularities occur in the shoring wall face (i.e., due to potential over-break, etc.), MSE reinforcing elements longer than shown on the plans may be required. If so, they should be furnished at no additional cost to the procuring agency. 8.2.5 Foundation Preparation Foundation preparation should be directed by the engineer and should conform to typical practice for MSE walls. Where foundation conditions differ from those anticipated by the engineer, the engineer may direct foundation improvement measures in accordance with the contract documents. 8.2.6 Interface Friction Avoid smooth shoring wall faces that achieve a lower interface friction than assumed by the engineer in design. Engineers should consider conservative interface friction angles (coefficients) to account for potential variability in shoring wall face installations.
CHAPTER 8 — PROCUREMENT AND CONSTRUCTABILITY ISSUES
81
8.2.7 Groundwater Groundwater may be encountered during construction of the shoring wall. The engineer should specify internal drainage elements in the shoring wall face, drained to a suitable outlet, for all permanent shoring walls incorporated in SMSE wall systems, as discussed in chapter 3. In some cases, groundwater seeps may come through the shoring wall face and be encountered during construction of the MSE wall portion of the SMSE wall system. In such cases, the contractor or the agency shall notify the engineer. The engineer may elect to require additional drainage measures in accordance with the contract documents.


CHAPTER 9 — CONCLUSIONS AND RECOMMENDATIONS
83
CHAPTER 9 — CONCLUSIONS AND RECOMMENDATIONS The design guidelines and recommendations presented in this report were developed based on results of a literature review (appendix A), centrifuge modeling (appendix B), field-scale testing (appendix C), and numerical modeling (appendix D). This chapter summarizes the conclusions of this report regarding SMSE wall system design, and presents recommendations for future research. 9.1 CONCLUSIONS Based on the results of the research conducted and presented, a minimum MSE reinforcement length equivalent to 30 percent of the wall height, i.e., aspect ratio of 0.3, has been selected for design of SMSE walls, with a recommended within reinforcement length of 1.5 meters. Centrifuge modeling of SMSE wall systems indicated that aspect ratios on the order of 0.25 to 0.6 produced stable wall configurations, while the field-scale test was stable at an aspect ratio ranging from 0.25 at the base to approximately 0.39 at the top under excessive surcharge loading. Additionally, centrifuge modeling of a conventional MSE wall with a retained backfill and an aspect ratio of 0.3 was stable under high levels of gravitational acceleration. The literature review further supports design of SMSE walls with a minimum aspect ratio of 0.3 when such walls are subject to low lateral earth pressures. Centrifuge modeling indicated that SMSE walls with aspect ratios less than 0.6 exhibited deformation in the form of “trench” development at the shoring interface, indicative of tension cracking. Because trench development was not observed for models with aspect ratios of 0.6 or greater, these guidelines recommend that the upper two or more layers of geogrid extend to a minimum length of 0.6H or 1.5 meters beyond the shoring wall, whichever is greater, to limit the potential for tension cracking at the interface. Additional constraints regarding the geometry of the overlapped layers and related guidance are provided in chapter 3. Measurements of lateral earth pressures recorded at the shoring interface during field-scale testing imply that the pressures acting on the back of the MSE wall component are less than the theoretical active earth pressures. The design procedure presented is based on active earth pressure and considered conservative. Based on the research, an analytical approach for design of the MSE wall component of an SMSE wall system is presented in chapter 5. This approach differs from traditional MSE wall design with regard to reinforcement pullout design. Conventional MSE wall design requires that each layer of reinforcement resist pullout by extending a nominal distance beyond the estimated failure surface.(2) In the case of an SMSE wall system, the lower MSE reinforcement layers (i.e., those that extend into the resistant zone) are designed to resist pullout for the entire “active” MSE mass. Additionally, external analysis of the MSE wall component includes evaluation of stability along the MSE/shoring interface, a feature that does not exist for a conventional MSE wall.

CHAPTER 9 — CONCLUSIONS AND RECOMMENDATIONS
84
Numerical modeling and field-scale testing indicates the potential for arching near the base of the MSE wall at the shoring interface for walls employing aspect ratios on the order of 0.25. Current practice for design of MSE walls with non-rectangular or stepped wall geometry recommends a minimum aspect ratio of 0.4 for the lower reinforcements when the wall is founded on rock or competent soil.(1,2) A forensic study conducted by Lee et al. on several failed stepped MSE walls with rock forming the foundation and the backslope for the lowermost portion of the wall suggests that the calculated vertical stress distribution at the back of the lower reinforcements is greater than the actual stresses because the stiffer rock behind the reinforcements encourage the formation of arching above the reinforcements.(51) As a result, design calculations likely overestimate the resistance to pullout, translation, and wedge failure for stepped structures adjacent to rock or other self-supporting backslopes (i.e., shoring). Based on these observations, the factor of safety against reinforcement pullout should be increased from 1.5 to 2.0 for wall aspect ratios less than or equal to 0.4. The design recommendations specific to SMSE wall systems presented in this report are summarized in table 5.
Table 5. Summary of SMSE wall system design recommendations.
Design Feature or Requirement Recommendation
Minimum aspect ratio, α 0.3 Minimum reinforcement length 1.5 m Maximum reinforcement vertical spacing, sv 0.6 m
Internal design, pullout Specific to SMSE walls systems, per section 5.3
Internal design, reinforcement rupture Generally follows traditional approach
Factor of safety against reinforcement pullout, FSp 1.5 for aspect ratios greater than 0.4 2.0 for aspect ratios less than or equal 0.4
Shoring wall batter 1H:14V or greater
Upper two or more reinforcements Extend to length of 0.6H, or 1.5 m beyond shoring wall, whichever is greater
Reinforced backfill High quality granular fill, section 3.3.1 Shoring wall construction Permanent structure
Shoring wall design Potentially reduced factors of safety (i.e., temporary stability factors of safety)
9.2 RECOMMENDATIONS This section provides recommendations with regard to implementation of SMSE wall design and construction, and SMSE wall monitoring. Future research of SMSE walls is recommended to improve and expand potential applications.

CHAPTER 9 — CONCLUSIONS AND RECOMMENDATIONS
85
9.2.1 Implementation CFLHD may commence with design and construction of SMSE wall systems using the guidelines and recommendations presented in this report. Until satisfactory performance of SMSE walls designed using these guidelines is adequately established, performance monitoring should be implemented with a scope that is above and beyond that of a traditional MSE wall. Recommendations for wall monitoring are discussed in section 9.2.3. 9.2.2 Wall Monitoring Until satisfactory performance is confirmed for SMSE walls designed using the guidelines presented in this report, a monitoring program should be established for each SMSE wall constructed. The scope and level of instrumentation and monitoring will be developed on a project-to-project, and perhaps wall-by-wall, basis. Evaluation of how SMSE walls function, not just how they perform, is important as FLH starts to deploy them on projects. This information will allow FLH to optimize the design and utilization of the wall type. Monitoring for wall function is more difficult and costly than monitoring for wall performance and FLH should look for opportunities where this more extensive monitoring program can be implemented. A monitoring program that evaluates how the SMSE wall functions, as well as how well it performs, should consider the following components: • Bonded-resistance strain gages installed on the MSE reinforcements to evaluate the local
stress and strain distribution in the wall. • Mechanical extensometers installed on the MSE reinforcements to evaluate the global strain
and stress state in the reinforcement. These may be installed in conjunction with strain gages to provide redundancy.
• Inductance coil strain gages placed between MSE reinforcing layers to evaluate lateral strains
in the reinforced soil mass. • Lateral earth pressure cells installed on the face of the shoring wall to measure lateral
pressures at the back of the reinforced fill. • Inclinometers installed at the face of the MSE wall and just behind the face of the shoring
wall to measure horizontal movement of each of the wall components. • Monitoring of vertical and horizontal movements of the MSE wall facing by conventional
optical surveys. • Monitoring vertical movement of the MSE wall portion by using settlement sensing devices
installed at the base of the wall.

CHAPTER 9 — CONCLUSIONS AND RECOMMENDATIONS
86
• Horizontal earth pressure cells installed at various locations along the base of the MSE wall portion (i.e., near shoring, near facing, and at midpoint) to measure vertical pressures at the base of the MSE wall and evaluate the presence of arching.
Several things to consider when designing the instrumentation program include: • Sensitivity - The instrumentation should be sensitive over a wide range of strains (i.e., large
during construction, and very small following construction). • Strain compatibility - The gages and their respective attachment methods must be compatible
with the type of reinforcement material. • Redundancy - The instrumentation program should provide sufficient redundancy to explain
anomalous data. • Quantity - A sufficient number of instruments spaced preferentially to identify areas of high
stress should be provided. • Monitoring intervals - The monitoring program should include continuous monitoring during
construction, establishment of post-construction baseline readings, and monitoring at a regular interval (i.e., monthly or quarterly) until sufficient data to confirm performance of the wall system is achieved.
In addition to monitoring of wall instrumentation, observational monitoring is recommended. This includes visual inspection of the surface (i.e., pavement) above the SMSE wall for tension cracking and observation of the wall facing for signs of distress. Observational monitoring should be conducted at least as frequently as the optical survey or measurement of inclinometers. Other instrumentation should be connected to a data logger(s) with recording of continuous or incremental measurements. Several of the benefits associated with the instrumentation and monitoring program summarized above include measurement of stresses and strains within the MSE reinforcements, lateral pressures acting on the MSE wall component, and vertical pressures and deformations at the base of the MSE wall component in addition to monitoring deformation of the MSE wall facing and potential outward deflection of the shoring wall component. Implementation of this full instrumentation program provides data suitable for further evaluation of how SMSE walls work. Such an extensive monitoring program is not substantiated for most projects, and may only be employed on a few. For most SMSE walls a lesser program should be implemented. For performance monitoring of an SMSE wall system, monitoring of deformations is more beneficial than monitoring of stresses, and the cost of deformation monitoring is generally quite less than monitoring of stresses. For instance, strain gages and pressure cells that provide data regarding stress and strain distributions within the reinforced soil mass are quite costly and require redundancy.

CHAPTER 9 — CONCLUSIONS AND RECOMMENDATIONS
87
In order to monitor performance, with the goal of measuring deformations, a minimum monitoring program should consider the following:
• Inclinometers installed behind the face of the shoring wall portion and behind the face of the MSE wall portion (minimum of two inclinometers per wall section).
• Survey monuments at the top face of the MSE wall portion on a nominal spacing of 8
meters, with a minimum of three monuments per wall section (one installed at each end of the wall and one near the midpoint), or optical surveys of MSE wall facing deformation.
• Observational monitoring which includes visual inspection of the surface above the wall
for tension cracking, and visual inspection of the wall facing for signs of distress. This minimum monitoring program should be implemented with measurements recorded at completion of wall construction (i.e., baseline), and quarterly thereafter for a minimum of one year. 9.2.3 Future Research Evidence collected during preparation of these guidelines suggests that the lateral pressures acting on the MSE wall component of an SMSE wall system are less than active earth pressures due to the stabilizing benefits provided by the shoring system. Lateral earth pressures were measured during the field-scale testing (appendix C). Generally, the lateral earth pressures were less than theoretical Rankine active earth pressures. The field-scale test indicated that the lateral pressures near the top of the wall were considerably higher for the connected system than they were for the unconnected system. Assumptions were stated with regard to possible tension crack development for the unconnected wall system, and transfer of load via the reinforcements for the connected wall system. The relationship between connected versus unconnected wall systems should be further investigated, though indications are that the connected system provides little benefit for walls constructed in accordance with these guidelines. The goal of the numerical modeling was to verify the results of the field-scale test, and provide additional insight into the results of the instrumentation. This goal was accomplished, as discussed in appendix D. Numerical modeling also provided insight to the degree of lateral pressures acting on the MSE wall component of an SMSE wall system, indicating that the lateral pressure increases with increasing surcharge load. The degree or level of reduction of the lateral pressure due to the shoring wall was not clearly quantifiable from either the field-scale test or numerical modeling, and further quantification of the lateral stresses is recommended. Numerical modeling is a powerful tool which may used to evaluate additional parameters with regard to SMSE wall systems, including one or more of the following:
• Fully- and partially-connected versus unconnected SMSE wall systems. • Extension of upper layers of geogrid for unconnected SMSE wall system.

CHAPTER 9 — CONCLUSIONS AND RECOMMENDATIONS
88
• Shoring wall geometry (i.e., stepped interface).
• Shoring wall type with regard to rigidity and pressures acting on the MSE wall mass.
• Varying aspect ratios from 0.25H to 0.5H.
The shoring wall component was modeled as a rigid unyielding member in the research conducted for this report. However, the shoring wall will exhibit some deformation which was not quantified in the research. Soil nail walls, for instance, are a relatively flexible system and require small deformations in order to mobilize their strength. The effect of a flexible shoring wall on the MSE wall component could be the subject of additional investigation, as mentioned above with regard to numerical modeling. However, this may better be accomplished by conducting ongoing monitoring of constructed SMSE wall systems.
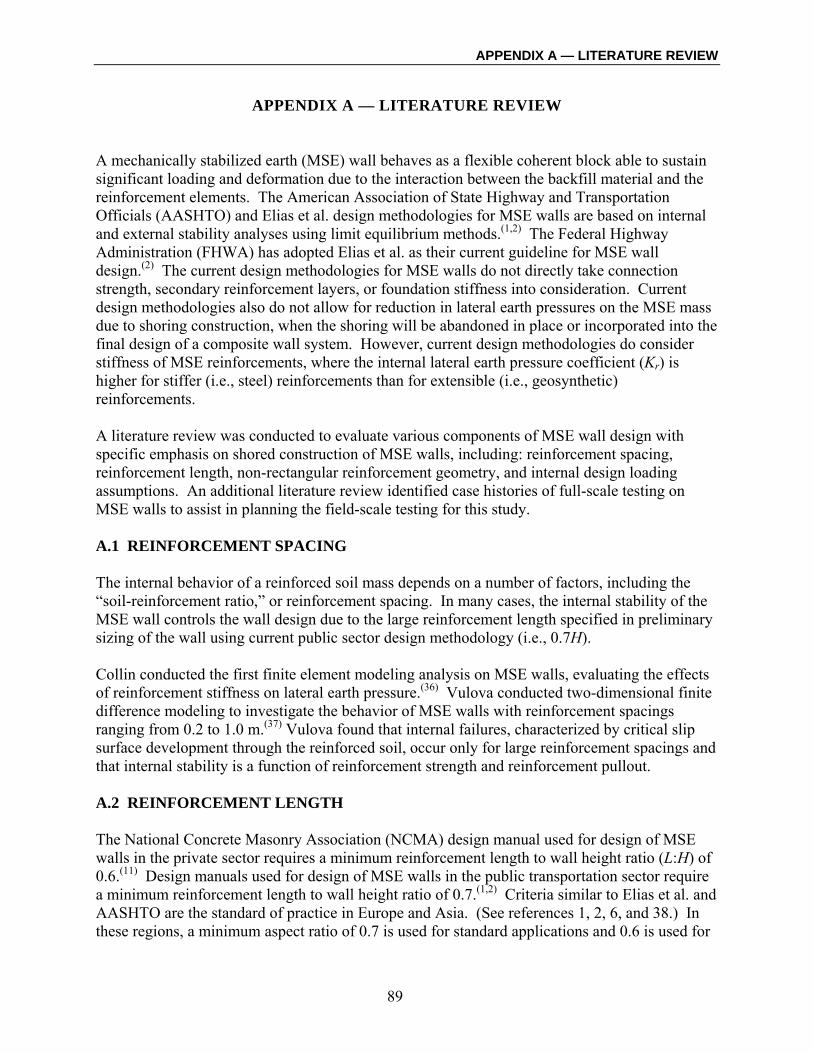
APPENDIX A — LITERATURE REVIEW
89
APPENDIX A — LITERATURE REVIEW A mechanically stabilized earth (MSE) wall behaves as a flexible coherent block able to sustain significant loading and deformation due to the interaction between the backfill material and the reinforcement elements. The American Association of State Highway and Transportation Officials (AASHTO) and Elias et al. design methodologies for MSE walls are based on internal and external stability analyses using limit equilibrium methods.(1,2) The Federal Highway Administration (FHWA) has adopted Elias et al. as their current guideline for MSE wall design.(2) The current design methodologies for MSE walls do not directly take connection strength, secondary reinforcement layers, or foundation stiffness into consideration. Current design methodologies also do not allow for reduction in lateral earth pressures on the MSE mass due to shoring construction, when the shoring will be abandoned in place or incorporated into the final design of a composite wall system. However, current design methodologies do consider stiffness of MSE reinforcements, where the internal lateral earth pressure coefficient (Kr) is higher for stiffer (i.e., steel) reinforcements than for extensible (i.e., geosynthetic) reinforcements. A literature review was conducted to evaluate various components of MSE wall design with specific emphasis on shored construction of MSE walls, including: reinforcement spacing, reinforcement length, non-rectangular reinforcement geometry, and internal design loading assumptions. An additional literature review identified case histories of full-scale testing on MSE walls to assist in planning the field-scale testing for this study. A.1 REINFORCEMENT SPACING The internal behavior of a reinforced soil mass depends on a number of factors, including the “soil-reinforcement ratio,” or reinforcement spacing. In many cases, the internal stability of the MSE wall controls the wall design due to the large reinforcement length specified in preliminary sizing of the wall using current public sector design methodology (i.e., 0.7H). Collin conducted the first finite element modeling analysis on MSE walls, evaluating the effects of reinforcement stiffness on lateral earth pressure.(36) Vulova conducted two-dimensional finite difference modeling to investigate the behavior of MSE walls with reinforcement spacings ranging from 0.2 to 1.0 m.(37) Vulova found that internal failures, characterized by critical slip surface development through the reinforced soil, occur only for large reinforcement spacings and that internal stability is a function of reinforcement strength and reinforcement pullout. A.2 REINFORCEMENT LENGTH The National Concrete Masonry Association (NCMA) design manual used for design of MSE walls in the private sector requires a minimum reinforcement length to wall height ratio (L:H) of 0.6.(11) Design manuals used for design of MSE walls in the public transportation sector require a minimum reinforcement length to wall height ratio of 0.7.(1,2) Criteria similar to Elias et al. and AASHTO are the standard of practice in Europe and Asia. (See references 1, 2, 6, and 38.) In these regions, a minimum aspect ratio of 0.7 is used for standard applications and 0.6 is used for

APPENDIX A — LITERATURE REVIEW
90
low lateral load applications with a minimum length of 3 m.(6,38) Because current design practice involves designing each component of a shored MSE (SMSE) wall system completely independent of the other, the reinforcement length prescribed by these design guidelines are most likely conservative. Reinforcement lengths less than 60 percent of the wall height (0.6H) have been reported in the literature, as discussed below. A.2.1 Geosynthetic-Reinforced Soil Retaining Walls In the 1980s, researchers in Japan constructed a geosynthetic reinforced soil wall using a rigid facing with reinforcement lengths considerably less than 0.6H. (See references 39, 40, 41, and 42.) The geosynthetic-reinforced soil retaining wall (GRS-RW) system uses a full-height rigid facing which is cast-in-place by staged construction procedures, geosynthetic reinforcement, and reinforced fill consisting of low-quality onsite soils. (See references 39, 40, 41, and 42.) Of particular interest is the small aspect ratio (i.e., reinforcement length versus wall height) that has been employed in the GRS-RW system. Researchers in Japan constructed six full-scale walls and conducted three series of model laboratory tests on reinforced embankments with reinforcement lengths approximately 30 percent of the wall height (i.e., 0.3H).(40,41) The two main features that allowed these systems to use short reinforcements included the use of planar geosynthetics and the use of a continuous rigid facing. Figure 30 illustrates the staged construction procedure for GRS-RW systems.
Figure 30. Illustration. Staged construction procedures for the GRS-RW system.(43)

APPENDIX A — LITERATURE REVIEW
91
Tatsuoka et al. concluded that the use of planar geotextile sheets reduce the required anchorage length by increasing the contact area with the backfill, as compared to the use of metal reinforcing strips.(40) Planar geotextile sheets may consist of geogrid for use in cohesionless or cohesive soil backfill. A composite of non-woven and woven geotextiles, for instance, may be suitable for a backfill containing cohesive soils to facilitate drainage and to ensure high tensile capacity.(40) Because geosynthetics tend to have a lower tensile strength than steel reinforcement, more layers of reinforcement are used in the GRS-RW system than in traditional MSE walls. A continuous rigid facing (i.e., reinforced concrete placed directly over a geosynthetic-wrapped wall face) increases the stability of the wall, reduces the lateral and vertical deformation at the wall face, and reduces settlement of the wall backfill by enabling the reinforced zone and the facing to act together.(40) One of six full-scale tests constructed by researchers in Japan used a non-rigid facing and exhibited considerably more deformation than those models constructed with continuous rigid facing.(40) Tatsuoka et al. suggests that overturning may be the most critical mode of failure for an MSE wall with short reinforcement lengths (i.e., 0.3H), where sliding typically governs for conventional MSE walls (i.e., 0.7H).(40) Tateyama et al. designed a geosynthetic-reinforced retaining wall with reinforcement lengths of approximately 0.45H, designed for a partial factor of safety of 1.5 for pullout failure of the reinforcement.(42) The wall was constructed to an average height of 5 m and a total length of 930 m and was subjected to dynamic loading by trains passing above the wall. Wall behavior was monitored for a period of about 1.5 years, and reported to perform well. A.2.2 Constrained Reinforced Fill Zones A design-and-analysis method for reinforced soil retaining walls where the extent of the reinforced fill zone is constrained by the presence of a rock or heavily over-consolidated soil outcrop making conventional MSE wall construction with reinforcements of 0.6H impractical is provided by Lawson and Lee.(5) For this method, they state that “constraining the extent of the reinforced fill zone reduces the internal stability of the reinforced segmental block wall by preventing full dissipation of tensile stresses in the geogrid reinforcement within the reinforced fill zone.”(5) Similar to a shored MSE wall, the rigid zone is assumed to be inherently stable and therefore does not impart any stresses onto the reinforced soil block. Within the constrained reinforced fill zone, the full active failure wedge is unable to develop because of the relative close proximity of the rigid zone behind the reinforced fill. Lawson and Lee evaluated the effect of the geometry of the constrained reinforced fill zone on the magnitude of horizontal stresses acting on the wall face, Ph, according to the following equation:
2
21 HKPh γ= Equation A.1
For walls with aspect ratios greater than 0.5, the theoretical active wedge can fully develop within the granular fill zone and hence K is equal to Ka. However, for aspect ratios less than 0.5, the full active wedge cannot develop fully and the magnitude of K was observed to decrease for decreasing aspect ratios.(5) Lawson and Lee propose dissipation of residual reinforcement

APPENDIX A — LITERATURE REVIEW
92
tensions by either connecting the geogrid reinforcements to anchors or nails inserted into the rigid zone, or by extending the geogrid reinforcement in the form of a wrap-around at the rear of the reinforced fill zone.(5) A.2.3 Other Constructed Cases of Short Reinforcement Lengths Other cases of MSE walls constructed using short reinforcements (less than 0.6H) are found in the literature. However, no studies for shored MSE walls using short reinforcement lengths have been identified, except for the case where standard MSE block units have been used as aesthetic facing (i.e., veneer) for soil nail walls. A common alternative to the GRS-RW wall system is a Reinforced Earth® Wall using metallic reinforcements with segmental facing. Such walls are constructed using reinforcement lengths as low as 0.45H. A study conducted by Terre Armee International showed that these wall systems may be stable with reinforcement lengths ranging from 0.7H to 0.4H.(44) Another type of wall system employing short reinforcements is a multi-anchored retaining wall with geosynthetic loop anchors.(45) A cross section of a multi-anchored wall is illustrated in figure 31. The main concept of this type of wall is that the reinforcement extends beyond the failure wedge, but the anchorage length may be significantly reduced because the reinforcement is looped in a manner that essentially restrains the failure wedge. This looping increases the pullout resistance of the MSE reinforcements. Figure 31 illustrates a wall used to stabilize a steep slope after a landslide. The aspect ratio for this wall system is a minimum of 0.44H at the base of the wall, increasing towards the top of the wall.(45)
Lin et al. describe a wall similar to an SMSE wall constructed with a multi-nailing system combined with soil reinforcement.(46) This system was chosen in an attempt to reduce the required reinforcement length where the wall was comparatively tall (39.5 m) and would have required 24-meter-long MSE reinforcements using the criterion developed for the private sector (0.6H). Consequently, the wall designer elected to replace a portion of the reinforcing element length with rock nails to reduce the amount of required excavation by 80 percent. The design involved stabilization of the vertical slope with rock nails and tiered construction of an MSE wall in front of the stabilizing shoring wall, as illustrated in figure 32. The MSE walls employ reinforcement lengths of 1.5 m and each wall section was 8 m high, resulting in an aspect ratio of 0.19. The MSE wall facing consists of steel mesh which was attached to the nails of the shoring system using galvanized cables. The MSE walls in this application were not designed to carry vertical loading, but instead constructed for aesthetic purposes.
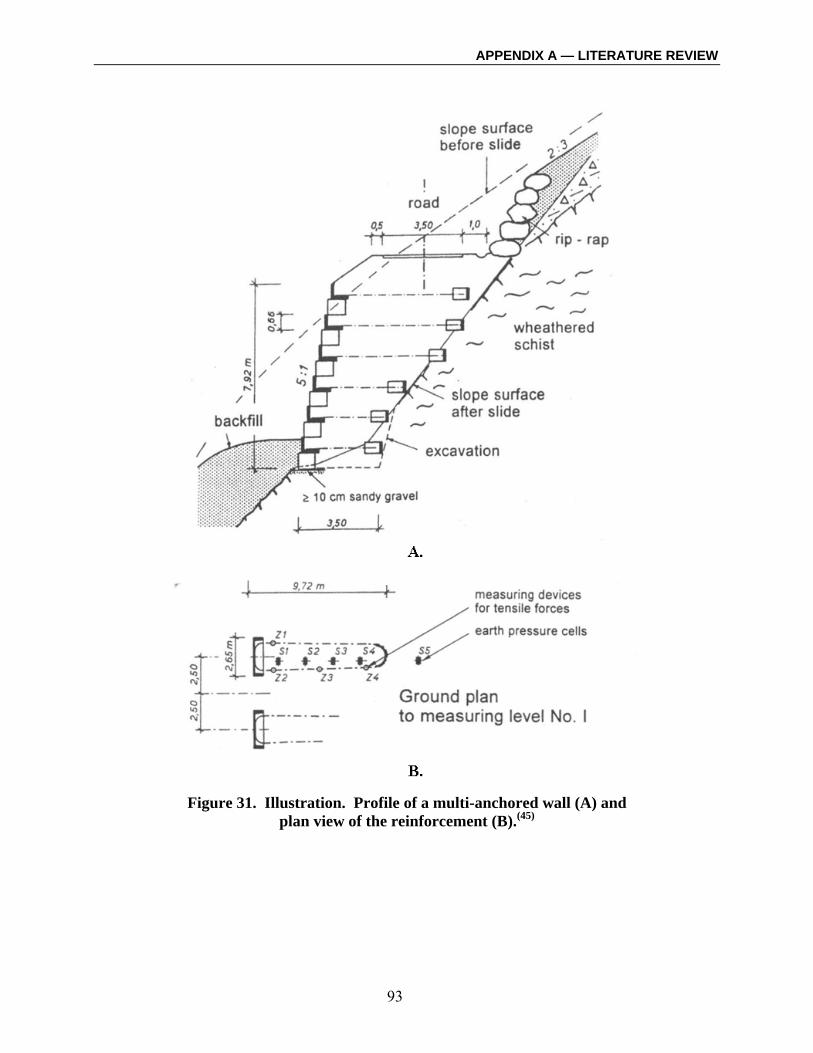
APPENDIX A — LITERATURE REVIEW
93
Figure 31. Illustration. Profile of a multi-anchored wall (A) and plan view of the reinforcement (B).(45)

APPENDIX A — LITERATURE REVIEW
94
Figure 32. Illustration. A multi-nailing shoring system combined with MSE construction.(46)
A.2.4 Numerical Analyses Evaluating Short Reinforcement Lengths Numerical studies have been reported which analyze short reinforcements in MSE walls.(37,47) A study by Vulova, though focusing on the affect of MSE reinforcement spacing, used Fast Lagrangian Analysis of Continua (FLAC), a finite difference numerical analysis program, to investigate MSE reinforcement length among other variables.(37,48) The models were simulated by constructing one layer at a time with a fixed length, where the addition of successive layers resulted in decreasing the aspect ratio of the wall until yielding and wall collapse occurred. The minimum aspect ratio achieved in this study was 0.17 with a reinforcement spacing of 0.2 m; the model failed due to overturning. An aspect ratio of 0.19 was achieved with a reinforcement spacing of 0.4 m, with this model failing in a compound mode with the failure surface developed through the retained fill as well as through the reinforced fill. In both cases, the stresses in the soil and in the reinforcements were found to be largest nearer to the facing than towards the end of the reinforced zone, increasing the tendency for overturning.(37) This was observed in the field-scale test performed for this report (appendix C) where the vertical stresses measured at the base of the MSE wall near to the MSE facing were approximately 20 percent higher than the vertical stresses measured near the shoring wall. One reviewer of Vulova’s research asserted that both models failed in an overturning mode, though a shear surface was able to develop for the model with an aspect ratio of 0.19 due to the larger reinforcement spacing, which in turn appeared to lead to a compound failure.(49)

APPENDIX A — LITERATURE REVIEW
95
Another numerical study involving finite element analyses showed that the behavior of an MSE wall underwent changes due to reduced reinforcement length, but remained quite similar as long as the length of the reinforcements were generally kept above 0.4H to 0.5H.(47) This numerical study was confirmed by conducting full-scale testing on an MSE wall constructed with short reinforcing strips (0.48H) loaded to a test pressure of 840 kPa. The full-scale test wall exhibited little distress at this high load.(47) Similar to Vulova, Bastick concluded that the maximum tensile forces developed in the reinforcements near the top of the wall are slightly closer to the facing than the usual theoretical position of 0.3H for an MSE wall employing inextensible reinforcements.(37, 47) The field-scale test performed for this report (appendix C) employed extensible reinforcements, so this conclusion could not be further evaluated. However, the maximum tensile forces in the MSE reinforcements were observed to occur near the top of the wall and closer to the wall facing than the theoretical location of the Rankine active failure wedge. A.2.5 Summary Various attempts have been reported in the literature to minimize the length of the reinforcements in MSE structures, illustrating the need for additional research in this area. To date, the minimum reinforcement length reported to have been successfully constructed in a permanent structure was by Japanese researchers for GRS-RW systems, with an aspect ratio of 0.3. All of the examples of short MSE reinforcements presented in this report take advantage of low lateral earth pressures, similar to that developed within an SMSE wall. Centrifuge modeling, presented in appendix B, was conducted to investigate this phenomenon with regard to SMSE walls and short reinforcements where the lateral earth pressures are greatly reduced due to the presence of a shoring system. A.3 NON-RECTANGULAR REINFORCEMENT GEOMETRY For fill-side retaining wall construction on sloping or steep terrain, temporary excavations are typically required for construction of the reinforced fill structure. In these situations, use of a non-rectangular reinforcement cross section (or stepped wall) may prove beneficial due to the reduction in the required excavation size and/or elimination of temporary shoring wall construction. A.3.1 North American Practice Elias et al. presents design procedures for the design of MSE walls utilizing uneven reinforcement lengths, or non-rectangular geometry.(2) The manual states that such reinforcement geometry should only be considered if the base of the MSE wall is founded on rock or competent soil; competent soils are defined as materials which will exhibit minimal post-construction settlements.(2) For weak foundation materials, ground improvement prior to MSE construction may be considered viable, allowing for use of nonstandard reinforcement geometries. Several foundation improvement options for MSE wall construction on weak foundations are found in the literature.(11)

APPENDIX A — LITERATURE REVIEW
96
The simplified design guidelines outlined in Elias et al. for walls with uneven reinforcement lengths include: • Representing the wall by a rectangular block (Lo, H) with the same area as the
non-rectangular cross section for external stability calculations (figure 33). • Assuming that the maximum tensile force line is the same as in rectangular walls. • Assigning a minimum base length (L3) greater than or equal to 0.4H, with the difference in
length in each zone being less than 0.15H. • Dividing the wall into rectangular sections for each of the different reinforcement lengths for
calculating internal stability or pullout.(2)
Figure 33. Diagram. Dimensioning for MSE wall with variable reinforcement lengths.(2)
Thomas used finite element methods to model MSE retaining walls having a truncated base, concluding that the quality of foundation and backfill materials has a significant influence on the performance of MSE retaining walls with a truncated base.(50) A forensic study conducted by Lee et al. on a series of failed retaining walls founded on rock with rock forming the backslope for the lower reinforcements concluded that the resistance against translation (or sliding) failure is reduced by using a stepped MSE cross section due to the smaller base area.(51) This study further suggests that the calculated vertical stress distribution at the back of the lower reinforcements is greater than the actual stresses because the stiffer rock behind the reinforcements encourages the formation of arching above the reinforcements, resulting in design calculations that likely overestimate the resistance to pullout.(51)

APPENDIX A — LITERATURE REVIEW
97
A.3.2 European Practice The United Kingdom considers two types of non-rectangular cross sections: (1) a stepped wall, employing longer reinforcements at the bottom, and (2) a trapezoidal wall, employing shorter reinforcements at the bottom.(38) For the purpose of this discussion, the trapezoidal wall case is considered. The British Standard BS 8006 design manual for MSE walls states that walls with trapezoidal cross sections should only be considered where foundations are formed by excavation into rock or other competent foundation conditions exist.(38) For the case of a trapezoidal wall, BS 8006 prescribes a minimum length of 0.4H for the lower reinforcing members, with 0.7H for the upper reinforcements.(38) This guideline corresponds closely to that presented in Elias et al. Bastick performed a full-scale test on a wall with a non-rectangular cross section. The trapezoidal cross section had longer reinforcements near the top of the wall, with shorter reinforcements at the base.(47) The reinforcement lengths were approximately 0.48H (for the similar rectangular section). Results of this study were presented earlier in section A.2.3. A.3.3 Asian Practice Hong Kong’s Geoguide 6 design manual for MSE walls states that reinforced fills constructed on sloping rock foundations are often constructed as stepped walls.(6) When such construction is conducted, the possibility of soil arching at the base of the structure associated with the geometry of the steps in the foundation profile must be considered (i.e.,. sv < γH).(6) Reduced development of vertical pressure on the back portion of the reinforcing elements may result from the effects of soil arching, causing internal compression of the reinforced fill adjacent to the foundation steps.(6) By limiting the size of the steps, arching effects may be reduced (6). In general, the design guidelines outlined in Geoguide 6 are the same as those outlined in Elias et al.(2, 6) A.4 DESIGN EARTH PRESSURES A.4.1 North American Practice The NCMA and Elias et al. design guidelines use different approaches to estimate lateral earth pressures.(11, 12) Coulomb earth pressure theory is used for internal and external stability evaluation according to NCMA, while the FHWA guidelines use Rankine theory for internal stability and Coulomb theory for external stability. For internal design, the lateral earth pressure coefficient Kr is determined by applying a multiplier to the active earth pressure coefficient, Ka. The ratio of Kr/Ka is evaluated based on the type of reinforcing and the depth below the top of the wall. For geosynthetic reinforcing, the ratio of Kr/Ka is equal to unity. Therefore, Ka is used for internal design with geosynthetics (excluding polymer strip reinforcement). For internal design of retaining walls with welded wire mats, the ratio of Kr/Ka is as much as 2.5 at the top of the wall depending on the type of reinforcing element used, reducing to 1.2 at a depth of 6 m and below. It should be noted that this method assumes that the vertical stress in the wall is equal to the weight of the overburden soils, conservatively neglecting surcharge pressures, temporary live loads, etc. It should be

APPENDIX A — LITERATURE REVIEW
98
further noted that this method does not account for potential arching effects at the back of the wall, which may be observed where shoring and short MSE reinforcements are applied. However, the results of field-scale testing of a shored MSE wall with short MSE reinforcements (appendix C) indicated that at low surcharge pressures the vertical stress in the wall is equivalent to the weight of the overburden soils. As such, arching may be considered negligible at low loadings. A.4.2 European Practice For internal design of MSE walls, the British Standard BS 8006 discusses two methods: the tie-back wedge method and the coherent gravity method.(38) Comparison of European methods to those discussed in chapter 5 indicates that MSE walls are designed very much the same in the U.S. as they are elsewhere in the world. The tie-back wedge method assumes active earth pressures (Ka) for design. The coherent gravity method uses a different earth pressure distribution, as follows:
⎟⎟⎠
⎞⎜⎜⎝
⎛+⎟⎟
⎠
⎞⎜⎜⎝
⎛−=
00 1
zzK
zzKK ao
for z ≤ zo ≤ 6 m Equation A.2
aKK = for z > 6 m Equation A.3 In these equations, K is the earth pressure used in the wall design, Ko is the at-rest earth pressure, and z is the depth of the reinforcement level measured from the top of the wall. In general, the distribution of lateral earth pressures within the reinforced block is considered to vary from the at-rest state (Ko) to the active state (Ka) in the upper six meters of the structure, and is considered to be entirely in the active state below 6 meters. The tie-back wedge method is recommended for walls where the short term axial tensile strain exceeds one percent (i.e., polymeric reinforcing). The coherent gravity method is recommended where the short-term axial tensile strain is less than or equal to one percent (i.e., steel reinforcements). A.4.3 Asian Practice The Hong Kong Geoguide specifies the same design earth pressures as the British Standard, further indicating that the determination of design earth pressures for MSE walls is relatively consistent around the world.(6,38)

APPENDIX A — LITERATURE REVIEW
99
A.5 FULL-SCALE TESTING OF MSE WALLS Instrumentation programs conducted on full-scale MSE walls were reviewed prior to developing a field-scale testing program (appendix C). This section provides a summary of these testing programs. Liang and Almoh’d instrumented a 15.8-m high MSE wall bridge abutment in Ohio with point bearing piles located approximately 0.9 m behind the wall facing to transfer bridge loads to the subsurface strata.(52) Their instrumentation program focused on the measurement of axial forces in the reinforcement, vertical earth pressures at the base of the reinforced soil mass, lateral earth pressures acting on the wall facing, and deflection of the wall facing by employing vibrating wire strain gages, interface pressure cells, vertical pressure cells and survey methods. Field measurements of reinforcement working forces were compared to the FHWA approach and to the load and resistance factor design (LRFD) method, and found to more closely approximate the LRFD method. Vertical pressure measurements at the base of the reinforced zone showed large variations from the predictions of the three distribution methods: Meyerhof, trapezoidal, and the uniform distribution.(53) Discrepancies between the vertical pressure measurements and the various theoretical pressure distributions were attributed to the lack of knowledge of the influences of the wall facing element and the frictional stresses that may have developed along the interface between the retained soil and the reinforced soil mass. Christopher et al. instrumented a 12.6-m high geotextile reinforced wall in Washington designed to provide a preload fill in an area of limited right-of-way, supporting a surcharge fill of more than 5 m in height.(54) The wall was instrumented using: • Bonded-resistance strain gages installed on the MSE reinforcements to evaluate the local
stress and strain distribution in the wall. • Mechanical extensometers installed on the MSE reinforcements to evaluate the global strain
and stress state in the geotextile and provide redundancy to the strain gages. • Inductance coil strain gages placed between reinforcing layers to evaluate lateral strains in
the reinforced soil mass. • Vertical earth pressure cells installed behind the reinforced zone to measure lateral pressures
at the back of the reinforced section. • Inclinometers installed at the face of the wall, in the reinforced section, and behind the
reinforced section to measure horizontal movement of the wall. • Monitoring of vertical movements of the wall by conventional optical surveys and the use of
liquid settlement sensing devices installed at the base of the wall. • Thermistors installed on the reinforcement for measuring internal temperatures of the soil
and reinforcement layers, coupled with a weather station.

APPENDIX A — LITERATURE REVIEW
100
The instrumentation program was considered to be successful in that most of the instruments survived construction and appeared to provide reasonable results. Several lessons learned applicable to development of an instrumentation program for an MSE wall were as follows: • The instrumentation should be sensitive over a wide range of strains (i.e., large during
construction, and very small following construction). • The gages and their respective attachment methods must be compatible with the type of
reinforcement material. • The instrumentation program should provide sufficient redundancy to explain anomalous
data. • A sufficient number of instruments spaced preferentially to identify areas of high stress
should be provided. • Measurement of both local and global strains is desirable. • Calibration of samples of gaged reinforcement is recommended. • Strain gages should be placed on both top and bottom of the reinforcements to identify
bending stresses, etc. • Temperature effects should be evaluated. • Continuous monitoring during construction is desirable. Thamm et al. conducted full-scale testing on a 3.2-m high Websol-wall reinforced with 2.7-m-long geotextile strips which was loaded to failure.(55) Their program employed the following instrumentation: • Hydraulic pressure cells to measure horizontal earth pressures behind the wall facing. • Strain gages to measure forces in the geotextile strips. • Inclinometer casing to determine the horizontal deformations of the wall facing. • Displacement transducers outside of the wall to measure horizontal deformation of the facing
panels and displacement transducers to measure the vertical settlement of the loading concrete slab on the surface.
• One pressure cell for determining the total vertical load placed on the surface of the wall. • Hydraulic pressure cells for measuring the pressures at the base of the loading concrete slab.

APPENDIX A — LITERATURE REVIEW
101
The load was applied to a concrete slab placed in the middle of the wall. Upon application of the first load, the slab settled approximately 25 mm and exhibited visible cracks, coupled with approximately 25 mm movement of the wall facing. The concrete slab reached steady state settlement at a load of 610 kN without taking additional load. Results of the instrumentation program indicated that arching occurred behind the wall facing. This was attributed to the construction procedure using strutted panels in combination with less densification along the first 1.0 m behind the facing. It was found that wedge failure mechanisms may be used for design of structures subjected to high surface loads. A.6 PERTINENT LITERATURE REVIEW FINDINGS The literature review conducted to assist in development of this report provided results relevant to the SMSE wall design guidelines: • MSE walls have been successfully constructed with reinforcement lengths shorter than
70 percent of the wall height (<0.7H), and use of MSE reinforcements on the order of 0.6H are common in the private sector for traditional MSE wall construction.
• MSE reinforcement lengths considerably less than 0.7H have been successfully employed
where the earth pressures are considerably less than active earth pressures (K<Ka), such as in the case of MSE walls constructed in front of rock outcrops.(5)
• For narrow or confined walls, the vertical overburden stress is likely less than the unit weight
of the overburden multiplied by the wall height (σv<γH) due to arching effects, and these effects require consideration for design of stepped walls.(6)
Results of the literature review determined that the best way to evaluate the use of short MSE reinforcements was through centrifuge modeling. The centrifuge modeling program is presented in appendix B.


APPENDIX B — CENTRIFUGE MODELING OF SHORED MSE WALL
103
APPENDIX B — CENTRIFUGE MODELING OF SHORED MSE WALL Laboratory-scale modeling (i.e., centrifuge testing) was conducted to evaluate the behavior of composite mechanically stabilized earth and shoring wall systems (SMSE) and to obtain guidance for optimization of the design. One of the most important aspects in optimization of the composite system is reduction of the MSE reinforcement lengths, which reduces both the amount of excavation as well as the amount of reinforced fill required. The use of short MSE reinforcements was found to best be evaluated using the centrifuge. The laboratory testing, presented in detail in Woodruff, addressed reducing the length of MSE reinforcements for MSE walls located adjacent to a rigid shoring wall, as well as other variables.(49) The centrifuge testing program was conducted in two phases: • Phase I – Parametric study of an SMSE system. • Phase II – Modeling of the field-scale prototype. B.1 CENTRIFUGE MODELING Because small-scale models do not exhibit the same stress conditions as the full-scale or prototype model, centrifuge model tests are conducted at an increased acceleration level to simulate the actual field conditions. Modeling of a prototype involves predicting the behavior of a full-scale project to be constructed in the field. The laboratory model is constructed using the same materials and is geometrically similar to the prototype. In order to use centrifuge modeling for the prediction of prototype behavior, knowledge of scaling laws is required. Increasing the acceleration level during centrifuge modeling (to N times that of natural gravity) leads to the relations summarized in table 6, assuming that the material in the model is the same as the material in the prototype. B.2 MODELING PARAMETERS B.2.1 Materials Two different types of materials were used for the laboratory testing presented in this appendix: reinforcement and soil. This section discusses the types of reinforcement materials and soil materials used in the centrifuge testing program. Reinforcement The reinforcements used in the centrifuge modeling included two commercially-available non-woven interfacing fabrics manufactured by Pellon Division of Freudenberg Non-wovens. The stronger fabric, Pellon True-Grid, consisted of 60 percent polyester and 40 percent rayon having a unit weight of 28 grams per square meter (g/m2). The weaker fabric, Pellon Sew-In,

APPENDIX B — CENTRIFUGE MODELING OF SHORED MSE WALL
104
consisted of 100 percent polyester fabric with a unit weight of 24.5 g/m2. Characterization of the reinforcement material used in the study is provided in Zornberg et al.(56)
Table 6. Centrifuge scaling relations.(57,58)
Parameter Prototype1 Model1 Length N 1 Area N2 1 Volume N3 1 Velocity 1 1 Acceleration 1 N Mass N3 1 Force N2 1 Energy N3 1 Stress 1 1 Strain 1 1 Mass Density 1 1 Energy Density 1 1 Time (Dynamic) N 1 Time (Diffusion) N2 1 Time (Creep) 1 1 Frequency 1 N Reinforcement Stiffness N 1 Reinforcement Ultimate Tensile Strength
N 1
1 The value, N, refers to the gravitational acceleration during centrifuge modeling with the acceleration level equal to N times gravity (g). Where indicated, the value of N is squared or cubed to evaluate the parameter.
The tensile strength of the reinforcement fabric is anisotropic, with the lower strength along the machine direction. Both orientations of the reinforcements (parallel and transverse to the machine direction) were used in the centrifuge modeling. The unconfined tensile strength of the reinforcement is presented in table 7.
Table 7. Unconfined tensile strengths of the reinforcement.
Geotextile Direction Unconfined Tensile
Strength (kN/m)
Reinforcement Designation1
Weak 0.03 R1 Pellon Sew-In Strong 0.10 R3 Weak 0.09 R2 Pellon True-Grid Strong 1.12 R4
1 Reinforcement designation indicates type and orientation of reinforcement for centrifuge models.

APPENDIX B — CENTRIFUGE MODELING OF SHORED MSE WALL
105
Soil The soil used for development of the centrifuge models differed between Phases I and II of the testing program. Monterey No. 30 sand was used for the Phase I testing, and mortar sand obtained from Turner Fairbanks Highway Research Center (TFHRC) was used for Phase II testing. The soil used for Phase I of the laboratory study was Monterey No. 30 sand having a uniform gradation and classified as poorly-graded sand (SP) according to the Unified Soil Classification System (USCS). The material gradation for Monterey No. 30 sand is presented in figure 34. For sample preparation, the Monterey No. 30 sand was pluviated to reach a target relative density, Dr, of 70 percent (16.05 kN/m3). Results of triaxial testing conducted on Monterey No. 30 sand indicate that the peak friction angle of the sand increases with increasing relative density. Assuming a relative density of 70 percent, which was used in the centrifuge models, the peak triaxial shear friction angle (φTX) for Monterey No. 30 sand was estimated to be 36.7 degrees.(49) Correlation from triaxial friction angle to plane strain friction angle (φPS) resulted in a plane strain friction angle of 42.2 degrees for the Monterey No. 30 sand at 70 percent relative density.(49)
0
10
20
30
40
50
60
70
80
90
100
0.010.1110
Particle Diameter (mm)
Percent Finer (%)
Monterey No. 30 Sand
Figure 34. Graph. Particle size distribution for Monterey No. 30 sand used for Phase I
centrifuge modeling.(49) Phase II of the centrifuge program used mortar sand obtained from TFHRC, which is the same material used for construction of the reinforced fill portion of the field-scale test wall
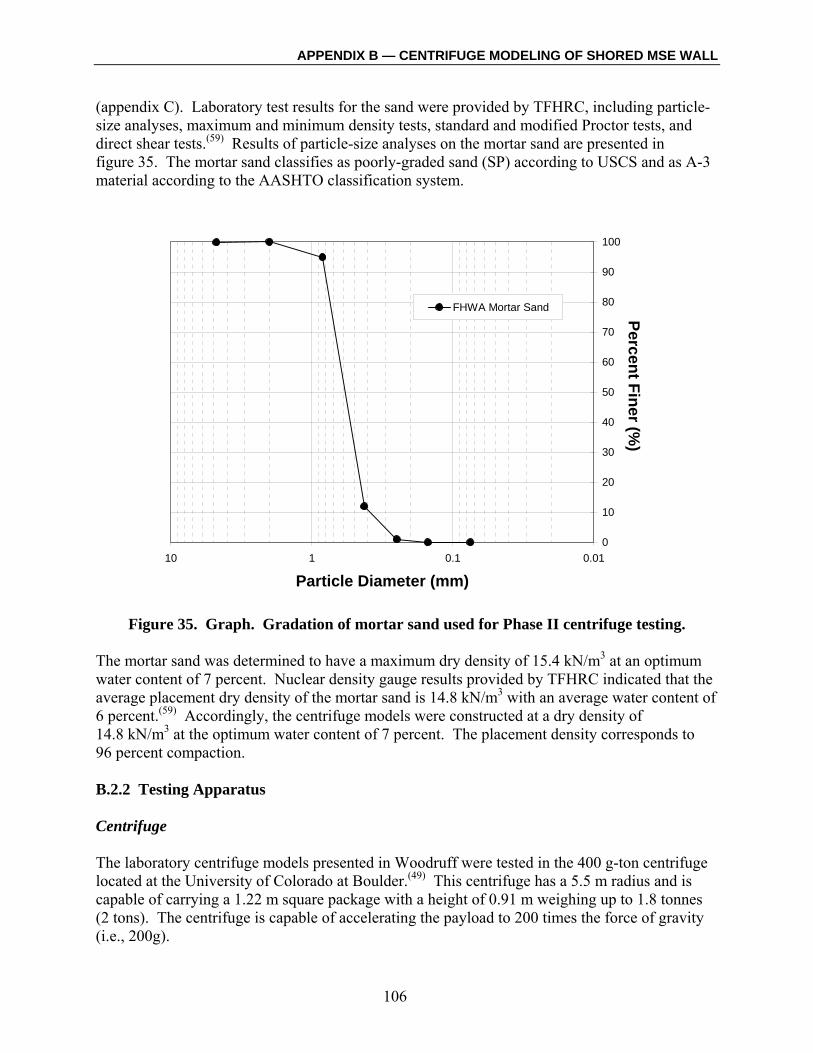
APPENDIX B — CENTRIFUGE MODELING OF SHORED MSE WALL
106
(appendix C). Laboratory test results for the sand were provided by TFHRC, including particle-size analyses, maximum and minimum density tests, standard and modified Proctor tests, and direct shear tests.(59) Results of particle-size analyses on the mortar sand are presented in figure 35. The mortar sand classifies as poorly-graded sand (SP) according to USCS and as A-3 material according to the AASHTO classification system.
0
10
20
30
40
50
60
70
80
90
100
0.010.1110
Particle Diameter (mm)
Percent Finer (%)
FHWA Mortar Sand
Figure 35. Graph. Gradation of mortar sand used for Phase II centrifuge testing.
The mortar sand was determined to have a maximum dry density of 15.4 kN/m3 at an optimum water content of 7 percent. Nuclear density gauge results provided by TFHRC indicated that the average placement dry density of the mortar sand is 14.8 kN/m3 with an average water content of 6 percent.(59) Accordingly, the centrifuge models were constructed at a dry density of 14.8 kN/m3 at the optimum water content of 7 percent. The placement density corresponds to 96 percent compaction. B.2.2 Testing Apparatus Centrifuge The laboratory centrifuge models presented in Woodruff were tested in the 400 g-ton centrifuge located at the University of Colorado at Boulder.(49) This centrifuge has a 5.5 m radius and is capable of carrying a 1.22 m square package with a height of 0.91 m weighing up to 1.8 tonnes (2 tons). The centrifuge is capable of accelerating the payload to 200 times the force of gravity (i.e., 200g).
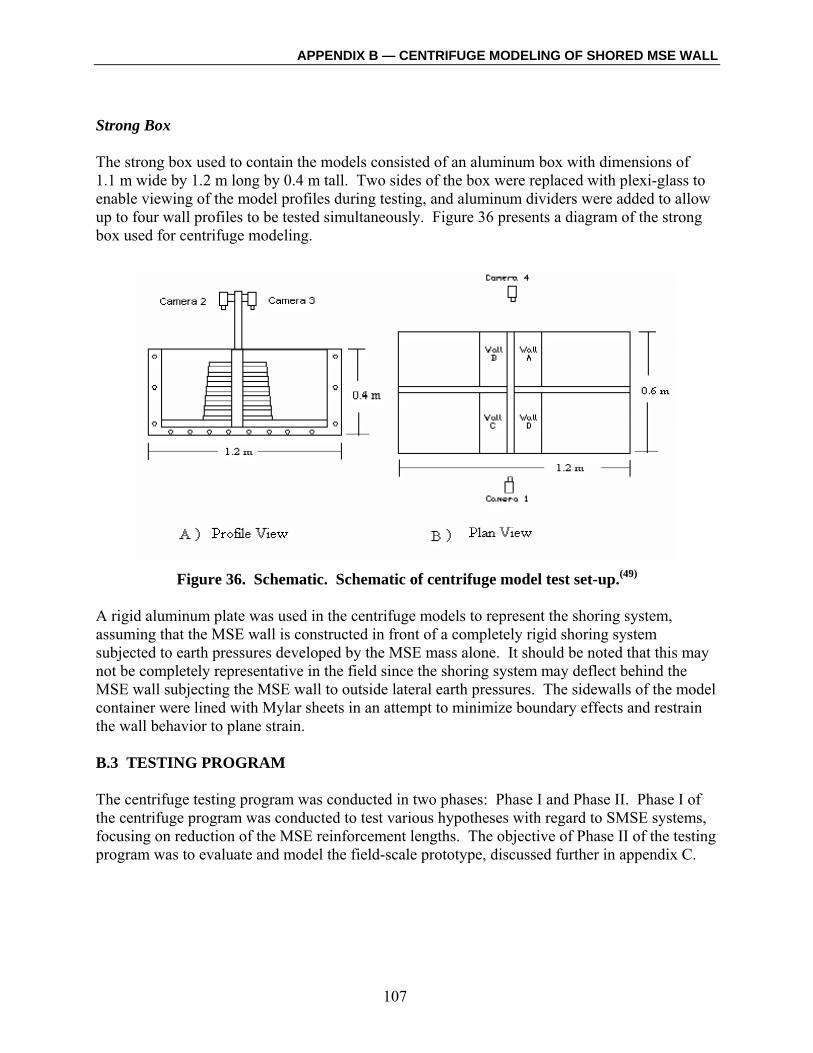
APPENDIX B — CENTRIFUGE MODELING OF SHORED MSE WALL
107
Strong Box The strong box used to contain the models consisted of an aluminum box with dimensions of 1.1 m wide by 1.2 m long by 0.4 m tall. Two sides of the box were replaced with plexi-glass to enable viewing of the model profiles during testing, and aluminum dividers were added to allow up to four wall profiles to be tested simultaneously. Figure 36 presents a diagram of the strong box used for centrifuge modeling.
Figure 36. Schematic. Schematic of centrifuge model test set-up.(49)
A rigid aluminum plate was used in the centrifuge models to represent the shoring system, assuming that the MSE wall is constructed in front of a completely rigid shoring system subjected to earth pressures developed by the MSE mass alone. It should be noted that this may not be completely representative in the field since the shoring system may deflect behind the MSE wall subjecting the MSE wall to outside lateral earth pressures. The sidewalls of the model container were lined with Mylar sheets in an attempt to minimize boundary effects and restrain the wall behavior to plane strain. B.3 TESTING PROGRAM The centrifuge testing program was conducted in two phases: Phase I and Phase II. Phase I of the centrifuge program was conducted to test various hypotheses with regard to SMSE systems, focusing on reduction of the MSE reinforcement lengths. The objective of Phase II of the testing program was to evaluate and model the field-scale prototype, discussed further in appendix C.

APPENDIX B — CENTRIFUGE MODELING OF SHORED MSE WALL
108
B.3.1 Phase I Phase I of the centrifuge testing program was a parametric study that addressed the following variables: • Aspect ratio of the wall (i.e., reinforcement length divided by wall height). • Reinforcement strength. • Shoring interface (i.e., roughness). • Reinforcement configuration at the shoring wall interface (i.e., attached, wrapped or
unconnected). • Reinforcement vertical spacing. • Shoring wall inclination. A total of 24 models were tested as part of the Phase I investigation, summarized in table 8. All of the models were constructed with an MSE face batter of 1 horizontal to 11 vertical (1:11V). Test model 1a verified modeling techniques with known results from other centrifuge research. Test models 1b, 2a, and 2b were conducted to evaluate the internal failure mechanism of an SMSE wall system. Test series 3 was conducted to investigate the effects of varying the shoring wall interface, using materials that were smooth to rough and a retained fill. Test series 4 and 5 were conducted to evaluate the minimum reinforcement length (aspect ratio) suitable for SMSE wall construction. The detail of the reinforcement connection at the shoring wall interface was also varied in test series 5 to investigate the benefits of wrapping the reinforcement around the back of the reinforced fill. Other design considerations were investigated in test series 6, including connection of the uppermost reinforcement layer, wrapping of the uppermost reinforcement layer, inclination of the shoring system, and a conventional MSE wall having retained fill with an aspect ratio of 0.3. Test series 7 investigated the effects of varying the reinforcement vertical spacing for a wall aspect ratio of 0.25. B.3.2 Phase II Phase II of the centrifuge testing program was conducted to predict behavior of the field-scale prototype wall scheduled for construction at TFHRC (appendix C). The field-scale wall modeled both reinforcements connected to the shoring system and unconnected reinforcements. Phase II centrifuge modeling only considered the unconnected system due to difficulties inherent in attempting to model the connected wall system. The model that was tested in the centrifuge was a duplication of the proposed field-scale prototype wall reduced by N, where N is the gravitational acceleration coefficient. The centrifuge model geometry versus the prototype geometry is presented in table 9, corresponding to a test acceleration of 16g.

APPENDIX B — CENTRIFUGE MODELING OF SHORED MSE WALL
109
Table 8. Summary of Phase I centrifuge test models.
Test Designation Reinforcement Length
Reinforcement Strength1
Reinforcement Configuration
at Shoring Interface
Shoring Interface Material
Reinforcement Vertical Spacing
(mm) a2
(Control) 0.9H R1 Unconnected Retained
fill 20
1 b 0.6H R1 Unconnected Aluminum 20 a 0.6H R2 Unconnected Aluminum 20 2 b 0.4H R2 Unconnected Aluminum 20 a 0.7H R2 Unconnected Aluminum 20 b 0.7H R2 Unconnected Retained
fill 20
c 0.7H R2 Unconnected Smooth 20 3
d 0.7H R2 Unconnected Rough 20 a 0.7H R4 Unconnected Aluminum 20 b 0.5H R4 Unconnected Aluminum 20 c 0.3H R4 Unconnected Aluminum 20 4
d 0.3H R4 Unconnected Aluminum 20 a 0.17H R4 Unconnected Aluminum 20 b 0.2H R4 Wrapped Aluminum 20 c 0.25H R4 Unconnected Aluminum 20 5
d 0.2H R4 Wrapped Aluminum 20 a 0.3H R4 Top layer
attached Aluminum 20
b 0.3H R4 Top layer wrapped
Aluminum 20
c 0.2H-0.3H R4 Unconnected Inclined 20 6
d 0.3H R4 Unconnected Retained fill
20
a 0.25H R4 Unconnected Aluminum 10 b 0.25H R4 Unconnected Aluminum 30 c 0.25H R4 Unconnected Aluminum 40 7
d 0.25H R4 Unconnected Aluminum 50 1 Reinforcement strengths: R1=Pellon Sew-In weak direction, R2=Pellon True-Grid weak direction, R3=Pellon
Sew-In strong direction, and R4=Pellon True-Grid strong direction. 2 This test was conducted as a duplication test on a standard MSE configuration to ensure that model preparation
methods are acceptable.

APPENDIX B — CENTRIFUGE MODELING OF SHORED MSE WALL
110
Table 9. Centrifuge model parameters compared to prototype parameters.
Variable Centrifuge model
Prototype (Preliminary
Design)
Prototype (Final Design)
Height, H 0.34 m 5.49 m 5.5 m Aspect ratio, α 0.25 0.25 0.25 to 0.39 Reinforcement vertical spacing, sv 0.029 m 0.457 m 0.457 m Width of load footing, Wf 0.089 m 1.422 m 1.0 m Length of load footing, Lf 0.425 m 6.81 m 2.5 m Area of load footing, Af 0.038 m2 9.68 m2 2.5 m2 Wall length, Lw 0.43 m 6.90 m 7.0 m Wall width (top), LT 0.143 m 2.29 m 2.3 m Wall width (bottom), LB 0.086 m 1.37 m 1.4 m Reinforcement Tensile Strength, T 1.12 kN/m 18 kN/m 52 kN/m
Pellon True-grid fabric placed in the strong direction was used as the reinforcement for construction of the Phase II centrifuge model. The ultimate tensile strength of the geotextile determined using the wide width tensile test (ASTM D4595 modified using 300 mm per minute displacement rate) was 1.12 kN/m.(60, 61) Scaling of the reinforcement strength for an acceleration level of 16g results in an ultimate tensile strength of 18 kN/m. The field-scale test wall was loaded with a jack and footing, and the centrifuge model was designed accordingly. The capacity of the hydraulic jacks at TFHRC is 890 kN. Two air actuators were used to apply load to the centrifuge model footing, as illustrated in figure 37. The model and prototype applied footing pressures are summarized in table 10.
Table 10. Comparison of centrifuge model and prototype footing pressures.
Model Prototype
Loads Force (kN)
Pressure (kPa)
Force (kN)
Pressure (kPa)
Service Load
0.90 23.9 231.6 23.9
Maximum Load
9.05 239.2 2316.1 239.2
The centrifuge model was tested in two phases. First, the model was spun at a constant acceleration of 16g and loaded to the service load of 23.9 kPa, followed by loading to failure of the model or capacity of the actuators. Secondly, after the actuator capacity was reached and the wall had not failed, the acceleration level was increased while keeping the actuator load constant until wall failure.
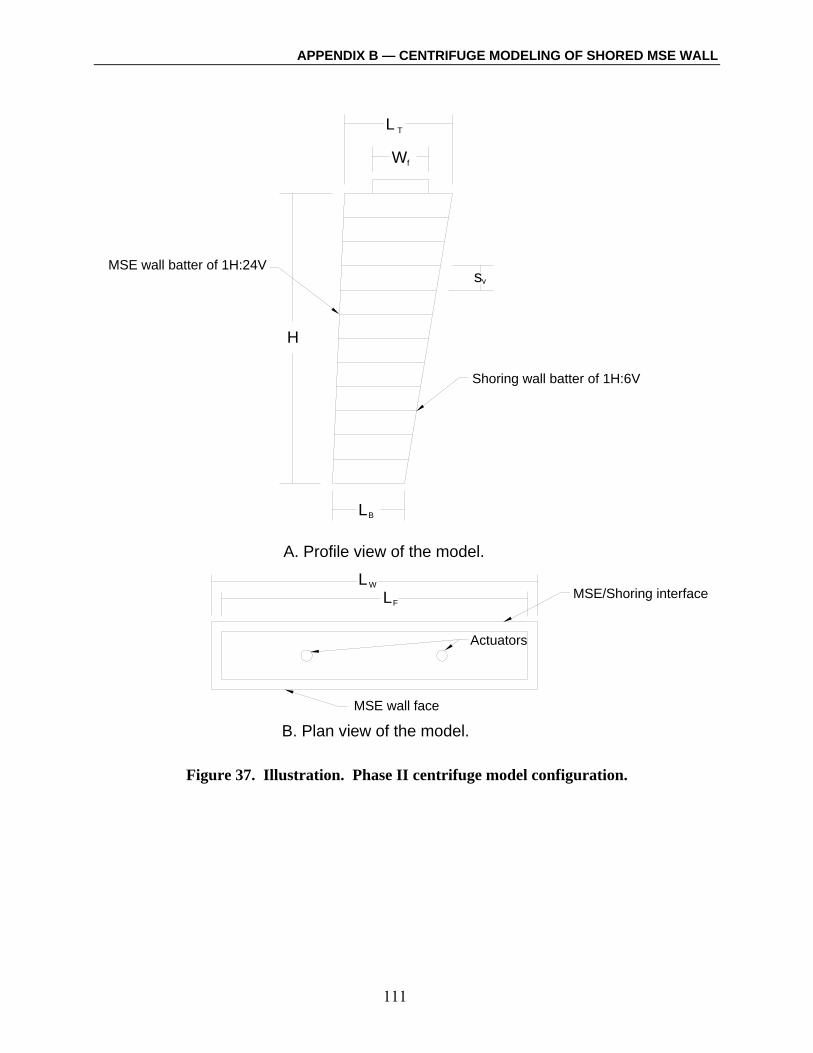
APPENDIX B — CENTRIFUGE MODELING OF SHORED MSE WALL
111
H
W
L
s
L
v
f
T
B
Shoring wall batter of 1H:6V
A. Profile view of the model.
MSE wall batter of 1H:24V
B. Plan view of the model.
LW
LF
Actuators
MSE/Shoring interface
MSE wall face
Figure 37. Illustration. Phase II centrifuge model configuration.

APPENDIX B — CENTRIFUGE MODELING OF SHORED MSE WALL
112
B.4 RESULTS B.4.1 Phase I Results of the Phase I centrifuge modeling program are summarized in table 11. The table presents the wall aspect ratio, gravitational acceleration level at failure (g-level), type of failure, and the g-level at “pull away.” “Pull away” is defined as the point where a trench develops along the MSE-shoring interface.
Table 11. Summary of Phase I centrifuge test results.
Test Designation Aspect Ratio
g-Level at Failure Failure Type1,2 g-Level at
Pull Away a3 (Control) 0.9H 18 Internal (1) N/A 1
b 0.6H 17 Compound (1) 17 a 0.6H 38 Compound (1) 27 2 b 0.4H 41 Compound (2) 39 a 0.7H 38 Internal (1) N/A b 0.7H 49 Internal (1) N/A c 0.7H 47 Internal (1) N/A 3
d 0.7H 44 Internal (1) N/A a 0.7H N/A N/A N/A b 0.5H N/A N/A N/A c 0.3H N/A N/A 22 4
d 0.3H N/A N/A 32 a 0.17H 7 Overturning (2) 5 b 0.2H N/A N/A N/A c 0.25H 32 Overturning (2) 13 5
d 0.2H N/A N/A N/A a 0.3H N/A N/A 27 b 0.3H N/A N/A 30 c 0.2H-0.3H 78 Overturning 25 6
d 0.3H N/A N/A N/A a 0.25H 38 Overturning (2) 31 b 0.25H 2.5 Overturning (2) 1 c 0.25H 1 Overlap pullout N/A 7
d 0.25H 1 Overlap pullout N/A 1 Compound failure implies that a portion of the failure surface followed the shoring interface. 2 Deformation modes (1) and (2) designate different types of deformation leading to failure, discussed in
the text. 3 This test was conducted as a duplication test on a standard MSE configuration to ensure that model
preparation methods are acceptable. Figure 38 is a photo of centrifuge test series 2 at a g-level of approximately 37g, which shows trench development at the top of the model on the left (model 2b), and surface settlement of the model on the right (model 2a). Figure 39 is a photo of the same test at an acceleration of 38g, marked by failure of the model on the right having an aspect ratio of 0.6. Failure of the model with an aspect ratio of 0.4 (on the left) is shown in figure 40 at an acceleration of 41g.

APPENDIX B — CENTRIFUGE MODELING OF SHORED MSE WALL
113
Figure 38. Photo. Centrifuge test series 2 at 37g acceleration.
Figure 39. Photo. Centrifuge test series 2 at 38g acceleration.

APPENDIX B — CENTRIFUGE MODELING OF SHORED MSE WALL
114
Figure 40. Photo. Centrifuge test series 2 at 41g acceleration.
The centrifuge test results are summarized as follows: • Test series 1 (models 1a and 1b) – Model 1a was a control model constructed to verify
modeling techniques. Model 1b was an MSE wall with sample reinforcements of length 0.6H using low strength reinforcements oriented with weak direction perpendicular to wall face. Reinforcing layers were butted against a vertical wall to resemble shoring by an unconnected system. Model 1b exhibited compound failure at a gravitational acceleration of 17g.
• Test series 2 (models 2a and 2b) – MSE wall with sample reinforcements of lengths of 0.6H
and 0.4H using high strength reinforcements oriented with weak direction perpendicular to wall face. Reinforcing layers were butted against a vertical wall to resemble shoring by an unconnected system. The models exhibited compound failure at gravitational accelerations of 38g and 41g for aspect ratios of 0.6 and 0.4, respectively. It should be noted that these models exhibited pull-away from the shoring wall at lower accelerations of 27g and 39g, respectively.
• Test series 3 (models 3a through 3d) – MSE walls with sample reinforcement lengths of 0.7H
using strong fabric reinforcements in the weak direction to investigate shoring interface roughness. Shoring interfaces tested included aluminum, retained fill, smooth surface, and rough surface. All of these models exhibited internal failure at gravitational accelerations ranging from 38g to 49g. The results were not as expected, as model 3b did not employ shoring and failed at the highest acceleration level, and the model with a smooth shoring interface (3c) appeared to be slightly more robust than, but otherwise very similar to, the model with a rough shoring interface (3a).

APPENDIX B — CENTRIFUGE MODELING OF SHORED MSE WALL
115
• Test series 4 (models 4a through 4d) – MSE walls with sample reinforcement lengths ranging
from 0.3H to 0.7H using strong fabric reinforcements in the strong direction to investigate reinforcement length. The models with reinforcement length of 0.3H began to pull away from the shoring at 22g to 32g, but did not fail at the test acceleration. Models with reinforcements of 0.5H and 0.7H did not even pull away at the test acceleration.
• Test series 5 (models 5a through 5d) – For this test, two (5b and 5d) of the four models were
duplicate tests, each constructed with 0.2H reinforcement lengths and MSE wrap-around at the shoring face. These models (5b and 5d) did not fail at the test acceleration. Models 5a and 5c were tested with reinforcement lengths (unconnected at the shoring wall) of 0.17H and 0.25H, respectively. These models exhibited overturning failure at g-levels of 7g and 32g, respectively.
• Test series 6 (models 6a through 6d) – In general, these models had MSE reinforcement
lengths on the order of 0.3H. Model 6a had the top reinforcements tied, while model 6b had the top reinforcements wrapped at the back. Model 6c was a standard test with a shoring wall, and model 6d had retained fill at the shoring interface. Models 6a, 6b, and 6d did not fail at the test acceleration, while model 6c exhibited overturning failure at 78g.
• Test series 7 (models 7a through 7d) – MSE walls with sample reinforcement lengths of
0.25H using strong fabric reinforcements in the strong direction to investigate reinforcement vertical spacing (ranging from 10 mm to 50 mm). Models 7a and 7b with vertical reinforcement spacings of 10 and 30 mm, respectively, exhibited overturning failure of38g and 2.5g, respectively. Models 7c and 7d, with vertical reinforcement spacings in excess of 30 mm, exhibited pullout failure at 1g.
The main conclusions that can be drawn from this study with regard to each of the variables evaluated are: • Aspect ratio – Walls with an aspect ratio larger than 0.6 failed completely internally with all
reinforcement layers intersecting the failure plane. Walls with aspect ratios equal to or less than 0.6 failed in a compound mode with the failure plane following the shoring interface near the top of the wall and intersecting the reinforcement layers near the bottom of the wall. In general, models constructed with aspect ratios of 0.3 or greater did not exhibit failure. However, failure due to overturning typically resulted when the wall aspect ratio was reduced to 0.25 or less.
• Reinforcement strength – Test series 1 through 3 failed internally due to the comparatively
low tensile strength of the reinforcement fabric used in the models. Stronger reinforcement materials, such as those used for test series 4 through 7, effectively prevented internal failure due to breakage of the reinforcement layers.
• Shoring interface – The roughness of the shoring interface was studied. However, the results
were not as expected because the smooth shoring wall was found to be as effective, if not more effective, than the rough shoring wall.

APPENDIX B — CENTRIFUGE MODELING OF SHORED MSE WALL
116
• Reinforcement configuration – Wrapping around the back reinforcement layers at the shoring
interface produced a wall configuration that was stable to very high acceleration levels, suggesting that earth pressures are effectively reduced.
• Reinforcement vertical spacing – Decreasing the spacing of the reinforcements was observed
to increase the stability of the walls with very short aspect ratios, suggesting that close reinforcement spacings reduce lateral earth pressures.
• Shoring wall batter – Shoring inclination was observed to add stability to the wall when
moderately inclined, as noted by test 6c which employed a shoring batter of 1H:14V. Other important observations were made from the Phase I centrifuge modeling. The failure planes have a tendency to be at an inclination slightly flatter than the theoretical Rankine failure plane where a shoring wall is employed. However, the presence of a retained fill produces a failure plane which closely approximates the theoretical Rankine failure plane. At aspect ratios on the order of 0.3, the models exhibited excessive deformation along the shoring interface in the form of a trench, though the walls did not exhibit collapse. This observation supports use of longer reinforcements at the top of the wall, on the order of 0.6H. B.4.2 Phase II General Results from the Phase I centrifuge program indicated that models with a small aspect ratio (0.25 or less) would fail through overturning if the reinforcement layers were sufficiently strong to resist breakage, as is the case with the centrifuge model tested during the Phase II program. The Phase II test model had an aspect ratio ranging from 0.25 to 0.39 and employed the strongest reinforcement type and direction. However, the prototype modeled in the centrifuge was subjected to vertical surcharge loading, which results in increased resistance to overturning, but decreased resistance to other modes of failure. The centrifuge model was tested at a constant acceleration of 16g, corresponding to the height of the prototype, and loaded to the capacity of the actuators. The centrifuge model did not exhibit failure during the first phase of the test, and so was then subjected to increasing acceleration levels until the model failed at an acceleration level of 32g. Due to the high surcharge load applied to the top of the centrifuge model, the model exhibited boundary effects with deformations the largest at the center, decreasing toward the edge of the container. Nine layers of the reinforcement tore during loading, causing ultimate failure of the model.

APPENDIX B — CENTRIFUGE MODELING OF SHORED MSE WALL
117
Prediction of Field-Scale Test Wall Behavior The field-scale test wall is discussed in detail in appendix C. The field-scale test wall consisted of two different wall cross sections, one with MSE reinforcements connected to the shoring wall, and the other as an unconnected system. Due to difficulties inherent in modeling the connected system, the centrifuge modeling was only conducted to model the unconnected portion of the field-scale test wall. The Phase II program further investigated the affects of shoring wall batter. The shoring wall was modeled with a batter of 1H:6V, further supporting the conclusion that moderate batter appears to increase wall stability. The centrifuge model was stable under the full capacity loading available, exceeding the prototype loading available at TFHRC. Results of the Phase II centrifuge modeling indicate that the field-scale prototype, as designed, would likely not exhibit significant failure under the maximum test load attainable at TFHRC.(59)


APPENDIX C — FIELD-SCALE TESTING OF SMSE WALL
119
APPENDIX C — FIELD-SCALE TESTING OF SMSE WALL Field-scale testing of a shored MSE (SMSE) wall system was conducted at the Federal Highway Administration (FHWA) Turner Fairbanks Highway Research Center (TFHRC) in McLean, Virginia. This appendix presents results of the field testing program. C.1 PURPOSE The field-scale testing was conducted to examine two hypotheses with regard to SMSE systems, as follows: • Primary Hypothesis – Construction of an MSE wall in front of a rigid backslope (i.e., shoring
system) results in reduced external lateral loading on the MSE wall compared to a conventional MSE wall.
• Secondary Hypothesis – Fully-connected wall systems provide limited benefit for an SMSE
wall system over an unconnected wall system. C.2 TEST WALL DESIGN The field-scale test model consisted of testing a wall with short MSE reinforcements (i.e., 0.25H to 0.39H [25 to 39 percent of the wall height, H]). The test wall was constructed using geogrid reinforcements with wire facing elements, typical to that used on many Federal Lands Highway (FLH) projects. Half of the wall (in plan) was constructed as an unconnected system, while half of the wall incorporated reinforcements attached to (or supported through) the shoring wall. The field-scale test wall was constructed in a concrete pit at TFHRC in McLean, Virginia. The pit dimensions are approximately 7 m long by 5.6 m wide with a depth of approximately 5.5 m. The MSE wall was constructed with a facing batter of 1H:24V (horizontal:vertical). The shoring wall was constructed at a batter of 1H:6V behind the reinforced section. A plan view of the test wall configuration is illustrated in figure 41. The minimum geogrid reinforcement length (measured at the bottom of the wall) was 1.4 m, corresponding to an aspect ratio of approximately 0.25. The reinforcement length increased from bottom to top, with the longest MSE reinforcement length (2.14 m) corresponding to an aspect ratio of 0.39. The vertical reinforcement spacing was set at a nominal 0.46 m, equivalent to the height of each wire facing element. Figures 42 and 43 provide typical cross sections for the unconnected and connected wall sections, respectively.
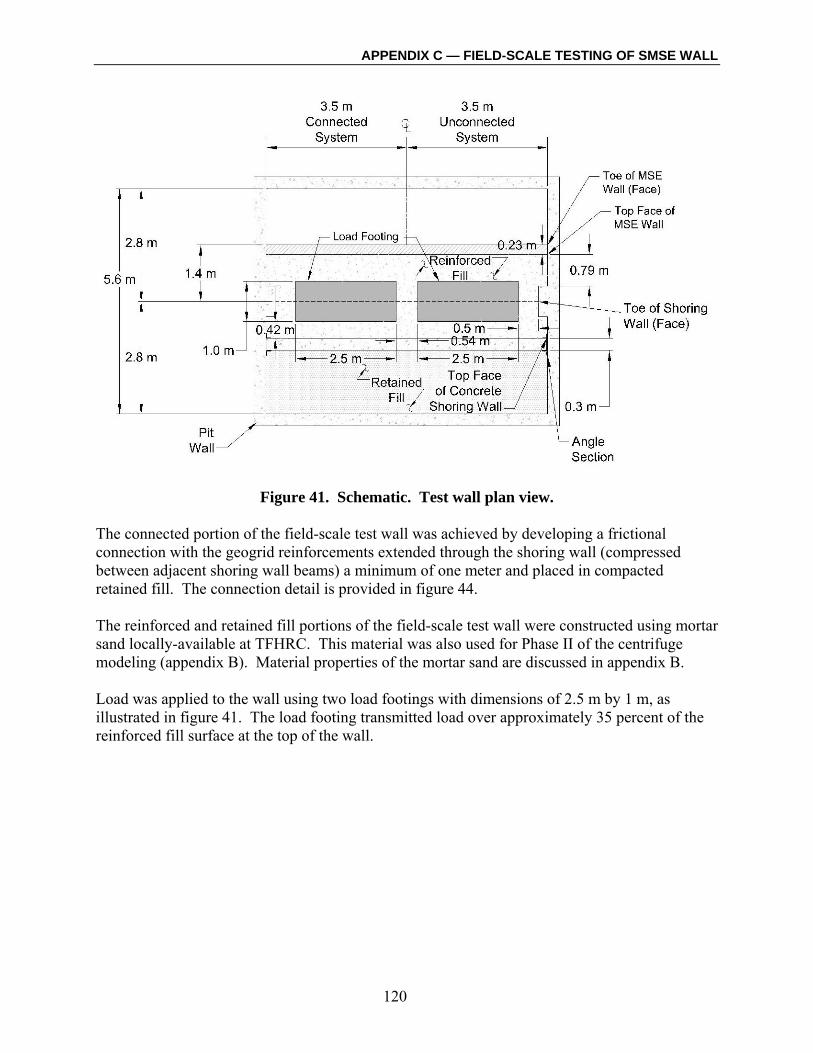
APPENDIX C — FIELD-SCALE TESTING OF SMSE WALL
120
Figure 41. Schematic. Test wall plan view.
The connected portion of the field-scale test wall was achieved by developing a frictional connection with the geogrid reinforcements extended through the shoring wall (compressed between adjacent shoring wall beams) a minimum of one meter and placed in compacted retained fill. The connection detail is provided in figure 44. The reinforced and retained fill portions of the field-scale test wall were constructed using mortar sand locally-available at TFHRC. This material was also used for Phase II of the centrifuge modeling (appendix B). Material properties of the mortar sand are discussed in appendix B. Load was applied to the wall using two load footings with dimensions of 2.5 m by 1 m, as illustrated in figure 41. The load footing transmitted load over approximately 35 percent of the reinforced fill surface at the top of the wall.

APPENDIX C — FIELD-SCALE TESTING OF SMSE WALL
121
Figure 42. Schematic. Typical field-scale test wall cross section with unconnected system.

APPENDIX C — FIELD-SCALE TESTING OF SMSE WALL
122
Figure 43. Schematic. Typical field-scale test wall cross section with connected system.
C.3 TEST WALL CONSTRUCTION The test wall was constructed by TFHRC personnel in September and October 2004. The reinforced fill zone was placed in maximum 200 mm loose lifts, and the retained fill zone was placed in nominally thicker loose lifts. A backhoe was used to place bulk fill in the pit, and the fill was spread manually using shovels. Compaction of the reinforced and retained fill zones was achieved by using a vibratory plate compactor. Figure 45 is a photo of construction of the reinforced and retained fill zones.

APPENDIX C — FIELD-SCALE TESTING OF SMSE WALL
123
Figure 44. Schematic. Connection detail for connected wall system.
Figure 45. Photo. Reinforced fill compaction and retained fill placement.
During wall construction, nuclear density gage measurements were taken for each lift of reinforced fill (figure 46) to ensure that compaction met or exceeded the specifications, i.e., minimum of 95 percent standard Proctor maximum dry density in accordance with ASTM D698 (or per AASHTO T-99).(7, 62) A compaction test conducted on a sample of TFHRC mortar sand

APPENDIX C — FIELD-SCALE TESTING OF SMSE WALL
124
per AASHTO T-99 resulted in a maximum dry density of 15.3 kN/m3 at an optimum moisture content of 17.4 percent.(7) Results of nuclear density gauge testing indicated that the reinforced fill portion of the field-scale test wall was over-compacted with densities corresponding to 102 to 105 percent of the AASHTO T-99 maximum dry density, and as a result not characteristic of typical wall construction.(7)
Figure 46. Photo. Nuclear density gage testing of reinforced fill zone.
The “shoring wall” was constructed using reinforced concrete beams fixed laterally at each end of the pit using angle sections bolted to the pit walls (figure 47). Each shoring beam was constructed with a height approximately equivalent to the height of each reinforced MSE wall layer for ease of installation. A crane was used to place the shoring beams in the pit, shown in figure 48.

APPENDIX C — FIELD-SCALE TESTING OF SMSE WALL
125
Figure 47. Schematic. Plan view of shoring beam connection to pit wall.
Figure 48. Photo. Installation of shoring beam.
Tensar® welded wire facing forms were used for the facing of the field-scale test wall. These facing units consist of L-shaped wire baskets supported with struts, as illustrated in figure 49. A geotextile wrap was installed adjacent to the wire facing to contain the reinforced fill.

APPENDIX C — FIELD-SCALE TESTING OF SMSE WALL
126
Figure 49. Schematic. Tensar® welded wire facing unit.
Tensar® UX1500MSE uniaxial structural geogrid manufactured from high density polyethylene (HDPE) was used as the MSE reinforcing elements (figure 50). UX1500MSE geogrid has a tensile strength of 52 kN/m at five percent strain, and an ultimate tensile strength of 114 kN/m. Two additional layers of geogrid were placed near the top of the wall to prevent bearing capacity failure of the soil due to the applied loading, as illustrated in figures 42 and 43.
Figure 50. Photo. Geogrid installation.

APPENDIX C — FIELD-SCALE TESTING OF SMSE WALL
127
C.4 INSTRUMENTATION AND MONITORING An instrumentation program consisting of strain gages, earth pressure cells, inclinometers, potentiometers, dial gages and optical survey methods was incorporated to monitor wall deflections, geogrid tensions, and earth pressures during wall loading. The primary objectives of the instrumentation program were as follows: • Observe stress and strain distribution in the MSE wall. • Evaluate the change in stress distribution in the MSE mass due to increased surcharge
loading. • Evaluate internal and external stress levels, especially as they relate to earth pressure on the
interface between the shoring wall and MSE mass. • Monitor the deformation response of the test wall. Two wall sections were instrumented and monitored: one section near the center of the connected wall system, and one section near the center of the unconnected wall section. Figure 51 illustrates the wall instrumentation plan, and table 12 summarizes the specifications of the various instruments installed in the test wall.
Table 12. Specification summary for test wall instrumentation.
Instrument Manufacturer Model Sensitivity Accuracy Resolution Calibrated By Strain Gage Micro-
Measurements EP-08-
500GB-120(+0.4±0.2)% at
24 degrees Celsius (oC)
— — Gages: Micro-Measurements; Gages and geogrid: University of Colorado-Denver
Pressure Cell Geokon 4800/4810 — ±0.1% ±0.025% F.S
Geokon
LVDT Solartron Metrology
DCR/50 3.2 microVolts per Volt per millimeter
(mV/V/mm)
— — TFHRC with Micro-Measurements system 5000
Potentiometer Celesco PT101 — ±0.15% full stroke
— TFHRC with Micro-Measurements system 5000

APPENDIX C — FIELD-SCALE TESTING OF SMSE WALL
128
Figure 51. Schematic. Instrumented wall section.
Along each of the instrumented sections, the following instrumentation was installed: • Bonded resistance strain gages (twelve per instrumented section) – located on four layers of
geogrid near the top, middle and bottom of the wall section and near the front, middle and back of each reinforcing element. The purpose of the bonded resistance strain gages was to enable evaluation of local stress and strain distribution in the geogrid reinforcing elements and identify areas of maximum stress. Strain gages manufactured by Micro-Measurements were installed, as shown in figure 52.
• Vertical earth pressure cells (four per instrumented section) – located at the MSE/shoring
wall interface near the bottom, middle and top of the wall section. The purpose of this instrumentation was to measure lateral earth pressures at the back of the MSE wall. Geokon 4810 vertical earth pressure cells were employed, as shown in figure 53.
• Horizontal earth pressure cells (six per instrumented section) – two cells located at the base
of the MSE mass, and the remainder coupled with the vertical earth pressure cells. The purpose of this instrumentation was to measure vertical earth pressures in the MSE mass as a function of applied surcharge load. Geokon 4800 horizontal earth pressure cells were employed, as shown in figure 53.
• Inclinometer casing (two per instrumented section) – one casing located at the face of the
MSE wall and one casing located behind the shoring wall. Inclinometer casing was installed
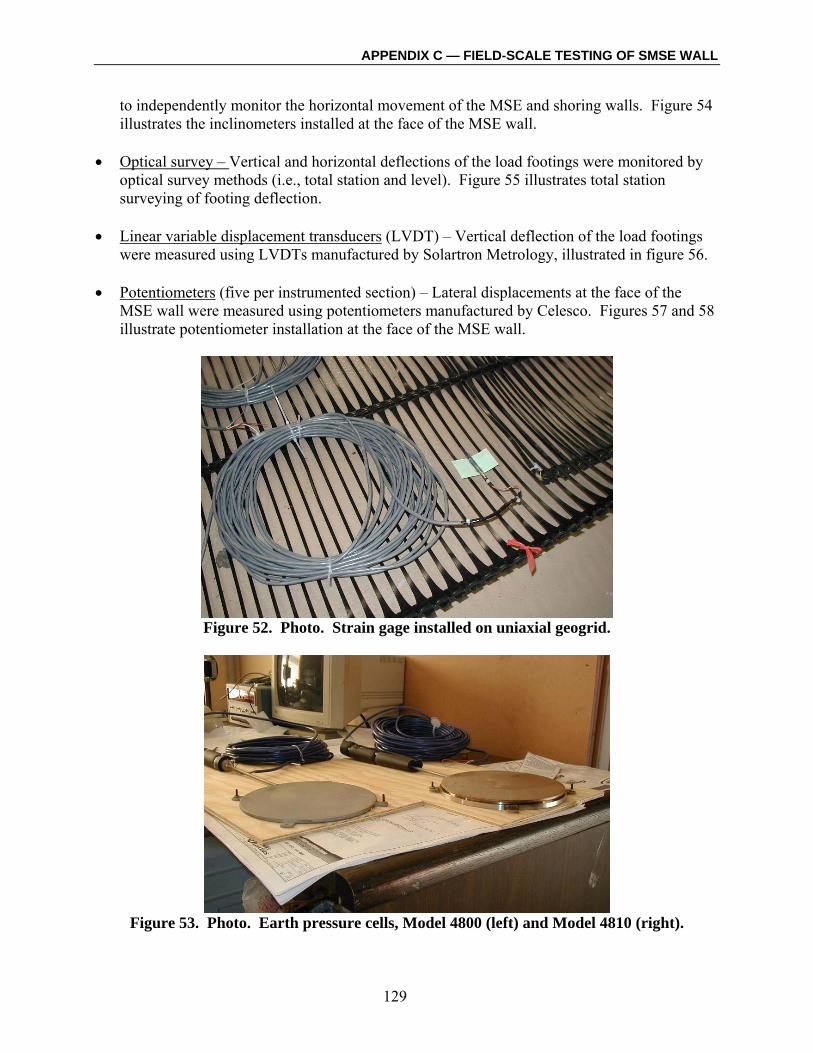
APPENDIX C — FIELD-SCALE TESTING OF SMSE WALL
129
to independently monitor the horizontal movement of the MSE and shoring walls. Figure 54 illustrates the inclinometers installed at the face of the MSE wall.
• Optical survey – Vertical and horizontal deflections of the load footings were monitored by
optical survey methods (i.e., total station and level). Figure 55 illustrates total station surveying of footing deflection.
• Linear variable displacement transducers (LVDT) – Vertical deflection of the load footings
were measured using LVDTs manufactured by Solartron Metrology, illustrated in figure 56. • Potentiometers (five per instrumented section) – Lateral displacements at the face of the
MSE wall were measured using potentiometers manufactured by Celesco. Figures 57 and 58 illustrate potentiometer installation at the face of the MSE wall.
Figure 52. Photo. Strain gage installed on uniaxial geogrid.
Figure 53. Photo. Earth pressure cells, Model 4800 (left) and Model 4810 (right).

APPENDIX C — FIELD-SCALE TESTING OF SMSE WALL
130
Figure 54. Photo. Inclinometers installed at the face of the MSE wall.
Figure 55. Photo. Total station surveying of footing deflection.
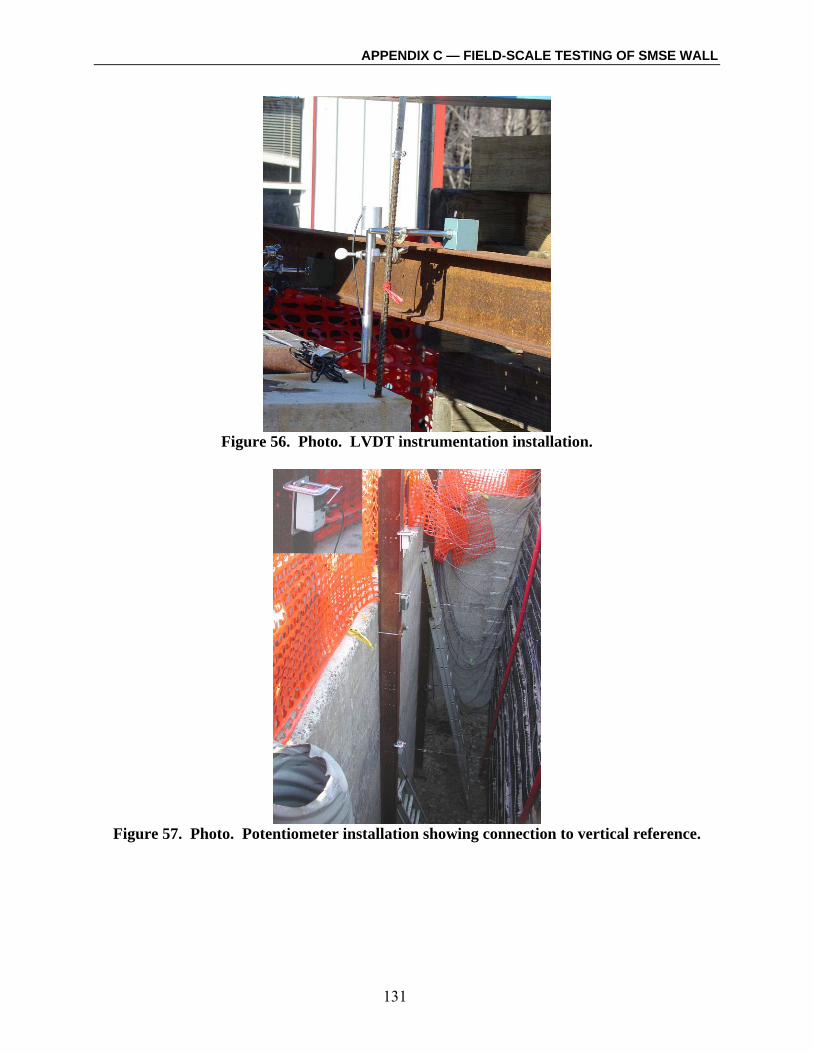
APPENDIX C — FIELD-SCALE TESTING OF SMSE WALL
131
Figure 56. Photo. LVDT instrumentation installation.
Figure 57. Photo. Potentiometer installation showing connection to vertical reference.

APPENDIX C — FIELD-SCALE TESTING OF SMSE WALL
132
Figure 58. Photo. Potentiometer wire connection to welded wire facing.
C.5 WALL LOADING Upon completion of construction, a dead load of 45 kiloPascal (kPa) was applied in four load increments over the course of one month. The dead load was applied by placing jersey barriers on the concrete footings. Survey total station measurements of the footing settlement recorded during dead loading are presented in figure 59. The dead load was used to remove “slack” from the system so that monitoring instruments could be interpreted with greater sensitivity during wall loading. The dead load was removed prior to setting up the load frame. Load testing of the field-scale test wall occurred in December 2004. The test loads were applied using jacks, with four jacks applying pressure on each footing (eight jacks total), as shown in figure 60. Each footing was 1 m by 2.5 m, as measured in plan, transmitting load over approximately 35 percent of the surface area of the reinforced fill. The test loads were applied in 22.24 kN per jack increments, equivalent to 89 kN per footing, or an incremental footing pressure of 35.6 kPa. Each test load was maintained for 30 minutes, with inclinometer and survey measurements recorded near the end of each load interval. The wall was loaded to a total load per footing of approximately 890 kN, equivalent to a total footing pressure of 356 kPa. The test wall was unloaded in two stages, with data recorded at 50 percent of the total test load and with the wall completely unloaded. It is important to note that the test wall was loaded to an extremely high level with a maximum footing pressure of 356 kPa applied to approximately 35 percent of the reinforced fill zone (125 kPa equivalent), equivalent to approximately 10 times the normal traffic loading of 12 kPa.

APPENDIX C — FIELD-SCALE TESTING OF SMSE WALL
133
Wall Face
2 4Footing
1 3Connected Wall System
-5.0
-4.0
-3.0
-2.0
-1.0
0.0
10/2
2/04
10/2
5/04
10/2
5/04
10/2
6/04
10/2
6/04
10/2
8/04
10/2
8/04
11/0
1/04
11/0
2/04
11/0
8/04
11/1
0/04
11/1
0/04
11/1
5/04
11/2
2/04
11.7 11.7 11.7 11.7 22.4 22.4 33.1 33.1 33.1 33.1 33.1 45.0 45.0 45.0Stress (kPa)
Unconnected Wall System-5.0
-4.0
-3.0
-2.0
-1.0
0.0
10/2
2/04
10/2
5/04
10/2
5/04
10/2
6/04
10/2
6/04
10/2
8/04
10/2
8/04
11/0
1/04
11/0
2/04
11/0
8/04
11/1
0/04
11/1
0/04
11/1
5/04
11/2
2/04
11.7 11.7 11.7 11.7 22.4 22.4 33.1 33.1 33.1 33.1 33.1 45.0 45.0 45.0
Stress (kPa)
Settl
emen
t (m
m)
0
5
10
15
20
0 100 200 300 400
1
2
3
4
AverageSettlement
Legend:
Figure 59. Graph. Footing settlement measurements recorded during dead loading.
Figure 60. Photo. Field-scale test wall load frame and jack set-up.
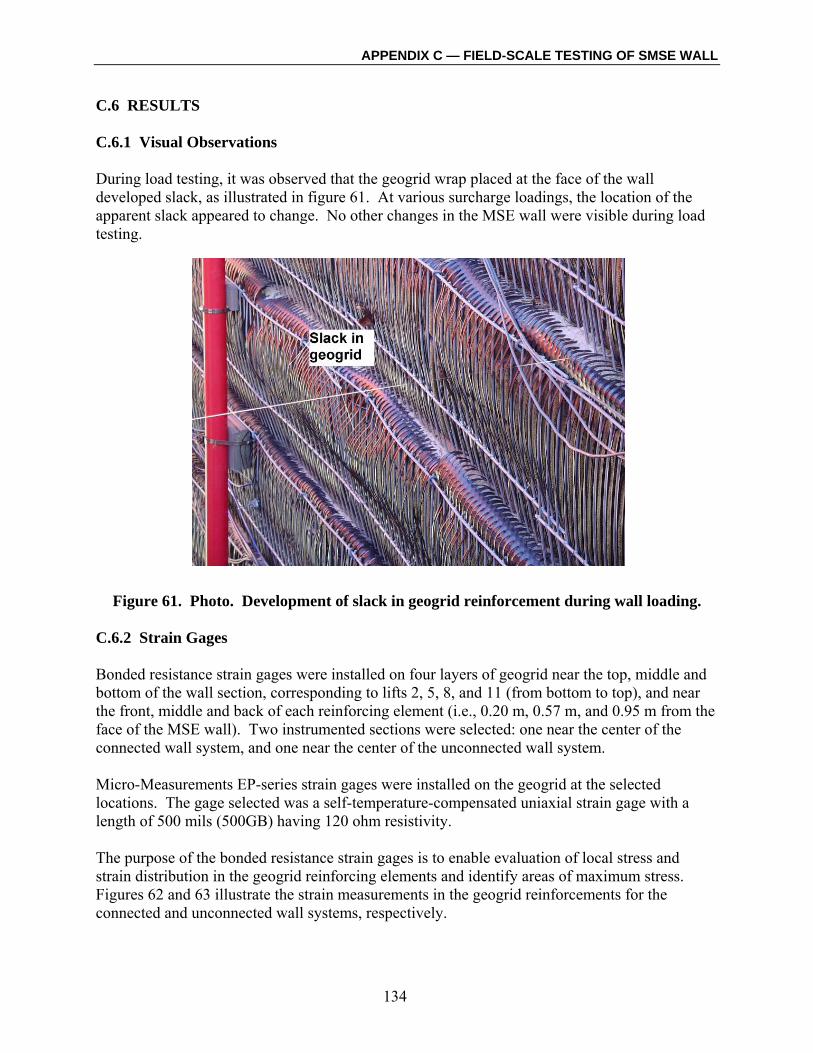
APPENDIX C — FIELD-SCALE TESTING OF SMSE WALL
134
C.6 RESULTS C.6.1 Visual Observations During load testing, it was observed that the geogrid wrap placed at the face of the wall developed slack, as illustrated in figure 61. At various surcharge loadings, the location of the apparent slack appeared to change. No other changes in the MSE wall were visible during load testing.
Figure 61. Photo. Development of slack in geogrid reinforcement during wall loading. C.6.2 Strain Gages Bonded resistance strain gages were installed on four layers of geogrid near the top, middle and bottom of the wall section, corresponding to lifts 2, 5, 8, and 11 (from bottom to top), and near the front, middle and back of each reinforcing element (i.e., 0.20 m, 0.57 m, and 0.95 m from the face of the MSE wall). Two instrumented sections were selected: one near the center of the connected wall system, and one near the center of the unconnected wall system. Micro-Measurements EP-series strain gages were installed on the geogrid at the selected locations. The gage selected was a self-temperature-compensated uniaxial strain gage with a length of 500 mils (500GB) having 120 ohm resistivity. The purpose of the bonded resistance strain gages is to enable evaluation of local stress and strain distribution in the geogrid reinforcing elements and identify areas of maximum stress. Figures 62 and 63 illustrate the strain measurements in the geogrid reinforcements for the connected and unconnected wall systems, respectively.

APPENDIX C — FIELD-SCALE TESTING OF SMSE WALL
135
0.0%
0.2%
0.4%
0.6%
0.8%
1.0%
0 0.2 0.4 0.6 0.8 1 1.2 1.4 1.6 1.8 2 2.2
0.0%
0.2%
0.4%
0.6%
0.8%
1.0%
0 0.2 0.4 0.6 0.8 1 1.2 1.4 1.6 1.8 2 2.2
0.0%
0.2%
0.4%
0.6%
0.8%
1.0%
0 0.2 0.4 0.6 0.8 1 1.2 1.4 1.6 1.8 2 2.2
0.0%
0.2%
0.4%
0.6%
0.8%
1.0%
0 0.2 0.4 0.6 0.8 1 1.2 1.4 1.6 1.8 2 2.2
Distance from wall face at base (m)
Stra
in (%
)
Lift 11
Lift 8
Lift 5
Lift 2
Load Footing
0 5
Stra
in (%
)
35 kPa
71 kPa
107 kPa
143 kPa
178 kPa
214 kPa
250 kPa
285 kPa
320 kPa
356 kPa
Rankine
Shoring wall
Legend:
Figure 62. Graph. Strain measurements in geogrid, connected wall system.

APPENDIX C — FIELD-SCALE TESTING OF SMSE WALL
136
0.0%
0.2%
0.4%
0.6%
0.8%
1.0%
0 0.2 0.4 0.6 0.8 1 1.2 1.4 1.6 1.8 2 2.2
0.0%
0.2%
0.4%
0.6%
0.8%
1.0%
0 0.2 0.4 0.6 0.8 1 1.2 1.4 1.6 1.8 2 2.2
0.0%
0.2%
0.4%
0.6%
0.8%
1.0%
0 0.2 0.4 0.6 0.8 1 1.2 1.4 1.6 1.8 2 2.2
0.0%
0.2%
0.4%
0.6%
0.8%
1.0%
0 0.2 0.4 0.6 0.8 1 1.2 1.4 1.6 1.8 2 2.2
Distance from wall face at base (m)
Stra
in (%
)
0 5
Stra
in (%
)
35 kPa
71 kPa
107 kPa
143 kPa
178 kPa
214 kPa
250 kPa
285 kPa
320 kPa
356 kPa
Rankine
Shoring wall
Legend:
Lift 11
Lift 8
Lift 5
Lift 2
Load Footing
Figure 63. Graph. Strain measurements in geogrid, unconnected wall system.
Strain gages were installed on geogrid reinforcements for lifts 2, 5, 8, and 11 as the wall was constructed. Figures 62 and 63 illustrate the location of the shoring wall interface in relation to the strain gage locations, as well as the location of the theoretical Rankine failure surface based on a soil friction angle of 40 degrees. Some of the strain gages failed during load testing, as illustrated by discontinuous strain measurements. The measured strain in the geogrid increased with increasing elevation of the retaining wall and with increasing surcharge load, as illustrated in figure 64, which suggests that the reinforcements are fully engaged. Little difference was noted between the measured strain in the connected versus the unconnected wall systems. Measured strain generally corresponded to less than 1 percent which is well within the serviceability limits of the geogrid. The measured strain in each geogrid layer generally increased with distance from the wall face. However, strain gages installed on the fifth lift in the connected wall system

APPENDIX C — FIELD-SCALE TESTING OF SMSE WALL
137
show the highest strain nearest to the wall face. Failure of one strain gage installed on lift five of the unconnected wall system prevented evaluation of a similar result. Peaks in the geogrid strain that might indicate a well developed shear zone were generally not detected. However, placement of the strain gages close to the MSE wall facing may not have allowed for the maximum geogrid strains to be captured.
0
50
100
150
200
250
300
350
400
0.0% 0.1% 0.2% 0.3% 0.4% 0.5% 0.6% 0.7% 0.8% 0.9% 1.0%
Average Strain (%)
Surc
harg
e Pr
essu
re (k
Pa)
Connected: Lift 2 Connected: Lift 5Connected: Lift 8 Connected: Lift 11Unconnected: Lift 2 Unconnected: Lift 5Unconnected: Lift 8 Unconnected: Lift 11
Figure 64. Graph. Average measured strain versus applied surcharge pressure.
C.6.3 Pressure Cells Horizontal and lateral vibrating wire earth pressure cells manufactured by Geokon were installed along each of the instrumented sections. Horizontal earth pressure cells were used to measure vertical stress as a function of overburden and applied load on the footing. Lateral earth pressure cells were used to measure lateral earth pressures at the back of the reinforced MSE mass. The earth pressure cells consist of two circular stainless steel plates welded together around their periphery and spaced apart by a narrow cavity filled with de-aired oil. Increases in the earth pressure squeeze the two plates together causing an increase in the fluid pressure inside the cell. The vibrating wire pressure transducer converts this pressure into an electric signal which is transmitted at a frequency via a cable to the readout location. The standard model 4800 earth pressure cell was used to measure vertical earth pressures. The model 4810 earth pressure cell, which is designed to measure contact pressures on the surface of concrete or steel structures, has a thicker back plate to minimize point loading effects and was used to measure lateral earth pressures adjacent to the shoring wall. The cells were mounted on the battered shoring wall, resulting in measured lateral pressures that include a small component of vertical pressure.

APPENDIX C — FIELD-SCALE TESTING OF SMSE WALL
138
Lateral Earth Pressure Cells Figure 65 compares the lateral earth pressure measurements for the connected and unconnected wall systems. The theoretical Rankine active earth pressures at zero surcharge and at the maximum surcharge loadings are plotted with the measured lateral earth pressures for comparison. The theoretical Rankine active lateral earth pressure (σh) was calculated as:
aah qKHK += γσ Equation C.1
where γ is the unit weight of soil, H is the wall height, Ka is the active earth pressure coefficient, and q is the surcharge loading. For the field-scale test wall, Ka was calculated as 0.22 assuming a soil friction angle of 40 degrees. The theoretical Rankine active earth pressure curve at the maximum surcharge plotted in figure 65 was reduced assuming 35 percent coverage of the load footing.
0
0.5
1
1.5
2
2.5
3
3.5
4
4.5
5
5.5
0 10 20 30 40 500
0.5
1
1.5
2
2.5
3
3.5
4
4.5
5
5.5
0 10 20 30 40 50
Connected Wall System Unconnected Wall System
Wal
l Hei
ght (
m)
Measured Lateral Earth Pressure (kPa)
Rankineactive earthpressures at
zero surcharge
Rankineactive earthpressure at
zero surcharge
Rankineactive earthpressure at
max. surcharge
0
0.5
1
1.5
2
2.5
3
3.5
4
4.5
5
5.5
0 20 40 60
0 kPa
35 kPa
71 kPa
107 kPa
143 kPa
214 kPa
250 kPa
285 kPa
320 kPa
356 kPa
Active Earth Pressure
Legend:
Rankineactive earthpressure at
max. surcharge
Failedpressure cell
Figure 65. Graph. Measured lateral earth pressures for the connected and unconnected wall systems.

APPENDIX C — FIELD-SCALE TESTING OF SMSE WALL
139
The measured lateral earth pressures generally increased with increasing surcharge load for both wall types. With the exception of the uppermost pressure cell for the connected wall system, the measured lateral earth pressures are generally less than the zero surcharge Rankine active earth pressures for both the connected and unconnected wall systems. The uppermost vertical pressure cell installed in the connected wall system recorded higher lateral earth pressures than all other cells. However, the measured lateral pressure remained considerably less than the estimated active earth pressures at representative surcharge loads. For the connected wall system, the measured lateral earth pressures for the lower three cells are nominally less and parallel to the estimated active earth pressure distribution at zero surcharge. For the unconnected wall system, the pressure cell located approximately 1.8 meters above the base of the wall appears to have failed prior to load testing with negligible pressures measured at loading increments of 35 kPa to 356 kPa. With the exception of this pressure cell, the measured lateral earth pressures at all surcharge loads in the unconnected wall system generally approximate the estimated Rankine active earth pressure distribution at zero surcharge. The measured lateral pressures prior to load testing (at zero surcharge) were approximately 50 to 60 percent of the theoretical Rankine active earth pressure for the unconnected wall system; at larger surcharges, this ratio becomes inconsistent and may be strain dependent. The measured lateral pressures for the connected wall system did not parallel the theoretical Rankine active earth pressure. Between the lateral pressure measurements for the two wall systems, the most significant difference occurs at the uppermost pressure cell. The lateral earth pressures at the uppermost pressure cell are relatively low for the unconnected wall system and significantly higher than the measurements at lower elevations for the connected wall system. Because the unconnected wall system was not tied to the shoring wall, the low lateral earth pressure measurements at the uppermost pressure cell may be due to development of a tension crack near the top of the wall. Conversely, the connected wall system which was tied to the shoring wall at each geogrid elevation exhibited considerably higher lateral pressures near the top of the wall. This appeared to be directly affected by the applied surcharge loading (i.e., increased lateral earth pressures with increased surcharge loading). The reduced lateral pressures measured at the top of the wall for the unconnected system increase the potential for tension crack development, further supporting extension of the upper MSE reinforcements over the shoring wall interface, as discussed in section 3.3.2. Horizontal Earth Pressure Cells Figure 66 compares the vertical pressure measurements for the connected and unconnected wall systems, measured using the horizontal earth pressure cells. As expected, the measured vertical pressures under loading exceed the calculated overburden surcharge pressure. The measured vertical pressure at no surcharge corresponds very well to the theoretical curve, confirming that calculation of overburden pressures using the unit weight of the soil multiplied by the wall height (γH) are appropriate for this wall. The shape of the measured vertical pressure distribution is approximately the same for the connected and unconnected wall systems.

APPENDIX C — FIELD-SCALE TESTING OF SMSE WALL
140
The theoretical pressure distributions for the 35 kPa (89 kN) and 356 kPa (890 kN) surcharge load increments were evaluated using the 2:1 pyramidal distribution method (per figure 18, chapter 5), plotted on figure 66. At relatively low surcharge pressures, similar to those that would be encountered in practice, the 2:1 method appears to provide a reasonable estimate of the vertical pressures at depth from applied surcharge loading. However, at high loads (i.e., 356 kPa), the 2:1 method appears to underpredict the vertical stress in the MSE wall.
012345
0 50100
150
200
250
300
0 kPa
35 kPa
71 kPa
107 kPa
143 kPa
214 kPa
250 kPa
285 kPa
320 kPa
356 kPa
Overburden pressure
Calculated total pressureat 35 kPa loadCalculated total pressureat 356 kPa
0.0
0.5
1.0
1.5
2.0
2.5
3.0
3.5
4.0
4.5
5.0
5.5
0 100 200 300
Connected Wall System
0.0
0.5
1.0
1.5
2.0
2.5
3.0
3.5
4.0
4.5
5.0
5.5
0 100 200 300
Unconnected Wall System
Legend:
Overburden pressureat zero surcharge
Overburden pressureat zero surcharge
γH + ∆σv at 35 kPa load
Measured Vertical Pressure (kPa)
Wal
l Hei
ght (
m)
γH + ∆σv at 356 kPa load
γH + ∆σv at 35 kPa load
γH + ∆σv at 356 kPa load
Figure 66. Graph. Measured vertical pressures for the connected and
unconnected wall systems. Figure 67 compares the measured vertical pressures versus the applied surcharge loading pressures. Due to the dimensions of the load footings, loads were applied to approximately 35 percent of the total top of wall area. As such, the measured vertical earth pressures are generally less than the applied vertical surcharge load, and generally on the order of 25 to 50 percent. In the upper half of the wall, a greater percentage of the applied load is observed (approximately 50 percent). In the lower two lifts of the wall, the measured load is approximately 25 percent of the applied load.

APPENDIX C — FIELD-SCALE TESTING OF SMSE WALL
141
At the base of the wall, the vertical pressures measured at pressure cell “A” nearest to the shoring wall were approximately 20 percent less than the vertical pressures measured at the adjacent “B” pressure cells, which were located nearer to the wall facing. This infers that the shoring wall in essence absorbed a portion of the vertical stress, which may be indicative of arching in the vicinity of the shoring wall near the base of the wall.
0
50
100
150
200
250
300
0 50 100 150 200 250 300 350 400
Applied Vertical Pressure, PVA (kPa)
Mea
sure
d Ve
rtic
al P
ress
ure,
PVM
(kPa
)
Connected - Lift 1, Cell BConnected - Lift 1, Cell AUnconnected - Lift 1, Cell BUnconnected - Lift 1, Cell AConnected - Lift 2Unconnected - Lift 2Connected - Lift 5Unconnected - Lift 5Connected - Lift 8Unconnected - Lift 8Connected - Lift 11Unconnected - Lift 11Measured=AppliedMeasured=50% of AppliedMeasured=25% of Applied
PVM = 0.25PVA
PVM = 0.50PVA
PVM = PVA
LEGEND
Figure 67. Graph. Measured versus applied vertical pressures excluding overburden.
The measured lateral earth pressures at each loading increment were divided by the measured vertical earth pressures to estimate the horizontal force coefficient, K, presented in figure 68. Recall that the vertical earth pressure cells were placed adjacent to the shoring wall, resulting in “lateral” earth pressure measurements that include a small degree of vertical pressures. The horizontal force coefficient ranged from less than 0.1 to about 0.4, with a calculated active earth pressure coefficient, Ka, of approximately 0.22. For use of geosynthetic reinforcements, Lawson and Lee concluded that K is less than Ka for aspect ratios less than 0.5.(5) This appears to generally be the case for the field-scale test wall which was constructed with an aspect ratio varying from 0.25 at the base to 0.39 at the top of the wall.

APPENDIX C — FIELD-SCALE TESTING OF SMSE WALL
142
0.0
0.5
1.0
1.5
2.0
2.5
3.0
3.5
4.0
4.5
5.0
0.0 0.1 0.2 0.3 0.4 0.50.0
0.5
1.0
1.5
2.0
2.5
3.0
3.5
4.0
4.5
5.0
0.0 0.1 0.2 0.3 0.4 0.5
0.000 0.500
0 kPa
35 kPa
71 kPa
107 kPa
143 kPa
214 kPa
250 kPa
285 kPa
320 kPa
356 kPa
Connected Unconnected
Horizontal Force Coefficient, K
Legend:
Wal
l Hei
ght (
m)
Failed verticalpressure cell
Figure 68. Graph. Calculated lateral earth pressure coefficient.
C.6.4 Inclinometer Measurements A total of four inclinometers were installed as part of the instrumentation program. Two of the inclinometers were installed to measure horizontal deflection of the MSE wall face, and two were installed to monitor horizontal deflection of the shoring wall, if any. The inclinometers were measured by TFHRC assuming the top of each inclinometer casing as a fixed point. Figure 69 presents the measured cumulative displacement of the inclinometers installed at the face of the MSE wall for the connected and unconnected wall systems. The measured cumulative displacements of the connected and unconnected portions of the MSE wall were similar, indicating a maximum horizontal displacement with respect to the top of the wall on the order of 8 mm outward.

APPENDIX C — FIELD-SCALE TESTING OF SMSE WALL
143
0
0.5
1
1.5
2
2.5
3
3.5
4
4.5
5
5.5
-10 -5 0 5 10
Post-Test (unloaded)
35 kPa
71 kPa
107 kPa
143 kPa
178 kPa
214 kPa
250 kPa
285 kPa
320 kPa
356 kPa
0
0.5
1
1.5
2
2.5
3
3.5
4
4.5
5
5.5
-10 -5 0 5 100
0.5
1
1.5
2
2.5
3
3.5
4
4.5
5
5.5
-10 -5 0 5 10
Legend:
Wal
l Hei
ght (
m)
Cumulative Displacement (mm)
Connected Wall System Unconnected Wall System
MSEWall
OpenPit
MSEWall
OpenPit
Figure 69. Graph. Measured cumulative displacement of MSE wall face.
Figure 70 presents the measured cumulative displacement of the shoring wall face. As demonstrated by the inclinometer measurements, the shoring wall exhibited negligible deflection, except perhaps a few millimeters of movement, increasing towards the bottom. Note that the measurement at 320 kPa for the connected wall section appears to be erroneous.

APPENDIX C — FIELD-SCALE TESTING OF SMSE WALL
144
0
0.5
1
1.5
2
2.5
3
3.5
4
4.5
5
5.5
-10 -5 0 5 10
Post-Test (unloaded)
35 kPa
71 kPa
107 kPa
143 kPa
178 kPa
214 kPa
250 kPa
285 kPa
320 kPa
356 kPa
Legend:
Wal
l Hei
ght (
m)
Cumulative Displacement (mm)
Connected Wall System Unconnected Wall System
0
0.5
1
1.5
2
2.5
3
3.5
4
4.5
5
5.5
-10 -5 0 5 100
0.5
1
1.5
2
2.5
3
3.5
4
4.5
5
5.5
-10 -5 0 5 10
MSEWall
ShoringWall
MSEWall
ShoringWall
Figure 70. Graph. Measured cumulative displacement of shoring wall. C.6.5 Survey Measurements Vertical and horizontal deflections of the load footing were measured using total station, level, and linear variable displacement transducers (LVDT). The total station enabled measurements of both vertical settlement and horizontal displacements, illustrated in figures 71 and 72, respectively. Connection of the shoring wall to the MSE wall did not appear to have a significant impact on footing settlement, with the measured maximum vertical settlement of the load footings for both the connected and unconnected systems on the order of 16 mm. Measured horizontal displacement of the load footings ranged from 4 to 9 mm for the connected wall system, and from 8 to 13 mm for the unconnected wall system. Because the measured horizontal displacement of the unconnected wall was greater than that of the connected wall, extension of the upper MSE reinforcements beyond the limits of the shoring wall is further recommended to decrease deformation for an unconnected wall, as discussed in section 3.3.2. The maximum

APPENDIX C — FIELD-SCALE TESTING OF SMSE WALL
145
horizontal displacement of the load footing for the connected wall system was measured for the portion of the footing closest to the unconnected wall section, with larger horizontal displacements measured for the unconnected wall section. Settlement measurements obtained from the total station were compared to settlement measurements obtained using the level, illustrated in figure 73. The level measurements compared well with the total station data, verifying the total station data.
Wall Face
2 4Footing
1 3
-20
-15
-10
-5
00 50 100 150 200 250 300 350 400
-20
-15
-10
-5
00 50 100 150 200 250 300 350 400
Settl
emen
t (m
m)
Connected Wall System
Unconnected Wall System
Vertical Stress (kPa)
0
5
10
15
20
0 500
1
2
3
4
AverageSettlement
Legend:
Figure 71. Graph. Measured settlement of load footings using total station.

APPENDIX C — FIELD-SCALE TESTING OF SMSE WALL
146
2 4Footing
1 3
Wall Face
0
50
100
150
200
250
300
350
400
0 5 10 15
Connected Wall System
0
50
100
150
200
250
300
350
400
0 5 10 15
Unconnected Wall SystemVe
rtic
al S
tres
s (k
Pa)
Horizontal Displacement (mm)
-50.0
0.0
50.0
100.0
150.0
200.0
250.0
-200 0 200 400
1
2
3
4
AverageDisplacement
Legend:
Figure 72. Graph. Measured horizontal displacement of load footings using total station.
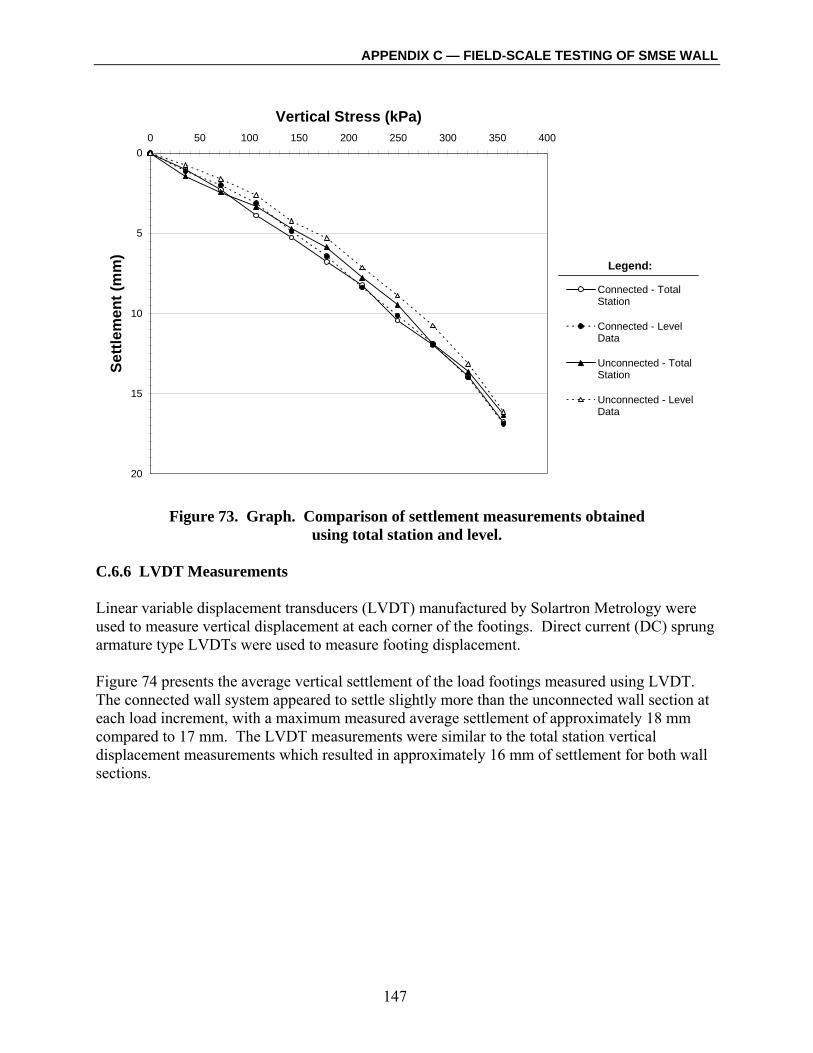
APPENDIX C — FIELD-SCALE TESTING OF SMSE WALL
147
0
5
10
15
20
0 50 100 150 200 250 300 350 400
Vertical Stress (kPa)Se
ttlem
ent (
mm
)
Connected - TotalStation
Connected - LevelData
Unconnected - TotalStation
Unconnected - LevelData
Legend:
Figure 73. Graph. Comparison of settlement measurements obtained
using total station and level.
C.6.6 LVDT Measurements Linear variable displacement transducers (LVDT) manufactured by Solartron Metrology were used to measure vertical displacement at each corner of the footings. Direct current (DC) sprung armature type LVDTs were used to measure footing displacement. Figure 74 presents the average vertical settlement of the load footings measured using LVDT. The connected wall system appeared to settle slightly more than the unconnected wall section at each load increment, with a maximum measured average settlement of approximately 18 mm compared to 17 mm. The LVDT measurements were similar to the total station vertical displacement measurements which resulted in approximately 16 mm of settlement for both wall sections.

APPENDIX C — FIELD-SCALE TESTING OF SMSE WALL
148
0
2
4
6
8
10
12
14
16
18
20
0 50 100 150 200 250 300 350 400
Applied Pressure (kPa)A
vera
ge V
ertic
al S
ettle
men
t (m
m)
Connected Section
Unconnected Section
Legend:
Figure 74. Graph. Average vertical settlement of load footings measured using LVDT.
C.6.7 Potentiometer Measurements Lateral displacement of the MSE wall face was measured using potentiometers. The potentiometers were firmly mounted on H-type steel beams using C-clamps. The extended stainless steel cable was connected and bolted onto the face of the wire basket near the center-height of the facing element. Potentiometers were installed at five levels near the top, middle and bottom of each wall section, corresponding to lifts 2, 5, 8, 11, and 12 (from bottom to top). Two instrumented sections were selected: one near the center of the connected wall system, and one near the center of the unconnected wall system. The purpose of the potentiometers was to measure lateral deformation of the MSE wall. Figure 75 illustrates the potentiometer measurements for the connected and unconnected wall systems. Data is not shown for potentiometers located on lifts 11 and 12 for the connected wall system and lifts 2, 5, 8, and 12 for the unconnected wall system as these instruments produced erratic data. Measured lateral displacement of the MSE wall face ranged from less than 1 mm near the base of the wall to 18 mm near the center of the wall for the connected wall system. Only one potentiometer on the unconnected wall system produced reasonable results, indicating about 10 mm of lateral displacement near the top of the wall.
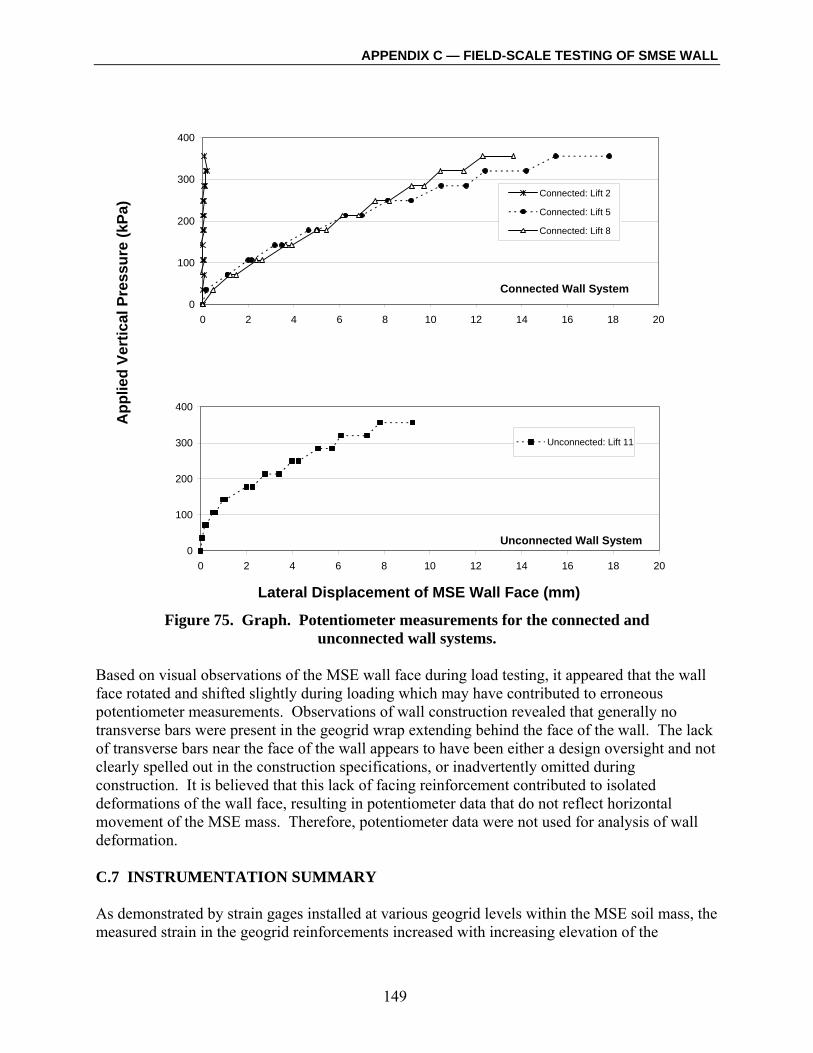
APPENDIX C — FIELD-SCALE TESTING OF SMSE WALL
149
0
100
200
300
400
0 2 4 6 8 10 12 14 16 18 20
Connected: Lift 2
Connected: Lift 5
Connected: Lift 8
0
100
200
300
400
0 2 4 6 8 10 12 14 16 18 20
Unconnected: Lift 11
App
lied
Vert
ical
Pre
ssur
e (k
Pa)
Connected Wall System
Unconnected Wall System
Lateral Displacement of MSE Wall Face (mm)
Figure 75. Graph. Potentiometer measurements for the connected and unconnected wall systems.
Based on visual observations of the MSE wall face during load testing, it appeared that the wall face rotated and shifted slightly during loading which may have contributed to erroneous potentiometer measurements. Observations of wall construction revealed that generally no transverse bars were present in the geogrid wrap extending behind the face of the wall. The lack of transverse bars near the face of the wall appears to have been either a design oversight and not clearly spelled out in the construction specifications, or inadvertently omitted during construction. It is believed that this lack of facing reinforcement contributed to isolated deformations of the wall face, resulting in potentiometer data that do not reflect horizontal movement of the MSE mass. Therefore, potentiometer data were not used for analysis of wall deformation. C.7 INSTRUMENTATION SUMMARY As demonstrated by strain gages installed at various geogrid levels within the MSE soil mass, the measured strain in the geogrid reinforcements increased with increasing elevation of the
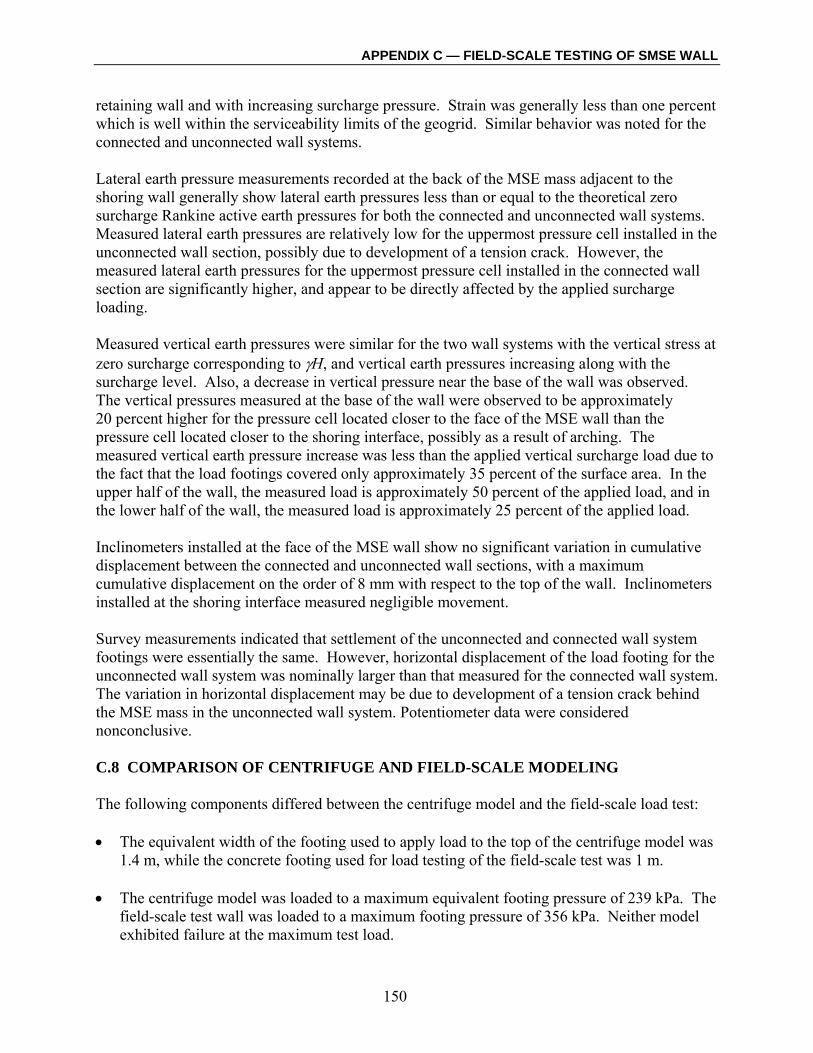
APPENDIX C — FIELD-SCALE TESTING OF SMSE WALL
150
retaining wall and with increasing surcharge pressure. Strain was generally less than one percent which is well within the serviceability limits of the geogrid. Similar behavior was noted for the connected and unconnected wall systems. Lateral earth pressure measurements recorded at the back of the MSE mass adjacent to the shoring wall generally show lateral earth pressures less than or equal to the theoretical zero surcharge Rankine active earth pressures for both the connected and unconnected wall systems. Measured lateral earth pressures are relatively low for the uppermost pressure cell installed in the unconnected wall section, possibly due to development of a tension crack. However, the measured lateral earth pressures for the uppermost pressure cell installed in the connected wall section are significantly higher, and appear to be directly affected by the applied surcharge loading. Measured vertical earth pressures were similar for the two wall systems with the vertical stress at zero surcharge corresponding to γH, and vertical earth pressures increasing along with the surcharge level. Also, a decrease in vertical pressure near the base of the wall was observed. The vertical pressures measured at the base of the wall were observed to be approximately 20 percent higher for the pressure cell located closer to the face of the MSE wall than the pressure cell located closer to the shoring interface, possibly as a result of arching. The measured vertical earth pressure increase was less than the applied vertical surcharge load due to the fact that the load footings covered only approximately 35 percent of the surface area. In the upper half of the wall, the measured load is approximately 50 percent of the applied load, and in the lower half of the wall, the measured load is approximately 25 percent of the applied load. Inclinometers installed at the face of the MSE wall show no significant variation in cumulative displacement between the connected and unconnected wall sections, with a maximum cumulative displacement on the order of 8 mm with respect to the top of the wall. Inclinometers installed at the shoring interface measured negligible movement. Survey measurements indicated that settlement of the unconnected and connected wall system footings were essentially the same. However, horizontal displacement of the load footing for the unconnected wall system was nominally larger than that measured for the connected wall system. The variation in horizontal displacement may be due to development of a tension crack behind the MSE mass in the unconnected wall system. Potentiometer data were considered nonconclusive. C.8 COMPARISON OF CENTRIFUGE AND FIELD-SCALE MODELING The following components differed between the centrifuge model and the field-scale load test: • The equivalent width of the footing used to apply load to the top of the centrifuge model was
1.4 m, while the concrete footing used for load testing of the field-scale test was 1 m. • The centrifuge model was loaded to a maximum equivalent footing pressure of 239 kPa. The
field-scale test wall was loaded to a maximum footing pressure of 356 kPa. Neither model exhibited failure at the maximum test load.

APPENDIX C — FIELD-SCALE TESTING OF SMSE WALL
151
• The centrifuge prototype was modeled for the wall section without mechanical connection to
the shoring wall (i.e., unconnected system). • Reinforcing elements installed in the centrifuge prototype had a tensile strength of 18 kN/m,
which is approximately 35 percent of the tensile strength of the geogrid used to construct the field-scale test wall (i.e., 52 kN/m).
• Two additional reinforcement layers were installed near the top of the field-scale test wall to
prevent bearing capacity failure of the footing at the surface. The centrifuge test wall did not have the additional reinforcing layers and appeared to fail in bearing capacity directly beneath the load footing.
After the centrifuge model was loaded to 239 kPa without failure, the acceleration level was increased until failure occurred. The centrifuge model prototype proceeded to fail at an acceleration of 32g, which is equivalent to a prototype height of 11.0 m. At this increased acceleration level, the reinforcement vertical spacing corresponded to approximately 0.9 m. The field-scale test wall was constructed to a maximum height of approximately 5.5 m with a reinforcement vertical spacing of approximately 0.46 m. Bonded resistance strain gages were installed in the field-scale test model to enable evaluation of local stress and strain distribution in the geogrid reinforcing elements and identify areas of maximum stress. Strain gages were installed on four layers of geogrid in the field-scale test wall near the top, middle and bottom of the wall section, corresponding to lifts 2, 5, 8, and 11 (from bottom to top), and near the front, middle and back of each reinforcing element (i.e., 0.20 m, 0.57 m, and 0.95 m from the face of the MSE wall). Figure 63 presented the strain measurements obtained from gages installed in the unconnected wall system, illustrating also the location of the shoring wall interface in relation to the strain gage locations as well as the location of the theoretical Rankine failure surface based on a soil friction angle of 40 degrees. Some of the strain gages failed during load testing, as illustrated by discontinuous strain measurements, as shown on figure 63. However, one strain gage failed prior to load testing and produced no data. The locations of strain gages installed in the field-scale test model were compared to digital imaging locations of torn reinforcement from the failed centrifuge model, as illustrated in figure 76. The location of the theoretical active failure wedge is illustrated based on an estimated soil friction angle of 40 degrees. Failure of the centrifuge model appears to have occurred relatively close to the active failure wedge for the lower half of the wall. In the upper half of the wall, an opposing active failure wedge appears to have developed as a result of bearing capacity failure of the soil beneath the load footing. Based on the results of the centrifuge testing, the strain gages were generally located within the expected zone of highest strain on the geogrid. Results from the instrumented layers of geogrid from the field-scale test are compared to the centrifuge test results, as follows:

APPENDIX C — FIELD-SCALE TESTING OF SMSE WALL
152
• Lift 11 – Based on centrifuge testing, the maximum strain was expected for the central strain gage. However, the maximum measured strain occurred for the strain gage located nearest the shoring wall.
• Lift 8 – Based on centrifuge testing, the maximum strain was expected for the strain gage
located nearest the shoring wall. However, the central strain gage appears to correspond to the peak strain. Failure of this strain gage during load testing may further indicate that this gage exhibited the maximum strain.
• Lift 5 – Based on the results of centrifuge testing, the expected maximum strain would
correspond to the location of the strain gage closest to the shoring wall. This particular strain gage failed prior to load testing.
• Lift 2 – The maximum strain measured during field testing was for the strain gage located
closest to the shoring wall. Centrifuge testing generally produced failure through the wall face at a corresponding elevation.
0
0.5
1
1.5
2
2.5
3
3.5
4
4.5
5
5.5
6
-0.5 0 0.5 1 1.5 2 2.5 3
Distance (m)
Wal
l Hei
ght (
m)
Shoring wall
MSE wall face
Strain gage locations
Tear locations fromcentrifuge
Theoretical activeRankine failure wedge
Failed strain gage
Legend:
N t
Location offailed strain
gage
Lift 11
Lift 8
Lift 5
Lift 2
Figure 76. Graph. Comparison of centrifuge reinforcement tears to
field-scale test wall strain gage locations.

APPENDIX C — FIELD-SCALE TESTING OF SMSE WALL
153
Trend lines were drawn through the reinforcement tears developed during centrifuge testing and compared to the theoretical active failure wedge based on a soil friction angle of 40 degrees, illustrated in figure 77.
0
0.5
1
1.5
2
2.5
3
3.5
4
4.5
5
5.5
6
-0.5 0 0.5 1 1.5 2 2.5
Distance (m)
Wal
l Hei
ght (
m)
Legend:
61o
14o
76o
0
0.5
1
1.5
2
2.5
3
3.5
4
4.5
5
5.5
6
-1 -0.5 0 0.5 1 1.5 2 2.5
Distance (m)
Wal
l Hei
ght (
m)
Shoring wall
MSE wall face
Strain gage locations
Centrifuge tearlocations
Theoretical activeRankine failure wedge
Approximate tear line
Centrifuge footing
Field test footing
Failed strain gage
Figure 77. Graph. Comparison of theoretical active failure wedge to
actual failure geometry. The lower portion of the centrifuge test wall exhibited failure which approximately paralleled the active failure wedge theory, failing with a base angle of 61 degrees as compared to the theoretical base angle of 65 degrees. The centrifuge model did not appear to fail out the toe point, but instead nominally back into the MSE wall reinforced zone. The upper portion of the

APPENDIX C — FIELD-SCALE TESTING OF SMSE WALL
154
centrifuge model exhibited a wedge failure at an approximately twice as steep of angle (14 degrees as compared to 29 degrees) than a corresponding active failure wedge. The locations of the load footings for centrifuge and field-scale testing are shown on figure 77. The failure surface for the upper portion of the wall obtained from centrifuge testing approximates the active failure wedge from bearing capacity theory. The angle of the active bearing capacity failure surface measured from horizontal is generally assumed to be equal to the soil friction angle.(63) However, the failure surface is inclined at approximately 76 degrees to horizontal compared to an estimated soil friction angle of 40 degrees. This may be attributed to the increased frictional resistance of the soil due to installation of MSE reinforcing elements. C.9 FACTOR OF SAFETY CALCULATION The factor of safety of the field-scale test wall with regard to internal stability was calculated under the maximum test pressure of 356 kPa using the design procedure outlined in section 5.3 (chapter 5). The calculations are presented in this section. C.9.1 Internal Stability Calculation This section presents a check on the internal stability design of the unconnected portion of the test wall at the maximum footing load of 890 kN (356 kPa). Step 1 - Identify MSE wall type, geometry, and loading conditions. The details of the wall design and loading conditions are summarized as follows: • Because the test wall was constructed for research purposes only, no embedment was
constructed at the toe of the test wall. Therefore, the design height, Hd, of 5.5 m is equivalent to the overall height.
• MSE facing elements consisted of Tensar® welded wire facing units having a unit height of
approximately 0.46 m. Given the facing unit size, a vertical spacing of 0.46 m was used, allowing for one reinforcement per facing unit.
• The MSE wall was constructed with a facing batter of 1H:24V and the shoring wall with a
batter of 1H:6V. • MSE reinforcements ranged in length, increasing from 1.4 m at the base to approximately
2.1 m near the top of the wall. • MSE reinforcements consisted of Tensar® UX1500MSE geogrid with a reported allowable
tensile strength of 52 kN/m at 5 percent strain, and an ultimate tensile strength of 114 kN/m. Geogrids were installed with 100 percent coverage.
• Because the test load was concentrated and applied to a footing, the test load is considered a
concentrated vertical load as opposed to a surcharge load. The vertical stress at each
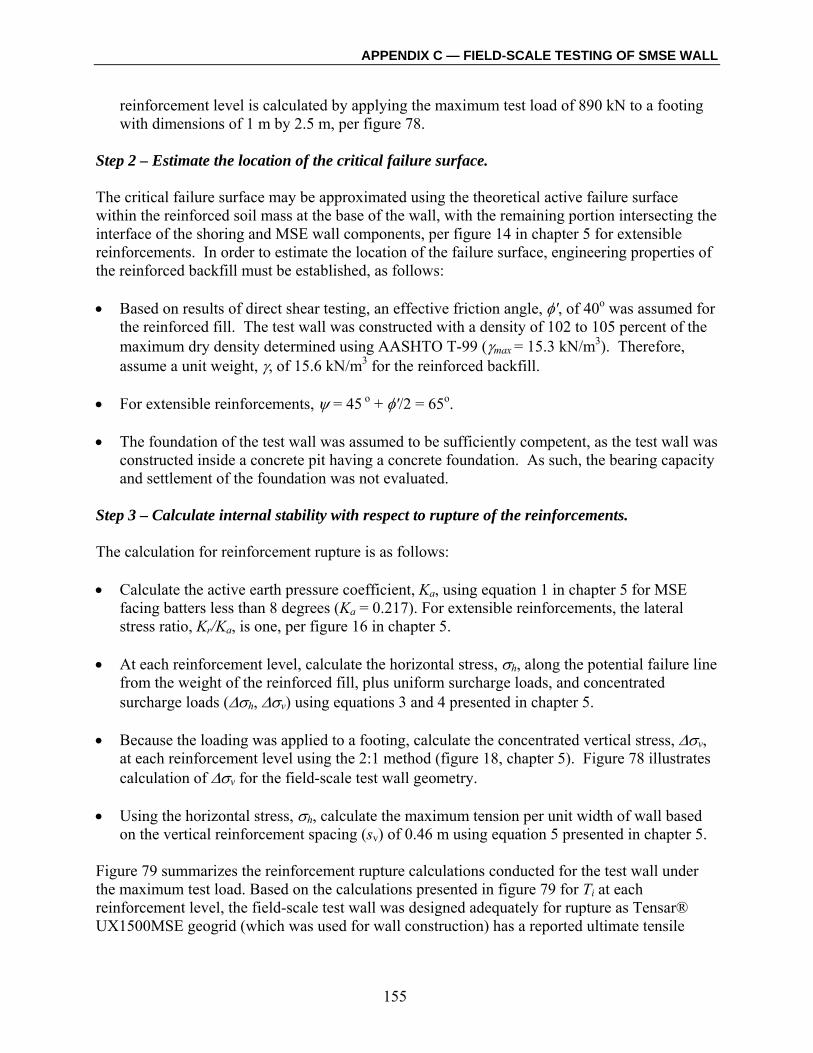
APPENDIX C — FIELD-SCALE TESTING OF SMSE WALL
155
reinforcement level is calculated by applying the maximum test load of 890 kN to a footing with dimensions of 1 m by 2.5 m, per figure 78.
Step 2 – Estimate the location of the critical failure surface. The critical failure surface may be approximated using the theoretical active failure surface within the reinforced soil mass at the base of the wall, with the remaining portion intersecting the interface of the shoring and MSE wall components, per figure 14 in chapter 5 for extensible reinforcements. In order to estimate the location of the failure surface, engineering properties of the reinforced backfill must be established, as follows: • Based on results of direct shear testing, an effective friction angle, φ', of 40o was assumed for
the reinforced fill. The test wall was constructed with a density of 102 to 105 percent of the maximum dry density determined using AASHTO T-99 (γmax = 15.3 kN/m3). Therefore, assume a unit weight, γ, of 15.6 kN/m3 for the reinforced backfill.
• For extensible reinforcements, ψ = 45 o + φ'/2 = 65o. • The foundation of the test wall was assumed to be sufficiently competent, as the test wall was
constructed inside a concrete pit having a concrete foundation. As such, the bearing capacity and settlement of the foundation was not evaluated.
Step 3 – Calculate internal stability with respect to rupture of the reinforcements. The calculation for reinforcement rupture is as follows: • Calculate the active earth pressure coefficient, Ka, using equation 1 in chapter 5 for MSE
facing batters less than 8 degrees (Ka = 0.217). For extensible reinforcements, the lateral stress ratio, Kr/Ka, is one, per figure 16 in chapter 5.
• At each reinforcement level, calculate the horizontal stress, σh, along the potential failure line
from the weight of the reinforced fill, plus uniform surcharge loads, and concentrated surcharge loads (∆σh, ∆σv) using equations 3 and 4 presented in chapter 5.
• Because the loading was applied to a footing, calculate the concentrated vertical stress, ∆σv,
at each reinforcement level using the 2:1 method (figure 18, chapter 5). Figure 78 illustrates calculation of ∆σv for the field-scale test wall geometry.
• Using the horizontal stress, σh, calculate the maximum tension per unit width of wall based
on the vertical reinforcement spacing (sv) of 0.46 m using equation 5 presented in chapter 5. Figure 79 summarizes the reinforcement rupture calculations conducted for the test wall under the maximum test load. Based on the calculations presented in figure 79 for Ti at each reinforcement level, the field-scale test wall was designed adequately for rupture as Tensar® UX1500MSE geogrid (which was used for wall construction) has a reported ultimate tensile

APPENDIX C — FIELD-SCALE TESTING OF SMSE WALL
156
strength of 114 kN/m, which was higher than the calculated maximum tension of approximately 22 kN/m.
CALCULATION OF VERTICAL STRESS DUE TO FOOTING:
Loading parameters: Input FieldsLoad, Fv: 890 kN Calculated FieldsFooting length, w: 2.5 mFooting width, bf: 1 m
Calculated based on wall geometries:z2: 0.63 mz3: 1.24 mx: 0.92 m
Footing load type: Isolated
For the field-scale test wall, the shoring wall was battered at 1H:6V and the MSE face at 1H:24V. Lengths, L, calculated manually.
Layer z1 (m) L (m) D1 (m) ∆σv (kPa)1 5.50 1.40 1.40 79.52 5.04 1.46 1.46 80.83 4.58 1.52 1.52 82.74 4.12 1.57 1.57 85.65 3.66 1.63 1.63 88.66 3.20 1.69 1.69 92.47 2.74 1.75 1.75 97.18 2.28 1.80 1.80 103.49 1.82 1.86 1.86 110.8
10 1.36 1.92 1.92 120.111 0.90 1.98 1.87 140.012 0.44 2.03 1.44 210.2
CONCENTRATED VERTICAL LOAD CALCULATION
Field-scale test wall:
Calculation modified from Elias et al. (2)
for SMSE walls.
z1
FV
x
bf
Footingw x bf
BatteredShoring Wall
D1
Lvaries
2 21 1
z2
z3D1
D1
For strip load:
For isolated footing load:
For point load (bf = 0):
11 zbD f +=:For 21 zz ≤
:For 213 zzz >>
xzb
D f ++
=2
11
:For 31 zz ≥
LD =1
1DFv
v =∆σ
)( 11 zwDFv
v +=∆σ
21D
Fvv =∆σ
Figure 78. Calculation. Calculation of vertical stress due to footing load for test wall.

APPENDIX C — FIELD-SCALE TESTING OF SMSE WALL
157
LATERAL STRESS RATIO:
Input FieldsWall height (m): 5.5 Calculated FieldsEmbedment depth (m): 0Soil unit weight (kN/m3): 15.6Wall batter (degrees): 2.39 (measured from vertical)Inclination of facing (degrees): 92.39 (measured from horizontal in front of wall)Friction angle (degrees): 40
Spacing (sv)1 (m): 0.46
Coverage Ratio (Rc): 1Reinforcement type: Geosynthetic
Conc. vert. load, Fv (kN): 0Conc. horiz. load, Fh (kN): 0Uniform surcharge, q (kPa): 0
Ka = 0.217
Layer (Bottom-upward): z (m) Kr/Ka
2 Kr
∆σv3
(kPa)
σv at reinforcement
level (kPa)∆σh
4
(kPa)
σh at reinforcement
level (kPa)
Τi at reinforcement level (kN/m)
1 5.5 1.00 0.217 79.5 165.3 0.0 35.9 16.52 5.04 1.00 0.217 80.8 159.5 0.0 34.7 16.03 4.58 1.00 0.217 82.7 154.1 0.0 33.5 15.44 4.12 1.00 0.217 85.6 149.9 0.0 32.6 15.05 3.66 1.00 0.217 88.6 145.7 0.0 31.7 14.66 3.2 1.00 0.217 92.4 142.3 0.0 30.9 14.27 2.74 1.00 0.217 97.1 139.8 0.0 30.4 14.08 2.28 1.00 0.217 103.4 139.0 0.0 30.2 13.99 1.82 1.00 0.217 110.8 139.2 0.0 30.3 13.9
10 1.36 1.00 0.217 120.1 141.3 0.0 30.7 14.111 0.9 1.00 0.217 140.0 154.0 0.0 33.5 15.412 0.44 1.00 0.217 210.2 217.1 0.0 47.2 21.7
Notes:1. Vertical reinforcement spacing to be consistent with selection of wall facing.2. Ratio to be input based on type of reinforcement selected and use of figure above.3. Calculate the increment of vertical stress due to concentrated loads at the surface using the 2:1 method at each reinforcement layer.4. Calculate the increment of horizontal stress (if any) due to concentrated loads at the surface.5. Allowable tensile strength of reinforcement obtained from manufacturer specifications.
Earth Pressure Calculations:
REINFORCEMENT RUPTURE CALCULATION
Wall Parameters:
Reinforcement Input Parameters:
Loading Input Parameters:
Field-scale test wall:
Dep
th B
elow
Top
of W
all,
z
00
6 m
1.0 1.2 1.7 2.5
1.0 1.2
Geosynthetics1
Metal Strips
Welded Wire GridsMetal Bar Mats &
Notes:1. Does not include polymer strip reinforcement.
Kr / Ka
Calculation identical to Elias et al. (2)
Figure 79. Calculation. Reinforcement rupture calculation for test wall.

APPENDIX C — FIELD-SCALE TESTING OF SMSE WALL
158
Step 4 – Calculate the pullout force. Calculate the pullout force, Tmax, for MSE reinforcements in the resistant zone, as follows: • The interior angle of the failure wedge: β = 90 – ψ = 25o. • Concentrated vertical load: FV = 890 kN. • No concentrated horizontal loads: FH = 0 kN. • Maximum surcharge loading: q = 0 kPa. • For purposes of the calculation, assume the maximum MSE reinforcement length of 2.14 m. • Calculate the pullout force per unit width of wall, Tmax, using equation 14 in chapter 5.
The pullout force calculation is presented in figure 80. The pullout force was calculated as approximately 465 kN/m. Step 5 – Check the pullout resistance of MSE reinforcements in the resistant zone. Calculate the pullout resistance of the MSE reinforcements, and compare it to the required pullout capacity, Tmax, calculated in step 4: • Based on the reinforcement spacing, calculate the length of embedment of each
reinforcement layer within the resistant zone per equation 18 in chapter 5. The embedment lengths are presented in figure 81.
• At each reinforcement layer within the resistant zone, calculate the pullout resistance, FPO,
according to equation 19 in chapter 5.
o Because this calculation is conducted to calculate the factor of safety of the wall, use a factor of safety against pullout (FSp) of one.
o Assume 'tan8.0* φ=F for geogrid reinforcement in granular soil (F* = 0.67).
o Reinforcement effective unit perimeter, C = 2.
o Scale effect correction factor, α, to account for a nonlinear stress reduction over the
embedded length of highly extensible reinforcements. Use 0.8 for geogrids.
o Coverage ratio, Rc = 1.
o The vertical stress, σv, is equivalent to γΗ.

APPENDIX C — FIELD-SCALE TESTING OF SMSE WALL
159
Equations:
Field-scale test wall:
FAILURE SURFACE APPROXIMATION: FREE-BODY DIAGRAM:
ASSUMPTIONS:
Wall height, H (m): 5.5 Input FieldsWall length at top, LT (m): 2.1 Calculated FieldsWall length at base, LB (m): 1.4Shoring wall batter, 1H:?V: 6Length of truncated wedge, L (m): 2.1Soil unit weight (kN/m3): 15.6Friction angle (degrees): 40
LOADING:Conc. vert. load, Fv (kN/m): 890Conc. horiz. load, FH (kN/m): 0Surcharge, q (kPa): 0
CALCULATIONS:
β (degrees) = 25.0Tmax(kN/m): 464.9
REQUIRED PULLOUT CAPACITY OF REINFORCEMENTS IN RESISTANT ZONE
( ) H
V
FFqLHL
T ++
+⎟⎟⎠
⎞⎜⎜⎝
⎛+⎟⎟
⎠
⎞⎜⎜⎝
⎛−
=βφ
βγ
'max tantan2
Calculation unique to SMSE walls.
W
Tmax
ψ1N1
S1
β
N2
S2
H
qL
(Distributedsurcharge load)
FV
FH
TruncatedFailureWedge
Figure 80. Calculation. Calculation of required pullout capacity for test wall.

APPENDIX C — FIELD-SCALE TESTING OF SMSE WALL
160
Field-scale test wall:
FAILURE SURFACE APPROXIMATION:
Wall Parameters: Input FieldsWall height (m): 5.5 Calculated FieldsEmbedment depth (m): 0Min. reinf. length, L (m): 1.4Shoring wall batter (1H:?V): 6MSE wall batter (1H:?V) 24
Soil Parameters:Soil unit weight (kN/m3): 15.6Friction angle (degrees): 40ψ (degrees): 65
Reinforcement Input Parameters:Calculation type (FS/Design): FSAllowable strength (kN/m): 52 Tensar UX1500MSEUltimate strength (kN/m): 114 Tensar UX1500MSESpacing (s)1 (m): 0.46Reinforcement type: 1 Type 1 = geogrid; Type 2 = geotextileScale effect factor, α: 0.8Effective unit perimeter,C: 2 Taken as 2 for strips, grids, and sheets.Pullout resistance factor,F*: 0.67Factor of safety, FSp: 1.0Coverage ratio, Rc: 1 Taken as 1 for full coverage. Calculate for strips, etc.
Layer (Bottom-upward): z (m) L (m) Lf (m) Lei1 (m) Total σv (kPa) FPO (kN)
1 5.5 1.40 0.00 1.40 85.8 114.02 5.04 1.46 0.20 1.26 78.6 106.83 4.58 1.52 0.39 1.13 71.4 86.74 4.12 1.57 0.59 0.98 64.3 67.95 3.66 1.63 0.78 0.85 57.1 52.06 3.2 1.69 0.98 0.71 49.9 38.27 2.74 1.75 1.17 0.58 42.7 26.58 2.28 1.80 1.37 0.43 35.6 16.59 1.82 1.86 1.56 0.30 28.4 9.110 1.36 1.92 1.76 0.16 21.2 3.711 0.9 1.98 1.95 0.03 14.0 0.412 0.44 2.03 2.03 0.00 6.9 0.0
Total pullout capacity (kN): 522Notes:1. Length of reinforcement in resistant zone.
CALCULATED PULLOUT RESISTANCE
Calculation unique to SMSE walls.
Figure 81. Calculation. Calculation of pullout resistance for test wall.

APPENDIX C — FIELD-SCALE TESTING OF SMSE WALL
161
• Because this calculation is being conducted to evaluate the factor of safety of the MSE reinforcements against pullout, the ultimate tensile strength of the geogrid reinforcements (i.e., 114 kN/m) should be compared to the calculated pullout resistance instead of the allowable pullout resistance (i.e., 52 kN/m). Use of the ultimate pullout resistance removes factors of safety applied for creep, installation damage, and chemical/biological durability.
• The pullout resistances at each reinforcement level are summarized in figure 81. The total
pullout capacity of the reinforcements of 522 kN/m is greater than the calculated pullout force, Tmax, of 465 kN/m. The factor of safety against reinforcement pullout can be calculated using the following equation:
1.1465522
=== ∑TF
FS POp Equation C.2
According to the design methodology presented in chapter 5, the field-scale test wall would not exhibit failure under the maximum test load, as observed from the load testing.
C.9.2 Summary Under the maximum test load, the design methodology presented in this report produces a factor of safety of 1.1 for pullout of the MSE reinforcements for the field-scale test. The factor of safety with regard to pullout was calculated using the ultimate strength of the MSE reinforcements instead of the allowable strength, as would have been considered in design. The factor of safety calculation for internal failure mechanisms of the test wall partially validates the design methodology presented in this report. C.10 CONCLUSIONS Phase II of the centrifuge testing program predicted that failure of the field-scale test wall would not occur under a footing pressure of 239 kPa, which was the maximum achievable test load for the centrifuge model. The field-scale test wall was loaded to a maximum footing pressure of 356 kPa over a contact area of approximately 35 percent (i.e., 125 kPa) which is approximately equivalent to 10 times the normal traffic surcharge of 12 kPa. Even at this very high surcharge loading, the field-scale test wall did not exhibit failure. Instrumentation data shows that the field-scale test wall did exhibit measurable strain and deformation as a function of the test load. The measured strains in the various geogrid layers were small, generally less than one percent which is well within the serviceability limits of the geogrid. Vertical and horizontal deformation of the MSE wall was also relatively small, with maximum settlements on the order of 16 mm and maximum horizontal deformations from 9 to 13 mm. With the exception of data obtained from the vertical pressure cells where the uppermost load cell installed in the connected MSE section exhibited significantly higher lateral earth pressures, the connected and unconnected wall sections generally exhibited similar behavior.

APPENDIX C — FIELD-SCALE TESTING OF SMSE WALL
162
The hypotheses established prior to load testing of the field-scale test wall were confirmed, as follows: • Construction of an MSE wall in front of a rigid backslope (i.e., shoring system or stable rock
face) results in reduced external lateral loading on the MSE wall compared to a conventional MSE wall. The lateral loading appears to be larger for a connected wall system.
Fully-connected wall systems appear to provide limited benefit for an SMSE system over an unconnected wall system, where the connected system appeared only to reduce the potential for tension crack development and nominally decrease lateral deformation.
APPENDIX D — NUMERICAL MODELING
163
APPENDIX D — NUMERICAL MODELING
This appendix reports results of the numerical modeling undertaken in conjunction with the centrifuge modeling and field-scale testing of the SMSE system, as reported in appendices B and C, respectively. A numerical modeling approach was adopted to establish a qualitative means of assessing load-deformation behavior up to failure, given the relatively low level of deformation observed in the field-scale test. Numerical modeling was limited to the unconnected portion of the field-scale test wall for assessment purposes. The two-dimensional finite element code PLAXIS was used to perform the numerical analyses.(64) D.1 PRELIMINARY WORK Use of numerical techniques based on the finite element method to assess geosynthetic reinforced wall performance has been limited given the prevalence of design methods based on limiting equilibrium concepts. Given that the accuracy of limiting equilibrium design methods in predicting loads in geosynthetic reinforcement is considered to be poor, their use as a comparative basis for finite element predictions was not pursued.(65) A review of literature regarding previous finite element studies of geosynthetic reinforced walls, suggests a general lack of consensus as to what modeling parameters or approaches are appropriate. In view of these analysis issues and the unique nature of the SMSE wall system tested, preliminary work was undertaken to first confirm the ability of the PLAXIS software to simulate geogrid and soil interaction. This was then followed by various trial analysis runs modeling the field-scale test to assess the modeled behavior and to establish the most effective modeling strategy for analyzing the field-scale test. D.1.1 Geogrid Pullout Simulation Simulation of a hypothetical pullout test was first undertaken using the model llustrated in figure 82. Pullout was simulated by applying displacement to the end of a central uniaxial “geogrid” element with accompanying “interface” elements placed within a confined, rectangular soil mass. Soil was modeled using an elastic perfectly plastic constitutive formulation where a linearly elastic, isotropic material was assumed for elastic response, and plastic behavior modeled using Mohr-Coulomb shear strength (i.e., c’ – φ’ characterization) and zero tensile strength as failure criteria (referred to as the “Mohr-Coulomb” model in PLAXIS). Interaction performance was assessed by inspecting the axial force mobilized at the pulled end of the geogrid and distribution of axial displacement along the geogrid element with increasing displacement. Discretization effects were also investigated by using both medium and very fine mesh coarseness for the soil zone.

APPENDIX D — NUMERICAL MODELING
164
Geogrid
InterfaceLp
3 m
Displacement
FixedBoundaries
100 kPa confining pressure
Figure 82. Diagram. Geogrid pullout simulation model set-up.
Results of the analysis are tabulated in table 13 and plots indicating increasing development lengths with increasing load levels are presented in appendix E. Also included in appendix E are plots showing the modeled soil behavior as characterized by the development of plastic points defining either shear or tensile failure. These latter plots indicated a progressive development of soil failure consistent with the variation of development length with increasing load levels in the geogrid.
Table 13. Results of geogrid pullout simulation.
Model Geogrid Displacement (m)
Development Length1 (m)
Max. Axial Force (kN/m)
Very fine mesh 0.005 0.20 27 0.010 0.34 40 0.015 0.45 50 0.02 0.55 58 0.05 0.96 95 0.10 1.40 137 0.20 2.01 197
Medium mesh 0.005 0.22 26 0.010 0.36 40 0.015 0.47 50 0.02 0.55 58 0.05 0.97 94 0.10 1.40 137 0.20 2.00 197
1 Development length is defined as the length at which horizontal movement of the geogrid is approximately 1 mm.
Overall, the pullout simulation results agreed qualitatively with observed pullout behavior, indicating appropriate performance of geogrid-soil interaction by PLAXIS in a mechanistic sense. The minor differences in tabulated values apparent for the different mesh configurations also provided confirmation of appropriate discretization for modeling of the field-scale test.
APPENDIX D — NUMERICAL MODELING
165
D.1.2 Modeling Issues Preliminary trials undertaken to assess model performance identified several modeling issues associated with the SMSE wall system. These involved the provision of appropriate stress-strain (stiffness) behavior for the soil, modeling of the welded wire facing units used to support the wall face for each lift of wall construction, and accounting for compaction effects. Soil Stiffness In contrast to the pullout simulation exercise, initial attempts at modeling soil behavior using the Mohr-Coulomb model in PLAXIS proved ineffective for the SMSE wall system. Repeated failure of the modeled MSE wall was exhibited due to either premature soil failure coupled with insufficient mobilization of geogrid reinforcement, or excessive deformation, depending on the stiffness assigned to the soil. Essentially, the bilinear characterization of stress-strain behavior (i.e., constant stiffness and strength idealization) was considered inadequate for modeling the apparent geogrid-soil interaction developed during construction. Subsequent implementation of a hyperbolic stress-strain characterization for the soil, using the “Hardening-Soil” model in PLAXIS, succeeded in providing the necessary improvement for this aspect of the analysis. MSE Wall Facing Modeling of the welded wire facing units posed additional challenges. Their self-stabilizing nature brought about by the diagonal wire component (i.e., strut) affixed at nominal 600 mm center-to-center spacing necessitated the inclusion of equivalent “anchor” elements at the top of each facing unit for modeling purposes. This anchor element provided a restraining stiffness afforded by the diagonal component in both tension and compression (the latter considered possible due to soil confinement). While the constructed configuration provided for possible independent movement of each facing unit, the continuum formulation inherent in PLAXIS prevented direct modeling of this constructed feature, at least from a practicality standpoint. However, an indirect account of this behavior was provided for in the model by assigning minimal axial stiffness to the elements used to model the vertical section of each facing unit. This prevented the modeled facing units from attracting any significant axial load, as was considered to be the case in the field-scale test. Compaction The observance of only 15 mm of vertical footing deflection under the maximum loading pressure of 356 kPa applied in the field-scale test confirms that compaction effects were significant, where the reinforced fill section of the field-scale test wall was constructed to 102 to 105 percent of the standard Proctor maximum dry density (appendix C). Implementation of the compaction effects in finite element modeling were discussed at length by Seed and Duncan.(66) They noted various theories and analytical procedures that could model one or more aspects of compaction, but also noted that none of these theories or procedures is reliable for predictive purposes. Various compaction modeling strategies were tested to assess their suitability using the observed load-deformation behavior as a basis of comparison. This lead to the adopted procedure where a 50 kPa inward pressure was applied to the top, bottom and exposed faces of

APPENDIX D — NUMERICAL MODELING
166
each lift to simulate compactive efforts, following activation of the lift which simulated initial placement. The inward pressure was then reduced to 10 kPa on the top and bottom faces prior to placement of the next lift to simulate vertical relaxation or unloading following compaction. The inward pressure acting on the exposed face was maintained at 50 kPa as this produced the most reasonable model deformation behavior compared with that observed in the field-scale test, and recognizing possible “locked-in” stresses. While the adopted compaction procedure was considered the most realistic from a qualitative standpoint, modeled behavior still resulted in vertical footing displacements an order of magnitude greater than those observed. This aspect of the analysis was not resolved and the analyses reported in this appendix are considered to represent a lesser compacted sand than that used in the field-scale test. While this obviously affects interpretation from a quantitative standpoint, use of a lesser compacted sand was considered acceptable for interpreting failure characteristics in a qualitative sense. D.2 ANALYSIS DETAILS D.2.1 Soil The mortar sand used to construct the reinforced fill in the Turner Fairbanks Highway Research Center (TFHRC) field-scale test was described as a poorly graded sand (SP) in terms of the Unified Soil Classification System (USCS). Particle size analysis reported the following: D10 = 0.15 mm, D30 = 0.24 mm, and D60 = 0.39 mm (Cu = 2.7, Cc = 1.05).(59) Laboratory direct shear test results for the sand produced a friction angle of 39 degrees at an equivalent dry density of 14.8 kN/m3, corresponding to approximately 96 percent of the standard Proctor maximum dry density.(59) A cohesion of 4.0 kPa was inferred from results of borehole shear testing provided by TFHRC. Moisture-density testing conducted according to the method outlined in AASHTO T-99 provided a maximum dry density of 15.3 kN/m3 at a moisture content of 17.4 percent, revealing that wall construction exceeded normal standards with greater than 100 percent compaction achieved.(7) The sand was modeled using the advanced Hardening-Soil formulation available in PLAXIS, providing both shear and volumetric hardening capabilities based on hyperbolic stress-strain behavior. The Hardening-Soil model also features stress dependent stiffness according to a power law, elastic unloading/reloading behavior, shear failure according to the Mohr-Coulomb failure criterion, and tensile failure strength. Recourse to the work undertaken by Duncan et al. was made in order to provide a basis for establishing stress-strain parameters.(67) Duncan et al. back-fitted a hyperbolic stress-strain formulation to various sands tested in the triaxial device, providing particle size analysis data that was used as guidance in selecting appropriate parameters for the TFHRC mortar sand.(67) Comparison of resultant triaxial compression stress-strain curves for both models over small strain and large strain ranges at confining stress (σ3) values of 101.3 kPa and 20 kPa are plotted in figures 83 and 84, respectively. These indicate sufficiently accurate agreement for modeling purposes. Soil parameters are provided in table 14 accordingly.

APPENDIX D — NUMERICAL MODELING
167
0
100
200
300
400
500
600
0 0.5 1 1.5
Strain, ε (%)
σ 1 −
σ3 (
kPa)
Duncan et al.(1980)
Hardening Soil
σ3 = 101.3 kPa
σ3 = 20 kPa
Legend:
Figure 83. Graph. Stress-strain comparison over small strain range.
0
100
200
300
400
500
600
0 2 4 6 8 10
Strain, ε (%)
σ1 −
σ3 (
kPa) Duncan et al.
(1980)
Hardening Soil
σ3 = 101.3 kPa
σ3 = 20 kPa
Legend:
Figure 84. Graph. Stress-strain comparison over large strain range.

APPENDIX D — NUMERICAL MODELING
168
Table 14. Soil model parameters.
Parameter Value Unit weight (unsaturated), γ 14.8 kN/m3
Effective cohesion, c’ 4 kPa Effective friction angle1, φ’ 44 degrees
Dilatancy angle, ψd 8 degrees Power for stress-level dependency of stiffness, m 0.5 Reference secant modulus for deviatoric loading, refE50 4000 kPa
Reference secant modulus for primary compression, refoedE 4000 kPa
Reference secant modulus for unloading/reloading, refurE 8000 kPa
Poisson’s ratio for unloading/reloading, νur 0.2 Reference pressure for stiffness, pref 101.3 kPa Tensile strength, σtension 0 kPa Failure ratio, Rf 0.9 1 Correction applied for plane strain conditions, based on Allen et al.(65)
D.2.2 Structures Geometrical and Material Properties Material and geometrical properties used for modeling the geogrid, MSE facing units, and the footing are provided in tables 15, 16, and 17, respectively.
Table 15. Modeling parameters for geogrid.
Parameter Value Axial stiffness per unit strain, EA 1,560 kN/m Maximum tensile force, F 114 kN/m
Table 16. Modeling parameters for MSE facing units.
Component Parameter Value
Axial stiffness per unit strain, EA 4 kN/m Bending stiffness, EI 0.12 kNm2/m Moment capacity, Mp 2,000 kNm/m Axial force capacity, Np 6 kN/m Poisson’s Ratio, ν 0.3
Vertical Component
Unit weight, γ 0.046 kN/m/m Axial stiffness per unit length, EA 10,900 kN Maximum compressive force, Fmax,comp 17 kN Maximum tensile force, Fmax,tens 17 kN
Diagonal Component
Out of plane spacing, L 1.0 m

APPENDIX D — NUMERICAL MODELING
169
Table 17. Modeling parameters for loading footing.
Parameter Value Axial stiffness per unit strain, EA 1.32 x 10⁷ kN/m Bending stiffness, EI 2.74 x 10⁵ kNm2/m Unit weight, γ 11.5 kN/m/m
Structure Models Geogrids were modeled using “geogrid” elements possessing only one (axial) degree of freedom at each node, and an inability to sustain compressive forces. A maximum tensile force was also assigned to effect a limiting capacity state. The vertical component of the MSE facing units were modeled using “plate” (beam) elements possessing x-translation, y-translation and a rotational degree of freedom at each node, and able to sustain axial forces. However, a low axial stiffness was assigned in order to minimize load carrying capabilities, as discussed in the “Modeling Issues” in section D.1.2. The diagonal (or strut) component of the wall facing was represented using an “anchor” element as previously discussed, representing what was essentially a spring element possessing a maximum axial force capacity (spring-slider element). The reinforced concrete footing was modeled using a plate element assuming elastic behavior and using axial and flexural rigidities based on gross footing dimensions (i.e., ignoring the steel reinforcement). The various structure models are indicated on figure 85. D.2.3 Model Configuration The modeling configuration used for analysis purposes is shown in figure 85, indicating geometry, boundary, and loading conditions applied to the model. Model dimensions and wall facing batters corresponded to the field-scale test, i.e., vertical height equal to 5.5 m with a reinforcement base width of 1.4 m increasing to 2.2 m at the top. Lift thicknesses were modeled as 0.46 m, and additional geogrids were placed centrally in lifts 11 and 12 to approximate the constructed configuration. A fixed boundary at the location of the shoring wall face followed the assumption of a rigid boundary at this location. “Interface” elements were utilized at all structure-soil boundaries (not shown on figure 85 for clarity) to provide for possible slippage and separation, assuming strength equal to that of the soil (i.e., rough interface). Mesh discretization used in the analysis is shown in figure 86.

APPENDIX D — NUMERICAL MODELING
170
Lift 1
Lift 2
Lift 3
Lift 5
Lift 7
Lift 8
Lift 9
Lift 10
Lift 11
Lift 12
alon
g M
SE
alon
g co
ncre
te s
horin
g w
all f
ace
Surcharge loading applied to each lift to simulate compaction
Free
bou
ndar
y
Fixe
d bo
unda
ry
"Geogrid" element to model unconnected
Tensar UX1500 geogrid
"Plate" element to model vertical
component of face unit
wal
l fac
e
"Anchor" element applied at top of each
face unit to model diagonal component of
face unit (only one anchor shown for
clarity)
"Plate" element to model 1m by 2.5m by 0.5m concrete footing
Free boundary
Sand modeled using "Hardening-Soil" model
with hyperbolic stress-strain & stress-dependent
stiffness formulations
Point load to model applied loading
Legend:
Primary nodes
Pressure tracking point A
A B
C
D
E
F
A
Figure 85. Diagram. PLAXIS field-scale test wall model configuration.

APPENDIX D — NUMERICAL MODELING
171
Figure 86. Screenshot. PLAXIS model mesh discretization.
D.2.4 Initial Stress State and Modeling Sequence A pre-consolidation pressure of 50 kPa was applied to all lifts in recognition of compaction induced overconsolidation. The construction sequence adopted for modeling purposes proceeded as follows: • Step 1 – Activate lift 1 and solve for self-weight loading. • Step 2 – Apply 50 kPa compaction surcharge loading and solve.

APPENDIX D — NUMERICAL MODELING
172
• Step 3 – Reduce vertical surcharge loading to 10 kPa and solve. • Repeat steps 1 through 3 for each lift. Footing loading was simulated using a point load located at the center of the 1 m wide equivalent plate element (refer to figure 85). Loading was applied in 50 kPa increments. D.3 ANALYSIS RESULTS D.3.1 Geogrid Strain Behavior Distribution of axial strain with footing load level in geogrid elements representing instrumented locations are shown in figures 87 and 88. The load range in figure 87 corresponded to the loading range applied in the field-scale test, whereas figure 88 provides additional data up to the load level approaching model failure (approximately 1,000 kPa). A general trend of increasing axial strain with increasing load level is apparent, as was observed in the field-scale test. The existence of some initial pre-stress in the geogrid elements at the MSE face is noted, attributed to the unloading procedure applied to model compaction effects. Such behavior was not observed in the field-scale test, but given the proximity to the free face and effective removal of pre-stress with increasing load levels, the effect of this pre-stress force was considered to have had only minimal influence on model failure characteristics. Similarities between the modeled and field-scale geogrid behavior are otherwise apparent: (1) both exhibited decreasing strain levels with decreasing wall height at a given footing pressure, and (2) both exhibited varying strain levels along each geogrid layer, with a distinct increase in strain noted towards the center of the footing in the upper geogrid layers. D.3.2 MSE/Shoring Interface Pressure Behavior Plots of lateral and vertical pressure behavior at points representing locations of the pressure load cells used in the field-scale test are shown in figures 89 and 90, respectively. The lateral and vertical pressure data correspond to the loading range applied in the field-scale test, using the same plotting format as used to present the field-scale test data (appendix C). Comparison with the field-scale test data indicates similar trends of increasing lateral and vertical pressures with increasing loads, but marked differences in the distribution of lateral and vertical pressures with wall height. Namely, the model results indicate lateral and vertical pressures generally increase toward the top of the wall, whereas the field-scale data indicate lateral and vertical pressures generally decrease with wall height. These differences are attributed to the modeled construction process, in particular the compaction procedure adopted for modeling purposes, and highlights the difficulty in modeling an appropriate initial stress state with the MSE shoring wall system, as alluded to in the discussion of modeling issues. In order to help assess pressure behavior in a qualitative sense, plots of stress-strain behavior recorded at the tracking points are shown in figures 91 and 92, indicating lateral and vertical pressure behavior, respectively, for the entire loading range applied in the model. The location of the tracking points, labeled A through F in figures 91 and 92, are indicated on figure 85.

APPENDIX D — NUMERICAL MODELING
173
Pressure at the shoring face at the level of lift 2 is characterized by a marked reduction in pressure compared to the remaining locations. This effect is also apparent at the lift 5 level, although to a much lesser degree, and a distinct drop in vertical pressure near model failure is also apparent at the base location nearest the shoring face.
0.0
0.2
0.4
0.6
0.8
1.0
0 0.2 0.4 0.6 0.8 1 1.2 1.4 1.6 1.8 2 2.2
0.0
0.2
0.4
0.6
0.8
1.0
0 0.2 0.4 0.6 0.8 1 1.2 1.4 1.6 1.8 2 2.2
0.0
0.2
0.4
0.6
0.8
1.0
0 0.2 0.4 0.6 0.8 1 1.2 1.4 1.6 1.8 2 2.2
0.0
0.2
0.4
0.6
0.8
1.0
0 0.2 0.4 0.6 0.8 1 1.2 1.4 1.6 1.8 2 2.2
50 kPa150 kPa250 kPa350 kPa
Stra
in (%
)
Distance from wall face at base (m)
Lift 2
Lift 5
Lift 8
Lift 11
Load Footing
Figure 87. Graph. Calculated strains in geogrid layers over field-scale test load range.

APPENDIX D — NUMERICAL MODELING
174
0
1
2
3
4
5
0 0.2 0.4 0.6 0.8 1 1.2 1.4 1.6 1.8 2 2.2
0
1
2
3
4
5
0 0.2 0.4 0.6 0.8 1 1.2 1.4 1.6 1.8 2 2.2
0
1
2
3
4
5
0 0.2 0.4 0.6 0.8 1 1.2 1.4 1.6 1.8 2 2.2
0
1
2
3
4
5
0 0.2 0.4 0.6 0.8 1 1.2 1.4 1.6 1.8 2 2.2
50 kPa 150 kPa250 kPa 350 kPa700 kPa 1000 kPa
Stra
in (%
)
Distance from wall face at base (m)
Load Footing
Lift 2
Lift 5
Lift 8
Lift 11
Figure 88. Graph. Calculated strains in geogrid layers over model load range.

APPENDIX D — NUMERICAL MODELING
175
0
0.5
1
1.5
2
2.5
3
3.5
4
4.5
5
5.5
0 20 40 60 80 100
Lateral Pressure (kPa)
Wal
l Hei
ght (
m)
50 kPa
100 kPa
150 kPa
200 kPa
250 kPa
300 kPa
350 kPa
Figure 89. Graph. Lateral pressures recorded at tracking points for footing pressures
up to 350 kPa.

APPENDIX D — NUMERICAL MODELING
176
0
0.5
1
1.5
2
2.5
3
3.5
4
4.5
5
5.5
0 50 100 150 200
Vertical Pressure (kPa)
Wal
l Hei
ght (
m)
50 kPa
100 kPa
150 kPa
200 kPa
250 kPa
300 kPa
350 kPa
Figure 90. Graph. Vertical pressures recorded at tracking points for footing pressures
up to 350 kPa.

APPENDIX D — NUMERICAL MODELING
177
0
50
100
150
200
250
300
0 100 200 300 400 500 600
Lateral Strain (%)
Late
ral P
ress
ure
(kPa
)
Bottom Left (Point A)
Bottom Right (Point B)
Lift 2 (Point C)
Lift 5 (Point D)
Lift 8 (Point E)
Lift 11 (Point F)
A
BF
E
D
C
Figure 91. Graph. Lateral pressures recorded at pressure tracking points.
0
100
200
300
400
500
600
700
800
900
0 50 100 150 200 250 300
Vertical Strain (%)
Vert
ical
Pre
ssur
e (k
Pa)
Bottom Left (Point A)
Bottom Right (Point B)
Lift 2 (Point C)
Lift 5 (Point D)
Lift 8 (Point E)
Lift 11 (Point F)
E
D
C
F
A
B
Figure 92. Graph. Vertical pressures recorded at pressure tracking points.
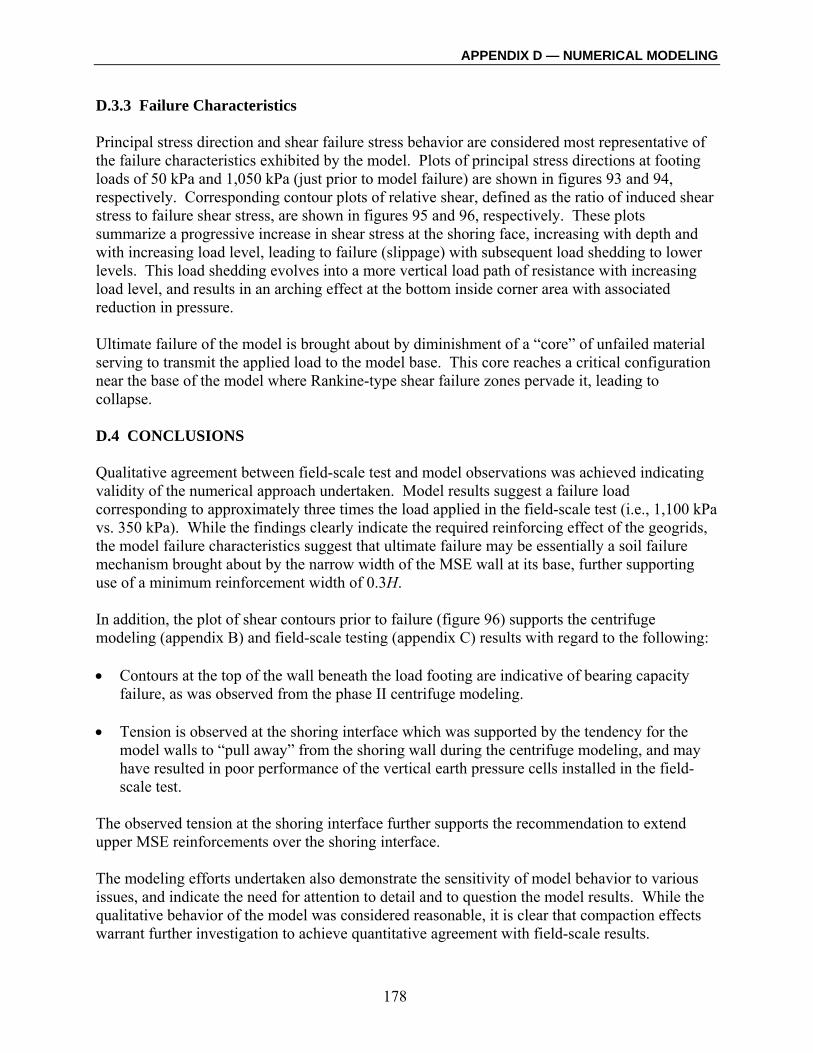
APPENDIX D — NUMERICAL MODELING
178
D.3.3 Failure Characteristics Principal stress direction and shear failure stress behavior are considered most representative of the failure characteristics exhibited by the model. Plots of principal stress directions at footing loads of 50 kPa and 1,050 kPa (just prior to model failure) are shown in figures 93 and 94, respectively. Corresponding contour plots of relative shear, defined as the ratio of induced shear stress to failure shear stress, are shown in figures 95 and 96, respectively. These plots summarize a progressive increase in shear stress at the shoring face, increasing with depth and with increasing load level, leading to failure (slippage) with subsequent load shedding to lower levels. This load shedding evolves into a more vertical load path of resistance with increasing load level, and results in an arching effect at the bottom inside corner area with associated reduction in pressure. Ultimate failure of the model is brought about by diminishment of a “core” of unfailed material serving to transmit the applied load to the model base. This core reaches a critical configuration near the base of the model where Rankine-type shear failure zones pervade it, leading to collapse. D.4 CONCLUSIONS Qualitative agreement between field-scale test and model observations was achieved indicating validity of the numerical approach undertaken. Model results suggest a failure load corresponding to approximately three times the load applied in the field-scale test (i.e., 1,100 kPa vs. 350 kPa). While the findings clearly indicate the required reinforcing effect of the geogrids, the model failure characteristics suggest that ultimate failure may be essentially a soil failure mechanism brought about by the narrow width of the MSE wall at its base, further supporting use of a minimum reinforcement width of 0.3H. In addition, the plot of shear contours prior to failure (figure 96) supports the centrifuge modeling (appendix B) and field-scale testing (appendix C) results with regard to the following: • Contours at the top of the wall beneath the load footing are indicative of bearing capacity
failure, as was observed from the phase II centrifuge modeling. • Tension is observed at the shoring interface which was supported by the tendency for the
model walls to “pull away” from the shoring wall during the centrifuge modeling, and may have resulted in poor performance of the vertical earth pressure cells installed in the field-scale test.
The observed tension at the shoring interface further supports the recommendation to extend upper MSE reinforcements over the shoring interface. The modeling efforts undertaken also demonstrate the sensitivity of model behavior to various issues, and indicate the need for attention to detail and to question the model results. While the qualitative behavior of the model was considered reasonable, it is clear that compaction effects warrant further investigation to achieve quantitative agreement with field-scale results.

APPENDIX D — NUMERICAL MODELING
179
Figure 93. Screenshot. Principal stress directions at footing loading of 50 kPa.
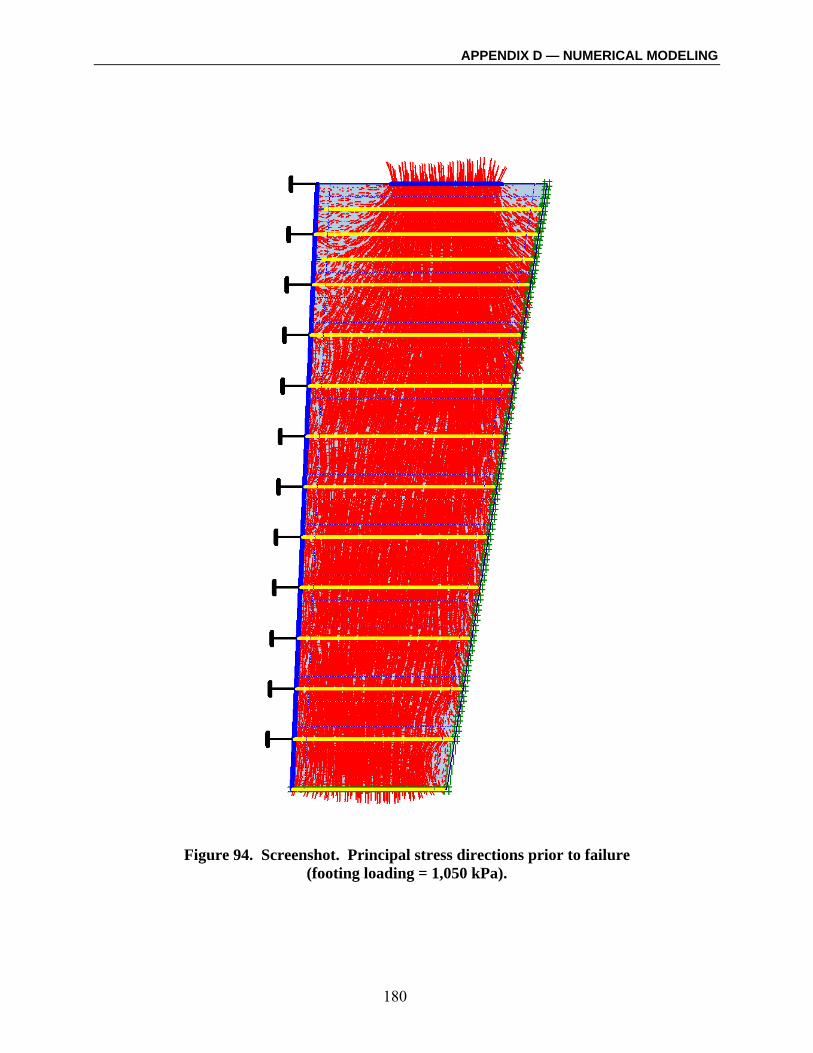
APPENDIX D — NUMERICAL MODELING
180
Figure 94. Screenshot. Principal stress directions prior to failure
(footing loading = 1,050 kPa).
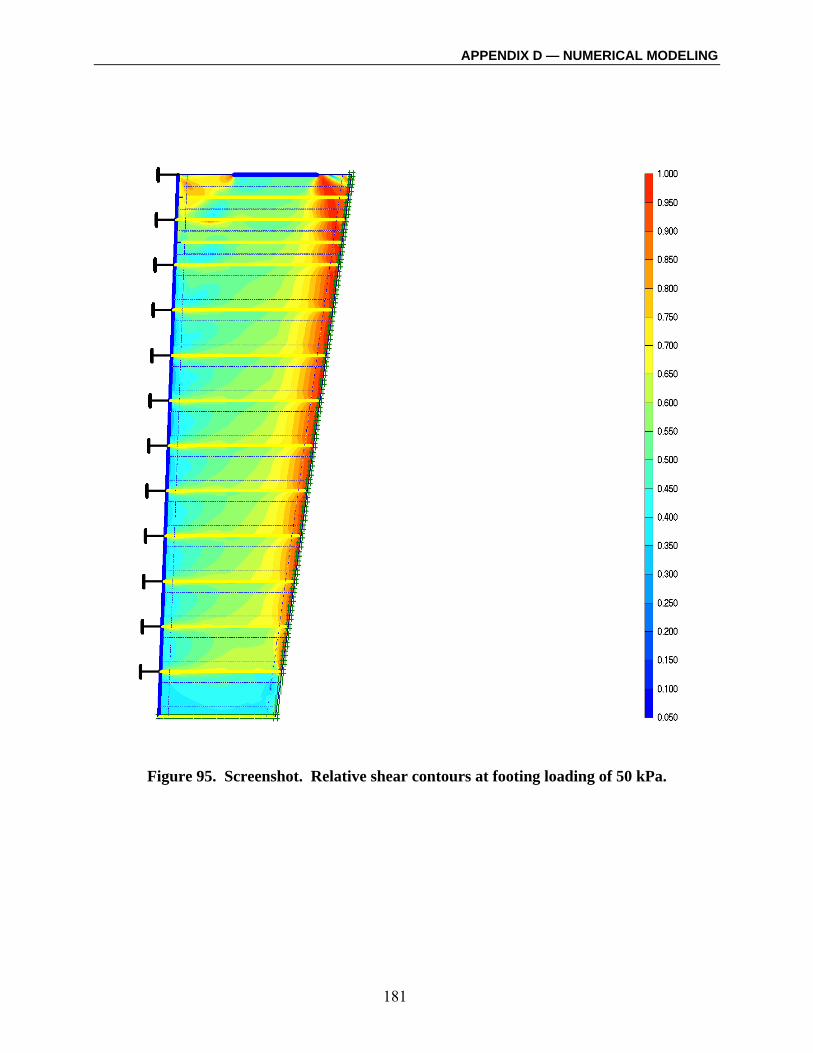
APPENDIX D — NUMERICAL MODELING
181
Figure 95. Screenshot. Relative shear contours at footing loading of 50 kPa.

APPENDIX D — NUMERICAL MODELING
182
Figure 96. Screenshot. Relative shear contours prior to failure
(footing loading = 1,050 kPa).

APPENDIX E — RESULTS OF GEOGRID PULLOUT SIMULATION
183
APPENDIX E — RESULTS OF GEOGRID PULLOUT SIMULATION E.1 MEDIUM MESH COARSENESS Medium mesh – 36 elements on each side of geogrid (3-m geogrid)
Figure 97. Screenshot. Plastic point development at displacement of 0.005 m,
medium mesh.
Figure 98. Screenshot. Geogrid development length at displacement of 0.005 m,
medium mesh.

APPENDIX E — RESULTS OF GEOGRID PULLOUT SIMULATION
184
Figure 99. Screenshot. Plastic point development at displacement of 0.010 m,
medium mesh.
Figure 100. Screenshot. Geogrid development length at displacement of 0.010 m,
medium mesh.

APPENDIX E — RESULTS OF GEOGRID PULLOUT SIMULATION
185
Figure 101. Screenshot. Plastic point development at displacement of 0.015 m,
medium mesh.
Figure 102. Screenshot. Geogrid development length at displacement of 0.015 m,
medium mesh.

APPENDIX E — RESULTS OF GEOGRID PULLOUT SIMULATION
186
Figure 103. Screenshot. Plastic point development at displacement of 0.02 m,
medium mesh.
Figure 104. Screenshot. Geogrid development length at displacement of 0.02 m,
medium mesh.

APPENDIX E — RESULTS OF GEOGRID PULLOUT SIMULATION
187
Figure 105. Screenshot. Plastic point development at displacement of 0.05 m,
medium mesh.
Figure 106. Screenshot. Geogrid development length at displacement of 0.05 m,
medium mesh.

APPENDIX E — RESULTS OF GEOGRID PULLOUT SIMULATION
188
Figure 107. Screenshot. Plastic point development at displacement of 0.10 m,
medium mesh.
Figure 108. Screenshot. Geogrid development length at displacement of 0.10 m,
medium mesh.

APPENDIX E — RESULTS OF GEOGRID PULLOUT SIMULATION
189
Figure 109. Screenshot. Plastic point development at displacement of 0.20 m,
medium mesh.
Figure 110. Screenshot. Geogrid development length at displacement of 0.20 m,
medium mesh.

APPENDIX E — RESULTS OF GEOGRID PULLOUT SIMULATION
190
E.2 VERY FINE MESH COARSENESS Very fine mesh – 73 elements on each side of geogrid (3-m geogrid)
Figure 111. Screenshot. Plastic point development at displacement of 0.005 m,
very fine mesh.
Figure 112. Screenshot. Geogrid development length at displacement of 0.005 m,
very fine mesh.

APPENDIX E — RESULTS OF GEOGRID PULLOUT SIMULATION
191
Figure 113. Screenshot. Plastic point development at displacement of 0.010 m,
very fine mesh.
Figure 114. Screenshot. Geogrid development length at displacement of 0.010 m,
very fine mesh.

APPENDIX E — RESULTS OF GEOGRID PULLOUT SIMULATION
192
Figure 115. Screenshot. Plastic point development at displacement of 0.015 m,
very fine mesh.
Figure 116. Screenshot. Geogrid development length at displacement of 0.015 m,
very fine mesh.

APPENDIX E — RESULTS OF GEOGRID PULLOUT SIMULATION
193
Figure 117. Screenshot. Plastic point development at displacement of 0.02 m,
very fine mesh.
Figure 118. Screenshot. Geogrid development length at displacement of 0.02 m,
very fine mesh.

APPENDIX E — RESULTS OF GEOGRID PULLOUT SIMULATION
194
Figure 119. Screenshot. Plastic point development at displacement of 0.05 m,
very fine mesh.
Figure 120. Screenshot. Geogrid development length at displacement of 0.05 m,
very fine mesh.
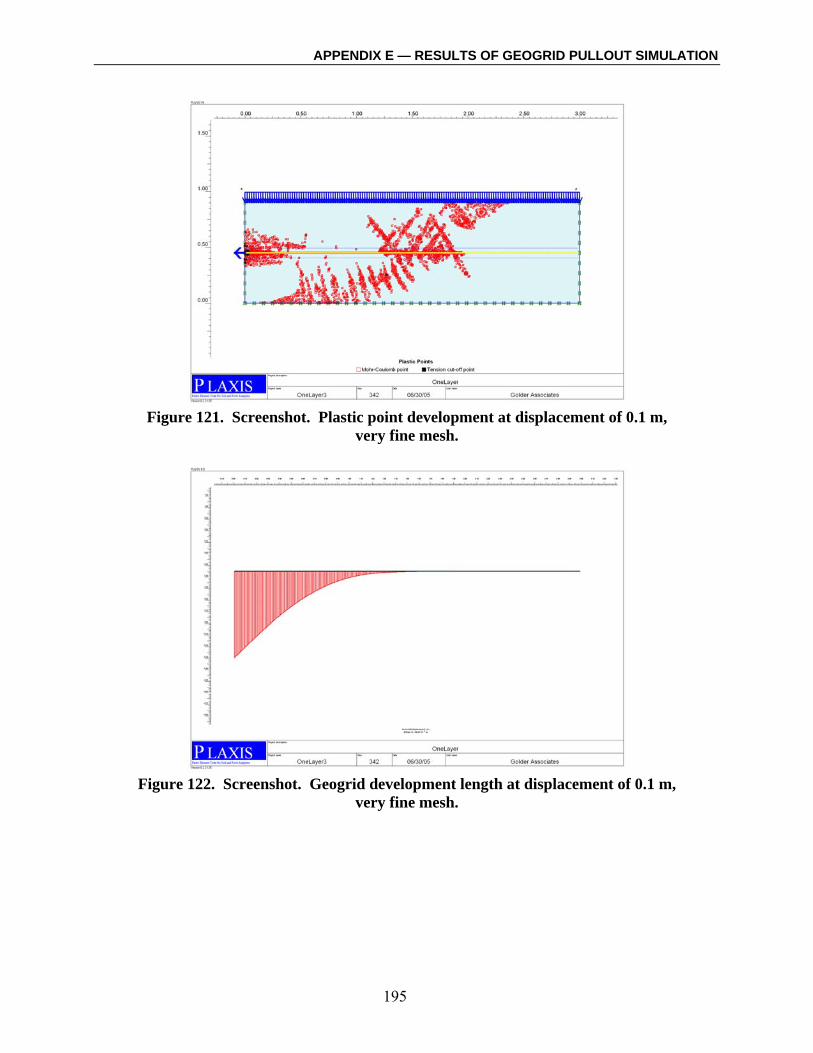
APPENDIX E — RESULTS OF GEOGRID PULLOUT SIMULATION
195
Figure 121. Screenshot. Plastic point development at displacement of 0.1 m,
very fine mesh.
Figure 122. Screenshot. Geogrid development length at displacement of 0.1 m,
very fine mesh.

APPENDIX E — RESULTS OF GEOGRID PULLOUT SIMULATION
196
Figure 123. Screenshot. Plastic point development at displacement of 0.2 m,
very fine mesh.
Figure 124. Screenshot. Geogrid development length at displacement of 0.2 m,
very fine mesh.

GLOSSARY OF TERMS
197
GLOSSARY OF TERMS
Abutment – A retaining wall that also supports a vertical load. Active Pressure – Pressure causing a wall to move away from the soil. Active Zone – The zone of an MSE wall where the soil tends to move outward toward the excavation or wall face. Aggregate – Sand-, gravel-, cobble- and boulder-sized particles in well-defined mixtures used in paving, concrete and other applications where specified properties are needed. Aggregates are typically inorganic, natural (e.g., gravel), processed (e.g., crushed rock) or man-made (e.g., air-cooled blast furnace slag and expanded shale). Aperture – An opening, such as a hole, gap or slit. Aspect Ratio – The ratio of the length of reinforcing elements to the height of the wall for an MSE wall system. Backfill – Earth or other material used to replace material removed during construction, such as behind retaining walls. Backslope – The non-horizontal finish grade of soils behind a wall; typically expressed as horizontal distance to vertical height (H:V backslope); used in engineering calculations, backslope increases the design load on a wall. Batter – As applied to walls, the difference between the wall face alignment and vertical. Batter can be expressed in degrees or ratio of vertical to horizontal. A lean of the wall face towards the retained fill is considered a positive batter, while an outward lean is considered a negative batter. Batter is often built into a wall by off-setting (or “setting back”) successive courses of a wall by a specified amount. Bearing Capacity – The pressure that a soil can sustain without failing. Bodkin Joint – A connection of one layer of geogrid to another layer, or a wrap formed by connecting the geogrid to itself, using a bodkin bar woven through the geogrid apertures. Caisson – An air- and water-tight chamber used as a foundation and/or used to work or excavate below the water level. Centrifuge – An apparatus used to test reduced-scale models of engineering structures under the stresses and loading conditions that realistically duplicate prototype behavior.

GLOSSARY OF TERMS
198
Coefficient of Consolidation – A measure of the rate of change of volume during primary consolidation. Cohesion – The state of cohering or sticking together. Compaction – Densification of soil by mechanical means, involving the expulsion of excess air. Compound Failure – A failure of a slope that involves slipping though differing components of material types instead of through a single component or material type, such as the case of a shear surface passing through both the shoring and MSE components of an SMSE wall system, or a shear surface passing through both the foundation and MSE wall component, for example. Compression Index – The slope of the normal compression line (NCL) and critical state line (CSL). Confining Stress – An applied force or system of forces that restricts movement. Consolidation – Densification of soil by mechanical means, involving the expulsion of excess water. Critical State – Theoretical state of a soil in which there is no change of mean effective stress, shear stress or volume with shear strain. Critical State Line (CSL) – Idealized volume-pressure relationship for soil under critical state conditions. Dead Load – An inert, inactive load, primarily due to the structure’s own weight. Dewatering – Lowering or reduction of the phreatic surface in surrounding strata by mechanical means such as pumping. Dilatancy – The ability of particles to move up relative to each other under shearing forces defined by the ratio between the rate of volumetric strain and the rate of shear strain. Drainage – The act or process of draining using a system of man-made or natural conveyances. Interception and removal of surface or groundwater. Conveyance of unwanted water from one point to another. Easement – A right to use or control the property of another for designated purposes. Eccentricity – The ratio of the distance between the foci to the length of the major axis describing the shape of a conic section. Elastic – Returning to, or capable of returning to, an initial form or state after deformation.

GLOSSARY OF TERMS
199
Embankment – A raised structure constructed of natural soil from excavation or borrow sources. Embedment – The buried depth requirements of a retaining wall where sufficient horizontal line to daylight is maintained. Embedment is included in total wall height. Erosion – Detachment and movement of soil or rock fragments by water, wind, ice or gravity. Excavation – A cavity formed by, or as if by, cutting, digging or scooping. There are minimum/maximum limits of excavation defined to meet a retaining wall design. Extensible – Able to experience small deformation in any direction; the deformation of an extensible reinforcement at failure is comparable to or even greater than the deformability of the soil. Face Drainage – A drainage system generally consisting of gravel and pipes located immediately behind the face of an MSE wall that prevents saturation of the reinforced soil. Facing – A generic term given to the face of a retaining wall, used to prevent the backfill soil from escaping out from between the rows of reinforcement. Fines – Silt- and/or clay-sized particles. Flexural Rigidity – A geogrid’s resistance to sag under its own weight. Footing – The soils, gravel and/or engineered materials used directly below a retaining wall. Foundation – The portion of a structure (usually below ground level) that distributes the pressure to the soil or to artificial supports. Friction Angle – A measure of the shear resistance of a soil due to the interlocking of soil grains and the resistance to sliding between the grains. Frost Heave – An upthrust of ground or pavement caused by the freezing of moist soil. Geogrid – A planar, polymeric (synthetic or natural) structure consisting of a regular open network of integrally connected tensile elements that may be lined or formed by extrusion, bonding, or interlacing which is capable of developing high tensile stresses with little deformation. Geomembrane – A sheet of geosynthetic to act as a barrier to the movement of water or gas (including air). Geostrip – A polymeric material in the form of a strip, with a width less than approximately 200 mm.

GLOSSARY OF TERMS
200
Geosynthetic – A planar product manufactured from polymeric material used with soil, rock, earth, or other geotechnical engineering related material as an integral part of a man-made project, structure or system. Geotextile – A planar, permeable, polymeric (synthetic or natural) textile material that may be woven, non-woven, or knitted. Global Stability – The factor of safety against an overall failure of a retaining wall or slope along a deep-seated slip surface passing beneath and behind a structure. Grade, Finished – The completed surfaces of lawns, walks and roads brought to grades as designed. Grade, Natural – The undisturbed natural surface of the ground. Grade, Subgrade – The grade established in preparation for top surfacing of roads, lawns, etc. Gravel – Granular material retained on a no. 4 sieve. Groundwater – Generally, all water that is underground as opposed to on the surface of the ground. Usually refers to water in the saturated zone below the water table. Height, Reinforced – A retaining wall, or the portion of a retaining wall cross section, that requires soil reinforcement to resist forces and loads. Height, Total Wall – The vertically measured height of a retaining wall; includes the portion of the wall extending below the ground surface in front of the wall (subgrade). Horizontal Line to Daylight – A horizontal line from the bottom of the wall to the intersection with the down slope. Hydrostatic Pressure – The pressure at any point in a liquid at rest, equal to the depth of the liquid multiplied by its density. Inboard – The upslope side of a roadway (or other feature) located in steep terrain. Inextensible – Not able to deform in any direction; the deformation of the reinforcement at failure is much less than the deformability of the soil. Infiltration – The movement of water downward from the ground surface through the upper soil. In situ – “In-place”; without removal; in original location. Lagging – Heavy planking used to construct walls in excavations and braced cuts.

GLOSSARY OF TERMS
201
Lateral Earth Pressure – Soil pressures that are exerted laterally (horizontally). Leveling Pad – A gravel or concrete pad installed to create a level horizontal surface for facing construction. Live Load – The weight of all non-permanent objects in a structure. Live load does not include wind or seismic loading. Load – (See Surcharge). Mechanically Stabilized Earth (MSE) – A retaining wall normally comprised of soil or aggregates stabilized by horizontal layers of reinforcement such as geogrids. The facing for such walls generally consist of precast concrete panels, concrete blocks or welded-wire. By industry convention, MSE walls have face inclinations of 70 to 90 degrees (near vertical). MSE slopes have inclinations of 70 degrees or less. For comparison, highway fill slopes typically have face inclinations of 34 degrees or less. Normal Compression Line (NCL) – Idealized volume-pressure relationship for soil under normal compression. Outboard – The downslope side of a roadway (or other feature) located in steep terrain. Outfall – A pipe that discharges water. Passive Pressure – A pressure acting to counteract active pressure. Pervious – The property of a material that permits movement of water through it under ordinary hydrostatic pressure. Plasticity – a soil is plastic if, like clay, when squeezed in the hand it does not break up. Plasticity Index – A numerical measure of the plasticity of a soil. It corresponds to the range of moisture contents, expressed as percent water by dry weight of soil, within which the soil has plastic properties. Pluviated – Also known as sand raining, placement of sand using a device called a pluviator held at a constant height. Holding the device at different heights achieves different relative densities. Pluviator – A device made of sheet metal formed into a triangular funnel with a row of holes at the bottom of the instrument to release the sand (i.e., pluviate). Poisson’s Ratio – The ratio between the strain of expansion in the direction of force and the strain of contraction perpendicular to that force.
GLOSSARY OF TERMS
202
Polyethylene – A polymeric substance formed by the addition of long chain molecules made up of repeat carbon and hydrogen atoms, belonging to the polyolefin family of thermoplastics. Products formed with high-density polyethylene include automobile battery casings, gasoline containers, polymeric liners for hazardous waste landfills and geogrids by certain manufacturers. Polymer – A substance or compound that features high molecular weight derived by the addition of many smaller molecules of the same kind. Positive Mechanical Connection – Structural connection of retaining walls specifically designed to mechanically connect facing elements to MSE reinforcement with a low-strain, end-bearing connection device that is not dependent on friction for connection strength.
Pullout Resistance – For soil nails, pullout resistance refers to the capacity of the soil nail to resist outward forces along the axis of the soil nail which may cause the nail to be removed or “pullout” from the surrounding strata. The resistance to soil nail pullout is affected by soil or rock type and strength, contractor installation methods, drillhole diameter, and roughness and cleanliness of the drillhole.
PVC Pipe – A type of smooth wall thermoplastic pipe manufactured using polyvinyl chloride, which is widely accepted for drainage applications due to its cost, longevity and chemical resistance. Reinforced Fill – Retaining wall backfill that contains reinforcing material to create the structure. Reinforced Slope – Man-made mechanically stabilized earth (MSE) slopes consisting of soil stabilized by planar reinforcing elements. Facing treatments ranging from natural vegetation to welded-wire are applied to prevent erosion. MSE slopes can be built much steeper than ordinary slopes due to the inclusion of the reinforcing elements, also called “steepened slopes.” Slopes are normally considered to be inclined at 70 degrees or less with respect to the horizontal. Reinforcing Elements (Reinforcements) – A generic term that encompasses all manmade elements incorporated in the soil to improve its behavior (i.e., geotextile sheets, geogrids steel strips, steel grids, etc.). Resistant Zone – The zone of an MSE wall where the reinforcing elements in the soil tend to resist outward movement of the wall. Retained Backfill – The fill material located behind the reinforced backfill zone in a conventional MSE wall. Retaining Wall – A wall built to hold back earth allowing adjacent areas to be at different elevations. Wall inclinations are typically 70 to 90 degrees with respect to the horizontal. Rotational Failure or Slide – A failure of a slope that involves slipping of the earth on a curved surface.
GLOSSARY OF TERMS
203
Sand – Granular material passing through a no. 4 sieve but predominantly retained on a no. 200 sieve. Scour – Erosion caused by rapid flow of water. Shear Strength – A measure of the ability of a soil to resist forces that tend to separate it from its position on a slope and cause it to move. Shoring System – A generic term for a retaining wall used to provide vertical or near-vertical temporary support of an excavation. Slope – The face of an embankment or cut section; any ground whose surface makes an angle with the horizontal plane. Slope Stability – Consideration of a slope’s propensity to fail as a result of several potential failure mechanisms including rotational slips, compound slips and translational slides. Soil Nail – Steel bars placed in drilled holes and then grouted in place for slope support, providing passive resistance. Soil Reinforcement – Tensile reinforcing elements usually placed in horizontal layers in soil so that the resulting composite soil is stronger than the original unreinforced soil. Soil Stabilization – The act of improving soil properties by inclusion of reinforcing elements, chemical substances, compaction or other methods. Soldier Pile – An upright pile (or steel H-shaped beam) driven vertically into the ground to provide support for lagging. Surcharge – Weight or load acting in, on, or near a retaining wall that impacts its ability to perform. Surcharge loads must be included in the design and engineering of retaining walls. System – A solution consisting of a variety of specialty products and engineering services, including engineering, technical assistance and specifications. Systems provide greater value to a customer because they remove the need to independently source each of the component materials. Also known as a “packaged solution.” Tensile Load – A pulling force or stress. Tensile Strength – The ability of a material to withstand tension; a term often used as an abbreviation for ultimate tensile stress. It is much higher than the greatest safe stress. Tension Crack – A small break or crack in a soil mass from a tensile load, often exposed at the surface.

GLOSSARY OF TERMS
204
Translational failure – A slide occurring along a bedding plane or other plane of weakness where the mass moves parallel to the plane. Uniaxial – Having one direction; or, relating to or affecting one axis. Having tensile strength in one direction only. The single direction stretching of perforated cast sheet or cast net. Uniformity Coefficient – A ratio of the particle size corresponding to 60 percent finer to the particle size corresponding to 10 percent fine that helps to classify soils. Weep Pipe – A pipe that connects to behind-the-wall drainage allowing collected water to drain. Wire-Formed Retaining Wall – Mechanically stabilized earth (MSE) retaining wall with facing elements manufactured from welded wire mesh.

ACKNOWLEDGEMENTS
205
ACKNOWLEDGEMENTS The authors would like to recognize the efforts of Mr. Scott A. Anderson, Ph.D., P.E., who was the FHWA Contracting Officer’s Technical Representative for this work. Mr. Anderson’s guidance and input to development of this report has been invaluable. This report also benefited from the reviews provided by the FHWA Technical Advisory Panel members: Mr. Mike Adams, Mr. Rich Barrows, Mr. Daniel Alzamora, and Mr. Roger Surdahl. The authors further acknowledge the efforts of Turner Fairbanks Highway Research Center staff under the direction of Mr. Mike Adams, and the research staff from the Department of Civil Engineering at the University of Colorado, notably Ryan Woodruff. Those who served as a review panel are, in alphabetical order: Mr. Andy Anderson, Tensar Corporation, Inc.; Dr. Hon-Yim Ko, University of Colorado; Mr. John Wolosick, Hayward Baker; Dr. Dobraslav Znidarcic, University of Colorado.


REFERENCES
207
REFERENCES 1. American Association of State Highway and Transportation Officials (AASHTO). 2002.
Standard Specifications for Highway Bridges, Seventeenth Edition. HB-17. 2. Elias, V., Christopher, B.R., and Berg, R.R. 2001. Mechanically Stabilized Earth Walls and
Reinforced Soil Slopes, Design & Construction Guidelines. Report No. FHWA-NHI-00-043. Federal Highway Administration, March. 394 pp.
3. Anderson, S.A. and Williams, J.L. 2002. Road stabilization and reconstruction adjacent to
recurring landslide in Zion National Park, Utah. ASCE Geotechnical Engineering in Transportation: More than Just Lines on a Map, 2002 Geotechnical Seminar, 4 October 2002, Denver, Colorado. American Society of Civil Engineers.
4. Occupational Safety and Health Association (OSHA). 2003. OSHA Excavation Standard
Handbook, (29 CFR Parts 1926.650 through 1926.652), Third Edition, J.J. Keller Associates (ed.).
5. Lawson, C.R. and Lee, T.W. 2005. Reinforced soil retaining walls with constrained
reinforced fill zones. Geo-Frontiers 2005, Austin, Texas. ASCE Geotechnical Special Publication 140: Slopes and Retaining Structures under Seismic and Static Conditions. American Society of Civil Engineers.
6. Geotechnical Engineering Office (GEO). 2002. Guide to Reinforced Fill Structure and Slope
Design, Draft. Geoguide 6. Civil Engineering Department, Government of the Hong Kong Special Administrative Region. 240 pp.
7. American Association of State Highway and Transportation Officials (AASHTO). 2003.
Standard Specifications for Transportation Materials and Methods of Sampling and Testing, 23rd Edition. 3,692 pp.
8. American Society for Testing and Materials (ASTM). 2004. Standard Test Method for
Consolidated Undrained Triaxial Compression Test for Cohesive Soils. D4767-04. 9. American Society for Testing and Materials (ASTM). 2000. Standard Practice for
Obtaining Samples of Geosynthetics from a Test Section for Assessment of Installation Damage. D5818-95.
10. Federal Highway Administration (FHWA). 2003. Standard Specifications for Construction
of Roads and Bridges on Federal Highway Projects. FP-03. 11. National Concrete Masonry Association (NCMA). 2002. Design Manual For Segmental
Retaining Walls, Second Edition. J.G. Collin (ed.). 289 pp.

REFERENCES
208
12. Sabatini, P.J., Bachus, R.C., Mayne, P.W., Schneider, J.A., and Zettler, T.E. 2002. Geotechnical Engineering Circular No. 5 – Evaluation of Soil and Rock Properties. Report No. FHWA-IF-02-034. Federal Highway Administration, April. 385 pp.
13. Mayne, P.W., Christopher, B.R., and DeJong, J. 2002. Subsurface Investigations,
Geotechnical Site Characterization Reference Manual. Report No. FHWA NHI-01-031. Federal Highway Administration, May. 300 pp.
14. Arman, A., Samtani, N., Castelli, R., and Munfakh, G. 1997. Subsurface Investigations
Participants Manual. (Training Course in Geotechnical and Foundation Engineering: NHI Course No. 13231, Module 1). Report No. FHWA-HI-97-021. Federal Highway Administration.
15. Rocscience. 2000. Slide 5.0 [software]. 16. Farrag, K., and Morvant, M. 2004. Evaluation of Interaction Properties of Geosynthetics in
Cohesive Soils: Lab and Field Pullout Tests. Report No. FHWA/LA.03/380. Federal Highway Administration, January. 95 pp.
17. Kimmerling, R.E. 2002. Geotechnical Engineering Circular No. 6 – Shallow Foundations.
Report No. FHWA-SA-02-054. Federal Highway Administration, September. 310 pp. 18. Wright, S. 1990. UTEXAS [software]. 19. Geo-Slope International. 2004. SLOPE/W [software]. 20. ADAMA Engineering. 2005. ReSSA version 2.0 [software]. 21. Anderson, M.G. and Richards, K.S. 1987. Slope Stability – Geotechnical Engineering and
Geomorphology, Chichester: John Wiley & Sons. 22. Collin, J.G., Hung, J.C., Lee, W.S., and Manfakh, G. 2001. Soil Slopes and Embankment
Design Reference Manual. Report No. DTFH61-97-C-00025. Federal Highway Administration, March.
23. American Society for Testing and Materials (ASTM). 2004. Standard Test Method for
Direct Shear Test of Soils Under Consolidated Drained Conditions. D3080-04. 24. Markland, J.T. 1972. A Useful Technique for Estimating the Stability of Rock Slopes When
the Rigid Wedge Sliding Type of Failure is Expected. Rock Mechanics Research Report No. 19. London: Imperial College.
25. Hoek, E. and Brown, E.T. 1988. The Hoek-Brown failure criterion – a 1988 update. Proc.
15th Canadian Rock Mechanics Symposium, J.H. Curran (ed.). Civil Engineering Dept., University of Toronto, pp. 31-38.

REFERENCES
209
26. Lazarte, C.A., Elias, V., Espinoza, R.D., and Sabatini, P.J. 2003. Geotechnical Engineering Circular No. 7 - Soil Nail Walls. Report No. FHWA0-IF-03-017. Federal Highway Administration, March.
27. Naval Facilities Engineering Command (NAVFAC). 1986. Foundations & Earth Structures.
Design Manual (DM) 7.02, September. 196 pp. 28. Elias, V., Lukas, R., Bruce, D., Collin, J.G., and Berg, R.R. 2004. Ground Improvement
Methods Reference Manual. Report No. FHWA NHI-04-001. Federal Highway Administration, July.
29. Armour, T., Groneck, P., Keeley, J., and Sharma, S. 2000. Micropile Design and
Construction Guidelines Implementation Manual Priority Technologies Program (PTP) Project. Report No. FHWA-SA-97-070. Federal Highway Administration, June. 376 pp.
30. Barksdale, R.D., and Bachus, R.C. 1983a. Design and Construction of Stone Columns
Volume 1. Report No. FHWA/RD-83-026. Federal Highway Administration, December. 210 pp.
31. Barksdale, R.D., and Bachus, R.C. 1983b. Design and Construction of Stone Columns
Volume II Appendices. Report No. FHWA/RD-83-027. Federal Highway Administration, May. 45 pp.
32. Byrne, R.J., Cotton, D., Porterfield, J., Wolschlag, C., and Ueblacker, G. 1998. Manual for
Design and Construction Monitoring of Soil Nail Walls. Report No. FHWA-SA-96-069R. Federal Highway Administration, October. 530 pp.
33. Sabatini, P.J., Pass, D.G., and Bachus, R.C. 1999. Geotechnical Engineering Circular
No. 4 – Ground Anchors and Anchored Systems. Report No. FHWA-IF-99-015. Federal Highway Administration, June. 281 pp.
34. United States Steel (USS). 1970. Steel Sheet Piling Design Manual. September. 35. Golder Associates Inc. 1998. Report on Design Methodology for Mechanically-Stabilized
Earth (Mse) Fill Wall, Yosemite El Portal Road Reconstruction Project, CA-YOSE 16(1), Prepared for Kiewit, DeLeuw, Cather, and FHWA-CFLHD, 15 December 1998.
36. Collin, J.G. 1986. Earth Wall Design. Ph.D. dissertation. University of California, Berkeley. 37. Vulova, C. 2000. Effects of Geosynthetic Reinforcement Spacing on the Behavior of
Mechanically Stabilized Earth Walls. Ph.D. dissertation. Department of Civil Engineering, University of Delaware.
38. British Standards Institution (BSI). 1995. Code of Practice for Strengthened/Reinforced Soils
and Other Fills. BS8006. Amended 1999. 161 pp.

REFERENCES
210
39. Tatsuoka, F., Tateyama, M., and Murata, O. 1989. Earth retaining wall with a short geotextile and a rigid facing. Proceedings, 12th ICSMFE, 1989, International Society of Soil Mechanics and Foundation Engineering, volume 2. pp. 1311-1314.
40. Tatsuoka, F., Murata, O., and Tateyama, M. 1992. Permanent geosynthetic-reinforced soil
retaining walls used for railway embankments in Japan. Geosynthetic-Reinforced Soil Retaining Walls: Proceedings of the International Symposium on Geosynthetic-Reinforced Soil Retaining Walls, Denver, Colorado, 8-9 August 1991, Jonathan T.H. Wu (ed.). Rotterdam, Netherlands [Brookfield, VT]: A.A. Balkema, pp. 101-130.
41. Murata, O., Tateyama, M., Tatsuoka, F., Nakamura, K., and Tamura, Y. 1991. A Reinforcing
Method for Earth Retaining Walls Using Short Reinforcing Members and a Continuous Rigid Facing. Proceedings, Geotechnical Engineering Congress, ASCE Geotechnical Special Publication 27, pp. 935-946.
42. Tateyama, M., Murata, O., Watanabe, K., and Tatsuoka, F. 1994. Geosynthetic-reinforced
retaining walls for bullet train yard in Nagoya. Proceedings, Recent Case Histories of Permanent Geosynthetic-Reinforced Soil Retaining Walls, Fumio Tatsuoka, Dov Leshchinsky (eds.). Rotterdam, Netherlands [Brookfield, VT]: A.A. Balkema, pp. 141-150.
43. Tatsuoka, F., Tateyama, M., Uchimura, T., and Koseki, J. 1997. Geosynthetic-reinforced Soil
Retaining Walls as Important Permanent Structures. Proceedings of the Conference on Mechanically-Stabilized Backfill, Jonathan T.H. Wu (ed.). Rotterdam, Netherlands [Brookfield, VT]: A.A. Balkema, pp. 3-24.
44. Segrestin, P. 1994. GRS Structures with Short Reinforcements and Rigid Facing –
Discussion of Previous Papers Published by Prof. F. Tatsuoka, M. Tateyama and O. Murata. Proceedings, Recent Case Histories of Permanent Geosynthetic-Reinforced Soil Retaining Walls. Fumio Tatsuoka, Dov Leshchinsky (eds.). Rotterdam, Netherlands [Brookfield, VT]: A.A. Balkema, pp. 323-342.
45. Brandl, H. 1998. “Multi-anchored Soil Retaining Walls with Geosynthetic Loop Anchors.”
Proceedings of the 6th International Conference on Geosynthetics, Atlanta, Georgia. Industrial Fabrics Association International (IFAI), volume 2: pp. 581-586.
46. Lin, C.C., Hsieh, T.J., Tsao, W.H., and Wang, Y.H. 1997. “Combining Multi-nailings with
Soil Reinforcement for Construction.” Mechanically Stabilized Backfill: Proceedings of the International Symposium on Mechanically Stabilized Backfill, Denver, Colorado, 6-8 February 1997, Jonathan T.H. Wu (ed.). Rotterdam, Netherlands [Brookfield, VT]: A.A. Balkema, pp. 255-257.
47. Bastick, M.J. 1990. Reinforced Earth Narrow Walls and Abutments Correlation of Measured
Performance with Design. Performance of Reinforced Soil Structures: Proceedings of the International Reinforced Soil Conference, organized by the British Geotechnical Society and held in Glasgow on 10-12 September 1990. Alan McGowan, Khen Yeo and K.Z. Andrawes (eds.), pp. 59-63.

REFERENCES
211
48. Itasca. 1998. Fast Lagrangian Analysis of Continua (FLAC), Version 3.40 [software]. 49. Woodruff, R. 2003. Centrifuge Modeling for MSE-Shoring Composite Walls. Thesis,
Master of Science, Department of Civil Engineering, University of Colorado, Boulder. 50. Thomas, D.B. 1997. Analysis of Geosynthetic-reinforced Soil Walls with a Truncated Base.
Thesis, Master of Science, Department of Civil Engineering, University of Colorado at Denver.
51. Lee, K., Jones, C.J.F.P., Sullivan, W.R., and Trolinger, W. 1994. Failure and Deformation of
Four Reinforced Soil Walls in Eastern Tennessee. Géotechnique, 4(3): 397-426. 52. Liang, R.Y. and Almoh’d, I.M. 2004. Monitoring Results of an Instrumented, Mechanically-
Stabilized Earth Wall, Comparison with Current Practice. Transportation Research Record: Journal of the Transportation Research Board, No. 1868, pp. 53-67.
53. Meyerhof, G.G. 1963. Some Recent Research on the Bearing Capacity of Foundations.
Canadian Geotechnical Journal, 1(1): 16-26. 54. Christopher, B.R., Holtz, R.D., and Allen, T.M. 1990. Instrumentation for a 12.6 m high
Geotextile-reinforced Wall. Performance of Reinforced Soil Structures: Proceedings of the International Reinforced Soil Conference, organized by the British Geotechnical Society and held in Glasgow on 10-12 September 1990. Alan McGowan, Khen Yeo and K.Z. Andrawes (eds.), pp. 73-78.
55. Thamm, B.R., Krieger, B. and Lesniewska, D. 1990. Full scale test of a geotextile reinforced
soil wall. Performance of Reinforced Soil Structures: Proceedings of the International Reinforced Soil Conference, organized by the British Geotechnical Society and held in Glasgow on 10-12 September 1990. Alan McGowan, Khen Yeo and K.Z. Andrawes (eds.), pp.241-245.
56. Zornberg, J.G., Sitar, N., and Mitchell, J.K. 1998. Performance of Geosynthetic Reinforced
Slopes at Failure. Journal of Geotechnical Engineering, 124(8): 670-683. 57. Ko, H.Y. 1988. Summary of the State-of-the-art in Centrifuge Model Testing. Proceedings,
International Conference Centrifuges in Soil Mechanics, James and Schofield (eds), pp. 11-18.
58. Zornberg, J.G., Mitchell, J.K., and Sitar, N. 1997. Testing of Reinforced Slopes in a
Geotechnical Centrifuge. Geotechnical Testing Journal, 20(4): 470-480. 59. Turner Fairbanks Highway Research Center (TFHRC). Undated. Laboratory Test Results
on FHWA Mortar Sand. Internal correspondence.

REFERENCES
212
60. American Society for Testing and Materials (ASTM). 2001. Standard Test Method for Tensile Properties of Geotextiles by the Wide-Width Strip Method. D4595-86(2001).
61. TRI/Environmental, Inc. 2003. Geotextile Test Results. Letter to Jim Collin of The Collin
Group, dated 26 July. 62. American Society for Testing and Materials (ASTM). 2000. Standard Test Methods for
Laboratory Compaction Characteristics of Soil Using Standard Effort (12,400 ft-lbf/ft3 (600 kN-m/m3)). D698-00ae1.
63. Das, B.M. 2004. Principles of Foundation Engineering, Fourth Edition. Pacific Grove, CA:
Thomson/Brooks/Cole. 828 pp. 64. PLAXIS b.v. 2002. PLAXIS 2D – [software]. (Version 8, Finite Element Code for Soil and
Rock Analyses). P.O. Box 572, 2600 AN DELFT, Netherlands. 65. Allen, T.M., Bathurst, R.J., Holtz, R.D., Walters, D. and Lee, W.F. 2003. A New Working
Stress Method for Prediction of Reinforcement Loads in Geosynthetic Walls. Canadian Geotechnical Journal, 40: 976-994.
66. Seed, R.B. and Duncan, J.M. 1983. Soil Structure Interaction Effects of Compaction-induced
Stresses and Deflections, Report Number UCB/GT/83-06. University of California, Berkeley, 425 pp.
67. Duncan, J.M., Byrne, P., Wong, K.S. and Mabry, P. 1980. Strength, Stress-strain And Bulk
Modulus Parameters for Finite-element Analysis of Stresses and Movements in Soil Masses, Report No. UCB/GT/80-01. Department of Civil Engineering, University of California, Berkeley.
68. Golder Associates. 1996- . Goldnail [software]. Redmond Washington. 69. California Department of Transportation (CALTRANS). 1999-. Snailz [software].
Periodically updated on the Web at http://www.dot.ca.gov/hq/esc/geotech/request.htm. 70. Kramer, S.L. 1996. Geotechnical Earthquake Engineering. New Jersey: Prentice Hall. 71. Federal Highway Administration (FHWA). 2003. Section 255 – Mechanically Stabilized
Earth Walls. Special Contract Requirements. www.cflhd.gov/design/scr.cfm.