Shoprite Holdings Ltd is an investment holding company · PDF file ·...
113
Shoprite Holdings Ltd comprises the following brands: b tt e r a nd b e r Shoprite Holdings Ltd is an investment holding company whose combined subsidiaries constitute the largest fast moving consumer goods (FMCG) retail operation on the African continent. Its various chains operate a total of 1 246 corporate stores in 16 countries, all integrated electronically into a central data base and replenishment system. The Group’s primary business is food retailing to consumers of all income levels, and there are outlets from Cape Town to Accra and on some Indian Ocean islands. Management’s goal is to provide all communities in Africa with food and household items in a first-world shopping environment, at the lowest prices. At the same time the Group is inextricably linked to Africa, contributing to the nurturing of stable economies and the social upliftment of its people. SHOPRITE HOLDINGS LTD INTEGRATED REPORT 2011
Transcript of Shoprite Holdings Ltd is an investment holding company · PDF file ·...

Shoprite Holdings Ltd comprises the following brands:
better and better
Shoprite Holdings Ltd is an investment holding company whose
combined subsidiaries constitute the largest fast moving consumer
goods (FMCG) retail operation on the African continent.
Its various chains operate a total of 1 246 corporate stores in 16 countries, all integrated electronically
into a central data base and replenishment system. The Group’s primary business is food retailing to
consumers of all income levels, and there are outlets from Cape Town to Accra and on some Indian
Ocean islands. Management’s goal is to provide all communities in Africa with food and household items
in a fi rst-world shopping environment, at the lowest prices. At the same time the Group is inextricably
linked to Africa, contributing to the nurturing of stable economies and the social upliftment of its people.
SHOPRITE HOLDINGS LTD INTEGRATED REPORT 2011

Business Overview
Organisational Structure . . . . . . . . . . . . . . . . . . . . . . . . . . . . . . . . . 2
The Group . . . . . . . . . . . . . . . . . . . . . . . . . . . . . . . . . . . . . . . . . . . . 4
Financial Highlights . . . . . . . . . . . . . . . . . . . . . . . . . . . . . . . . . . . . . 6
Value-added Statement . . . . . . . . . . . . . . . . . . . . . . . . . . . . . . . . . . 7
Board of Directors . . . . . . . . . . . . . . . . . . . . . . . . . . . . . . . . . . . . . . 8
Chairman’s Report . . . . . . . . . . . . . . . . . . . . . . . . . . . . . . . . . . . . . 10
Chief Executive’s Report . . . . . . . . . . . . . . . . . . . . . . . . . . . . . . . . 14
Five-year Financial Review . . . . . . . . . . . . . . . . . . . . . . . . . . . . . . 19
Financial Report. . . . . . . . . . . . . . . . . . . . . . . . . . . . . . . . . . . . . . . 20
Non-Financial Report . . . . . . . . . . . . . . . . . . . . . . . . . . . . . . . . . . . 23
Governance
Corporate Governance Report . . . . . . . . . . . . . . . . . . . . . . . . . . . 32
Audit and Risk Committee Report . . . . . . . . . . . . . . . . . . . . . . . . . 35
Nominations Committee Report . . . . . . . . . . . . . . . . . . . . . . . . . . 36
Remuneration Committee Report . . . . . . . . . . . . . . . . . . . . . . . . . 37
Annual Financial Statements
Contents . . . . . . . . . . . . . . . . . . . . . . . . . . . . . . . . . . . . . . . . . . . . 38
Notes to the Annual Financial Statements . . . . . . . . . . . . . . . . . . 46
Shareholder Information
Shareholder Analysis . . . . . . . . . . . . . . . . . . . . . . . . . . . . . . . . . . 101
Notice to Shareholders . . . . . . . . . . . . . . . . . . . . . . . . . . . . . . . . 103
Form of Proxy . . . . . . . . . . . . . . . . . . . . . . . . . . . . . . . . . . . . . . . 109
Electronic Receipt of Communication and Notices . . . . . . . . . . . 111
Administration . . . . . . . . . . . . . . . . . . . . . . . . . . . . . . . . . . . . . . . IBC
Shareholder’s Diary . . . . . . . . . . . . . . . . . . . . . . . . . . . . . . . . . . . IBC
Table of Contents
In the event of inconsistencies between
the text of this report and the Afrikaans
translation, the English text prevails.
1

SUBSIDIARIES OF SHOPRITE HOLDINGS LTD
100%Shoprite Checkers (Pty) Ltd
Has operations in:
LesothoMauritius Namibia
South AfricaSwaziland
100%Shoprite International Ltd
Has operations in:
AngolaBotswana
Ghana Madagascar
MalawiMozambique
NigeriaTanzaniaUgandaZambia
Zimbabwe
100%Shoprite Insurance Company Ltd
Integrated Report
The scope of the Integrated Report is equal to that of the IFRS financial statements. This Integrated Report is for the Shoprite Group, incorporating Shoprite Holdings Ltd and all its subsidiaries for the 52 weeks to June 2011.
Set out below is an organigram of Shoprite Holdings Ltd and its main subsidiaries.
100% Computicket (Pty) Ltd
SHOPRITE HOLDINGS LTD INTEGRATED REPORT 2011
2

Angola Botswana Ghana Lesotho Madagascar Malawi Mauritius Mozambique
Gross domestic product, constant prices (% change) 1.61 8.562 5.735 2.444 -1.983 6.602 4.035 7.009
Inflation, average consumer prices (% change) 14.481 6.95 10.709 3.8 8.995 6.908 2.933 12.699
Population (millions) 19 053 1 839 23 699 2 542 21 299 15 694 1 281 21 585
Namibia Nigeria South Africa Swaziland Tanzania Uganda Zambia Zimbabwe
Gross domestic product, constant prices (% change) 4.379 8.394 2.784 1.986 6.5 5.182 7.601 9.006
Inflation, average consumer prices (% change) 4.47 13.72 4.274 4.469 10.496 9.4 8.502 3.045
Population (millions) 2 099 156 051 49 912 1 161 41 349 33 977 13 257 12 575
Source: International Monetary Fund, World Economic Outlook Database, April 2011
ECONOMIC OVERVIEW
Nigeria
Mauritius
Namibia
Mozambique
Botswana
Madagascar
Angola
Ghana
DRC
Malawi
Tanzania
Uganda
Zambia
Zimbabwe
Distribution of Operations
South AfricaLesotho
Swaziland
Sho
prite
Che
cker
s
Che
cker
s H
yper
Usa
ve
OK
Fur
nitu
re
OK
Pow
er
Exp
ress
Hou
se &
Hom
e
Hun
gry
Lion
OK
Foo
ds
OK
Gro
cer
OK
Min
imar
k
OK
Val
ue
Meg
asav
e
Sen
tra
OK
Enj
oy
Sho
prite
Liqu
orS
hop
Che
cker
s Li
quor
Sho
p
Sho
prite
M
ediR
ite
Che
cker
s M
ediR
ite
South Africa 331 154 26 189 205 17 48 109 13 72 26 26 17 57 15 69 48 40 80
Angola 4 7 1 2
Botswana 5 2 6 7 1 1
Ghana 2 1
Lesotho 4 3 5 1 2
Madagascar 7
Malawi 2 3
Mauritius 1
Mozambique 6 2 2
Namibia 14 4 14 10 2 6 2 9 2 7 10 11 2 1
Nigeria 2
Swaziland 6 2 2 1 1
Tanzania 3
Uganda 2
Zambia 19 1 8
Zimbabwe 1
Outside SA 78 4 34 27 1 2 26 2 9 2 7 11 12 2 1 1
Total 409 158 26 223 232 18 50 135 15 81 28 33 28 69 15 71 49 41 80
3

Target market Store numbers
Shoprite is the original business of the Group and remains the flagship brand, serving the mass middle market. It’s the brand with the most stores in RSA, as well as the brand used to spearhead growth into Africa. The brand’s core focus is to provide the masses with the lowest possible prices on a range of groceries and some durable items. Specific emphasis is placed on basic commodities, which is critical to the core target market.
LSM 4-7 RSA: 331Non RSA: 78
Total: 409
Usave is a no-frills discounter focussing on lower income consumers. This smaller format, limited range store is an ideal vehicle for the Group’s expansion into Africa and allows far greater penetration into underserved areas within South Africa.
LSM 1-5 RSA: 189Non RSA: 34
Total: 223
Checkers has repositioned itself to focus on time-pressed, higher income consumers, and differentiated on its specialty ranges of meats, cheeses and wines. Its full range of groceries and household non-food items are all promised at the consistently good value for which the Group is famous. The stores across South Africa and Namibia are located in shop-ping malls and other premises conveniently accessible to more affluent residential areas.
LSM 8-10 RSA: 154Non RSA: 4
Total: 158
Checkers Hyper offers the same specialty food selections and great value as Checkers, but within large format stores that encourage bulk rather than convenience shopping. The general merchandise ranges are far wider in Hyper stores, focusing on categories like small appliances, pet accessories, garden and pool care, outdoor gear, home improvement, homeware, baby products, toys and stationery. Checkers Hyper stores operate in South Africa only and are found in areas with high population densities.
LSM 8-10 RSA: 26 Non RSA: 0
Total: 26
The OK Furniture chain, with its wide geographic spread of stores, strives to offer a wide range of furniture, electrical appliances and home entertain-ment products at the lowest prices with impeccable service, at discounted prices, for cash or on credit. It sells quality cheaply, not cheap quality.
LSM 5-7 RSA: 205Non RSA: 27
Total: 232
A chain of small format stores, located mainly in high-density areas, selling a carefully selected range of white goods and home entertain-ment products as well as bedding and carpeting, for cash or competitive credit options.
LSM 5-7 RSA: 17 Non RSA: 1
Total: 18
The Group
better and better
SHOPRITE HOLDINGS LTD INTEGRATED REPORT 2011
4

Target market Store numbers
House & Home offers its customers a quality shopping experience, with a large selection of affordable, exclusive and well-known ranges of furniture, appliances, home entertainment products and floor coverings.
LSM 7-10 RSA: 48 Non RSA: 2
Total: 50
Now, with over 120 pharmacies – and two more opening every month – MediRite is on its way to becoming the most convenient pharmacy for millions of South African grocery shoppers. MediRite pharmacies inside Shoprite and Checkers stores meet the growing need for easily accessible and affordable healthcare for all its shoppers. Many of the pharmacies are located in supermarkets serving economically disadvantaged areas where there are few medical practitioners.
Same as Shoprite and Checkers
RSA: 120Non RSA: 1
Total: 121
LiquorShop offers an upmarket, convenient shopping experience to Shoprite and Checkers shoppers. LiquorShop marketing primarily targets Shoprite and Checkers customers, but the location of the outlets – with a separate entrance to that of the supermarket – invites passing trade too. It offers a full assortment of wine, beer and spirits.
Same as Shoprite and Checkers
RSA: 117Non RSA: 3
Total: 120
Transpharm Pharmaceutical Wholesalers distributes a wide range of pharmaceutical products and surgical equipment to MediRite pharmacies, as well as other pharmacies, hospitals, clinics, dispensing doctors and veterinary surgeons across South Africa. Having opened a second depot in Cape Town this year, the Shoprite Group is expanding this dynamic company to improve its existing national distribution network.
Targets pharmacies, vets, clinics, hospitals and dispensing doctors
The OK Franchise Division (OKFD) enabled the Group to gain a foothold in a diverse range of mostly smaller, convenience-oriented markets situated in rural towns, suburbs and neighbourhoods. The stores offer a wide range of fresh and non-perishable food items, as well as general merchandise. The OKFD encompasses seven supermarket and convenience outlet brands (OK Foods, OK Grocer, OK MiniMark, OK Value, Friendly, 7-Eleven and Priceclub), a wholesaler (Megasave), and three add-on liquor outlets (Enjoy OK Liquor Store, Friendly Liquormarket and 7-Eleven Liquormarket). The OK brand is only awarded to outlets that meet specific requirements.
The various store formats, with their different identities and facilities, cater to the needs of the community in which they are located. These range from lower to middle income consumers (living standards measurement 4 to 8) and from convenience shopping to bulk buy.
RSA: 226Non RSA: 43
Total: 269
5

Financial HighlightsShoprite Holdings Ltd and its Subsidiaries
%increase
June 2011
R’000
June 2010
R’000
Sale of merchandise 7.3 72 297 777 67 402 440
Trading profit 14.2 3 986 697 3 490 441
Earnings before interest, income tax, depreciation and amortisation (EBITDA) 15.0 4 898 255 4 260 005
Profit before income tax 14.0 3 876 368 3 399 088
Headline earnings 12.0 2 569 006 2 293 215
PERFORMANCE MEASURESHeadline earnings per share (cents) 11.5 507,6 455,4
Diluted headline earnings per share (cents) 12.4 507,6 451,6
Dividends per share declared (cents) 11.5 253,0 227,0
Dividend cover (times) 2,0 2,0
Trading margin (%) 5.51 5.18
Return on average shareholders’ equity (%) 39.3 41.9
Defi nitions Return on average shareholders’ equity: Headline earnings, expressed as a percentage of the average of capital and reserves and interest-bearing borrowings at the beginning and the end of the financial year.
SHOPRITE HOLDINGS LTD SHARE PRICE
12 000
10 000
8 000
6 000
4 000
2 000
0
Jun
02
Dec
02
Jun
03
Dec
03
Jun
04
Dec
04
Jun
05
Dec
05
Jun
06
Dec
06
Jun
07
Dec
07
Jun
08
Dec
08
Jun
09
Dec
09
Jun
10
Dec
10
Jun
11
SALES
80 000
70 000
60 000
50 000
40 000
30 000
20 000
10 000
0
R M
illio
n
200
4
2005
200
6
2007
2008
200
9
2010
2011
NUMBER OF CORPORATE STORES
1 300
1 200
1 100
1 000
900
800
700
600
500
400
300
200
100
0
200
4
2005
200
6
2007
2008
200
9
2010
2011
704 76
6 846 91
7 984
1 07
9 1 16
6 1 24
6
26 6
41
29 7
04
33 5
11 38 9
50
47 6
52
59 3
19 67 4
02
72 2
97
SHOPRITE HOLDINGS LTD INTEGRATED REPORT 2011
6

Value-added StatementShoprite Holdings Ltd and its Subsidiaries for the year ended June 2011
June2011
R’000 %
June2010
R’000 %
Sale of merchandise 72 297 777 67 402 440
Investment income 122 277 138 403
Cost of goods and services (61 341 791) (57 268 979)
VALUE-ADDED 11 078 263 100.0 10 271 864 100.0
Employed as follows:
EMPLOYEES
Salaries, wages and service benefits 6 089 252 55.0 6 051 154 58.9
PROVIDERS OF CAPITAL 1 315 375 11.9 1 156 568 11.3
Finance costs to providers of funds 125 964 1.1 93 690 0.9
Dividends to providers of share capital 1 189 411 10.7 1 062 878 10.3
INCOME TAX
Income tax on profits made 1 346 826 12.2 964 379 9.4
REINVESTED
Reinvested in the Group to finance future expansion and growth 2 326 811 21.0 2 099 763 20.4
Depreciation and amortisation 1 006 442 9.1 896 119 8.7
Retained earnings 1 320 369 11.9 1 203 644 11.7
EMPLOYMENT OF VALUE ADDED 11 078 263 100.0 10 271 864 100.0
11.9%Providers of capital
12.2%Income tax 55.0%
Employees
11.3%Providers of capital
9.4%Income tax 58.9%
Employees
20.4%Reinvested
20.9%Reinvested
2010
2011
7

Board of DirectorsShoprite Holdings Ltd
EXECUTIVE DIRECTORS
Dr JW Basson (65) BCom CTA CA(SA) DCom (hc)Chief Executive Officer
– Joined Pep Stores Ltd as financial manager in 1971.
– Appointed as Chief Executive Officer of Shoprite Holdings in 1979.
– Managing director of Shoprite Checkers (Pty) Ltd.
Mr CG Goosen (58)BCom Hons CA(SA)Deputy Managing Director and Financial Director
– Joined the Pepkor Group as financial manager in 1983.
– Appointed as financial director of Shoprite Holdings in 1993.
– Director of Shoprite Checkers (Pty) Ltd and various group subsidiaries.
Mr B Harisunker (59)Divisional Manager
– Joined Checkers in 1969.– Appointed to the board of
Shoprite Holdings in 2002.– Director of Shoprite Checkers (Pty) Ltd
and various group subsidiaries.– Responsible for the group’s retail
operations in KwaZulu-Natal, Indian Ocean Islands and Tanzania.
Mr AE Karp (52)General Manager: Furniture Division
– Joined OK Bazaars in 1990.– Appointed to the board of Shoprite
Holdings in 2005.– Director of Shoprite Checkers (Pty) Ltd
and various group subsidiaries.
Mr EL Nel (62)BCom CTA CA(SA) General Manager: Retail Investments
– Joined the Shoprite Group in 1997.– Appointed to the board of Shoprite
Holdings in 2005.– Director of Shoprite Checkers (Pty) Ltd
and various group subsidiaries.
Mr BR Weyers (59)General Manager: Marketing & Product Development
– Joined the Shoprite Group in 1980.– Appointed as director of Shoprite
Holdings in 1997.– Director of Shoprite Checkers (Pty) Ltd.
EXECUTIVE ALTERNATE DIRECTORS
Mr JAL Basson (35)BAccGeneral Manager: Hungry Lion
– Appointed as Shoprite Holdings alternate director in 2005.
– Director of Shoprite Checkers (Pty) Ltd and various group subsidiaries.
Mr M Bosman (54)B Acc Hons CA(SA)General Manager: Group Finance
– Appointed as Shoprite Holdings alternate director in 2005.
– Director of Shoprite Checkers (Pty) Ltd and various group subsidiaries.
Mr PC Engelbrecht (42)BCompt Hons CA(SA)Chief Operating Officer
– Appointed as Shoprite Holdings alternate director in 2005.
– Director of Shoprite Checkers (Pty) Ltd and various group subsidiaries.
SHOPRITE HOLDINGS LTD INTEGRATED REPORT 2011
8

NON-EXECUTIVE DIRECTORS
Dr CH Wiese (69)BA LLB DCom (hc)
– Appointed as Chairman of Shoprite Holdings in 1991.
– Chairs the Remuneration and Nomination Committees.
– Executive Chairman of Pepkor since 1981.
– Chairman of Tradehold Ltd, Invicta Holdings Ltd and Tulca (Pty) Ltd (trading as Mango).
– Serves as a director of the PSG, Primedia and Luna Groups of Companies.
Mr JG Rademeyer (62)BCom CTA CA(SA)
– Appointed as director of Shoprite Holdings in 2002.
– Chairman of the Audit and Risk Committees.
– Serves as a non-executive director of Pepkor.
Mr EC Kieswetter (52)B Ed (Science Education) MCom(cum laude) (SA and International Tax) Executive MBA (Strategy and Business Transformation) (UK)MA (Science Education – Cognitive Development)
– Appointed as director of Shoprite Holdings in 2010.
– Group Chief Executive of Alexander Forbes Equity Holdings (Pty) Ltd and holds various directorships within Alexander Forbes group subsidiaries.
– Previous Deputy Commissioner at SARS and member of the National Treasury Tax Revenue Committee.
Mr JA Louw (67)BSc Hons B(B&A) Hons
– Appointed as director of Shoprite Holdings in 1991.
– Serves on the Audit and Risk, Remuneration and Nomination Committees.
– Holds directorships in various private companies.
Mr JF Malherbe (82)BCom LLB
– Appointed as director of Shoprite Holdings in 1999.
– Serves on the Audit and Risk Committee.– Previous President of the Law Society of
South Africa, the Attorneys Fidelity Fund and the Attorneys Insurance Indemnity Fund.
NON-EXECUTIVE ALTERNATE DIRECTOR
Adv JD Wiese (30)BA, MIEM (Italy), LLB
– Appointed as alternate director of Shoprite Holdings in 2005.
– Serves on the boards of various listed companies.
– Advocate of the High Court ofSouth Africa.
9

Chairman’s Report
cies, South Africa’s growth has slowed down. This is the result not only of the problems experienced by its major trading partners, but also because of the strength of the rand and structural problems in the economy itself. Excluding some countries in Asia and Africa, the global economy is not expected to regain traction in the near future.
The recovery in the South African economy has, at best, been fragile and growth figures for the year are being increasingly adapted downwards. The growth there in for instance the manufacturing sector has been sluggish and has not been accompanied by any noticeable rise in employment. In fact, according to the latest report of the World Bank, 869 000 South Africans have lost their jobs since the 2008-2009 recession. The number of unemployed people in the country’s economically active population has now reached 25.7%, which is the highest of the 61 countries tracked by international agen-cies. At the same time more than 14% of employers, among them many government departments, are struggling to fill crucial skilled positions because of the lack of sufficiently qualified applicants.
The government tries to relieve the plight of consumers by making social grants available to a growing number of people. With more than 14 million people now receiving grants, this approach appears to be unsustainable given the country’s subdued economic growth and relatively small tax base. Despite job creation being high on the list of the government’s declared priorities, most new employ-ment opportunities will have to come from the private sector, which is, however, hampered by inappropriate labour legislation, high wage demands and bureaucratic delays in the approval of skills immigra-tion. This lack of an adequate reservoir of skills is part of the reason
SOUTH AFRICA AND THE GLOBAL ECONOMIC ENVIRONMENTThe year to end June 2011 continued to see the fallout of the world’s economic woes affecting the lives of consumers almost everywhere. Uncertainty has gripped international markets for long periods at a time, brought on by the sovereign debt crises of several Euro Zone countries and the fear that the US could default on its debt. Although buffered against the worst of the international fallout by its prudent fiscal poli-
CH Wiese
SHOPRITE HOLDINGS LTD INTEGRATED REPORT 2011
10

why, in the 2010 Global Competitiveness Report, the country dropped from 45th to 54th place on the list of 139 nations.
Unemployment represents a major challenge to the Group’s core business, which has always predominantly served people at the lower end of the income spectrum.
AFRICAAfrican countries, with their cash-based economies, did not experi-ence the economic downswing to the same extent as most other economies. In the present economic lull, Africa is expected to be the only region to register faster real growth in 2011 than in 2010. As a result, it is becoming increasingly attractive to investors worldwide, making South Africa a logical destination for investors keen on using the country as entry point into Africa. However, the enormous competitive edge this gives the country is fast dissipating as irre-sponsible pronouncements by political leaders, the lack of skilled workers and the difficulties experienced in entering the local market increasingly frustrate foreign investors.
Over a period approaching two decades, the Shoprite Group has been expanding its presence on the continent, particularly in the resource-rich countries of West Africa and today operates more than 140 stores in 15 countries. However, in developing its business, the continuing high level of bureaucratic regulation found at every level of government in virtually every country on the continent remains a constant challenge and the Group is continually developing ways to minimise the impact of such bureaucracy on its operation.
I believe the biggest problem of doing business in Africa is the bureaucratisation of its economies, which assumes frightening proportions in terms of the costs and delays in which it involves busi-nesses wishing to invest. The endless delays apply in the case of virtually every approval a business needs, from visas for skilled workers to those for building plans or rezoning applications. The crip-pling effects of this all-pervading bureaucratisation are as prevalent today in South Africa as anywhere else on the continent. By contrast, a few countries seem to want to start opening up their economies, such as Rwanda where, according to a World Bank report, it is
While the economy as a whole is still shedding jobs, we were able to increase our staff complement in the year under review through organic growth by more than 7 000 to over 95 000, making Shoprite Holdings one of the biggest employers in the private sector.
11

possible to register a company and obtain a registration certificate within as little as two days. However, those are the exceptions – much will have to change before this becomes the norm in Africa.
COMPETITORSThe entry of Wal-Mart, the world’s largest food retailer, into the South African retail market represents a major foreign direct investment in the country and should therefore be welcomed, especially as capital flows to this country from the rest of the world slowed conspicuously in 2010. With the growth potential of the African continent probably the least developed of all emerging markets, it is reasonable to expect that other major international companies would also in time establish themselves here.
However, South African retailing has always been one of the most competitive sectors of the local economy and hence also one of the most sophisticated. As a result, we have produced world-class retailers capable of continuously assimilating changing international trends. The Shoprite Group is no exception in this respect. Over a period of more than three decades we have come to know our market thoroughly and how to trade not only in South Africa, but also elsewhere on the continent where we do business. We operate an extensive network of strategically located outlets and continuously invest in improving our supply lines and centralised distribution networks. Backed by experienced management and extensive opera-tional skills, we believe we are well-equipped to face any challenges in food retailing that may result from new entrants into our market.
BROAD-BASED BLACK ECONOMIC EMPOWERMENT The Group has committed itself fully to the principles of broad-based black economic empowerment (B-BBEE), however avoiding a path intended to benefit a few at the expense of the wider community. We have devoted our energies to creating employment opportunities to provide a viable financial future for an increasing number of previ-ously disadvantaged people. While the economy as a whole is still shedding jobs, we were able to increase our staff complement in the year under review through organic growth by more than 7 000 to over 95 000, making Shoprite Holdings one of the biggest employers in the private sector. Staff remuneration contributes almost R6 billion to the economy.
The Group has created close to 30 000 new jobs over the past five years; and if our plans of opening 106 new stores in the new financial year come to fruition, we expect to create a further 8 000 to 9 000 jobs by June next year.
Of our present staff complement, over 11 000 are employed in our businesses outside South Africa, thereby contributing to the growth of the economies of the other African countries where we operate.
Within our business, job creation is linked to extensive, ongoing training to equip employees with skills over a range of areas. Of the almost 1 million hours devoted to training and development in the past financial year, 95% involved previously disadvantaged members of staff. We promote people through the ranks from our existing staff base, so that people of colour, both men and women, now enjoy a growing presence in middle, senior and top manage-
Chairman’s Report (continued)
SHOPRITE HOLDINGS LTD INTEGRATED REPORT 2011
12

ment teams across our various divisions. Strategies are in place to ensure that this also happens increasingly at Group management level.
However, we share the frustration of other training-based companies who lose their trained staff to businesses who invest little in training themselves.
We extended our B-BBEE involvement this year with the establishment of the Shoprite Development Trust, with initial capital of R65 million. It will, in support of the national Enterprise Development Strategy, make low-interest loans as well as manage-ment skills available to black entrepreneurs from communities where the Group owns or is developing shopping facilities, enabling them to become business owners.
Our B-BBEE programmes, which for the review period brought the Group to a level 5 contributor status, also extend to our suppliers. In terms of our preferential procurement programme, we bought products during the year to the value of R37,1 billion from B-BBEE suppliers, among them 456 small-scale farmers all over Africa who supply us with fresh produce to the demanding standards we set. We currently have greenfields initiatives involving 167 such small farmers.
BOARDS OF DIRECTORSThere were no changes to the board of Shoprite Holdings Ltd. In the light of our increasingly complex business and growing geographic footprint, the directors are sensitive to the need of not only the main
board, but also of the subsidiary boards in the group, to stay in close touch with the dynamics of its ever-changing markets. To this end, various initiatives have been identified to ensure that we possess at board level all the skills and knowledge needed to ensure that the Group continues on its present growth path. Announcements in this regard will be made in the current year.
ACKNOWLEDGMENTI am extremely proud of the results that the Group achieved this past financial year – the outcome of a supreme team effort involving the board, management and staff, who all made a vital contribution to our success. It is therefore with deep gratitude and appreciation that I thank them all – my fellow directors for their insight, guidance and support; management for the way in which they turned the many challenges to the Group’s advantage, and every member of staff for their dedication and unremitting hard work.
C H WieseChairman
26 August 2011
13

Chief Executive’s Report
JW Basson
BUSINESS ENVIRONMENTThe business environment during the reporting period presented many challenges to the retail sector. Against the background of the lacklustre performance of the economy as a whole, the disposable income of consumers, particularly those in the lower income groups, came under increased pressure. Factors such as high household debt and the surging cost of essential services like electricity and transport eroded their spending power. Although a strong rand has partially
shielded local consumers from the full effect of international food and energy costs, it has also hampered exports from this country and inhibited job creation. Although the sale of durable goods such as motor vehicles saw a resurgence as more affluent consumers took advantage of low interest rates, spending on fast moving consumer goods remained depressed with few factors present that indicate an improvement.
Management has a growing concern over the ability of many smaller local suppliers to survive. High input costs and rigid labour regulations make it increasingly difficult for them to remain competitive in relation to imports. Their departure would not only increase unem-ployment in some of the sectors in which the Group does business, but would also jeopardise supplies of certain product categories. Contingency plans to obtain such products from alternative sources are in place to protect the Group against any potential fallout.
OPERATIONAL REVIEWPrice competition amongst food retailers in the South African market remained fierce. To assist consumers and protect its position of consistently offering the lowest prices, the Group’s supermarket chains kept price increases to the minimum by passing on cost savings to consumers. More than 40% of its product categories could thus be purchased for the same or a lower price than during the previous reporting period.
Internal food inflation averaged -0.1% for the reporting period (2010: 2.2%) compared to the official food price inflation of 3.2%. Against this background, turnover for the 52 weeks to June 2011
SHOPRITE HOLDINGS LTD INTEGRATED REPORT 2011
14

Applying international best practice to all aspects of the business, management continued to strengthen the low price-positioning of it’s supermarket brands, resulting in 64.3% of all South African consumers shopping at the Group’s chains according to AMPS.
grew by 7.3% compared to the 53 weeks of the previous year. On a comparable 52-week basis the growth was 9.7%.
Stringent cost management and the ongoing improvement in efficiency levels enabled the Group to increase its trading margin to 5.5%. Management considers this a satisfactory performance in the face of considerable increases in operating costs, such as staff salaries, rentals and electricity, in the second half of the year.
CORE BUSINESSThe Group’s core business – its three supermarket chains, Shoprite, Checkers and Usave, which between them cover the entire LSM consumer spectrum in South Africa – traded successfully during the reporting period. Shoprite, the largest of the three in terms of turnover and the number of stores, remains the dominant player in the middle to lower income sectors despite more fierce competition from an increasing number of participants. It countered this by expanding its presence in economically disadvantaged residential areas in particular with full-service supermarkets that include pharma-
cies providing increased access to prescription and self-medicating remedies. During the reporting period, a net 11 new stores were opened to bring the total in South Africa to 331.
Checkers further entrenched its position in the higher income consumer segment to the extent that 53% of its customers now fall within LSM 8-10. The brand’s repositioning has been so successful that it is increasingly the preferred anchor tenant for many new shopping centres countrywide. It was, for the third consecutive year, the fastest growing supermarket chain in the country. It continued to expand its ranges of specialist offerings, such as estate wines, exotic cheeses, and branded fresh meat products.
Usave’s low cost structures enable it to consistently sell compa-rable products at lower prices than its competitors. Its strategic role in an increasingly competitive local market has grown during the reporting period. In order to gain access to desirable sites, it is imple-menting innovative ways of developing stores in conjunction with landowners. It will be intensifying its store opening programme in the new financial year.
15

Chief Executive’s Report (continued)
Applying international best practice to all aspects of the business, management continued to strengthen the low price positioning of these brands. In doing so, the Group is benefiting from recent AMPS research which shows that consumers are visiting more than one store to cherry-pick items on price. Research from the same source shows that the Group’s chains are now being frequented by 64.3% of all South African shoppers.
In the recent 2011 Sunday Times Top Brands Awards, the winners of which are voted in by consumers, the Shoprite Group won the convenience and grocery store category for the second consecutive year and for the fifth time in the history of the awards.
During the reporting period the Group opened a net 54 super-markets, of which 46 are within the borders of South Africa. It now operates 816 supermarkets, 700 of which are within the country. In order to ensure that it has access to areas where it will want to trade in future, it is also increasingly buying land and buildings for potential development. It plans to open at least the same number of stores in the new financial year of which 16 will be elsewhere in Africa.
GROUP SERVICESManagement believes that the Group is well-positioned for future growth, due to its extensive infrastructure for product sourcing and distribution, multi-layered store network for the different brands, some of the most sophisticated information technology (IT) systems available to support its operations, and management who is experi-enced in every aspect of the business. By applying the principles of continuous supply, stores are being re- engineered to enlarge trading
space and allow for the introduction of some of the latest trends in layout and presentation.
It is an accepted fact that food retailing is a replenishment business. The supply chain is therefore crucial to the success of any food retailer.
The Shoprite Group resolved more than 17 years ago that it could only derive maximum efficiency from the supply chain if it controlled every stage of that process. At the same time, it started investing in the most advanced IT systems to support the supply chain functions. These systems are regularly upgraded to stay abreast of the latest international developments.
In the past two years the Group has invested substantially in extending its distribution facilities with major additions to its centres in Brackenfell and Centurion, with the latter remaining the largest in Africa.
COMPLEMENTARY SERVICESThe idea of enabling customers to do all their shopping under one roof was further expanded with the introduction of in-store pharma-cies (under the name MediRite) and liquor outlets (under the name LiquorShop). The latter are located at or very close to the entrances to Shoprite or Checkers supermarkets. Both extend a service to customers and, in doing so, enhance their shopping experience.
During the reporting period MediRite increased its number of outlets from 104 to 121 and it is budgeting for another 22 in the new financial year. Its pharmacies enjoy secure supply lines from its fellow subsidiary, Transpharm Pharmaceutical Wholesalers, which now has depots in Cape Town as well as Gauteng, providing 93% of their total
SHOPRITE HOLDINGS LTD INTEGRATED REPORT 2011
16

product range and offering the opportunity of direct purchases from international markets. Despite the subdued growth experienced by the liquor industry as a whole, LiquorShop grew apace in the reporting period, opening 37 outlets in key areas to bring its number of outlets to 120. Growth will accelerate further in the new financial year, with 40 new outlets on the cards, depending on the rate at which licences are issued. LiquorShop offer a comprehensive collection of spirits and other alcoholic drinks.
Several years ago, the Group introduced the Money Market concept to enhance its offering of a one-stop shopping experience through its supermarkets. The Money Market counters continue to expand their range of services, from money transfers and flight and bus tickets to the payment of electricity bills, municipal services and traffic offences. As part of this service, tickets for almost all major sports, cultural and entertainment offerings are offered through Computicket, the country’s largest ticket vendor.
NON-RSA EXPANSIONThe Group continued to expand its operations into Africa and has made great strides in establishing a presence across the continent years ahead of its competitors. It will enter its 17th African country before the end of 2011 with the opening of a Shoprite supermarket in the business district of Kinshasa in the Democratic Republic of Congo. The expansion programme in Nigeria is on track, with four Shoprite supermarkets scheduled to open during the next year and a great many other opportunities are also currently being investigated.
New Shoprite supermarkets will also open in Angola, Botswana,
Ghana, Madagascar and Uganda in the new financial year. The Usave chain will also be extending its footprint by opening its first branch in Zambia early in the new financial year as part of a roll-out of six outlets in African countries.
In order to counter the effects of an expensive rand, the Group now imports merchandise for its African operation from many other countries in addition to South Africa. At the same time, management is continuously trying to convince South African manufacturers to establish operations in the countries where the Group does business.The Group’s challenge is to remain at the forefront of food retailing on the continent. It meets this challenge by identifying and obtaining choice locations in cities and countries where it plans to establish or expand its presence; by constantly upgrading existing stores to ensure that they continue to represent an exciting shopping experi-ence, or by moving them to new locations where they are closer to the heart of developing city centres.
FURNITURE DIVISIONThe Furniture Division, which operates three chains – House & Home, OK Furniture and OK Power Express – experienced a difficult trading year. Retailers had to contend with deflation of on average 15.7% in home entertainment and appliance products.
In spite of these adverse conditions, the furniture division increased turnover by consistently pricing its product ranges very competitively and by increasing the number of direct imports, which not only kept it competitive, but also provided a better profit margin. Of the three chains, the two targeting the lower to middle income
17

Chief Executive’s Report (continued)
market – OK Furniture and OK Power Express – showed the strongest relative growth. The results of House & Home, which reported a drop in turnover, largely reflect the financial difficulties of its higher income market. Total turnover was at R3,060 billion – 1.9% above 2010; while trading profit, at R131 million was marginally above that of the previous year.
The division continued to grow strongly in terms of new outlets. In the year to June 2011, a net 20 new stores were added – 16 under the OK Furniture brand, three House & Homes and one for OK Power Express to bring the total number of stores to 300, of which 30 are outside the borders of South Africa. OK Furniture is by far the domi-nant brand, with 232 of the 300 stores trading under this name.
OK FRANCHISEThe franchise division of the Group uses the Group’s supermarket procurement capacity to offer franchisees competitive prices coupled with the resources and skills to provide their customers with a viable shopping experience.
It was a trying time for all the division’s members who are inde-pendent traders doing business all over South Africa and Namibia, as well as in Botswana. Because of their dependence on a single store, they are vulnerable to any downswing in the economy. A highly competitive environment, low food inflation, and steep increases in input costs placed a strain on members’ profitability.
The OK Franchise Division (OKFD) increased turnover by 7.8%, while operating profit grew due to overhead costs lagging the growth in income. A major development during the reporting period was the
offer made for Metcash’s franchise division, which will provide OKFD with a further platform to grow its business and franchisees, repre-senting some two years of organic growth without altering its risk profile. The transaction was ratified by the Competition Authority after year-end and will see some 150 members added to OKFD, albeit with a smaller turnover base for the majority of those compared to existing OKFD franchises.
ACKNOWLEDGMENT It has always been an honour for me to lead a team so dedicated and so set on success as the management and staff of the Shoprite Group. With some I have worked for many years; others are new to the team, but together they share the same ideal: to be the best, however difficult the times may be. This frame of mind stood them in good stead during the past financial year, which presented them with many challenges, all of which were tackled with a will to win. My grateful thanks go to all of them.
Whitey BassonChief Executive Officer
26 August 2011
SHOPRITE HOLDINGS LTD INTEGRATED REPORT 2011
18

Five-year Financial ReviewShoprite Holdings Ltd and its Subsidiaries
June June June June June2011 2010 2009 2008 2007
R’000 R’000 R’000 R’000 R’000
STATEMENT OF COMPREHENSIVE INCOMESale of merchandise 72 297 777 67 402 440 59 318 559 47 651 548 38 949 845
Trading profit 3 986 697 3 490 441 2 940 914 2 296 550 1 597 692 Exchange rate (losses)/gains (446) (77 824) 3 005 33 187 23 725 Items of a capital nature (78 533) (25 580) (31 227) 6 756 60 935
Operating profit 3 907 718 3 387 037 2 912 692 2 336 493 1 682 352 Interest received 94 614 105 741 191 566 183 915 109 332 Finance costs (125 964) (93 690) (86 142) (59 149) (83 570)
Profit before income tax 3 876 368 3 399 088 3 018 116 2 461 259 1 708 114 Income tax (1 346 826) (1 111 792) (999 478) (875 570) (622 586)
Profit for the year 2 529 542 2 287 296 2 018 638 1 585 689 1 085 528
STATEMENT OF FINANCIAL POSITIONASSETSProperty, plant and equipment 8 168 749 6 577 677 5 359 587 4 502 928 3 804 159 Other investments 63 964 65 942 50 440 41 604 67 728 Deferred income tax assets 326 457 288 677 277 951 248 614 252 749 Intangible assets 719 105 611 037 354 434 319 825 277 901 Current assets 11 416 236 10 442 805 10 690 843 9 733 319 7 476 005 Fixed escalation operating lease accrual 9 246 5 559 6 233 7 993 1 131
TOTAL ASSETS 20 703 757 17 991 697 16 739 488 14 854 283 11 879 673
EQUITY AND LIABILITIESCapital and reserves 7 084 700 5 904 832 4 960 000 4 758 656 3 639 181 Non-controling interest 58 750 67 184 69 295 60 182 49 590
Permanent capital 7 143 450 5 972 016 5 029 295 4 818 838 3 688 771 Interest-bearing borrowings 49 755 40 448 30 727 22 899 2 498 Other liabilities 13 510 552 11 979 233 11 679 466 10 012 546 8 188 404
TOTAL EQUITY AND LIABILITIES 20 703 757 17 991 697 16 739 488 14 854 283 11 879 673
STATISTICS PER ORDINARY SHARE AND FINANCIAL RATIOSNet asset value per share (cents) 1 399,8 1 166,7 990,2 938,0 717,3 Earnings per share (cents) 495,9 450,1 396,5 309,5 212,1 Headline earnings per share (cents) 507,6 455,4 401,1 309,9 201,6 Diluted headline earnings per share (cents) 507,6 451,6 390,8 298,6 193,8 Dividend per share (cents) 253,0 227,0 200,0 155,0 101,0 Dividend cover (based on headline earnings) (times) 2,0 2,0 2,0 2,0 2,0 Trading margin (%) 5.51 5.18 4.96 4.82 4.10Headline earnings on average total permanent capital (%) 39.2 41.7 41.1 37.0 30.2 Inventory turn (times) 8,8 8,9 8,9 9,1 8,9
DEFINITIONSTrading margin: Trading profit expressed as a percentage of sales.Inventory turn: Cost of merchandise sold, divided by the average of inventories at the beginning and the end of the financial year.Headline earnings: Profit before items of a capital nature, net of income tax.
19
Financial Report
STATEMENT OF COMPREHENSIVE INCOME
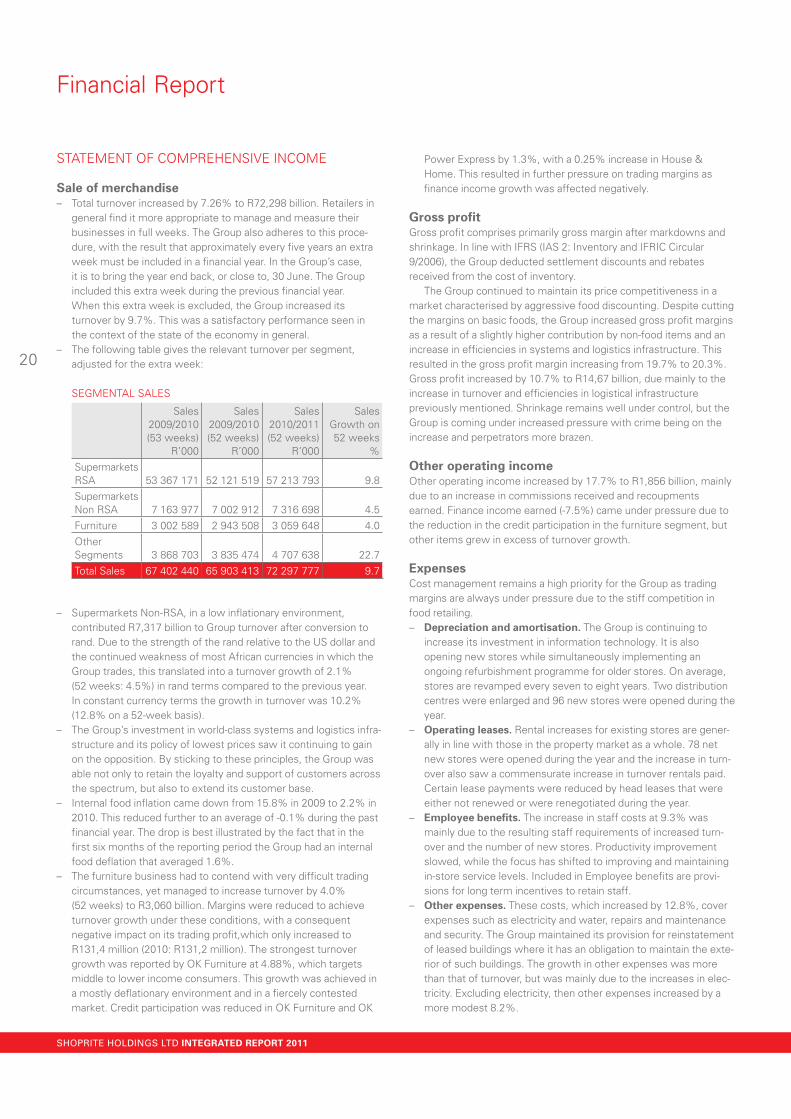
Sale of merchandise– Total turnover increased by 7.26% to R72,298 billion. Retailers in
general find it more appropriate to manage and measure their businesses in full weeks. The Group also adheres to this proce-dure, with the result that approximately every five years an extra week must be included in a financial year. In the Group’s case, it is to bring the year end back, or close to, 30 June. The Group included this extra week during the previous financial year. When this extra week is excluded, the Group increased its turnover by 9.7%. This was a satisfactory performance seen in the context of the state of the economy in general.
– The following table gives the relevant turnover per segment, adjusted for the extra week:
SEGMENTAL SALES
Sales2009/2010(53 weeks)
R’000
Sales2009/2010(52 weeks)
R’000
Sales2010/2011(52 weeks)
R’000
Sales Growth on 52 weeks
%Supermarkets RSA 53 367 171 52 121 519 57 213 793 9.8SupermarketsNon RSA 7 163 977 7 002 912 7 316 698 4.5Furniture 3 002 589 2 943 508 3 059 648 4.0OtherSegments 3 868 703 3 835 474 4 707 638 22.7Total Sales 67 402 440 65 903 413 72 297 777 9.7
– Supermarkets Non-RSA, in a low inflationary environment, contributed R7,317 billion to Group turnover after conversion to rand. Due to the strength of the rand relative to the US dollar and the continued weakness of most African currencies in which the Group trades, this translated into a turnover growth of 2.1% (52 weeks: 4.5%) in rand terms compared to the previous year. In constant currency terms the growth in turnover was 10.2% (12.8% on a 52-week basis).
– The Group’s investment in world-class systems and logistics infra-structure and its policy of lowest prices saw it continuing to gain on the opposition. By sticking to these principles, the Group was able not only to retain the loyalty and support of customers across the spectrum, but also to extend its customer base.
– Internal food inflation came down from 15.8% in 2009 to 2.2% in 2010. This reduced further to an average of -0.1% during the past financial year. The drop is best illustrated by the fact that in the first six months of the reporting period the Group had an internal food deflation that averaged 1.6%.
– The furniture business had to contend with very difficult trading circumstances, yet managed to increase turnover by 4.0% (52 weeks) to R3,060 billion. Margins were reduced to achieve turnover growth under these conditions, with a consequent negative impact on its trading profit,which only increased to R131,4 million (2010: R131,2 million). The strongest turnover growth was reported by OK Furniture at 4.88%, which targets middle to lower income consumers. This growth was achieved in a mostly deflationary environment and in a fiercely contested market. Credit participation was reduced in OK Furniture and OK
Power Express by 1.3%, with a 0.25% increase in House & Home. This resulted in further pressure on trading margins as finance income growth was affected negatively.
Gross profi tGross profit comprises primarily gross margin after markdowns and shrinkage. In line with IFRS (IAS 2: Inventory and IFRIC Circular 9/2006), the Group deducted settlement discounts and rebates received from the cost of inventory.
The Group continued to maintain its price competitiveness in a market characterised by aggressive food discounting. Despite cutting the margins on basic foods, the Group increased gross profit margins as a result of a slightly higher contribution by non-food items and an increase in efficiencies in systems and logistics infrastructure. This resulted in the gross profit margin increasing from 19.7% to 20.3%. Gross profit increased by 10.7% to R14,67 billion, due mainly to the increase in turnover and efficiencies in logistical infrastructure previously mentioned. Shrinkage remains well under control, but the Group is coming under increased pressure with crime being on the increase and perpetrators more brazen.
Other operating incomeOther operating income increased by 17.7% to R1,856 billion, mainly due to an increase in commissions received and recoupments earned. Finance income earned (-7.5%) came under pressure due to the reduction in the credit participation in the furniture segment, but other items grew in excess of turnover growth.
ExpensesCost management remains a high priority for the Group as trading margins are always under pressure due to the stiff competition in food retailing.– Depreciation and amortisation. The Group is continuing to
increase its investment in information technology. It is also opening new stores while simultaneously implementing an ongoing refurbishment programme for older stores. On average, stores are revamped every seven to eight years. Two distribution centres were enlarged and 96 new stores were opened during the year.
– Operating leases. Rental increases for existing stores are gener-ally in line with those in the property market as a whole. 78 net new stores were opened during the year and the increase in turn-over also saw a commensurate increase in turnover rentals paid. Certain lease payments were reduced by head leases that were either not renewed or were renegotiated during the year.
– Employee benefits. The increase in staff costs at 9.3% was mainly due to the resulting staff requirements of increased turn-over and the number of new stores. Productivity improvement slowed, while the focus has shifted to improving and maintaining in-store service levels. Included in Employee benefits are provi-sions for long term incentives to retain staff.
– Other expenses. These costs, which increased by 12.8%, cover expenses such as electricity and water, repairs and maintenance and security. The Group maintained its provision for reinstatement of leased buildings where it has an obligation to maintain the exte-rior of such buildings. The growth in other expenses was more than that of turnover, but was mainly due to the increases in elec-tricity. Excluding electricity, then other expenses increased by a more modest 8.2%.
SHOPRITE HOLDINGS LTD INTEGRATED REPORT 2011
20

Trading profi tTrading margins increased from 5.18% to a record level of 5.51%, due to an increase in gross margins and expenses that were well managed over the period.
Foreign exchange differencesAs stated in the accounting policies, the balance sheets of foreign subsidi-aries are converted to rand at closing rates. These translation differences are recognised in equity in the foreign currency translation reserve (FCTR). In essence, most foreign exchange differences in the income statement are due to US dollar denominated short-term loans of operations outside South Africa and balances in US dollar held in offshore accounts.
During the year the strong rand prevailed – while the currencies of some of the countries in Africa where the Group does business weakened against the US dollar, the rand held firm. The result was a smaller currency loss of R0,446 million compared to a currency loss of R77,8 million in the previous financial year.
The table below gives the approximate cost of a unit of the following major currencies at year-end:
2008 2009 2010 2011
USA dollar 7.956 8.02 7.745 6.7697
Euro 12.516 11.2511 9.674 9.82511
Zambia kwacha 0.003 0.0015 0.0015 0.001403
Angolan kwanza 0.103 0.1033 0.0834 0.07274
Mozambique metical 0.321 0.2976 0.2245 0.2394
Nigerian naira 0.054 0.0541 0.0518 0.0444
Net interest paidThe Group utilises overnight call facilities for both short-term deposits and borrowings. As in the past, the Group funded all capital projects utilising short-term borrowings and cash reserves. During the current financial year interest received turned from a net interest received of R12m into net interest paid of R31,3m, due to the increase in capital expenditure and the reductions in interest rates. As stated else-where, the Group has embarked on a major drive to increase capacity in its distribution centres. As at year end the capacity in both Centurion and Brackenfell Centres has virtually doubled.
Income tax expenseThe effective income tax rate is higher than the nominal income tax rate due to certain non-deductible expenses, such as leasehold improvements, as well as income tax losses in certain non-RSA countries that cannot be utilised for Group purposes. The income tax expense includes an amount of R121,7 million in respect of secondary tax on companies.
Diluted headline earnings per shareDiluted headline earnings per share increased by 12.4% from 451,6 cents to 507,6 cents and result mainly from the turnover growth of 7.26%; an increase in trading profit of 14.2% and the decrease in exchange rate losses. This was a satisfactory performance consid-ering the extra week included in the previous year.
STATEMENT OF FINANCIAL POSITION
Non-current assets
PROPERTY, PLANT AND EQUIPMENT AND INTANGIBLE ASSETSDuring the year the Group spent R3,005 billion on property, plant and equipment and software compared to R2,509 billion in 2010. The Group is also continuing with its policy to purchase vacant land for strategic purposes and building retail premises when no developers can be found. During the year the Group spent R937 million on such land and buildings. The investment in refurbishments amounted to R361 million, while R610 million was spent on new stores (excluding land and buildings), R374 million on information technology and the balance on normal replacements. The Group is in the process of upgrading its merchandising, master data and central stock ledger systems. This will be continuing into the next financial year. Capital commitments of R1,344 billion have been made relating to these improvements for the next financial year.
Intangible assets consist mainly of goodwill paid for acquisitions, trademarks acquired and software. Goodwill represents the premium paid for certain businesses and is tested for impairment annually based on the value-in-use of these businesses, calculated by using cash flow projections. The last major addition was due to the purchase of the Transpharm Group in December 2009.
Software represents the Group’s investment in certain computer software that is used in its daily operations. The Group continued to investment in new SAP software. Software is amortised over its useful life of three to seven years.
Trademarks represent the purchased Computicket and Transpharm trademarks and is amortised over 20 and 16 years respectively.
AVAILABLE-FOR-SALE-INVESTMENTS100 “S” class ordinary shares in RMB Global Solutions (Pty) Ltd valued at R60 million. This represents the Group’s investment in an international treasury system that is utilised by the Group in its international trade.
LOANS AND RECEIVABLES13 500 000 redeemable, convertible (both under certain conditions, such as achieved levels of profitability), cumulative preference shares in Pick & Buy Ltd, a retailing supermarket group in Mauritius, valued at R33 million. These shares were acquired as part of a reciprocal arrangement with the owners of Pick & Buy Ltd, who in turn invested in the Group’s subsidiary in Mauritius. Pick & Buy has since divested from said subsidiary.
The balance consists mainly of amounts owing by franchisees for franchises and fixture and fittings sold to them.
DEFERRED INCOME TAX ASSETSDeferred income tax is provided, using the liability method, for calculated income tax losses and temporary differences between the income tax bases of assets and liabilities, and their carrying values for financial reporting purposes. This asset developed primarily from provisions created for various purposes, as well as the fixed escalation operating lease accrual.
21

Current assets
INVENTORIESInventories amounted to R7,06 billion, an increase of 15% on the previous year. The inventory turn, based on sales of merchandise, was 11,0 times (2010: 11,1 times) and, based on cost of sales, 8,8 times (2010: 8,9 times). The increase in inventory resulted mainly from the following:– the provisioning for a net 78 new stores;– further growth in the business of Transpharm, the wholesale
pharmaceutical operation; and– the extension to the DC in Centurion.
TRADE AND OTHER RECEIVABLESTrade and other receivables represent mainly instalment sale debtors, franchise debtors, buy-aid societies and rental debtors. Adequate allowance is made for potential bad debts and the outstanding debtor’s book is reviewed regularly.
The allowance for impairment and unearned finance income in respect of instalment sale debtors amounted to 13.87% compared to 13.7% the previous year. This minimal increase was made possible by the quality of the book.
ASSETS HELD FOR SALECertain land and buildings are classified as assets held for sale, as the Group is currently in the process of actively seeking buyers for these properties. This is in line with the Group’s policy of only investing in fixed property when appropriate rental space is not available.
CASH AND CASH EQUIVALENTS AND BANK OVERDRAFTSNet cash and cash equivalents amounted to an overdraft of R81 million at year-end, compared to R1,3 billion positive balance in 2010. The reduction was mainly due to the following:– capital expenditure, mainly on land and buildings, of R3 billion; and– the 53rd week included in the Group’s results in the previous year
has resulted in the Statement of Financial Position date moving to after the calendar month-end, causing certain 30-day term credi-tors to be paid before year end.
Current liabilities
PROVISIONSAdequate provision is made for post-retirement medical benefits, reinstatements, onerous lease contracts, long-term employee benefits and all outstanding insurance claims. The Group has settled a major portion of the post-retirement medical liability in the previous financial year. The remaining liability relates to mainly pensioners and will be settled during the next financial years.
CREDIT SALESThe Group continued to supply credit facilities as part and parcel of its furniture business. The management and administration of this debtor’s book is done in-house, as the granting of credit is deemed an integral part of selling furniture.
SHOPRITE INSURANCEThe Group operates its own short-term insurance company as part of the furniture business. During the year under review, net premiums earned amounted to R257 million compared to R228 million the previous year. As in the past, the Group accounts for premiums earned and extended guarantee fees over the life of the policy. In South Africa, insurance premiums are invoiced and earned on a monthly basis. This is in line with the National Credit Act.
The following provisions are made on an annual basis:– Outstanding claims payable = average of actual claims
outstanding for the relevant periods– Contingency reserve = 10% of net premiums whereas premiums
are earned as per the following formula: • Premiums earned = Net premium x expired period • Premiums unearned = Net premium x unexpired period.
At year end the insurance company had a solvency margin of 76% (2010: 69%) compared to the minimum requirement of 15% as per the Insurance Act.
Financial Report (continued)
SHOPRITE HOLDINGS LTD INTEGRATED REPORT 2011
22

Non-Financial Report
EMPLOYEES
Remuneration policyIt is the Group’s objective to provide a level of remuneration that will attract, develop, retain and motivate its employees to implement and execute its strategy in a highly competitive business environment. The Group places a very strong emphasis on “pay for performance”, as is evident in the short and long-term incentive schemes that form an integral part of the remuneration package of all executive and managerial employees. These incentive schemes seek to align the Group’s business strategy with those of its shareholders.
The remuneration packages of executives and management consist of the following components:– guaranteed pay, which consists of a cash salary and certain
benefits, amongst others a provident fund that provides for retirement, death and disability and medical aid;
– short-term incentive scheme; and– long-term incentive schemes where applicable.
Total annual remuneration consists of guaranteed pay and short-term incentives. In order to attract talent the Group aims to set the total remuneration of executives at a competitive level in the market in which it competes. Due to the size of the group, its multiple brands and its extensive footprint on the African continent, the total remu-neration of executives are benchmarked at the upper quartile values of the South African remuneration surveys used for this purpose. As variable remuneration in the form of short-term incentives comprises a substantial portion of the executives’ total remuneration package, the benchmarked values aimed for will only be attained once the targets as set out in the short-term incentive scheme are fully met.
Reviews are performed annually to benchmark the Group’s remuneration against the market. Executive positions are also evaluated frequently. Independent remuneration consultants (mainly PwC Remchannel) are utilized to perform the above reviews and benchmarking exercise.
The remuneration for management and other employees who are not included in the collective bargaining units are performance driven.
Collective wage increases are negotiated with the representative trade unions for all employees included in the collective bargaining units.
Guaranteed payAll employees falling outside the collective bargaining units receive guaranteed pay, which is based on the nature of their respective roles, the market value thereof and the individuals’ personal perform-ance. Annual increases in the guaranteed pay are determined by personal performance and competence, company performance and expected increases in the South African and other markets, as well as movements in the CPI during the preceding twelve months.
Short-term incentive schemeExecutives and management participate in the short-term incentive scheme, that runs over the financial year of the group. This is a self-funding scheme, as the value of the on-target bonus is included in the annual budget and is provided for in the financial statements.
The criteria for the scheme are based on financial measures and contain targets for budget achievement and growth on the previous year. Each participant is measured against his specific area of respon-
sibility. Various weightings are also included in the criteria to encourage participants to maximize their role and functionality.
During the year under review, executives could earn an average of 35% and management 19% of their total package in the form of a short-term incentive bonus.
The scheme also makes provision for stretch targets above the annual budgets set. In exceptional cases participants can earn up to 150% of their on-target maximum incentive. Likewise no incentive will be payable if none of the performance criteria are met.
Long-term incentive schemesThree long-term incentive schemes are offered to executives and senior management, namely a share appreciation rights scheme, a virtual option bonus scheme and a long-term incentive bonus scheme.
Share appreciation rights schemeThe share appreciation rights scheme was introduced during 2007 and is dependent on the performance of the share price of Shoprite Holdings Ltd. The share appreciation rights vest equally over a period of three, four and five years (2010 to 2012). The basis for calculation is the difference between the share price at the date of the exercise of the rights and the settlement date. The number of shares on which the rights are based, as well as the dates of issue and issue prices, are set out in the notes to the Group’s financial statements.
Virtual option bonus schemeThe virtual option bonus scheme was introduced in 2007 and operates on a notional capital amount, which is allocated to partici-pants. Subject to certain provisos, a bonus is determined each year by multiplying the capital amount allocated with the percentage growth in the operating profit of the group. The bonus determined as such vests equally over a three-, four- and five- year period.
Long-term incentive bonus schemeThe long term incentive bonus scheme was introduced in 2007. Participants are measured on the same criteria which is applicable for the short-term incentive scheme. The bonus determined as such vests equally over a three-, four- and five- year period.
DiversityEmployees are the backbone of any business, and a stable, skilled and committed workforce is critical to business success. In the wholesale and retail industry – which is challenged by high turnover rates and a skills shortage – it is especially important to manage employees carefully, ensuring that the right people are employed and remain invested in the company. The most salient features of the group effort to effectively manage its workforce comprise of:– diversity and inclusion;– attracting and retaining talent;– developing and training employees;– organised labour; and– HIV/Aids.
The Group is focused on improving the quality and decreasing the quantity of its recruitment activities, while remaining committed to equality and non-discrimination in the recruitment process. A work-force that is representative of the communities it serves is the ultimate goal, as the Group believes that this will aid the success of the business long term.
23

Non-Financial Report (continued)
PERCENTAGE OF TRAINING SPEND ON PDIs
95
94
93
92
91
90
2009 2010 2011
94.26
93.59
91.95
New recruitment systems have been developed and implemented at head office in order to improve and streamline the talent pipeline, with a focus on previously disadvantaged individuals (PDIs) and people with disabilities. In the last year, there has been a 10% increase in the size of the South African employee base, with an almost 3% improvement of overall PDI representation within top management. In terms of employment equity, the Group is on track to achieve its numerical goals for the current plan period (2010 to 2015) and continues to outperform the rest of the wholesale and retail sector.
RetentionRetention strategies are constantly evolving in consultation with employees. Internally, care is taken to ensure that employees at all levels are well provided for. The Group boasts a relatively low turnover – 14.9% for full-time employees compared with the retail industry norm of 20-25% – which is viewed as a robust indicator of overall staff satisfaction.
TrainingTraining and career development form part of the employee retention and succession planning strategies, and the Group spent 2.7% of payroll on training in the period under review. There have been significant changes to the Sector Education and Training Authority landscape over the last two years, and the National Skills Development Strategy (NSDS) III has been implemented.
The Group has been aligning its Skills Development Strategy with the NSDS III. Continuous development is promoted and the Group offers a number of training programmes recognised by the National Qualifications Framework (NQF), focussing on the development of scarce and critical skills that will give the business a competitive edge. Five hundred and twenty learners were placed on various Learnerships (for 12 months) and 613 learners on skills programmes (for 2 months). The Group is committed to employing 90% of successful candidates after completion of their learning. Funding of university bursaries for scarce and critical skills totalled R9.3 million.
There is also a focus on disability training to enhance diversity, and 33 hearing-impaired learners participated in various skills programmes leading up to an NQF Level 2 operations qualification. Free grants are also made available to lower income employees and their dependents (for school and tertiary studies) through the Group’s Educational Trust.
Employee unionsJust over one third of the Group’s staff members in South Africa (36.5% of non-management staff) are represented through employee unions and collective bargaining structures. An agreement with Uni Global Union (an organisation representing over 900 unions world-wide) was recently signed. This agreement is a commitment to global standards on labour relations, and aims to create a forum for social dialogue between the group and the unions within all countries of operation. The Group works closely with the unions in South Africa, utilising some innovative strategies to maintain good relations.
HealthAn actuarial evaluation estimated a 17.8% HIV infection rate amongst group employees. This is a serious issue, which the Group approaches through a number of healthy living campaigns targeted at staff. A voluntary counselling and testing programme has been launched, and qualified nurses and doctors are available to staff through the Group’s HIV/Aids Call Centre. The Group aims to test 25 000 employees in the coming year.
REMUNERATION OF DIRECTORSEmoluments paid to directors and alternate directors of the Shoprite Group during the year ended June 2011 and comparatives for the previous year are set out on page 79 of the Group’s financial statements.
STAFF REPRESENTATION
20.5%
70.9%
5.4%
3.2%
African
Coloured
Indian
White and foreign
2011 2010
Total permanent (SA) 83 867 76 318
% black representation 94.67 94.47
STAFF TURNOVER
16
15
14
2009 2010 2011
14.5
15.5
14.9
SHOPRITE HOLDINGS LTD INTEGRATED REPORT 2011
24

CUSTOMERSRetail customers tend to have a wide choice enabling them to shift quickly between one retailer and the next. To foster a loyal customer base and achieve customer service excellence, the Group endeavours to satisfy the changing needs of customers. It does this by combining the best technology with sensitivity to customer expectations and consumer trends. A number of customer issues are now governed by the new Consumer Protection Act (CPA), which prescribes the rights of consumers and increases the level of protection across the Board. The most pressing issues adopted by the Group to ensure a satisfied customer base are: – customer needs and service levels;– food and product safety; and– responsible credit provision.
In the past, responsibility for faulty products and related customer grievances was placed squarely on the shoulders of the manufac-turer. The CPA now divides this responsibility between both the manufacturer and the retailer. The Group’s policy includes the nine key consumer rights identified by the CPA. To support this change, the Group launched a compulsory CPA Awareness Training Campaign in the supermarket environment in April 2011.
The Group aims to ensure that all customers are satisfied and their reasonable expectations are accommodated. Customer-facing staff members are provided with customer service training. In the period under review, the number of customer service training inter-ventions more than doubled, reaching 40 516. Of these, 17 412 involved initiation into the CPA.
Customer feedback, received through a variety of different avenues and media is viewed as an opportunity to gather first-hand customer knowledge and enables an immediate response to customer needs. A new Customer Feedback System, based on inter-nationally developed technology, has been installed. This will give the Group access to more intelligent customer experience data in order to better respond to potential problem areas.
The CPA applies to a range of issues, including food safety and product labelling. The Group has therefore allocated considerable time and resources to the implementation of a robust Food Safety Management System (FSMS), including a policy for both internal use and suppliers. Product recall processes and stock rotation disciplines are in place.
Customer satisfaction through price leadership is the top priority
for the Group’s business. This and its smaller low-cost retail model, Usave, which caters for smaller, economically disadvantaged commu-nities, is aligned with the CPA’s requirement that services be made available to marginalised and underserved markets.
Lower income consumers in particular need to be protected against reckless lending. Credit is only offered to customers of the three furniture chains. The Group’s credit offering is aligned with the provisions of the National Credit Act (NCA), and applications are processed using more than 25 granting policies to determine a customer’s eligibility for credit.
SUPPLIERSThe Group aims to develop a base of suppliers that are responsible, loyal and reliable, founding these relationships on open and honest communication. Suppliers that are not compliant with basic human rights and environmental standards place the Group’s reputation at risk, and impact negatively on the health of the environment and affected communities. The Group aims to develop its suppliers and they are therefore the focus of its enterprise development initiatives, which are closely linked to preferential procurement initiatives. The most material issues relating to suppliers are:– supplier relationships;– preferential procurement; and– enterprise development.
All suppliers are subject to a contractual agreement providing a platform for monitoring and managing each relationship. The Group follows international best practice in terms of orders and supplier account management, using electronic data exchange systems to manage supplier issues. In the period under review, new packaging legislation was one of the main subjects of engagement. Education and assistance are being provided to the Group’s suppliers within South Africa and across Africa, where bar coding is being developed and improved.
Freshmark maintains growing programmes for each of its 456 local suppliers annually, most of whom enjoy a long-term, close rela-tionship with the Group. Farmers’ Days were held in all provinces in South Africa (as well as in Zambia), where supply performance and operational issues were discussed and produce category perform-ance was analysed.
Meat Market currently has 274 registered meat suppliers, all of whom have been visited and approved by the relevant divisional managers prior to being selected.
In the coming year, two workshops on food safety standards will be held with suppliers in all major centres, and an electronic guideline on implementing minimum food safety standards will continue to be distributed to all small suppliers.
CUSTOMER SERVICE TRAINING
45 000
40 000
35 000
30 000
25 000
20 000
15 000
10 000
5 000
0
2010 2011
17 412
Number of CPA-related training interventions
Number of training interventions
40 516
17 841
CREDIT – PERCENTAGE OF ACCOUNTS NOT IN ARREARS
100.0%
50.0%
0.0%
South Africa Shoprite average
84.0%53.6%
25

Non-Financial Report (continued)
By supporting local suppliers, the Group makes a substantial contribution to the transformation of the South African economy. The Group therefore allocates time and resources to enterprise development within its own supply chain in order to create a stable and sustainable supplier base. The Group spent more than 2% of its net profit after tax (NPAT) on enterprise development initiatives in the period under review.
The R65 million Shoprite Development Trust was initiated to further target the Group’s substantial Corporate Social Investment (CSI) financial contributions. This Trust targets enterprise develop-ment through the Group’s property developments and is aimed at facilitating the ownership of the Group’s developments or properties by economically disadvantaged entrepreneurs and community organisations.
The Group is committed to supporting black suppliers, and aims to assist small, medium and micro-enterprises (SMME’s) to become efficient suppliers. B-BBEE performance forms part of the supplier selection criteria and preference is given to black female suppliers. This strategy assists in the identification of new supply opportunities and efficiencies. The Group’s Code 600 Preferential Procurement spend for the period under review was R37,1 billion.
The Group aims to extend its strategic goals of rural economic development and local economic development into marginalised communities with the knowledge and assistance of the independent trustees of the Shoprite Development Trust. The Group also intends to actively seek out co-operative ventures with government and other entities, improving the status and stability of its preferential procure-ment successes.
COMMUNITIESA business does not function in isolation from the communities it operates in and these communities also have an impact on the business. In particular in the retail space, good community relations can enhance the sustainability of the Group’s profit line. The Group makes its CSI contributions with specific focus on women, children and senior citizens.
SHOPRITE MOBILE SOUP KITCHENS – SERVINGS OF SOUP AND BREAD
2007 – 2010
2011
4 488 971
3 278 423
SHOPRITE HOLDINGS LTD INTEGRATED REPORT 2011
26

In the period under review, the Group spent more than 1% of its NPAT on corporate social investment projects. A successful new initiative involved the Group partnering with the Western Cape Police during December 2010 to help combat crime through various campaigns. Due to the success of the partnership this project has also been rolled out in Gauteng.
Shoprite Mobile Soup Kitchens is an ongoing initiative the Group is very proud of. In the period under review, 3 278 423 servings of soup and bread were distributed largely to children, senior citizens, and people affected by job losses and disasters countrywide, bringing the total since launch in February 2007 to 7 767 394. This is a dramatic increase compared to the first three years and was made possible by an increase in the truck fleet.
Other significant projects include The Shoprite Checkers Women of the Year Awards (which awards R130 000 to one exceptional woman in each of five different social development categories), and The Shoprite Community Network (which provides approximately R1.2 million per year in support of organisations that are making a difference in their communities).
ENVIRONMENTThe Group depends on the environment for all its resources, either directly (for fresh produce) or indirectly (for processed materials and energy). The Group recognises that degradation of the environment will undermine its ability to produce resources cost effectively and is therefore paying attention to this issue. While the Group endeavours to consider its environmental impacts in all areas, four key aspects are reported on:– electricity consumption;– fuel consumption;– packaging and recycling; and– carbon disclosure.
As almost 90% of South Africa’s electricity is coal-generated, electricity consumption results in a number of externalised effects, including pollution and the release of carbon dioxide (CO2) into the atmosphere. In addition, the country’s electricity supply is subject to rapidly rising costs as capacity is increased. The Group adopts a holistic approach to managing electricity consumption and is in the process of establishing a programme to continually measure, monitor and report on electricity consumption in supermarkets. Energy efficient initiatives are being assessed and a number of these have been implemented in our supermarkets. Systems have also been put in place to enable the optimisation of the cold chain.
Transportation constitutes a significant part of the retail industry, where moving large quantities of produce is a daily requirement. Road transport relies on fossil fuel, which is growing scarcer and more costly. Fuel is also a significant contributor to air pollution. The Group explores and evaluates all technologies and processes available for reducing fossil fuel use across the entire supply chain and has adopted a centralised distribution approach in line with international best practice.
Transporting produce requires large quantities of packaging resulting in waste. The Group supports the National Environmental Waste Act of 2008 principle of waste avoidance first, followed by reduction, re-use and recycling where possible. The Group aims to reduce the use of one-way packaging by purchasing and imple-menting re-usable packaging equipment. Ways to recycle materials and reduce landfill contribution are constantly being assessed, and the Group also collaborates with suppliers to implement new packaging initiatives. A reclamation centre in Centurion is in the pilot phase and will enable central management of damaged products and waste, in accordance with international best practice.
Electricity and fossil fuel consumption and the production of waste all contribute to emissions responsible for climate change. The Group has begun the journey of accounting for its impacts by responding to the Carbon Disclosure Project (CDP) for the first time in the period under review. A number of measurement systems and protocols have been developed and implemented to enable the Group to perform a comprehensive assessment of its carbon foot-print. Scope 2 emissions for the year under review was estimated at 1 079 659 metric tonnes of carbon dioxide equivalent (CO2e).
The Group’s supply chain strategy and structures provide the business with a competitive advantage. The focus on supply chain efficiency will continue, in parallel with the responsible management of health, safety and environmental impacts such as carbon emis-sions and waste management. This holistic approach to supply chain management will assist the Group in retaining a competitive edge as future challenges are encountered and addressed.
SOUTH AFRICA’S ENERGY SUPPLY MIX IN 2010
Hydrocarbon
Renewable
Nuclear
Pumped storage
Other86.5%
1.0%
3.6%
4.1%
4.8%
27

The Shoprite Group is proud to recognise
suppliers for their unstinting support and collaborative approach toward our business over the past year.
Supplier of the Year Award Winners
HOUSEBRAND/PRIVATE LABELS
Chet Chemicals
Mervyn Kessler (left), Chief Executive Officer and Nico van der Merwe, Sales Director
Chet Chemicals (Pty) Ltd was established by the Kessler family in 1969. The company manufactures a full range of laundry, household cleaners, and bath additive products as a house label manufacturer. The family business has evolved and is now a member of Liberty Star Consumer Holdings, a B-BBEE F.M.C.G. group of companies.
Its manufacturing facility and distribution centre is located in Kempton Park, Gauteng, South Africa, from where it services the national market. The manufacturing unit produces some 500 metric tons of powders and liquids per day.
Standing as the Shoprite and Checkers character witness, quality complete and on-time service is continuously top of mind. Chet’s new product development capability has enabled it to continue to roll out quality substitutes at the right price to targeted market leaders.
The company has been extremely privileged and is proud to be involved in the Shoprite Group’s housebrand programme, for which we now manufacture some 120 products under Ritebrand, Checkers Housebrand and confined labels for the Group.
Winning the award as the Shoprite Group’s housebrand Supplier of the Year 2010 has been a real highlight for the Chet operation and we look forward to growing the business into the future.
CEO AWARDSPersianas Properties LtdZambeef Products PLC PERISHABLES AND SERVICE DEPARTMENTSDairyBelle (Pty) Ltd
CONFECTIONERY AND BEVERAGESCadbury SA (Pty) Ltd
AMBIENT GROCERIESUnity Food Products (Pty) Ltd
TOILETRIESUnilever SA (Pty) Ltd
HOUSEBRAND / PRIVATE LABELSChet Chemicals
UPCOMING SUPPLIERSSunningdale Dairy
MEAT MARKETSRoelcor Meat
FRUIT AND VEGETABLESRennie Farms
NON-FOODSPremier Stationery
FURNITUREWhirlpool Home Appliances
CONTRACTORS / SERVICE PROVIDERSConcord Refrigeration (Pty) Ltd
SHOPRITE HOLDINGS LTD INTEGRATED REPORT 2011
28

CONFECTIONERY & BEVERAGES
Kraft Foods
Michael FouchéRegional Account Manager
Kraft Foods is a global powerhouse with an unrivalled portfolio of brands people love. We are also the world’s second largest food company with annual revenues of $49.2 billion.
Following its global acquisition by Kraft Foods in 2010, Cadbury South Africa and Kraft Foods integrated in March 2011 to form Kraft Foods South Africa – a dynamic, diverse and growing FMCG business that participates in the chocolate, candy, gum, biscuits, coffee and grocery categories. Our higher purpose is to make today delicious. Our aspiration is to be the most loved, respected and successful snacking company in Southern Africa.
We are proud of our combined heritage of over 80 years in the South African industry, manufacturing and selling brands people love. Southern Africa is a key market in the emerging markets portfolio of Kraft Foods Inc. and contributes significantly to its growth. With strong brands that resonate with all income groups in this market, we aim to delight our consumers not only with power brands, but also accessible and affordable ones.
As one of the world’s largest food companies, we believe in fighting hunger, promoting healthy lifestyles, sustainable agriculture and ethical sourcing. In a ground-breaking move, Cadbury Dairy Milk Plain has recently been Fair Trade certified. In partnership with Fair Trade, we want to ensure better living conditions for farmers of developing communities through fair prices, community develop-ment and sustainability of produce.
It is an absolute honour to be recognised as one of the Shoprite Group’s Suppliers of the Year. We value immensely the longstanding relationship that we have built with Shoprite over the many years as a legacy Cadbury business and, now as Kraft Foods South Africa, we look forward to a continued strategic partnership.
PERISHABLES & SERVICE DEPARTMENTS
DairyBelle
Brenda McClearyNational Customer Manager
DairyBelle’s origins can be traced back to the 19th century, when South African Cold Storage was first established. In 1902, Cecil John Rhodes and Sir Leander Starr Jameson bought the company and renamed it Imperial Cold Storage (ICS). The products manufactured included ice cream, chocolate, butter and cheese. In 1960, the DairyBelle brand that South Africans have come to know and love was registered for use on a range of dairy products.
The radio jingle “Ding-Dong DairyBelle” gained pop culture status among South African consumers and introduced the new brand,while the distinct orange DairyBelle cow gained popularity and further boosted the brand value.
DairyBelle has built a strong, wholesome brand that continues to provide South Africans with good quality and good value products that include a wide range of cheeses, yoghurt, juice, fresh milk, UHT milk and other dairy products.
Research conducted in 2010 confirmed that DairyBelle has retained substantial equity over the years; however, it highlighted the need to revitalise the brand, the packaging and the portfolio to make it more relevant and modern. In mid-2010 the DairyBelle brand under-went a major revamp of its overall positioning, logo and packaging design, as well as reconceptualizing and organizing its various brands for consistency and focus.
Innovation and an ongoing commitment to supporting the DairyBelle brand are key goals of DairyBelle. The aim is to keep the brand fresh and relevant to meet the changing needs of our consumers.
We are extremely proud of being acknowledged as one of the 2010 Shoprite Group Suppliers of the year
29

Supplier of the Year Winners (continued)
TOILETRIES
Unilever
Peter LamploughCustomer Marketing Director, Home Care
“Our vision is to create a better future in which people can improve their quality of life without increasing their environmental impact” – Paul Polman, CEO, Unilever.
Unilever South Africa is honoured to be acknowledged as a Shoprite Group Supplier of the year once again. It is because of customers like Shoprite that Unilever has been a part of South African consumers’ lives for over 100 years.
At Unilever, we believe that our products make small but important differences to the quality of peoples’ lives. Our strategy is to increase our social impact by ensuring that our products meet the needs of people everywhere for balanced nutrition, good hygiene and the confidence that comes from having clean clothes, clean hair and good skin. To this end, our portfolio ranges from nutritionally balanced foods to indulgent ice creams, affordable soaps, luxurious shampoos and everyday household care products. Our brands include household names like Sunlight, Omo, Knorr, Dove, Pond’s, Rama, Mrs Balls, Sunsilk and Handy Andy.
Unilever also realises that growth at any cost is not viable. To ensure that we achieve our growth ambition, but not at the cost of the planet, we launched the Unilever Sustainable Living Plan (USLP) in 2010.Globally, the USLP sets three overarching targets for 2020:– to help more than a billion people take action to improve their
health and wellbeing; – to halve the environmental footprint in manufacturing and use of
our products; and– to enhance the livelihoods of hundreds of thousands of people as
we grow our business. In South Africa, through our operations and our brands, we plan to address the needs and priorities of the country while contributing to our global targets.
However, we cannot achieve these targets on our own. We will have to work with our partners, including customers such as the Shoprite Group, whose continued support has allowed Unilever to dream big.
UPCOMING SUPPLIERS
Sunningdale Dairy
Pierre van RensburgMarketing Manager
Sunningdale started off as a small dairy farming operation marketing Amasi into the rural areas and townships on the outskirts of King Williams Town in the Eastern Cape of South Africa in the early 90’s. The dairy consisted of 30 Jersey cows, 10 staff members, and an owner-driven “bakkie” to market the product. What was produced, was always sold. Owner Neil van Rensburg, who was both the farmer and the driver, always made sure that all product produced was sold. He was ably assisted in the operations by his wife Sandi.
In a short space of time things developed and towards the late 90’s more products were added, including dairy blend juice and bottled Maas, as opposed to the 50 litres bulk Maas cans that up to then had been a single product line.
The processing operation was soon moved into town, and milk was procured from additional farmers. In 2005, a new processing plant was set up in East London, processing up to 30 000 litres per day. The product range expanded rapidly to include yoghurt and fresh milk and later butter and cheese as well.
Three years later it became necessary to construct a brand new, state-of-the-art processing facility in the East London industrial development zone, with the capacity to process in excess of 200 000 litres of product per day. Completed in 2010, this facility is complemented by a separate cheese and butter plant in Mdantsane and a third factory in Kokstad, in the KwaZulu-Natal province of South Africa.
Today Sunningdale is still a family run operation, with a tightly knit team of staff and a group of milk suppliers. All with the same goal: to
produce market leading quality products and to develop a strong milk producer base and further develop
the people that work for us.
SHOPRITE HOLDINGS LTD INTEGRATED REPORT 2011
30

FURNITURE
Whirlpool South Africa
Stefan EgliManaging Director
ABOUT WHIRLPOOL CORPORATION: Whirlpool Corporation is the world’s leading manufacturer and marketer of major home appliances, with annual sales in 2010 of $18.4 billion, 71,000 employees, and 67 manufacturing and technology research centres around the world. The company markets Whirlpool, Maytag, KitchenAid, Jenn-Air, Amana, Brastemp, Consul, Bauknecht and other major brand names to consumers in nearly every country around the world. Additional information about the company can be found at http://www.whirlpoolcorp.com.
ABOUT WHIRLPOOL EUROPE, MIDDLE EAST & AFRICA (EMEA):With around 12,000 employees, a sales presence in over 30 European countries and manufacturing sites in seven countries, Whirlpool EMEA is a wholly owned subsidiary of Whirlpool Corporation. Whirlpool’s European Operations’ Center is located in Comerio (VA), Italy. For further information on the company, please visit www.whirlpoolcorp.com.
ABOUT WHIRLPOOL SOUTH AFRICA: Established in 1996 with the purchase of KIC, Whirlpool South Africa (WPSA) falls within the Whirlpool EMEA region, with the reporting office in Comerio (VA), Italy. WPSA’s Head Office is based in Bedfordview, in the Gauteng province of South Africa. The manufacturing facility is located in Isithebe, KwaZulu-Natal, and employs approximately 900 people. The company markets Whirlpool and KIC to all of South Africa and selected African countries. While the KIC brand targets the mass market, Whirlpool is an upmarket brand. KIC is simple in its design, but with good quality and satisfies the basic needs when it comes to refrigeration and cooking, while Whirlpool promotes modern design, innovation and energy efficiency. It is with great pride that WPSA stands as one of the Shoprite Group’s Supplier of the Year recipients. For further information, please visit www.whirlpool.co.za.
AMBIENT GROCERIES
Unity Food Products
Mahomed Rayhaaz EssackChief Executive Officer
Unity Food Products commenced operations in March 2002 and has since grown from strength to strength. The company has a proud tradition of producing high quality, pure sunflower cooking oil, and more recently has ventured into producing margarine to expand our range of quality products that has made its way into South African homes.
Unity’s well known oil brand, Helios™, is a permanent fixture in many South African kitchens, and this much loved brand name recently launched a new margarine product as well. The Helios™ brand name is expanding and we aim to make Helios™ a name constantly associated with quality, value, healthy living and solid tradition.
Our range of margarine products includes Ruby™ and Golden Lite™, new margarines to complement our Helios™ brand. Also complementing our consumer brands is Palmfry™, a palmolein oil that is perfect for restaurants, cafeterias and the hospitality industries.
Our business philosophy has always been to stand by our principles, purpose and vision. Our vision is to make Unity Food Products the largest edible oil manufacturer in South Africa with the best quality products. Our guiding principles have guided us to continually act in an ethical manner and to deal fairly with our esteemed customers at all times.
Our ability to continuously offer customers premium brands with excellent value and quality at the right price has become the hallmark of our ongoing desire to bring our valued customers the best every time. In this context, we cannot adequately express and acknowl-edge the tremendous support that have been accorded by the Shoprite Group. Our continuous partnership has indeed grown by leaps and bounds, and to crown it all, to be chosen as 2010 Supplier of the Year in the category for Ambient Groceries is an honour.
THE TRADITION LIVES ON!!!
31

Corporate Governance Report
INTRODUCTIONThe board of directors (“the Board”) of Shoprite Holdings Limited (“Shoprite Holdings” or “Company”) and senior management subscribes to high ethical standards and principles of corporate governance, and recognises that sound governance can benefit long-term equity performance and enhance shareholder value. The Company’s corporate governance system is the cornerstone of its primary objective of creating value for material stakeholders in a sustainable way.
A governance model has been adopted and implemented by the Group through the introduction of specialist disciplines such as risk management, legal and compliance.
CORPORATE GOVERNANCE STATEMENTSouth Africa’s commitment to world class principles and guidelines on corporate governance was cemented with the introduction of the third King Report on Corporate Governance (“King III”) on 1 March 2010. King III was formulated to, amongst others, promote the legislative framework set out in the new Companies Act 71 of 2008 (as amended) (“the Companies Act”) and has therefore become the cornerstone of corporate governance principles. The JSE Listings Requirements requires listed companies to comply with the recommendations of King III.
The Board governs according to the principles of discipline, responsibility, fairness, social responsibility, transparency and accountability of directors to all material stakeholders. These principles are reflected in the group’s business principles, internal controls and policies.
With regard to the financial year under review, the directors of Shoprite Holdings believe that it complied with all the significant requirements of King III. In instances where we do not comply, this is stated and explained.
BOARD OF DIRECTORS
The details of individual attendance at board meetings are set out below:
NON-EXECUTIVE DIRECTORS 23/08/2010 02/11/2010 21/02/2011 24/05/2011
CH WIESE √ √ √ √
EC KIESWETTER √ √ √ xJA LOUW x √ √ √
JF MALHERBE √ √ √ √
JG RADEMEYER √ √ √ √
EXECUTIVE DIRECTORS 23/08/2010 02/11/2010 21/02/2011 24/05/2011
JW BASSON √ √ √ √
CG GOOSEN √ √ √ √
B HARISUNKER √ √ √ √
AE KARP √ √ x √
EL NEL √ √ √ √
BR WEYERS √ √ √ √
Board meetingsThe Board met four (4) times during the year to consider strategic issues, approve financial results and budgets, and to monitor the performance of the Group, executive directors and senior manage-ment. Additional meetings are held whenever deemed necessary. The reports of the chairman of each committee, as well as a number of key performance indicators, are considered.
The Chairman, in consultation with the Chief Executive Officer and Company Secretary is responsible for setting the agenda for each meeting. Board meetings are scheduled well in advance and management ensures that board members are provided with all relevant information to enable the Board to make well-informed deci-sions. Board documents are provided timeously to directors. Senior management are also invited to attend board meetings on rotation.
Board structureShoprite Holdings has a unitary board of 11 directors, which fulfils oversight and controlling functions. The responsibilities of the Board are set out in the Board charter, evidencing a clear division between responsibilities.
The Board consists of five non-executive directors, including the Chairman of the Board, and six executive directors. Four of the non-executive directors are independent as defined in the King III Code. In view of the Chairman not being independent, the Board has appointed a lead independent director, Mr JG Rademeyer. The roles of the Chairman and the Managing Director are separate, ensuring a clear division of responsibilities.
A number of board committees assist the board in fulfilling its stated objective. The role and responsibilities of each of these commit-tees are recorded in formal terms of reference. The Audit and Risk Committee has additional responsibilities by virtue of the Companies Act. During the course of the year, changes were made to the terms of reference to adopt the additional JSE Listing Requirements.
Board responsibilitiesThe general powers of the directors are set out in the Company’s Memorandum of Incorporation. In addition, the Board charter regulates how the Board and its individual members discharge their responsibilities and sets out the scope of authority, responsibility, composition and functioning of the Board. The charter is reviewed from time to time.
It is also the aim of the Board charter to ensure that all members of the Board understand their duties and responsibilities, as well as the relevant legislation, regulations and best practices that govern their conduct.
The Board is the custodian of corporate governance and ensures that the Group’s business is conducted along sound corporate governance principles. It also adopts strategic plans and through the monitoring of operational performance provide management with effective leadership in line with the Company’s values.
Chairman and Chief Executive Offi cerThe responsibilities of the Chairman and Chief Executive Officer are clearly separate.
Dr CH Wiese is the non-executive chairman who provides guid-ance and leadership to the board and also ensures that the Board is efficient, focussed and operates effectively as a unit. He also acts as the facilitator at Board meetings, ensuring a flow of opinions and attempts to lead discussions to optimal outcomes.
The Chief Executive Officer, Dr JW Basson, reports to the Board and is responsible for the day-to-day business of the Group and the formulation and implementation of strategies once approved by the Board. He is assisted by various heads of operational divisions.
DirectorsAll non-executive directors, excluding the Chairman, are inde-
32
SHOPRITE HOLDINGS LTD INTEGRATED REPORT 2011

pendent as defined in King III. Through its nominations committee, the Board annually considers and reconfirms the classification of directors as being independent. Their independence in character and judgement, and whether there are any relationships or circumstances which are likely to affect their independence, are all factors that are considered.
To uphold their independence and integrity, directors disclose all material interests as and when they arise. A list of directors’ interest is tabled annually.
The non-executive directors have unrestricted access to manage-ment, all Company information, records and documents and may meet with management separately without the attendance of executive directors.
The Company has a formal board induction programme, which is managed by the Company Secretary. Directors are provided with all the necessary documentation to familiarise themselves with aspects that effect the Board. The directors may seek professional advice on any matters concerning the affairs of the Group, at the expense of the Company.
The Board, with the assistance of the Nominations Committee, considers the skills, knowledge and experience of the directors as a whole to be appropriate for their responsibilities to the Company’s stakeholders.
Board appointment The appointment of directors is a matter for the Board as a whole. The Board is assisted by the Nominations Committee who makes recommendations on the appointment of new executive and non-executive directors, including making recommendations on the composition of the Board generally and the balance between execu-tive and non-executive directors.
Directors do not have a fixed term of appointment. In terms of the Company’s Memorandum of Incorporation, directors retire by rotation at least once every three (3) years, but can make themselves available for re-election by shareholders. A director may not hold office for more than three (3) consecutive years before standing for re-election. Dr CH Wiese and Messrs JF Malherbe, JA Louw and BR Weyers will retire at the annual general meeting, but offer themselves for re-election.
GROUP COMPANY SECRETARYThe Company Secretary is a central source of information and advice to the Board and within the Company on matters of ethics and good governance. Together with investor relations, the Company Secretary provides a communication link with investors and liaises with the Company’s share registrars in all issues affecting shareholders.
All directors have unrestricted access to the advice and services of the Company Secretary, who is responsible for ensuring that the Board complies with all applicable statutes, regulations and procedures. To ensure that the Board functions effectively, all directors have full and timely access to relevant information that assists them to perform their duties effectively. Directors are entitled to seek independent professional advice at the Company’s expense after consultation with the Chairman of the Board. No directors exercised this right during the year.
This office also communicates and monitors compliance, among others, with the Group’s trading embargo, ensuring that no employee, executive or non-executive director is allowed to deal in the Company’s securities during prohibited periods.
The Company Secretary is also the compliance officer and ensures that, in accordance with specific legislation, the proceedings and affairs of the Board and its members, the Group itself, and where appropriate, the owners of securities in the Company are properly administered.
In addition, the Company Secretary ensures compliance with the rules and Listings Requirements of the JSE Limited, as well as compliance with the statutory requirements related to the Company and its subsidiaries.
The Company Secretary acts as secretary for the committees of the Board as required by King III.
CORPORATE GOVERNANCE PRACTICESThe Group’s corporate governance practices are embedded in the following:
Ethical and moral behaviourThe Group is committed to promoting the highest standards of ethical behaviour among its directors, management, and employees. In accordance with this objective, and in the interest of good corporate governance, the code of conduct is subject to regular review. This code of conduct sets out the standard expected in dealings with customers, employees, competitors, suppliers, the community, and shareholders. All employees are expected to comply with the code.
All new employees receive training on the code of conduct at induction. The Group’s human resources division monitors compli-ance with the code across the Group and ensures that complaints are followed up, and disciplinary actions taken where appropriate. Employees and other stakeholders may anonymously report instances of unlawful or unethical behaviour to the Tip-offs Anonymous hotline, which is managed by a third party service provider. Allegations are investigated by dedicated specialists.
The Group applies the same code of conduct at all subsidiaries, including within Non-RSA subsidiaries.
Any transgressions of the Group’s code of conduct during the 2010/11 financial year were dealt with appropriately in terms of the code.
Stakeholder communicationThe Group strives to have transparent, open and clear communica-tion with all its material stakeholders. Communication with such stakeholders has always been an important feature of the Group’s corporate governance practices. Financial and non-financial information is disseminated timeously and accurately to relevant stakeholders. Regular presentations are made by executive directors and senior management to institutional investors, analysts and the media. A corporate website (http://www.shopriteholdings.co.za) communicates the latest Group financial and operational data, as well as relevant historical information.
Shareholders are encouraged to attend the annual general meeting, which provides an opportunity for shareholders to raise pertinent questions and to interact with directors. A summary of the proceedings of general meetings and the outcome of voting on items of business is posted on SENS immediately following the annual general meeting.
The Board is not aware of any material requests under the Promotion of Access to Information Act that were either complied with or denied.
33

Insider trading and price sensitive informationThe Shoprite Group has implemented a closed period policy to govern share trades by the Group’s directors and employees. Directors and employees who may have access to price-sensitive information are precluded from dealing in Shoprite shares from one (1) week before the end of the interim and year-end financial periods until the release of the Group’s interim and final results.
In terms of the policy, shares include options, financial instru-ments, and securities, as defined by the JSE Listings Requirements. Appropriate additional closed periods may be invoked by the Board.
In terms of the policy, the Company Secretary regularly dissemi-nates written notices to all directors and members of senior manage-ment throughout the Group, highlighting the provisions of the JSE Listings Requirements and the Securities Services Act, and informing them that dealing in Shoprite Holdings shares during certain restricted periods may not be undertaken.
Dealings in securities of the Company by the Directors and alternate directors of Shoprite Holdings and its main trading subsidiary are disclosed as required by the JSE Listings Requirements. The Board has also implemented a formal approval framework that requires directors and alternate directors to obtain written approval to deal in Company securities from the Chairman or a senior director. The Chairman is required to obtain written clearance from the lead independent director, and the CEO from the chairman.
It is mandatory for directors to notify the Company Secretary of any dealings in the Company’s securities. This information is then disclosed on SENS within 48 hours of the trade being affected.
INTERNAL ACCOUNTABILITYThe Group’s assets are insured against loss with cover being taken out above predetermined levels of self insurance. In the event of disaster recovery circumstances, detailed business continuity plans will ensure that the Group’s business will continue with the minimum amount of disruption.
Legislative and regulatory complianceRegulatory compliance is of importance due to the frequent amendments to the regulatory framework in South Africa.
The compliance function resorts under the Company Secretary, who is responsible for the general monitoring of regulatory requirements and is also involved in implementing the requirements of recently enacted legislation.
The most significant codes and legislation that have impacted the Group during the reporting period are:– King III;– The Companies Act 71 of 2008 (as amended);– The Consumer Protection Act;– The Foodstuffs, Cosmetics and Disinfectants Act;– The Standards Act; and – The Regulation of Interception of Communications Act (RICA).
A comprehensive review of the Consumer Protection Act was conducted and the Group’s employees have been trained to ensure that they understand and are in a position to implement the new requirements.
The Group has also conducted a review of the requirements of the Companies Act and has implemented various measures to ensure compliance with the Act.
The Board monitors compliance by means of committee reports, which include information on any significant interaction with key stakeholders, including regulators, and through the activities of its Audit & Risk Committee.
Anti-competitive conductThe Group does not engage in practices that could prevent others from competing with it or that could adversely impact customers.
External legal advisors were engaged to advise the directors and management of the contents of issues arising from the Competition Act. These advisors are currently developing a competition compli-ance framework and programme for the Group.
During the reporting period, the Competition Commission (“the Commission”) referred a complaint of alleged anti-competitive behaviour against Computicket (Pty) Ltd to the Competition Tribunal for hearing. The Commission’s investigation into the alleged anti-competitive behaviour against various food retailers is ongoing.
Political donations and affi liationsWhilst the Group supports the democracy in South Africa, it does not make donations to individual political parties.
APPLY OR EXPLAIN PRINCIPLES OF KING IIIJSE-listed companies are required to report and disclose the application of the King III principles. The principles that have not been applied are therefore explained below:– Principle 2.16 recommends that the Chairman of the Board should
be independent. The Board has considered this issue and is of the view that Dr CH Wiese’s skills, knowledge and experience allows him to make a significant contribution to the functioning and effectiveness of the Board. A lead independent director was, however, appointed.
– Principle 2.18 requires that the Board should comprise a balance of power with a majority of non-executive directors, and that the majority of non-executive directors should be independent. The Board is in the process of restructuring and will aim to comply with this principle by 30 June 2012.
– Principle 2.22: The evaluation of the Board, its committees, and individual directors should be performed every year. The Group does not comply with this principle, but will implement the neces-sary measures to ensure compliance.
Corporate Governance Report (continued)
34
SHOPRITE HOLDINGS LTD INTEGRATED REPORT 2011
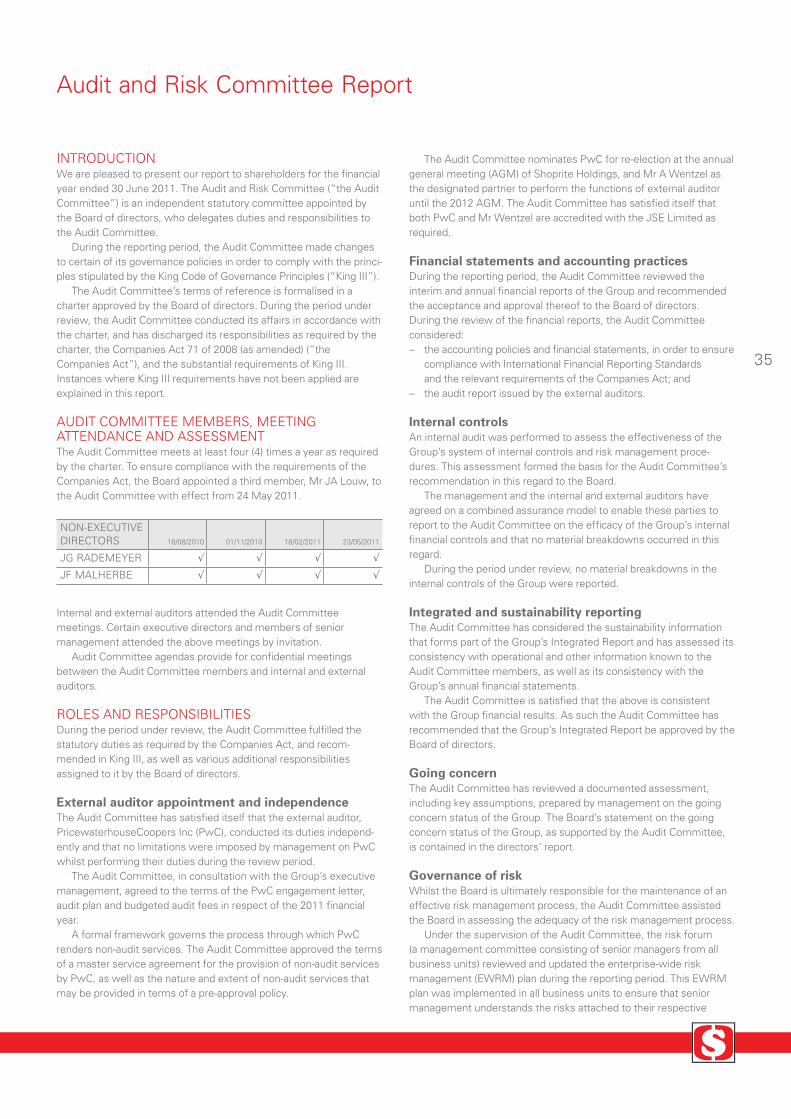
INTRODUCTIONWe are pleased to present our report to shareholders for the financial year ended 30 June 2011. The Audit and Risk Committee (“the Audit Committee”) is an independent statutory committee appointed by the Board of directors, who delegates duties and responsibilities to the Audit Committee.
During the reporting period, the Audit Committee made changes to certain of its governance policies in order to comply with the princi-ples stipulated by the King Code of Governance Principles (“King III”).
The Audit Committee’s terms of reference is formalised in a charter approved by the Board of directors. During the period under review, the Audit Committee conducted its affairs in accordance with the charter, and has discharged its responsibilities as required by the charter, the Companies Act 71 of 2008 (as amended) (“the Companies Act”), and the substantial requirements of King III. Instances where King III requirements have not been applied are explained in this report.
AUDIT COMMITTEE MEMBERS, MEETING ATTENDANCE AND ASSESSMENTThe Audit Committee meets at least four (4) times a year as required by the charter. To ensure compliance with the requirements of the Companies Act, the Board appointed a third member, Mr JA Louw, to the Audit Committee with effect from 24 May 2011.
NON-EXECUTIVE DIRECTORS 16/08/2010 01/11/2010 18/02/2011 23/05/2011
JG RADEMEYER √ √ √ √
JF MALHERBE √ √ √ √
Internal and external auditors attended the Audit Committee meetings. Certain executive directors and members of senior management attended the above meetings by invitation.
Audit Committee agendas provide for confidential meetings between the Audit Committee members and internal and external auditors.
ROLES AND RESPONSIBILITIESDuring the period under review, the Audit Committee fulfilled the statutory duties as required by the Companies Act, and recom-mended in King III, as well as various additional responsibilities assigned to it by the Board of directors.
External auditor appointment and independenceThe Audit Committee has satisfied itself that the external auditor, PricewaterhouseCoopers Inc (PwC), conducted its duties independ-ently and that no limitations were imposed by management on PwC whilst performing their duties during the review period.
The Audit Committee, in consultation with the Group’s executive management, agreed to the terms of the PwC engagement letter, audit plan and budgeted audit fees in respect of the 2011 financial year.
A formal framework governs the process through which PwC renders non-audit services. The Audit Committee approved the terms of a master service agreement for the provision of non-audit services by PwC, as well as the nature and extent of non-audit services that may be provided in terms of a pre-approval policy.
The Audit Committee nominates PwC for re-election at the annual general meeting (AGM) of Shoprite Holdings, and Mr A Wentzel as the designated partner to perform the functions of external auditor until the 2012 AGM. The Audit Committee has satisfied itself that both PwC and Mr Wentzel are accredited with the JSE Limited as required.
Financial statements and accounting practicesDuring the reporting period, the Audit Committee reviewed the interim and annual financial reports of the Group and recommended the acceptance and approval thereof to the Board of directors.During the review of the financial reports, the Audit Committee considered:– the accounting policies and financial statements, in order to ensure
compliance with International Financial Reporting Standards and the relevant requirements of the Companies Act; and
– the audit report issued by the external auditors.
Internal controlsAn internal audit was performed to assess the effectiveness of the Group’s system of internal controls and risk management proce-dures. This assessment formed the basis for the Audit Committee’s recommendation in this regard to the Board.
The management and the internal and external auditors have agreed on a combined assurance model to enable these parties to report to the Audit Committee on the efficacy of the Group’s internal financial controls and that no material breakdowns occurred in this regard.
During the period under review, no material breakdowns in the internal controls of the Group were reported.
Integrated and sustainability reporting The Audit Committee has considered the sustainability information that forms part of the Group’s Integrated Report and has assessed its consistency with operational and other information known to the Audit Committee members, as well as its consistency with the Group’s annual financial statements.
The Audit Committee is satisfied that the above is consistent with the Group financial results. As such the Audit Committee has recommended that the Group’s Integrated Report be approved by the Board of directors.
Going concernThe Audit Committee has reviewed a documented assessment, including key assumptions, prepared by management on the going concern status of the Group. The Board’s statement on the going concern status of the Group, as supported by the Audit Committee, is contained in the directors’ report.
Governance of riskWhilst the Board is ultimately responsible for the maintenance of an effective risk management process, the Audit Committee assisted the Board in assessing the adequacy of the risk management process.
Under the supervision of the Audit Committee, the risk forum (a management committee consisting of senior managers from all business units) reviewed and updated the enterprise-wide risk management (EWRM) plan during the reporting period. This EWRM plan was implemented in all business units to ensure that senior management understands the risks attached to their respective
Audit and Risk Committee Report
35

Meetings of the Nominations Committee are held as the committee deems appropriate;. however the committee meets at least once a year.
The main purpose of the committee is to assist the Board to ensure that appointments of directors are made in terms of a formal and transparent procedure.
The Nominations Committee currently consists of two (2) non- executive directors, of which one is independent.
The following directors served on the Nominations Committee, a sub-committee of the Board:Dr CH Wiese – Chairman (non-executive); and Mr JA Louw – Independent non-executive director.
Details of attendance of meetings by the members of the Nominations Committee are set out herein:
Nominations Committee Report
DIRECTOR 24/05/2011
CH WIESE √
JA LOUW √
The committee’s terms of reference have been reviewed and updated during the year.
One third of the directors will retire by rotation at the forthcoming annual general meeting. Dr CH Wiese and Messrs JF Malherbe, JA Louw and BR Weyers are due to retire by rotation at the next annual general meeting and, being eligible, offer themselves for re-election. Their re-election as directors is recommended to shareholders.
The Nominations Committee is satisfied that it has carried out its responsibilities for the financial year in compliance with its terms of reference.
business units and the controls necessary to mitigate these risks. The Audit Committee is satisfied that, during the course of the
2011 financial year, management revisited all risks by means of an enterprise-wide risk assessment. The resultant top 20 risks that now form part of individual EWRM’s were adequately addressed by the Group’s various business units.
Internal auditThe Audit Committee is responsible for ensuring that the Group’s internal audit function is independent and has the necessary resources, standing and authority within the Group to enable it to discharge its responsibilities effectively. Furthermore, the Audit Committee oversees cooperation between the internal and external auditors, and serves as a link between the Board of directors and these functions.
The internal audit function reports centrally and is responsible for reviewing and providing assurance on the adequacy of the internal control environment across all of significant areas of the Group’s operations. The internal audit manager is responsible for reporting the progress and findings of internal audit’s work conducted against the Group’s approved audit plan to the Audit Committee on a quarterly basis.
The internal audit manager has direct access to the Audit Committee, primarily through the Chairman.
The Audit Committee is satisfied that Group internal audit has complied with the required legal, regulatory and other responsibilities as stipulated in their charter during the period under review.
Governance of information technologyAs part of the Group’s IT governance framework a formal IT governance charter and policies were formulated and implemented. The charter and policies outline the decision making rights and accountability framework for IT governance within the Group.
EVALUATION OF THE EXPERTISE AND EXPERIENCE OF THE FINANCIAL DIRECTOR AND FINANCE FUNCTIONThe Audit Committee has satisfied itself that the financial director, Mr CG Goosen, has the appropriate expertise and experience to act in this capacity.
The Audit Committee is also satisfied that the Group finance function has the required expertise and adequacy of resources to perform the Group financial function.
JG RademeyerChairman
26 August 2011
Audit and Risk Committee Report (continued)
36
SHOPRITE HOLDINGS LTD INTEGRATED REPORT 2011

Remuneration Committee Report
The Remuneration Committee is a sub-committee of the Board and comprises of two non-executive directors. The following directors served as members of the committee during the reporting period:– Dr CH Wiese: non-executive chairman – Mr JA Louw: independent non-executive director
The Chief Executive Officer and the Deputy Managing Director attend the meetings of the committee by invitation to advise on remuneration and other related matters.
The committee functions in terms of a charter formally approved by the Board and its main responsibilities can be summarized as follows:
– consideration and approval of the remuneration of executives and other members of management;
– to approve any changes in the structure of short or long-term incentive schemes of the Group; and
– to make recommendation to the Board on the remuneration to be paid to non-executive directors.
The committee is chaired by a non-executive director and meets as deems appropriate, but at least once a year. Further meetings may be convened by the chairperson or any other member of the committee.
The committee is satisfied that it has discharged its responsibili-
ties for the period under the review in compliance with its terms of reference.
REMUNERATION COMMITTEE MEETING ATTENDANCEDetails of attendance of meetings by the members of the committee are set out below:
DIRECTOR 05/07/2011
CH WIESE √
JA LOUW x
NON-EXECUTIVE DIRECTORS’ FEESNon-executive directors receive fees for their services on the Board and Board committees.
Fees for non-executive directors are recommended by the committee to the Board. The Board recommends these fees to shareholders for approval at the annual general meeting. These fees reward the directors fairly for the time, expertise and service provided to the Board based on an annual benchmarking of non-exec-utive directors fees.
No incentives were awarded to non-executive directors during the reporting period.
37

ContentsCertificate by Company Secretary . . . . . . . . . . . . . . . . . . . . . . . . . . . . . . . . . . . . . . . . . . . . . . . . . . . . . . . . . . . . . . . . . . . . . . . . . . . . . .39
Currency of Annual Financial Statements . . . . . . . . . . . . . . . . . . . . . . . . . . . . . . . . . . . . . . . . . . . . . . . . . . . . . . . . . . . . . . . . . . . . . . .39
Independent Auditor’s Report . . . . . . . . . . . . . . . . . . . . . . . . . . . . . . . . . . . . . . . . . . . . . . . . . . . . . . . . . . . . . . . . . . . . . . . . . . . . . . . . . .39
Directors’ Report . . . . . . . . . . . . . . . . . . . . . . . . . . . . . . . . . . . . . . . . . . . . . . . . . . . . . . . . . . . . . . . . . . . . . . . . . . . . . . . . . . . . . . . . . . . . . .40
Statement of Financial Position . . . . . . . . . . . . . . . . . . . . . . . . . . . . . . . . . . . . . . . . . . . . . . . . . . . . . . . . . . . . . . . . . . . . . . . . . . . . . . . . .42
Statement of Comprehensive Income . . . . . . . . . . . . . . . . . . . . . . . . . . . . . . . . . . . . . . . . . . . . . . . . . . . . . . . . . . . . . . . . . . . . . . . . . .43
Statement of Changes in Equity . . . . . . . . . . . . . . . . . . . . . . . . . . . . . . . . . . . . . . . . . . . . . . . . . . . . . . . . . . . . . . . . . . . . . . . . . . . . . . . .44
Statement of Cash Flows . . . . . . . . . . . . . . . . . . . . . . . . . . . . . . . . . . . . . . . . . . . . . . . . . . . . . . . . . . . . . . . . . . . . . . . . . . . . . . . . . . . . . .45
Notes to the Annual Financial Statements . . . . . . . . . . . . . . . . . . . . . . . . . . . . . . . . . . . . . . . . . . . . . . . . . . . . . . . . . . . . . . . . . . . . . .46
Accounting Policies . . . . . . . . . . . . . . . . . . . . . . . . . . . . . . . . . . . . . . . . . . . . . . . . . . . . . . . . . . . . . . . . . . . . . . . . . . . . . . . . . . . . . . . . . . . . .46
Operating Segment Information . . . . . . . . . . . . . . . . . . . . . . . . . . . . . . . . . . . . . . . . . . . . . . . . . . . . . . . . . . . . . . . . . . . . . . . . . . . . . . . . . . . .56
Notes . . . . . . . . . . . . . . . . . . . . . . . . . . . . . . . . . . . . . . . . . . . . . . . . . . . . . . . . . . . . . . . . . . . . . . . . . . . . . . . . . . . . . . . . . . . . . . . . . . . . . . . .57
Interests in Subsidiaries . . . . . . . . . . . . . . . . . . . . . . . . . . . . . . . . . . . . . . . . . . . . . . . . . . . . . . . . . . . . . . . . . . . . . . . . . . . . . . . . . . . . . . 100
Annual Financial StatementsShoprite Holdings Ltd and its Subsidiaries as at June 2011
SHOPRITE HOLDINGS LTD INTEGRATED REPORT 2011
REVIEWER OF THE ANNUAL FINANCIAL STATEMENTSIn compliance with the disclosure requirements of the Companies Act 71 of 2008 (as amended), the annual financial statements have been reviewed by Mr. M Bosman, CA(SA).
38

39
Certifi cate of the Company Secretary
In my capacity as the company secretary, I hereby confirm, in terms of the Companies Act 71 of 2008 (as amended), that for the year ended June 2011, Shoprite Holdings Limited has filed all such returns as are required in terms of this Act, and that all such returns are, to the best of my knowledge and belief, true, correct and up to date.
PG du Preez26 August 2011
Independent Auditor’s Report
Currency of Annual Financial Statements
2011 2010
USA dollar 6.770 7.745 Pound sterling 10.873 11.737 Euro 9.825 9.674 Zambia kwacha 0.002 0.001 Mozambique metical 0.239 0.224
2011 2010
Botswana pula 1.035 1.080 Uganda shilling 0.003 0.003 Malawi kwacha 0.045 0.052 Mauritian rupee 0.242 0.244 Angolan kwanza 0.073 0.083
2011 2010
Indian rupee 0.152 0.166 Ghanian cedi 4.455 5.341 Madagascan ariary 0.004 0.003 Nigerian naira 0.045 0.052 Tanzania shilling 0.004 0.005
The annual financial statements are expressed in South African rand. The approximate rand cost of a unit of the following currencies at year-end was:
We have audited the consolidated annual financial statements and annual financial statements of Shoprite Holdings Limited, which comprise the consolidated and separate statements of financial position as at 30 June 2011, and the consolidated and separate statements of comprehensive income, changes in equity and cash flows for the year then ended, and a summary of significant accounting policies and other explanatory information, and the directors’ report, as set out on pages 40 to 100.
DIRECTORS’ RESPONSIBILITY FOR THE FINANCIAL STATEMENTSThe company’s directors are responsible for the preparation and fair presentation of these financial statements in accordance with International Financial Reporting Standards and the requirements of the Companies Act of South Africa, and for such internal control as the directors determine is necessary to enable the preparation of financial statements that are free from material misstatements, whether due to fraud or error.
AUDITOR’S RESPONSIBILITYOur responsibility is to express an opinion on these financial state-ments based on our audit. We conducted our audit in accordance with International Standards on Auditing. Those standards require that we comply with ethical requirements and plan and perform the audit to obtain reasonable assurance about whether the financial statements are free from material misstatement.
An audit involves performing procedures to obtain audit evidence about the amounts and disclosures in the financial statements. The procedures selected depend on the auditor’s judgement, including the assessment of the risks of material misstatement of the financial
statements, whether due to fraud or error. In making those risk assessments, the auditor considers internal control relevant to the entity’s preparation and fair presentation of the financial statements in order to design audit procedures that are appropriate in the circum-stances, but not for the purpose of expressing an opinion on the effectiveness of the entity’s internal control. An audit also includes evaluating the appropriateness of accounting policies used and the reasonableness of accounting estimates made by management, as well as evaluating the overall presentation of the financial statements.
We believe that the audit evidence we have obtained is sufficient and appropriate to provide a basis for our audit opinion.
OPINIONIn our opinion, the financial statements present fairly, in all material respects, the consolidated and separate financial position of Shoprite Holdings Limited as at 30 June 2011, and its consolidated and sepa-rate financial performance and its consolidated and separate cash flows for the year then ended in accordance with International Financial Reporting Standards and the requirements of the Companies Act of South Africa.
PricewaterhouseCoopers Inc. Director: NH DömanRegistered Auditor
Cape Town26 August 2011

SHOPRITE HOLDINGS LTD INTEGRATED REPORT 2011
40
Directors’ ReportShoprite Holdings Ltd and its Subsidiaries
NATURE OF BUSINESSShoprite Holdings Limited (“Shoprite Holdings” or “the Group”) is an investment holding company listed on the JSE Limited security exchange in the “food retailers & wholesalers” sector. Secondary listings are also maintained on the Namibian and Zambian Stock Exchanges.
THE GROUP COMPRISES OF THE FOLLOWING MAIN TRADING SUBSIDIARIES:
Shoprite Checkers (Pty) Ltd:Supermarkets: Serves a broad customer base through our Shoprite, Shoprite Hyper, Checkers, Checkers Hyper and Usave store formats. Supply Chain Management: A highly sophisticated supply line serv-ices the Group’s outlets in 16 countries. The Group prides itself in running a state-of-the-art distribution operation and became the first South African retailer to receive the ISO 9002 accreditation for import and export handling.Fast Foods: Developed from a small take-away outlet, the Hungry Lion chain now boasts modern, well-designed stores with ample seating and an inescapable focus on fried chicken. Hungry Lion competes in the same market as well-known American chicken fran-chises. The chain delivers a wide variety of quality products that offer consumers more value for money in a fast and friendly environment.Franchise: The OK Franchise Division franchises retail supermarket, liquor as well as wholesale outlets, each with its own identity and personality, under the OK Foods, OK Grocer, OK Minimark, OK Value, Sentra, Megasave and Enjoy brands in South Africa, Botswana, Lesotho and Namibia.Freshmark: In its role as the Group’s fruit and vegetable procurement and distribution arm, Freshmark not only supplies fresh produce to the Group’s outlets within South Africa, but also to its outlets in other parts of the continent. Currently one of the largest buyers of fresh produce in South Africa, Freshmark also imports fruit and vegetables to ensure a wide variety and continuity of traditionally seasonal fresh produce. Liquor Stores: One of the latest retail areas the Group has entered into, trading under the Shoprite and Checkers LiquorShop brands respectively.Meat Markets: The Group’s meat market division is the largest retailer of fresh meat on the African continent. Customers are served through in-store butcheries that employ qualified butchers and tech-nicians.Money Markets: Our Money Markets offer a comprehensive range of financial services and products to our customers through dedicated in-store service counters under the “Money Market” brand.Furniture: Retail of furniture, appliances and home entertainment through its OK Furniture, OK Power Express and House and Home outlets in South Africa and other countries.Pharmacies and wholesale distribution: MediRite was established to meet the growing health and wellness needs of consumers by healthcare professionals at affordable prices. In-store dispensaries currently operate throughout South Africa and Swaziland. The Group’s pharmaceutical wholesaler, Transpharm, sells and distributes a wide range of pharmaceutical products and surgical equipment to hospitals and clinics, dispensing doctors and veterinary surgeons as well as to private and corporate pharmacies. Properties: In its capacity as the Group’s property arm, this division is tasked with the supermarket expansion program as its main priority, either by identifying and leasing new supermarket premises or devel-oping new shopping centres to accommodate a supermarket. This function includes conducting ongoing market research, aimed at identifying trends and shifts in consumer patterns and the identifica-tion of new opportunities for expanding the Group’s trading opera-tions and increasing its market share. In respect of new retail devel-
opments and the redevelopment of its existing properties, it over-sees every stage of the planning-, design- and construction process.
Computicket (Pty) Ltd:As a premier ticketing solution provider and one of the most recognised brand names, Computicket offers theatre, concert, festival, sport and cinema tickets along with bus tickets and gift vouchers through three convenient distribution channels. This includes a network of Computicket outlets located across South Africa as well as at the Money Market service counters in Shoprite, Checkers and Checkers Hyper stores nationally, a call centre as well as the Computicket website.
Shoprite International Ltd:Incorporated in Mauritius, Shoprite International controls the majority of the Group’s non-South African retail and property investments.
Shoprite Insurance Company Ltd:Provides first and third party short term insurance to the Group and its customers.
Other Group Subsidiaries:The interests of Shoprite Holdings in other subsidiaries are set out on page 100 of the Integrated Report.
FINANCIAL REVIEWThe Group’s diluted headline earnings per share amounts to 507,6 cents for the year (2010: 451,6 cents). Details of the profit of Shoprite Holdings and its subsidiaries are contained in the statement of compre-hensive income on page 43 with reference to the operating segment information on page 56. The financial position of Shoprite Holdings and its subsidiaries are recorded in the statement of financial position on page 42. Further details are furnished in the notes to the annual finan-cial statements on page 46 to 99. The Group’s net asset value per share as at 30 June 2011 was 1400 cents (2010: 1167 cents).
The attributable interest of Shoprite Holdings in the taxed profits and losses of its subsidiaries for the period is as follows:
R’000 2011 2010
Total profits 2 936 174 2 578 668 Total losses (338 615) (251 703)
DISTRIBUTION TO SHAREHOLDERS
Preference dividendsDetails are reflected in note 28 to the Group’s annual financial statements.
Ordinary dividendsAn interim cash dividend (no. 124) of 88 cents per share was paid on 22 March 2011. A final dividend (no. 125) of 165 cents per share, was payable on 19 September 2011, bringing the total dividend for the year to 253 cents (2010: 227 cents) per ordinary share.
SHARE CAPITALThe authorised share capital of Shoprite Holdings remained unchanged at 650 000 000 (six hundred and fifty million) ordinary shares of 113,4 cents (one hundred and thirteen comma four cents) each.
There was no movement in the number of issued Shoprite Holdings ordinary shares during the reporting period, which remained at 543 479 460 (five hundred and forty three million four hundred and seventy nine thousand four hundred and sixty) shares of 113,4 cents each.
The deferred share capital of Shoprite Holdings remained unchanged and is reflected in note 14.2 to the annual financial statements.

41
GOING CONCERNThe annual financial statements of the Group were prepared on a going concern basis.
The Board has performed a formal review of the Group’s results and its ability to continue trading as a going concern in the foresee-able future.
The directors of Shoprite Holdings confirm that they are satisfied that the Group has adequate resources to continue in business for the foreseeable future.
BORROWINGSShoprite Holdings has unlimited borrowing powers in terms of its Memorandum of Incorporation (MOI).
The Group’s overall level of debt increased from R40 million to R50 million during the financial year under review.
SPECIAL RESOLUTIONSAt the annual general meeting of Shoprite Holdings held on 25 October 2010, shareholders approved the following special resolution:
Special resolution number 1 – General approval to repurchase shares
No special resolutions were passed by any of the Group’s main trading subsidiaries during the reporting period.
DIRECTORS AND SECRETARYThe directors’ names and details are furnished on pages 8 and 9 and the company secretary’s name, business and postal address on the inside back cover of the Integrated Report.
In terms of the MOI of Shoprite Holdings, all directors are subject to retirement by rotation and re-election by the shareholders after a maximum tenure of three (3) years.
Dr CH Wiese and Messrs JF Malherbe, JA Louw and BR Weyers retire as directors, in terms of paragraph 14.1 of the MOI of the Company, at the annual general meeting. All the directors have offered themselves for re-election as directors of Shoprite Holdings.
The board supports the re-election of these directors.
Directors’ and Alternate Directors’ Interests in Ordinary Shares
BeneficialNon-
beneficialTotal2011
Total2010
CH Wiese 89 917 398 89 917 398 85 627 398JW Basson 10 110 084 10 110 084 10 049 554CG Goosen 1 206 202 1 206 202 1 206 202B Harisunker 400 189 400 189 407 379AE Karp 147 269 147 269 147 269EC Kieswetter 0 0 0JA Louw 150 000 150 000 150 000JF Malherbe 72 453 72 453 72 453EL Nel 148 727 148 727 148 727JG Rademeyer 10 000 10 000 10 000BR Weyers 404 594 404 594 404 594JAL Basson 80 600 80 600 63 600M Bosman 110 000 110 000 110 000PC Engelbrecht 224 055 224 055 129 440JD Wiese 14 074 14 074 14 074
After the Group’s financial year end and expiry of the closed trading period directors or alternate directors purchased the following amount of shares on the open market:
BeneficialNon-
beneficial Total
JAL Basson 8 601 8 601M Bosman 15 000 15 000PC Engelbrecht 51 606 51 606
Director’s Interest in Non-Convertible, Non-Participating, No Par Value Deferred Shares
Total2011
Total2010
CH Wiese 276 821 666 276 821 666
CORPORATE GOVERNANCEStatements of the Board’s application of the codes of good corporate governance are set out in the corporate governance report, which forms part of this directors’ report and the remuneration committee report on page 37.
BOARD COMMITTEESThe reports of the audit and risk and other board committees are included in the corporate governance report on pages 32 to 36.
AUDITORSPricewaterhouseCoopers Incorporated will be nominated for reappointment at the annual general meeting in accordance with the Companies Act (Act 71 of 2008), as amended.
EVENTS AFTER THE REPORTING DATEOther than the facts in this Integrated Report, there have been no material changes in the affairs or financial position of the Group and its subsidiaries from 30 June 2011 to the date of this report that have an impact on the financial results or disclosures in these annual financial statements.
HOLDING COMPANYShoprite Holdings has no holding company. An analysis of the main shareholders appears on page 101 of this report.
LITIGATION STATEMENTThe two disputes between the Group and South African Breweries Plc related to the purchase of OK Bazaars (1929) Limited have not been resolved.
The investigation by the Competition Commission of South Africa (“the Commission”) into the alleged anti-competitive conduct of various food retailers which includes the Group’s main trading subsid-iary, Shoprite Checkers (Pty) Ltd, is still pending.
The referral by the Commission of its case against Computicket (Pty) Ltd must still be heard by the Competition’s Tribunal.
During April 2010, a claim was lodged against the Group’s main trading subsidiary, Shoprite Checkers (Pty) Ltd and its Nigerian subsidiary, Retail Supermarkets Nigeria Ltd, by AIC Limited, a company registered in the Federal Republic of Nigeria, on alleged breach of contract. A hearing date must still be allocated by the Lagos High Court.
Save as recorded above, the directors are not aware of any legal or arbitration proceedings, including proceedings that are pending or threatened, that may have or have had in the recent past, being at least the previous 12 months, a material effect on the Group’s financial position.
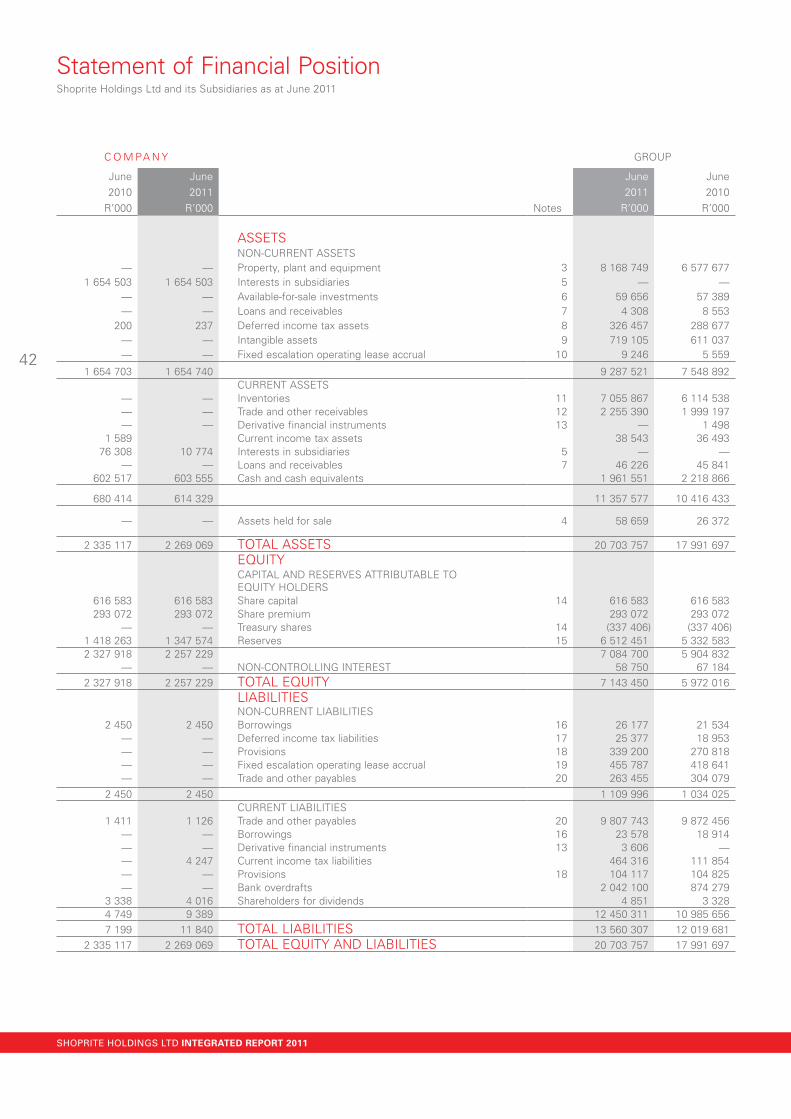
42
C O M PA N Y GROUP
June June June June2010 2011 2011 2010
R’000 R’000 Notes R’000 R’000
SHOPRITE HOLDINGS LTD INTEGRATED REPORT 2011
Statement of Financial PositionShoprite Holdings Ltd and its Subsidiaries as at June 2011
ASSETSNON-CURRENT ASSETS
— — Property, plant and equipment 3 8 168 749 6 577 677 1 654 503 1 654 503 Interests in subsidiaries 5 — —
— — Available-for-sale investments 6 59 656 57 389 — — Loans and receivables 7 4 308 8 553
200 237 Deferred income tax assets 8 326 457 288 677 — — Intangible assets 9 719 105 611 037 — — Fixed escalation operating lease accrual 10 9 246 5 559
1 654 703 1 654 740 9 287 521 7 548 892 CURRENT ASSETS
— — Inventories 11 7 055 867 6 114 538 — — Trade and other receivables 12 2 255 390 1 999 197 — — Derivative financial instruments 13 — 1 498
1 589 Current income tax assets 38 543 36 493 76 308 10 774 Interests in subsidiaries 5 — —
— — Loans and receivables 7 46 226 45 841 602 517 603 555 Cash and cash equivalents 1 961 551 2 218 866
680 414 614 329 11 357 577 10 416 433
— — Assets held for sale 4 58 659 26 372
2 335 117 2 269 069 TOTAL ASSETS 20 703 757 17 991 697 EQUITYCAPITAL AND RESERVES ATTRIBUTABLE TO EQUITY HOLDERS
616 583 616 583 Share capital 14 616 583 616 583 293 072 293 072 Share premium 293 072 293 072
— — Treasury shares 14 (337 406) (337 406)1 418 263 1 347 574 Reserves 15 6 512 451 5 332 583 2 327 918 2 257 229 7 084 700 5 904 832
— — NON-CONTROLLING INTEREST 58 750 67 184 2 327 918 2 257 229 TOTAL EQUITY 7 143 450 5 972 016
LIABILITIESNON-CURRENT LIABILITIES
2 450 2 450 Borrowings 16 26 177 21 534 — — Deferred income tax liabilities 17 25 377 18 953 — — Provisions 18 339 200 270 818 — — Fixed escalation operating lease accrual 19 455 787 418 641 — — Trade and other payables 20 263 455 304 079
2 450 2 450 1 109 996 1 034 025 CURRENT LIABILITIES
1 411 1 126 Trade and other payables 20 9 807 743 9 872 456 — — Borrowings 16 23 578 18 914 — — Derivative financial instruments 13 3 606 — — 4 247 Current income tax liabilities 464 316 111 854 — — Provisions 18 104 117 104 825 — — Bank overdrafts 2 042 100 874 279
3 338 4 016 Shareholders for dividends 4 851 3 328 4 749 9 389 12 450 311 10 985 656 7 199 11 840 TOTAL LIABILITIES 13 560 307 12 019 681
2 335 117 2 269 069 TOTAL EQUITY AND LIABILITIES 20 703 757 17 991 697

43
C O M PA N Y GROUP
June June June June2010 2011 2011 2010
R’000 R’000 Notes R’000 R’000
— — Sale of merchandise 72 297 777 67 402 440 — — Cost of sales (57 624 408) (54 147 848)
— — GROSS PROFIT 14 673 369 13 254 592 633 372 1 307 681 Other operating income 21 1 855 841 1 576 128
— — Depreciation and amortisation 22 (933 592) (839 208) — — Operating leases 23 (1 700 468) (1 550 745) — — Employee benefits 24 (5 762 045) (5 273 843)
(5 960) (3 508) Other expenses (4 146 408) (3 676 483)
627 412 1 304 173 TRADING PROFIT 3 986 697 3 490 441 572 (1) Exchange rate (losses)/gains (446) (77 824)
— — Items of a capital nature 27 (78 533) (25 580)
627 984 1 304 172 OPERATING PROFIT 25 3 907 718 3 387 037 42 729 33 574 Interest received 94 614 105 741
(126) (198) Finance costs 28 (125 964) (93 690)
670 587 1 337 548 PROFIT BEFORE INCOME TAX 3 876 368 3 399 088 (110 507) (131 060) Income tax expense 29 (1 346 826) (1 111 792)
560 080 1 206 488 PROFIT FOR THE YEAR 2 529 542 2 287 296
OTHER COMPREHENSIVE INCOME, NET OF INCOME TAX — — Fair value movements on available-for-sale investments 15 1 950 8 244 — — Foreign currency translation differences 15 (142 451) (170 030)
560 080 1 206 488 TOTAL COMPREHENSIVE INCOME FOR THE YEAR 2 389 041 2 125 510
PROFIT ATTRIBUTABLE TO:
560 080 1 206 488 Owners of the parent 2 509 780 2 266 522 — — Non-controlling interest 19 762 20 774
560 080 1 206 488 2 529 542 2 287 296
TOTAL COMPREHENSIVE INCOME ATTRIBUTABLE TO:
560 080 1 206 488 Owners of the parent 2 369 279 2 104 736 — — Non-controlling interest 19 762 20 774
560 080 1 206 488 2 389 041 2 125 510
Earnings per share (cents) 30 495.9 450.1
Diluted earnings per share (cents) 30 495.9 446.4
Statement of Comprehensive IncomeShoprite Holdings Ltd and its Subsidiaries for the year ended June 2011

44
SHOPRITE HOLDINGS LTD INTEGRATED REPORT 2011
Statement of Changes in EquityShoprite Holdings Ltd and its Subsidiaries for the year ended June 2011
Attributable to equity holders
TotalNon-
controlling Share Share Treasury Other RetainedR’000 Notes equity interest Total capital premium shares reserves earnings
GROUPBALANCE AT JUNE 2009 5 029 295 69 295 4 960 000 616 583 293 072 (619 438) 314 582 4 355 201
Total comprehensive income 2 125 510 20 774 2 104 736 — — — (161 786) 2 266 522 Profit for the year 2 287 296 20 774 2 266 522 2 266 522 Recognised in equity Net fair value movement on available-for-sale investments 15 9 585 9 585 9 585 Income tax effect of net fair value movement on available-for-sale investments 15 (1 341) (1 341) (1 341) Foreign currency translation differences 15 (170 030) (170 030) (170 030)
Purchase of treasury shares (244 439) (244 439) (244 439)Treasury share utilised for share option take-up, net of income tax 14 147 413 147 413 526 471 (379 058)Realisation of share based payment reserve 14 — — (14 353) 14 353 Transfer to contingency reserve 15 — — 2 477 (2 477)Non-controlling interest purchased (3 215) (3 215) — Dividends distributed to shareholders (1 082 548) (19 670) (1 062 878) (1 062 878)
BALANCE AT JUNE 2010 5 972 016 67 184 5 904 832 616 583 293 072 (337 406) 140 920 5 191 663
Total comprehensive income 2 389 041 19 762 2 369 279 — — — (140 501) 2 509 780 Profit for the year 2 529 542 19 762 2 509 780 2 509 780 Recognised in equity Net fair value movement on available-for-sale investments 15 2 267 2 267 2 267 Income tax effect of net fair value movement on available-for-sale investments 15 (317) (317) (317) Foreign currency translation differences 15 (142 451) (142 451) (142 451)
Transfer to contingency reserve 15 — — 4 509 (4 509)Dividends distributed to shareholders (1 217 607) (28 196) (1 189 411) (1 189 411)
BALANCE AT JUNE 2011 7 143 450 58 750 7 084 700 616 583 293 072 (337 406) 4 928 6 507 523
COMPANYBALANCE AT JUNE 2009 2 909 145 2 909 145 616 583 293 072 — 16 505 1 982 985
Total comprehensive income Profit for the year 560 080 560 080 560 080
Realisation of share based payment reserve — — (14 353) 14 353 Dividends distributed to shareholders (1 141 307) (1 141 307) (1 141 307)
BALANCE AT JUNE 2010 2 327 918 2 327 918 616 583 293 072 — 2 152 1 416 111
Total comprehensive income Profit for the year 1 206 488 1 206 488 1 206 488
Dividends distributed to shareholders (1 277 177) (1 277 177) (1 277 177)
BALANCE AT JUNE 2011 2 257 229 2 257 229 616 583 293 072 — 2 152 1 345 422

45
C O M PA N Y GROUP
June June June June2010 2011 2011 2010
R’000 R’000 Notes R’000 R’000
Statement of Cash FlowsShoprite Holdings Ltd and its Subsidiaries for the year ended June 2011
(588 714) (64 496) CASH FLOWS FROM/(UTILISED BY) OPERATING ACTIVITIES 1 543 646 1 509 740
627 984 1 304 172 Operating profit 3 907 718 3 387 037 (632 842) (1 306 771) Less: investment income (27 663) (32 662)
(572) 1 Non-cash items 32.1 1 459 480 1 387 610 — — Payments for cash settlement of share appreciation rights (218 037) —
Payments for settlement of post-retirement medical benefits liability — — 36.2 (2 630) (216 860)
2 679 (285) Changes in working capital 32.2 (1 324 359) (594 756)
(2 751) (2 883) Cash generated from/(utilised by) operations 3 794 509 3 930 369 42 729 33 574 Interest received 110 519 128 892
(126) (198) Interest paid (125 964) (93 690) 632 842 1 306 771 Dividends received 11 758 9 511
(1 140 507) (1 276 499) Dividends paid 32.3 (1 216 084) (1 082 293) (120 901) (125 261) Income tax paid 32.4 (1 031 092) (1 383 049)
587 398 65 535 CASH FLOWS (UTILISED BY)/FROM INVESTING ACTIVITIES 32.5 (2 937 011) (2 680 113) — — CASH FLOWS FROM/(UTILISED BY) FINANCING ACTIVITIES 32.6 9 329 (237 928)
(1 316) 1 039 NET MOVEMENT IN CASH AND CASH EQUIVALENTS (1 384 036) (1 408 301)
603 261 602 517 Cash and cash equivalents at the beginning of the year 1 344 587 2 811 465
572 (1)Effect of exchange rate movements on cash and cash equivalents (41 100) (58 577)
602 517 603 555 CASH AND CASH EQUIVALENTS AT THE END OF THE YEAR (80 549) 1 344 587
Consisting of: 602 517 603 555 Cash and cash equivalents 1 961 551 2 218 866
— — Bank overdrafts (2 042 100) (874 279)
602 517 603 555 (80 549) 1 344 587

SHOPRITE HOLDINGS LTD INTEGRATED REPORT 2011
46
Notes to the Annual Financial StatementsShoprite Holdings Ltd and its Subsidiaries for the year ended June 2011
1. ACCOUNTING POLICIES The principal accounting policies adopted in the preparation
of the consolidated financial statements are set out below and are consistent with those applied in the previous year, unless otherwise stated.
The consolidated Group’s and separate Company’s financial statements were authorised for issue by the board of directors on 26 August 2011.
1.1 Basis of preparation The financial statements are prepared in accordance with
and comply with International Financial Reporting Standards (IFRS) and the South African Companies Act (Act No 71 of 2008), as amended. The financial statements are prepared under the historical cost convention, as modified by the revaluation of certain financial instruments to fair value.
1.1.1 USE OF JUDGMENTS, ASSUMPTIONS AND ESTIMATES 1.1.1.1 Judgments The preparation of the financial statements in accordance
with IFRS requires management to exercise its judgment in the process of applying the Group’s accounting policies. The most significant judgments in applying the Group’s accounting policies relate to the following:
a) Valuation of inventory: Trading inventories are valued by use of the retail inventory method as an approximation of weighted average cost. Significant judgment is required in the application thereof, specifically as far as it relates to gross margin percentages, accrual rates for rebates and settlement discounts and shrinkage rates applied.
b) Segment reporting: IFRS 8 requires an entity to identify its operating segments. Once an entity has done that, it is required to determine its reportable segments. Reportable segments may comprise single operating segments or an aggregation of operating segments. Aggregation of one or more operating segments into a single reportable segment is permitted where certain conditions are met, the principle conditions being that the operating segments should have similar economic characteristics and the operating segments are similar in respect of the products and services offered, nature of production processes, type or class of customers, distribution methods, and regulatory environment.
The Group’s management has assessed the above mentioned aggregation criteria in respect of its identified retail operating segments and believe that they have been satisfied, therefore it has elected to aggregate these segments as allowed by IFRS 8.
1.1.1.2 Assumptions and estimates The preparation of the financial statements in accordance
with IFRS requires the use of certain critical accounting estimates and assumptions. The most significant assump-tions and estimates used in applying the Group’s accounting policies relate to the following:
a) Impairment of assets: The Group performs a review of loss-making stores and considers the need for the impairment of assets under these circumstances. This
determination requires significant judgment. The Group evaluates amongst other things, the duration and extent of the losses, the near-term business outlook for the store, and the possible redeployment of the assets between stores.
b) Useful lives of assets: In determining the depreciation and amortisation charge for property, plant and equip-ment and intangible assets, management applies judg-ment in estimating the useful lives and residual values of these different asset classes. Refer to note 22
c) Income taxes: The Group is subject to income taxes in numerous jurisdictions. Significant judgment is required in determining the worldwide accrual for income taxes. The Group recognises liabilities for anticipated income tax issues based on estimates of potential additional taxes due. With regards to deferred income tax assets for unuti-lised income tax losses, judgment is also required to whether sufficient future taxable income will be available against which these losses can be utilised. Refer to notes 1.10 and 29.
d) Allowances for doubtful debts: Trade receivables include instalment sale debtors and franchise debtors for which allowances for impairment are made in accordance with the accounting policy in note 1.14. These calculations involve the discounting of projected future cash flows and require the use of estimates. Details regarding the allowances are set out in note 12.
e) Employee benefit accruals and provisions: Various assumptions are applied in determining the valuations of post-retirement medical benefits, share based payment accruals and long term employee benefits as set out in notes 1.19, 1.21, 14, 18 and 36.
Estimates and assumptions that have a significant risk of causing a material adjustment to the carrying value of assets and liabilities in a subsequent year relate to the following: income taxes; allowances for doubtful debts and employee benefit allowances.
All estimates and underlying assumptions are based on historical experience and various other factors that manage-ment believes are reasonable under the circumstances. The results of these estimates form the basis of judgments about the carrying value of assets and liabilities that are not readily apparent from other sources. Actual results may differ from these estimates. The estimates and underlying assumptions are reviewed on an ongoing basis. Revisions to accounting estimates are recognised in the period in which the estimate is revised and any affected future periods.
1.1.2 USE OF ADJUSTED MEASURES The measures listed on the following page are presented as
management believes it to be relevant to the understanding of the Group’s financial performance. These measures are used for internal performance analysis and provide addi-tional useful information on underlying trends to equity holders. These measures are not defined terms under IFRS and may therefore not be comparable with similarly titled

47
measures reported by other entities. It is not intended to be a substitute for, or superior to, measures as required by IFRS.
a) Trading profit on the face of the statement of compre-hensive income, being the Group’s operating results excluding foreign exchange rate differences and income or expenditure of a capital nature.
b) Income or expenditure of a capital nature on the face of the statement of comprehensive income, being all re-measurements excluded from the calculation of head-line earnings per share in accordance with the guidance contained in SAICA Circular 3/2009: Headline Earnings. The principal items that will be included under this meas-urement are: gains and losses on disposal and scrapping of property, plant and equipment, intangible assets and assets held for sale; impairments or reversal of impair-ments; any non-trading items such as gains and losses on disposal of investments, operations and subsidiaries.
c) Interest received on the face of the statement of comprehensive income, being only interest received on call and operating bank account balances.
1.2 Consolidation 1.2.1 SUBSIDIARIES Subsidiaries are entities (including special purpose entities)
which are, directly or indirectly, controlled by the Group. Control is established where the Group has the power to govern the financial and operating policies of an entity so as to obtain benefits from its activities. The existence and effect of potential voting rights that are currently exercis-able or convertible are considered when assessing whether the Group controls another entity. The acquisition method of accounting is used to account for business combinations.
The cost of an acquisition is measured as the fair value of the assets given, equity instruments issued and liabilities incurred or assumed at the date of exchange. Identifiable assets acquired as well as liabilities and contingent liabilities assumed in a business combination are measured initially at their fair values at the acquisition date, irrespective of the extent of any non-controlling interest. The excess of the cost of the acquisition over the fair value of the Group’s share of the identifiable net assets of the subsidiary acquired is recorded as goodwill. If the cost of the acquisi-tion is less than the fair value of the net assets of the subsid-iary acquired, the difference is recognised directly in the statement of comprehensive income. A subsidiary is consol-idated from the date on which control is transferred to the Group and is no longer consolidated from the date that the control ceases. Where necessary, accounting policies of subsidiaries have been changed to ensure consistency with the policies adopted by the Group. All intergroup transac-tions, balances and unrealised gains and losses on transac-tions between Group companies have been eliminated.
1.2.2 JOINT VENTURES Joint ventures are those entities over which the Group
exercises joint control in terms of a contractual agreement. The Group’s interests in jointly controlled entities are
accounted for by proportionate consolidation. The Group combines its proportionate share of the assets, liabilities, revenue, income and expenses, on a line-for-line basis, with similar items in the financial statements of the Group. The results of joint ventures are included in the Group’s annual financial statements from the effective date of joint control until the effective date that joint control ceases. Where applicable, accounting policies applied by joint ventures have been changed to ensure consistency with the policies adopted by the Group.
1.2.3 TRANSACTION WITH NON-CONTROLLING INTERESTS The Group treats transactions, such as share purchases, with
non-controlling interests as transactions with equity owners of the Group. For purchases from non-controlling interests, the difference between any consideration paid and the rele-vant share acquired of the carrying value of net assets of the subsidiary is recorded in equity. Gains or losses on disposals to non-controlling interests are also recorded in equity.
1.3 Foreign currency translation 1.3.1 FUNCTIONAL AND PRESENTATION CURRENCY All items in the financial statements of the Group’s subsidi-
aries and joint ventures are measured using the currency of the primary economic environment in which the entity operates (the functional currency). The Group’s consoli-dated financial statements are presented in South African rand, which is Shoprite Holdings Ltd’s functional and the Group’s presentation currency.
1.3.2 TRANSACTIONS AND BALANCES Foreign currency transactions are translated into the
functional currency using the average exchange rates for the relevant month. These average exchange rates approxi-mate the spot rate at the date of the transaction. Gains and losses resulting from the settlement of such transactions, and from the translation of monetary assets and liabilities denominated in foreign currencies at closing rates, are recognised in the statement of comprehensive income.
1.3.3 FOREIGN SUBSIDIARIES AND JOINT VENTURES The results and the financial position of all Group subsidi-
aries and joint ventures that have a functional currency that is different from the presentation currency of the Group are translated into the presentation currency as follows:
i) Assets and liabilities for each statement of financial position presented are translated at the closing rate at the date of that statement of financial position;
ii) Income and expenses for each statement of compre-hensive income presented are translated at the average exchange rates for the period presented; and
iii) All resulting translation differences are recognised as a separate component of equity in the foreign currency translation reserve (FCTR).
On consolidation, exchange rate differences arising from the translation of the net investment in foreign subsidiaries are also taken to the FCTR. When a foreign operation is partially

SHOPRITE HOLDINGS LTD INTEGRATED REPORT 2011
48
disposed of or sold all related exchange rate differences recog-nised in equity in the FCTR are recognised in the statement of comprehensive income as part of the profit or loss on the sale of the operation. The Group’s net investment in a subsidiary is equal to the equity investment plus all monetary items that are receivable from the subsidiary, for which settlement is neither planned nor likely to occur in the foreseeable future.
Goodwill and fair value adjustments arising on the acquisi-tion of a foreign subsidiary are treated as assets and liabilities of the foreign subsidiary and are translated at the closing rate.
1.4 Property, plant and equipment Property, plant and equipment are tangible assets held by the
Group for use in the supply of goods, rental to others or administrative purposes and are expected to be used during more than one period. All property, plant and equipment are stated at historical cost less accumulated depreciation and accumulated impairment. The historical cost includes all expenditure that is directly attributable to the acquisition of the buildings, machinery, equipment and vehicles and is depreciated on a straight-line basis, from the date it is avail-able for use, at rates appropriate to the various classes of assets involved, taking into account the estimated useful life and residual values of the individual items. Land is not depre-ciated, as it has an unlimited useful life. Improvements to leasehold properties are shown at cost and written off over the remaining period of the lease and the items useful life.
Management determines the estimated useful lives, residual values and the related depreciation charges at acquisi-tion and these are reviewed at each statement of financial posi-tion date. If appropriate, adjustments are made and accounted for prospectively as a change in estimate. During the year under review, the estimated useful life of computer equipment has been adjusted to 4 to 5 years, previously 3 years.
Useful lives: Buildings ................................................................ 20 years Machinery ...................................................... 5 to 10 years Vehicles .......................................................... 5 to 10 years Trolleys .................................................................... 3 years Equipment ...................................................... 5 to 10 years Computer equipment ....................................... 4 to 5 years Aeroplane .............................................................. 15 years
The cost of major refurbishments is capitalised as property, plant and equipment to the extent that it can be recovered from future use of the assets. The capitalised amounts are depreciated over the relevant write-off periods. All other repairs and maintenance are charged to the statement of comprehen-sive income during the period in which these are incurred.
An asset’s carrying amount is written down immediately to its recoverable amount if the asset’s carrying amount is greater than its estimated recoverable amount.
Gains and losses on disposal or scrapping of property, plant and equipment, being the difference between the net proceeds on disposal or scrapping and the carrying amount, are recognised in the statement of comprehensive income.
1.5 Financial instruments The Group classifies its financial instruments in the following
categories: available-for-sale financial assets, loans and receiv-ables, financial liabilities and derivatives at fair value through profit and loss. The classification depends on the purpose for which the financial instruments were acquired. Management determines the classification of its financial instruments at initial recognition and re-evaluates such designations when circumstances indicate that reclassification is permitted. The Group assesses at each statement of financial position date whether there is objective evidence that a financial instru-ment or a group of financial instruments is impaired.
Financial assets are derecognised when the contractual rights to the cash flows from the financial assets expire or have been transferred and the Group has transferred substan-tially all risks and rewards of ownership. Financial liabilities are derecognised when they are extinguished, i.e. when the contractual obligation is discharged, cancelled or expires.
1.6 Derivative financial instruments Derivatives, being forward foreign exchange rate contracts,
categorised as at fair value through profit or loss, are either assets or liabilities. A classification between current and non-current is made based on the remaining contractual maturity of the foreign exchange rate contracts over the following 12 months. Purchases and settlements of deriva-tive financial instruments are initially recognised on the trade date at fair value and are subsequently carried at fair value. Transaction costs are expensed as it is incurred. Realised and unrealised gains and losses arising from changes in the fair value of derivative financial instruments are included in the statement of comprehensive income as other income or other expenses in the period in which they arise. The fair value of forward foreign exchange rate contracts is deter-mined using exchange rates at the statement of financial position date. The Group does not apply hedge accounting.
1.7 Available-for-sale financial assets The Group’s listed and unlisted equity investments are classi-
fied as financial assets available-for-sale. Purchases and sales of available-for-sale investments are recognised on the trade date at fair value, including transaction costs. Investments are subsequently carried at fair value. Realised and unreal-ised gains and losses arising from changes in the fair value of these investments are recognised in other comprehensive income and accumulated in a reserve within equity. When available-for-sale investments are sold or impaired, the accumulated fair value adjustments recognised in equity are included in the statement of comprehensive income as gains and losses from the disposal of investments. These invest-ments are included in non-current assets, unless manage-ment intends to dispose of the investments within 12 months of the statement of financial position date.
Interest on available-for-sale securities calculated using the effective interest method is recognised in the statement of comprehensive income as part of other income. Dividends on available-for-sale equity instruments are recognised in the statement of comprehensive income as part of other income
Notes to the Annual Financial Statements (continued)Shoprite Holdings Ltd and its Subsidiaries for the year ended June 2011

49
when the Group’s right to receive payments is established. The fair value of these investments is based on quoted
transaction prices (for listed investments) or the underlying net asset value (for unlisted investments). If the market for a finan-cial asset is not active (and for unlisted securities), the Group establishes fair value by using recognised valuation techniques.
For the purposes of impairment testing a significant or prolonged decline in the fair value of the equity instrument below its cost is considered as an indicator that the securi-ties are impaired. If any such evidence exists for available-for-sale financial assets, the cumulative loss – measured as the difference between the acquisition cost and the current fair value, less any impairment loss on that financial asset previously recognised in profit or loss – is removed from equity and recognised in the statement of comprehensive income. Impairment losses on equity instruments recog-nised in the statement of comprehensive income are not reversed through the statement of comprehensive income.
1.8 Loans and receivables Loans and receivables are non-derivative financial assets with
fixed or determinable payments that are not quoted in an active market. They arise when the Group provides money, goods or services directly to a debtor with no intention of trading the receivable, and purchases and sales are recognised at trade date at fair value, including transaction costs. Loans and receivables are subsequently carried at amortised cost using the effective-interest method. These financial assets are included under current assets unless it matures later than 12 months after statement of financial position date.
If there is objective evidence that an impairment loss has been incurred, the amount of the loss is measured as the difference between the loans and receivables carrying amount and the present value of the estimated future cash flows discounted at the original effective interest rate applicable to the relevant loans and receivables. The carrying amount will be reduced and the loss recognised in the statement of comprehensive income.
1.9 Investments in subsidiaries The Company’s investments in the ordinary shares of its
subsidiaries are carried at cost less impairment losses and, if denominated in foreign currencies, are translated at historical rates. Purchases and sales of these investments are recog-nised on the trade date at cost, including transaction costs.
1.10 Deferred income tax Deferred income tax is provided, using the liability method,
for calculated income tax losses and temporary differences arising between the tax bases of assets and liabilities and their carrying values for financial reporting purposes. However, the deferred income tax is not accounted for if it arises from initial recognition of an asset or liability in a trans-action other than a business combination that, at the time of the transaction, affects neither accounting nor taxable profit nor loss. Currently enacted tax rates and laws are used to determine deferred income tax. Deferred income tax assets are recognised only to the extent that it is probable that
future taxable profit will be available against which tempo-rary differences can be utilised. Management applies judg-ment to determine whether sufficient future taxable profit will be available after considering, amongst others, factors such as profit histories, forecasted cash flows and budgets.
Deferred income tax is provided on temporary differ-ences arising on the consolidation of investments in subsid-iaries and joint ventures, except where the timing of the reversal of the temporary difference can be controlled by the Group, and it is probable that the temporary difference will not reverse in the foreseeable future.
The Group is subject to taxes in numerous jurisdictions. Significant judgment is required in determining worldwide accrual for income taxes. There are many transactions and calculations during the ordinary course of business for which the ultimate tax determination is uncertain. The Group recog-nises liabilities for anticipated tax audit issues based on best informed estimates of whether additional taxes will be due. Where the final tax outcome of these matters is different from the amounts that were initially recorded, such differ-ences will impact the income tax and deferred income tax provisions in the period in which such determination is made.
1.11 Intangible assets 1.11.1 GOODWILL Goodwill represents the excess of the cost of an acquisition
over the fair value of the Group’s share of the net assets of the acquired subsidiary or operation at the date of acquisition. Goodwill denominated in a foreign currency is translated at closing rates. Goodwill is tested for impairment annually and whenever there is indication of impairment. Goodwill is carried at cost less accumulated impairment losses. Goodwill is allocated to cash-generating units (CGUs) for the purpose of impairment testing. The allocation is made to those CGUs or groups of CGUs that are expected to benefit from the busi-ness combination in which the goodwill arose. Each of those CGUs represents the Group’s investment in a trading unit or a group of trading units. Gains and losses on the disposal of an entity that has related goodwill include the carrying amount of the related goodwill. An impairment loss recognised for good-will shall not be reversed in a subsequent period.
1.11.2 SOFTWARE Software represents all costs incurred to acquire the assets
and bring it into use. These costs are amortised over the estimated useful life of the relevant software, being between three and seven years, on a straight-line basis.
Costs associated with implementing or maintaining soft-ware are recognised as an expense when incurred. Costs that are directly associated with the purchase and customisation of identifiable and unique software controlled by the Group, and that will probably generate future economic benefits beyond one year, are recognised as intangible assets. Direct costs include the software development employee costs and an appropriate portion of relevant overheads.
Software’s useful lives are reviewed at each statement of financial position date. If appropriate, adjustments are made and accounted for prospectively as a change in estimate.
SHOPRITE HOLDINGS LTD INTEGRATED REPORT 2011
50
1.11.3 TRADEMARKS Acquired trademarks and licences are initially shown at
historical cost and trademarks and licences acquired in a business combination are recognised at fair value at the acquisition date. Trademarks have a finite useful life and are subsequently measured at cost less accumulated amortisa-tion and impairment losses. Amortisation is calculated using the straight-line method to allocate the cost of trademarks and licences over their estimated useful lives, being 16 to 20 years. The useful lives are reviewed at each statement of financial position date. If appropriate, adjustments are made and accounted for prospectively as a change in estimate.
1.11.4 CUSTOMER RELATIONSHIPS Customer relationships acquired in a business combination
are recognised at fair value at the acquisition date. The customer relationships have a finite useful life and are carried at cost less accumulated amortisation. Amortisation is calculated using the straight-line method over the expected useful life of 10 years.
1.12 Non-current assets held for sale Non-current assets and/or disposal groups are classified as
assets held for sale and are stated at the lower of the carrying amount and fair value less cost to sell if their carrying amount will be recovered principally through a sale transaction rather than through continued use and this sale is considered highly probable.
1.13 Inventories Trading inventories are stated at the lower of cost, using the
weighted average cost formula, and net realisable value. The weighted average cost formula is determined by applying the retail inventory method. The cost of merchandise is the net of: invoice price of merchandise; insurance; freight; customs duties; an appropriate allocation of distribution costs; trade discounts; rebates and settlement discounts. The retail method approximates the weighted average cost and is determined by reducing the sales value of the inventory by the appropriate percentage gross margin. The percentage used takes into account inventory that has been marked down below original selling price. An average percentage per retail department is used. Net realisable value is the esti-mated selling price in the ordinary course of business.
1.14 Trade and other receivables Trade and other receivables are recognised at trade date at
fair value. Subsequent recognition is measured at amortised cost using the effective-interest method, less allowance made for impairment of these receivables. An allowance for impairment of trade receivables is established when there is objective evidence that the Group will not be able to collect all amounts due according to the original terms of the receiv-ables. Significant financial difficulties of the debtor, proba-bility that the debtor will enter bankruptcy or financial reorganisation, and default or delinquency in payments (more than 30 days overdue) are considered indicators that the trade receivable is impaired. The amount of the allow-
ance is the difference between the carrying amount and the recoverable amount, being the present value of the expected cash flows, discounted at the original effective interest rate. Any resulting impairment losses are included in other expenses in the statement of comprehensive income. The impairment of instalment sale receivables is done on a collective basis due to the wide-spread customer base. When a receivable is uncollectible, it is written off against the allowance for impairment for receivables. Subsequent recoveries of amounts previously written off are recognised in the statement of comprehensive income.
1.15 Leases 1.15.1 WHERE THE GROUP IS THE LESSEE Leases of assets under which a significant portion of the
risks and rewards of ownership are effectively retained by the lessor are classified as operating leases. Certain premises and other assets are leased. Payments made in respect of operating leases with a fixed escalation clause are charged to the statement of comprehensive income on a straight-line basis over the lease term. All other lease payments are expensed as they become due. Incentives paid to enter into a lease agreement are expensed in the statement of comprehensive income as operating lease expense over the lease term. Minimum rentals due after year-end are reflected under commitments.
When an operating lease is terminated before the lease period has expired, any payment required to be made to the lessor by way of penalty is recognised as an expense and any unamortised portion of the fixed escalation lease accrual is recognised in the statement of comprehensive income in the period in which termination takes place.
1.15.2 WHERE THE GROUP IS THE LESSOR Portions of owner-occupied properties and leased proper-
ties are leased or subleased out under operating leases. The owner-occupied properties are included in property, plant and equipment in the statement of financial position. Rental income in respect of operating leases with a fixed escalation clause is recognised on a straight-line basis over the lease term. Incentives received to enter into a lease agreement are released to the statement of comprehensive income as operating lease income over the lease term. All other rental income is recognised as it becomes due.
When an operating lease is terminated before the lease period has expired, any payment received from the lessee by way of penalty is recognised as income and any unamor-tised portion of the fixed escalation lease accrual is recog-nised in the statement of comprehensive income in the period in which termination takes place.
1.16 Cash and cash equivalents and bank overdrafts Cash and cash equivalents and bank overdrafts are carried
at cost and, if denominated in foreign currencies, are trans-lated at closing rates. Cash comprises cash on hand and cash at banks. Cash equivalents are short-term highly liquid investments that are readily convertible to known amounts of cash and are subject to an insignificant risk of change in
Notes to the Annual Financial Statements (continued)Shoprite Holdings Ltd and its Subsidiaries for the year ended June 2011

51
value. Bank overdrafts are disclosed separately on the face of the statement of financial position.
1.17 Share capital Ordinary shares and non-convertible, non-participating
deferred shares, including incremental costs directly attribut-able to the issue of new shares, are both classified as equity.
Where entities controlled by the Group purchase the Company’s shares, the consideration paid, including attribut-able transaction costs net of income taxes, is deducted from capital and reserves attributable to equity holders as treasury shares until they are sold. Where such shares are subsequently sold, any consideration received is included in capital and reserves attributable to equity holders. Dividends received on treasury shares are eliminated on consolidation.
1.18 Borrowings Borrowings are recognised initially at fair value, net of trans-
action costs incurred. Borrowings are subsequently stated at amortised cost and any difference between the proceeds (net of transaction costs) and the redemption value is recognised in the statement of comprehensive income over the period of the borrowings using the effective interest method. Borrowings are classified as current liabilities unless the Group has the unconditional right to defer settlement of the liability for at least 12 months after the statement of financial position date.
Preference shares, which carry non-discretionary dividend obligations, are classified as non-current liabilities at amortised cost. Amortised cost is calculated using the effective-interest yield method. The dividends on these preference shares are recognised in the statement of comprehensive income as finance costs.
1.19 Provisions Provisions are recognised when the Group has a present
legal or constructive obligation as a result of past events; it is probable that an outflow of resources embodying economic benefits will be required to settle the obligation, and a reliable estimate of the amount of the obligation can be made. The Group has discounted provisions to their present value where the effect of the time value of money is material. The notional interest charge representing the unwinding of the provision discounting is included in the statement of comprehensive income.
1.19.1 ONEROUS LEASE CONTRACTS The Group recognises a provision for onerous lease
contracts when the expected benefits, including subleasing income, to be derived from non-cancellable operating lease contracts are lower than the unavoidable costs of meeting the contract obligations. The unavoidable contracted costs are applied over the remaining periods of the relevant lease agreements with an estimated average of three years. The notional interest charge relating to the unwinding of the provisions discounting is included in the statement of comprehensive income as finance costs.
1.19.2 PROVISION FOR OUTSTANDING INSURANCE CLAIMS The Group recognises a provision for the estimated direct
cost of settling all outstanding claims at year-end. The provi-sion for outstanding claims at year-end includes a provision for cost of claims incurred but not yet reported at year-end as well as for the cost of claims reported but not yet settled at year-end. The provision for cost of claims incurred but not yet reported (IBNR) at year-end is determined by using established claims patterns. Full provision is made for the cost of claims reported but not yet settled at year-end by using the best information available.
1.19.3 LONG-TERM EMPLOYEE BENEFITS Long-term employee benefits are provided to employees
who achieve certain predetermined milestones of service within the Group. The Group’s obligation under these plans is valued by independent qualified actuaries at year-end and the corresponding liability is raised. Payments are set off against the liability. Movements in the liability, including notional interest, resulting from the valuation by the actu-aries are charged against the statement of comprehensive income as employee benefits.
1.19.4 REINSTATEMENT PROVISION Where it has a contractual obligation in respect of certain
operating lease agreements, the Group provides for expected reinstatement costs to be incurred at the expiry of the lease.
1.20 Trade and other payables Trade and other payables are recognised initially at fair value
and subsequently at amortised cost using the effective interest method.
Financial guarantee contracts are recognised initially at fair value and subsequently at the higher of: the initially recognised fair value, less appropriate cumulative amortisa-tion recognised on a straight-line basis over the estimated duration of the contract, or an amount that is the best estimate of the expenditure required to settle the present obligation at statement of financial position date. Intra-group financial guarantees are eliminated on consolidation.
When the financial guarantee contract is issued by the Company to a subsidiary the fair value at initial recognition is capitalised as part of the investment in the relevant subsidiary.
1.21 Employee benefits 1.21.1 PENSION OBLIGATIONS Group companies operate various pension schemes. The
schemes are funded through payments to trustee-adminis-tered funds in accordance with the plan terms.
Provident fund A defined-contribution plan is a pension plan under which
the Group pays fixed contributions into a separate entity. The Group has no legal or constructive obligations to pay further contributions if the fund does not hold sufficient assets to pay all employees the benefits relating to employee service in the current and prior periods.
SHOPRITE HOLDINGS LTD INTEGRATED REPORT 2011
52
The Group’s contributions to defined contribution plans in respect of services rendered in a particular period are recognised as an expense in that period. Additional contri-butions are recognised as an expense in the period during which the associated services are rendered by employees.
1.21.2 POST-RETIREMENT MEDICAL BENEFITS The Group provides for post-retirement medical benefits,
where they exist. The expected costs of these benefits are accrued over the period of employment based on past services and charged to the statement of comprehensive income as employee benefits. This post-retirement medical benefit obligation is measured at present value by discounting the estimated future cash outflows using interest rates of govern-ment bonds that are denominated in the currency in which the benefits will be paid and that have the terms to maturity approximating the terms of the related post-employment liability. The future cash outflows are estimated using amongst others the following assumptions: health-care cost inflation; discount rates; salary inflation and promotions and experience increases; expected mortality rates; expected retirement age; and continuation at retirement. Valuations of this obligation are carried out annually by independent qualified actuaries in respect of past-service liabilities using the projected unit credit method. Actuarial gains or losses and settlement premiums, when it occurs, are recognised immediately in the statement of comprehensive income as employee benefits.
1.21.3 CASH-SETTLED SHARE-BASED PAYMENTS The Group recognises a liability for cash-settled share-
based payments calculated at current fair value determined at each statement of financial position date. The fair value is calculated using relevant pricing models. This amount is expensed through the statement of comprehensive income over the vesting periods.
1.21.4 BONUS PLANS The Group recognises a liability and an expense for
bonuses, based on formulas that take into consideration the Group’s trading profit after certain adjustments. The accrual for this liability is made where a contractual or constructive obligation exists.
1.22 Impairment of non-financial assets Non-financial assets that have an indefinite useful life are
not subject to depreciation and amortisation and are tested for impairment at each statement of financial position date. Assets that are subject to depreciation and amortisation are reviewed for impairment whenever events or changes in circumstances indicate that the full carrying amount may not be recoverable. The determination of whether an asset is impaired requires significant management judgment and, amongst others, the following factors will be considered: duration and extent to which the fair value of the assets is less than its cost; industry, geographical and sector performance; changes in regional economies; and opera-tional and financing cash flows.
Where the carrying value of an asset exceeds its esti-
mated recoverable amount, the carrying value is impaired and the asset is written down to its recoverable amount. The recoverable amount is calculated as the higher of the asset’s fair value less cost to sell and the value in use. These calcula-tions are prepared based on management’s assumptions and estimates such as forecasted cash flows; management budgets and industry, regional and geographical operational and financial outlooks. For the purpose of impairment testing the assets are allocated to cash-generating units (CGUs) or a group of CGUs. CGUs are the lowest levels for which sepa-rately identifiable cash flows can be determined. The related impairment expense is charged to the statement of compre-hensive income as expenses of a capital nature.
The Group assesses at each reporting date whether there is any indication that an impairment loss recognised in prior periods for an asset other than goodwill may no longer exist or may have decreased. If any such indication exists the Group will immediately recognise the reversal as income of a capital nature in the statement of comprehen-sive income. An impairment loss recognised for goodwill shall not be reversed in a subsequent period.
1.23 Revenue recognition Revenue comprises the fair value of the consideration
received or receivable for the sale of merchandise from ordinary Group-operating activities, net of value added tax, rebates and discounts and after eliminating sales within the Group. Sales are recognised upon delivery of products and customer acceptance. Payment is usually received via cash, debit card or credit card. Related card transaction costs are recognised in the statement of comprehensive income as other expenses. When merchandise is sold under instal-ment sale agreements, the present value of the instalment sale payments is recognised as a receivable.
1.24 Other operating income Other operating income is recognised as follows:
1.24.1 FINANCE INCOME EARNED When merchandise is sold under instalment sale agreements,
the present value of the instalment sale payments is recog-nised as a receivable. The difference between the gross receiv-able and the present value of the receivable is recognised as unearned finance income. Finance income is recognised over the term of the instalment sale using the effective-interest method, which reflects a constant periodic rate of return.
1.24.2 RENTAL INCOME Rental income in respect of operating leases with a fixed
escalation clause is recognised on a straight-line basis over the lease term. All other rental income is recognised as it becomes due. Refer note 1.15.2.
1.24.3 FRANCHISE FEES RECEIVED Franchise fees received comprises fees received from
franchisees and are recognised when the underlying sales, which give rise to the income, occur.
Notes to the Annual Financial Statements (continued)Shoprite Holdings Ltd and its Subsidiaries for the year ended June 2011

53
1.24.4 PREMIUM INCOME Premium income is recognised in the period it is earned. Net
premiums earned are all written premiums relating to policies incepted during the period less amounts that are unearned at statement of financial position date. Refer note 1.30.2.
1.24.5 INTEREST INCOME Interest income is recognised as it accrues, taking into
account the effective yield on the related asset.
1.24.6 DIVIDEND INCOME Dividend income is recognised when the shareholders’
right to receive payment is established.
1.24.7 GIFT VOUCHERS AND SAVINGS STAMPS Proceeds from the sale of gift vouchers and saving stamps
are initially recognised in other payables, deferring the income. The income is recognised as cash sales of goods when the gift vouchers or savings stamps are redeemed.
1.24.8 COMMISSION RECEIVED The Group acts as a payment office for the services and
products provided by a variety of third parties to the Group’s customers. The agent’s commissions received by the Group from the third parties for the payment office service are recognised as other income. Commissions relating to third-party products are recognised when the underlying third-party payments take place. Commissions relating to third-party services are recognised based on the stage of completion by reference to services performed to date as a percentage of the total services to be performed.
1.25 Borrowing costs Borrowing costs directly attributable to the acquisition,
construction or production of qualifying assets, are capital-ised to the cost of that qualifying asset. General borrowing costs are capitalised by calculating the weighted average expenditure on the qualifying asset and applying a weighted average borrowing rate to the expenditure. Specific borrowing costs are capitalised according to the borrowing costs incurred on the specific borrowing provided the borrowing facility is utilised specifically for the qualifying asset. All other borrowing costs incurred are recognised as an expense in the statement of comprehensive income and are accrued on a time basis by reference to the principal amounts outstanding and at the interest rate applicable.
1.26 Current and deferred income tax The income tax expense for the period comprises current
and deferred income tax. Tax is recognised in the statement of comprehensive income, except to the extent that it relates to items recognised directly in equity, in which case it will also be recognised directly in equity.
The current income tax charge is calculated on the basis of the tax laws enacted or substantively enacted at the statement of financial position date in the countries where the Group operate and generate taxable income.
Dividends declared by South African companies within the
Group are subject to secondary tax on companies (“STC”). The STC expense is included in the statement of comprehen-sive income in the period that the related dividend is paid.
Deferred income tax is calculated and recognised in terms of note 1.10.
1.27 Earnings per share Earnings and headline earnings per share are calculated by
dividing the net profit attributable to equity holders of the Group and headline earnings, respectively, by the weighted average number of ordinary shares in issue during the year, excluding the ordinary shares held by the Group as treasury shares.
For the diluted earnings per share, the weighted average number of ordinary shares in issue is adjusted to assume conversion of all ordinary shares with dilutive potential. Share options, issued in terms of the share option scheme, have dilutive potential. For the share options a calculation is done to determine the number of shares that could have been acquired, at the average market price, based on the mone-tary value of subscription rights attached to outstanding share options in order to determine the “bonus” element; the “bonus” shares are added to the ordinary shares in issue. No adjustment is made to net profit, as the options have no statement of comprehensive income effect.
1.28 Government grants Government grants, being assistance by government in the
form of allowances and refunds for certain expenditure, are recognised at fair value when the Group complies with the conditions attached to the grants and the grants have been received. The grants are recognised, on a systematic basis, in the statement of comprehensive income as a deduction of the related expense over the periods necessary to match them with the related costs.
1.29 Dividends distributed to shareholders Dividends are accounted for on the date they have been
declared by the Company.
1.30 Basis of accounting for underwriting activities 1.30.1 CLASSIFICATION OF CONTRACTS Insurance risk is risk other than financial risk, transferred
from the holder of a contract to the issuer. The accounting policies of the Group are in accordance with the policies for recognition and measurement of short-term insurance contracts as outlined in SAICA Circular 2/2007 and IFRS 4: Insurance Contracts.
Contracts under which the Group accepts significant insurance risk from another party (the policyholder) by agreeing to compensate the policyholder or other benefi-ciary if a specified uncertain future event (the insured event) adversely affects the policyholder or other beneficiary, are classified as insurance contracts.
An insurance risk is deemed significant if, and only if, an insured event could cause an insurer to pay significant addi-tional benefits in any scenario, excluding scenarios that lack commercial substance. If significant additional benefits would be payable in scenarios that have commercial

SHOPRITE HOLDINGS LTD INTEGRATED REPORT 2011
54
substance, the condition in the previous sentence may be met even if the insured event is extremely unlikely or even if the expected (i.e. probability weighted) present value of contingent cash flows is a small proportion of the expected present value of all the remaining contractual cash flows.
1.30.2 RECOGNITION AND MEASUREMENT OF CONTRACTS a) Premiums arising from general insurance business Gross written premiums comprise the premiums on
insurance contracts entered into during the year. Premiums are disclosed gross of commission payable to intermediaries and exclude taxes and levies based on premiums. Premiums are accounted for as income when the risk related to the insurance policy incepts.
b) Unearned premium allowance The allowance for unearned premiums comprises the
proportion of gross premiums written which relate to the unexpired period at the reporting date and is esti-mated to be earned in the following or subsequent financial years. The unearned premium allowance is computed separately for each insurance contract on a basis appropriate to the Group’s release from insured risk, using the 365th method.
c) Claims arising from insurance business Claims incurred in respect of insurance contracts consist
of claims and claims-handling expenses paid during the financial year together with the movement in the provi-sion for incurred but not reported claims. Provisions for incurred but not reported claims comprise provisions for claims arising from insured events that incurred before the statement of financial position date, but which had not been reported to the Group by that date.
d) Provision for outstanding claims Provision is made for the estimated final cost of all
claims that had not been settled by the reporting date, less amounts already paid. Liabilities for unpaid claims are estimated, using the input of assessments for indi-vidual cases reported to the Group and statistical anal-yses, to estimate the expected cost of more complex claims that may be affected by external factors. The Group does not discount its liabilities for unpaid claims.
e) Contingency reserve A contingency reserve is maintained in terms of the
Insurance Act, 1998. The utilisation of this reserve, in case of a catastrophe, is subject to the approval of the Financial Services Board. Transfers to this reserve are reflected in the statement of changes in equity, and are indicated in the statement of financial position as a non-distributable reserve under capital and reserves.
The contingency reserve is calculated as 10% of net written premiums.
f) Reinsurance The Group has evaluated its exposure to risk and deter-
mined that significant reinsurance protection is not required. g) Liabilities and related assets under liability
adequacy test At each statement of financial position date, liability
adequacy tests are performed on the Group’s Insurance
entities to ensure the adequacy of the contract liabilities net of related deferred acquisition cost (DAC) and any related assets (i.e. the value of business acquired assets (VOBA)). In performing these tests, current best esti-mates of future contractual cash flows and claims-handling and administration expenses, as well as invest-ment income from the assets backing such liabilities, are used. Any deficiency is immediately charged to profit or loss initially by writing off DAC or VOBA and by subse-quently establishing a provision for losses arising from liability adequacy tests (the unexpired risk provision).
1.31 Related parties Individuals, as well as their close family members, or enti-
ties are related parties if one party has the ability, directly or indirectly, to control or jointly control the other party or exer-cise significant influence over the other party in making financial and/or operating decisions or if the parties are jointly controlled. Key management personnel are defined as all directors of Shoprite Holdings Ltd and the main trading subsidiary (Shoprite Checkers (Pty) Ltd) of the Group.
1.32 Operating segment information An operating segment is a component of the Group that
engages in business activities which may earn revenues and incur expenses and whose operating results are regu-larly reviewed by the Group’s chief operating decision maker (this being the Shoprite Holdings Ltd board of direc-tors), in order to allocate resources and assess performance and for which discrete financial information is available.
Operating segments, which display similar economic characteristics and have similar products, services, customers, methods of distribution and regulatory environ-ments are aggregated for reporting purposes.
The Group has the following four reportable segments: 1. Supermarkets RSA – all retail operations under the
Shoprite, Checkers, Checkers Hyper, Usave and Hungry Lion brands in South Africa, retailing products such as food, clothing, general merchandise, cosmetics and liquor.
2. Supermarkets Non-RSA – all retail operations under the Shoprite, Checkers, Checkers Hyper, Usave and Hungry Lion brands outside of South Africa, retailing products such as food, clothing, general merchandise, cosmetics and liquor.
3. Furniture – all retail operations under the OK Furniture, OK Power Express, and House & Home brands trading in RSA and Non-RSA, retailing products such as furni-ture, household appliances and home entertainment systems for cash or credit.
4. Other operating segments – all other operations not included in the above segments, trading in RSA and Non-RSA, including franchise operations and retail and wholesale of pharmaceutical products.
These segments were identified and grouped together using a combination of the products and services offered by the segments and the geographical areas in which they operate.
Notes to the Annual Financial Statements (continued)Shoprite Holdings Ltd and its Subsidiaries for the year ended June 2011
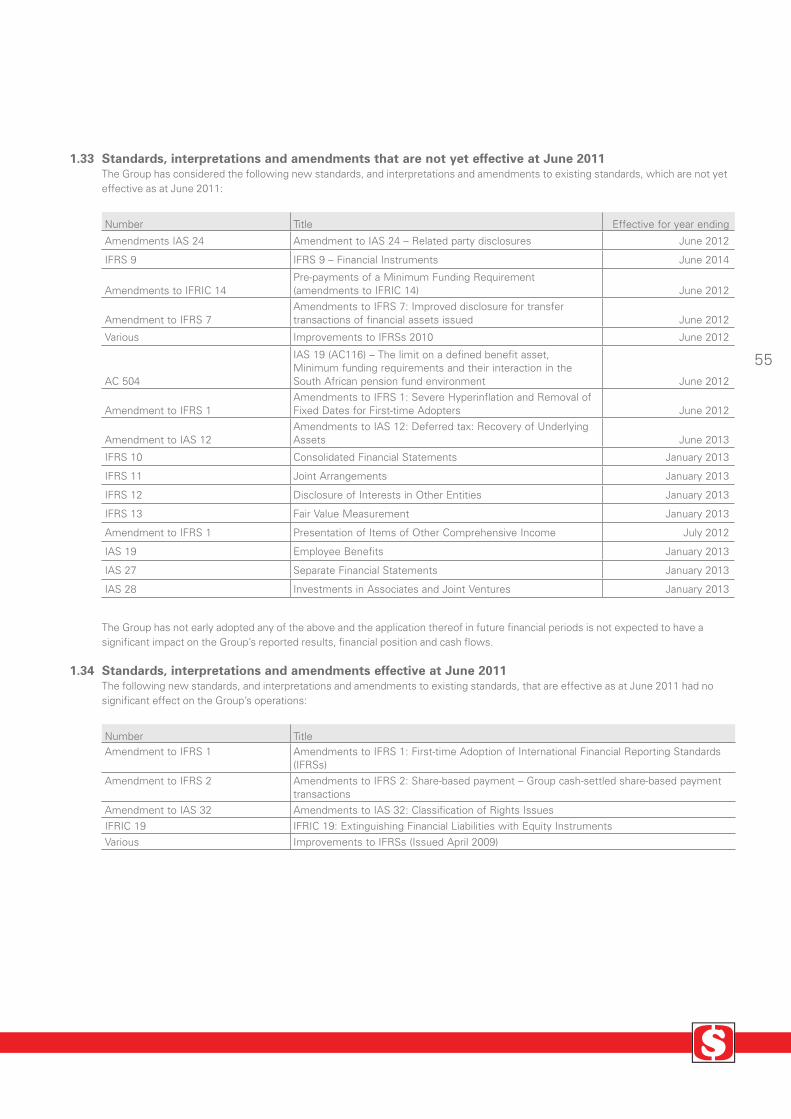
55
1.33 Standards, interpretations and amendments that are not yet effective at June 2011 The Group has considered the following new standards, and interpretations and amendments to existing standards, which are not yet
effective as at June 2011:
Number Title Effective for year ending
Amendments IAS 24 Amendment to IAS 24 – Related party disclosures June 2012
IFRS 9 IFRS 9 – Financial Instruments June 2014
Amendments to IFRIC 14Pre-payments of a Minimum Funding Requirement (amendments to IFRIC 14) June 2012
Amendment to IFRS 7Amendments to IFRS 7: Improved disclosure for transfer transactions of financial assets issued June 2012
Various Improvements to IFRSs 2010 June 2012
AC 504
IAS 19 (AC116) – The limit on a defined benefit asset, Minimum funding requirements and their interaction in the South African pension fund environment June 2012
Amendment to IFRS 1Amendments to IFRS 1: Severe Hyperinflation and Removal of Fixed Dates for First-time Adopters June 2012
Amendment to IAS 12Amendments to IAS 12: Deferred tax: Recovery of Underlying Assets June 2013
IFRS 10 Consolidated Financial Statements January 2013
IFRS 11 Joint Arrangements January 2013
IFRS 12 Disclosure of Interests in Other Entities January 2013
IFRS 13 Fair Value Measurement January 2013
Amendment to IFRS 1 Presentation of Items of Other Comprehensive Income July 2012
IAS 19 Employee Benefits January 2013
IAS 27 Separate Financial Statements January 2013
IAS 28 Investments in Associates and Joint Ventures January 2013
The Group has not early adopted any of the above and the application thereof in future financial periods is not expected to have a significant impact on the Group’s reported results, financial position and cash flows.
1.34 Standards, interpretations and amendments effective at June 2011The following new standards, and interpretations and amendments to existing standards, that are effective as at June 2011 had no significant effect on the Group’s operations:
Number TitleAmendment to IFRS 1 Amendments to IFRS 1: First-time Adoption of International Financial Reporting Standards
(IFRSs)Amendment to IFRS 2 Amendments to IFRS 2: Share-based payment – Group cash-settled share-based payment
transactionsAmendment to IAS 32 Amendments to IAS 32: Classification of Rights IssuesIFRIC 19 IFRIC 19: Extinguishing Financial Liabilities with Equity InstrumentsVarious Improvements to IFRSs (Issued April 2009)

56
Notes to the Annual Financial Statements (continued)Shoprite Holdings Ltd and its Subsidiaries for the year ended June 2011
SHOPRITE HOLDINGS LTD INTEGRATED REPORT 2011
2 OPERATING SEGMENT INFORMATION2.1 Analysis per reportable segment
June 2011
Supermarkets RSA
Supermarkets Non-RSA Furniture
Other operating segments Consolidated
R’000 R’000 R’000 R’000 R’000
Sales of merchandise External 57 213 793 7 316 698 3 059 648 4 707 638 72 297 777 Inter-segment 1 512 692 — — — 1 512 692
58 726 485 7 316 698 3 059 648 4 707 638 73 810 469
Trading profit 3 302 262 415 524 131 484 137 427 3 986 697
Depreciation and amortisation 831 309 111 274 41 025 22 834 1 006 442
Total assets 14 600 472 2 996 263 2 035 346 1 071 676 20 703 757
June 2010
Supermarkets RSA
Supermarkets Non-RSA Furniture
Other operating segments Consolidated
R’000 R’000 R’000 R’000 R’000
Sales of merchandise External 53 367 171 7 163 977 3 002 589 3 868 703 67 402 440 Inter-segment 1 366 181 — — — 1 366 181
54 733 352 7 163 977 3 002 589 3 868 703 68 768 621
Trading profit 2 755 207 485 799 131 213 118 222 3 490 441
Depreciation and amortisation 759 170 86 022 41 318 9 609 896 119
Total assets 12 048 136 2 876 407 1 981 388 1 085 766 17 991 697
2.2 Geographical analysisJune 2011
South AfricaOutside South
Africa ConsolidatedR’000 R’000 R’000
Sales of merchandise – external 64 068 311 8 229 466 72 297 777
Non-current assets* 7 569 684 1 327 416 8 897 100
June 2010
South AfricaOutside South
Africa ConsolidatedR’000 R’000 R’000
Sales of merchandise – external 59 378 057 8 024 383 67 402 440
Non-current assets* 6 045 669 1 148 604 7 194 273
*Non-current assets consist of property, plant and equipment, intangible assets and fixed escalation operating lease accruals.
Operating segments were identified based on financial information regularly reviewed by the Shoprite Holdings Ltd board of directors (identified as the chief operating decision maker of the Group in terms of the IFRS 8 requirements) for performance assessments and resource allocations.
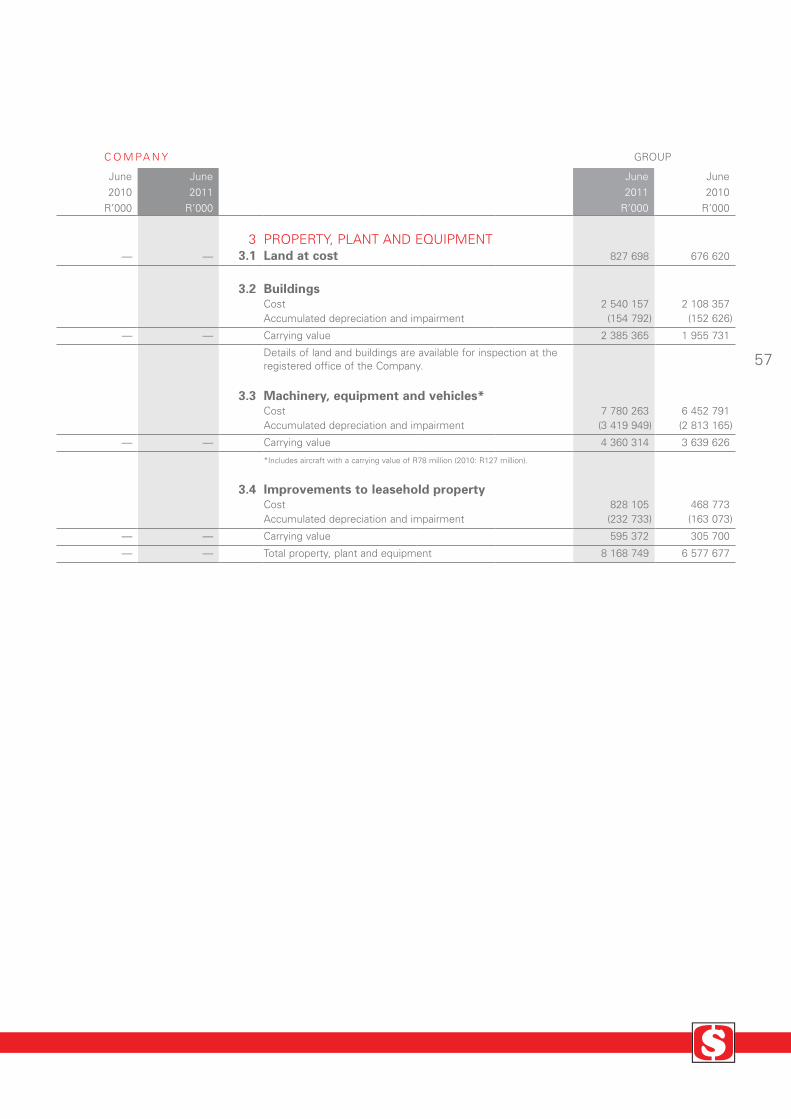
57
Notes to the Annual Financial Statements (continued)Shoprite Holdings Ltd and its Subsidiaries for the year ended June 2011
C O M PA N Y GROUP
June June June June2010 2011 2011 2010
R’000 R’000 R’000 R’000
3 PROPERTY, PLANT AND EQUIPMENT — — 3.1 Land at cost 827 698 676 620
3.2 BuildingsCost 2 540 157 2 108 357 Accumulated depreciation and impairment (154 792) (152 626)
— — Carrying value 2 385 365 1 955 731
Details of land and buildings are available for inspection at the registered office of the Company.
3.3 Machinery, equipment and vehicles*Cost 7 780 263 6 452 791 Accumulated depreciation and impairment (3 419 949) (2 813 165)
— — Carrying value 4 360 314 3 639 626
*Includes aircraft with a carrying value of R78 million (2010: R127 million).
3.4 Improvements to leasehold propertyCost 828 105 468 773 Accumulated depreciation and impairment (232 733) (163 073)
— — Carrying value 595 372 305 700
— — Total property, plant and equipment 8 168 749 6 577 677

58
Notes to the Annual Financial Statements (continued)Shoprite Holdings Ltd and its Subsidiaries for the year ended June 2011
SHOPRITE HOLDINGS LTD INTEGRATED REPORT 2011
3. PROPERTY, PLANT AND EQUIPMENT (CONTINUED)
Reconciliation of carrying values
Land Buildings
Machinery, equipment and
vehicles Leasehold
improvements Total
Carrying value at June 2009 455 140 1 498 219 3 145 753 260 475 5 359 587
Additions 239 659 630 413 1 336 847 139 194 2 346 113 Transfer to assets held for sale (note 4) (4 770) (15 994) — (1 278) (22 042)Acquisition of subsidiaries (note 32.5.1) — — 7 985 — 7 985 Disposal — (21 036) (42 279) (50 326) (113 641) Proceeds on disposal — (21 376) (24 898) (53 171) (99 445) Profit/(loss) on disposal and scrapping — 340 (17 381) 2 845 (14 196)Depreciation — (24 279) (781 329) (42 662) (848 270)Reversal of impairment (note 3.5) — 7 876 — — 7 876 Impairment (note 3.5) — (18 567) (3 941) — (22 508)Exchange rate differences (13 409) (100 901) (23 410) 297 (137 423)
Carrying value at June 2010 676 620 1 955 731 3 639 626 305 700 6 577 677
Additions 203 103 722 982 1 705 964 221 224 2 853 273 Reclassification (55 571) (140 913) (12) 163 585 (32 911)Reclassification to software — — (145) — (145)Transfer to assets held for sale (note 4) — (55 808) — — (55 808)Transfer from assets held for sale (note 4) — — — 6 989 6 989 Acquisition of subsidiaries and operations (note 32.5.1) 11 000 — 1 228 — 12 228 Disposal — (6 331) (67 837) (27 784) (101 952) Proceeds on disposal (27) (90) (33 371) (29 994) (63 482) Profit/(loss) on disposal and scrapping 27 (6 241) (34 466) 2 210 (38 470)Depreciation (281) (27 653) (854 417) (66 169) (948 520)Reversal of impairment (note 3.5) — 4 984 — — 4 984 Impairment (note 3.5) — (16 745) (44 590) — (61 335)Exchange rate differences (7 173) (50 882) (19 503) (8 173) (85 731)
Carrying value at June 2011 827 698 2 385 365 4 360 314 595 372 8 168 749
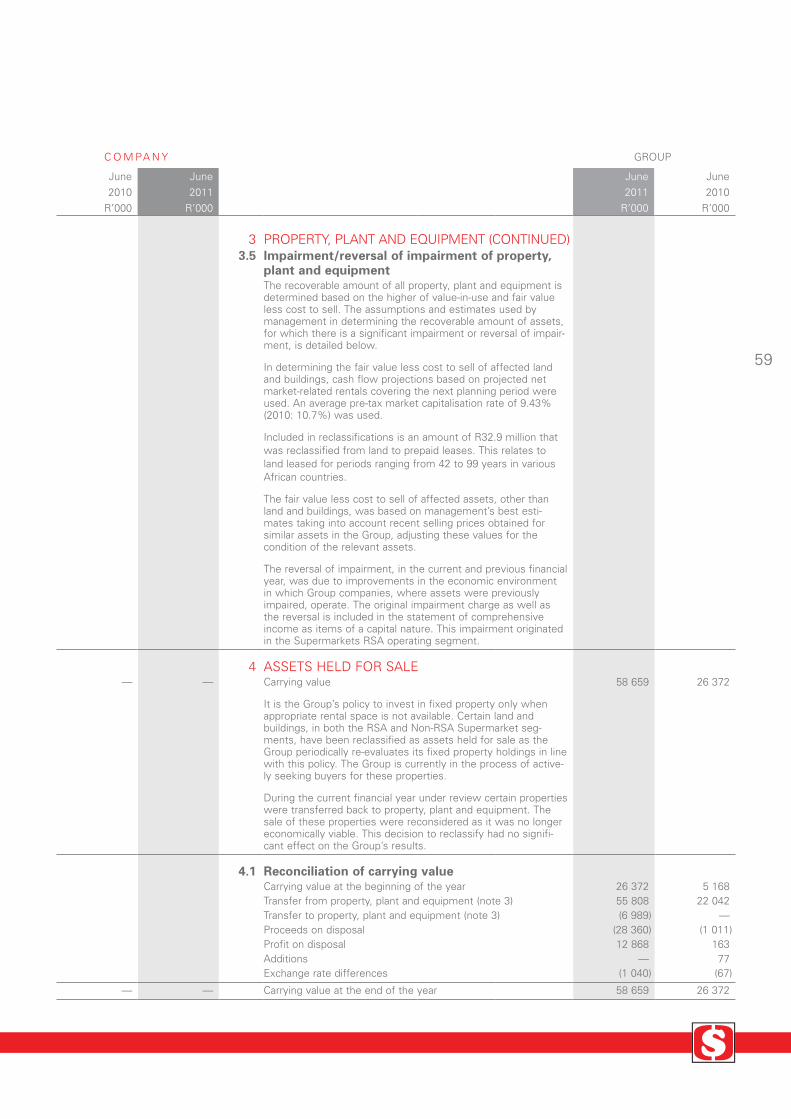
59
Notes to the Annual Financial Statements (continued)Shoprite Holdings Ltd and its Subsidiaries for the year ended June 2011
C O M PA N Y GROUP
June June June June2010 2011 2011 2010
R’000 R’000 R’000 R’000
3 PROPERTY, PLANT AND EQUIPMENT (CONTINUED)3.5 Impairment/reversal of impairment of property,
plant and equipmentThe recoverable amount of all property, plant and equipment is determined based on the higher of value-in-use and fair value less cost to sell. The assumptions and estimates used by management in determining the recoverable amount of assets, for which there is a significant impairment or reversal of impair-ment, is detailed below.
In determining the fair value less cost to sell of affected land and buildings, cash flow projections based on projected net market-related rentals covering the next planning period were used. An average pre-tax market capitalisation rate of 9.43% (2010: 10.7%) was used.
Included in reclassifications is an amount of R32.9 million that was reclassified from land to prepaid leases. This relates to land leased for periods ranging from 42 to 99 years in various African countries.
The fair value less cost to sell of affected assets, other than land and buildings, was based on management’s best esti-mates taking into account recent selling prices obtained for similar assets in the Group, adjusting these values for the condition of the relevant assets.
The reversal of impairment, in the current and previous financial year, was due to improvements in the economic environment in which Group companies, where assets were previously impaired, operate. The original impairment charge as well as the reversal is included in the statement of comprehensive income as items of a capital nature. This impairment originated in the Supermarkets RSA operating segment.
4 ASSETS HELD FOR SALE — — Carrying value 58 659 26 372
It is the Group’s policy to invest in fixed property only when appropriate rental space is not available. Certain land and buildings, in both the RSA and Non-RSA Supermarket seg-ments, have been reclassified as assets held for sale as the Group periodically re-evaluates its fixed property holdings in line with this policy. The Group is currently in the process of active-ly seeking buyers for these properties.
During the current financial year under review certain properties were transferred back to property, plant and equipment. The sale of these properties were reconsidered as it was no longer economically viable. This decision to reclassify had no signifi-cant effect on the Group’s results.
4.1 Reconciliation of carrying valueCarrying value at the beginning of the year 26 372 5 168 Transfer from property, plant and equipment (note 3) 55 808 22 042 Transfer to property, plant and equipment (note 3) (6 989) — Proceeds on disposal (28 360) (1 011)Profit on disposal 12 868 163 Additions — 77 Exchange rate differences (1 040) (67)
— — Carrying value at the end of the year 58 659 26 372

60
Notes to the Annual Financial Statements (continued)Shoprite Holdings Ltd and its Subsidiaries for the year ended June 2011
C O M PA N Y GROUP
June June June June2010 2011 2011 2010
R’000 R’000 R’000 R’000
SHOPRITE HOLDINGS LTD INTEGRATED REPORT 2011
5 INTERESTS IN SUBSIDIARIES 211 490 211 490 Investments in ordinary shares
1 443 013 1 443 013 Investments in preference shares 76 308 10 774 Amounts owing by subsidiaries
1 730 811 1 665 277 — —
Analysis of total interests in subsidiaries1 654 503 1 654 503 Non-current
76 308 10 774 Current
1 730 811 1 665 277 — —
Detail analysis of the Company’s interests in subsidiaries are given in annexure A.
Investments in preference shares consist of convertible and redeemable, both under certain conditions, non-cumulative preference shares.
Amounts owing by subsidiaries of the Company are interest-free, unsecured and are payable on demand.
6 AVAILABLE-FOR-SALE INVESTMENTSUnlisted share investments Analysis of total available-for-sale investments
— — 100 “S” class ordinary shares in RMB Global Solutions (Pty) Ltd 59 656 57 389
This investment is denominated in ZAR and the fair value is based on the underlying net asset value of RMB Global Solutions (Pty) Ltd as it is mainly represented by short-term USD bank deposits at financial institutions with a Moody’s long-term credit rating of Aa2.za. The maximum exposure to credit risk at the reporting date is the carrying value.
The directors’ valuation of the unlisted investments is equal to the carrying value.
7 LOANS AND RECEIVABLESPreference share investment (note 7.1) 32 640 32 983 Amounts owing by franchisees (note 7.2) 16 886 20 026 Other 1 008 1 385
— — 50 534 54 394
Analysis of total loans and receivablesNon-current 4 308 8 553 Current 46 226 45 841
— — 50 534 54 394
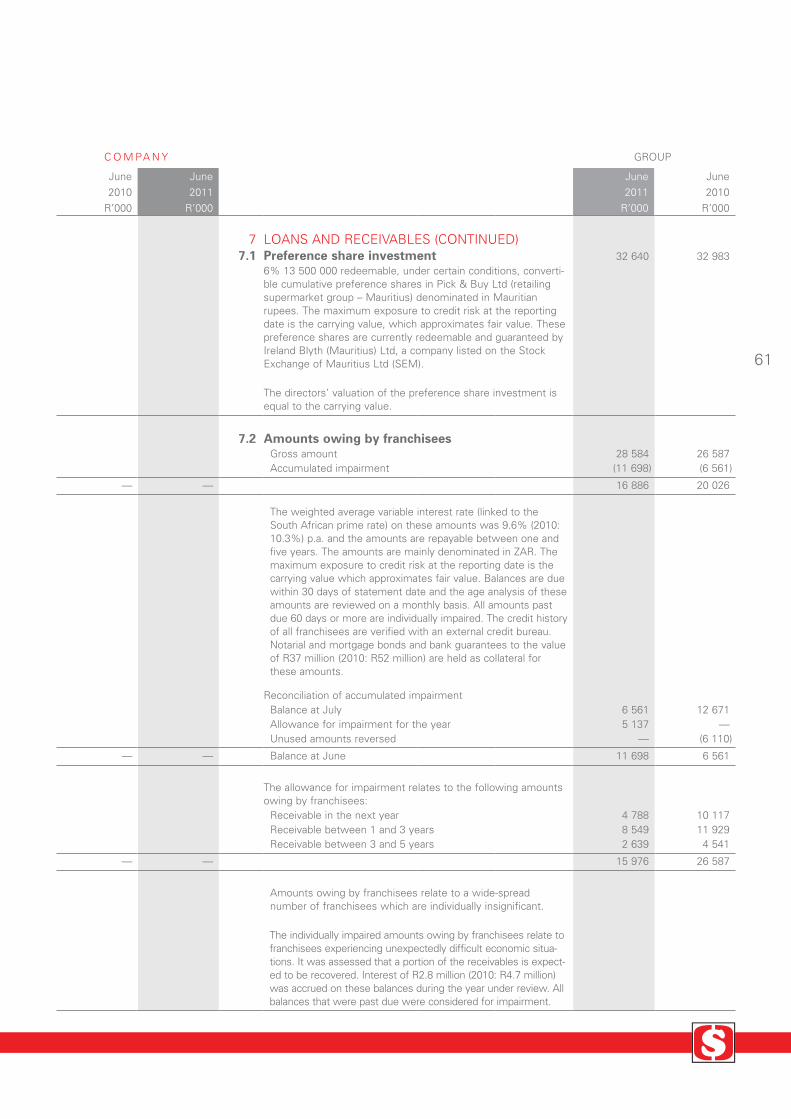
61
Notes to the Annual Financial Statements (continued)Shoprite Holdings Ltd and its Subsidiaries for the year ended June 2011
C O M PA N Y GROUP
June June June June2010 2011 2011 2010
R’000 R’000 R’000 R’000
7 LOANS AND RECEIVABLES (CONTINUED)7.1 Preference share investment 32 640 32 983
6% 13 500 000 redeemable, under certain conditions, converti-ble cumulative preference shares in Pick & Buy Ltd (retailing supermarket group – Mauritius) denominated in Mauritian rupees. The maximum exposure to credit risk at the reporting date is the carrying value, which approximates fair value. These preference shares are currently redeemable and guaranteed by Ireland Blyth (Mauritius) Ltd, a company listed on the Stock Exchange of Mauritius Ltd (SEM).
The directors’ valuation of the preference share investment is equal to the carrying value.
7.2 Amounts owing by franchisees Gross amount 28 584 26 587 Accumulated impairment (11 698) (6 561)
— — 16 886 20 026
The weighted average variable interest rate (linked to the South African prime rate) on these amounts was 9.6% (2010: 10.3%) p.a. and the amounts are repayable between one and five years. The amounts are mainly denominated in ZAR. The maximum exposure to credit risk at the reporting date is the carrying value which approximates fair value. Balances are due within 30 days of statement date and the age analysis of these amounts are reviewed on a monthly basis. All amounts past due 60 days or more are individually impaired. The credit history of all franchisees are verified with an external credit bureau. Notarial and mortgage bonds and bank guarantees to the value of R37 million (2010: R52 million) are held as collateral for these amounts.
Reconciliation of accumulated impairment Balance at July 6 561 12 671 Allowance for impairment for the year 5 137 — Unused amounts reversed — (6 110)
— — Balance at June 11 698 6 561
The allowance for impairment relates to the following amounts owing by franchisees: Receivable in the next year 4 788 10 117 Receivable between 1 and 3 years 8 549 11 929 Receivable between 3 and 5 years 2 639 4 541
— — 15 976 26 587
Amounts owing by franchisees relate to a wide-spread number of franchisees which are individually insignificant.
The individually impaired amounts owing by franchisees relate to franchisees experiencing unexpectedly difficult economic situa-tions. It was assessed that a portion of the receivables is expect-ed to be recovered. Interest of R2.8 million (2010: R4.7 million) was accrued on these balances during the year under review. All balances that were past due were considered for impairment.

62
Notes to the Annual Financial Statements (continued)Shoprite Holdings Ltd and its Subsidiaries for the year ended June 2011
C O M PA N Y GROUP
June June June June2010 2011 2011 2010
R’000 R’000 R’000 R’000
SHOPRITE HOLDINGS LTD INTEGRATED REPORT 2011
8 DEFERRED INCOME TAX ASSETS 200 237 Provisions and accruals 316 404 242 515
— — Allowances on property, plant and equipment (300 964) (235 619) — — Fixed escalation operating lease accrual 144 251 138 429 — — Allowances on intangible assets (25 947) (28 088) — — Share-based payment accrual 158 826 140 260 — — Unrealised exchange rate differences 13 561 15 242 — — Fair value differences (8 337) (8 021) — — Tax losses 28 663 23 959
200 237 326 457 288 677
The movement in the deferred income tax assets is as follows: 108 200 Carrying value at the beginning of the year 288 677 277 951 92 37 Charge to profit for the year 46 191 42 770 92 37 Provisions and accruals 71 030 (13 197) — — Allowances on property, plant and equipment (57 473) (47 998) — — Fixed escalation operating lease accrual 6 225 4 783 — — Allowances on intangible assets 2 141 1 503 — — Share-based payment accrual 18 747 72 374 — — Unrealised exchange rate differences 310 12 543 — — Tax losses 5 310 12 942 — — Tax rate change (99) (180) — — Charged to other comprehensive income (317) (1 341) — — Transfer from deferred tax liability (5 290) (11 028) — — Acquisition of subsidiaries and operations (note 32.5.1) — (17 457) — — Exchange rate differences (2 804) (2 218)
200 237 Carrying value at the end of the year 326 457 288 677
— — Net taxable temporary differences to be settled after more than 12 months (88 057) (101 757)
200 237 Net deductable temporary differences to be recovered within 12 months 414 514 390 434
200 237 326 457 288 677
9 INTANGIBLE ASSETSGoodwill (note 9.1) 180 981 167 074 Software (note 9.2) 451 143 348 737 Trademarks (note 9.3) 41 378 44 258 Customer relationships (note 9.4) 45 603 50 968
— — 719 105 611 037
9.1 GoodwillGross amount 217 269 202 331 Impairment losses (36 288) (35 257)
— — Carrying value 180 981 167 074
Reconciliation of carrying valueCarrying value at the beginning of the year 167 074 91 216 Acquisition of subsidiaries and operations (note 32.5.1) 14 676 75 858 Impairment (note 9.1.1) (769) —
— — Carrying value at the end of the year 180 981 167 074

63
Notes to the Annual Financial Statements (continued)Shoprite Holdings Ltd and its Subsidiaries for the year ended June 2011
C O M PA N Y GROUP
June June June June2010 2011 2011 2010
R’000 R’000 R’000 R’000
9 INTANGIBLE ASSETS (CONTINUED)9.1 Goodwill (continued)
9.1.1 IMPAIRMENT OF GOODWILLGoodwill is allocated to the Group’s cash-generating units (CGUs). The recoverable amount of a CGU is determined based on value-in-use calculations. These calculations use cash flow projections based on financial budgets approved by manage-ment covering five-year planning periods. Cash flows beyond these planning periods are extrapolated using an estimated growth rate of 4.6% (2010: 6.0%). This does not exceed the long-term average growth rate for the business in which the CGUs operate. The following represent significant assumptions on which management based cash flow projections.
Supermarket operations % %
Operating margin* 5.9 4.9Growth rate** 4.6 6.0Pre-tax discount rate*** 14.1 15.4
Other operations % %
Operating margin* 6.1 49.3Growth rate** 4.6 6.1Pre-tax discount rate*** 9.3 16.2
* Forecasted operating margin, based on budgets, relating to the specific CGUs to
which goodwill is allocated. This rate does not apply to the Group as a whole.
**Weighted average sales growth rate
***Pre-tax discount rate applied to the cash flow projections
These key assumptions are used for the analysis of each CGU within the geographical segment. Management determines budgeted sales growth rates and gross profit margins based on past performance and its expectations of the retail market with-in the relevant country or area. The discount rates used reflect specific risks relating to the relevant segments.
The impairment charge in the current financial year under review arose in a CGU in the Supermarket RSA operating segment. This impairment was the result of a significant reduction in the future expected sales due to a weakening in the general economic conditions in which this CGU operates.

64
Notes to the Annual Financial Statements (continued)Shoprite Holdings Ltd and its Subsidiaries for the year ended June 2011
C O M PA N Y GROUP
June June June June2010 2011 2011 2010
R’000 R’000 R’000 R’000
SHOPRITE HOLDINGS LTD INTEGRATED REPORT 2011
9 INTANGIBLE ASSETS (CONTINUED)9.2 Software
Gross amount 574 714 451 107 Accumulated amortisation and impairment losses (123 571) (102 370)
— — Carrying value 451 143 348 737
Reconciliation of carrying valueCarrying value at the beginning of the year 348 737 225 752 Additions 36 575 30 674 Internally generated 115 371 132 505 Acquisition of subsidiaries and operations (note 32.5.1) — 2 400 Reclassification from property, plant and equipment (note 3) 145 — Proceeds on disposal (1) — Amortisation (49 677) (42 580)Exchange rate differences (7) (14)
— — Carrying value at the end of the year 451 143 348 737
Included in the gross amount of software is R288 million that relates to cost capitalised for software not yet in use. This relates mainly to the implementation of SAP merchandising software.
9.3 TrademarksGross amount 177 756 177 756 Accumulated amortisation (136 378) (133 498)
— — Carrying value 41 378 44 258
Reconciliation of carrying valueCarrying value at the beginning of the year 44 258 37 466 Acquisition of subsidiaries and operations (note 32.5.1) — 9 379 Amortisation (2 880) (2 587)
— — Carrying value at the end of the year 41 378 44 258
9.4 Customer relationshipsGross amount 53 650 53 650 Accumulated amortisation (8 047) (2 682)
— — Carrying value 45 603 50 968
Reconciliation of carrying valueCarrying value at the beginning of the year 50 968 — Acquisition of subsidiaries and operations (note 32.5.1) — 53 650 Amortisation (5 365) (2 682)
— — Carrying value at the end of the year 45 603 50 968
10 FIXED ESCALATION OPERATING LEASE ACCRUALOperating lease receipts straight-lined 9 449 5 943 Less: current (included under trade and other receivables: note 12) (203) (384)
— — 9 246 5 559
11 INVENTORIES — — Trading goods 7 055 867 6 114 538

65
Notes to the Annual Financial Statements (continued)Shoprite Holdings Ltd and its Subsidiaries for the year ended June 2011
C O M PA N Y GROUP
June June June June2010 2011 2011 2010
R’000 R’000 R’000 R’000
12 TRADE AND OTHER RECEIVABLESInstalment sales
— — Gross amount (note 12.1) 1 099 858 1 036 503 — — Accumulated impairment (note 12.2) (118 029) (115 906) — — Unearned finance income (27 066) (25 861)
Insurance contract allowances — — – Unearned premiums (note 12.3) (156 520) (142 298)
— — 798 243 752 438 — — Trade receivables (note 12.4) 881 100 731 390 — — Other receivables (note 12.5) 559 039 473 888 — — Fixed escalation operating lease accrual (note 10) 203 384 — — Amounts owing by joint ventures (note 12.6) 16 805 41 097
— — 2 255 390 1 999 197
12.1 Instalment salesThe Group has entered into various instalment sale agreements for household furniture. The periods of these contracts range between 1 and 2 years and the weighted average interest rate on these receivables is 22.0% (2010: 23.6%) p.a. The amounts are mainly denominated in ZAR. The maximum exposure to cred-it risk at the reporting date is the carrying value which approxi-mates fair value. Instalment sales comprise a wide-spread client base and external credit checks are made to ensure that all instalment sale clients have an appropriate credit history. Furniture items, including appliances and electronic products are held as collateral for all instalment sale agreements.
Instalment sale receivablesFuture minimum instalment payments receivable under non-cancellable instalment sale agreements
Not later than 1 year 647 468 729 648 Later than 1 year not later than 2 years 452 390 306 855
— — 1 099 858 1 036 503
12.2 Accumulated impairmentReconciliation of accumulated impairment
Balance at July 115 906 99 989 Allowance for impairment for the year 41 583 61 042 Receivables written off during the year as uncollectable (54 865) (57 145)Penalty interest accrued 14 578 12 920 Exchange rate differences 1 350 (900)Unused amounts reversed (523) —
— — Balance at June 118 029 115 906
The accumulated impairment relates to actual arrears, individual repayments that are past due, and the age analysis below reflects the period that these amounts are overdue.
30 days 19 918 20 024 60 days 12 665 13 058 90 days 9 515 9 940 120 days 7 645 8 027 150 days 6 318 6 671 180 days 5 384 5 618 + 180 days 37 313 34 613
— — 98 758 97 951
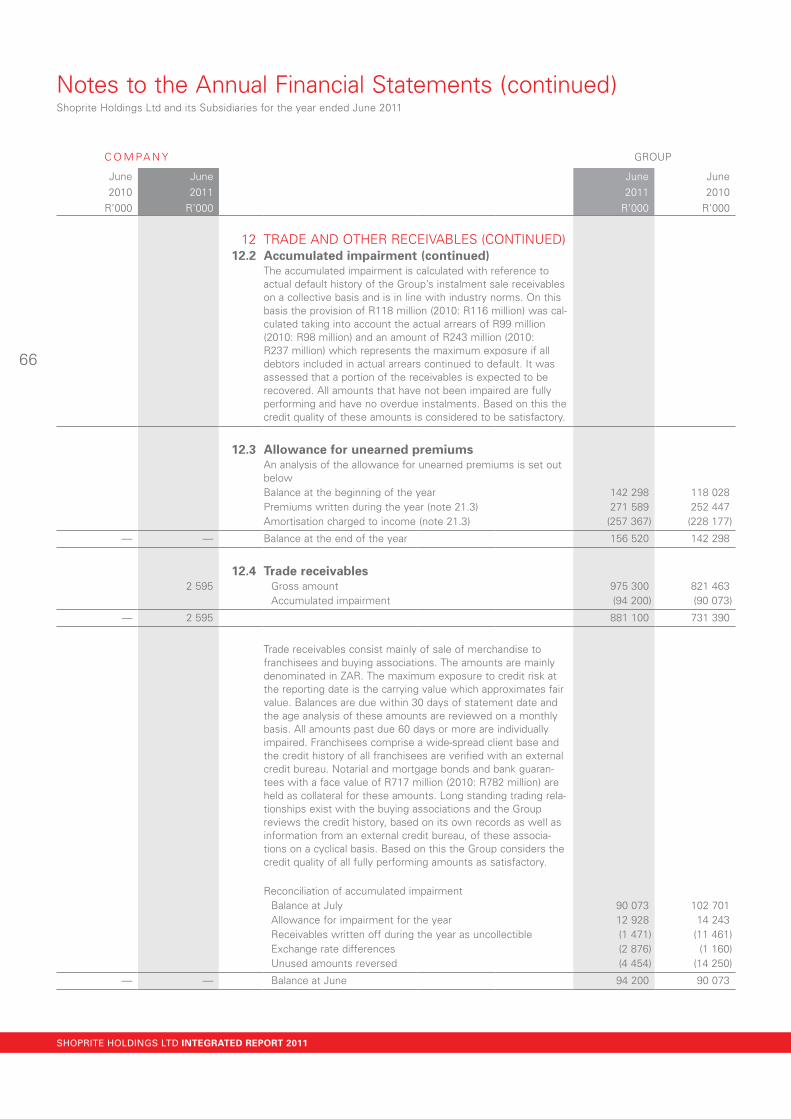
66
Notes to the Annual Financial Statements (continued)Shoprite Holdings Ltd and its Subsidiaries for the year ended June 2011
C O M PA N Y GROUP
June June June June2010 2011 2011 2010
R’000 R’000 R’000 R’000
SHOPRITE HOLDINGS LTD INTEGRATED REPORT 2011
12 TRADE AND OTHER RECEIVABLES (CONTINUED)12.2 Accumulated impairment (continued)
The accumulated impairment is calculated with reference to actual default history of the Group’s instalment sale receivables on a collective basis and is in line with industry norms. On this basis the provision of R118 million (2010: R116 million) was cal-culated taking into account the actual arrears of R99 million (2010: R98 million) and an amount of R243 million (2010: R237 million) which represents the maximum exposure if all debtors included in actual arrears continued to default. It was assessed that a portion of the receivables is expected to be recovered. All amounts that have not been impaired are fully performing and have no overdue instalments. Based on this the credit quality of these amounts is considered to be satisfactory.
12.3 Allowance for unearned premiumsAn analysis of the allowance for unearned premiums is set out belowBalance at the beginning of the year 142 298 118 028 Premiums written during the year (note 21.3) 271 589 252 447 Amortisation charged to income (note 21.3) (257 367) (228 177)
— — Balance at the end of the year 156 520 142 298
12.4 Trade receivables 2 595 Gross amount 975 300 821 463
Accumulated impairment (94 200) (90 073)
— 2 595 881 100 731 390
Trade receivables consist mainly of sale of merchandise to franchisees and buying associations. The amounts are mainly denominated in ZAR. The maximum exposure to credit risk at the reporting date is the carrying value which approximates fair value. Balances are due within 30 days of statement date and the age analysis of these amounts are reviewed on a monthly basis. All amounts past due 60 days or more are individually impaired. Franchisees comprise a wide-spread client base and the credit history of all franchisees are verified with an external credit bureau. Notarial and mortgage bonds and bank guaran-tees with a face value of R717 million (2010: R782 million) are held as collateral for these amounts. Long standing trading rela-tionships exist with the buying associations and the Group reviews the credit history, based on its own records as well as information from an external credit bureau, of these associa-tions on a cyclical basis. Based on this the Group considers the credit quality of all fully performing amounts as satisfactory.
Reconciliation of accumulated impairmentBalance at July 90 073 102 701 Allowance for impairment for the year 12 928 14 243 Receivables written off during the year as uncollectible (1 471) (11 461)Exchange rate differences (2 876) (1 160)Unused amounts reversed (4 454) (14 250)
— — Balance at June 94 200 90 073

67
Notes to the Annual Financial Statements (continued)Shoprite Holdings Ltd and its Subsidiaries for the year ended June 2011
C O M PA N Y GROUP
June June June June2010 2011 2011 2010
R’000 R’000 R’000 R’000
12 TRADE AND OTHER RECEIVABLES (CONTINUED)12.4 Trade receivables (continued)
The provision for impairment relates to trade receivables of R94 million (2010: R95 million) receivable within the next 12 months.
These individually impaired amounts relate mostly to franchisees experiencing unexpectedly difficult economic situations. It was assessed that a portion of the receivables is expected to be recovered. Interest of R1,468,000 (2010: R1,798,000) was accrued on these balances during the year under review.
Trade receivables of R62 million (2010: R14 million) that were past due between 30 and 60 days of statement date were not impaired. These amounts relate to a number of debtors for whom there is no recent history of default.
— — 12.5 Other receivables 559 039 473 888 Other receivables consist of various prepayments and opera-tional debtors such as rental and municipal deposits and value added taxes refundable. Included in the balance for the current year is the reclassification of R32.9 million (note 3.5).The amounts are mainly denominated in ZAR. The maximum exposure to credit risk at the reporting date is the carrying value which approximates fair value. The age analysis of these amounts are reviewed on a monthly basis and no allowance for impairment has been made. If the credit risk of any individual receivables is deemed to be material the credit history of the relevant client will be verified with an external credit bureau. No security is held for these balances.
— — 12.6 Amounts owing by joint ventures 16 805 41 097 These amounts owing are unsecured, payable on demand and earn interest at an average of 6.0% (2010: 7.6%) p.a. The maximum exposure to credit risk at the reporting date is the carrying value and the Group does not hold any collateral as security. The amounts are denominated mainly in ZAR and are not impaired.

68
Notes to the Annual Financial Statements (continued)Shoprite Holdings Ltd and its Subsidiaries for the year ended June 2011
C O M PA N Y GROUP
June June June June2010 2011 2011 2010
R’000 R’000 R’000 R’000
SHOPRITE HOLDINGS LTD INTEGRATED REPORT 2011
13 DERIVATIVE FINANCIAL INSTRUMENTSForward foreign exchange rate contracts (note 39.1.1)
— — Current liabilities 3 606 — — — Current assets — 1 498
As at June 2011 the settlement dates on open forward contracts ranged between one and three (2010: one and three) months. The local currency amounts to be received and contractual exchange rates of the Company’s outstanding contracts were:
US dollar rand equivalent at rates averaging R1 = $0,1451 (2010: R1 = $0,1291)
Outflow (385 297) (158 334)Inflow 379 682 158 318
Swedish krona rand equivalent at rates averaging R1 = SEK0,9354 (2010: R1 = SEK1.0217)
Outflow (4 486) (18 050)Inflow 3 951 18 514
Euro rand equivalent at rates averaging R1 = €0,1011 (2010: R1 = €0,1043)
Outflow (58 793) (12 632)Inflow 58 610 12 752
14 SHARE CAPITAL, TREASURY SHARES AND SHARE INCENTIVE SCHEMES
14.1 Ordinary share capitalAuthorised:
650 000 000 (2010: 650 000 000) ordinary shares of 113,4 cents each
Issued:
616 306 616 306 543 479 460 (2010: 543 479 460) ordinary shares of 113,4 cents each 616 306 616 306
Treasury shares held by Shoprite Checkers (Pty) Ltd and The Shoprite Holdings Ltd Share Incentive Trust are netted off against share capital on consolidation. The net number of ordinary shares in issue for the Group are:
Number of shares2011 2010
Issued ordinary share capital 543 479 460 543 479 460 Treasury shares (note 14.3) (37 346 947) (37 346 947)
506 132 513 506 132 513
The unissued ordinary shares are under the control of the direc-tors who may issue them on such terms and conditions as they deem fit until the Company’s next annual general meeting.
All shares are fully paid up.

69
Notes to the Annual Financial Statements (continued)Shoprite Holdings Ltd and its Subsidiaries for the year ended June 2011
C O M PA N Y GROUP
June June June June2010 2011 2011 2010
R’000 R’000 R’000 R’000
14 SHARE CAPITAL, TREASURY SHARES AND SHARE INCENTIVE SCHEMES (CONTINUED)
14.2 Deferred share capitalAuthorised:
360 000 000 (2010: 360 000 000) non-convertible, non-participating no par value deferred shares
Issued:
277 277 276 821 666 (2010: 276 821 666) non-convertible, non-participating no par value deferred shares 277 277
The unissued deferred shares are not under the control of the directors, and can only be issued under predetermined circumstances as set out in the Memorandum of Incorporation of Shoprite Holdings Ltd.
All shares are fully paid up and carry the same voting rights as the ordinary shares.
616 583 616 583 616 583 616 583
14.3 Treasury shares — — 37 346 947 (2010: 37 346 947) ordinary shares 337 406 337 406
Reconciliation of movement in number of treasury shares for the Group:
Number of sharesBalance at the beginning of the year 37 346 947 42 581 065 Movement in shares held by Shoprite Checkers (Pty) Ltd
Shares purchased during the year — 3 778 920 Shares utilised for option settlement — (9 013 038)
— — Balance at the end of the year 37 346 947 37 346 947
14.4 Share incentive schemesIn terms of the rules of The Shoprite Holdings Ltd Share Incentive Trust, the trustees are authorised to acquire and allocate shares which in total may not exceed 20% of the issued ordinary share capital of the Company.
14.4.1 SHARE PURCHASE SCHEMEThere were no movements in the number of ordinary shares held by The Shoprite Holdings Ltd Share Incentive Trust in terms of the share purchase scheme.
Number of sharesShares held by The Shoprite Holdings Ltd Share Incentive Trust 506 036 506 036
R’000 R’000 Fair value of treasury shares held by The Shoprite Holdings Ltd Share Incentive Trust 51 514 41 925

70
Notes to the Annual Financial Statements (continued)Shoprite Holdings Ltd and its Subsidiaries for the year ended June 2011
C O M PA N Y GROUP
June June June June2010 2011 2011 2010
R’000 R’000 R’000 R’000
SHOPRITE HOLDINGS LTD INTEGRATED REPORT 2011
14 SHARE CAPITAL, TREASURY SHARES AND SHARE INCENTIVE SCHEMES (CONTINUED)
14.4 Share incentive schemes (continued)14.4.2 CASH-SETTLED SHARE-BASED PAYMENTS
The Group has granted cash-settled share-based payments to directors and management. The rights to cash-settled share-based payments entitle the participants to receive cash pay-ments based on the difference between the share price at the date of the exercise of the rights and the strike price which relates to the share price at the date of the grant. The number of shares on which the rights are based as well as the strike prices and the exercise and expiry dates are set out below. The Group has recognised the liability in respect of the cash-settled share-based payments and included it in payables (refer note 20).
Refer note 24 for the expense recognised in the statement of comprehensive income as employee benefits.
Average strike price per share
Number of shares on which rights are based
Movements in rights to cash-settled share-based payments 2011 2010
Balance at the beginning of the year R6,50 / R6,22 13 400 000 14 531 250 Exercised during the year R6,22 (3 958 333) (1 256 250)Issued on 9 Oct 2009 R62,35 — 125 000
Balance at the end of the year 9 441 667 13 400 000
Rights to cash-settled share-based payments on June 2011 are unconditional on the following dates or immediately in the case of a deceased estate:
29 Aug 2010 R31,31 — 3 958 333 29 Aug 2011 R31,31 3 958 333 3 958 333 29 Aug 2012 R31,31 3 958 333 3 958 333 10 Oct 2011 R45,45 133 333 133 333 10 Oct 2012 R45,45 133 333 133 333 10 Oct 2013 R45,45 133 334 133 334 9 Oct 2012 R62,35 41 667 41 667 9 Oct 2013 R62,35 41 667 41 667 9 Oct 2014 R62,35 41 667 41 667 CH Wiese: refer following page R6,50 1 000 000 1 000 000
9 441 667 13 400 000

71
Notes to the Annual Financial Statements (continued)Shoprite Holdings Ltd and its Subsidiaries for the year ended June 2011
15 RESERVES1 416 111 1 345 422 Retained earnings 6 507 523 5 191 663
2 152 2 152 Other reserves (note 15.1) 4 928 140 920
1 418 263 1 347 574 6 512 451 5 332 583
15.1 Other reserves 209 209 Reserve on conversion from no par value to par value shares 209 209
1 943 1 943 Capital redemption reserve 1 943 1 943 — — Foreign currency translation reserve (81 979) 60 472 — — Contingency reserve 33 536 29 027 — — Fair value reserve 51 219 49 269
2 152 2 152 4 928 140 920
Director Expiry date Exercise dateNumber of shares on
which rights are basedAverage strike
price per share
CH Wiese* 5 Sep 2012 Currently exercisable 1 000 000 R6,50
JAL Basson 29 Aug 2011 29 Aug 2011 83 333 R31,31
JAL Basson 29 Aug 2012 29 Aug 2012 83 334 R31,31
M Bosman 29 Aug 2011 29 Aug 2011 116 667 R31,31
M Bosman 29 Aug 2012 29 Aug 2012 116 666 R31,31
PC Engelbrecht 29 Aug 2011 29 Aug 2011 250 000 R31,31
PC Engelbrecht 29 Aug 2012 29 Aug 2012 250 000 R31,31
CG Goosen 29 Aug 2011 29 Aug 2011 316 667 R31,31
CG Goosen 29 Aug 2012 29 Aug 2012 316 666 R31,31
B Harisunker 29 Aug 2011 29 Aug 2011 116 667 R31,31
B Harisunker 29 Aug 2012 29 Aug 2012 116 666 R31,31
AE Karp 10 Oct 2011 10 Oct 2011 133 333 R45,45
AE Karp 10 Oct 2012 10 Oct 2012 133 333 R45,45
AE Karp 10 Oct 2013 10 Oct 2013 133 334 R45,45
EL Nel 29 Aug 2011 29 Aug 2011 133 333 R31,31
EL Nel 29 Aug 2012 29 Aug 2012 133 334 R31,31
BR Weyers 29 Aug 2011 29 Aug 2011 100 000 R31,31
BR Weyers 29 Aug 2012 29 Aug 2012 100 000 R31,31
14 SHARE CAPITAL, TREASURY SHARES AND SHARE INCENTIVE SCHEMES (CONTINUED) 14.4 Share incentive schemes (continued) 14.4.2 CASH-SETTLED SHARE-BASED PAYMENTS (CONTINUED)
Cash-settled share-based payments issued to directors
*The right to the cash-settled share-based payments have been granted via a management company.
C O M PA N Y GROUP
June June June June2010 2011 2011 2010
R’000 R’000 R’000 R’000

72
Notes to the Annual Financial Statements (continued)Shoprite Holdings Ltd and its Subsidiaries for the year ended June 2011
SHOPRITE HOLDINGS LTD INTEGRATED REPORT 2011
16 BORROWINGSConsisting of:
2 450 2 450 Shoprite Holdings Ltd preference share capital (note 16.2) 2 450 2 450 — — Shoprite International Ltd preference share capital (note 16.3) 149 171 — — First National Bank of Namibia Ltd (note 16.4) 47 156 37 827
2 450 2 450 49 755 40 448
16.1 Analysis of total borrowings 2 450 2 450 Non-current 26 177 21 534
— — Current 23 578 18 914
2 450 2 450 49 755 40 448
R’000
Share-based
payments reserve
Foreign currency
translationreserve
Contingencyreserve
Fair valuereserve Other
Balance at June 2009 14 353 230 502 26 550 41 025 2 152
Foreign currency translation differences (170 030)Transfer from distributable reserves 2 477 Net fair value gains on available-for-sale investments, net of income tax 8 244Net fair value gains 9 585 Related income tax (1 341)
Realisation of share based payment reserve (14 353)
Balance at June 2010 — 60 472 29 027 49 269 2 152
Foreign currency translation differences (142 451)Transfer from distributable reserves 4 509 Net fair value gains on available-for-sale investments, net of income tax 1 950
Net fair value gains 2 267 Related income tax (317)
Balance at June 2011 — (81 979) 33 536 51 219 2 152
15 RESERVES (CONTINUED) 15.1 Other reserves (continued) 15.1.1 RECONCILIATION OF CARRYING VALUES OF OTHER RESERVES
C O M PA N Y GROUP
June June June June2010 2011 2011 2010
R’000 R’000 R’000 R’000

73
Notes to the Annual Financial Statements (continued)Shoprite Holdings Ltd and its Subsidiaries for the year ended June 2011
C O M PA N Y GROUP
June June June June2010 2011 2011 2010
R’000 R’000 R’000 R’000
16 BORROWINGS (CONTINUED)16.2 Shoprite Holdings Ltd preference share capital
Authorised:175 000 (2010: 175 000) 6% non-convertible cumulative preference shares of R2 each325 000 (2010: 325 000) 5% non-convertible cumulative preference shares of R2 each225 000 (2010: 225 000) second 5% non-convertible cumulative preference shares of R2 each1 000 000 (2010: 1 000 000) third 5% non-convertible cumulative preference shares of R2 each
Issued:
350 350 175 000 (2010: 175 000) 6% non-convertible cumulative preference shares of R2 each 350 350
650 650 325 000 (2010: 325 000) 5% non-convertible cumulative preference shares of R2 each 650 650
450 450 225 000 (2010: 225 000) second 5% non-convertible cumulative preference shares of R2 each 450 450
1 000 1 000 500 000 (2010: 500 000) third 5% non-convertible cumulative preference shares of R2 each 1 000 1 000
2 450 2 450 2 450 2 450
16.3 Shoprite International Ltd preference share capital20 (2010: 20) “Malawi"” redeemable under certain conditions, preference shares of USD1,82 each (note 16.3.1) 1 259 1 442 2 (2010: 2) “Angola” redeemable under certain conditions, preference shares of USD1,82 each (note 16.3.1) 126 144 Accumulated losses recognised (1 236) (1 415)
— — 149 171
16.3.1 Preference dividends on these shares will be subject to and based on the Hungry Lion division’s profits, generated in Malawi and Angola respectively, through relevant trading subsidiaries of the Group.
16.4 First National Bank of Namibia Ltd
— —
This loan is unsecured, will be repaid within the next 24 months in equal instalments and bears interest at an average of 9.19% (2010: 10.9%) p.a. 47 156 37 827

74
Notes to the Annual Financial Statements (continued)Shoprite Holdings Ltd and its Subsidiaries for the year ended June 2011
C O M PA N Y GROUP
June June June June2010 2011 2011 2010
R’000 R’000 R’000 R’000
SHOPRITE HOLDINGS LTD INTEGRATED REPORT 2011
17 DEFERRED INCOME TAX LIABILITIESAllowances on property, plant and equipment 60 803 61 534 Fixed escalation operating lease accrual 1 221 (72)Allowances on intangible assets 3 314 Tax losses (21 286) (35 065)Unrealised exchange rate differences (11 997) (368)Provisions and accruals (3 366) (7 390)
— — 25 377 18 953
The movement in the deferred income tax liabilities is as follows:Carrying value at the beginning of the year 18 953 26 992 Charged to profit and loss 11 513 3 146
Allowances on property, plant and equipment 10 161 3 478 Fixed escalation operating lease accrual 614 (235)Allowances on intangible assets 5 134 Provisions and accruals 387 (2 585)Unrealised exchange rate differences (11 407) (760)Tax rate change — (155)Tax losses 11 753 3 269
Transfer to deferred tax asset (5 290) (11 028)Exchange rate differences 201 (157)
— — Carrying value at the end of the year 25 377 18 953
Net taxable temporary differences to be settled after more than 12 months 36 916 25 932 Net deductable temporary differences to be recovered within 12 months (11 539) (6 979)
— — 25 377 18 953
18 PROVISIONSProvision for post-retirement medical benefits (note 36.2) 33 534 32 404 Provision for onerous lease contracts 50 578 41 421 Provision for outstanding claims 2 134 1 459 Provision for long-term employee benefits 219 831 158 981 Reinstatement provision 137 240 141 378
— — 443 317 375 643

75
Notes to the Annual Financial Statements (continued)Shoprite Holdings Ltd and its Subsidiaries for the year ended June 2011
C O M PA N Y GROUP
June June June June2010 2011 2011 2010
R’000 R’000 R’000 R’000
18.2 Analysis of total provisions R’000 R’000Non-current 339 200 270 818 Current 104 117 104 825
— — 443 317 375 643
19 FIXED ESCALATION OPERATING LEASE ACCRUALOperating lease payments straight lined (refer note 23) 522 205 498 175 Less: current (included under trade and other payables: note 20) 66 418 79 534
— — 455 787 418 641
20 TRADE AND OTHER PAYABLES — — Trade payables 6 303 789 6 907 964
1 257 966 Other payables and accruals 2 254 512 1 874 711 — — Employee benefit accruals 655 394 566 675
154 160 Indirect taxes payable 200 323 206 149 — — Amounts owing to joint ventures (note 20.2) 3 917 9 428 — — Fixed escalation operating lease accrual (note 19) 66 418 79 534 — — Cash settled share-based payment accrual 586 845 532 074
1 411 1 126 10 071 198 10 176 535
20.1 Analysis of trade and other payables — — Non-current 263 455 304 079
1 411 1 126 Current 9 807 743 9 872 456
1 411 1 126 10 071 198 10 176 535
— — 20.2 Amounts owing to joint ventures 3 917 9 428 These loans are unsecured, payable on demand and bears interest at an average of 1.2% (2010: 3.0%) p.a.
18 PROVISIONS (CONTINUED) 18.1 Reconciliation of carrying values
R’000
Post-retirement
medical benefits
Onerous lease contracts
Outstanding claims
Long-term employee
benefits Reinstatement
provision Total
Balance at June 2009 243 268 28 439 2 375 118 745 140 381 533 208 Additional provisions 1 089 24 464 — 65 649 30 844 122 046 Unused amounts reversed (7 515) (3 350) (916) (293) (4 220) (16 294)Utilised during the year (216 860) (5 544) — (31 348) (25 605) (279 357)Accretion of discount 12 422 (2 588) — 6 228 — 16 062 Exchange rate differences — — — — (22) (22)
Balance at June 2010 32 404 41 421 1 459 158 981 141 378 375 643 Additional provisions 1 240 21 356 675 59 461 11 570 94 302 Unused amounts reversed (312) (159) — (321) (732) (1 524)Utilised during the year (2 630) (10 818) — (6 354) (14 912) (34 714)Accretion of discount 2 832 (1 222) — 8 572 — 10 182 Exchange rate differences — — — (508) (64) (572)
Balance at June 2011 33 534 50 578 2 134 219 831 137 240 443 317
Discount rates used2010 9% 10% N/A 9% 10%2011 9% 12% N/A 9% 12%

76
Notes to the Annual Financial Statements (continued)Shoprite Holdings Ltd and its Subsidiaries for the year ended June 2011
C O M PA N Y GROUP
June June June June2010 2011 2011 2010
R’000 R’000 R’000 R’000
SHOPRITE HOLDINGS LTD INTEGRATED REPORT 2011
21 OTHER OPERATING INCOME — — Finance income earned 196 066 211 966
632 842 1 306 771 Investment income (note 21.1) 27 663 32 662 — — Franchise fees received 38 262 37 523 — — Operating lease income (note 21.2) 231 900 208 562 — — Commissions received 412 386 339 925 — — Premiums earned (note 21.3) 257 367 228 177
530 910 Other income 692 197 517 313
633 372 1 307 681 1 855 841 1 576 128
21.1 Investment income — — Interest received from joint ventures 965 1 747 — — Interest received other 14 940 21 404
632 814 1 306 751 Dividends – subsidiaries — — 28 20 – unlisted investments 11 758 9 511
632 842 1 306 771 27 663 32 662
21.2 Operating lease incomeThe Group has entered into various operating lease agreements as the lessor of property.
Leases on properties are contracted for periods of between 1 and 13 years (2010: 1 and 12 years). Rental comprises mainly minimum monthly payments. Rental escalations vary, but average at a rate of 8.3% (2010: 8.2%) p.a.
21.3 Premiums earnedPremiums written 271 589 252 447 Change in allowance for unearned premiums (14 222) (24 270)
— — 257 367 228 177
22 DEPRECIATION AND AMORTISATIONProperty, plant and equipment 948 520 848 270 Intangible assets 57 922 47 849
1 006 442 896 119 Disclosed as cost of sales (72 850) (56 911)
— — 933 592 839 208
Included in depreciation for the period is a change in estimate of R54,571,768. This is due to an increase in the estimated useful life of computer equipment which is now depreciated over 4 to 5 years, previously 3 years. This change will result in a reduction in depreciation of R9,030,572 in the next financial year.

77
Notes to the Annual Financial Statements (continued)Shoprite Holdings Ltd and its Subsidiaries for the year ended June 2011
C O M PA N Y GROUP
June June June June2010 2011 2011 2010
R’000 R’000 R’000 R’000
23 OPERATING LEASESThe Group has entered into various operating lease agreements on property, plant and equipment.
Leases on properties are contracted for periods of between 3 and 10 years (2010: 3 and 10 years) with renewal options averaging a further 3 to 20 years. Rental comprises minimum monthly payments and contingent payments based on turnover levels. Turnover rentals, where applicable, average 1.84% (2010: 1.85%) of turnover. Rental escalations vary, but average at a rate of 6.76% (2010: 7.07%) p.a.
Operating lease payments – property 1 692 493 1 544 496 Operating lease payments – equipment 81 943 69 641
1 774 436 1 614 137 Disclosed as cost of sales (73 968) (63 392)
— — 1 700 468 1 550 745
Consisting of:Minimum lease payments 1 543 435 1 355 182 Contingent lease payments 231 001 258 955
— — 1 774 436 1 614 137
24 EMPLOYEE BENEFITSWages and salaries 5 514 459 4 961 705 Cash-settled share-based payments (note 14.4.2) 256 618 278 086 Post-retirement medical benefits (note 36.2) 3 760 5 996 Retirement benefit contributions (note 36.1) 314 415 278 896
6 089 252 5 524 683 Disclosed as cost of sales (327 207) (250 840)
— — 5 762 045 5 273 843
24.1 Learnership allowancesThe Group has, during the year under review, received certain learnership allowances.
Sector Educational Training Authorities (SETA) grantsIn terms of the SETA grant in South Africa the Group can recoup Skills Development Levies (SDLs) to the extent that training, as prescribed by SETA, is provided to its employees. This resulted in a reduction in SDLs of R20,601,405 (2010: R18,091,757) for the year under review. The net amount is taxable at 28% (2010: 28%).

78
Notes to the Annual Financial Statements (continued)Shoprite Holdings Ltd and its Subsidiaries for the year ended June 2011
C O M PA N Y GROUP
June June June June2010 2011 2011 2010
R’000 R’000 R’000 R’000
SHOPRITE HOLDINGS LTD INTEGRATED REPORT 2011
25 OPERATIONAL COSTS
54 66 Auditors’ remuneration 26 489 28 899 54 66 Audit fees – for the year 20 699 20 576 — — – (over)/underprovided – previous year (718) 762 — — Fees for other assurance services 316 210 — — Fees for tax consulting services 1 927 2 164 — — Fees for secretarial services 11 94 — — Fees for information technology consulting services 2 613 3 460 — — Fees for accounting services 517 793 — — Fees for other consulting services 1 124 840
6 100 4 008 Fees paid for outside services 164 725 214 000 — — Administrative 49 575 65 516
2 695 135 Technical 114 151 147 856 3 405 3 873 Secretarial 999 628
— — Fair value losses on financial instruments 5 105 27 899
— — Policyholder claims and benefits paid 14 073 19 228 — — – claims paid 13 398 20 144 — — – movement in accumulated unpaid claims (note 18.1) 675 (916)
26 DIRECTORS’ REMUNERATION 657 236 126 300 Executive directors
713 845 Non-executive directors
657 949 127 145 (657 236) (126 300) Less: paid by subsidiaries and joint ventures
713 845 — —
The only prescribed officers of the Group are the Shoprite Holdings Ltd directors and alternate directors, as listed on the following page.
For details of equity and cash-settled share-based payment instruments issued to directors refer note 14.4.
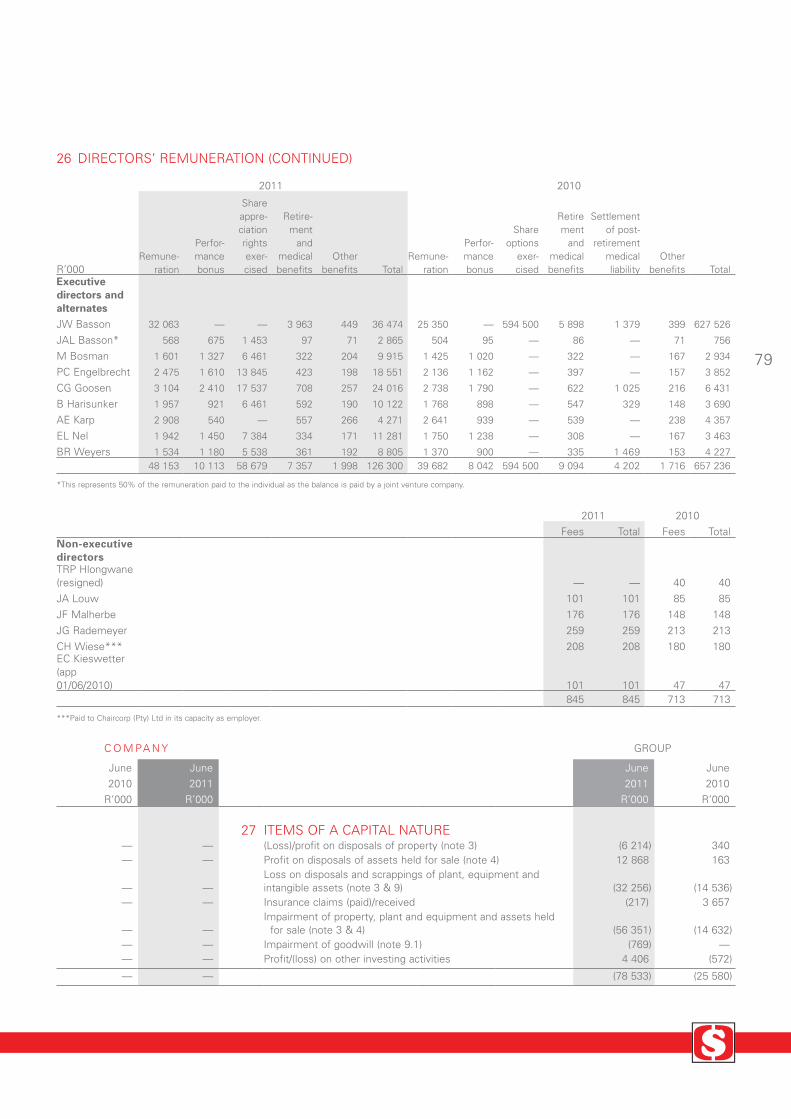
79
Notes to the Annual Financial Statements (continued)Shoprite Holdings Ltd and its Subsidiaries for the year ended June 2011
26 DIRECTORS’ REMUNERATION (CONTINUED)
2011 2010
R’000Remune-
ration
Perfor-mance bonus
Share appre-ciation rights exer-cised
Retire-ment
and medical benefits
Other benefits Total
Remune-ration
Perfor-mance bonus
Share options
exer-cised
Retirement
and medical benefits
Settlement of post-
retirement medical liability
Other benefits Total
Executive directors and alternatesJW Basson 32 063 — — 3 963 449 36 474 25 350 — 594 500 5 898 1 379 399 627 526
JAL Basson* 568 675 1 453 97 71 2 865 504 95 — 86 — 71 756
M Bosman 1 601 1 327 6 461 322 204 9 915 1 425 1 020 — 322 — 167 2 934
PC Engelbrecht 2 475 1 610 13 845 423 198 18 551 2 136 1 162 — 397 — 157 3 852
CG Goosen 3 104 2 410 17 537 708 257 24 016 2 738 1 790 — 622 1 025 216 6 431
B Harisunker 1 957 921 6 461 592 190 10 122 1 768 898 — 547 329 148 3 690
AE Karp 2 908 540 — 557 266 4 271 2 641 939 — 539 — 238 4 357
EL Nel 1 942 1 450 7 384 334 171 11 281 1 750 1 238 — 308 — 167 3 463
BR Weyers 1 534 1 180 5 538 361 192 8 805 1 370 900 — 335 1 469 153 4 227 48 153 10 113 58 679 7 357 1 998 126 300 39 682 8 042 594 500 9 094 4 202 1 716 657 236
*This represents 50% of the remuneration paid to the individual as the balance is paid by a joint venture company.
2011 2010Fees Total Fees Total
Non-executive directorsTRP Hlongwane (resigned) — — 40 40 JA Louw 101 101 85 85 JF Malherbe 176 176 148 148 JG Rademeyer 259 259 213 213 CH Wiese*** 208 208 180 180 EC Kieswetter (app 01/06/2010) 101 101 47 47
845 845 713 713
***Paid to Chaircorp (Pty) Ltd in its capacity as employer.
27 ITEMS OF A CAPITAL NATURE — — (Loss)/profit on disposals of property (note 3) (6 214) 340 — — Profit on disposals of assets held for sale (note 4) 12 868 163
— — Loss on disposals and scrappings of plant, equipment and intangible assets (note 3 & 9) (32 256) (14 536)
— — Insurance claims (paid)/received (217) 3 657
— — Impairment of property, plant and equipment and assets held for sale (note 3 & 4) (56 351) (14 632)
— — Impairment of goodwill (note 9.1) (769) — — — Profit/(loss) on other investing activities 4 406 (572)
— — (78 533) (25 580)
C O M PA N Y GROUP
June June June June2010 2011 2011 2010
R’000 R’000 R’000 R’000

80
Notes to the Annual Financial Statements (continued)Shoprite Holdings Ltd and its Subsidiaries for the year ended June 2011
C O M PA N Y GROUP
June June June June2010 2011 2011 2010
R’000 R’000 R’000 R’000
SHOPRITE HOLDINGS LTD INTEGRATED REPORT 2011
28 FINANCE COSTS — 72 Interest paid 125 608 93 258 — — Interest paid to joint ventures 230 306
126 126 Preference dividends 126 126 21 21 6% non-convertible cumulative preference shares 21 21 32 32 5% non-convertible cumulative preference shares 32 32 23 23 Second 5% non-convertible cumulative preference shares 23 23 50 50 Third 5% non-convertible cumulative preference shares 50 50
126 198 125 964 93 690
29 INCOME TAX EXPENSE29.1 Classification
110 507 131 060 South African income tax 1 162 478 1 002 125 — — Foreign income tax 184 348 109 667
110 507 131 060 1 346 826 1 111 792
29.2 Consisting of: 12 342 12 879 Current income tax 1 223 548 1 026 327 (2 602) 1 165 Prior year income tax 28 295 15 209
— — Withholding income tax 7 991 6 067 100 859 117 053 Secondary income tax on companies 121 670 103 813
110 599 131 097 1 381 504 1 151 416 (92) (37) Deferred income tax (34 678) (39 624)
110 507 131 060 1 346 826 1 111 792
29.3 Reconciliation of income tax 187 764 374 513 South African current income tax at 28% (2010: 28%) 1 085 383 951 745 (77 257) (243 453) Net adjustments 261 443 160 047
37 35 Preference dividends (255) (266) (177 197) (365 897) Dividend income (5 966) (2 427)
1 646 4 191 Other exempt income and non-deductible expenses 76 058 6 488 — — Income tax allowances (2 648) (12 967) — — Deferred income tax asset previously not recognised (25 242) (23 597)
(2 602) 1 165 Prior year income tax 28 295 15 209 100 859 117 053 Secondary income tax on companies 121 670 103 813
— — Effect of foreign income tax rates 33 398 19 055 — — Withholding income tax 7 991 6 067 — — Deferred income tax asset not recognised 28 142 48 672
110 507 131 060 Income tax 1 346 826 1 111 792

81
Notes to the Annual Financial Statements (continued)Shoprite Holdings Ltd and its Subsidiaries for the year ended June 2011
C O M PA N Y GROUP
June June June June2010 2011 2011 2010
R’000 R’000 R’000 R’000
29 INCOME TAX EXPENSE (CONTINUED)29.4 Secondary income tax on companies
78 805 89 674 Secondary income tax on companies on proposed or envisaged dividends 89 674 78 805
If the total distributable reserves of the Company of R1,345 mil-lion (2010: R1,416 million) were to be declared as dividends, the secondary income tax impact at a rate of 10% (2010: 10%) would be R135 million (2010: R142 million). These amounts should be considered taking into account the proposal by the South African Government to replace secondary income tax on companies with a dividend tax on shareholders commencing in the next financial year.
29.5 Net calculated income tax losses and net deductible temporary differences Calculated income tax losses and net deductible temporary differences at year-end 1 424 491 1 456 865 Applied in the provision for deferred income tax 1 137 964 1 037 436
— — 286 527 419 429
The utilisation of the income tax relief, translated at closing rates, to the value of R95,036,491 (2010: R156,095,405), calculated at current income tax rates on the net calculated income tax losses, is dependent on sufficient future taxable income in the companies concerned.
The carry forward of all gross calculated income tax losses is indefinite, except for certain African countries, as set out below:
Expiry date of income tax relief30 June 2010 — 2 221 30 June 2011 — 9 294 30 June 2012 1 625 5 195 30 June 2013 3 165 35 033 30 June 2014 7 542 8 099 30 June 2015 3 802 10 279 30 June 2016 4 744 3 677 30 June 2017 16 879 18 446 30 June 2018 — — 30 June 2019 103 —
— — 37 860 92 244
— —
Calculated temporary differences on consolidation associated with investments in subsidiaries for which deferred income tax liabilities have not been created 89 255 87 175

82
Notes to the Annual Financial Statements (continued)Shoprite Holdings Ltd and its Subsidiaries for the year ended June 2011
SHOPRITE HOLDINGS LTD INTEGRATED REPORT 2011
30 EARNINGS PER SHARE2011
R’000 GrossIncome
tax effect Net
Profit attributable to equity holders 2 509 780 Loss on disposals of property (note 3) 6 214 (197) 6 017 Profit on disposals of assets held for sale (note 4) (12 868) 1 802 (11 066)Loss on disposals and scrappings of plant, equipment and intangible assets (note 3 & 9) 32 256 (9 077) 23 179Insurance claims paid 217 (61) 156 Impairment of property, plant and equipment and assets held for sale (note 3 & 4) 56 351 (12 311) 44 040Impairment of goodwill (note 9.1) 768 — 768 Profit on other investing activities (4 405) 537 (3 868)
Headline earnings 78 533 (19 307) 2 569 006
2010
R’000 GrossIncome
tax effect Net
Profit attributable to equity holders 2 266 522 Profit on disposals of property (note 4) (340) 23 (317)Profit on disposals of assets held for sale (note 4) (163) 2 (161)Loss on disposals and scrappings of plant, equipment and intangible assets (note 3 & 9) 14 536 (3 999) 10 537Insurance claims received (3 657) 1 278 (2 379)Impairment of property, plant and equipment and assets held for sale (note 3 & 4) 14 632 — 14 632Loss on other investing activities 572 3 808 4 380
Headline earnings 25 580 1 113 2 293 215
2011 2010Number of shares
’000 ’000Weighted average number of ordinary shares 506 133 503 523 Adjustments for dilutive potential of share options — 4 252
Weighted average number of ordinary shares for diluted earnings per share 506 133 507 775
Number of ordinary shares– In issue 506 133 506 133 – Weighted average 506 133 503 523 – Weighted average adjusted for dilution 506 133 507 775
Earnings per share Cents– Earnings 495,9 450,1 – Diluted earnings 495,9 446,4 – Headline earnings 507,6 455,4 – Diluted headline earnings 507,6 451,6

83
Notes to the Annual Financial Statements (continued)Shoprite Holdings Ltd and its Subsidiaries for the year ended June 2011
C O M PA N Y GROUP
June June June June2010 2011 2011 2010
R’000 R’000 R’000 R’000
31 DIVIDENDS PER SHARECents 31.1 Dividends per share paid Cents
130,0 147,0 No 123 paid 20 September 2010 (2010: No 121 paid 21 September 2009) 147,0 130,0
80,0 88,0 No 124 paid 22 March 2011 (2010: No 122 paid 23 March 2010) 88,0 80,0
210,0 235,0 235,0 210,0
31.2 Dividends per share declared
147,0 165,0 No 125 paid 19 September 2011 (2010: No 123 paid 20 September 2010) 165,0 147,0
32 CASH FLOW INFORMATION32.1 Non-cash items
— — Depreciation of property, plant and equipment 948 520 848 270 — — Amortisation of intangible assets 57 922 47 849 — — Net fair value losses on financial instruments 5 105 27 899
(572) 1 Exchange rate losses/(gains) 446 77 824 — — Loss/(profit) on disposals of property 6 214 (340) — — Profit on disposals of assets held for sale (12 868) (163)
— — Loss on disposals and scrappings of plant, equipment and intangible assets 32 256 14 536
— — Impairment of property, plant and equipment and assets held for sale 56 351 14 632
— — Impairment of goodwill 768 — — — Movement in provisions 70 876 59 317 — — Movement in cash-settled share-based payment accrual 272 808 277 558 — — Movement in fixed escalation operating lease accrual 21 081 20 228
(572) 1 1 459 479 1 387 610
32.2 Changes in working capital — — Inventories (1 000 474) (46 064)
2 040 — Trade and other receivables (236 566) (125 470) 639 (285) Trade and other payables (87 319) (423 222)
2 679 (285) (1 324 359) (594 756)
32.3 Dividends paid (2 538) (3 338) Shareholders for dividends at the beginning of the year (3 328) (3 073)
(1 141 307) (1 277 177) Dividends distributed to shareholders (1 189 411) (1 062 878) — — Dividends distributed to non-controlling interest (28 196) (19 670)
3 338 4 016 Shareholders for dividends at the end of the year 4 851 3 328
(1 140 507) (1 276 499) (1 216 084) (1 082 293)
32.4 Income tax paid (8 713) 1 589 Payable at the beginning of the year (75 361) (445 531)
(110 599) (131 097) Per statement of comprehensive income (1 381 504) (1 151 416) — — Income tax effect of treasury share utilisation for share option take-up — 147 413 — — Acquisition of subsidiaries and operations (note 32.5.1) — (8 876)
(1 589) 4 247 Prepaid/(payable) at the end of the year 425 773 75 361
(120 901) (125 261) (1 031 092) (1 383 049)

84
Notes to the Annual Financial Statements (continued)Shoprite Holdings Ltd and its Subsidiaries for the year ended June 2011
C O M PA N Y GROUP
June June June June2010 2011 2011 2010
R’000 R’000 R’000 R’000
SHOPRITE HOLDINGS LTD INTEGRATED REPORT 2011
32 CASH FLOW INFORMATION (CONTINUED)32.5 Cash flows utilised by investing activities
— — Purchase of property, plant and equipment and intangible assets (3 005 219) (2 509 369)
— — Proceeds on disposals of property, plant and equipment and intangible assets 63 483 99 445
— — Proceeds on disposals of assets held for sale 28 360 1 011 (13 333) — Other investing activities 3 493 (15 306)
(679 488) (1 342 957) Amounts owing paid to subsidiaries — — 1 280 219 1 408 492 Amount received from subsidiaries — —
— — Acquisition of subsidiaries and operations (note 32.5.1) (27 128) (255 894)
587 398 65 535 (2 937 011) (2 680 113)
32.5.1 ACQUISITION OF SUBSIDIARIES AND OPERATIONSThe Group acquired a 100% shareholding in a subsidiary and various operations. The acquisition had no significant impact on the Group’s results.
In the previous financial year, the Group acquired a 100% shareholding in pharmaceutical wholesale operations, the Transpharm Group, from Dirk Verbeek Family Trust and Schulenburg – BWS Trust on 24 December 2009. This business combination ensured that the Group improved and secured the supply chain of pharmaceutical products to Medirite, its medical retail operation. Goodwill is not income tax deductible.
The assets and liabilities arising from this acquisition was as follow:Property, plant and equipment (note 3) 12 228 7 985 Software (note 9.2) — 2 400 Customer relationships (note 9.4) — 53 650 Trademark (note 9.3) — 9 379 Trade and other receivables (note 12) — 150 089 Trade and other payables (note 20) (1 087) (141 856)Deferred income tax liability (note 8) — (17 457)Current income tax (note 29) — (8 876)Inventories (note 11) 1 311 124 722
12 452 180 036 Goodwill (note 9.1) 14 676 75 858
Cash flow on acquisition 27 128 255 894 Bank overdrafts acquired on acquisition — (66 204)
Purchase consideration 27 128 189 690
32.6 Cash flows utilised by financing activitiesAcquisition of treasury shares — (244 439)Purchase of non-controlling interest — (3 215)Increase in borrowings from First National Bank of Namibia Ltd 9 329 9 726
— — 9 329 (237 928)
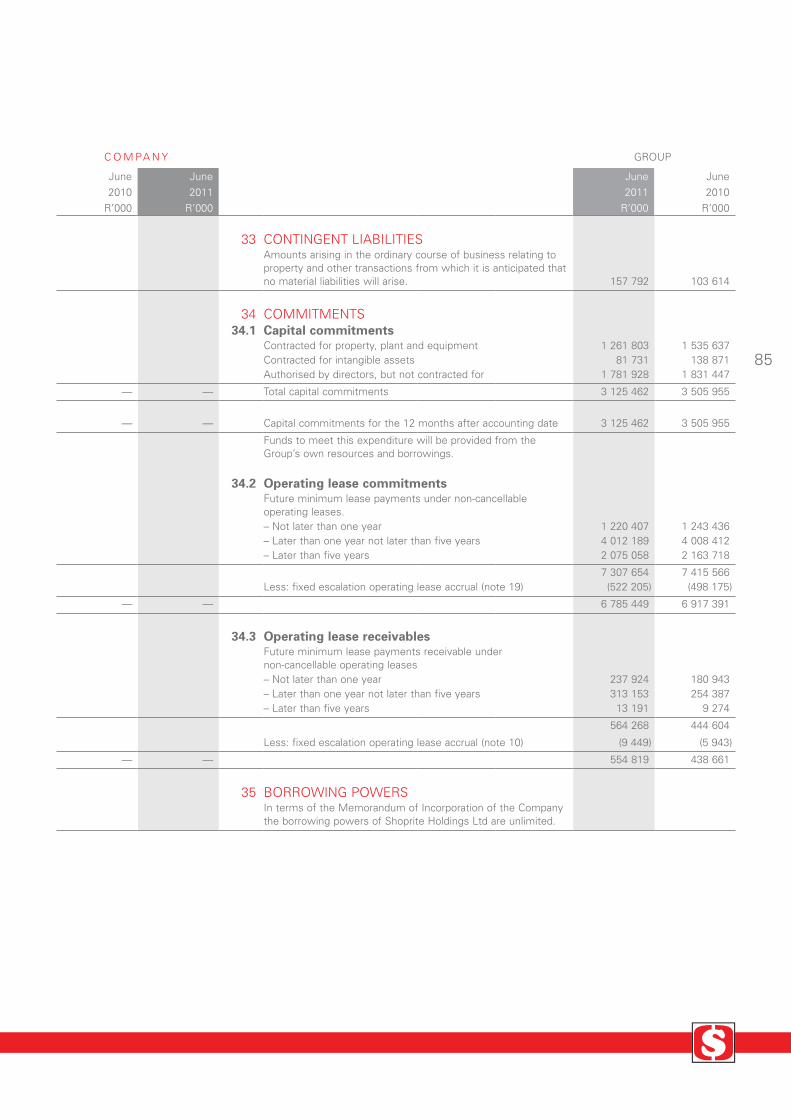
85
Notes to the Annual Financial Statements (continued)Shoprite Holdings Ltd and its Subsidiaries for the year ended June 2011
C O M PA N Y GROUP
June June June June2010 2011 2011 2010
R’000 R’000 R’000 R’000
33 CONTINGENT LIABILITIESAmounts arising in the ordinary course of business relating to property and other transactions from which it is anticipated that no material liabilities will arise. 157 792 103 614
34 COMMITMENTS34.1 Capital commitments
Contracted for property, plant and equipment 1 261 803 1 535 637 Contracted for intangible assets 81 731 138 871 Authorised by directors, but not contracted for 1 781 928 1 831 447
— — Total capital commitments 3 125 462 3 505 955
— — Capital commitments for the 12 months after accounting date 3 125 462 3 505 955
Funds to meet this expenditure will be provided from the Group’s own resources and borrowings.
34.2 Operating lease commitmentsFuture minimum lease payments under non-cancellable operating leases.– Not later than one year 1 220 407 1 243 436 – Later than one year not later than five years 4 012 189 4 008 412 – Later than five years 2 075 058 2 163 718
7 307 654 7 415 566 Less: fixed escalation operating lease accrual (note 19) (522 205) (498 175)
— — 6 785 449 6 917 391
34.3 Operating lease receivablesFuture minimum lease payments receivable under non-cancellable operating leases– Not later than one year 237 924 180 943 – Later than one year not later than five years 313 153 254 387 – Later than five years 13 191 9 274
564 268 444 604
Less: fixed escalation operating lease accrual (note 10) (9 449) (5 943)
— — 554 819 438 661
35 BORROWING POWERSIn terms of the Memorandum of Incorporation of the Company the borrowing powers of Shoprite Holdings Ltd are unlimited.

86
Notes to the Annual Financial Statements (continued)Shoprite Holdings Ltd and its Subsidiaries for the year ended June 2011
C O M PA N Y GROUP
June June June June2010 2011 2011 2010
R’000 R’000 R’000 R’000
SHOPRITE HOLDINGS LTD INTEGRATED REPORT 2011
36 POST-RETIREMENT BENEFITS36.1 Retirement funds
Group companies provide post-retirement benefits in accord-ance with the local conditions and practices in the countries in which they operate.
The Group provides retirement benefits to 57.1% (2010: 68.3%) of employees and 4.3% (2010: 4.0%) of the employees belong to national retirement plans. The monthly contributions are charged to the statement of comprehensive income.
All company funds are defined contribution funds. All South African funds are subject to the Pension Fund Act of 1956.
During the year under review contributions to retirement funding have been calculated as 314 415 278 896
36.2 Medical benefitsFull provision for post-retirement medical benefits, where they exist, are made with reference to actuarial valuations in respect of past services liabilities. The remaining liability relates mainly to pensioners and will be settled during the next financial years.
36.2.1 THE PRINCIPAL ACTUARIAL ASSUMPTIONS USED FOR ACCOUNTING PURPOSES ARE AS FOLLOWS:
Health-care cost inflation 9.8% 9.5%Discount rate 8.8% 9.0%Salary adjustments– inflation 7.3% 7.0%– promotions and experience increases 1.5% 1.5%Continuation at retirement 95.0% 95.0%Expected retirement age 60 years 60 years
The assumed rates of mortality are as follows:During employment: SA 2010: 85-90 (light) ultimate table
(2010: N/A)
Post-employment: PA (90) ultimate table rated down 2 years plus 1% p.a. improvement from 2006 (2010: PA (90) ultimate table rated down 2 years plus 1% p.a. improvement from 2006)

87
Notes to the Annual Financial Statements (continued)Shoprite Holdings Ltd and its Subsidiaries for the year ended June 2011
C O M PA N Y GROUP
June June June June2010 2011 2011 2010
R’000 R’000 R’000 R’000
36 POST-RETIREMENT BENEFITS (CONTINUED)36.2 Medical benefits (continued)
36.2.2 THE MOVEMENT IN THE LIABILITY RECOGNISED IN THE STATEMENT OF FINANCIAL POSITION (NOTE 18) WAS AS FOLLOWS:Balance at the beginning of the year 32 404 243 268 Total expense charged to the statement of comprehensive income (note 36.2.3) 3 760 5 996 Benefits paid (2 630) (216 860)
— — Balance at the end of the year 33 534 32 404
36.2.3 THE AMOUNTS RECOGNISED IN THE STATEMENT OF COMPREHENSIVE INCOME WERE AS FOLLOWS:Current service cost 115 1 089 Net actuarial loss/(gains) recognised during the year 813 (7 515)Interest cost 2 832 12 422
— — Total included in employee benefits (note 24) 3 760 5 996
The effect of a 1% increase in the assumed health-care cost inflation is as follows:
Increase in the current service and interest cost 443 431 Increase in the post-retirement medical benefit liability 4 878 4 553
The effect of a 1% decrease in the assumed health-care cost inflation is as follows:
Decrease in the current service and interest cost 359 354 Decrease in the post-retirement medical benefit liability 3 975 3 729
36.2.4 TREND ANALYSIS OF POST-RETIREMENT MEDICAL BENEFITS
Present value of obligation
Experience adjustments
R’000 R’000
30 June 2007 179 811 10 380 30 June 2008 181 099 4 563 30 June 2009 243 268 1 687 30 June 2010 32 404 5 907 30 June 2011 33 534 963

88
Notes to the Annual Financial Statements (continued)Shoprite Holdings Ltd and its Subsidiaries for the year ended June 2011
SHOPRITE HOLDINGS LTD INTEGRATED REPORT 2011
37 FINANCIAL INSTRUMENTS BY CATEGORYLoans
and receivables
Assets at fair value through profit and loss
Available-for-sale Total
GroupR’000 2011FINANCIAL ASSETS AS PER STATEMENT OF FINANCIAL POSITIONAvailable-for-sale investments 59 656 59 656 Loans and receivables 50 534 50 534 Instalment sales 798 243 798 243 Trade receivables 881 100 881 100 Other receivables excluding prepayments and taxes receivable 353 932 353 932 Amounts owing by joint ventures 16 805 16 805 Cash and cash equivalents 1 961 551 1 961 551
4 062 165 — 59 656 4 121 821
R’000 2010FINANCIAL ASSETS AS PER STATEMENT OF FINANCIAL POSITIONAvailable-for-sale investments 57 389 57 389 Loans and receivables 54 394 54 394 Instalment sales 752 438 752 438 Trade receivables 731 390 731 390 Other receivables excluding prepayments and taxes receivable 309 449 309 449 Amounts owing by joint ventures 41 097 41 097 Derivative financial instruments 1 498 1 498 Cash and cash equivalents 2 218 866 2 218 866
4 107 634 1 498 57 389 4 166 521
CompanyR’000 2011FINANCIAL ASSETS AS PER STATEMENT OF FINANCIAL POSITIONAmounts owing by subsidiaries 10 774 10 774 Cash and cash equivalents 603 555 603 555
614 329 — — 614 329
R’000 2010FINANCIAL ASSETS AS PER STATEMENT OF FINANCIAL POSITIONAmounts owing by subsidiaries 76 308 76 308 Cash and cash equivalents 602 517 602 517
678 825 — — 678 825
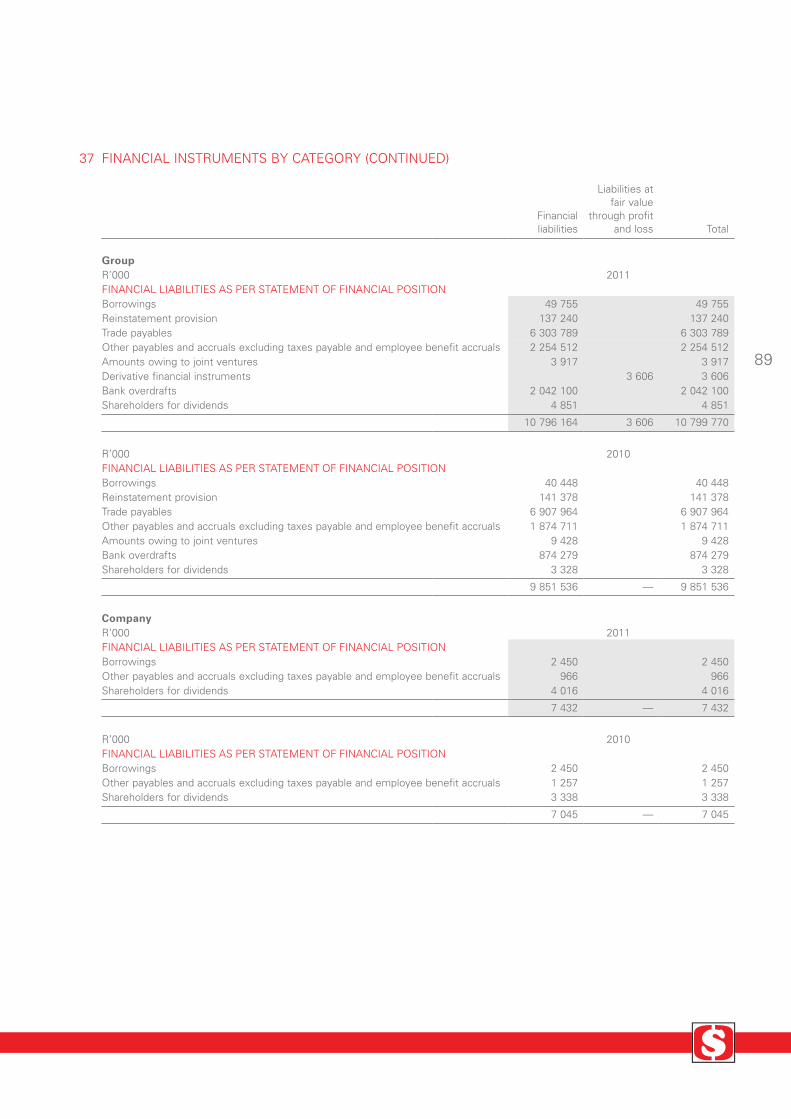
89
Notes to the Annual Financial Statements (continued)Shoprite Holdings Ltd and its Subsidiaries for the year ended June 2011
37 FINANCIAL INSTRUMENTS BY CATEGORY (CONTINUED)
Financial liabilities
Liabilities at fair value
through profit and loss Total
GroupR’000 2011FINANCIAL LIABILITIES AS PER STATEMENT OF FINANCIAL POSITIONBorrowings 49 755 49 755 Reinstatement provision 137 240 137 240 Trade payables 6 303 789 6 303 789 Other payables and accruals excluding taxes payable and employee benefit accruals 2 254 512 2 254 512 Amounts owing to joint ventures 3 917 3 917 Derivative financial instruments 3 606 3 606 Bank overdrafts 2 042 100 2 042 100 Shareholders for dividends 4 851 4 851
10 796 164 3 606 10 799 770
R’000 2010FINANCIAL LIABILITIES AS PER STATEMENT OF FINANCIAL POSITIONBorrowings 40 448 40 448 Reinstatement provision 141 378 141 378 Trade payables 6 907 964 6 907 964 Other payables and accruals excluding taxes payable and employee benefit accruals 1 874 711 1 874 711 Amounts owing to joint ventures 9 428 9 428 Bank overdrafts 874 279 874 279 Shareholders for dividends 3 328 3 328
9 851 536 — 9 851 536
CompanyR’000 2011FINANCIAL LIABILITIES AS PER STATEMENT OF FINANCIAL POSITIONBorrowings 2 450 2 450 Other payables and accruals excluding taxes payable and employee benefit accruals 966 966 Shareholders for dividends 4 016 4 016
7 432 — 7 432
R’000 2010FINANCIAL LIABILITIES AS PER STATEMENT OF FINANCIAL POSITIONBorrowings 2 450 2 450 Other payables and accruals excluding taxes payable and employee benefit accruals 1 257 1 257 Shareholders for dividends 3 338 3 338
7 045 — 7 045
90
Notes to the Annual Financial Statements (continued)Shoprite Holdings Ltd and its Subsidiaries for the year ended June 2011
C O M PA N Y GROUP
June June June June2010 2011 2011 2010
R’000 R’000 R’000 R’000
SHOPRITE HOLDINGS LTD INTEGRATED REPORT 2011
38 FAIR VALUE DISCLOSURESAll financial instruments measured at fair value are classified using a three-tiered fair value hierarchy that reflects the significance of the inputs used in determining the measure-ment. The hierarchy is as follows:
Level 1 – Measurements in whole or in part are done by reference to unadjusted, quoted prices in an active market for identical assets and liabilities. Quoted prices are readily availa-ble from an exchange, dealer, broker, industry group, pricing service or regulatory agency and those prices represent actual and regularly occurring market transactions on an arm’s length basis.
Level 2 – Measurements are done by reference to inputs other than quoted prices that are included in level 1. These inputs are observable for the financial instrument, either directly (i.e. as prices) or indirectly (i.e. from derived prices).
Level 3 – Measurements are done by reference to inputs that are not based on observable market data.
Available-for-sale investments are measured at fair value. The investment in RMB Global Solutions (Pty) Ltd is classified at level 2.
Derivatives – being foreign exchange contracts – are measured at fair value and classified at level 2.
39 FINANCIAL RISK MANAGEMENT39.1 Financial risk factors
The Group’s activities expose it to a variety of financial risks, including the effects of changes in debt, foreign currency exchange rates and interest rates. The Group’s overall risk man-agement programme focuses on the unpredictability of financial markets and seeks to minimise potential adverse effects on the financial performance of the Group. The Group uses derivative financial instruments such as foreign exchange rate contracts as economic hedges, to hedge certain exposures.
Risk management is carried out by a central treasury depart-ment under policies approved by the Board of Directors. The treasury department identifies, evaluates and hedges financial risks in close co-operation with the Group’s operating units. The Board provides written principles for overall risk management, as well as written policies covering specific areas, such as for-eign exchange rate risk, interest rate risk, credit risk, use of derivative financial instruments and investing excess liquidity.

91
Notes to the Annual Financial Statements (continued)Shoprite Holdings Ltd and its Subsidiaries for the year ended June 2011
C O M PA N Y GROUP
June June June June2010 2011 2011 2010
R’000 R’000 R’000 R’000
39 FINANCIAL RISK MANAGEMENT (CONTINUED)39.1 Financial risk factors (continued)
39.1.1 MARKET RISKa) Currency risk
The Group operates internationally and is exposed to currency risk arising from various currency exposures. The treasury department hedges the Group’s net position in each foreign cur-rency by using call deposits in foreign currencies and derivative financial instruments in the form of forward foreign exchange rate contracts for all cumulative foreign commitments of three months or more. Forward foreign exchange rate contracts are not used for speculative purpose. These instruments are not designated as hedging instruments for purposes of accounting.
Currency exposure arising from the net monetary assets in individual countries, held in currencies other than the functional currency of the Group, are managed primarily through converting cash and cash equivalents not required for operational cash flows to US dollar. The US dollar is the preferred currency due to its history of stability, liquidity and availability in most markets.
Material concentrations of currency risk exists within the Group’s cash and cash equivalents. The net cash and cash equivalents are denominated in the following currencies:
602 517 603 555 South African rand (603 468) 486 352 — — USA dollar 148 131 310 536 — — Zambian kwacha 52 476 69 447 — — Malawi kwacha 62 935 36 361 — — Angolan kwanza 51 358 204 038 — — Botswana pula 24 296 20 767 — — Mauritian rupee 17 973 (7 214) — — Nigerian naira 7 306 16 443 — — Namibian dollar 56 859 74 037 — — Swaziland emilangeni 30 241 42 903 — — Lesotho maluti 11 098 20 645 — — Mozambique metical 34 109 46 587 — — Other currencies 26 137 23 685
602 517 603 555 (80 549) 1 344 587
The Group does not have significant foreign creditors as most inventory imports are prepaid.
Where material concentrations of currency risk exists within the Group a sensitivity analysis was performed to calculate what the increase/decrease in profit for the year would have been if the various individual currencies strengthened or weakened against the ZAR and the USD. At June 2011 the total possible decrease in Group post-tax profit, calculated for all possible currency move-ments, was R339,045 with the ZAR/USD exchange rate (with an expected 8.5% decline) contributing R7,536,798 to this number. At June 2010 the total possible increase in Group post-tax profit, calculated for all possible currency movements, was R2,823,000 with the ZAR/USD exchange rate (with an expected 5.2% incline) contributing R307,000 to this number. These changes had no material effect on the Group’s equity.
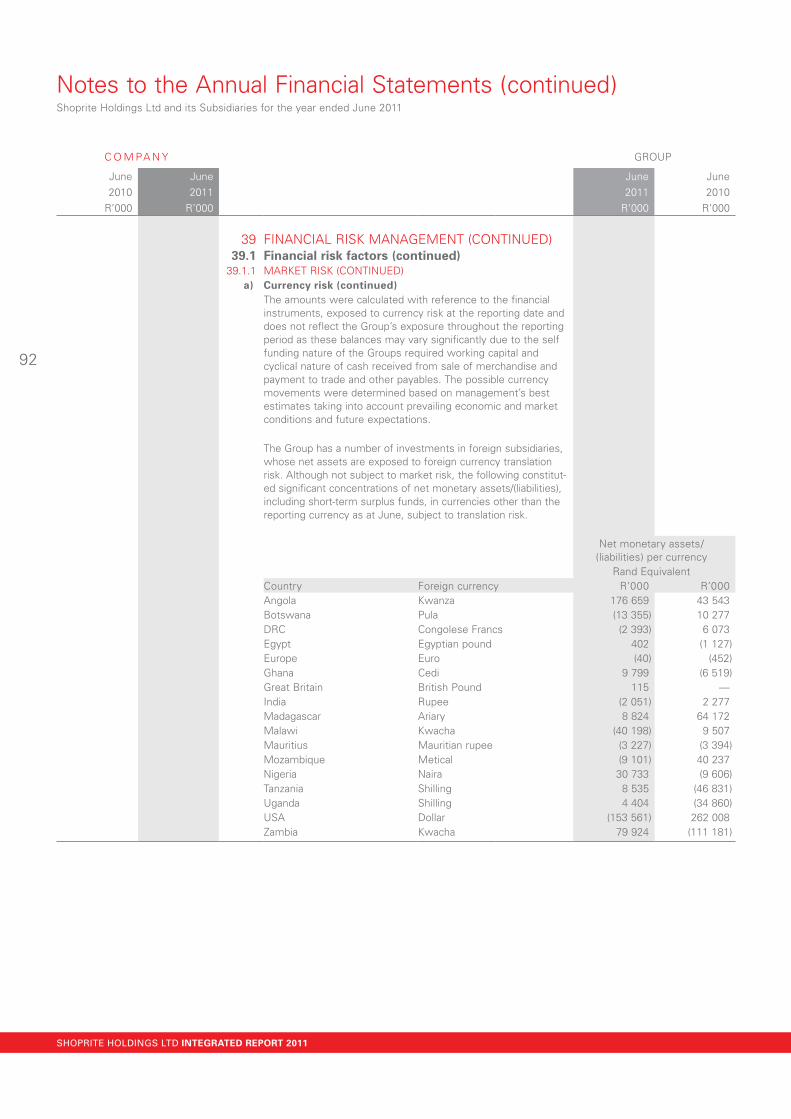
92
Notes to the Annual Financial Statements (continued)Shoprite Holdings Ltd and its Subsidiaries for the year ended June 2011
C O M PA N Y GROUP
June June June June2010 2011 2011 2010
R’000 R’000 R’000 R’000
SHOPRITE HOLDINGS LTD INTEGRATED REPORT 2011
39 FINANCIAL RISK MANAGEMENT (CONTINUED)39.1 Financial risk factors (continued)
39.1.1 MARKET RISK (CONTINUED)a) Currency risk (continued)
The amounts were calculated with reference to the financial instruments, exposed to currency risk at the reporting date and does not reflect the Group’s exposure throughout the reporting period as these balances may vary significantly due to the self funding nature of the Groups required working capital and cyclical nature of cash received from sale of merchandise and payment to trade and other payables. The possible currency movements were determined based on management’s best estimates taking into account prevailing economic and market conditions and future expectations.
The Group has a number of investments in foreign subsidiaries, whose net assets are exposed to foreign currency translation risk. Although not subject to market risk, the following constitut-ed significant concentrations of net monetary assets/(liabilities), including short-term surplus funds, in currencies other than the reporting currency as at June, subject to translation risk.
Net monetary assets/(liabilities) per currency
Rand EquivalentCountry Foreign currency R’000 R’000 Angola Kwanza 176 659 43 543 Botswana Pula (13 355) 10 277 DRC Congolese Francs (2 393) 6 073 Egypt Egyptian pound 402 (1 127)Europe Euro (40) (452)Ghana Cedi 9 799 (6 519)Great Britain British Pound 115 — India Rupee (2 051) 2 277 Madagascar Ariary 8 824 64 172 Malawi Kwacha (40 198) 9 507 Mauritius Mauritian rupee (3 227) (3 394)Mozambique Metical (9 101) 40 237 Nigeria Naira 30 733 (9 606)Tanzania Shilling 8 535 (46 831)Uganda Shilling 4 404 (34 860)USA Dollar (153 561) 262 008 Zambia Kwacha 79 924 (111 181)

93
Notes to the Annual Financial Statements (continued)Shoprite Holdings Ltd and its Subsidiaries for the year ended June 2011
C O M PA N Y GROUP
June June June June2010 2011 2011 2010
R’000 R’000 R’000 R’000
39 FINANCIAL RISK MANAGEMENT (CONTINUED)39.1 Financial risk factors (continued)
39.1.1 MARKET RISK (CONTINUED)b) Cash flow and fair value interest rate risk
The Group’s interest rate risk arises mainly from daily call accounts and bank overdrafts. These carry interest at rates fixed on a daily basis and expose the Group to cash flow inter-est rate risk. The Group analyses this interest rate exposure on a dynamic basis. Daily cash flow forecasts are done and com-bined with interest rates quoted on a daily basis. This informa-tion is then taken into consideration when reviewing refinanc-ing/reinvesting and/or renewal/cancellation of existing positions and alternative financing/investing. Based on these scenarios, the Group calculates the impact on profit and loss of a defined interest rate shift. The scenarios are run only for cash/borrow-ings that represent the major interest-bearing positions. The weighted average effective interest rate on call accounts was 6.2% (2010: 7.6%).
The interest rate on individual instalment sale receivables (refer note 12) is fixed and expose the Group to fair value interest rate risk which is mitigated by charging appropriate margins and the fact that the maximum term of these contracts are 24 months.
For exposure to interest rate risk on other monetary items refer to the following: – Interest-bearing borrowings: note 16 – Amounts owing by joint ventures: note 12 – Loans and receivables: note 7
Where material concentrations of interest rate risk exists within the Group a sensitivity analysis was performed to calculate what the increase/decrease in profit for the year would have been if the various individual interest rates the Group’s financial instruments are subject to strengthened or weakened. At June 2011 the total possible decrease in Group post-tax profit, calculated for all possible interest rate movements, was R7,142,099. The estimated increase of 50 basis points in the South African prime rate would have resulted in a possible decrease in Group post-tax profit of R7,123,119. At June 2010 the total possible decrease in Group post-tax profit, calculated for all possible interest rate movements, was R71,000. The estimated decrease of 50 basis points in the South African prime rate would have resulted in a possible decrease in Group post-tax profit of R51,000. These changes had no material effect on the Group’s equity.

94
Notes to the Annual Financial Statements (continued)Shoprite Holdings Ltd and its Subsidiaries for the year ended June 2011
C O M PA N Y GROUP
June June June June2010 2011 2011 2010
R’000 R’000 R’000 R’000
SHOPRITE HOLDINGS LTD INTEGRATED REPORT 2011
39 FINANCIAL RISK MANAGEMENT (CONTINUED)39.1 Financial risk factors (continued)
39.1.1 MARKET RISK (CONTINUED)b) Cash flow and fair value interest rate risk (continued)
The amounts were calculated with reference to the financial instruments exposed to interest rate risk at the reporting date and does not reflect the Group’s exposure throughout the reporting period as these balances may vary significantly due to the self funding nature of the Group’s required working capital and cyclical nature of cash received from sale of merchandise and payment to trade and other payables. The possible interest rate movements were determined based on management’s best estimates taking into account prevailing economic and market conditions and future expectations.
39.1.2 CREDIT RISKCredit risk is managed on a group basis. Potential concentration of credit risk consists primarily of cash and cash equivalents, trade and other receivables, financial guarantees and investments.
Funds are only invested with South African financial institutions with a minimum Moody’s short-term credit rating of P-2 and a minimum Moody’s long-term rating of Baa2. For financial insti-tutions outside South Africa the required minimum Moody’s short-term and long-term credit ratings are P-1 and Aa3 respec-tively. Due to the Group’s international operational requirements it is forced to transact with financial institutions in certain coun-tries where independent internationally accredited credit ratings are not available. In these instances the Group’s exposure to credit risk at each of these financial institutions are evaluated by management on a case by case basis. Cash balances depos-ited with these financial institutions are kept to an operational minimum and are transferred, subject to exchange control regu-lations and available suitable foreign currency, to financial insti-tutions with acceptable credit ratings. The Group has policies that limit the amount of credit exposure to any one financial institution.
Sales to retail customers are settled in cash or using debit and credit cards. Except for the total exposure represented by the respective statement of financial position items, the Group has no other significant concentration of credit risk. Accounts receivable comprise a wide-spread client base and the Group has policies in place to ensure that all sales of goods and serv-ices on credit are made to customers with an appropriate credit history. These policies include reviewing the Group’s own credit history with the customer, verifying the credit history with an external credit bureau, as well as a formalised application proc-ess where the creditworthiness of the customer is assessed. The Group also obtains security from its franchisees.

95
Notes to the Annual Financial Statements (continued)Shoprite Holdings Ltd and its Subsidiaries for the year ended June 2011
C O M PA N Y GROUP
June June June June2010 2011 2011 2010
R’000 R’000 R’000 R’000
39 FINANCIAL RISK MANAGEMENT (CONTINUED)39.1 Financial risk factors (continued)
39.1.2 CREDIT RISK (CONTINUED)Credit risk exposure resulting from financial guarantee liabilities relating to trading partners are evaluated by management on a monthly basis taking into consideration the credit rating of the underlying parties as well as their financial position. Financial guarantees are kept to an operational minimum and reassessed regularly. The gross exposure of R97m (2010: Rnil) equals the fair value of these financial instruments and has been included under other payables.
For exposure to credit risk on other monetary items refer to the following:– Trade and other receivables: note 12– Loans and receivables: note 7– Trade and other payables: note 20
The table below shows the cash invested at the statement of financial position date at financial institutions grouped per Moody’s short-term credit rating of the financial institutions.
Rating 602 517 603 555 P-1 (329 930) 829 884
— — P-2 41 037 41 918 — — No rating available 151 505 391 004 — — Cash on hand and in transit 56 839 81 781
602 517 603 555 (80 549) 1 344 587
39.1.3 LIQUIDITY RISKAll significant financial liabilities of the Group matures within 12 months of statement of financial position date. The risk of illiquidity is managed by using cash flow forecasts; maintaining adequate unutilised banking facilities (2011: R2,818,407,632; 2010: R2,715,214,692) and unlimited borrowing powers. All unutilised facilities are controlled by the Group’s treasury department in accordance with a treasury mandate as approved by the Board of Directors.
Cash and cash equivalents of the Company of R600 million serve as security for banking facilities of its main trading subsidiary, Shoprite Checkers (Pty) Ltd. These facilities were utilised in full at the statement of financial position date.
The Group’s derivative financial instruments that will be settled on a gross basis are detailed in note 13. The amounts disclosed are the contractual undiscounted cash flows. All balances are due within 12 months and equal their carrying values, as the impact of discounting is not significant.

96
Notes to the Annual Financial Statements (continued)Shoprite Holdings Ltd and its Subsidiaries for the year ended June 2011
C O M PA N Y GROUP
June June June June2010 2011 2011 2010
R’000 R’000 R’000 R’000
SHOPRITE HOLDINGS LTD INTEGRATED REPORT 2011
39 FINANCIAL RISK MANAGEMENT (CONTINUED)39.2 Insurance risk
The Group underwrites insurance products with the following terms and conditions:
– Credit protection which covers the risk of the customer being unable to settle the terms of the credit agreement as a result of death, disability or qualifying retrenchment.
– All risk cover which covers the repair or replacement of the product due to accidental loss or damage within the terms of the conditions of the policy, and extended guarantees which covers the repair or replacement of faulty products as an extension of the suppliers’ guarantees.
The risk under any one insurance contract is the possibility that an insured event occurs as well as the uncertainty of the amount of the resulting claim. By the very nature of an insur-ance contract, this risk is random and unpredictable.
Underwriting risk is the risk that the Group’s actual exposure to short-term risks in respect of policy-holding benefits will exceed prudent estimates. Where appropriate, the above risks are managed by senior management and directors.
Within the insurance process, concentration risk may arise where a particular event or series of events could impact heavily on the Group’s resources. The Group has not formally monitored the concentration risk; however, it has mitigated against concen-tration risk by structuring event limits in every policy to ensure that the probability of underwriting loss is minimised. Therefore the Group does not consider its concentration risk to be high.
39.3 Fair value estimationThe nominal value less estimated credit adjustments of trade and other receivables and payables are assumed to approxi-mate their fair values.
The book value of all other financial instruments approximate the fair values thereof.

97
Notes to the Annual Financial Statements (continued)Shoprite Holdings Ltd and its Subsidiaries for the year ended June 2011
C O M PA N Y GROUP
June June June June2010 2011 2011 2010
R’000 R’000 R’000 R’000
40 CAPITAL RISK MANAGEMENTThe Group’s objectives when managing capital are to safeguard the Group’s ability to continue as a going concern in order to provide returns for shareholders and benefits for other stake-holders and to maintain an optimal capital structure to reduce the cost of capital. Total capital is considered to be equity as shown in the statement of financial position.
In order to maintain or adjust the capital structure, the Group may adjust the amount of dividends paid to shareholders, return capital to shareholders, issue new shares or sell assets to reduce debt. Due to the cash generative nature of the Group’s operations and current prevailing economic conditions, management has determined that the lowest possible gearing ratio will provide shareholders with the highest possible return on investment with the lowest possible exposure to financial risk. The gearing ratio is calculated as net debt borrowings divided by equity and was 0.70% (2010: 0.68%) on the state-ment of financial position date. The Group is in the process of converting part of it’s short term borrowings into longer term borrowings to match the nature and terms of borrowings with the expenditure the funds are intended for.
The Group is currently maintaining a two times dividend cover based on headline earnings per share.
41 RELATED-PARTY INFORMATIONRelated-party relationships exist between the Company, subsidiaries, directors, as well as their close family members, and key management of the Company.
During the year under review, in the ordinary course of busi-ness, certain Group companies entered into transactions with each other. All these intergroup transactions have been elimi-nated in the annual financial statements on consolidation.
Non-executive director, CH Wiese, is an employee of Chaircorp (Pty) Ltd, a management company that renders advisory servic-es to Shoprite Checkers (Pty) Ltd in return for an annual fee. The fees relating to services as non-executive director are included in the directors remuneration note 26. An amount of R5,782,798 (2010: R7,446,667) was paid to Chaircorp (Pty) Ltd for advisory services to Shoprite Checkers (Pty) Ltd.
Details of the remuneration of directors, and their shareholding, are disclosed in notes 14 and 26.
Key management personnel compensationShort-term employee benefits 142 869 119 725 Post-employment benefits 16 021 24 487 Share-based payments 188 521 617 928 Directors’ fees 845 713
— — 348 256 762 853

98
Notes to the Annual Financial Statements (continued)Shoprite Holdings Ltd and its Subsidiaries for the year ended June 2011
C O M PA N Y GROUP
June June June June2010 2011 2011 2010
R’000 R’000 R’000 R’000
SHOPRITE HOLDINGS LTD INTEGRATED REPORT 2011
41 RELATED-PARTY INFORMATION (CONTINUED)In compliance with King III, the combined compensation of the 3 highest paid employees for the company that are not directors are as follows:
Remuneration 5 171 2 850Performance bonus 3 888 2 743Share based payments 19 383 23 428Retirement and medical benefits 1 068 635Other benefits 465 386
— — 29 975 30 042
During the year key management have purchased goods at the Group’s usual prices less a 15% discount. Discount ranging from 5% to 15% is available to all permanent full-time and flexi-time employees.
During the financial year under review, in the ordinary course of business, certain Group companies purchased certain products and services from certain entities, in which directors JW Basson, CH Wiese, EL Nel and JA Louw, or their direct family members, have a significant influence. These purchases were concluded at what management believe to be market-related prices and are insignificant in terms of the Group’s total operations for the year.
These purchases and related balances were as follows:Purchase of merchandise 80 784 64 903 Utilisation of services 573 7 199 Year-end balances 4 070 4 485
The Group has a 50% interest in the Hungry Lion joint venture (refer note 42). The other 50% is indirectly held by alternate director JAL Basson.
The following transactions took place between the Hungry Lion joint venture and the Group during the year under review:
Administration fees paid to the Group 3 709 3 266 Rent paid to the Group 2 000 5 965 Interest paid to the Group 1 930 3 494 Interest paid to the joint venture 460 611
The year-end balances relating to the transactions with the joint venture are disclosed in notes 12 and 20.
The Company received the following from its subsidiary, Shoprite Checkers (Pty) Ltd:
1 075 1 305 Annual administration fee
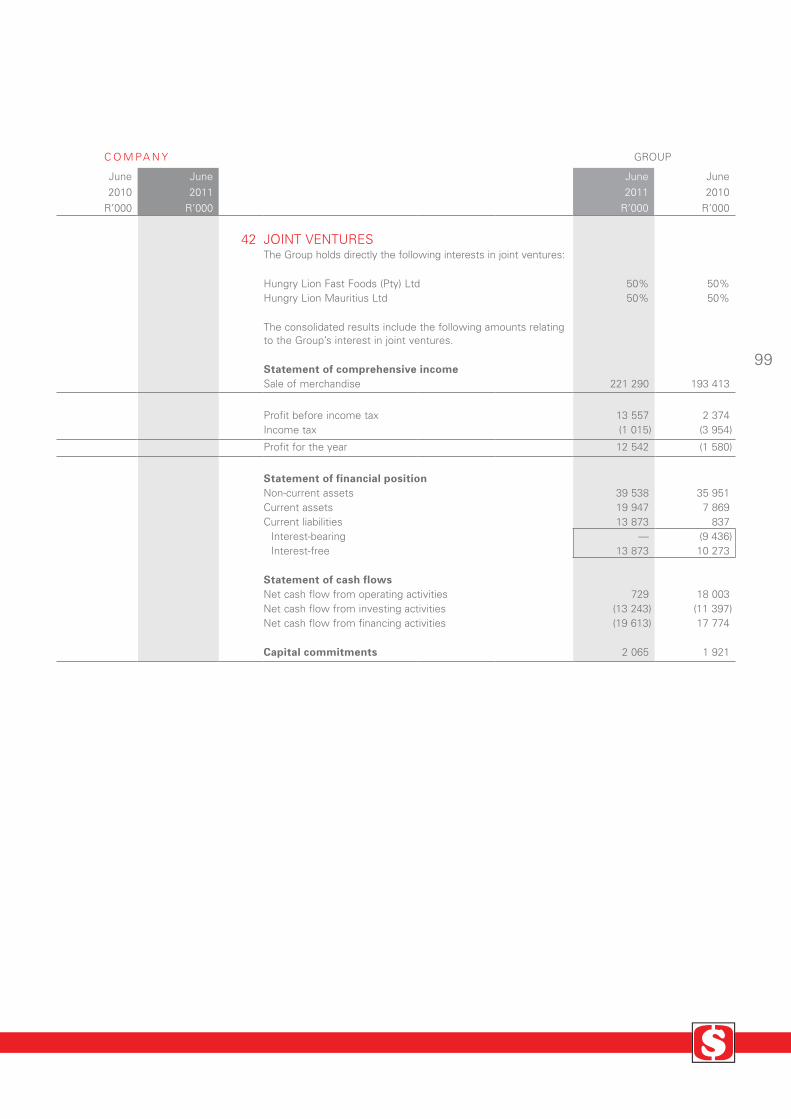
99
Notes to the Annual Financial Statements (continued)Shoprite Holdings Ltd and its Subsidiaries for the year ended June 2011
C O M PA N Y GROUP
June June June June2010 2011 2011 2010
R’000 R’000 R’000 R’000
42 JOINT VENTURESThe Group holds directly the following interests in joint ventures:
Hungry Lion Fast Foods (Pty) Ltd 50% 50%Hungry Lion Mauritius Ltd 50% 50%
The consolidated results include the following amounts relating to the Group’s interest in joint ventures.
Statement of comprehensive incomeSale of merchandise 221 290 193 413
Profit before income tax 13 557 2 374 Income tax (1 015) (3 954)
Profit for the year 12 542 (1 580)
Statement of financial positionNon-current assets 39 538 35 951 Current assets 19 947 7 869 Current liabilities 13 873 837
Interest-bearing — (9 436)Interest-free 13 873 10 273
Statement of cash flowsNet cash flow from operating activities 729 18 003 Net cash flow from investing activities (13 243) (11 397)Net cash flow from financing activities (19 613) 17 774
Capital commitments 2 065 1 921

SHOPRITE HOLDINGS LTD INTEGRATED REPORT 2011
100
Interest in Subsidiaries – Annexure A
Country of incorporation
Issued ordinary and
preference share
capital and premium
Percentage shares held
by Group Investment in shares Amount owing by/(to)June 2011 June 2010 June 2011 June 2010
R’000 % R’000 R’000 R’000 R’000
DIRECT SUBSIDIARIESOK Bazaars (1998) (Pty) Ltd South Africa 2 700 100 — — — — Shoprite Checkers (Pty) Ltd South Africa 1 128 908 100 174 431 174 431 7 559 73 093 Shoprite International Ltd Mauritius 1 443 013 100 1 443 013 1 443 013 — — Shoprite Insurance Company Ltd South Africa 20 230 100 20 230 20 230 — — Shoprite Checkers Properties Ltd South Africa 26 196 100 16 679 16 679 3 365 3 365 Other South Africa — 100 150 150 (150) (150)
1 654 503 1 654 503 10 774 76 308
INDIRECT SUBSIDIARIESAfrica Supermarkets Ltd* Zambia — 100 Checkers Chatsworth Ltd South Africa 2 000 48 Computicket (Pty) Ltd South Africa 233 100 Megasave Trading (Pvt) Ltd* India 118 383 100 Mercado Fresco de Angola Lda* Angola 342 100 Medirite (Pty) Ltd South Africa — 100 OK Bazaars (Lesotho) (Pty) Ltd Lesotho 300 50 OK Bazaars (Namibia) Ltd Namibia 500 100 OK Bazaars (Swaziland) (Pty) Ltd Swaziland 200 100 OK Bazaars (Venda) Ltd South Africa 2 400 50 Propco Mozambique Lda* Mozambique 432 100 Retail Holdings Botswana (Pty) Ltd* Botswana 46 648 100 Retail Supermarkets Nigeria Ltd* Nigeria 522 100 Sentra Namibia Ltd* Namibia 5 880 100 Shophold (Mauritius) Ltd* Mauritius 351 100 Shoprite Angola Imobiliaria Lda* Angola 342 100 Shoprite Checkers Tanzania Ltd* Tanzania 205 797 100 Shoprite Checkers Uganda Ltd* Uganda 41 612 100 Shoprite Egypt for Internal Trade SAE* Egypt 40 424 100 Shoprite Ghana (Pty) Ltd* Ghana 31 417 100 Shoprite Lesotho (Pty) Ltd* Lesotho 1 100 Shoprite Madagascar S.A.* Madagascar 116 331 100 Shoprite (Mauritius) Ltd* Mauritius 72 400 100 Shoprite Namibia (Pty) Ltd* Namibia — 100 Shoprite RDC SPRL* DRC 32 302 100 Shoprite Supermercados Lda* Angola 342 100 Shoprite Too (Pty) Ltd* Tanzania 1 870 100 Shoprite Trading Ltd* Malawi 1 100
1 654 503 1 654 503 10 774 76 308
*Converted at historical exchange rates
NOTE:General information in respect of subsidiaries is set out in respect of only those subsidiaries of which the financial position or results are material for a proper appreciation of the affairs of the Group. A full list of subsidiaries is available on request.

101
Shareholder AnalysisShoprite Holdings Ltd and its Subsidiaries as at June 2011
SHAREHOLDER SPREADNo of Shareholders % No of Shares %
1 – 1,000 shares 10 516 72.20 3 371 283 0.621,001 – 10,000 shares 3 181 21.84 9 971 689 1.8310,001 – 100,000 shares 639 4.39 20 570 292 3.78100,001 – 1000,000 shares 165 1.13 52 250 337 9.61Over 1,000,001 shares 65 0.45 457 315 859 84.15
Totals 14 566 100.00 543 479 460 100.00
DISTRIBUTION OF SHAREHOLDERSNo of Shareholders % No of Shares %
Banks 151 1.04 220 223 947 40.52Brokers 33 0.23 10 773 974 1.98Close Corporations 138 0.95 260 120 0.05Endowment Funds 75 0.51 587 931 0.11Individuals 11 463 78.70 16 783 953 3.50Insurance Companies 33 0.23 12 377 631 2.28Investment Companies 31 0.21 5 663 779 1.04Medical Aid Schemes 3 0.02 32 792 0.01Mutual Funds 240 1.65 33 386 538 6.14Nominees & Trusts 1 852 12.71 50 484 741 9.29Other Corporations 84 0.58 153 565 0.03Own Holdings 2 0.01 37 346 947 6.46Private Companies 298 2.05 59 264 963 10.90Public Companies 16 0.11 780 296 0.14Retirement Funds 147 1.01 95 358 283 17.55
Totals 14 566 100.00 543 479 460 100.00
PUBLIC / NON – PUBLIC SHAREHOLDERSNo of Shareholders % No of Shares %
Non – Public Shareholders 40 0.27 140 261 213 25.81Directors of the company 38 0.26 102 914 266 18.94Own Holdings 2 0.01 37 346 947 6.87
Public Shareholders 14 526 99.73 403 218 247 74.19
Totals 14 566 100.00 543 479 460 100.00
BENEFICIAL SHAREHOLDERS HOLDING 1% OR MORENo of Shares %
Wiese, CH 89 917 398 16.54Government Employees Pension Fund 74 076 350 13.63Capital Group 62 499 926 11.50Shoprite Checkers (Pty) Ltd 37 346 947 6.87Lazard 18 329 406 3.37Basson, JW 10 110 084 1.86BlackRock 9 517 955 1.75Vanguard 9 061 800 1.67Artio Global Investors 8 773 256 1.61JPMorgan 8 448 572 1.55Fidelity 8 249 721 1.52First State Investments 7 919 805 1.46Namibian Government Institutions Pension Fund 7 819 262 1.44Liberty Group 7 132 625 1.31Skagen 6 722 590 1.24Rand Merchant Bank 6 163 195 1.13Rotrust (Pty) Ltd 5 465 705 1.01
Totals 377 554 597 69.47
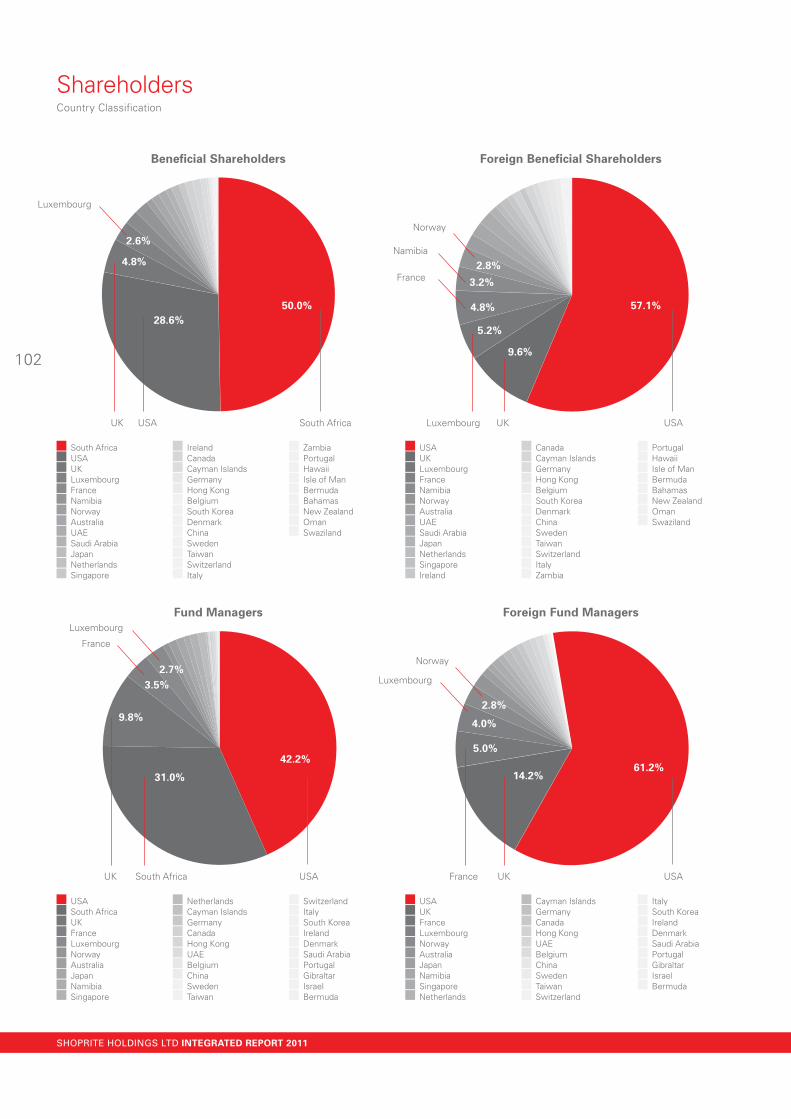
SHOPRITE HOLDINGS LTD INTEGRATED REPORT 2011
102
ShareholdersCountry Classification
50.0%28.6%
4.8%
2.6%
42.2%
31.0%
9.8%
2.7%3.5%
Fund Managers
USA South Africa UK France Luxembourg Norway Australia Japan Namibia Singapore
Netherlands Cayman Islands Germany Canada Hong Kong UAE Belgium China Sweden Taiwan
Switzerland Italy South Korea Ireland Denmark Saudi Arabia Portugal Gibraltar Israel Bermuda
USASouth AfricaUK
Beneficial Shareholders
South Africa USA UK Luxembourg France Namibia Norway Australia UAE Saudi Arabia Japan Netherlands Singapore
Ireland Canada Cayman Islands Germany Hong Kong Belgium South Korea Denmark China Sweden Taiwan Switzerland Italy
Zambia Portugal Hawaii Isle of Man Bermuda Bahamas New Zealand Oman Swaziland
South AfricaUSAUK
Foreign Fund Managers
USA UK France Luxembourg Norway Australia Japan Namibia Singapore Netherlands
Cayman Islands Germany Canada Hong Kong UAE Belgium China Sweden Taiwan Switzerland
Italy South Korea Ireland Denmark Saudi Arabia Portugal Gibraltar Israel Bermuda
61.2%
USAUKFrance
Foreign Beneficial Shareholders
USA UK Luxembourg France Namibia Norway Australia UAE Saudi Arabia Japan Netherlands Singapore Ireland
Canada Cayman Islands Germany Hong Kong Belgium South Korea Denmark China Sweden Taiwan Switzerland Italy Zambia
Portugal Hawaii Isle of Man Bermuda Bahamas New Zealand Oman Swaziland
57.1%
5.2%
9.6%
USAUKLuxembourg
Luxembourg
France
2.8%
4.0%
4.8%
3.2%
2.8%
Norway
Norway
Luxembourg
Namibia
France
Luxembourg
5.0%
14.2%
103
1. NOTICE OF MEETING Notice is hereby given that the AGM of Shoprite Holdings
will be held at the Company’s registered office, corner William Dabs and Old Paarl Roads, Brackenfell, South Africa on Monday, 31 October 2011 at 09:15 (South African time).
2. MEMORANDUM OF INCORPORATION (MOI) The Companies Act 71 of 2008 (as amended) (“the
Companies Act”) came into effect on 1 May 2011 (“the Effective Date”). From the Effective Date the Company’s Memorandum of Association and Articles of Association became known as its MOI. In this notice of the AGM, the term MOI is used to refer to the Company’s MOI ( previously the Memorandum of Association and Articles of Association).
3. WHO MAY ATTEND AND VOTE? 3.1 If you hold dematerialised shares which are registered in
your name or if you are the registered holder of certificated shares:
– You may attend the AGM in person; – Alternatively, you may appoint a proxy to represent you
at the AGM and to attend, participate in, and speak and vote at the AGM in your place by completing the attached form of proxy in accordance with the instruc-tions it contains and returning it to the company secre-tary or transfer secretaries at their addresses set out below to be received not later than 09:15 (South African time) on Saturday 29 October 2011. A proxy need not be a shareholder of the Company.
3.2 If you hold dematerialised shares which are not registered in your name and:
– wish to attend the AGM, you must obtain the necessary letter of representation authority from your Central Share Depository Participant (CSDP) or broker; or
– do not wish to attend the AGM, but would like your vote to be recorded at the meeting, you should contact your CSDP or broker and furnish them with your voting instructions.
You must not complete the attached form of proxy.
3.3 The record date for purposes of determining which shareholders are entitled to receive this notice is deter-mined in terms of section 59(3)(a) of the Companies Act, being 29 September 2011.
3.4 The date on which shareholders must be recorded as such in the register maintained by the transfer secretaries of the Company for purposes of being entitled to attend and vote at this meeting is determined in terms of section 59(3)(b) of the Companies Act, being 28 October 2011 (“the Voting Record Date”).
3.5 All AGM participants will be required to provide identifica-tion reasonably satisfactory to the chairperson of the AGM.
3.6 As required by section 61(10) of the Companies Act, the Company will make provision for shareholders or their
Notice to Shareholders: Annual General Meeting (AGM)Shoprite Holdings Ltd and its Subsidiaries as at June 2011
proxies to participate in the AGM by way of electronic communication. Participants must dial the appropriate access numbers depending on their locations five minutes prior to the starting time of the AGM:
Johannesburg ............................................... (011) 535 3600 Cape Town ................................................... (021) 819 0900 Durban .......................................................... (031) 812 7600 International ............................................(+27 11) 535 3600
3.7 In order to reflect the views of shareholders more accu-rately, all resolutions and substantive decisions at the AGM will be put to vote on a poll, rather than being determined on a show of hands. A vote on poll takes into account the number of shares held by each shareholder, which the Board believes to be a more democratic procedure.
3.8 If you are in any doubt as to what action you should take arising from the following resolutions, please consult your stockbroker, banker, attorney, accountant or other profes-sional adviser immediately.
4. FINANCIAL STATEMENTS A copy of the financial statements of the Company for the
year ended 30 June 2011 and the reports of the directors and independent auditors are delivered herewith.
5. PURPOSE OF THE AGM The purpose of this meeting is to present the: – directors report to the shareholders; – audited financial statements for the year ended
30 June 2011; – the audit committee report, and – to consider and, if deemed fit, to pass, with or without
modification, the resolutions set out below.
The following resolutions will be considered at the AGM, and, if deemed fit, passed with or without modification:
5.1 Ordinary Resolution Number 1: Annual Financial Statements
“Resolved that the annual financial statements of the Company and the Group for the year ended 30 June 2011 circulated with this notice, including the reports of the direc-tors and independent auditors be and are hereby approved.”
For ordinary resolution number 1 to be adopted, the support
of a majority of votes cast by shareholders present or repre-sented by proxy at this meeting is required.
5.2 Ordinary Resolution Number 2: Re-Appointment of Auditors
“Resolved that PricewaterhouseCoopers Inc. (PwC) be re-elected as independent registered auditors of the Company for the period until the next AGM of the Company (noting that Mr A Wentzel is the individual registered auditor of PwC who will undertake the audit in respect of the finan-cial year ending 30 June 2012) as recommended by the Company’s Audit and Risk Committee.”
Shoprite Holdings Limited (Incorporated in the Republic of South Africa)
(Registration number 1936/007721/06)JSE share code: SHPNSX share code: SRH
LUSE share code: SHOPRITEISIN: ZAE000012084
(“Shoprite Holdings” or “the Company”)

SHOPRITE HOLDINGS LTD INTEGRATED REPORT 2011
104
Notice to Shareholders (continued)Shoprite Holdings Ltd and its Subsidiaries as at June 2011
For ordinary resolution number 2 to be adopted, the support of a majority of votes cast by shareholders present or repre-sented by proxy at this meeting is required.
5.3 Ordinary Resolution Number 3: Re-Election of Dr CH Wiese
“Resolved that Dr CH Wiese, who is required to retire by rotation as a director of the Company at this AGM and who is eligible and available for re-election, is hereby reap-pointed with immediate effect.”
Age: 69 First Appointed: 30 October 1991 Educational qualifications: BA LLB DCom (hc) Directorship: Chairman of Tradehold, Invicta Holdings and
Tulca. Also serves on the boards of PSG Group, Primedia and the Luna Group.
Dr Wiese is the non-executive chairman of the Board and also serves on the Remuneration and Nomination Committees.
For ordinary resolution number 3 to be adopted, the support of a majority of votes cast by shareholders present or repre-sented by proxy at this meeting is required.
5.4 Ordinary Resolution Number 4: Re-Election of Mr JA Louw
“Resolved that Mr JA Louw, who is required to retire by rotation as a director of the Company at this AGM and who is eligible and available for re-election, is hereby reappointed with immediate effect.”
Age: 67 First Appointed: 30 October 1991 Educational qualifications: Bsc Hons B(B&A) Hons Directorship: Chairman of Andrag Agrico. Mr Louw is an independent non-executive director and also
serves on the Audit, Remuneration and Nomination Committees.
For ordinary resolution number 4 to be adopted, the support of a majority of votes cast by shareholders present or represented by proxy at this meeting is required.
5.5 Ordinary Resolution Number 5: Re-Election of Mr JF Malherbe
“Resolved that Mr JF Malherbe who is required to retire by rotation as a director of the Company at this AGM and who is eligible for re-election and has offered, is hereby reap-pointed with immediate effect.”
Age: 82 First Appointed: 14 May 1999 Educational qualifications: BCom LLB Mr Malherbe is an independent non-executive director and
also serves on the Audit Committee.
For ordinary resolution number 5 to be adopted, the support of a majority of votes cast by shareholders present or repre-sented by proxy at this meeting is required.
5.6 Ordinary Resolution Number 6: Re-Election of Mr BR Weyers
“Resolved that Mr BR Weyers, who is required to retire by rotation as a director of the Company at this AGM and who is eligible for re-election and has offered, is hereby reap-pointed with immediate effect.”
Age: 59 First Appointed: 20 February 1997 Directorship: Director of main trading subsidiary, Shoprite
Checkers (Pty) Ltd Mr Weyers is an executive director and holds the position
of general manager marketing and product development.
For ordinary resolution number 6 to be adopted, the support of a majority of votes cast by shareholders present or repre-sented by proxy at this meeting is required.
5.7 Ordinary Resolution Number 7: Appointment of Mr JG Rademeyer as Chairperson and member of the Shoprite Holdings Audit Committee
“Resolved that Mr JG Rademeyer be elected as Chairperson and member of the Shoprite Holdings Audit and Risk Committee with immediate effect in terms of section 94(2) of the Companies Act”
Age: 62 First Appointed: 4 November 2002 Educational qualifications: BCom CTA CA(SA) Mr Rademeyer is an independent non-executive director
and has also been appointed as the lead independent director.
For ordinary resolution number 7 to be adopted, the support of a majority of votes cast by shareholders present or repre-sented by proxy at this meeting is required.
5.8 Ordinary Resolution Number 8: Appointment of Mr JA Louw as member of the Shoprite Holdings Audit Committee
“Subject to the re-election of Mr JA Louw as a director pursuant to ordinary resolution 4, it is resolved that Mr JA Louw be elected as member of the Shoprite Holdings Audit and Risk Committee with immediate effect in terms of section 94(2) of the Companies Act.”
For ordinary resolution number 8 to be adopted, the support of a majority of votes cast by shareholders present or repre-sented by proxy at this meeting is required.
5.9 Ordinary Resolution Number 9: Appointment of Mr JF Malherbe as member of the Shoprite Holdings Audit Committee
“Subject to the re-election of Mr JF Malherbe as a director pursuant to ordinary resolution 5, it is resolved that Mr JF Malherbe be elected as member of the Shoprite Holdings Audit and Risk Committee with immediate effect in terms of section 94(2) of the Companies Act.”

105
For ordinary resolution number 9 to be adopted, the support of a majority of votes cast by shareholders present or repre-sented by proxy at this meeting is required.
5.10 Ordinary Resolution Number 10: Endorsement of Remuneration Policy
“Resolved that, through a non-binding advisory vote, the Company’s remuneration policy (excluding the remunera-tion of the non-executive directors and members of board committees for their services as directors) as set out in the Integrated Report, is endorsed.”
For ordinary resolution number 10 to be adopted, the support of a majority of votes cast by shareholders present or represented by proxy at this meeting is required.
5.11 Ordinary Resolution Number 11: General Authority over Unissued Shares
“Resolved that 27,2 million (5% of the issued share capital that includes treasury shares) of the authorised but unissued shares in the capital of the Company be and are hereby placed under the control and authority of the directors of the Company until the next AGM and that the directors of the Company be and are hereby authorised and empowered to allot, issue and otherwise dispose of such shares to such person or persons on such terms and condi-tions and at such times as the directors of the Company may from time to time and in their discretion deem fit, subject to the provisions of the Companies Act, the MOI of the Company and JSE Limited (“JSE”) Listings Requirements, when applicable, and any other exchange on which the shares of the Company may be quoted or listed from time to time.”
For ordinary resolution number 11 to be adopted, the support of a majority of votes cast by shareholders present or represented by proxy at this meeting is required.
5.12 Ordinary Resolution Number 12: General Authority to Issue Shares for Cash
“Resolved that the directors of the Company be and are hereby authorised by way of a general authority, to issue all or any of the authorised, but unissued shares in the capital of the Company, for cash, as and when they in their discre-tion deem fit, subject to the Companies Act, the MOI of the Company, the JSE Listings Requirements and any other exchange on which the shares of the Company may be quoted from time to time, when applicable, subject to the following limitations, namely that:
– the equity securities which are the subject of the issue for cash must be of a class already in issue, or where this is not the case, must be limited to such securities or rights that are convertible into a class already in issue;
– any such issue will only be made to “public share-holders” as defined in the JSE Listings Requirements and not related parties, unless the JSE otherwise agrees;
– the number of shares issued for cash shall not in the aggregate in any 1 (one) financial year, exceed 5% (five percent) of the Company’s issued share capital of ordi-nary shares. The number of ordinary shares which may be issued shall be based on the number of ordinary shares in issue, added to those that may be issued in future (arising from the conversion of options/converti-bles) at the date of such application, less any ordinary shares issued, or to be issued in future arising from options/convertible ordinary shares issued during the current financial year, plus any ordinary shares to be issued pursuant to a rights issue which has been announced, is irrevocable and fully underwritten, or an acquisition which has had final terms announced;
– this authority be valid until the Company’s next AGM, provided that it shall not extend beyond 15 (fifteen) months from the date that this authority is given;
– a paid press announcement will be published giving full details, including the impact on the net asset value and earnings per share, at the time of any issue, repre-senting on a cumulative basis within one (1) financial year, 5% (five percent) or more of the number of shares in issue prior to the issue in terms of this authorisation;
– in determining the price at which an issue of shares may be made in terms of this general authority, the maximum discount permitted will be 10% (ten percent) of the weighted average traded price on the JSE of those shares measured over the 30 (thirty) business days prior to the date that the price of the issue is deter-mined or agreed by the directors of the Company.”
In order for this ordinary resolution number 12 to be adopted, in terms of the JSE Listings Requirements, the support of 75% of votes cast by shareholders present or represented by proxy at this meeting is required.
5.13 Ordinary Resolution Number 13: General Authority to Directors
“Resolved that the directors of the Company be and are hereby authorised to do all things, perform all acts and to sign all documentation necessary to effect the implementation of the ordinary and special resolutions adopted at the AGM.”
For ordinary resolution number 13 to be adopted, the support of a majority of votes cast by shareholders present or represented by proxy at this meeting is required.
5.14 Special Resolution Number 1: Remuneration Payable to Non-Executive Directors
“Resolved in terms of section 66(9) of the Companies Act that the annual remuneration of the non-executive directors for the twelve months from 1 November 2010 – 31 October 2011 be approved as follows:
SHOPRITE HOLDINGS LTD INTEGRATED REPORT 2011
106
SHOPRITE HOLDINGS BOARD AND COMMITTEE FEES
2010/2011 2009/10 BOARD Chairman of the Board R218 000 R179 775 Lead Independent Director R113 000 R93 060 Director R103 000 R84 600
AUDIT COMMITTEE Chairman R154 000 R126 900 Member R77 000 R63 450
For special resolution number 1 to be adopted, the support of 75% of votes cast by shareholders present or repre-sented by proxy at this meeting is required.
REASON FOR AND EFFECT OF SPECIAL RESOLUTION NUMBER 1
The reason for and effect for special resolution number 1 is to grant the Company the authority to pay remuneration to its directors for their services as directors for the period that ended on 31 October 2011.
5.15 Special Resolution 2 – Financial Assistance to Subsidiaries, Related and Inter-Related Entities
Resolved in terms of section 45(3)(a)(ii) of the Companies Act, subject to compliance with the requirements of the Company’s MOI, the Companies Act and the JSE Listings Requirements as presently constituted and amended from time to time as a general approval, that the board of the Company be authorised during a period of two (2) years from the date of this special resolution to authorise the Company to provide direct or indirect financial assistance to any related or inter-related company or corporation (“any related or inter-related company or corporation” has herein the same meaning as in section 45 of the Companies Act and which meaning includes all the subsidiaries of the Company) to the Company, in one or more of the following forms:
– loan to, – guarantee of any obligation of, – suretyship in respect any obligation of, – indemnity undertakings in respect of obligations of, or – the securing of any debt or obligations of,
such a related or inter-related company or corporation which the board of the Company may deem fit on the terms and conditions and for amounts that the board of the Company may determine.
For special resolution number 2 to be adopted, the support of 75% of votes cast by shareholders present or repre-sented by proxy at this meeting is required.
REASON FOR AND EFFECT OF SPECIAL RESOLUTION NUMBER 2
This special resolution will grant the Company’s directors the authority to authorise financial assistance in any of the
forms described in the resolution to any company related or inter-related to the Company as contemplated by section 45 of the Companies Act.
NOTICE TO THE SHAREHOLDERS OF THE COMPANY IN TERMS OF SECTION 45(5) OF THE COMPANIES ACT OF A RESOLUTION ADOPTED BY THE BOARD AUTHORISING THE COMPANY TO PROVIDE SUCH DIRECT OR INDIRECT FINANCIAL ASSISTANCE:
– By the time that this notice of the AGM is delivered to shareholders, the Board would have adopted a written board resolution (“the Section 45 Board Resolution”) authorising the Company to provide at any time during the period of two (2) years from the date that the above special resolution number 2 is adopted, any direct or indirect financial assistance as contemplated in section 45 of the Companies Act to any one or more related or inter-related companies or corporations of the Company;
– The Section 45 Board Resolution will only be subject to and only effective to the extent that special resolution number 2 is adopted by shareholders and the provision of any such direct or indirect financial assistance by the Company, pursuant to such resolution, will always be subject to the Board being satisfied that immediately after providing such financial assistance, the Company will satisfy the solvency and liquidity test as referred to in section 45(3)(b)(i) of the Companies Act and that the terms under which the financial assistance will be given are fair and reasonable to the Company as required in section 45(3)(b)(ii) of the Companies Act; and
– The Company hereby provides notice of the Section 45 Board Resolution to shareholders of the Company.
5.16 Special Resolution Number 3 – General Approval to Repurchase Shares
“Resolved that, the Company and/or any subsidiary of the Company be and are hereby authorised by way of a general approval to acquire the issued ordinary shares of the Company, upon such terms and conditions and in such amounts as the directors of the Company may from time to time determine, but subject to the MOI of the Company, the provisions of the Companies Act and the JSE Listings Requirements and any other exchange on which the shares of the Company may be quoted or listed from time to time, where applicable, and provided that:
– the repurchase of securities will be effected through the main order book operated by the JSE trading system without any prior understanding or arrangement between the Company and the counterparty, or other manner approved by the JSE;
– this general authority shall be valid until the Company’s next AGM, provided that it shall not extend beyond 15 (fifteen) months from the date of passing of this special resolution;
– in determining the price at which the Company’s ordi-nary shares are acquired by the Company or its subsidi-aries in terms of this general authority, the maximum premium at which such ordinary shares may be acquired
Notice to Shareholders (continued)Shoprite Holdings Ltd and its Subsidiaries as at June 2011

107
will be 10% (ten percent) of the weighted average of the market price at which such ordinary shares are traded on the JSE, as determined over the 5 (five) trading days immediately preceding the date of the repurchase of such ordinary shares by the Company;
– the acquisitions of ordinary shares in the aggregate in any 1 (one) financial year do not exceed 5% (five percent) of the Company’s issued ordinary share capital from the date of this general authority;
– the Company and the Group are in a position to repay their debt in the ordinary course of business for the 12 (twelve) month period after the date of the notice of the AGM;
– the assets of the Company and the Group, being fairly valued in accordance with the accounting policies used in the latest annual financial statements are, after the repurchase, in excess of the liabilities of the Company and the Group for the 12 (twelve) month period after the date of the notice of the AGM;
– the ordinary capital and reserves of the Company and the Group are adequate for the 12 (twelve) month period after the date of the notice of the AGM;
– the available working capital is adequate to continue the operations of the Company and the Group for a period of 12 (twelve) months after the date of the notice of the AGM;
– prior to entering the market to proceed with the repur-chase, the Company’s sponsor has complied with its responsibilities contained in Schedule 25 of the JSE Listings Requirements;
– prior to entering the market to repurchase the Company’s securities, a board resolution to authorise the repurchase will have been passed in accordance with the requirements of section 46 of the Companies Act, and stating that the Board has acknowledged that it has applied the solvency and liquidity test as set out in section 4 of the Companies Act and has reasonably concluded that the Company will satisfy the solvency and liquidity test immediately after completing the proposed repurchase;
– after such repurchase the Company will still comply with paragraphs 3.37 to 3.41 of the JSE Listings Requirements concerning shareholder spread;
– the Company or its subsidiaries will not repurchase securities during a prohibited period as defined in para-graph 3.67 of the JSE Listings Requirements, unless there is a repurchase programme in place where the dates and quantities of securities to be traded during the relevant period are fixed (not subject to any variation) and full details of the programme have been disclosed in an announcement on SENS prior to the commencement of the prohibited period;
– when the Company has cumulatively repurchased 3% (three percent) of the initial number of the relevant class of securities, and for each 3% (three percent) in aggre-gate of the initial number of that class acquired there-after, an announcement will be made; and
– the Company only appoints one agent to effect any repurchase(s) on its behalf.”
For special resolution number 3 to be adopted, the support of 75% of votes cast by shareholders present or repre-sented by proxy at this meeting is required.
STATEMENT BY THE BOARD OF DIRECTORS The directors of the Company have no specific intention to
effect the resolution, but will continually review the Company’s position, having regard to prevailing circum-stances and market conditions, in considering whether to repurchase its own shares.
After having considered the effect of the repurchase of ordinary shares pursuant to this general authority, the directors of the Company in terms of the relevant provi-sions of the Companies Act and the JSE Listings Requirements confirm that they will not undertake such purchase unless:
– the Company and the Group are in a position to repay their debt in the ordinary course of business for the 12 (twelve) month period after the date of the notice of the AGM;
– the assets of the Company and the Group, being fairly valued in accordance with the accounting policies used in the latest annual financial statements are, after the repurchase, in excess of the liabilities of the Company and the Group for the 12 (twelve) month period after the date of the notice of the AGM;
– the ordinary capital and reserves of the Company and the Group are adequate for the 12 (twelve) month period after the date of the notice of the AGM;
– the available working capital is adequate to continue the operations of the Company and the Group for a period of 12 (twelve) months after the date of the notice of the AGM.
REASON FOR AND EFFECT OF SPECIAL RESOLUTION NUMBER 3
The Company’s MOI contains a provision allowing the Company or any subsidiary of the Company to repurchase securities issued by the Company subject to the approval of the members in terms of the MOI, the requirements of the Companies Act and the JSE Listing Requirements. The existing general authority granted by the members of the Company at the previous AGM on 25 October 2010, is due to expire, unless renewed.
The directors are of the opinion that it would be in the best interest of the Company to extend such general authority.
The proposed general authority would enable the Company or any subsidiary of the Company to repurchase up to a maximum of 54,347,946 (fifty four million three hundred and forty seven thousand nine hundred and forty six) ordinary shares of the Company, representing 10% (ten percent) of the issued ordinary share capital of Company as at 30 June 2011.
The reason for the passing of special resolution number 3 is to authorise the Company and/or its subsidiaries by way of a general authority from shareholders to repurchase ordi-nary shares issued by the Company.
SHOPRITE HOLDINGS LTD INTEGRATED REPORT 2011
108
Once adopted this special resolution will permit the Company or any of its subsidiaries, to repurchase such ordi-nary shares in terms of the Companies Act, its MOI and the JSE Listings Requirements.
DISCLOSURES IN TERMS OF SECTION 11.26 OF THE JSE LISTINGS REQUIREMENTS
The JSE Listings Requirements require the following disclosures in respect of special resolution 3, some of which are disclosed in the Integrated Report of which this notice forms part:
– Directors and management . . . . . . . . . . .pages 8 and 9 – Major shareholders of the Company . . . . . . . page 101 – Directors’ interests in securities . . . . . . . . . . . . page 41 – Share capital of Company . . . . . . . . . . . . . . . . . page 71
MATERIAL CHANGE Other than the facts and developments as referred to on
pages 35 to 36 of the Integrated Report, there have been no material changes in the affairs or financial position of the Company and its subsidiaries since the date of signature of the audit report and the date of this notice.
DIRECTORS’ RESPONSIBILITY STATEMENT The directors, whose names are given on pages 8 and 9 of
the Integrated Report, collectively and individually accept full responsibility for the accuracy of the information and certify that to the best of their knowledge and belief there are no facts that have been omitted which would make any statement false or misleading and that all reasonable enquiries to ascertain such facts have been made.
LITIGATION STATEMENT Save for the disclosure in the directors report on page 40
and 41 the directors, whose names are given on pages 8 and 9 of the Integrated Report of which this notice forms part, are not aware of any legal or arbitration proceedings, including proceedings that are pending or threatened, that may have or have had in the recent past, being at least the previous 12 (twelve) months, a material effect on the Group’s financial position.
6. TRANSACTION OF OTHER BUSINESS To transact such other business as may be dealt with at
the AGM.
FOR SHOPRITE HOLDINGS LIMITED
PG du PreezCompany secretary26 August 2011
THE COMPANY SECRETARYCnr William Dabs and Old Paarl RoadsP O Box 215, Brackenfell, 7560 South AfricaFacsimile: +27 (0) 21 980 4468E-mail Address: [email protected]
SOUTH AFRICAN TRANSFER SECRETARIESComputershare Investor Services (Pty) Ltd70 Marshall Street, Johannesburg, 2001PO Box 61051, Marshalltown, 2107Facsimile: +27 (0) 11 688 5248
Notice to Shareholders (continued)Shoprite Holdings Ltd and its Subsidiaries as at June 2011

109
Form of ProxyShoprite Holdings Ltd
Shoprite Holdings Limited (Incorporated in the Republic of South Africa)
(Registration number 1936/007721/06)JSE share code: SHPNSX share code: SRH
LUSE share code: SHOPRITEISIN: ZAE000012084
(“Shoprite Holdings” or “the Company”)
For use only by:– certificated ordinary shareholders– dematerialised ordinary shareholders with “own name” registrations
At the annual general meeting of shareholders of Shoprite Holdings to be held at Cnr William Dabs and Old Paarl Roads, Brackenfell at 09h15 on Monday, 31 October 2011 and any adjournment thereof (“the AGM”).
Dematerialised shareholders holding shares other than with “own name” registration, must inform their CSDP or broker of their intention to attend the AGM and request their CSDP or broker to issue them with the necessary letter of representation to attend the AGM in person.
If you do not wish to attend the AGM, provide your CSDP or broker with your voting instruction in terms of your custody agreement.
I/We ........................................................................... (name/s in block letters) of ...................................................................................................
being a shareholder/shareholders of Shoprite Holdings and holding ............................................ ordinary shares in the Company, hereby appoint
1. ......................................................................................................................of ...................................................................... or, failing him/her,
2. ......................................................................................................................of ...................................................................... or, failing him/her,
3. the chairman of the Annual General Meeting, as my/our proxy to attend speak and vote on my/our behalf at the AGM of the shareholders of the Company to be held at 09:15 on Monday 31 October 2011 at Brackenfell, and at any adjournment thereof:
Number of shares
In favour of Against AbstainOrdinary resolution number 1Adoption of the annual financial statementsOrdinary resolution number 2Reappointment of PricewaterhouseCoopers as auditors Ordinary resolution number 3Re-election of Dr CH WieseOrdinary resolution number 4Re-election of Mr JA LouwOrdinary resolution number 5Re-election of Mr JF MalherbeOrdinary resolution number 6Re-election of Mr BR WeyersOrdinary resolution number 7Appointment of Mr JG Rademeyer as Chairperson and member of the Shoprite Holdings Audit CommitteeOrdinary resolution number 8Appointment of Mr JA Louw as member of the Shoprite Holdings Audit CommitteeOrdinary resolution number 9Appointment of Mr JF Malherbe as member of the Shoprite Holdings Audit CommitteeOrdinary resolution number 10 Endorsement of the Remuneration PolicyOrdinary resolution number 11 General authority over unissued sharesOrdinary resolution number 12 General authority to issue shares for cash Special resolution number 1General approval of remuneration payable to non-executive directorsSpecial resolution number 2General approval of financial assistance to subsidiaries, related and inter-related entitiesSpecial resolution number 3General approval to repurchase sharesOrdinary resolution number 13 General authority to directors
*Please indicate with an “X” in the appropriate spaces above how you wish your votes to be cast.
Unless otherwise instructed, my/our proxy may vote as he/she thinks fit.
Signed at (place) ........................................................................ on (date) .......................................................................................................2011
................................................................................... Shareholder’s signature
Please read the notes and instructions overleaf.

SHOPRITE HOLDINGS LTD INTEGRATED REPORT 2011
110
Form of Proxy (continued)Shoprite Holdings Ltd
Notes to form of proxy
1. This form of proxy must only be used by certificated ordinary shareholders or dematerialised ordinary shareholders who hold dematerialised ordinary shares with “own name” registration.
2. Dematerialised ordinary shareholders are reminded that the onus is on them to communicate with their CSDP or broker.
3. Each shareholder is entitled to appoint one or more proxies (who need not be a shareholder(s) of the Company) to attend, speak and vote in place of that shareholder at the Annual General Meeting.
4. A shareholder may insert the name of a proxy or the names of two alternative proxies of the shareholder’s choice in the space provided, with or without deleting “the chairman of the Annual General Meeting”. The person whose name stands first on the form of proxy and who is present at the Annual General Meeting will be entitled to act as proxy to the exclusion of those whose names follow.
5. A shareholder’s instructions to the proxy must be indicated by the insertion of the relevant number of votes exercisable by that share-holder in the appropriate box(es) provided or to mark the relevant box(es). If a box is marked without inserting a number of votes it is deemed that the proxy may exercise all the votes of the shareholder. Failure to comply with the above will be deemed to authorise the chairman of the Annual General Meeting to vote in favour of the ordi-nary and special resolutions at the Annual General Meeting, or any other proxy to vote or to abstain from voting at the Annual General Meeting as he/she deems fit, in respect of the shareholder’s total holding.
6. Summary of rights established by section 58 of the Companies Act of 2008
6.1 At any time, a shareholder of a company may appoint any individual, including an individual who is not a shareholder of that company, as a proxy to:
• participate in, and speak and vote at, a shareholders meeting on behalf of the shareholder; or
• give or withhold written consent on behalf of the shareholder to a decision contemplated in section 60.
6.2 A proxy appointment: • must be in writing, dated and signed by the shareholder; and • remains valid for- – one year after the date on which it was signed; or – any longer or shorter period expressly set out in the
appointment, unless it is revoked in a manner contemplated in subsection (4) (c), or expires earlier as contemplated in subsection (8) (d).
6.3 Except to the extent that the Memorandum of Incorporation of a company provides otherwise:
• a shareholder of that company may appoint two or more persons concurrently as proxies, and may appoint more than one proxy to exercise voting rights attached to different securities held by the shareholder;
• a proxy may delegate the proxy’s authority to act on behalf of the shareholder to another person, subject to any restriction set out in the instrument appointing the proxy; and
• a copy of the instrument appointing a proxy must be delivered to the company, or to any other person on behalf of the company, before the proxy exercises any rights of the shareholder at a shareholders meeting.
6.4 Irrespective of the form of instrument used to appoint a proxy: • the appointment is suspended at any time and to the extent that
the shareholder chooses to act directly and in person in the exercise of any rights as a shareholder;
• the appointment is revocable unless the proxy appointment expressly states otherwise; and
• if the appointment is revocable, a shareholder may revoke the proxy appointment by-
– cancelling it in writing, or making a later inconsistent appointment of a proxy; and
– delivering a copy of the revocation instrument to the proxy, and to the company.
6.5 The revocation of a proxy appointment constitutes a complete and final cancellation of the proxy’s authority to act on behalf of the shareholder as of the later of:
• the date stated in the revocation instrument, if any; or • the date on which the revocation instrument was delivered as
required in subsection (4) (c) (ii).
6.6 If the instrument appointing a proxy or proxies has been delivered to a company, as long as that appointment remains in effect, any notice that is required by this Act or the company’s Memorandum of Incorporation to be delivered by the company to the shareholder must be delivered by the company to:
• the shareholder; or • the proxy or proxies, if the shareholder has- – directed the company to do so, in writing; and – paid any reasonable fee charged by the company for doing so.
6.7 A proxy is entitled to exercise, or abstain from exercising, any voting right of the shareholder without direction, except to the extent that the Memorandum of Incorporation, or the instrument appointing the proxy, provides otherwise.
6.8 If a company issues an invitation to shareholders to appoint one or
more persons named by the company as a proxy, or supplies a form of instrument for appointing a proxy-
• the invitation must be sent to every shareholder who is entitled to notice of the meeting at which the proxy is intended to be exercised;
• the invitation, or form of instrument supplied by the company for the purpose of appointing a proxy, must-
– bear a reasonably prominent summary of the rights established by this section;
– contain adequate blank space, immediately preceding the name or names of any person or persons named in it, to enable a shareholder to write in the name and, if so desired, an alternative name of a proxy chosen by the shareholder; and
– provide adequate space for the shareholder to indicate whether the appointed proxy is to vote in favour of or against any resolution or resolutions to be put at the meeting, or is to abstain from voting;
• the company must not require that the proxy appointment be made irrevocable; and
• the proxy appointment remains valid only until the end of the meeting at which it was intended to be used, subject to subsection (5).
7. Documentary evidence establishing the authority of a person signing this form of proxy in a representative capacity must be attached to this form of proxy, unless previously recorded by the Company’s transfer office or waived by the chairman of the Annual General Meeting.
8. The chairman of the Annual General Meeting may reject or accept any form of proxy which is completed and/or received other than in accordance with these instructions, provided that he is satisfied as to the manner in which a shareholder wishes to vote.
9. Any alterations or corrections to this form of proxy must be initialled by the signatory(ies).
10. The completion and lodging of this form of proxy will not preclude the relevant shareholder from attending the Annual General Meeting and speaking and voting in person thereat to the exclusion of any proxy appointed in terms hereof, should such shareholder wish to do so.
11. A minor must be assisted by his/her parent guardian unless the relevant documents establishing his/her legal capacity are produced or have been registered by the Company.
12. Where there are joint holders of any shares: – any one holder may sign this form of proxy; – the vote(s) of the senior shareholders (for that purpose seniority will
be determined by the order in which the names of shareholders appear in the Company’s register of shareholders) who tenders a vote (whether in person or by proxy) will be accepted to the exclusion of the vote(s) of the other joint shareholder(s).
13. The proxy may not delegate any of the rights or powers granted to it.

111
Dear Shareholder
Please note that in terms of the Companies Act 71 of 2008 (as amended) and the JSE listings Requirements, you may elect to receive
shareholder communications and notices from the Company electronically.
To receive shareholder communications and notices in electronic form, kindly provide the following information:
Full name of shareholder ...........................................................................................................................................................................................
Reference number* ...................................................................................................................................................................................................
Email address ............................................................................................................................................................................................................
Telephone numbers ....................................................................................................................................................................................... (home)
....................................................................................................................................................................................... (office)
......................................................................................................................................................................................(mobile)
*can be obtained from the envelope in which you received the 2011 Integrated Report or please call Computershare on telephone +27 (0)11 370 5000 for details.
Once completed, please return this form to Computershare Investor Services (Pty) Limited in the enclosed business reply paid envelope provided.
Should any of your details change in the future, please advise of the change as soon as possible to enable us to update our records accordingly.
Yours sincerely
P G Du Preez
Company Secretary
Electronic Receipt of Communication and Notices
Shoprite Holdings Limited (Incorporated in the Republic of South Africa)
(Registration number 1936/007721/06)JSE share code: SHPNSX share code: SRH
LUSE share code: SHOPRITEISIN: ZAE000012084
(“Shoprite Holdings” or “the Company”)

REGISTRATION NUMBER1936/007721/06
REGISTERED OFFICE Physical address: Cnr William Dabs and Old Paarl Roads Brackenfell, 7560, South AfricaPostal address: PO Box 215, Brackenfell, 7561, South AfricaTelephone: +27 (0) 21 980 4000Facsimile: +27 (0) 21 980 4050Website: www.shopriteholdings.co.za
COMPANY SECRETARYMr P G du PreezPhysical address: Cnr William Dabs and Old Paarl Roads Brackenfell, 7560, South AfricaPostal address: PO Box 215, Brackenfell, 7561, South AfricaTelephone: +27 (0) 21 980 4284Facsimile: +27 (0) 21 980 4468E-mail: [email protected]
TRANSFER SECRETARIES
South AfricaComputershare Investor Services (Pty) LtdPO Box 61051, Marshalltown, 2107, South AfricaTelephone: +27 (0) 11 370 5000Facsmile: +27 (0) 11 688 5248Website: www.computershare.com
NamibiaTransfer Secretaries (Pty) LtdPO Box 2401, Windhoek, NamibiaTelephone: +264 (0) 61 227 647Facsimile: +264 (0) 61 248 531
ZambiaEnfi n Solutions LimitedPO Box 320069, Lusaka, ZambiaTelephone: +260 (0) 211 256284/5Facsimile: +260 (0) 211 256294
SPONSORS
South AfricaNedbank CapitalPO Box 1144Johannesburg, 2000, South AfricaTelephone: +27 (0) 11 295 8600Facsmile: +27 (0) 11 294 8600Website: www.nedbank.co.za
NamibiaOld Mutual Investment Group (Namibia) (Pty) Ltd,PO Box 25549, Windhoek, NamibiaTelephone: +264 (0) 61 299 3527Facsmile: +264 (0) 61 299 3528
AUDITORSPricewaterhouseCoopers IncorporatedPO Box 2799, Cape Town, 8000, South AfricaTelephone: +27 (0) 21 529 2000Facsimile: +27 (0) 21 529 3300
BANKERSABSA Bank LtdCitibank N.A.First National Bank LtdHSBC LtdInvestec Bank LtdNedbank LtdOld Mutual Specialised Finance (Pty) LtdThe Standard Bank of South Africa LtdStandard Chartered Bank PLC
JUNE
Financial year-end
AUGUST
Reviewed results
SEPTEMBER
Publishing of Integrated Report
Payment of preference dividend
Payment of final ordinary dividend
OCTOBER
Annual General Meeting
DECEMBER
End of financial half-year
FEBRUARY
Interim results
MARCH
Payment of preference dividend
Payment of interim ordinary dividend
AdministrationShoprite Holdings Ltd
Shareholders’ diary
Design and layout: Fresh Identity | Printed by: Hansa Print