SHOPPERS & RETAILING
8
in Thailand 2021 SHOPPERS & RETAILING
Transcript of SHOPPERS & RETAILING

in Thailand 2021SHOPPERS & RETAILING

2 Shoppers & Retailing in Thailand 2021
Contents
Part 1 Introduction 3
Part 2 Executive Summary 9
Part 3 Impact of COVID-19 in 2020: Retail Sales Index 11
Part 4 Thailand at a Glance 21
Part 5 Thai Shoppers: Income and Expenditure 33
Part 6 Retail Market of Thailand: Overview 47
Part 7 Growth in Retail Channels 59
Part 8 E-Commerce in Thailand 68
About Us 74
2
Tommy

14 Shoppers & Retailing in Thailand 202114
When the state of emergency was imposed, retail sales fell sharply to minus 12.1% year-on-year in March 2020, minus 29.4% in April, and 28.2% in May. From June onwards, the decline became smaller each month, recovering to minus 0.2% year-on-year in December.
Sources: Revenue Department, Ministry of Finance, Bank of Thailand, World Health Organization.
Retail Sales Index (YoY), 2020
-2.1% -0.9%
-12.1%
-29.4% -28.2%-17.4%
-12.1%-5.6% -6.6% -6.6% -2.5% -0.2%
Jan Feb Mar Apr May Jun Jul Aug Sep Oct Nov Dec
Total Retail Sales
Numbers of Daily Confirmed Covid-19 Cases
Tommy
Tommy
37 Shoppers & Retailing in Thailand 202137
17,40318,766 19,061
20,892 21,157 21,144 21,437 21,34620,742
2011 2012 2013 2014 2015 2016 2017 2018 2019
Unit: THB
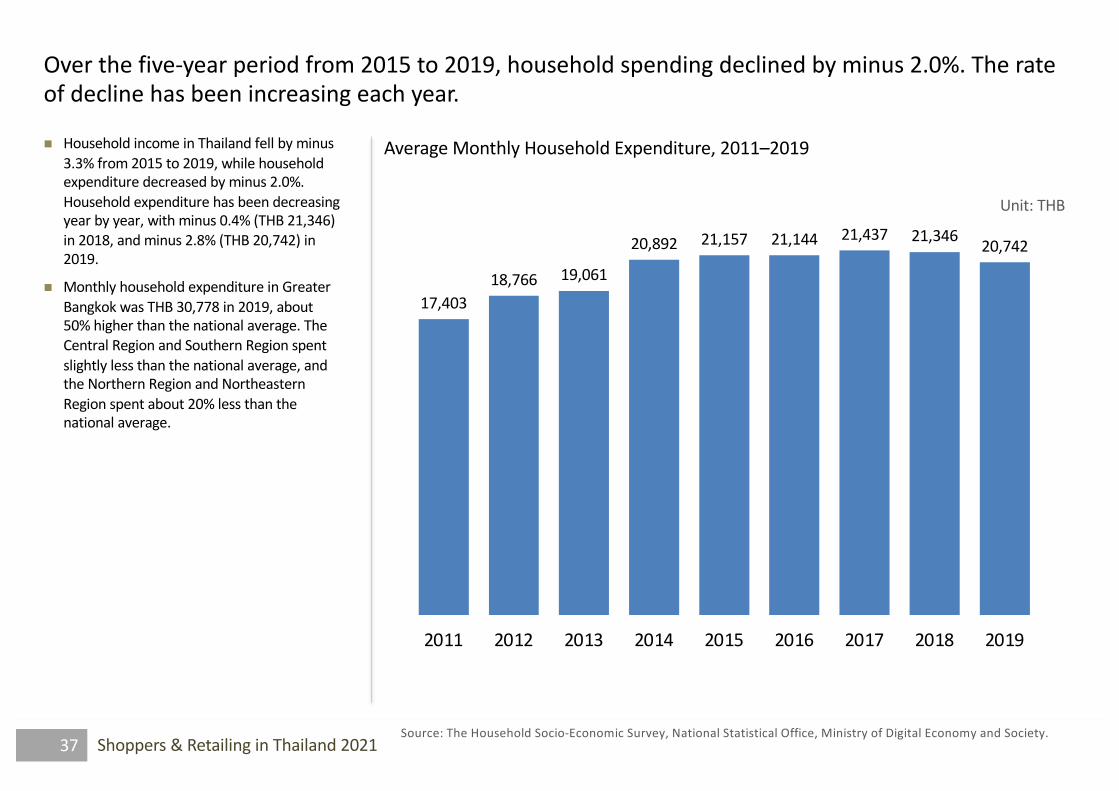
Average Monthly Household Expenditure, 2011–2019
Source: The Household Socio-Economic Survey, National Statistical Office, Ministry of Digital Economy and Society.
Over the five-year period from 2015 to 2019, household spending declined by minus 2.0%. The rate of decline has been increasing each year.
n Household income in Thailand fell by minus 3.3% from 2015 to 2019, while household expenditure decreased by minus 2.0%. Household expenditure has been decreasing year by year, with minus 0.4% (THB 21,346) in 2018, and minus 2.8% (THB 20,742) in 2019.
n Monthly household expenditure in Greater Bangkok was THB 30,778 in 2019, about 50% higher than the national average. The Central Region and Southern Region spent slightly less than the national average, and the Northern Region and Northeastern Region spent about 20% less than the national average.
Tommy

43 Shoppers & Retailing in Thailand 202143
-180
-130
-80
-30
20
70
120
-20% -10% 0% 10%
Mon
thly
Hou
seho
ld E
xpen
ditu
re G
row
th V
alue
, 20
15–2
019
(THB
)
Monthly Household Expenditure Growth Percentage, 2016–2019
CommunicationThailand
Non-ConsumptionExpenditure
Housing/Utilities/Household Equipment
Personal Care/Clothing/Footwear
Food/Beverages/Tobacco
Medical/Healthcare
Vehicle/Transportation
Religious Activities
EducationRecreation/
Entertainment
From 2015 to 2019, only three categories saw increases in spending: Non-Consumption Expenditure, Communication and Housing/Utilities/ Household Equipment.
Monthly Household Expenditure Growth (Value & Percentage), 2015–2019
Source: The 2019 Household Socio-Economic Survey Whole Kingdom, National Statistical Office, Ministry of Digital Economy and Society.

55 Shoppers & Retailing in Thailand 202155
Major Retail Groups and Store Brands in Thailand (Part 1 of 4)
Supermarket Discount Store/Supercenter/Hypermarket Convenience Store
Central Group
Department Store Category Specialist & Others
n The characteristics of the retail market in Thailand are influenced by several key multi-channel retail company groups.
n Among them, Central Group has the largest number of multi-channel operations in nearly all the mixed merchandise channels, many category specialist channels and shopping malls. In 2020, Central Group launched JD CENTRAL, an e-commerce site jointly operated with China’s e-commerce company, Jingdong Group. The following belongs to Central Group: l Supermarkets (Tops Market, Central Food
Hall)l Hypermarkets (Tops Super Store, Tops
Super Koom)l Convenience Stores (Tops Daily, Family
Mart)
Ø Family Mart became wholly owned by Central Retail in May 2020.
l Department stores (Central, Zen, Robinson)Ø The merging of Central and Robinson
was announced in September 2020l Drugstores (Matsumoto Kiyoshi)l DIY household goods (Thaiwatsadu,
homeWork, baan & BEYOND)l Discount Store/Single-Price (Just Buy)l Others (Payless Shoesource, babyshop, etc.)
63 Shoppers & Retailing in Thailand 202163
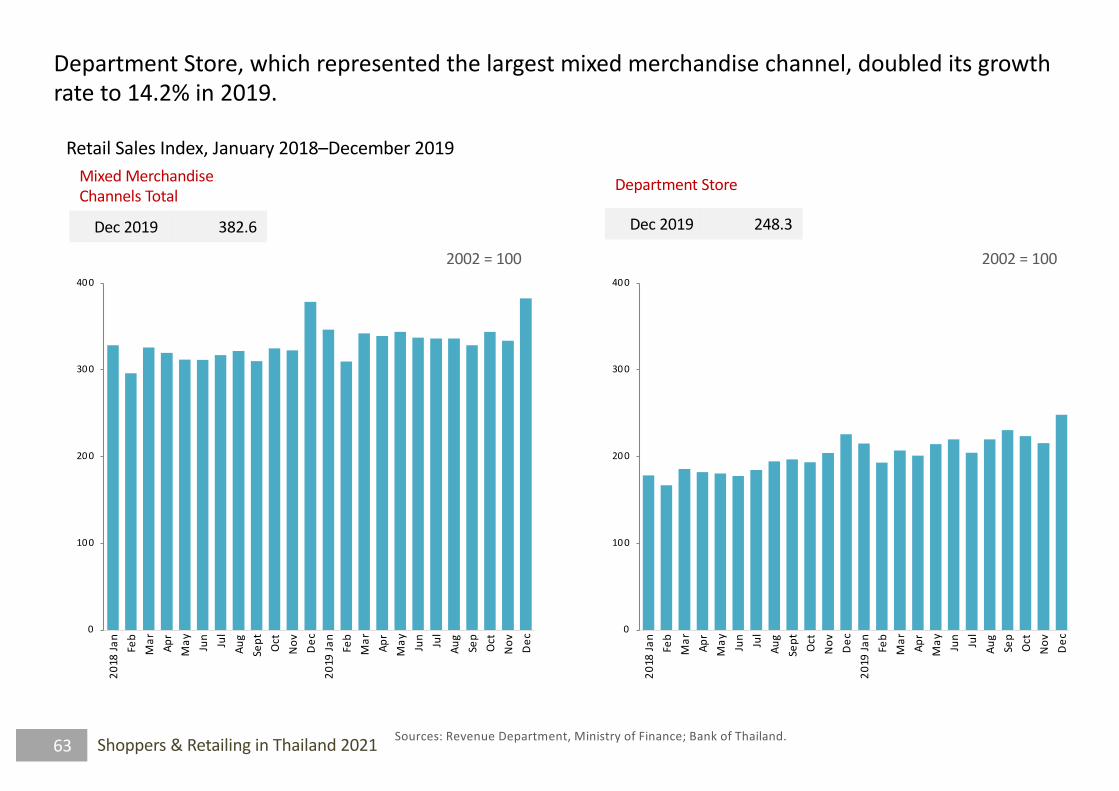
Retail Sales Index, January 2018–December 2019
Sources: Revenue Department, Ministry of Finance; Bank of Thailand.
0
100
200
300
400
2018
Jan
Feb
Mar Ap
rM
ay Jun Jul
Aug
Sept Oc
tNo
vDe
c20
19 Ja
nFe
bM
ar Apr
May Jun Jul
Aug
Sep
Oct
Nov
Dec
2002 = 100
Mixed Merchandise Channels Total
Dec 2019 382.6
0
100
200
300
400
2018
Jan
Feb
Mar Ap
rM
ay Jun Jul
Aug
Sept Oc
tNo
vDe
c20
19 Ja
nFe
bM
ar Apr
May Jun Jul
Aug
Sep
Oct
Nov
Dec
2002 = 100
Department Store
Dec 2019 248.3
Department Store, which represented the largest mixed merchandise channel, doubled its growth rate to 14.2% in 2019.

73 Shoppers & Retailing in Thailand 202173
Major E-Commerce Stores in Thailand and Average Number of Website Visitors, Q4 2020
E-Commerce Store Monthly Traffic
1. Shopee
51,242,700
2. Lazada
38,539,000
3. JD Central
2,203,700
4. Central Online
2,131,500
5. Advice
1,995,000
E-Commerce Store Monthly Traffic
6. Power Buy
1,940,700
7. HomePro
1,656,700
8. JIB
1,332,500
9. Banana Store
1,114,100
10. ShopAt24
1,051,900
Source: https://ipricethailand.com/insights/mapofecommerce/en/ (Q4 2020 updated 9 February 2021).
In terms of web traffic, Shopee and Lazada soared ahead of other e-commerce sites in Thailand in Q4 2020.
n In the last quarter of 2020 (October to December), Shopee was the most accessed Thai online shopping site with an average monthly traffic of 51,242,700 visitors, followed by Lazada with 38,539,000. Central Group’s JD Central, which recently started joint operations with China’s JingdongGroup, was already the third most visited site with an average monthly traffic of 2,203,700.
n The fourth most visited site, Central Online, is the online site of Central Group’s flagship department stores, while seventh-ranked Power Buy is their online store for home appliances.
Tommy