
Shoalhaven City Council
90
Shoalhaven City Council Community Satisfaction Survey 2020 Final Report Prepared for Prepared for Prepared for Prepared for Shoalhaven City Council Prepared by Prepared by Prepared by Prepared by IRIS Research June 2020 June 2020 June 2020 June 2020 IRIS Research IRIS Research IRIS Research IRIS Research ABN 16 002 278 793 POST: Office A, Wing C, Level 1, iC Central, Innovation Campus, University of Wollongong, Wollongong NSW 2522 OFFICES: iC Central, Innovation Campus, North Wollongong NSW 2500 Level 1, Suite F, 110 George St, Parramatta NSW 2150 Net: http://www.iris.org.au Email: [email protected] © IRIS Research, June 2020
Transcript of Shoalhaven City Council

Shoalhaven City Council Community Satisfaction Survey 2020
Final Report
Prepared forPrepared forPrepared forPrepared for
Shoalhaven City Council
Prepared byPrepared byPrepared byPrepared by
IRIS Research
June 2020June 2020June 2020June 2020
IRIS ResearchIRIS ResearchIRIS ResearchIRIS Research ABN 16 002 278 793 POST: Office A, Wing C, Level 1, iC Central, Innovation Campus, University of Wollongong, Wollongong NSW 2522
OFFICES: iC Central, Innovation Campus, North Wollongong NSW 2500
Level 1, Suite F, 110 George St, Parramatta NSW 2150
Net: http://www.iris.org.au Email: [email protected]
© IRIS Research, June 2020

ii
TABLE OF CONTENTS
LIST OF TABLES .......................................................................................................................................................... iii
LIST OF FIGURES......................................................................................................................................................... v
KEY FINDINGS ............................................................................................................................................................. vi
INTRODUCTION .......................................................................................................................................................... vii
SUMMARY OF FINDINGS ......................................................................................................................................... viii
RESEARCH DESIGN ..................................................................................................................................................... 1
1 OVERALL SATISFACTION .................................................................................................................................. 5
1.1 Overall satisfaction with Shoalhaven City Council ........................................................................... 5
1.2 Internal Benchmarks ............................................................................................................................... 6
1.3 Issues influencing overall satisfaction ratings ................................................................................. 7
1.4 Frequency of hearing a negative story or comment about Council ............................................ 8
2 COUNCIL SERVICES & FACILITIES ............................................................................................................... 10
2.1 SUSTAINABLE, LIVEABLE ENVIRONMENTS ...................................................................................... 12
2.2 PROSPEROUS COMMUNITIES ............................................................................................................. 17
2.3 RESPONSIBLE GOVERNANCE .............................................................................................................. 19
2.4 RESILIENT, SAFE AND INCLUSIVE COMMUNITIES .......................................................................... 25
3 PRIORITISING SERVICES & FACILITIES ...................................................................................................... 31
3.1 Quadrant Analysis ................................................................................................................................. 31
3.2 Impact of Council perceptions on satisfaction with services .................................................... 36
4 CUSTOMER SERVICES ................................................................................................................................... 38
4.1 Recent contact with Council .............................................................................................................. 38
4.2 Satisfaction with customer services ................................................................................................ 39
5 COMMUNITY LIVING ........................................................................................................................................ 40
5.1 Support active and healthy communities ....................................................................................... 40
5.2 Walking .................................................................................................................................................... 41
6 COMMUNITY ENGAGEMENT PROJECTS & INITIATIVES ........................................................................... 44
7 COMMUNICATION & ENGAGEMENT ............................................................................................................. 47
7.1 Methods of receiving information ..................................................................................................... 47
7.2 Methods of engaging with Council decision making .................................................................... 51
8 HAPPINESS INDEX .......................................................................................................................................... 54
APPENDIX 1 – SUBGROUP ANALYSIS ................................................................................................................. 57

iii
LIST OF TABLES
Table 1 Summary of Sustainable, Liveable Environments .............................................................................. ix
Table 2 Summary of Prosperous Communities .................................................................................................. x
Table 3 Summary of Responsible Governance .................................................................................................. xi
Table 4 Summary of Resilient, Safe and Inclusive Communities ................................................................. xii
Table 1.1 Overall satisfaction with Shoalhaven City Council – Subgroup Analysis .................................... 5
Table 1.2 Frequency of hearing a negative story or comment – Subgroup Analysis ................................ 8
Table 2.1 Sustainable, liveable environments – Subgroup Analysis .......................................................... 13
Table 2.2 Sustainable, liveable environments – Internal Benchmarks ...................................................... 15
Table 2.3 Sustainable, liveable environments – External Benchmarks ..................................................... 16
Table 2.4 Prosperous communities – Subgroup Analysis............................................................................. 17
Table 2.5 Prosperous communities – Internal Benchmarks ........................................................................ 18
Table 2.6 Prosperous communities – External Benchmarks ....................................................................... 18
Table 2.7 Responsible governance – Subgroup Analysis .............................................................................. 20
Table 2.8 Responsible governance – Internal Benchmarks ......................................................................... 21
Table 2.9 Responsible governance – External Benchmarks ........................................................................ 22
Table 2.10 Frequency of using a Council facility – Significant differences .............................................. 23
Table 2.11 Frequency of using a Council facility – Comparison with 2018 .............................................. 23
Table 2.12 Satisfaction with Council facilities by Facility Usage ................................................................ 24
Table 2.13 Resilient, safe and inclusive communities – Subgroup Analysis ............................................ 26
Table 2.14 Resilient, safe and inclusive communities – Internal Benchmarks ....................................... 27
Table 2.15 Resilient, safe and inclusive communities – External Benchmarks ...................................... 28
Table 2.16 Frequency of attending Shoalhaven events – Significant differences ................................. 29
Table 2.17 Frequency of attending Shoalhaven events – Comparison with 2018 ................................. 29
Table 2.18 Satisfaction with Shoalhaven events by Event Attendance ..................................................... 30
Table 3.1 Quadrant Analysis ................................................................................................................................. 33
Table 3.2 Quadrant Analysis by Service Category ........................................................................................... 35
Table 3.3 Impact of Council perceptions on satisfaction with services .................................................... 36
Table 4.1 Recent contact with Council............................................................................................................... 38
Table 4.2 Recent contact with Council – Subgroup Analysis ....................................................................... 38
Table 4.3 Satisfaction with customer services – Internal Benchmarks .................................................... 39
Table 5.1 Support active and healthy communities – Subgroup Analysis ................................................ 40
Table 5.2 Frequency of walking for recreation, exercise or transport – Subgroup Analysis ................ 41
Table 5.3 Total time spent walking in the last week – Subgroup Analysis ................................................ 42
iv
Table 5.4 Purpose of walks – Subgroup Analysis ............................................................................................ 43
Table 6.1 Awareness of community engagement projects – Subgroup Analysis ................................... 44
Table 6.2 Recalled community engagement projects – Subgroup Analysis ............................................ 45
Table 6.3 Recalled community engagement projects – Comparison with 2018 .................................... 45
Table 6.4 Participation in community engagement projects – Subgroup Analysis ............................... 46
Table 7.1 Likelihood of using methods to receive information – Subgroup Analysis ............................ 48
Table 7.2 Most preferred method of receiving information – Subgroup Analysis .................................. 49
Table 7.3 Most preferred method of receiving information – Further Segmentation ........................... 50
Table 7.4 Likelihood of using methods to engage with Council – Subgroup Analysis ........................... 51
Table 7.5 Most preferred method of engaging with Council – Subgroup Analysis ................................. 52
Table 7.6 Most preferred method of engaging with Council – Further Segmentation .......................... 53
Table 8.1 Happiness Index – Subgroup Analysis ............................................................................................. 54
Table 8.2 Happiness Index – Internal Benchmarks ........................................................................................ 55
Table 8.3 Frequency of speaking to a neighbour – Subgroup Analysis ..................................................... 56
Table 8.4 Frequency of speaking to a neighbour – Comparison with 2018 ............................................. 56

v
LIST OF FIGURES
Figure 1.1 Overall satisfaction with Shoalhaven City Council ......................................................................... 5
Figure 1.2 Overall satisfaction with Shoalhaven City Council – Comparison of Ratings .......................... 6
Figure 1.3 Overall satisfaction with Shoalhaven City Council – Internal Benchmarks ............................. 6
Figure 1.4 Frequency of hearing a negative story or comment about Council .......................................... 8
Figure 1.5 Overall satisfaction by Frequency of hearing a negative story ................................................... 9
Figure 2.1 Sustainable, liveable environments ................................................................................................ 12
Figure 2.2 Prosperous communities .................................................................................................................. 17
Figure 2.3 Responsible governance ................................................................................................................... 19
Figure 2.4 Frequency of using a Council facility .............................................................................................. 23
Figure 2.5 Resilient, safe and inclusive communities .................................................................................... 25
Figure 2.6 Frequency of attending Shoalhaven events ................................................................................. 29
Figure 3.1 Quadrant Analysis – Full View .......................................................................................................... 32
Figure 3.2 Quadrant Analysis ................................................................................................................................ 33
Figure 4.1 Satisfaction with customer services .............................................................................................. 39
Figure 5.1 Support active and healthy communities ..................................................................................... 40
Figure 5.2 Frequency of walking for recreation, exercise or transport ..................................................... 41
Figure 5.3 Total time spent walking in the last week ..................................................................................... 42
Figure 5.4 Purpose of walks .................................................................................................................................. 43
Figure 6.1 Awareness of community engagement projects......................................................................... 44
Figure 6.2 Recalled community engagement projects.................................................................................. 45
Figure 6.3 Participation in community engagement projects ..................................................................... 46
Figure 7.1 Likelihood of using methods to receive information .................................................................. 47
Figure 7.2 Most preferred method of receiving information ........................................................................ 49
Figure 7.3 Likelihood of using methods to engage with Council ................................................................ 51
Figure 7.4 Most preferred method of engaging with Council ...................................................................... 52
Figure 8.1 Happiness Index .................................................................................................................................. 54
Figure 8.2 Frequency of speaking to a neighbour or someone in the street ........................................... 56

vi
KEY FINDINGS
Shoalhaven CityShoalhaven CityShoalhaven CityShoalhaven City Council’sCouncil’sCouncil’sCouncil’s overall overall overall overall pppperformanceerformanceerformanceerformance
� FortyFortyFortyForty----four percent (44%)four percent (44%)four percent (44%)four percent (44%) of residents are satisfied overall with the performance of Council
as an organisation over the past 12 months.
� The average satisfaction rating is 3.343.343.343.34 out of 5. This is a medium-level satisfaction score
and is statistically in-line with the result from 2018 (3.30).
� Five of 42 services recorded statistically significant improvements in average satisfaction
since 2018, including elected Council decision makingelected Council decision makingelected Council decision makingelected Council decision making.
� Three services recorded declines in average satisfaction.
Key Key Key Key StrengthStrengthStrengthStrengthssss, , , , Improvements and Community Priorities for CouncilImprovements and Community Priorities for CouncilImprovements and Community Priorities for CouncilImprovements and Community Priorities for Council
� Council’s strengths lie in the Resilient, safe and inclusive communitiesResilient, safe and inclusive communitiesResilient, safe and inclusive communitiesResilient, safe and inclusive communities category and
include services such as library serviceslibrary serviceslibrary serviceslibrary services, operation of sewerage and quality water serviceoperation of sewerage and quality water serviceoperation of sewerage and quality water serviceoperation of sewerage and quality water service
and solid waste and recyclingsolid waste and recyclingsolid waste and recyclingsolid waste and recycling collection collection collection collection –––– wheelie bin servicewheelie bin servicewheelie bin servicewheelie bin service.
� Services related to roadsroadsroadsroads, planningplanningplanningplanning, and developmentdevelopmentdevelopmentdevelopment are generally lower performing.
� Higher frequency of hearing a negative story or comment about Council correlates with
lower satisfaction with Council overall as well as lower satisfaction with Council’s service
provision.
� Improvement in the appearance of CBD’s (major town centresappearance of CBD’s (major town centresappearance of CBD’s (major town centresappearance of CBD’s (major town centres)))) and Council’s actions are Council’s actions are Council’s actions are Council’s actions are
inininin----line with community expectationsline with community expectationsline with community expectationsline with community expectations will be have the biggest impact on increasing
Council’s overall satisfaction score.
� Residents are highly satisfied with Council’s disaster response in the Shoalhavendisaster response in the Shoalhavendisaster response in the Shoalhavendisaster response in the Shoalhaven ((((3.9).
Average satisfaction with this service has declined since 2018 (4.2). Considering the
natural disasters faced in the region since the previous survey period, this is a strong result
for Council. Furthermore, all attributes of personal wellbeing are in-line or improved since
2018.
vii
INTRODUCTION
IRIS Research was commissioned by Shoalhaven City Council to conduct a Community Satisfaction
Survey in 2020 which tracks Council’s performance in service delivery, identifies priority areas and
evaluates Council’s customer services, communication and community engagement.
The objectives for the Community Satisfaction Survey process were to:
1. Measure and track the performance of Council in delivering services and facilities.
2. Uncover Council’s areas of improvement and priorities for the near future.
3. Understand community perceptions regarding Council’s customer services, communications
and community engagement.
4. Understand community perceptions regarding liveability and personal wellbeing.
This project was carried out in compliance with This project was carried out in compliance with This project was carried out in compliance with This project was carried out in compliance with
ISO 20252 ISO 20252 ISO 20252 ISO 20252 –––– Market and SocMarket and SocMarket and SocMarket and Social Research Management.ial Research Management.ial Research Management.ial Research Management.
Certification MSR 701303Certification MSR 701303Certification MSR 701303Certification MSR 701303

viii
SUMMARY OF FINDINGS
The Community Satisfaction Survey 2020 collected 401 completed responses from residents of the
Shoalhaven City Council area aged 18 years and over.
Overall sOverall sOverall sOverall satisfactionatisfactionatisfactionatisfaction with with with with Shoalhaven CityShoalhaven CityShoalhaven CityShoalhaven City Council Council Council Council
Overall satisfaction with the performance of Council as an organisation over the past 12
months is 3.33.33.33.34444 out of 5.
This result is statistically in-line with 2018 (3.30).
FortyFortyFortyForty----four percentfour percentfour percentfour percent ((((44444444%) %) %) %) of residents are satisfiedof residents are satisfiedof residents are satisfiedof residents are satisfied with the performance of Council while
15 percent are dissatisfied.
Residents aged 65 plus years are more satisfied compared to residents aged 50 to 64 years.
On average, residents hear a negative story or comment about Council 6.5 times a month.
Higher frequency of hearing a negative story or comment about Council correlates with lower
average overall satisfaction (see Section 1.4).
Performance of Key Service AreasPerformance of Key Service AreasPerformance of Key Service AreasPerformance of Key Service Areas
Respondents were asked to rate their satisfaction with 42 Council services and facilities across four
service areas using a five-point scale where 1 meant ‘very dissatisfied’ and 5 meant ‘very satisfied’.
The summary tables for Council services and facilities contain several measures:
SatisfiedSatisfiedSatisfiedSatisfied refers to the proportion of residents who provided a satisfaction rating of 4 or 5.
AverageAverageAverageAverage refers to the average satisfaction rating for that service (out of 5).
Internal BenchmarkInternal BenchmarkInternal BenchmarkInternal Benchmark refers to whether there was a statistically significant change in average
satisfaction since 2018.
External External External External BenchmarkBenchmarkBenchmarkBenchmark refers to how Council is performing against an amalgamation of councils
with similar characteristics to Shoalhaven City Council. Not all services were able to be
benchmarked.
Strategic LocationStrategic LocationStrategic LocationStrategic Location refers to the location in the performance / importance quadrant (see
Section 3.1).

ix
Sustainable, liveable environmentsSustainable, liveable environmentsSustainable, liveable environmentsSustainable, liveable environments
There have been statistically significant increases in average satisfaction with the provision of car provision of car provision of car provision of car
parksparksparksparks and provision of cyclewaysprovision of cyclewaysprovision of cyclewaysprovision of cycleways. There have been significant declines in sustainablesustainablesustainablesustainable
management of Shoalhaven’s natural environmentmanagement of Shoalhaven’s natural environmentmanagement of Shoalhaven’s natural environmentmanagement of Shoalhaven’s natural environment and sustainable management of lakes and sustainable management of lakes and sustainable management of lakes and sustainable management of lakes and
estuariesestuariesestuariesestuaries.
Appearance of towns and villagesAppearance of towns and villagesAppearance of towns and villagesAppearance of towns and villages is a Strategic Advantage, meaning it is performing above
average relative to Council’s wider service provision and it has an important impact on creating
overall satisfaction with Council.
Reasons for dissatisfaction with local roads centred on the quality of the roads in the area (e.g.
potholes), as well as the quality of the maintenance carried out by Council (e.g. impermanent
‘patchwork’ maintenance).
Table Table Table Table 1111 Summary of Summary of Summary of Summary of Sustainable, Sustainable, Sustainable, Sustainable, LLLLiveable iveable iveable iveable EEEEnvironmentsnvironmentsnvironmentsnvironments
Sustainable, liveable environmentsSustainable, liveable environmentsSustainable, liveable environmentsSustainable, liveable environments SatisfiedSatisfiedSatisfiedSatisfied AverageAverageAverageAverage Internal Internal Internal Internal
BenchmarkBenchmarkBenchmarkBenchmark
External External External External
BenchmarkBenchmarkBenchmarkBenchmark
Strategic Strategic Strategic Strategic
LocationLocationLocationLocation
Maintenance of beaches and dunes 57% 3.6 - Differentiator
Appearance of towns and villages 51% 3.5 - Strategic
Advantage
Management of stormwater and
drainage 45% 3.4 -
Key
Vulnerability
Provision of car parks 45% 3.3 Potential
Vulnerability
Management of street trees 42% 3.2 - Potential
Vulnerability
Sustainable management of
Shoalhaven's natural environment 40% 3.2 -
Potential
Vulnerability
Making the most of our waterfronts 44% 3.1 - Potential
Vulnerability
Provision of footpaths 40% 3.1 Potential
Vulnerability
Sustainable management of lakes and
estuaries 34% 3.1 -
Potential
Vulnerability
Environmental protection and
enforcement 31% 3.1 -
Potential
Vulnerability
Provision of cycleways 30% 3.0 Potential
Vulnerability
Compliance and enforcement of
development 21% 3.0 -
Potential
Vulnerability
Strategic land use and town planning
for Shoalhaven 21% 2.8 -
Key
Vulnerability
Maintenance of unsealed local roads 18% 2.7 Potential
Vulnerability
Efficient processing of development
applications 12% 2.6
Potential
Vulnerability
Maintenance of sealed local roads 23% 2.5 Potential
Vulnerability

x
Prosperous communitiesProsperous communitiesProsperous communitiesProsperous communities
All services within this category are performing in-line with 2018.
Most residents (62%) are satisfied with Council’s promotion of tourismpromotion of tourismpromotion of tourismpromotion of tourism. This service is a Strategic
Advantage as satisfaction is above average and this service has an above-average impact on
overall satisfaction with Council.
Appearance of CBD’s (major town centres) Appearance of CBD’s (major town centres) Appearance of CBD’s (major town centres) Appearance of CBD’s (major town centres) and promoting economic development (i.e. jobs promoting economic development (i.e. jobs promoting economic development (i.e. jobs promoting economic development (i.e. jobs
growth)growth)growth)growth) are important services that are performing below average and thus are categorised as Key
Vulnerabilities. Furthermore, both services are underperforming relative to councils with
comparable characteristics to Shoalhaven City Council.
Table Table Table Table 2222 Summary of Summary of Summary of Summary of Prosperous Prosperous Prosperous Prosperous CCCCommunities ommunities ommunities ommunities
Prosperous communitiesProsperous communitiesProsperous communitiesProsperous communities SatisfiedSatisfiedSatisfiedSatisfied AverageAverageAverageAverage Internal Internal Internal Internal
BenchmarkBenchmarkBenchmarkBenchmark
External External External External
BenchmarkBenchmarkBenchmarkBenchmark
Strategic Strategic Strategic Strategic
LocationLocationLocationLocation
Promotion of tourism 62% 3.7 Strategic
Advantage
Appearance of CBD's (major town
centres) 38% 3.1
Key
Vulnerability
Promoting economic development (i.e.
jobs growth) 23% 2.9
Key
Vulnerability

xi
Responsible governance Responsible governance Responsible governance Responsible governance
Average satisfaction with swimming poolsswimming poolsswimming poolsswimming pools and elected Council decision makingelected Council decision makingelected Council decision makingelected Council decision making have recorded
statistically significant increases in average satisfaction since 2018. All other services within this
category are performing in-line with 2018.
Swimming poolsSwimming poolsSwimming poolsSwimming pools and public toiletspublic toiletspublic toiletspublic toilets are outperforming an average of councils with comparable
characteristics to Council.
Despite improving in satisfaction since 2018, elected Council decision makingelected Council decision makingelected Council decision makingelected Council decision making is underperforming
relative to similar councils. IIIInforming the community of Council decisions, activities and nforming the community of Council decisions, activities and nforming the community of Council decisions, activities and nforming the community of Council decisions, activities and
servicesservicesservicesservices is also underperforming.
Table Table Table Table 3333 Summary of Summary of Summary of Summary of Responsible Responsible Responsible Responsible GGGGovernanceovernanceovernanceovernance
Responsible governanceResponsible governanceResponsible governanceResponsible governance SatisfiedSatisfiedSatisfiedSatisfied AverageAverageAverageAverage Internal Internal Internal Internal
BenchmarkBenchmarkBenchmarkBenchmark
External External External External
BenchmarkBenchmarkBenchmarkBenchmark
Strategic Strategic Strategic Strategic
LocationLocationLocationLocation
Shoalhaven Entertainment Centre 62% 4.1 - Differentiator
Swimming pools 61% 4.1 Differentiator
Cemeteries 40% 3.9 - Differentiator
Sporting fields 65% 3.9 Differentiator
Community buildings and halls 53% 3.7 Differentiator
Parks, playgrounds and reserves 63% 3.7 Differentiator
Council's customer service 57% 3.6 - Strategic
Advantage
Public toilets 37% 3.2 Potential
Vulnerability
Informing the community of Council
decisions, activities and services 31% 3.1
Key
Vulnerability
Opportunities to participate in Council
decision making processes 23% 2.9 -
Potential
Vulnerability
Elected Council decision making 15% 2.8 Potential
Vulnerability
Council's actions are in-line with
community expectations 19% 2.8 -
Key
Vulnerability

xii
Resilient, safe and inclusive communities Resilient, safe and inclusive communities Resilient, safe and inclusive communities Resilient, safe and inclusive communities
This is Council’s best performing category of services. Three services including library serviceslibrary serviceslibrary serviceslibrary services,
operation of sewerage and quality water serviceoperation of sewerage and quality water serviceoperation of sewerage and quality water serviceoperation of sewerage and quality water service and hygiene standards of retail food marketshygiene standards of retail food marketshygiene standards of retail food marketshygiene standards of retail food markets
are outperforming an average of councils with comparable characteristics to Shoalhaven City
Council.
Six of the eleven services within this category are Strategic Advantages. These services are
performing above average and have an important impact on creating overall satisfaction with
Council.
Disaster response in the Shoalhaven Disaster response in the Shoalhaven Disaster response in the Shoalhaven Disaster response in the Shoalhaven has recorded a statistically significant decline since 2018.
Open-ended responses cited the level of communication during the bushfires as the primary
reason for dissatisfaction. However, this service recorded a high average satisfaction rating (above
3.75) and is a Strategic Advantage. This decline should be properly contextualised given the natural
disasters faced in the region since the 2018 survey.
Table Table Table Table 4444 Summary of Summary of Summary of Summary of ResResResResilient, ilient, ilient, ilient, SSSSafe and afe and afe and afe and IIIInclusive nclusive nclusive nclusive CCCCommunities ommunities ommunities ommunities
Resilient, safe and inclusive Resilient, safe and inclusive Resilient, safe and inclusive Resilient, safe and inclusive
communitiescommunitiescommunitiescommunities SatisfiedSatisfiedSatisfiedSatisfied AverageAverageAverageAverage
Internal Internal Internal Internal
BenchmarkBenchmarkBenchmarkBenchmark
External External External External
BenchmarkBenchmarkBenchmarkBenchmark
Strategic Strategic Strategic Strategic
LocationLocationLocationLocation
Library services 66% 4.3 Differentiator
Operation of sewerage and quality
water service 76% 4.2
Strategic
Advantage
Solid waste and recycling collection -
wheelie bin service 74% 4.1 - Differentiator
Hygiene standards of retail food
markets 79% 4.1 Differentiator
Shoalhaven Regional Gallery Nowra 33% 4.0 - Differentiator
Disaster response in the Shoalhaven 66% 3.9 - Strategic
Advantage
Companion animal (dogs)
management 49% 3.7 -
Strategic
Advantage
Landfill and resource recovery services
- waste depots 60% 3.7 -
Strategic
Advantage
Types of events in the Shoalhaven 56% 3.6 - Strategic
Advantage
Council's support of events in the
Shoalhaven 48% 3.5 -
Strategic
Advantage
Facilities and services for the disabled 35% 3.5 Differentiator

xiii
Customer ServicesCustomer ServicesCustomer ServicesCustomer Services
In total, 21 percent of residents have contacted Council in the past month, with 13 percent
contacting Council in the past week.
This result has declined 5% pts since 2018 (26%).
Both aspects of customer service including timeliness of the responsetimeliness of the responsetimeliness of the responsetimeliness of the response and ooooverall verall verall verall
performance of Council in dealing with their requestperformance of Council in dealing with their requestperformance of Council in dealing with their requestperformance of Council in dealing with their request recorded medium levels of satisfaction.
However, average satisfaction with both aspects have recorded statistically significant declines
since 2018.
Community LivingCommunity LivingCommunity LivingCommunity Living
Eighty-one percent (81%) of residents agree Shoalhaven is a liveable cityShoalhaven is a liveable cityShoalhaven is a liveable cityShoalhaven is a liveable city.
Forty-eight percent (48%) of residents agree Shoalhaven is a vibrant cityShoalhaven is a vibrant cityShoalhaven is a vibrant cityShoalhaven is a vibrant city.
In total, 83 percent of residents had walked continuously for at least ten minutes for recreation,
exercise or transport in the week prior to being surveyed.
Forty percent (40%) walked more than five times.
On average, residents spent 1.5 hours1.5 hours1.5 hours1.5 hours walking during the week.
The main reason for walking was exerciseexerciseexerciseexercise (80%). Other reasons include walking to shopswalking to shopswalking to shopswalking to shops
(24%), walking to the workplacewalking to the workplacewalking to the workplacewalking to the workplace (11%) and walking the dogwalking the dogwalking the dogwalking the dog (9%).
Community Engagement Projects & Initiatives Community Engagement Projects & Initiatives Community Engagement Projects & Initiatives Community Engagement Projects & Initiatives
Thirty-four percent (34%) of residents are aware of Council-run projects or initiatives in the
Shoalhaven conducted over the last 12 months.
This result has declined 4% pts since 2018 (38%).
Projects and initiatives recalled by these residents include the Delivery Program and Delivery Program and Delivery Program and Delivery Program and
Operational Plan (DOperational Plan (DOperational Plan (DOperational Plan (DPOP)POP)POP)POP) as well as environmental initiatives and bushfire recovery programs.
Twenty-six percent (26%) of the residents aware of Council-run projects have participated in
them. This result is in-line with 2018 (25%).

xiv
Communication & Engagement Communication & Engagement Communication & Engagement Communication & Engagement
To receive information and communication from Council, the methods residents are most likelymost likelymost likelymost likely
to use are:
1.1.1.1. Direct mail Direct mail Direct mail Direct mail (3.4)(3.4)(3.4)(3.4)
2.2.2.2. Email (including Newsletters) Email (including Newsletters) Email (including Newsletters) Email (including Newsletters) (3.2)(3.2)(3.2)(3.2)
3.3.3.3. Radio (Radio (Radio (Radio (3.1)3.1)3.1)3.1)
The most preferredmost preferredmost preferredmost preferred methods of receiving information and communication from Council are:
1.1.1.1. Email (including Newsletter) (32%)Email (including Newsletter) (32%)Email (including Newsletter) (32%)Email (including Newsletter) (32%)
2.2.2.2. Direct mail (26%)Direct mail (26%)Direct mail (26%)Direct mail (26%)
3.3.3.3. Social Media (e.g. Facebook, Twitter, LinkedIn) (14%)Social Media (e.g. Facebook, Twitter, LinkedIn) (14%)Social Media (e.g. Facebook, Twitter, LinkedIn) (14%)Social Media (e.g. Facebook, Twitter, LinkedIn) (14%)
To engage with and ‘have their say’ on Council decision making, the methods residents are
most likelymost likelymost likelymost likely to use are:
1.1.1.1. Speak with a Customer Speak with a Customer Speak with a Customer Speak with a Customer Service person (3.3)Service person (3.3)Service person (3.3)Service person (3.3)
2.2.2.2. Email (3.2)Email (3.2)Email (3.2)Email (3.2)
3.3.3.3. Online surveys (3.0)Online surveys (3.0)Online surveys (3.0)Online surveys (3.0)
The most preferredmost preferredmost preferredmost preferred methods of engaging with Council are:
1.1.1.1. Email (32%)Email (32%)Email (32%)Email (32%)
2.2.2.2. Speak with a Customer Service person (18%)Speak with a Customer Service person (18%)Speak with a Customer Service person (18%)Speak with a Customer Service person (18%)
3.3.3.3. Direct mail (17%)Direct mail (17%)Direct mail (17%)Direct mail (17%)
Happiness IndexHappiness IndexHappiness IndexHappiness Index
The Personal Wellbeing IndexPersonal Wellbeing IndexPersonal Wellbeing IndexPersonal Wellbeing Index of Shoalhaven residents is 84.684.684.684.6.
The index has increased since 2018 (83.1) and is higher than the national standard (75.7).
All aspects of personal wellbeing recorded high average satisfaction ratings.
Residents are most satisfied with their personal relationshipspersonal relationshipspersonal relationshipspersonal relationships (4.4).
Satisfaction with feeling part of your communityfeeling part of your communityfeeling part of your communityfeeling part of your community has recorded a statistically significant
increase in average satisfaction since 2018.
Eighty-four percent (84%) of residents speak to a neighbour or someone in their street weekly.

1
RESEARCH DESIGN
The Shoalhaven City Council Community Satisfaction Survey 2020 aimed to collect 400 completed
responses from a random sample of residents in the Shoalhaven City Council local government
area. The reported results have a margin of error of ±4.9 percent at the 95 percent confidence level.
This means that if we repeated the survey 100 times, in 95 times the results will be within 4.9
percent of the true population value.
Computer-Aided Telephone Interviews
A A A A telephone basedtelephone basedtelephone basedtelephone based (CATI) survey was used to secure a response from (CATI) survey was used to secure a response from (CATI) survey was used to secure a response from (CATI) survey was used to secure a response from 404040401111 residents throughout residents throughout residents throughout residents throughout
the local government areathe local government areathe local government areathe local government area. 111 responses were collected from mobile phones (28 percent of the
total telephone interviews). The survey unit was residents of the Shoalhaven City Council local
government area. In order to qualify for an interview, respondents had to be permanent residents
aged 18 years or older that have lived in the area for longer than six months. The 2016 Census was
used to establish quotas to ensure a good distribution of responses by age and gender.
Interviews were conducted between 1 June and 10 June 2020. Calls were made between 4.30pm
and 8.30pm during weekdays. Seventeen interviewers conducted interviews over the course of the
data collection period. The survey was implemented under Interviewer Quality Control Australia
(IQCA) quality guidelines. Continuous interviewer monitoring was used, and post-interview
validations were conducted within five days of the close of the survey. Ten percent (10%) of all
respondents were contacted after data collection was complete in order to verify and validate their
data.
Table Table Table Table 5555 Final Final Final Final Telephony Telephony Telephony Telephony SampleSampleSampleSample
TelephonyTelephonyTelephonyTelephony ####
Landlines 290
Mobiles 111
TotalTotalTotalTotal 401401401401

2
Online Survey
A version of the survey was made available online for all residents to complete. The survey was
available from 1 June to 15 June 2020 and 252525256666 completed responses were collected.completed responses were collected.completed responses were collected.completed responses were collected. Online
responses have been provided to Council in a separate report.
Survey Weighting
The collected data often cannot mirror the exact age/sex distribution of a region. To allow for this,
the collected data set is weighted to bring it back to the ideal age/sex distribution.
Table 6 reports the weighting factors for the sample. Using a high number of mobile phone
numbers resulted in better access to young respondents.
Table Table Table Table 6666 Data Weighting Factors Data Weighting Factors Data Weighting Factors Data Weighting Factors –––– Age/Sex Age/Sex Age/Sex Age/Sex
PopulationPopulationPopulationPopulation IdealIdealIdealIdeal ActualActualActualActual WeightsWeightsWeightsWeights
AgeAgeAgeAge MaleMaleMaleMale FemaleFemaleFemaleFemale MaleMaleMaleMale FemaleFemaleFemaleFemale MaleMaleMaleMale FemaleFemaleFemaleFemale MaleMaleMaleMale FemaleFemaleFemaleFemale
18 to 34 8,176 7,718 41 39 15 11 2.73 3.52
35 to 49 7,754 8,127 39 41 31 51 1.25 0.80
50 to 64 10,574 11,295 53 56 32 45 1.66 1.26
65 plus 12,684 13,658 63 68 92 124 0.69 0.55
TotalTotalTotalTotal 39,18839,18839,18839,188 40,79840,79840,79840,798 196196196196 204204204204 170170170170 231231231231

3
Sample Profile
In order to obtain a clear view of the sample’s profile and to conduct comparison tests,
demographic characteristics including gender, age and property ownership were collected. Table 7
details the weighted sample profile for this survey.
Table Table Table Table 7777 Sample ProfileSample ProfileSample ProfileSample Profile
GenderGenderGenderGender % # Property OwnershipProperty OwnershipProperty OwnershipProperty Ownership % #
Male 49% 196 Owns property in Shoalhaven 11% 43
Female 51% 205 Does not own property 13% 53
AgeAgeAgeAge % #
18 to 34 years 20% 80
35 to 49 years 20% 80
50 to 64 years 27% 110
65 plus years 33% 132
Base: All respondents (n=401)

4
Table 8 Table 8 Table 8 Table 8 Suburb/AreaSuburb/AreaSuburb/AreaSuburb/Area
Suburb/AreaSuburb/AreaSuburb/AreaSuburb/Area nnnn Suburb/AreaSuburb/AreaSuburb/AreaSuburb/Area nnnn Suburb/AreaSuburb/AreaSuburb/AreaSuburb/Area nnnn
Bangalee 3 Greenwell Point 5 Old Erowal Bay 2
Basin View 4 Huskisson 3 Orient Point 1
Bayswood 1 Hyams Beach 3 Pyree 1
Bellawongarah 1 Jaspers Brush 2 Sanctuary Point 24
Berrara 3 Jervis Bay 1 Shoalhaven Heads 8
Berry 14 Kangaroo Valley 3 South Nowra 7
Bolong 1 Kings Point 3 St Georges Basin 11
Bomaderry 31 Kioloa 4 Sussex Inlet 17
Broughton 1 Lake Conjola 3 Tapitallee 4
Burrill Lake 7 Lake Tabourie 1 Terara 1
Callala Bay 15 Little Forest 1 Tomerong 6
Cambewarra 3 Longreach 1 Ulladulla 31
Conjola Park 3 Manyana 3 Vincentia 8
Coolangatta 2 Milton 11 Wandandian 2
Cudmirrah 1 Mollymook 18 West Nowra 3
Culburra Beach 13 Morton 1 Woodhill 1
Currarong 4 Narrawallee 8 Woollamia 4
East Nowra 2 North Nowra 22 Worrigee 16
Erowal Bay 2 Nowra 41 Worrowing Heights 2
Falls Creek 4 Nowra Hill 2 Yatte Yattah 1
Base: All respondents (n=401)
Subgroups
Comparison tests are used to test whether there are statistically significant differences in survey
results based on the demographic profile of respondents. Appendix 1 (pp. 57-76) contains full
subgroup analysis for all questionsfor all questionsfor all questionsfor all questions contained in the Community Satisfaction Survey 2020.
5
1 OVERALL SATISFACTION
This section of the report covers overall satisfaction with Shoalhaven City Council as an
organisation over the past 12 months. It includes subgroup analysis, comparisons with previous
results (internal benchmarks) and comparisons with Council with similar characteristics to
Shoalhaven City Council (external benchmarks).
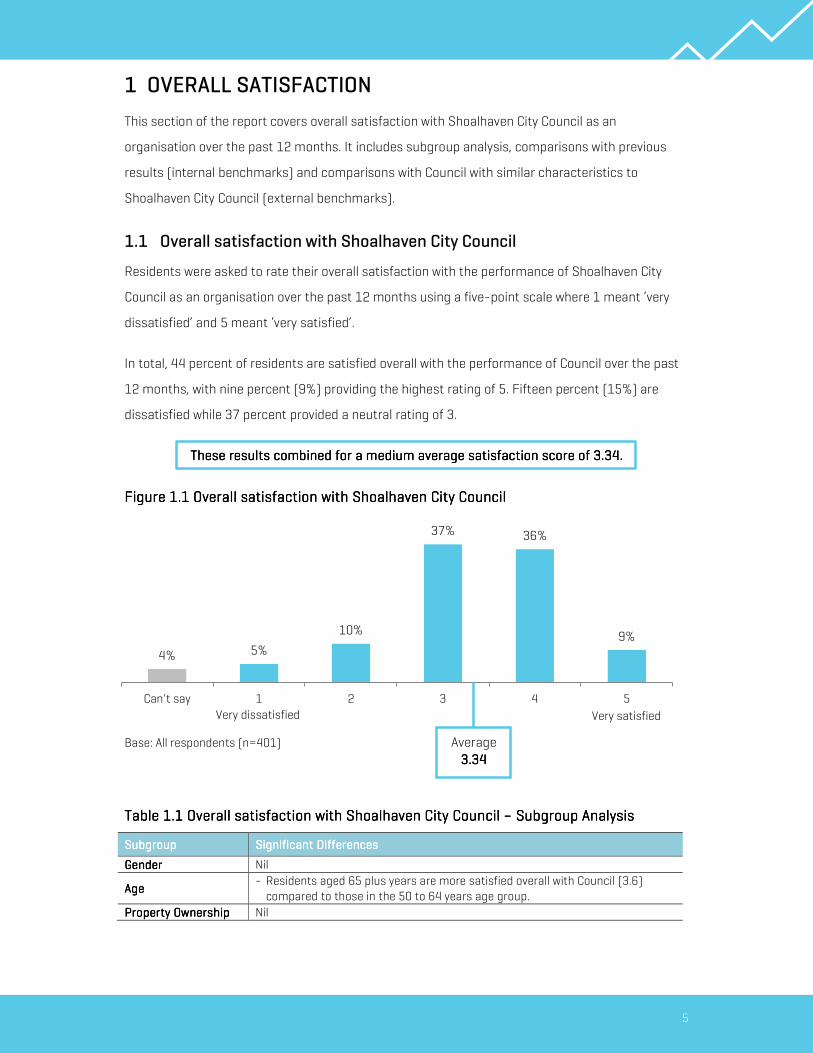
1.1 Overall satisfaction with Shoalhaven City Council
Residents were asked to rate their overall satisfaction with the performance of Shoalhaven City
Council as an organisation over the past 12 months using a five-point scale where 1 meant ‘very
dissatisfied’ and 5 meant ‘very satisfied’.
In total, 44 percent of residents are satisfied overall with the performance of Council over the past
12 months, with nine percent (9%) providing the highest rating of 5. Fifteen percent (15%) are
dissatisfied while 37 percent provided a neutral rating of 3.
These These These These results combined for a medium average satisfaction score of 3.results combined for a medium average satisfaction score of 3.results combined for a medium average satisfaction score of 3.results combined for a medium average satisfaction score of 3.33334444....
Figure Figure Figure Figure 1111....1111 Overall satisfaction with Overall satisfaction with Overall satisfaction with Overall satisfaction with Shoalhaven CityShoalhaven CityShoalhaven CityShoalhaven City CouncilCouncilCouncilCouncil
Base: All respondents (n=401)
Table Table Table Table 1111....1111 Overall satisfaction with Overall satisfaction with Overall satisfaction with Overall satisfaction with Shoalhaven City Shoalhaven City Shoalhaven City Shoalhaven City CouncilCouncilCouncilCouncil –––– Subgroup AnalysisSubgroup AnalysisSubgroup AnalysisSubgroup Analysis
SubgroupSubgroupSubgroupSubgroup Significant DifferencesSignificant DifferencesSignificant DifferencesSignificant Differences
GenderGenderGenderGender Nil
AgeAgeAgeAge - Residents aged 65 plus years are more satisfied overall with Council (3.6)
compared to those in the 50 to 64 years age group.
Property OwnershipProperty OwnershipProperty OwnershipProperty Ownership Nil
4% 5%
10%
37% 36%
9%
Can't say 1 2 3 4 5
Average
3.343.343.343.34
Very dissatisfied Very satisfied

6
1.2 Internal Benchmarks
Figure 1.2 compares the breakdown of satisfaction ratings with previous results from 2018. There
has been an increase of two percent (2%) in the proportion of satisfied residents (rating of 4 or 5).
Figure Figure Figure Figure 1111....2222 Overall satisfaction with Overall satisfaction with Overall satisfaction with Overall satisfaction with Shoalhaven CityShoalhaven CityShoalhaven CityShoalhaven City Council Council Council Council –––– Comparison of Comparison of Comparison of Comparison of RRRRatingsatingsatingsatings
Figure 1.3 compares average overall satisfaction with previous results. Average overall satisfaction
is in-line with 2018. There has been no statistically significant change in average overall
satisfaction since 2018.
Figure Figure Figure Figure 1111....3333 Overall satisfaction with Overall satisfaction with Overall satisfaction with Overall satisfaction with Shoalhaven CityShoalhaven CityShoalhaven CityShoalhaven City CouncilCouncilCouncilCouncil –––– Internal Benchmarks Internal Benchmarks Internal Benchmarks Internal Benchmarks
7%16%
34%42%
4%15%
37%44%
Can't say Dissatisfied (1-2) Neutral (3) Satisfied (4-5)
2018 2020
3.30 3.41 3.43 3.40 3.30 3.34
1
2
3
4
5
2014 2015 2016 2017 2018 2020

7
1.3 Issues influencing overall satisfaction ratings
Residents were asked whether there was a particular issue that strongly influence their view in a
positive or negative way. Residents that stated their rating was influenced by a particular issue
were asked to describe that issue. This was an open-ended response. A full list of open-ended
responses has been provided to Council in a separate report.
Positive issues (n=Positive issues (n=Positive issues (n=Positive issues (n=54545454))))
Respondents that stated their issue was positive were generally complimentary of Shoalhaven City
Council as an organisation. In particular, residents indicated the handling of the bushfire and flood
emergencies are positives.
Negative issuesNegative issuesNegative issuesNegative issues (n=(n=(n=(n=109109109109))))
109 residents that stated their overall satisfaction rating was negatively impacted by a particular
issue described a range of issues in their open-ended responses. These responses generally cited
specific issues related to service provision or issues with Shoalhaven City Council as an
organisation.
Issues relating to service provision included road maintenance, waste management (e.g. green
waste), land management and urban development. Issues relating to Council as an organisation
covered decision making, level of communication and its response to the bushfires and COVID-19
pandemic.

8
1.4 Frequency of hearing a negative story or comment about Council
Residents were asked how frequently they hear a negative story or comment about Council.
Twenty-seven percent (27%) of residents hear a negative story or comment monthlymonthlymonthlymonthly.
Twenty-one percent (21%) hear a negative story weeklyweeklyweeklyweekly while eight percent (8%) hear a negative
story dailydailydailydaily.
Sixteen percent (16%) of residents indicated they nevernevernevernever hear a negative story or comment about
Council.
On average, residents of Shoalhaven hear a negative story or comment about Council 6.5 times a 6.5 times a 6.5 times a 6.5 times a
month. month. month. month.
Figure Figure Figure Figure 1111....4444 Frequency of hearing a negative story or comment about CouncilFrequency of hearing a negative story or comment about CouncilFrequency of hearing a negative story or comment about CouncilFrequency of hearing a negative story or comment about Council
All respondents (n=401)
Table Table Table Table 1111....2222 Frequency of hearing a negative story or commentFrequency of hearing a negative story or commentFrequency of hearing a negative story or commentFrequency of hearing a negative story or comment –––– Subgroup Analysis Subgroup Analysis Subgroup Analysis Subgroup Analysis
SubgroupSubgroupSubgroupSubgroup Significant DifferencesSignificant DifferencesSignificant DifferencesSignificant Differences
GenderGenderGenderGender - A significantly higher proportion of female residents hear a negative story or
comment monthlymonthlymonthlymonthly.
AgeAgeAgeAge
- Residents aged 35 to 49 years and 65 plus years are more likely to hear a
negative story weeklyweeklyweeklyweekly compared to those aged 18 to 34 years.
- Residents aged 50 to 64 years are more likely to hear a negative story monthlymonthlymonthlymonthly
compared to those aged 65 plus years.
- Residents aged 18 to 34 years and 65 plus years nevernevernevernever hear a negative story or
comment compared to those aged 50 to 64 years.
Property OwnershipProperty OwnershipProperty OwnershipProperty Ownership
- A significantly higher proportion of property owners hear a negative story or
comment at least once a yearat least once a yearat least once a yearat least once a year.
- A significantly higher proportion of residents that do not own property nevernevernevernever
hear a negative story or comment.
8%
21%
27%
19%
16%
8%
Daily
Weekly
Monthly
Yearly
Never
I don't know
Monthly AverageMonthly AverageMonthly AverageMonthly Average
6.56.56.56.5
9
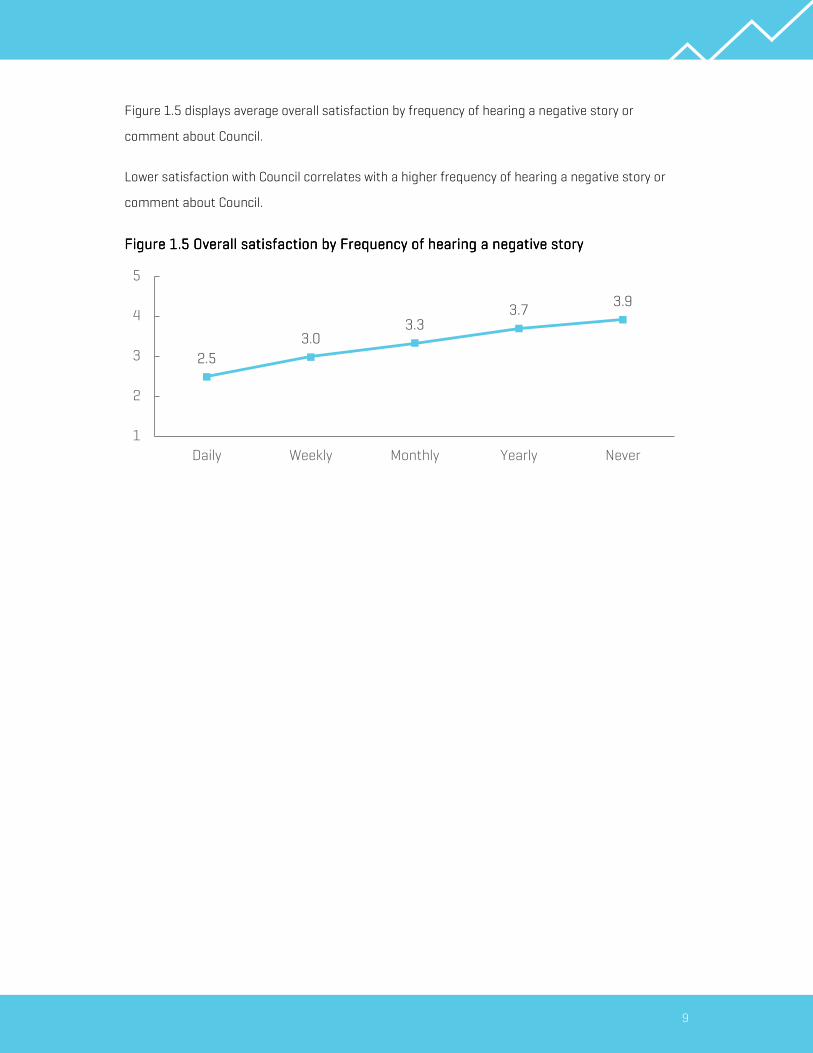
Figure 1.5 displays average overall satisfaction by frequency of hearing a negative story or
comment about Council.
Lower satisfaction with Council correlates with a higher frequency of hearing a negative story or
comment about Council.
Figure Figure Figure Figure 1111....5555 Overall satisfaction by Frequency of hearing a negative storyOverall satisfaction by Frequency of hearing a negative storyOverall satisfaction by Frequency of hearing a negative storyOverall satisfaction by Frequency of hearing a negative story
2.5
3.03.3
3.73.9
1
2
3
4
5
Daily Weekly Monthly Yearly Never

10
2 COUNCIL SERVICES & FACILITIES
This section reports on the services and facilities provided by Shoalhaven City Council. Respondents
were asked to rate their satisfaction with 42 services and facilities provided by Council. These
services and facilities were classified into four service areas.
SUSTAINABLE, LIVEABLE ENVIRONMENTSSUSTAINABLE, LIVEABLE ENVIRONMENTSSUSTAINABLE, LIVEABLE ENVIRONMENTSSUSTAINABLE, LIVEABLE ENVIRONMENTS
Plan and manage appropriate and sustainable developmentPlan and manage appropriate and sustainable developmentPlan and manage appropriate and sustainable developmentPlan and manage appropriate and sustainable development
Appearance of towns and villages
Compliance and enforcement of development
Efficient processing of development applications
Making the most of our waterfronts
Strategic land use and town planning for Shoalhaven
Improve and maintain our road and transport Improve and maintain our road and transport Improve and maintain our road and transport Improve and maintain our road and transport infrastructureinfrastructureinfrastructureinfrastructure
Maintenance of sealed local roads
Maintenance of unsealed local roads
Management of stormwater and drainage
Provision of car parks
Provision of cycleways
Provision of footpaths
Protect and showcase the naturel environmentProtect and showcase the naturel environmentProtect and showcase the naturel environmentProtect and showcase the naturel environment
Environmental protection and enforcement (e.g. building site inspections, illegal dumping,
tree vandalism or clearing)
Maintenance of beaches and dunes
Management of street trees
Sustainable management of lakes and estuaries
Sustainable management of Shoalhaven's natural environment
PROSPEROUS COMMUNITIESPROSPEROUS COMMUNITIESPROSPEROUS COMMUNITIESPROSPEROUS COMMUNITIES
Maintain and grow a robust economy and vibrant towns and villagesMaintain and grow a robust economy and vibrant towns and villagesMaintain and grow a robust economy and vibrant towns and villagesMaintain and grow a robust economy and vibrant towns and villages
Appearance of CBD's (major town centres)
Promoting economic development (i.e. jobs growth)
Promotion of tourism

11
RESPONSIBLE GOVERNANCERESPONSIBLE GOVERNANCERESPONSIBLE GOVERNANCERESPONSIBLE GOVERNANCE
Reliable services that meet daily community needsReliable services that meet daily community needsReliable services that meet daily community needsReliable services that meet daily community needs
Cemeteries
Community buildings and halls
Parks, playgrounds and reserves
Public toilets
Shoalhaven Entertainment Centre
Sporting fields
Swimming pools
Provide advocacy and transparent leadership Provide advocacy and transparent leadership Provide advocacy and transparent leadership Provide advocacy and transparent leadership through effective government and administrationthrough effective government and administrationthrough effective government and administrationthrough effective government and administration
Council's customer service
Elected Council decision making
Inform and engage with the community about the decisions that affect their livesInform and engage with the community about the decisions that affect their livesInform and engage with the community about the decisions that affect their livesInform and engage with the community about the decisions that affect their lives
Council's actions are in-line with community expectations
Informing the community of Council decisions, activities and services
Opportunities to participate in Council decision making processes
RESILIENT, SAFE AND INCLUSIVE COMMUNITIESRESILIENT, SAFE AND INCLUSIVE COMMUNITIESRESILIENT, SAFE AND INCLUSIVE COMMUNITIESRESILIENT, SAFE AND INCLUSIVE COMMUNITIES
Build inclusive, safe and connected communitiesBuild inclusive, safe and connected communitiesBuild inclusive, safe and connected communitiesBuild inclusive, safe and connected communities
Companion animal (dogs) management
Disaster response in the Shoalhaven
Facilities and services for the disabled
Hygiene standards of retail food markets
Landfill and resource recovery services - waste depots
Library services
Operation of sewerage and quality water service
Shoalhaven Regional Gallery Nowra
Solid waste and recycling collection - wheelie bin service
Activate communities through arts, culture and eventsActivate communities through arts, culture and eventsActivate communities through arts, culture and eventsActivate communities through arts, culture and events
Council's support of events in the Shoalhaven
Types of events in the Shoalhaven

12
2.1 SUSTAINABLE, LIVEABLE ENVIRONMENTS
Residents were asked to rate their satisfaction with 16 services within this category using a five-
point scale where 1 meant ‘very dissatisfied’ and 5 meant ‘very satisfied’.
Residents are most satisfied with maintenance of beaches and dunesmaintenance of beaches and dunesmaintenance of beaches and dunesmaintenance of beaches and dunes (3.6). More than half (51%)
of Shoalhaven residents are satisfied with the appearance of towns and villagesappearance of towns and villagesappearance of towns and villagesappearance of towns and villages.
Services relating to roadsroadsroadsroads, developmentdevelopmentdevelopmentdevelopment and planning planning planning planning recorded lower satisfaction results.
Residents are least satisfied with the maintenance of sealed lomaintenance of sealed lomaintenance of sealed lomaintenance of sealed local roadscal roadscal roadscal roads (2.5).
Figure Figure Figure Figure 2222....1111 Sustainable, liveable environmentsSustainable, liveable environmentsSustainable, liveable environmentsSustainable, liveable environments
Base: All respondents (n=401)
8%
7%
5%
6%
3%
4%
14%
11%
13%
27%
6%
26%
41%
9%
12%
16%
23%
24%
21%
29%
24%
21%
23%
27%
20%
35%
30%
26%
49%
26%
37%
31%
32%
30%
34%
24%
32%
31%
35%
30%
32%
38%
27%
20%
28%
57%
51%
45%
45%
42%
40%
44%
40%
34%
31%
30%
21%
21%
18%
12%
23%
Maintenance of beaches and dunes
Appearance of towns and villages
Management of stormwater and drainage
Provision of car parks
Management of street trees
Sustainable management of natural environment
Making the most of our waterfronts
Provision of footpaths
Sustainable management of lakes and estuaries
Environmental protection and enforcement
Provision of cycleways
Compliance and enforcement of development
Strategic land use and town planning for Shoalhaven
Maintenance of unsealed local roads
Efficient processing of development applications
Maintenance of sealed local roads
Can't say Dissatisfied (1-2) Neutral (3) Satisfied (4-5) AverageAverageAverageAverage
3.6
3.5
3.4
3.3
3.2
3.2
3.1
3.1
3.1
3.1
3.0
3.0
2.8
2.7
2.6
2.5

13
Table 2.1 lists significant differences among subgroups for this category of services.
Most significant differences are related to property ownership. Residents that do not own property
in Shoalhaven are significantly more satisfied with a range of services.
TableTableTableTable 2222....1111 Sustainable, liveable environments Sustainable, liveable environments Sustainable, liveable environments Sustainable, liveable environments –––– Subgroup AnalysisSubgroup AnalysisSubgroup AnalysisSubgroup Analysis
SubgroupSubgroupSubgroupSubgroup Significant DifferencesSignificant DifferencesSignificant DifferencesSignificant Differences
GenderGenderGenderGender
- Female residents are more satisfied with the appearance of towns and appearance of towns and appearance of towns and appearance of towns and
villagesvillagesvillagesvillages.
- Male residents are most satisfied with the provision of footpathsprovision of footpathsprovision of footpathsprovision of footpaths.
AgeAgeAgeAge
- Residents aged 65 plus years are more satisfied with the following services
compared to those aged 50 to 64 years:
- Making the most of our waterfrontsMaking the most of our waterfrontsMaking the most of our waterfrontsMaking the most of our waterfronts
- Strategic land use and town Strategic land use and town Strategic land use and town Strategic land use and town planning for Shoalhavenplanning for Shoalhavenplanning for Shoalhavenplanning for Shoalhaven
- Efficient processing of development applicationsEfficient processing of development applicationsEfficient processing of development applicationsEfficient processing of development applications
Property OwnershipProperty OwnershipProperty OwnershipProperty Ownership
- Residents that do not own property were more satisfied with the following
services compared to property owners:
- Provision of car parksProvision of car parksProvision of car parksProvision of car parks
- Management of street treesManagement of street treesManagement of street treesManagement of street trees
- MMMMaking the most of our waterfrontsaking the most of our waterfrontsaking the most of our waterfrontsaking the most of our waterfronts
- Provision of footpathsProvision of footpathsProvision of footpathsProvision of footpaths
- Compliance and enforcement of developmentCompliance and enforcement of developmentCompliance and enforcement of developmentCompliance and enforcement of development
- Efficient processing of development applicationsEfficient processing of development applicationsEfficient processing of development applicationsEfficient processing of development applications

14
Reasons for DissatisfactionReasons for DissatisfactionReasons for DissatisfactionReasons for Dissatisfaction
All open-ended responses have been provided to Council in a separate report.
Local roadsLocal roadsLocal roadsLocal roads (n=201)(n=201)(n=201)(n=201)
The main reasons for dissatisfaction among residents that gave a low rating to maintenance of
sealed or unsealed local roads were the condition of the roads themselves and the quality of the
maintenance carried out by Council. The primary issue identified by these residents is potholes,
with 92 responses mentioning potholes. Furthermore, several responses referenced ‘patchwork’
maintenance, stating that roads should be resealed rather temporarily maintained.
Footpaths and cyclewFootpaths and cyclewFootpaths and cyclewFootpaths and cyclewaysaysaysays (n=151)(n=151)(n=151)(n=151)
The biggest issue for residents dissatisfied with footpaths and cycleways is insufficiency. Most
responses related to a lack of footpaths and cycleways in the respondent’s local area. A smaller
number of residents referenced the quality of footpaths, stating that they can be uneven and poorly
maintained.
EfficienEfficienEfficienEfficient processing of development applications (n=94)t processing of development applications (n=94)t processing of development applications (n=94)t processing of development applications (n=94)
Most residents dissatisfied with this service had concerns about the speed of the process and the
length of time required for approval. Other issues raised include the requirements of the process,
perceptions of political influence and issues with neighbour’s development applications.
Sustainable management of lakes and estuarieSustainable management of lakes and estuarieSustainable management of lakes and estuarieSustainable management of lakes and estuaries (n=72)s (n=72)s (n=72)s (n=72)
One of the main issues for residents dissatisfied with this service is the management of Lake
Conjola. These residents believe that the opening and closing of the lake to prevent flooding is
ineffective. Other less common issues raised include a lack of cleaning pollution and runoff from
land.
Compliance and enforcement of development (n=71)Compliance and enforcement of development (n=71)Compliance and enforcement of development (n=71)Compliance and enforcement of development (n=71)
Residents dissatisfied with this service cited overdevelopment, high-rise development, impact on
the natural environment and concerns about specific areas and estates.

15
Internal BenchmarksInternal BenchmarksInternal BenchmarksInternal Benchmarks
Table 2.2 compares the average satisfaction ratings for 2020 with previous results from 2017 and
2018.
There have been statistically significant improvementsimprovementsimprovementsimprovements in two services: provision of car parksprovision of car parksprovision of car parksprovision of car parks (up
0.4 pts to 3.3) and provision of cyclewaysprovision of cyclewaysprovision of cyclewaysprovision of cycleways (up 0.2 pts to 3.0).
There have also been statistically significant declinesdeclinesdeclinesdeclines in two services: sustainable management of sustainable management of sustainable management of sustainable management of
Shoalhaven’s natural environmentShoalhaven’s natural environmentShoalhaven’s natural environmentShoalhaven’s natural environment (down 0.2 pts to 3.2) and sustainable management of lasustainable management of lasustainable management of lasustainable management of lakes kes kes kes
and estuariesand estuariesand estuariesand estuaries (down 0.4 pts to 3.1).
Table Table Table Table 2222....2222 Sustainable, liveable environments Sustainable, liveable environments Sustainable, liveable environments Sustainable, liveable environments –––– Internal Benchmarks Internal Benchmarks Internal Benchmarks Internal Benchmarks
Sustainable, liveable environmentsSustainable, liveable environmentsSustainable, liveable environmentsSustainable, liveable environments 2012012012017777 2018201820182018 2020202020202020 Significant Significant Significant Significant
change change change change
since 2018since 2018since 2018since 2018
Maintenance of beaches and dunes 3.7 3.6 3.6
Appearance of towns and villages 3.5 3.6 3.5
Management of stormwater and drainage 3.2 3.3 3.4
Provision of car parks 3.0 2.9 3.3
Management of street trees 3.2 3.2 3.2
Sustainable management of Shoalhaven's natural
environment 3.5 3.4 3.2
Making the most of our waterfronts 3.0 3.0 3.1
Provision of footpaths 2.9 3.0 3.1
Sustainable management of lakes and estuaries 3.6 3.5 3.1
Environmental protection and enforcement 3.1 3.2 3.1
Provision of cycleways 2.7 2.8 3.0
Compliance and enforcement of development - 3.0 3.0
Strategic land use and town planning for
Shoalhaven 2.8 2.8 2.8
Maintenance of unsealed local roads 2.5 2.6 2.7
Efficient processing of development applications 2.7 2.5 2.6
Maintenance of sealed local roads 2.4 2.4 2.5

16
External BenchmarksExternal BenchmarksExternal BenchmarksExternal Benchmarks
Table 2.3 compares benchmarked results for this category with an average of councils in NSW with
comparable characteristics to Shoalhaven City Council. A difference of ±4 pts indicates a
significant difference in performance. Ten services could not be benchmarked.
Table Table Table Table 2222....3333 Sustainable, liveable environments Sustainable, liveable environments Sustainable, liveable environments Sustainable, liveable environments –––– External Benchmarks External Benchmarks External Benchmarks External Benchmarks
Sustainable, liveable environmentsSustainable, liveable environmentsSustainable, liveable environmentsSustainable, liveable environments CurrentCurrentCurrentCurrent Comparable Comparable Comparable Comparable
CouncilCouncilCouncilCouncil BestBestBestBest WorstWorstWorstWorst
Provision of car parks 56 51 68 33
Provision of footpaths 53 55 70 43
Provision of cycleways 50 58 76 43
Maintenance of unsealed local roads 42 47 59 37
Efficient processing of development
applications 40 52 75 38
Maintenance of sealed local roads 38 54 70 34

17
2.2 PROSPEROUS COMMUNITIES
Residents were asked to rate their satisfaction with three services within this category using a five-
point scale.
Residents are most satisfied with the promotion of tourismpromotion of tourismpromotion of tourismpromotion of tourism (3.7). Sixty-two percent (62%) of
residents are satisfied with this service.
Residents are relatively less satisfied with the appearance of CBD’s (major town centres)appearance of CBD’s (major town centres)appearance of CBD’s (major town centres)appearance of CBD’s (major town centres) and
promoting economic development (i.e. jobs growth)promoting economic development (i.e. jobs growth)promoting economic development (i.e. jobs growth)promoting economic development (i.e. jobs growth).
There are no significant differences in results among subgroups.
Figure Figure Figure Figure 2222....2222 Prosperous communities Prosperous communities Prosperous communities Prosperous communities
Base: All respondents (n=401)
Table Table Table Table 2222....4444 Prosperous communities Prosperous communities Prosperous communities Prosperous communities –––– Subgroup AnalysisSubgroup AnalysisSubgroup AnalysisSubgroup Analysis
SubgroupSubgroupSubgroupSubgroup Significant DifferencesSignificant DifferencesSignificant DifferencesSignificant Differences
GenderGenderGenderGender Nil
AgeAgeAgeAge Nil
Property OwnershipProperty OwnershipProperty OwnershipProperty Ownership Nil
4%
15%
10%
25%
28%
24%
37%
34%
62%
38%
23%
Promotion of tourism
Appearance of CBD's (major town centres)
Promoting economic development (i.e. jobs growth)
Can't say Dissatisfied (1-2) Neutral (3) Satisfied (4-5) AverageAverageAverageAverage
3.7
3.1
2.9
18
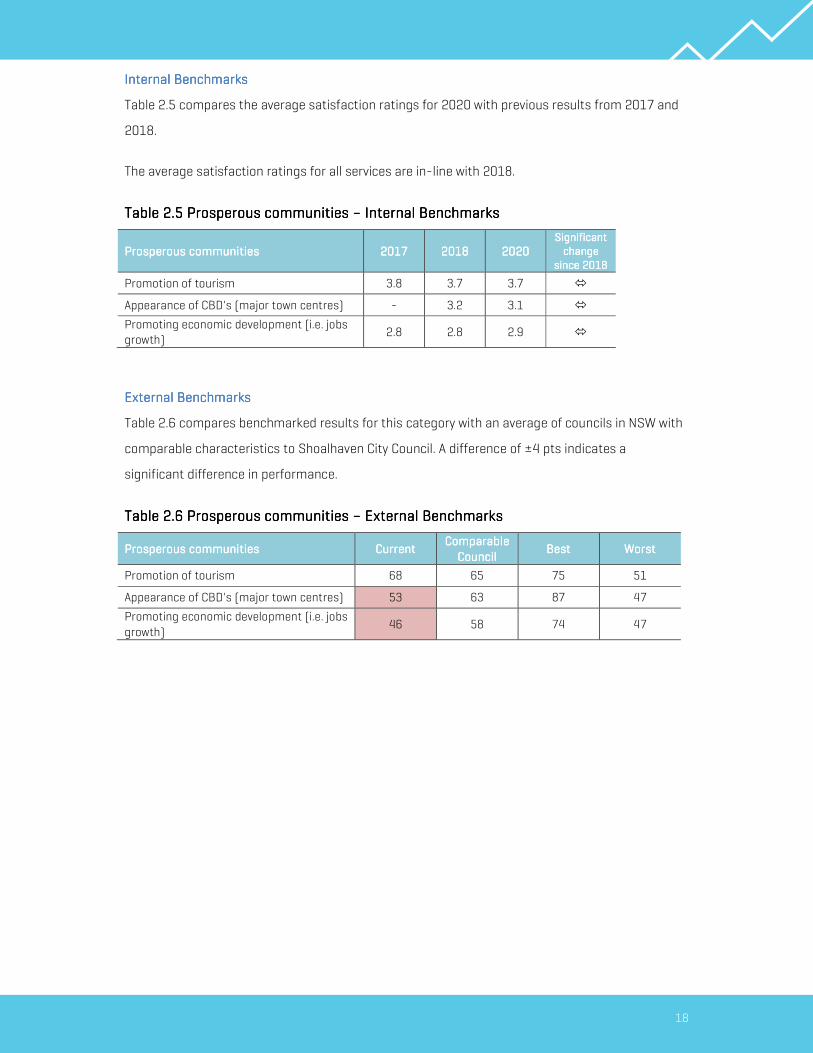
Internal Benchmarks Internal Benchmarks Internal Benchmarks Internal Benchmarks
Table 2.5 compares the average satisfaction ratings for 2020 with previous results from 2017 and
2018.
The average satisfaction ratings for all services are in-line with 2018.
Table Table Table Table 2222....5555 Prosperous communities Prosperous communities Prosperous communities Prosperous communities –––– Internal Benchmarks Internal Benchmarks Internal Benchmarks Internal Benchmarks
Prosperous communitiesProsperous communitiesProsperous communitiesProsperous communities 2012012012017777 2018201820182018 2020202020202020 Significant Significant Significant Significant
change change change change
since 2018since 2018since 2018since 2018
Promotion of tourism 3.8 3.7 3.7
Appearance of CBD's (major town centres) - 3.2 3.1
Promoting economic development (i.e. jobs
growth) 2.8 2.8 2.9
ExternalExternalExternalExternal Benchmarks Benchmarks Benchmarks Benchmarks
Table 2.6 compares benchmarked results for this category with an average of councils in NSW with
comparable characteristics to Shoalhaven City Council. A difference of ±4 pts indicates a
significant difference in performance.
Table Table Table Table 2222....6666 Prosperous communities Prosperous communities Prosperous communities Prosperous communities –––– External BenchmarksExternal BenchmarksExternal BenchmarksExternal Benchmarks
Prosperous communitiesProsperous communitiesProsperous communitiesProsperous communities CurrentCurrentCurrentCurrent Comparable Comparable Comparable Comparable
CouncilCouncilCouncilCouncil BestBestBestBest WorstWorstWorstWorst
Promotion of tourism 68 65 75 51
Appearance of CBD's (major town centres) 53 63 87 47
Promoting economic development (i.e. jobs
growth) 46 58 74 47

19
2.3 RESPONSIBLE GOVERNANCE
Residents were asked to rate their satisfaction with 12 services and facilities within this category
using a five-point scale.
Four facilities recorded highhighhighhigh average satisfaction ratings (above 3.75): Shoalhaven Entertainment Shoalhaven Entertainment Shoalhaven Entertainment Shoalhaven Entertainment
CentreCentreCentreCentre (4.1), swimming poolsswimming poolsswimming poolsswimming pools (4.1), cemeteriescemeteriescemeteriescemeteries (3.9) and sporting fieldssporting fieldssporting fieldssporting fields (3.9). Residents were
more likely to not offer a rating than to provide a dissatisfied rating. This suggests that residents
that are familiar with and use facilities and therefore more likely to provide a rating are generally
satisfied with these facilities.
Services related to Council decision making recorded lower average satisfaction ratings.
Figure Figure Figure Figure 2222....3333 Responsible governanceResponsible governanceResponsible governanceResponsible governance
Base: All respondents (n=401)
23%
23%
41%
14%
15%
5%
12%
11%
9%
20%
18%
11%
4%
3%
2%
3%
4%
11%
11%
23%
21%
25%
22%
31%
11%
13%
18%
17%
27%
22%
20%
28%
39%
33%
45%
39%
62%
61%
40%
65%
53%
63%
57%
37%
31%
23%
15%
19%
Shoalhaven Entertainment Centre
Swimming pools
Cemeteries
Sporting fields
Community buildings and halls
Parks, playgrounds and reserves
Council's customer service
Public toilets
Informing the community of Council decisions,
activities and services
Opportunities to participate in Council decision
making processes
Elected Council decision making
Council's actions are in-line with community
expectations
Can't say Dissatisfied (1-2) Neutral (3) Satisfied (4-5)
4.1
4.1
3.9
3.9
3.7
3.7
3.6
3.2
3.1
2.9
2.8
2.8
AverageAverageAverageAverage

20
Table Table Table Table 2222....7777 Responsible governance Responsible governance Responsible governance Responsible governance –––– Subgroup AnalysisSubgroup AnalysisSubgroup AnalysisSubgroup Analysis
SubgroupSubgroupSubgroupSubgroup Significant DifferencesSignificant DifferencesSignificant DifferencesSignificant Differences
GenderGenderGenderGender - Female residents are more satisfied with Shoalhaven Entertainment CentreShoalhaven Entertainment CentreShoalhaven Entertainment CentreShoalhaven Entertainment Centre.
AgeAgeAgeAge
- Residents aged 65 plus years are more satisfied with Council’s customer Council’s customer Council’s customer Council’s customer
serviceserviceserviceservice compared to those in the 35 to 49 years and 50 to 64 years age groups.
- Residents are more satisfied with elected Council decision makingelected Council decision makingelected Council decision makingelected Council decision making compared
to those aged 50 to 64 years.
- Residents aged 65 plus years are more satisfied with Council’s actions are inCouncil’s actions are inCouncil’s actions are inCouncil’s actions are in----
line with community expectationsline with community expectationsline with community expectationsline with community expectations compared to all other residents.
Property OwnershipProperty OwnershipProperty OwnershipProperty Ownership - Residents that do not own property are more satisfied with sporting fieldssporting fieldssporting fieldssporting fields.
Reasons for DReasons for DReasons for DReasons for Dissatisfactionissatisfactionissatisfactionissatisfaction
All open-ended responses have been provided to Council in a separate report.
Elected Council decision making (n=74)Elected Council decision making (n=74)Elected Council decision making (n=74)Elected Council decision making (n=74)
Responses from residents dissatisfied with elected Council decision making referred to specific
decisions made by Council (e.g. Nowra bridge, hazard reduction burns, bypasses) as well as
Councillor conduct at meetings and political partisanship.
Council’sCouncil’sCouncil’sCouncil’s customer servicecustomer servicecustomer servicecustomer service (n=37)(n=37)(n=37)(n=37)
Issues raised by residents dissatisfied with Council’s customer service included timeliness,
responsiveness and lack of follow up and interest from the customer service workers.

21
Internal BenchmarksInternal BenchmarksInternal BenchmarksInternal Benchmarks
Table 2.8 compares the average satisfaction ratings for 2020 with previous results from 2017 and
2018.
There have been statistically significant improvements in average satisfaction with swimming swimming swimming swimming
ppppoolsoolsoolsools (up 0.2 pts to 4.1) and elected Council decision makingelected Council decision makingelected Council decision makingelected Council decision making (up 0.2 pts to 2.8) since 2018.
Table Table Table Table 2222....8888 Responsible governance Responsible governance Responsible governance Responsible governance –––– Internal BenchmarksInternal BenchmarksInternal BenchmarksInternal Benchmarks
Responsible governanceResponsible governanceResponsible governanceResponsible governance 2012012012017777 2018201820182018 2020202020202020 Significant Significant Significant Significant
change change change change
since 2018since 2018since 2018since 2018
Shoalhaven Entertainment Centre 4.1 4.1 4.1
Swimming pools 3.9 3.9 4.1
Cemeteries 3.8 3.8 3.9
Sporting fields 3.7 3.8 3.9
Community buildings and halls 3.6 3.7 3.7
Parks, playgrounds and reserves 3.5 3.6 3.7
Council's customer service 3.7 3.6 3.6
Public toilets 2.9 3.1 3.2
Informing the community of Council
decisions, activities and services 3.1 3.0 3.1
Opportunities to participate in Council
decision making processes 3.1 2.8 2.9
Elected Council decision making 2.8 2.6 2.8
Council's actions are in-line with community
expectations 2.9 2.8 2.8

22
External BenchmarksExternal BenchmarksExternal BenchmarksExternal Benchmarks
Table 2.9 compares benchmarked results for this category with an average of councils in NSW with
comparable characteristics to Shoalhaven City Council. A difference of ±4 pts indicates a
significant difference in performance. Five services could not be benchmarked.
Table Table Table Table 2222....9999 Responsible governance Responsible governance Responsible governance Responsible governance –––– External Benchmarks External Benchmarks External Benchmarks External Benchmarks
Responsible governanceResponsible governanceResponsible governanceResponsible governance CurrentCurrentCurrentCurrent CompaCompaCompaComparable rable rable rable
CouncilCouncilCouncilCouncil BestBestBestBest WorstWorstWorstWorst
Swimming pools 77 67 83 58
Sporting fields 73 70 87 60
Community buildings and halls 68 66 77 56
Parks, playgrounds and reserves 67 69 88 58
Public toilets 54 49 69 38
Informing the community of Council
decisions, activities and services 53 62 74 49
Elected Council decision making 46 56 67 45

23
Usage of Council facilitiesUsage of Council facilitiesUsage of Council facilitiesUsage of Council facilities
Residents were asked how often they use Council facilities and were provided examples including
parks, halls, public toilets, sporting fields and swimming pools.
Due to COVIDDue to COVIDDue to COVIDDue to COVID----19 lockdown restrictions residents were asked to answer based on the time 19 lockdown restrictions residents were asked to answer based on the time 19 lockdown restrictions residents were asked to answer based on the time 19 lockdown restrictions residents were asked to answer based on the time
before restrictions were implemented. before restrictions were implemented. before restrictions were implemented. before restrictions were implemented.
Over half (52%) use Council facilities weeklyweeklyweeklyweekly. A further 17 percent use Council facilities monthlymonthlymonthlymonthly.
Only eight percent (8%) of residents indicated they nevernevernevernever use Council facilities. These results are
generally in-line with 2018 results (see Table 2.11).
Figure Figure Figure Figure 2222....4444 Frequency of using a Council facility Frequency of using a Council facility Frequency of using a Council facility Frequency of using a Council facility
All respondents (n=401)
Table Table Table Table 2222....10101010 Frequency of using a Council facility Frequency of using a Council facility Frequency of using a Council facility Frequency of using a Council facility –––– Significant differencesSignificant differencesSignificant differencesSignificant differences
SubgroupSubgroupSubgroupSubgroup Significant DifferencesSignificant DifferencesSignificant DifferencesSignificant Differences
GenderGenderGenderGender Nil
AgeAgeAgeAge
- Residents aged 35 to 49 years are more likely to use facilities weeklyweeklyweeklyweekly compared
to those aged 65 plus years.
- Residents aged 65 plus years are more likely to use facilities every six monthsevery six monthsevery six monthsevery six months
compared to those aged 18 to 34 years.
- Residents aged 50 years and over are more likely to nevernevernevernever use facilities
compared to those aged 18 to 34 years.
Property OwnershipProperty OwnershipProperty OwnershipProperty Ownership - Residents that do not own property are more satisfied with sporting fieldssporting fieldssporting fieldssporting fields.
TableTableTableTable 2222....11111111 Frequency of using a Council facility Frequency of using a Council facility Frequency of using a Council facility Frequency of using a Council facility –––– Comparison with 2018Comparison with 2018Comparison with 2018Comparison with 2018
FrequencyFrequencyFrequencyFrequency 2012012012018888 2020202020202020
Weekly 51% 52%
Fortnightly 12% 11%
Monthly 17% 17%
Every six months 10% 6%
At least once a year 6% 5%
Never 6% 8%
52%
11%
17%
6%
5%
8%
Weekly
Fortnightly
Monthly
Every six months
At least once a year
Never
Monthly AverageMonthly AverageMonthly AverageMonthly Average
2.72.72.72.7

24
Residents that use Council facilities weekly are more significantly satisfied with community community community community
buildings and hallsbuildings and hallsbuildings and hallsbuildings and halls (3.8) compared to those that use Council facilities every six months or less
often (3.4).
There are no other statistically significant differences in satisfaction with facilities based on usage
frequency.
Table Table Table Table 2222....12121212 Satisfaction with Council facilities by Facility Usage Satisfaction with Council facilities by Facility Usage Satisfaction with Council facilities by Facility Usage Satisfaction with Council facilities by Facility Usage
Council Facilities Council Facilities Council Facilities Council Facilities WeeklyWeeklyWeeklyWeekly FortnightlyFortnightlyFortnightlyFortnightly MonthlyMonthlyMonthlyMonthly Less often Less often Less often Less often
or neveror neveror neveror never
Shoalhaven Entertainment Centre 4.2 4.3 4.2 3.7
Swimming pools 4.1 4.3 4.0 3.8
Cemeteries 4.0 3.9 3.8 3.9
Sporting fields 3.9 4.0 3.9 3.8
Community buildings and halls 3.8 3.6 3.6 3.4
Parks, playgrounds and reserves 3.7 3.8 3.7 3.6
Public toilets 3.3 2.8 3.1 3.0
Statistically significant difference at the 95% confidence level.

25
2.4 RESILIENT, SAFE AND INCLUSIVE COMMUNITIES
Residents were asked to rate their satisfaction with 11 services and facilities within this category
using a five-point scale.
This is a high-performing service category with six services recording high average satisfaction
ratings (above 3.75). Residents are most satisfied with library serviceslibrary serviceslibrary serviceslibrary services (4.3). This is followed by
operation of sewerage and quality water serviceoperation of sewerage and quality water serviceoperation of sewerage and quality water serviceoperation of sewerage and quality water service (4.2).
Figure Figure Figure Figure 2222....5555 Resilient, safe and inclusive communities Resilient, safe and inclusive communities Resilient, safe and inclusive communities Resilient, safe and inclusive communities
Base: All respondents (n=401)
25%
7%
58%
6%
24%
7%
6%
15%
36%
3%
3%
9%
4%
8%
10%
14%
7%
7%
10%
6%
13%
15%
14%
8%
19%
17%
20%
31%
30%
19%
66%
76%
74%
79%
33%
66%
49%
60%
56%
48%
35%
Library services
Operation of sewerage and quality water service
Solid waste and recycling collection - wheelie bin
service
Hygiene standards of retail food markets
Shoalhaven Regional Gallery Nowra
Disaster response in the Shoalhaven
Companion animal (dogs) management
Landfill and resource recovery services - waste
depots
Types of events in the Shoalhaven
Council's support of events in the Shoalhaven
Facilities and services for the disabled
Can't say Dissatisfied (1-2) Neutral (3) Satisfied (4-5)
4.3
4.2
4.1
4.1
4.0
3.9
3.7
3.7
3.6
3.5
3.5
AverageAverageAverageAverage

26
Table Table Table Table 2222....13131313 Resilient, safe and inclusive communities Resilient, safe and inclusive communities Resilient, safe and inclusive communities Resilient, safe and inclusive communities –––– Subgroup AnalysisSubgroup AnalysisSubgroup AnalysisSubgroup Analysis
SubgroupSubgroupSubgroupSubgroup Significant DifferencesSignificant DifferencesSignificant DifferencesSignificant Differences
GenderGenderGenderGender Nil
AgeAgeAgeAge
- Residents aged 65 plus years are more satisfied with library serviceslibrary serviceslibrary serviceslibrary services than
those aged 50 to 64 years.
- Residents aged 65 plus years are more satisfied with facilities and services for facilities and services for facilities and services for facilities and services for
the disabledthe disabledthe disabledthe disabled compared to those aged 35 to 49 years.
Property OwnershipProperty OwnershipProperty OwnershipProperty Ownership Nil
Reasons for DissatisfactionReasons for DissatisfactionReasons for DissatisfactionReasons for Dissatisfaction
All open-ended responses have been provided to Council in a separate report.
Landfill and resource recovery services Landfill and resource recovery services Landfill and resource recovery services Landfill and resource recovery services –––– waste depotswaste depotswaste depotswaste depots (n=37)(n=37)(n=37)(n=37)
Responses from residents dissatisfied with this service cited the costs associated with using the
waste depots as well as issues relating to the process of disposing waste at the depots. A smaller
number of residents cited no green waste bin as their concern.
Disaster response in the Shoalhaven Disaster response in the Shoalhaven Disaster response in the Shoalhaven Disaster response in the Shoalhaven (n=25)(n=25)(n=25)(n=25)
The responses from residents dissatisfied with disaster response generally referred to the bushfire
disasters. The main concern among these residents is the level of communication during the
disasters. Other issues cited included the quality of the disaster response and timeliness.

27
Internal Benchmarks Internal Benchmarks Internal Benchmarks Internal Benchmarks
Table 2.14 compares the average satisfaction ratings for 2020 with previous results from 2017 and
2018.
There has been a statistically significant improvement in average satisfaction with companion companion companion companion
animaanimaanimaanimal (dogs) managementl (dogs) managementl (dogs) managementl (dogs) management (up 0.3 pts to 3.7) since 2018.
There has been a statistically significant decline in average satisfaction with disaster response in disaster response in disaster response in disaster response in
the Shoalhaventhe Shoalhaventhe Shoalhaventhe Shoalhaven (down 0.3 pts to 3.9). This change should be properly contextualised given the
natural disasters experience in the Shoalhaven over the past 12 months.
Table Table Table Table 2222....14141414 Resilient, safe and inclusive communities Resilient, safe and inclusive communities Resilient, safe and inclusive communities Resilient, safe and inclusive communities –––– Internal Benchmarks Internal Benchmarks Internal Benchmarks Internal Benchmarks
Resilient, safe and inclusive communitiesResilient, safe and inclusive communitiesResilient, safe and inclusive communitiesResilient, safe and inclusive communities 2012012012017777 2018201820182018 2020202020202020 Significant Significant Significant Significant
change change change change
since 2018since 2018since 2018since 2018
Library services 4.4 4.3 4.3
Operation of sewerage and quality water
service 4.0 4.1 4.2
Solid waste and recycling collection -
wheelie bin service - 4.0 4.1
Hygiene standards of retail food markets 3.9 4.0 4.1
Shoalhaven Regional Gallery Nowra 4.1 4.0 4.0
Disaster response in the Shoalhaven 4.1 4.2 3.9
Companion animal (dogs) management 3.7 3.4 3.7
Landfill and resource recovery services -
waste depots - 3.7 3.7
Types of events in the Shoalhaven 3.7 3.6 3.6
Council's support of events in the
Shoalhaven 3.7 3.5 3.5
Facilities and services for the disabled 3.5 3.4 3.5
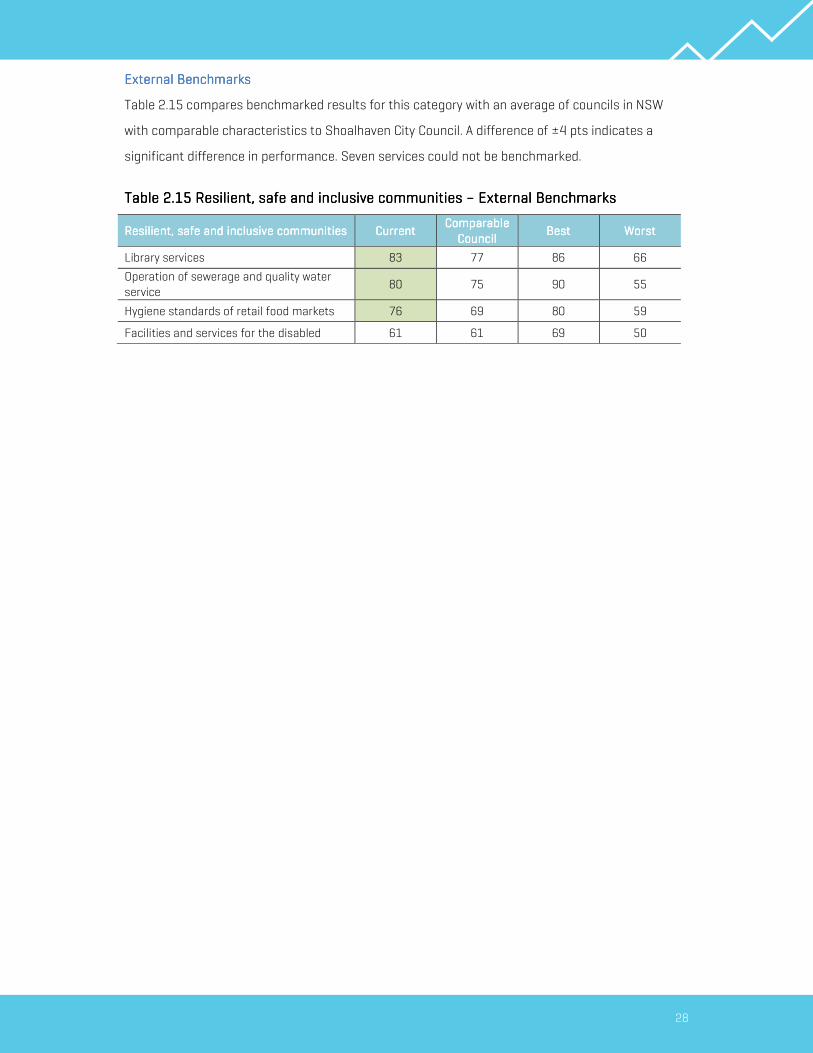
28
External BenchmarksExternal BenchmarksExternal BenchmarksExternal Benchmarks
Table 2.15 compares benchmarked results for this category with an average of councils in NSW
with comparable characteristics to Shoalhaven City Council. A difference of ±4 pts indicates a
significant difference in performance. Seven services could not be benchmarked.
Table Table Table Table 2222....15151515 Resilient, safe and iResilient, safe and iResilient, safe and iResilient, safe and inclusive communities nclusive communities nclusive communities nclusive communities –––– External Benchmarks External Benchmarks External Benchmarks External Benchmarks
Resilient, safe and inclusive communitiesResilient, safe and inclusive communitiesResilient, safe and inclusive communitiesResilient, safe and inclusive communities CurrentCurrentCurrentCurrent Comparable Comparable Comparable Comparable
CouncilCouncilCouncilCouncil BestBestBestBest WorstWorstWorstWorst
Library services 83 77 86 66
Operation of sewerage and quality water
service 80 75 90 55
Hygiene standards of retail food markets 76 69 80 59
Facilities and services for the disabled 61 61 69 50

29
Shoalhaven EventsShoalhaven EventsShoalhaven EventsShoalhaven Events
Residents were asked how often they take part in events occurring in Shoalhaven.
Due to COVIDDue to COVIDDue to COVIDDue to COVID----19 lockdown restrictions residents were asked to answer based on the time 19 lockdown restrictions residents were asked to answer based on the time 19 lockdown restrictions residents were asked to answer based on the time 19 lockdown restrictions residents were asked to answer based on the time
before restrictions were implemented. before restrictions were implemented. before restrictions were implemented. before restrictions were implemented.
In total, 38 percent attend Shoalhaven events monthly or move oftenmonthly or move oftenmonthly or move oftenmonthly or move often. Twenty-nine percent (29%)
attend every six monthsattend every six monthsattend every six monthsattend every six months. Fourteen percent (14%) of residents indicated they nevernevernevernever attend events
in Shoalhaven.
Figure Figure Figure Figure 2222....6666 Frequency of attending Shoalhaven events Frequency of attending Shoalhaven events Frequency of attending Shoalhaven events Frequency of attending Shoalhaven events
All respondents (n=401)
Table Table Table Table 2222....16161616 Frequency of attending Shoalhaven events Frequency of attending Shoalhaven events Frequency of attending Shoalhaven events Frequency of attending Shoalhaven events –––– Significant differencesSignificant differencesSignificant differencesSignificant differences
SubgroupSubgroupSubgroupSubgroup Significant DifferencesSignificant DifferencesSignificant DifferencesSignificant Differences
GenderGenderGenderGender - Females are more likely to attend events monthlymonthlymonthlymonthly.
AgeAgeAgeAge
- Residents aged 35 to 49 years and 65 plus years are more likely to attend
weeklyweeklyweeklyweekly compared to those aged 18 to 34 years.
- Residents aged 50 to 64 years are more likely to attend monthlymonthlymonthlymonthly compared to
those aged 65 plus years.
- Residents aged 18 to 34 years and 65 plus years are more likely to nevernevernevernever
attend compared to those aged 50 to 64 years.
Property OwnershipProperty OwnershipProperty OwnershipProperty Ownership - Property owners were more likely to attend at least once a yearat least once a yearat least once a yearat least once a year.
- Residents that do not own property are more likely to never never never never attend.
Table Table Table Table 2222....17171717 Frequency of attending Shoalhaven events Frequency of attending Shoalhaven events Frequency of attending Shoalhaven events Frequency of attending Shoalhaven events –––– Comparison with 2018Comparison with 2018Comparison with 2018Comparison with 2018
FrequencyFrequencyFrequencyFrequency 2012012012018888 2020202020202020
Weekly 5% 5%
Fortnightly 6% 4%
Monthly 30% 29%
Every six months 32% 29%
At least once a year 14% 19%
Never 14% 14%
5%
4%
29%
29%
19%
14%
Weekly
Fortnightly
Monthly
Every six months
At least once a year
Never
Monthly AverageMonthly AverageMonthly AverageMonthly Average
0.70.70.70.7
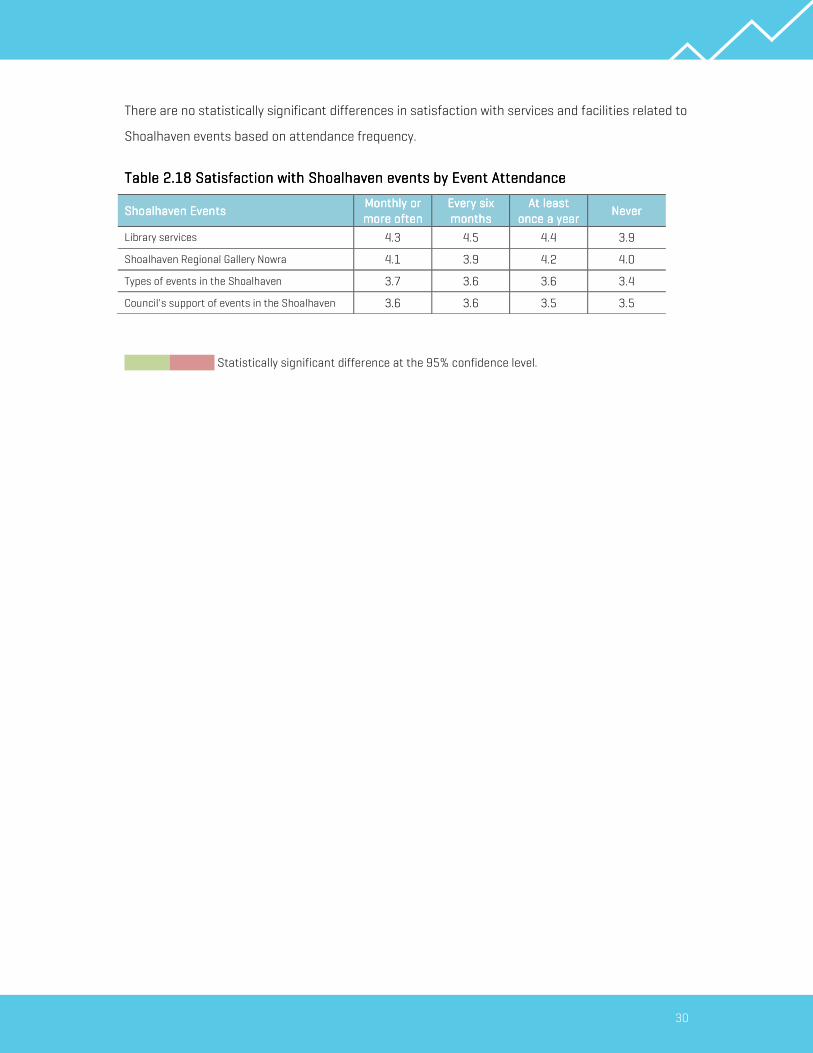
30
There are no statistically significant differences in satisfaction with services and facilities related to
Shoalhaven events based on attendance frequency.
Table Table Table Table 2222....18181818 Satisfaction with Satisfaction with Satisfaction with Satisfaction with Shoalhaven evenShoalhaven evenShoalhaven evenShoalhaven eventstststs by by by by EventEventEventEvent Attendance Attendance Attendance Attendance
Shoalhaven Events Shoalhaven Events Shoalhaven Events Shoalhaven Events Monthly or Monthly or Monthly or Monthly or
more oftenmore oftenmore oftenmore often
Every six Every six Every six Every six
monthsmonthsmonthsmonths
At least At least At least At least
once a yearonce a yearonce a yearonce a year NeverNeverNeverNever
Library services 4.3 4.5 4.4 3.9
Shoalhaven Regional Gallery Nowra 4.1 3.9 4.2 4.0
Types of events in the Shoalhaven 3.7 3.6 3.6 3.4
Council's support of events in the Shoalhaven 3.6 3.6 3.5 3.5
Statistically significant difference at the 95% confidence level.

31
3 PRIORITISING SERVICES & FACILITIES
This section of the report aims to identify the key drivers of resident satisfaction via a deeper
analysis of the relationship between overall satisfaction with Shoalhaven City Council and
satisfaction with services and facilities as reported in the previous section.
3.1 Quadrant Analysis
Quadrant analysis simultaneously analyses the importance of a service in terms of driving overall
satisfaction and the performance of services in terms of resident satisfaction. To do this, mean
satisfaction scores are plotted against derived importance scores for each Council service.
Importance scores are derived from regression analysis.
To form quadrants, the average derived importance score and average satisfaction score across all
services and facilities were calculated. Services and facilities with a mean satisfaction score less
than the overall average were classified as ‘low’ performing while those with a mean score above
the average were classified as ‘high’ performing. Similarly, services and facilities have ‘high’ or ‘low’
importance depending on their position above or below the overall average.
These scores do not suggest the service or facility is not important in the personal lives of These scores do not suggest the service or facility is not important in the personal lives of These scores do not suggest the service or facility is not important in the personal lives of These scores do not suggest the service or facility is not important in the personal lives of
residents. residents. residents. residents. It strictly relates to importance in creating overall satisfaction with Council. Areas of It strictly relates to importance in creating overall satisfaction with Council. Areas of It strictly relates to importance in creating overall satisfaction with Council. Areas of It strictly relates to importance in creating overall satisfaction with Council. Areas of
personapersonapersonapersonal importance are analysed in Section l importance are analysed in Section l importance are analysed in Section l importance are analysed in Section 1.31.31.31.3 ‘‘‘‘Issues influencing overall satisfaction Issues influencing overall satisfaction Issues influencing overall satisfaction Issues influencing overall satisfaction
ratings’ratings’ratings’ratings’....
Figure 3.1 (over-page) is Council’s performance/importance quadrant.
1. The upper right quadrant (high importance and high satisfaction) represents current service
strengths or ‘Strategic Advantages’.
2. The upper left quadrant (high importance but low satisfaction) denotes services where
satisfaction should be improved or ‘Key Vulnerabilities’.
3. The lower left quadrant (relatively lower importance and relatively lower satisfaction) represents
lower priority service dimensions or ‘Potential Vulnerabilities’.
4. The lower right quadrant (relatively lower importance and high satisfaction) represent Council’s
‘Differentiator’.

32
Figure Figure Figure Figure 3333....1111 Quadrant Analysis Quadrant Analysis Quadrant Analysis Quadrant Analysis –––– Full View Full View Full View Full View
Average Satisfactio
n
3.41
3.41
3.41
3.41
Average Importance
11 11
33 33
55 55
SATISFACTION
SATISFACTION
SATISFACTION
SATISFACTION
IMPORTANCEIMPORTANCEIMPORTANCEIMPORTANCE
22 22
44 44
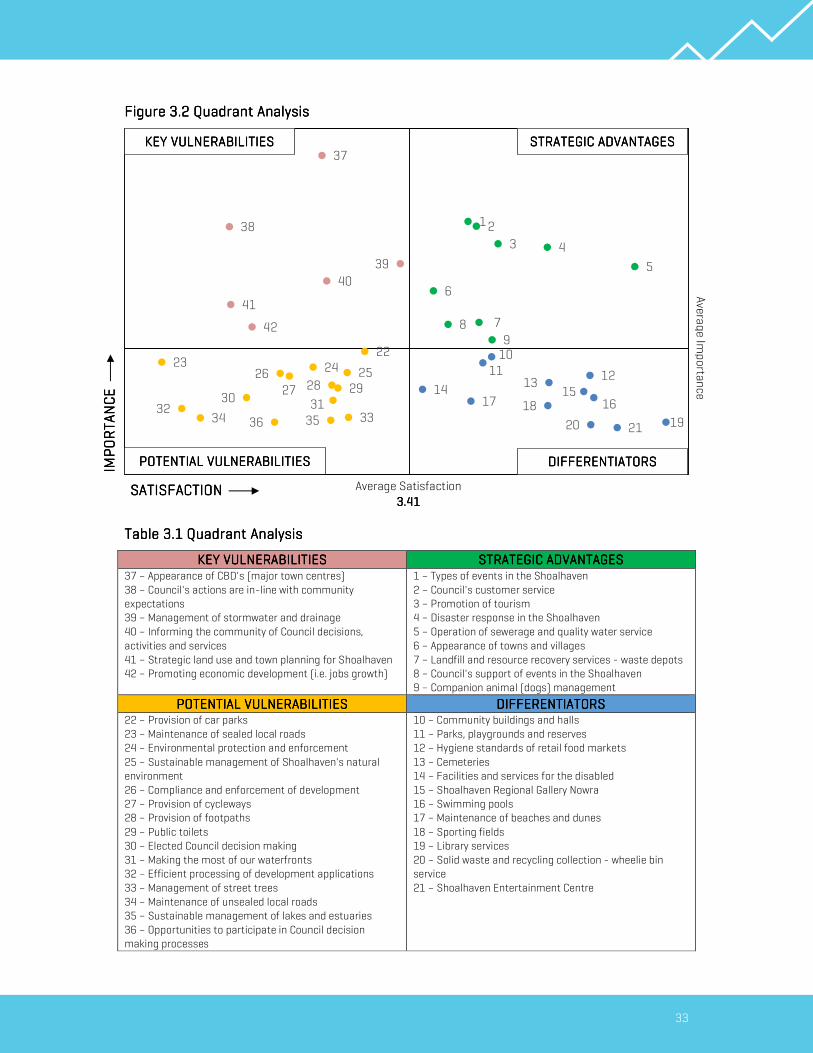
33
Figure Figure Figure Figure 3333....2222 Quadrant Analysis Quadrant Analysis Quadrant Analysis Quadrant Analysis
Table Table Table Table 3333....1111 Quadrant AnalysisQuadrant AnalysisQuadrant AnalysisQuadrant Analysis
KEY VULNERABILITIESKEY VULNERABILITIESKEY VULNERABILITIESKEY VULNERABILITIES STRATEGIC ADVANTAGESSTRATEGIC ADVANTAGESSTRATEGIC ADVANTAGESSTRATEGIC ADVANTAGES 37 – Appearance of CBD's (major town centres)
38 – Council's actions are in-line with community
expectations
39 – Management of stormwater and drainage
40 – Informing the community of Council decisions,
activities and services
41 – Strategic land use and town planning for Shoalhaven
42 – Promoting economic development (i.e. jobs growth)
1 – Types of events in the Shoalhaven
2 – Council's customer service
3 – Promotion of tourism
4 – Disaster response in the Shoalhaven
5 – Operation of sewerage and quality water service
6 – Appearance of towns and villages
7 – Landfill and resource recovery services - waste depots
8 – Council's support of events in the Shoalhaven
9 – Companion animal (dogs) management
POTENTIAL VULNERABILITIESPOTENTIAL VULNERABILITIESPOTENTIAL VULNERABILITIESPOTENTIAL VULNERABILITIES DIFFERENTIATORSDIFFERENTIATORSDIFFERENTIATORSDIFFERENTIATORS 22 – Provision of car parks
23 – Maintenance of sealed local roads
24 – Environmental protection and enforcement
25 – Sustainable management of Shoalhaven's natural
environment
26 – Compliance and enforcement of development
27 – Provision of cycleways
28 – Provision of footpaths
29 – Public toilets
30 – Elected Council decision making
31 – Making the most of our waterfronts
32 – Efficient processing of development applications
33 – Management of street trees
34 – Maintenance of unsealed local roads
35 – Sustainable management of lakes and estuaries
36 – Opportunities to participate in Council decision
making processes
10 – Community buildings and halls
11 – Parks, playgrounds and reserves
12 – Hygiene standards of retail food markets
13 – Cemeteries
14 – Facilities and services for the disabled
15 – Shoalhaven Regional Gallery Nowra
16 – Swimming pools
17 – Maintenance of beaches and dunes
18 – Sporting fields
19 – Library services
20 – Solid waste and recycling collection - wheelie bin
service
21 – Shoalhaven Entertainment Centre
12
3 4
5
6
78910
11 1213
14 151617 18
1920 21
2223 24 2526
27 28 2930
31323334 3536
37
38
39
40
41
42
STRATEGIC ADVANTAGESSTRATEGIC ADVANTAGESSTRATEGIC ADVANTAGESSTRATEGIC ADVANTAGES KEY VULNERABILITIESKEY VULNERABILITIESKEY VULNERABILITIESKEY VULNERABILITIES
DIFFERENTIATORSDIFFERENTIATORSDIFFERENTIATORSDIFFERENTIATORS POTENTIAL VULNERABILITIESPOTENTIAL VULNERABILITIESPOTENTIAL VULNERABILITIESPOTENTIAL VULNERABILITIES
Average Satisfaction
3.3.3.3.41414141
Average Im
porta
nce
SATISFACTIONSATISFACTIONSATISFACTIONSATISFACTION
IMPORTANCE
IMPORTANCE
IMPORTANCE
IMPORTANCE

34
Services in the upper right quadrant are SSSStrategic trategic trategic trategic AAAAdvantagesdvantagesdvantagesdvantages – these have an important impact
on creating overall satisfaction with Council and their performance is above average.
Council’s nine SSSStrategic trategic trategic trategic AAAAdvantagesdvantagesdvantagesdvantages include:
Types of events in the Shoalhaven
Council's customer service
Promotion of tourism
Disaster response in the Shoalhaven
Operation of sewerage and quality water service
Appearance of towns and villages
Landfill and resource recovery services - waste depots
Council's support of events in the Shoalhaven
Companion animal (dogs) management
Services in the upper left quadrant are KKKKey ey ey ey VVVVulnerabilitiesulnerabilitiesulnerabilitiesulnerabilities – services which have an important
impact on creating overall satisfaction but are performing below average. These services are
regarded as Council’s foremostforemostforemostforemost priorities.
Council’s six KKKKey ey ey ey VVVVulnerabilitiesulnerabilitiesulnerabilitiesulnerabilities include:
Appearance of CBD's (major town centres)
Council's actions are in-line with community expectations
Management of stormwater and drainage
Informing the community of Council decisions, activities and services
Strategic land use and town planning for Shoalhaven
Promoting economic development (i.e. jobs growth)
All other services are classified as DDDDifferentiatorsifferentiatorsifferentiatorsifferentiators or PPPPotential otential otential otential VVVVulnerabilulnerabilulnerabilulnerabilitiesitiesitiesities based on whether
they are performing above or below average, respectively. Improvement in the performance of
these services will not have a large, significant impact on overall satisfaction with Council.
Table 3.2 (over page) displays quadrant analysis according to service category. Strategic Strategic Strategic Strategic
AdvantagesAdvantagesAdvantagesAdvantages are primarily contained within the resilient, safe and inclusive communitiesresilient, safe and inclusive communitiesresilient, safe and inclusive communitiesresilient, safe and inclusive communities service
category. Council’s Key VulnerabilitiesKey VulnerabilitiesKey VulnerabilitiesKey Vulnerabilities are spread across three service categories.
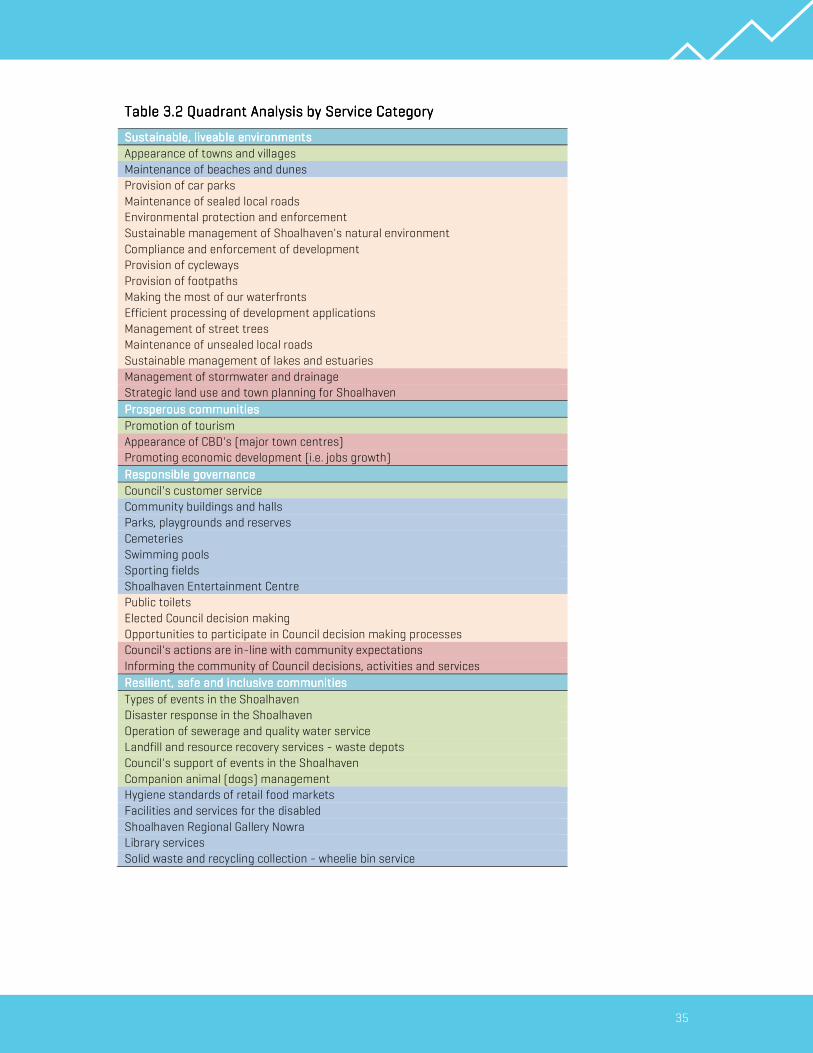
35
Table Table Table Table 3333....2222 Quadrant Analysis by Service CategoryQuadrant Analysis by Service CategoryQuadrant Analysis by Service CategoryQuadrant Analysis by Service Category
Sustainable, liveable environments Sustainable, liveable environments Sustainable, liveable environments Sustainable, liveable environments
Appearance of towns and villages
Maintenance of beaches and dunes
Provision of car parks
Maintenance of sealed local roads
Environmental protection and enforcement
Sustainable management of Shoalhaven's natural environment
Compliance and enforcement of development
Provision of cycleways
Provision of footpaths
Making the most of our waterfronts
Efficient processing of development applications
Management of street trees
Maintenance of unsealed local roads
Sustainable management of lakes and estuaries
Management of stormwater and drainage
Strategic land use and town planning for Shoalhaven
Prosperous communities Prosperous communities Prosperous communities Prosperous communities
Promotion of tourism
Appearance of CBD's (major town centres)
Promoting economic development (i.e. jobs growth)
Responsible governanceResponsible governanceResponsible governanceResponsible governance
Council's customer service
Community buildings and halls
Parks, playgrounds and reserves
Cemeteries
Swimming pools
Sporting fields
Shoalhaven Entertainment Centre
Public toilets
Elected Council decision making
Opportunities to participate in Council decision making processes
Council's actions are in-line with community expectations
Informing the community of Council decisions, activities and services
Resilient, safe and inclusive communitiesResilient, safe and inclusive communitiesResilient, safe and inclusive communitiesResilient, safe and inclusive communities
Types of events in the Shoalhaven
Disaster response in the Shoalhaven
Operation of sewerage and quality water service
Landfill and resource recovery services - waste depots
Council's support of events in the Shoalhaven
Companion animal (dogs) management
Hygiene standards of retail food markets
Facilities and services for the disabled
Shoalhaven Regional Gallery Nowra
Library services
Solid waste and recycling collection - wheelie bin service

36
3.2 Impact of Council perceptions on satisfaction with services
Comparison tests were used to identify statistically significant differences in average satisfaction
between residents based on how often they hear a negative story or comment about Council.
Table 3.3 (continues over page) displays satisfaction results for Council services and facilities
across these groups. Generally, a higher frequency of hearing a negative story about Council aligns
with more negative perceptions of Council services and facilities.
Table Table Table Table 3333....3333 Impact of Council perceptions on satisfaction with services Impact of Council perceptions on satisfaction with services Impact of Council perceptions on satisfaction with services Impact of Council perceptions on satisfaction with services
Sustainable, liveable environments Sustainable, liveable environments Sustainable, liveable environments Sustainable, liveable environments Weekly or Weekly or Weekly or Weekly or
more oftenmore oftenmore oftenmore often MonthlyMonthlyMonthlyMonthly YearlyYearlyYearlyYearly NeverNeverNeverNever
Maintenance of beaches and dunes 3.4 3.6 4.0 3.7
Appearance of towns and villages 3.0 3.5 3.9 4.0
Management of stormwater and
drainage 3.1 3.4 3.6 3.6
Provision of car parks 2.9 3.2 3.5 3.6
Management of street trees 2.8 3.2 3.6 3.5
Sustainable management of
Shoalhaven's natural environment 2.8 3.1 3.5 3.6
Making the most of our waterfronts 2.7 3.0 3.4 3.9
Provision of footpaths 3.0 3.1 3.2 3.4
Sustainable management of lakes and
estuaries 2.8 3.1 3.6 3.2
Environmental protection and
enforcement 2.8 3.0 3.4 3.4
Provision of cycleways 2.8 2.9 3.2 3.4
Compliance and enforcement of
development 2.6 2.9 3.2 3.4
Strategic land use and town planning for
Shoalhaven 2.2 2.9 3.0 3.2
Maintenance of unsealed local roads 2.4 2.6 3.1 2.8
Efficient processing of development
applications 2.0 2.6 2.8 3.4
Maintenance of sealed local roads 2.2 2.5 2.7 2.8
Prosperous communities Prosperous communities Prosperous communities Prosperous communities Weekly or Weekly or Weekly or Weekly or
more oftenmore oftenmore oftenmore often MonthlyMonthlyMonthlyMonthly YearlyYearlyYearlyYearly NeverNeverNeverNever
Promotion of tourism 3.6 3.7 3.9 3.8
Appearance of CBD's (major town
centres) 2.6 3.0 3.4 3.8
Promoting economic development (i.e.
jobs growth) 2.6 2.8 3.1 3.0
Statistically significant difference at the 95% confidence level.

37
Responsible governanceResponsible governanceResponsible governanceResponsible governance Weekly or Weekly or Weekly or Weekly or
more oftenmore oftenmore oftenmore often MonthlyMonthlyMonthlyMonthly YearlyYearlyYearlyYearly NeverNeverNeverNever
Shoalhaven Entertainment Centre 4.2 4.0 4.4 4.1
Swimming pools 4.0 4.2 4.1 4.1
Cemeteries 4.0 3.9 3.9 3.9
Sporting fields 3.7 3.9 4.1 4.2
Community buildings and halls 3.5 3.7 3.8 4.0
Parks, playgrounds and reserves 3.3 3.7 3.9 4.0
Council's customer service 3.2 3.6 4.0 4.0
Public toilets 2.8 3.2 3.4 3.4
Informing the community of Council
decisions, activities and services 2.7 3.1 3.2 3.5
Opportunities to participate in Council
decision making processes 2.4 3.0 3.3 3.3
Elected Council decision making 2.4 2.8 3.1 3.3
Council's actions are in-line with
community expectations 2.2 2.9 3.2 3.1
Resilient, safe and inclusive Resilient, safe and inclusive Resilient, safe and inclusive Resilient, safe and inclusive
communitiescommunitiescommunitiescommunities
Weekly or Weekly or Weekly or Weekly or
more oftenmore oftenmore oftenmore often MonthlyMonthlyMonthlyMonthly YearlyYearlyYearlyYearly NeverNeverNeverNever
Library services 4.2 4.3 4.4 4.4
Operation of sewerage and quality water
service 3.9 4.2 4.5 4.4
Solid waste and recycling collection -
wheelie bin service 4.0 3.9 4.2 4.2
Hygiene standards of retail food markets 3.8 4.1 4.2 4.3
Shoalhaven Regional Gallery Nowra 3.9 3.9 4.2 4.1
Disaster response in the Shoalhaven 3.7 3.8 4.1 4.1
Companion animal (dogs) management 3.4 3.7 3.7 4.1
Landfill and resource recovery services -
waste depots 3.2 3.7 4.0 3.9
Types of events in the Shoalhaven 3.3 3.6 3.9 4.0
Council's support of events in the
Shoalhaven 3.2 3.6 3.7 3.9
Facilities and services for the disabled 3.1 3.5 3.5 4.1
Statistically significant difference at the 95% confidence level.

38
4 CUSTOMER SERVICES
This section of the report covers Shoalhaven City Council’s customer services. It includes recent
contact with Council and satisfaction with customer services. Comparisons are made with previous
results where possible.
4.1 Recent contact with Council
Residents were asked to indicate the last time they contacted Council. There has been an increase
in the proportion of residents that have never contacted Council or cannot recall. This is likely driven
by improvements in the number of younger residents surveyed through more effective age
targeting.
Table Table Table Table 4444....1111 Recent contact with Council Recent contact with Council Recent contact with Council Recent contact with Council
Recent Contact with CouncilRecent Contact with CouncilRecent Contact with CouncilRecent Contact with Council 2018201820182018 2020202020202020
Within the last week 12% 13%
Within the last month 14% 8%
Within the last three months 13% 8%
Within the last six months 10% 7%
Longer than six months ago 23% 19%
Never 10% 15%
Can't recall 18% 30%
Table Table Table Table 4444....2222 Recent contact with Council Recent contact with Council Recent contact with Council Recent contact with Council –––– Subgroup Analysis Subgroup Analysis Subgroup Analysis Subgroup Analysis
SubgroupSubgroupSubgroupSubgroup Significant DifferencesSignificant DifferencesSignificant DifferencesSignificant Differences
GenderGenderGenderGender Nil
AgeAgeAgeAge
- A significantly lower proportion of residents aged 18 to 34 years have
contacted Council within the last monthwithin the last monthwithin the last monthwithin the last month.
- Residents aged 18 to 34 years and 65 plus were more likely say they can’tcan’tcan’tcan’t
recallrecallrecallrecall compared to those aged 35 to 49 years.
Property OwnershipProperty OwnershipProperty OwnershipProperty Ownership
- Property owners were more likely to have contacted Council within the lastwithin the lastwithin the lastwithin the last
weekweekweekweek or within the last six monthswithin the last six monthswithin the last six monthswithin the last six months.
- Residents that do not own property were more likely to have nevernevernevernever contacted
Council.

39
4.2 Satisfaction with customer services
Residents who had contacted Council were asked to rate their satisfaction with two aspects of
customer services using a five-point scale.
Average satisfaction with both aspects of customer services recorded statistically significant
declines since 2018.
Figure Figure Figure Figure 4444....1111 Satisfaction with customer services Satisfaction with customer services Satisfaction with customer services Satisfaction with customer services
Base: Have contacted Council (n=220)
Table Table Table Table 4444....3333 Satisfaction with customer services Satisfaction with customer services Satisfaction with customer services Satisfaction with customer services –––– Internal BenchmarksInternal BenchmarksInternal BenchmarksInternal Benchmarks
Satisfaction with customer servicesSatisfaction with customer servicesSatisfaction with customer servicesSatisfaction with customer services 2018201820182018 2020202020202020 Significant Significant Significant Significant
change change change change
since 2018since 2018since 2018since 2018
The timeliness in Council responding to your
request 3.8 3.5
The overall performance of Council in dealing
with your request 3.7 3.5
10%
9%
18%
21%
22%
16%
49%
54%
The timeliness in Council responding to your
request
The overall performance of Council in dealing with
your request
Can't say Dissatisfied (1-2) Neutral (3) Satisfied (4-5)
3.5
3.5
AverageAverageAverageAverage

40
5 COMMUNITY LIVING
This section of the report covers liveability in Shoalhaven. It covers perceptions of Shoalhaven as a
liveable and vibrant city as well as analysis of recent walking activity of residents.
5.1 Support active and healthy communities
Residents were asked to rate their agreement with two statements relating to Shoalhaven as a city
using a five-point scale where 1 meant ‘strongly disagree’ and 5 meant ‘strongly agree’.
Most residents (81%) agree Shoalhaven is a liveable cityShoalhaven is a liveable cityShoalhaven is a liveable cityShoalhaven is a liveable city. This statement recorded a high average
agreement rating of 4.1. Fewer residents agreed Shoalhaven is a vibrant cityShoalhaven is a vibrant cityShoalhaven is a vibrant cityShoalhaven is a vibrant city (48%).
Figure Figure Figure Figure 5555....1111 Support active and healthy communities Support active and healthy communities Support active and healthy communities Support active and healthy communities
Base: All respondents (n=401)
Table Table Table Table 5555....1111 Support active and healthy communities Support active and healthy communities Support active and healthy communities Support active and healthy communities –––– Subgroup AnalysisSubgroup AnalysisSubgroup AnalysisSubgroup Analysis
SubgroupSubgroupSubgroupSubgroup Significant DifferencesSignificant DifferencesSignificant DifferencesSignificant Differences
GenderGenderGenderGender Nil
AgeAgeAgeAge
- Residents aged 65 plus years agreed that Shoalhaven is a liveable cityShoalhaven is a liveable cityShoalhaven is a liveable cityShoalhaven is a liveable city
significantly more than residents aged 50 to 64 years.
- Residents aged 65 plus years agreed that Shoalhaven is a vibrant cityShoalhaven is a vibrant cityShoalhaven is a vibrant cityShoalhaven is a vibrant city
significantly more than residents aged 35 to 49 years.
ProProProProperty Ownershipperty Ownershipperty Ownershipperty Ownership Nil
Reasons for dissatisfactionReasons for dissatisfactionReasons for dissatisfactionReasons for dissatisfaction
All open-ended responses have been provided to Council in a separate report.
Shoalhaven is a liveable city (n=13)Shoalhaven is a liveable city (n=13)Shoalhaven is a liveable city (n=13)Shoalhaven is a liveable city (n=13)
The thirteen responses provided covered topics such as transport, crime and employment
opportunities.
5%
18%
14%
34%
81%
48%
Shoalhaven is a liveable city
Shoalhaven is a vibrant city
Can't say Disagree (1-2) Neutral (3) Agree (4-5)
4.1
3.4
AverageAverageAverageAverage

41
5.2 Walking
Residents were asked how many times they walked continuously for at least ten minutes for
recreation, exercise or transport in the past week.
In total, 83 percent of residents walked for recreation, exercise or transport at least once in the
week prior to being surveyed.
Forty percent (40%) of residents have walked more than five timesmore than five timesmore than five timesmore than five times. Fourteen percent (14%)
indicated they have not walked for at least ten minutes for these purposes at all in the week prior to
being interviewed.
Figure Figure Figure Figure 5555....2222 Frequency of walking for recreation, exercise or transportFrequency of walking for recreation, exercise or transportFrequency of walking for recreation, exercise or transportFrequency of walking for recreation, exercise or transport
All respondents (n=401)
Table Table Table Table 5555....2222 Frequency of walking for recreation, exercise or transport Frequency of walking for recreation, exercise or transport Frequency of walking for recreation, exercise or transport Frequency of walking for recreation, exercise or transport –––– Subgroup AnalysisSubgroup AnalysisSubgroup AnalysisSubgroup Analysis
SubgroupSubgroupSubgroupSubgroup Significant DifferencesSignificant DifferencesSignificant DifferencesSignificant Differences
GenderGenderGenderGender - A significantly higher proportion of female residents walked five timesfive timesfive timesfive times.
AgeAgeAgeAge - A significantly lower proportion of residents aged 18 to 34 years walked threethreethreethree
timestimestimestimes.
Property OwnershipProperty OwnershipProperty OwnershipProperty Ownership - A significantly higher proportion of residents that own property walked threethreethreethree
timestimestimestimes.
14%
10%
8%
9%
6%
11%
40%
3%
None
Once
Twice
Three times
Four times
Five times
More than 5 times
N/A
Median Frequency Median Frequency Median Frequency Median Frequency
5 times5 times5 times5 times

42
Residents who walked continuously for ten minutes for recreation, exercise or transport at least
once were asked to indicate the total time spent walking in the past week.
Most residents (59%) walked for over two hoursover two hoursover two hoursover two hours in the week before being interviewed. A further
18 percent walked for 1111----2 hours2 hours2 hours2 hours.
Figure Figure Figure Figure 5555....3333 Total time spent walking in the last weekTotal time spent walking in the last weekTotal time spent walking in the last weekTotal time spent walking in the last week
Base: Walked for at least 10 minutes at least once in the past week (n=336)
Table Table Table Table 5555....3333 Total time spent walking in the last weekTotal time spent walking in the last weekTotal time spent walking in the last weekTotal time spent walking in the last week –––– Subgroup Analysis Subgroup Analysis Subgroup Analysis Subgroup Analysis
SubgroupSubgroupSubgroupSubgroup Significant Significant Significant Significant DifferencesDifferencesDifferencesDifferences
GenderGenderGenderGender - A significantly higher proportion of male residents walked for 21212121----30 minutes30 minutes30 minutes30 minutes.
AgeAgeAgeAge Nil
Property OwnershipProperty OwnershipProperty OwnershipProperty Ownership Nil
6%
4%
2%
3%
7%
18%
59%
10-20 minutes
21-30 minutes
31-40 minutes
41-50 minutes
51-60 minutes
1-2 hours
Over 2 hours
Average Average Average Average TimeTimeTimeTime
1.5 hours1.5 hours1.5 hours1.5 hours

43
Residents who walked continuously for ten minutes for recreation, exercise or transport were asked
to indicate the purpose of their walks. They were able to select multiple responses.
By far the most common purpose for walking is exerciseexerciseexerciseexercise (80%). There are no statistically
significant differences in results across subgroups indicating that this proportion is consistent
across a wide demographic profile.
The next most common reasons for walking are walking to shopswalking to shopswalking to shopswalking to shops (24%), walking to the workplacewalking to the workplacewalking to the workplacewalking to the workplace
(11%) and walking the dogwalking the dogwalking the dogwalking the dog (9%).
Figure Figure Figure Figure 5555....4444 Purpose of walksPurpose of walksPurpose of walksPurpose of walks
Base: Walked for at least 10 minutes at least once in the past week (n=336)
Note: Respondents could select multiple responses thus percentages do not sum to 100%.
Table Table Table Table 5555....4444 Purpose of walks Purpose of walks Purpose of walks Purpose of walks –––– Subgroup Analysis Subgroup Analysis Subgroup Analysis Subgroup Analysis
SubgroupSubgroupSubgroupSubgroup Significant DifferencesSignificant DifferencesSignificant DifferencesSignificant Differences
GenderGenderGenderGender - A significantly higher proportion of male residents walked for workworkworkwork.
AgeAgeAgeAge
- A significantly higher proportion of residents aged 18 to 49 years walked to
their workplaceworkplaceworkplaceworkplace compared to those aged 65 plus years.
- A significantly higher proportion of residents aged 35 to 40 years walkedwalkedwalkedwalked
children to schoolchildren to schoolchildren to schoolchildren to school compared to those aged 65 plus years.
Property OwnershipProperty OwnershipProperty OwnershipProperty Ownership Nil
80%
24%
11%
9%
5%
3%
2%
1%
0.2%
8%
0.4%
Exercise
Walking to shops
Walking to workplace
Walking the dog
Walking children to school
Work
Walking children to park
Gardening
Walking to public transport
Other
None of the above

44
6 COMMUNITY ENGAGEMENT PROJECTS & INITIATIVES
This section of the report covers the perceptions of residents regarding Shoalhaven City Council’s
community engagement.
Thirty-four percent (34%) of residents are aware of Council-run projects or initiatives in the
Shoalhaven conducted over the last 12 months. This result has declined 4% pts since 2018 (38%).
FFFFiiiigggguuuurrrreeee 6666....1111 AAAAwwwwaaaarrrreeeennnneeeessssssss ooooffff ccccoooommmmmmmmuuuunnnniiiittttyyyy eeeennnnggggaaaaggggeeeemmmmeeeennnntttt pppprrrroooojjjjeeeeccccttttssss
Base: All respondents (n=401)
Table Table Table Table 6666....1111 Awareness of community engagement projects Awareness of community engagement projects Awareness of community engagement projects Awareness of community engagement projects –––– Subgroup Analysis Subgroup Analysis Subgroup Analysis Subgroup Analysis
SubgroupSubgroupSubgroupSubgroup Significant DifferencSignificant DifferencSignificant DifferencSignificant Differenceseseses
GenderGenderGenderGender Nil
AgeAgeAgeAge Nil
Property OwnershipProperty OwnershipProperty OwnershipProperty Ownership - A significantly higher proportion of residents that own property were aware of
community engagement projects or initiatives (39%).
Aware
34%Not aware
56%
Don't know/Can't say
10%
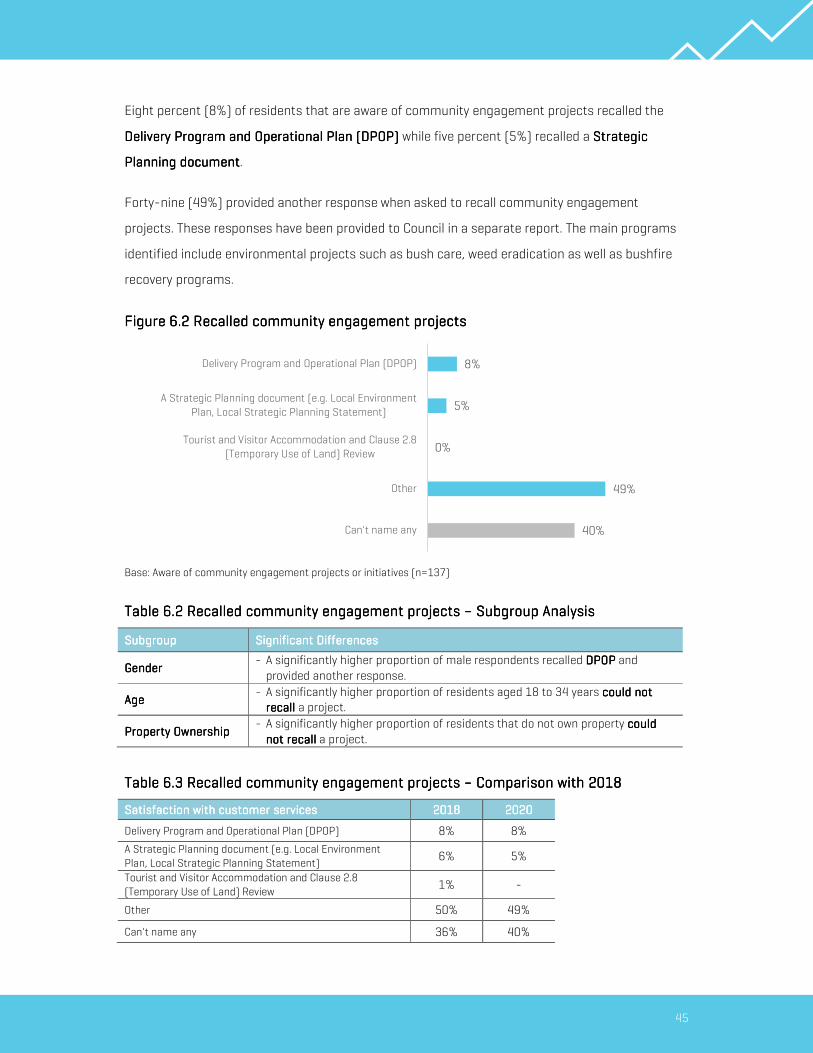
45
Eight percent (8%) of residents that are aware of community engagement projects recalled the
Delivery Program and Operational Plan (DPOP)Delivery Program and Operational Plan (DPOP)Delivery Program and Operational Plan (DPOP)Delivery Program and Operational Plan (DPOP) while five percent (5%) recalled a Strategic Strategic Strategic Strategic
Planning documentPlanning documentPlanning documentPlanning document.
Forty-nine (49%) provided another response when asked to recall community engagement
projects. These responses have been provided to Council in a separate report. The main programs
identified include environmental projects such as bush care, weed eradication as well as bushfire
recovery programs.
Figure Figure Figure Figure 6666....2222 Recalled community engagement projectsRecalled community engagement projectsRecalled community engagement projectsRecalled community engagement projects
Base: Aware of community engagement projects or initiatives (n=137)
Table Table Table Table 6666....2222 Recalled community engagement projects Recalled community engagement projects Recalled community engagement projects Recalled community engagement projects –––– Subgroup Analysis Subgroup Analysis Subgroup Analysis Subgroup Analysis
SubgroupSubgroupSubgroupSubgroup Significant DifferencesSignificant DifferencesSignificant DifferencesSignificant Differences
GenderGenderGenderGender - A significantly higher proportion of male respondents recalled DPOPDPOPDPOPDPOP and
provided another response.
AgeAgeAgeAge - A significantly higher proportion of residents aged 18 to 34 years could not could not could not could not
recallrecallrecallrecall a project.
Property OwnershipProperty OwnershipProperty OwnershipProperty Ownership - A significantly higher proportion of residents that do not own property could could could could
not recallnot recallnot recallnot recall a project.
Table Table Table Table 6666....3333 Recalled community engagement projects Recalled community engagement projects Recalled community engagement projects Recalled community engagement projects –––– Comparison with 2018Comparison with 2018Comparison with 2018Comparison with 2018
Satisfaction with customer servicesSatisfaction with customer servicesSatisfaction with customer servicesSatisfaction with customer services 2018201820182018 2020202020202020
Delivery Program and Operational Plan (DPOP) 8% 8%
A Strategic Planning document (e.g. Local Environment
Plan, Local Strategic Planning Statement) 6% 5%
Tourist and Visitor Accommodation and Clause 2.8
(Temporary Use of Land) Review 1% -
Other 50% 49%
Can't name any 36% 40%
8%
5%
0%
49%
40%
Delivery Program and Operational Plan (DPOP)
A Strategic Planning document (e.g. Local Environment
Plan, Local Strategic Planning Statement)
Tourist and Visitor Accommodation and Clause 2.8
(Temporary Use of Land) Review
Other
Can't name any

46
Residents aware of community engagement projects were also asked whether they had actively
participated in the projects or initiatives.
Twenty-six percent (26%) of these residents actively participated in community engagement
projects. This result is in-line with 2018 (25%).
Figure Figure Figure Figure 6666....3333 Participation in community engagement projects Participation in community engagement projects Participation in community engagement projects Participation in community engagement projects
Base: Aware of community engagement projects or initiatives (n=137)
Table Table Table Table 6666....4444 Participation inParticipation inParticipation inParticipation in community engagement projects community engagement projects community engagement projects community engagement projects –––– Subgroup Analysis Subgroup Analysis Subgroup Analysis Subgroup Analysis
SubgroupSubgroupSubgroupSubgroup Significant DifferencesSignificant DifferencesSignificant DifferencesSignificant Differences
GenderGenderGenderGender Nil
AgeAgeAgeAge - A significantly higher proportion of residents aged 50 plus years participated
compared to those aged 18 to 34 years.
Property OwnershipProperty OwnershipProperty OwnershipProperty Ownership Nil
Participated
26%Did not
participate
66%Don't know/Can't say
8%

47
7 COMMUNICATION & ENGAGEMENT
This section of the report covers communication and engagement with Shoalhaven City Council. It
includes preferences regarding the methods of receiving information from Council and methods of
engaging with Council decision making.
7.1 Methods of receiving information
Residents were asked to rate their likelihood of using methods to receive information and
communication from Council using a five-point scale where 1 meant ‘not at all likely’ and 5 meant
‘very likely’.
Over half (55%) of Shoalhaven residents are likely to receive information from Council through
direct maildirect maildirect maildirect mail (3.4). This is following by email (including newsletters)email (including newsletters)email (including newsletters)email (including newsletters) (3.2) and radioradioradioradio (3.1).
Residents are least likely to receive information through videovideovideovideo (1.8), community noticeboardscommunity noticeboardscommunity noticeboardscommunity noticeboards
(2.2) and Council’s WebsiteCouncil’s WebsiteCouncil’s WebsiteCouncil’s Website (2.3).
Figure Figure Figure Figure 7777....1111 Likelihood of using methods to receive information Likelihood of using methods to receive information Likelihood of using methods to receive information Likelihood of using methods to receive information
Base: All respondents (n=401)
6%
4%
30%
32%
34%
40%
44%
59%
53%
61%
75%
14%
15%
18%
21%
16%
13%
18%
17%
11%
55%
50%
47%
38%
38%
25%
22%
21%
10%
Direct mail
Email (including Newsletters)
Radio
Television
Social Media (e.g. Facebook, Twitter, LinkedIn)
Newspapers
Council's Website (including 'Get Involved' website)
Community Noticeboards (e.g. Library, Facilities,
CBD)
Video
Can't say Not likely (1-2) Neutral (3) Likely (4-5)
3.4
3.2
3.1
2.9
2.8
2.3
2.3
2.2
1.8
AverageAverageAverageAverage

48
Most statistically significant differences in results are based on age. Residents aged 65 plus years
are more likely to use direct maildirect maildirect maildirect mail and less likely to use electronic methods to receive information.
Table Table Table Table 7777....1111 Likelihood of using methods to receive information Likelihood of using methods to receive information Likelihood of using methods to receive information Likelihood of using methods to receive information –––– Subgroup AnalysisSubgroup AnalysisSubgroup AnalysisSubgroup Analysis
SubgroupSubgroupSubgroupSubgroup Significant DifferencesSignificant DifferencesSignificant DifferencesSignificant Differences
GenderGenderGenderGender Nil
AgeAgeAgeAge
- Residents aged 65 plus years are significantly more likely to use direct maildirect maildirect maildirect mail
compared to all other residents.
- Residents aged 65 plus years are significant less likely to use the following
electronic methods compared to all other residents:
- EEEEmail (includinmail (includinmail (includinmail (including Newsletters)g Newsletters)g Newsletters)g Newsletters)
- SSSSocial mediaocial mediaocial mediaocial media
- Council’s Website (including ‘Get Involved’ website)Council’s Website (including ‘Get Involved’ website)Council’s Website (including ‘Get Involved’ website)Council’s Website (including ‘Get Involved’ website)
- Residents aged 65 plus years are significantly more likely to use newspapersnewspapersnewspapersnewspapers
compared to those aged 35 to 49 years.
- Residents aged 18 to 49 years are more likely to use videovideovideovideo compared to those
aged 50 years and over.
Property OwnershipProperty OwnershipProperty OwnershipProperty Ownership - Residents that do not own property are more likely to use social mediasocial mediasocial mediasocial media and
videovideovideovideo compared to property owners.

49
Residents were asked to indicate which option was their most preferred method of receiving
information and communication from Council.
The most preferred method of receiving information from Council is email (including newsletters)email (including newsletters)email (including newsletters)email (including newsletters),
with one in three residents (32%) preferring this method. This is followed by direct maildirect maildirect maildirect mail (26%) and
social media (e.g. Facebook, Twitter, LinkedIn)social media (e.g. Facebook, Twitter, LinkedIn)social media (e.g. Facebook, Twitter, LinkedIn)social media (e.g. Facebook, Twitter, LinkedIn) (14%).
Figure Figure Figure Figure 7777....2222 Most preferred method of receiving informationMost preferred method of receiving informationMost preferred method of receiving informationMost preferred method of receiving information
All respondents (n=401)
Table Table Table Table 7777....2222 Most preferred method of receiving information Most preferred method of receiving information Most preferred method of receiving information Most preferred method of receiving information –––– Subgroup Analysis Subgroup Analysis Subgroup Analysis Subgroup Analysis
SubgroupSubgroupSubgroupSubgroup Significant DifferencesSignificant DifferencesSignificant DifferencesSignificant Differences
GenderGenderGenderGender Nil
AgeAgeAgeAge
- A significantly higher proportion of residents aged 65 plus years prefer directdirectdirectdirect
mailmailmailmail.
- Residents aged 18 to 49 years prefer social mediasocial mediasocial mediasocial media significantly more than
residents aged 50 years and over.
- Residents aged 50 to 64 years prefer radioradioradioradio significantly more than residents
aged 65 plus years.
Property OwnershipProperty OwnershipProperty OwnershipProperty Ownership
- A significantly higher proportion of residents that own property prefer emailemailemailemail
(including newsletters)(including newsletters)(including newsletters)(including newsletters) and direct maildirect maildirect maildirect mail.
- A significantly higher proportion of residents that do not own property prefer
social media and social media and social media and social media and radioradioradioradio....
32%
26%
14%
12%
6%
4%
3%
1%
0%
2%
1%
Email (including Newsletters)
Direct mail
Social Media
Radio
Councils Website (inc. Get Involved website)
Television
Newspapers
Community Noticeboards
Video
Other
I don't know
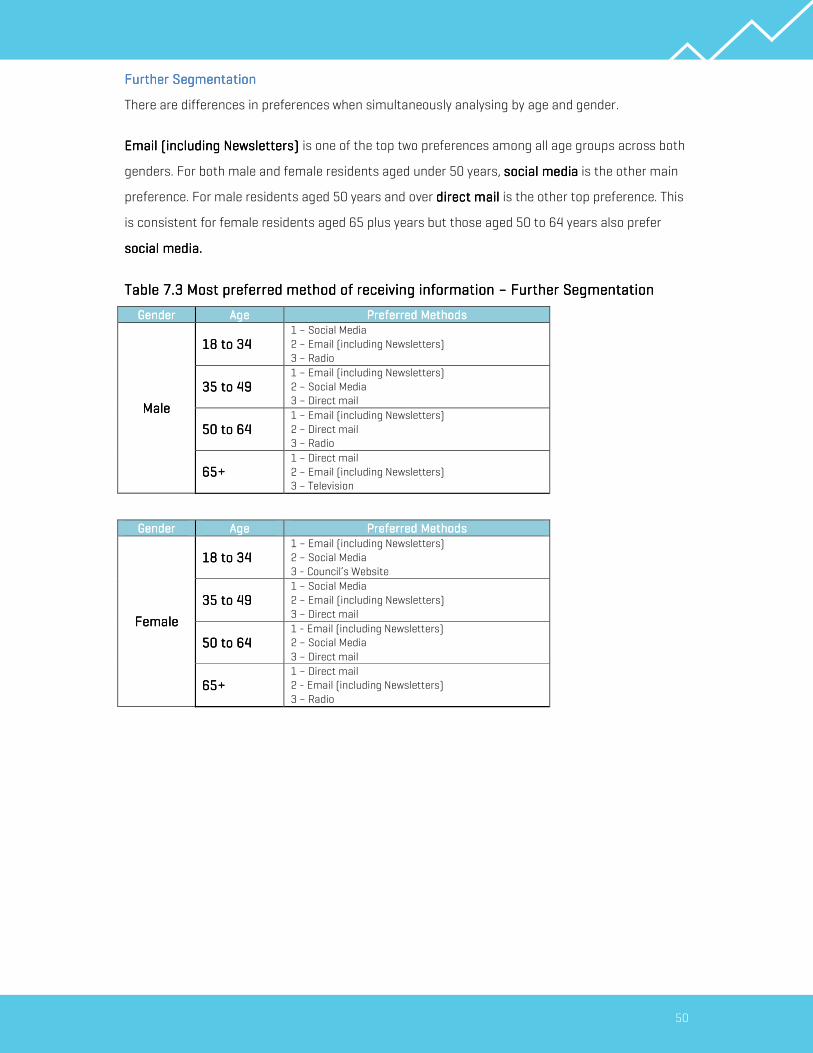
50
Further SegmentationFurther SegmentationFurther SegmentationFurther Segmentation
There are differences in preferences when simultaneously analysing by age and gender.
Email (including Newsletters) Email (including Newsletters) Email (including Newsletters) Email (including Newsletters) is one of the top two preferences among all age groups across both
genders. For both male and female residents aged under 50 years, socialsocialsocialsocial mediamediamediamedia is the other main
preference. For male residents aged 50 years and over direct maildirect maildirect maildirect mail is the other top preference. This
is consistent for female residents aged 65 plus years but those aged 50 to 64 years also prefer
social media. social media. social media. social media.
Table Table Table Table 7777....3333 Most preferred method of receiving information Most preferred method of receiving information Most preferred method of receiving information Most preferred method of receiving information –––– Further Segmentation Further Segmentation Further Segmentation Further Segmentation
GenderGenderGenderGender AgeAgeAgeAge Preferred MethodsPreferred MethodsPreferred MethodsPreferred Methods
MMMMaaaalelelele
18 to 3418 to 3418 to 3418 to 34 1 – Social Media
2 – Email (including Newsletters)
3 – Radio
35 to 4935 to 4935 to 4935 to 49 1 – Email (including Newsletters)
2 – Social Media
3 – Direct mail
50 to 6450 to 6450 to 6450 to 64 1 – Email (including Newsletters)
2 – Direct mail
3 – Radio
65+65+65+65+ 1 – Direct mail
2 – Email (including Newsletters)
3 – Television
GenderGenderGenderGender AgeAgeAgeAge Preferred MethodsPreferred MethodsPreferred MethodsPreferred Methods
FemaleFemaleFemaleFemale
18 to 3418 to 3418 to 3418 to 34 1 – Email (including Newsletters)
2 – Social Media
3 - Council’s Website
35 to 4935 to 4935 to 4935 to 49 1 – Social Media
2 – Email (including Newsletters)
3 – Direct mail
50 to 6450 to 6450 to 6450 to 64 1 - Email (including Newsletters)
2 – Social Media
3 – Direct mail
65+65+65+65+ 1 – Direct mail
2 - Email (including Newsletters)
3 – Radio

51
7.2 Methods of engaging with Council decision making
Residents were asked to rate their likelihood of using methods to engage with and ‘have their say’
on Council decision making using a five-point scale where 1 meant ‘not at all likely’ and 5 meant
‘very likely’.
The method with the highest average likelihood rating is speak with a Customer Service personspeak with a Customer Service personspeak with a Customer Service personspeak with a Customer Service person
(3.3). The method with the highest proportion of residents likely to use it (4 or 5) is emailemailemailemail (48%).
Residents are least likely to use the live chat function on Council’s websitelive chat function on Council’s websitelive chat function on Council’s websitelive chat function on Council’s website (1.9) and face to face face to face face to face face to face
or or or or vvvvirtual irtual irtual irtual mmmmeetingseetingseetingseetings (2.5).
Figure Figure Figure Figure 7777....3333 Likelihood of using methods to Likelihood of using methods to Likelihood of using methods to Likelihood of using methods to engage with Council engage with Council engage with Council engage with Council
Base: All respondents (n=401)
Table Table Table Table 7777....4444 Likelihood of using methods Likelihood of using methods Likelihood of using methods Likelihood of using methods to to to to engage with Councilengage with Councilengage with Councilengage with Council –––– Subgroup AnalysisSubgroup AnalysisSubgroup AnalysisSubgroup Analysis
SubgroupSubgroupSubgroupSubgroup Significant DifferencesSignificant DifferencesSignificant DifferencesSignificant Differences
GenderGenderGenderGender - Female residents are significantly more likely to use emailemailemailemail.
AgeAgeAgeAge
- Residents aged 35 to 64 years are significantly more likely to use emailemailemailemail
compared to other residents.
- Residents aged 65 plus years are significantly less likely to use online surveysonline surveysonline surveysonline surveys
and the live chat function on Council’s website live chat function on Council’s website live chat function on Council’s website live chat function on Council’s website compared to other residents.
- Residents aged 65 plus years are significantly more likely to use direct maildirect maildirect maildirect mail
compared to other residents.
Property OwnershipProperty OwnershipProperty OwnershipProperty Ownership Nil
3%
3%
4%
3%
4%
5%
20%
29%
35%
41%
49%
73%
33%
20%
21%
17%
22%
9%
44%
48%
41%
39%
25%
13%
Speak with a Customer Service person
Online surveys
Direct mail
Face to Face or Virtual Meetings
Use live chat function on Council's website
Can't say Not likely (1-2) Neutral (3) Likely (4-5)
3.3
3.2
3.0
2.9
2.5
1.9
AverageAverageAverageAverage

52
Residents were asked to indicate which option was their most preferred method of receiving
engaging with Council decision making.
The most preferred method of engaging with Council decision making is via emailemailemailemail (32%). This is
followed by speaking with a Customer Service person speaking with a Customer Service person speaking with a Customer Service person speaking with a Customer Service person (18%) and direct maildirect maildirect maildirect mail (17%).
Figure Figure Figure Figure 7777....4444 Most preferred method of Most preferred method of Most preferred method of Most preferred method of engagengagengagengaging ing ing ing with Councilwith Councilwith Councilwith Council
All respondents (n=401)
Table Table Table Table 7777....5555 Most preferred method of Most preferred method of Most preferred method of Most preferred method of engagengagengagengaging ing ing ing with Councilwith Councilwith Councilwith Council –––– Subgroup Analysis Subgroup Analysis Subgroup Analysis Subgroup Analysis
SubgroupSubgroupSubgroupSubgroup Significant DifferenSignificant DifferenSignificant DifferenSignificant Differencescescesces
GenderGenderGenderGender
- A significantly higher proportion of female residents prefer direct maildirect maildirect maildirect mail.
- A significantly higher proportion of male residents prefer face to face or virtualface to face or virtualface to face or virtualface to face or virtual
meetingsmeetingsmeetingsmeetings.
AgeAgeAgeAge
- A significantly higher proportion of residents aged 65 plus years prefer directdirectdirectdirect
mailmailmailmail.
- A significantly higher proportion of residents aged 35 to 49 years prefer onlineonlineonlineonline
surveyssurveyssurveyssurveys compared to those aged 65 plus years.
Property OwnershipProperty OwnershipProperty OwnershipProperty Ownership Nil
32%
18%
17%
12%
9%
4%
3%
5%
Speak with a Customer Service person
Direct mail
Face to Face or Virtual Meetings
Online surveys
Use live chat function on Councils website
Other
I don't know

53
Further SegmFurther SegmFurther SegmFurther Segmentationentationentationentation
There are differences in preferences when simultaneously analysing by age and gender.
EmailEmailEmailEmail is the top preference among residents aged 18 to 64 years across both genders. Male
residents aged 65 plus years and female residents aged 18 to 34 years and 65 plus years also
prefer direct maildirect maildirect maildirect mail. One of the top three preferences among all groups is speakspeakspeakspeaking with a Customer ing with a Customer ing with a Customer ing with a Customer
Service personService personService personService person.
Table Table Table Table 7777....6666 Most preferred method of Most preferred method of Most preferred method of Most preferred method of engagengagengagengaging ing ing ing with Councilwith Councilwith Councilwith Council –––– Further Segmentation Further Segmentation Further Segmentation Further Segmentation
GenderGenderGenderGender AgeAgeAgeAge Preferred MethodsPreferred MethodsPreferred MethodsPreferred Methods
MMMMaaaalelelele
18 to 3418 to 3418 to 3418 to 34 1 – Email
2 – Speak with a Customer Service person
3 – Face to Face or Virtual Meetings
35 to 4935 to 4935 to 4935 to 49 1 – Email
2 – Speak with a Customer Service person
3 – Face to Face or Virtual Meetings
50 to 6450 to 6450 to 6450 to 64 1 – Email
2 – Speak with a Customer Service person
3 – Face to Face or Virtual Meetings
65+65+65+65+ 1 – Direct mail
2 – Email
3 – Speak with a Customer Service person
GenderGenderGenderGender AgeAgeAgeAge Preferred MethodsPreferred MethodsPreferred MethodsPreferred Methods
FemaleFemaleFemaleFemale
18 to 3418 to 3418 to 3418 to 34 1 – Email
2 – Direct mail
3 - Speak with a Customer Service person
35 to 4935 to 4935 to 4935 to 49 1 – Email
2 – Online surveys
3 – Speak with a Customer Service person
50 to 6450 to 6450 to 6450 to 64 1 – Email
2 – Speak with a Customer Service person
3 – Online surveys
65+65+65+65+ 1 – Direct mail
2 – Email
3 – Speak with a Customer Service person

54
8 HAPPINESS INDEX
Residents were asked to rate their satisfaction with aspects of their personal wellbeing using a
five-point scale where 1 meant ‘very dissatisfied’ and 5 meant ‘very satisfied’.
All attributes recorded high average satisfaction ratings. Residents are most satisfied with their
personal relatpersonal relatpersonal relatpersonal relationshipsionshipsionshipsionships (4.4).
Figure Figure Figure Figure 8888....1111 Happiness IndexHappiness IndexHappiness IndexHappiness Index
Base: All respondents (n=401)
Table Table Table Table 8888....1111 Happiness Index Happiness Index Happiness Index Happiness Index –––– Subgroup Analysis Subgroup Analysis Subgroup Analysis Subgroup Analysis
SubgroupSubgroupSubgroupSubgroup Significant DifferencesSignificant DifferencesSignificant DifferencesSignificant Differences
GenderGenderGenderGender
- Female residents are more satisfied with the following attributes:
- Your life as a wholeYour life as a wholeYour life as a wholeYour life as a whole
- Feeling part of your communityFeeling part of your communityFeeling part of your communityFeeling part of your community
AgeAgeAgeAge
- Residents aged 65 plus years are more satisfied with the following attributes
compared to those aged 65 plus years:
- Your personal relationships
- How safe you feel
- Your standard of living
- Your life as a whole
- Residents aged 18 to 34 years and 65 plus years are more satisfied with youryouryouryour
future secfuture secfuture secfuture security.urity.urity.urity.
- Residents aged 18 to 34 years are more satisfied with your healthyour healthyour healthyour health than
residents aged 65 plus years.
- Residents aged 65 plus years are more satisfied with feeling part of yourfeeling part of yourfeeling part of yourfeeling part of your
communitycommunitycommunitycommunity than residents aged 18 to 34 years.
Property OwnershipProperty OwnershipProperty OwnershipProperty Ownership - Property are more satisfied with your life as a wholeyour life as a wholeyour life as a wholeyour life as a whole.
2%
2%
1%
2%
6%
5%
7%
8%
7%
12%
10%
12%
15%
16%
12%
13%
91%
85%
89%
86%
76%
79%
80%
78%
Your personal relationships
How safe you feel
Your standard of living
Your life as a whole
Your future security
What you are currently achieving in life
Your health
Feeling part of your community
Can't say Dissatisfied (1-2) Neutral (3) Satisfied (4-5)
4.4
4.3
4.3
4.3
4.1
4.1
4.1
4.1
AverageAverageAverageAverage

55
Average satisfaction with seven of the eight aspect of personal wellbeing are in-line with 2018
results.
There has been a statistically significant increase in average satisfaction with feeling part of your feeling part of your feeling part of your feeling part of your
communitycommunitycommunitycommunity (up 0.2 pts to 4.1).
The Personal Wellbeing IndexPersonal Wellbeing IndexPersonal Wellbeing IndexPersonal Wellbeing Index for residents of Shoalhaven City Council has increased 1.5 pts since
2018 and remains above the national standard (75.7).
Table Table Table Table 8888....2222 Happiness Index Happiness Index Happiness Index Happiness Index –––– Internal Benchmarks Internal Benchmarks Internal Benchmarks Internal Benchmarks
Happiness IndexHappiness IndexHappiness IndexHappiness Index 2014201420142014 2015201520152015 2016201620162016 2017201720172017 2018201820182018 2020202020202020 Significant Significant Significant Significant
change change change change
since 2018since 2018since 2018since 2018
Your personal
relationships 4.3 4.3 4.4 4.4 4.4 4.4
How safe you feel 4.2 4.2 4.3 4.3 4.2 4.3
Your standard of living 4.2 4.3 4.4 4.4 4.3 4.3
Your life as a whole 4.2 4.3 4.3 4.3 4.3 4.3
Your future security 3.9 3.9 4.0 4.0 4.0 4.1
What you are currently
achieving in life 4.0 4.0 4.1 4.1 4.1 4.1
Your health 3.9 4.0 4.0 4.0 4.0 4.1
Feeling part of your
community 4.0 4.0 4.1 4.1 3.9 4.1
Personal Wellbeing Personal Wellbeing Personal Wellbeing Personal Wellbeing
IndexIndexIndexIndex 81.581.581.581.5 82.582.582.582.5 83.683.683.683.6 84.184.184.184.1 83.183.183.183.1 84.684.684.684.6 -

56
Speaking to a neighbour Speaking to a neighbour Speaking to a neighbour Speaking to a neighbour
Residents were asked how often they speak to a neighbour or someone in their street.
Eighty-four percent (84%) of residents speak to a neighbour weeklyweeklyweeklyweekly. Results are generally in-line
with 2018.
Figure Figure Figure Figure 8888....2222 Frequency of speaking to a neighbour or someone in the street Frequency of speaking to a neighbour or someone in the street Frequency of speaking to a neighbour or someone in the street Frequency of speaking to a neighbour or someone in the street
All respondents (n=401)
Table Table Table Table 8888....3333 Frequency of speaking to a neighbour Frequency of speaking to a neighbour Frequency of speaking to a neighbour Frequency of speaking to a neighbour –––– Subgroup Analysis Subgroup Analysis Subgroup Analysis Subgroup Analysis
SubgroupSubgroupSubgroupSubgroup Significant DifferencesSignificant DifferencesSignificant DifferencesSignificant Differences
GenderGenderGenderGender Nil
AgeAgeAgeAge - A significantly higher proportion of residents aged 65 plus years speak to a
neighbour weeklyweeklyweeklyweekly.
Property OwnershipProperty OwnershipProperty OwnershipProperty Ownership - A significantly higher proportion of residents that do not own property speak to
a neighbour fortnightlyfortnightlyfortnightlyfortnightly, at least once a yearat least once a yearat least once a yearat least once a year or nevernevernevernever.
Table Table Table Table 8888....4444 Frequency of speaking to a neighbour Frequency of speaking to a neighbour Frequency of speaking to a neighbour Frequency of speaking to a neighbour –––– Comparison with 2018Comparison with 2018Comparison with 2018Comparison with 2018
FrequencyFrequencyFrequencyFrequency 2018201820182018 2020202020202020
Weekly 83% 84%
Fortnightly 5% 6%
Monthly 7% 5%
Every six months 1% 1%
At least once a year 2% 1%
Never 2% 3%
84%
6%
5%
1%
1%
3%
Weekly
Fortnightly
Monthly
Every six months
At least once a year
Never
Monthly AverageMonthly AverageMonthly AverageMonthly Average
3.83.83.83.8

57
APPENDIX 1 – SUBGROUP ANALYSIS
Overall SatisfactionOverall SatisfactionOverall SatisfactionOverall Satisfaction
Overall satisfaction with the Overall satisfaction with the Overall satisfaction with the Overall satisfaction with the performance of performance of performance of performance of Shoalhaven CityShoalhaven CityShoalhaven CityShoalhaven City CouncilCouncilCouncilCouncil
Overall SatisfactionOverall SatisfactionOverall SatisfactionOverall Satisfaction TotalTotalTotalTotal
GenderGenderGenderGender AgeAgeAgeAge
MaleMaleMaleMale FemaleFemaleFemaleFemale 18 to 3418 to 3418 to 3418 to 34 35 to 4935 to 4935 to 4935 to 49 50 to 6450 to 6450 to 6450 to 64 65+65+65+65+
Dissatisfied (1-2) 15% 16% 15% 15% 21% 18% 10%
Neutral (3) 37% 39% 35% 45% 32% 44% 29%
Satisfied (4-5) 44% 43% 46% 40% 42% 36% 55%
Can’t say 4% 2% 5% ---- 4% 2% 7%
Average SatisfactionAverage SatisfactionAverage SatisfactionAverage Satisfaction 3.33.33.33.3 3.33.33.33.3 3.43.43.43.4 3.33.33.33.3 3.23.23.23.2 3.23.23.23.2 3.63.63.63.6
Overall SatisfactionOverall SatisfactionOverall SatisfactionOverall Satisfaction TotalTotalTotalTotal Property OwnershipProperty OwnershipProperty OwnershipProperty Ownership
Owns Owns Owns Owns
propertypropertypropertyproperty
Does not Does not Does not Does not
own own own own
Dissatisfied (1-2) 15% 15% 17%
Neutral (3) 37% 40% 27%
Satisfied (4-5) 44% 41% 56%
Can’t say 4% 5% ----
Average SatisfactionAverage SatisfactionAverage SatisfactionAverage Satisfaction 3.33.33.33.3 3.33.33.33.3 3.53.53.53.5
Has any issue strongly influenced your view, either in a positive or negative way?Has any issue strongly influenced your view, either in a positive or negative way?Has any issue strongly influenced your view, either in a positive or negative way?Has any issue strongly influenced your view, either in a positive or negative way?
Has any issue strongly Has any issue strongly Has any issue strongly Has any issue strongly
influenced your view?influenced your view?influenced your view?influenced your view? TotalTotalTotalTotal
GenderGenderGenderGender AgeAgeAgeAge
MaleMaleMaleMale FemaleFemaleFemaleFemale 18 to 3418 to 3418 to 3418 to 34 35 to 4935 to 4935 to 4935 to 49 50 to 6450 to 6450 to 6450 to 64 65+65+65+65+
Yes – Positive 15% 17% 14% 16% 20% 17% 11%
Yes – Negative 29% 31% 27% 26% 31% 36% 23%
No 56% 52% 59% 58% 49% 46% 66%
Has any issue strongly Has any issue strongly Has any issue strongly Has any issue strongly
influenced your view?influenced your view?influenced your view?influenced your view? TotalTotalTotalTotal
Property OwnershipProperty OwnershipProperty OwnershipProperty Ownership
Owns Owns Owns Owns
propertypropertypropertyproperty
Does not Does not Does not Does not
own own own own
Yes – Positive 15% 14% 21%
Yes – Negative 29% 34% 14%
No 56% 53% 65%
Statistically significant difference at the 95% confidence level.

58
Frequency of hearing a negative story or comment about CouncilFrequency of hearing a negative story or comment about CouncilFrequency of hearing a negative story or comment about CouncilFrequency of hearing a negative story or comment about Council
Frequency of hearing a Frequency of hearing a Frequency of hearing a Frequency of hearing a
negative story or negative story or negative story or negative story or
comment about Councilcomment about Councilcomment about Councilcomment about Council
TotalTotalTotalTotal
GenderGenderGenderGender AgeAgeAgeAge
MaleMaleMaleMale FemaleFemaleFemaleFemale 18 18 18 18 to 34to 34to 34to 34 35 to 4935 to 4935 to 4935 to 49 50 to 6450 to 6450 to 6450 to 64 65+65+65+65+
Daily 8% 9% 8% 8% 8% 13% 4%
Weekly 21% 23% 20% 28% 32% 18% 14%
Monthly 27% 25% 29% 19% 25% 25% 35%
Yearly 19% 18% 21% 16% 12% 25% 20%
Never 16% 17% 16% 19% 14% 12% 19%
I don't know 8% 9% 7% 10% 9% 6% 8%
Frequency of hearing a Frequency of hearing a Frequency of hearing a Frequency of hearing a
negative story or negative story or negative story or negative story or
comment about Councilcomment about Councilcomment about Councilcomment about Council
TotalTotalTotalTotal
Property OwnershipProperty OwnershipProperty OwnershipProperty Ownership
Owns Owns Owns Owns
propertypropertypropertyproperty
Does not Does not Does not Does not
ownownownown
Daily 8% 10% 3%
Weekly 21% 23% 18%
Monthly 27% 26% 29%
Yearly 19% 21% 12%
Never 16% 13% 27%
I don't know 8% 7% 11%

59
Council Services & FacilitiesCouncil Services & FacilitiesCouncil Services & FacilitiesCouncil Services & Facilities
Sustainable, liveable environmentsSustainable, liveable environmentsSustainable, liveable environmentsSustainable, liveable environments
Sustainable, liveable Sustainable, liveable Sustainable, liveable Sustainable, liveable
environmentsenvironmentsenvironmentsenvironments TotalTotalTotalTotal
GenderGenderGenderGender AgeAgeAgeAge
MaleMaleMaleMale FemaleFemaleFemaleFemale 18 to 3418 to 3418 to 3418 to 34 35 to 4935 to 4935 to 4935 to 49 50 to 6450 to 6450 to 6450 to 64 65+65+65+65+
Maintenance of beaches and
dunes 3.6 3.5 3.7 3.8 3.6 3.5 3.6
Appearance of towns and
villages 3.5 3.3 3.7 3.3 3.5 3.5 3.7
Management of stormwater
and drainage 3.4 3.4 3.3 3.5 3.4 3.2 3.5
Provision of car parks 3.3 3.3 3.2 3.6 3.1 3.2 3.2
Management of street trees 3.2 3.1 3.3 3.2 3.3 3.2 3.1
Sustainable management of
Shoalhaven's natural
environment
3.2 3.2 3.1 3.2 3.2 3.1 3.3
Making the most of our
waterfronts 3.1 3.2 3.0 3.1 2.8 3.0 3.4
Provision of footpaths 3.1 3.3 3.0 3.4 3.2 3.1 3.0
Sustainable management of
lakes and estuaries 3.1 3.1 3.2 3.2 3.2 3.0 3.2
Environmental protection
and enforcement 3.1 3.1 3.1 3.2 3.0 2.9 3.2
Provision of cycleways 3.0 3.0 3.0 3.0 3.0 2.9 3.0
Compliance and enforcement
of development 3.0 3.0 2.9 3.2 2.8 2.8 3.0
Strategic land use and town
planning for Shoalhaven 2.8 2.8 2.8 2.6 2.6 2.8 3.0
Maintenance of unsealed
local roads 2.7 2.6 2.8 2.9 2.6 2.6 2.7
Efficient processing of
development applications 2.6 2.5 2.7 2.7 2.3 2.5 2.9
Maintenance of sealed local
roads 2.5 2.5 2.6 2.2 2.4 2.6 2.7

60
Sustainable, Sustainable, Sustainable, Sustainable, liveable liveable liveable liveable
environmentsenvironmentsenvironmentsenvironments TotalTotalTotalTotal
Property OwnershipProperty OwnershipProperty OwnershipProperty Ownership
Owns Owns Owns Owns
propertypropertypropertyproperty
Does not Does not Does not Does not
ownownownown
Maintenance of beaches and
dunes 3.6 3.6 3.8
Appearance of towns and
villages 3.5 3.5 3.6
Management of stormwater
and drainage 3.4 3.3 3.5
Provision of car parks 3.3 3.2 3.6
Management of street trees 3.2 3.1 3.6
Sustainable management of
Shoalhaven's natural
environment
3.2 3.1 3.4
Making the most of our
waterfronts 3.1 3.0 3.5
Provision of footpaths 3.1 3.0 3.5
Sustainable management of
lakes and estuaries 3.1 3.1 3.3
Environmental protection
and enforcement 3.1 3.0 3.3
Provision of cycleways 3.0 2.9 3.1
Compliance and enforcement
of development 3.0 2.9 3.3
Strategic land use and town
planning for Shoalhaven 2.8 2.7 2.9
Maintenance of unsealed
local roads 2.7 2.6 2.9
Efficient processing of
development applications 2.6 2.5 3.0
Maintenance of sealed local
roads 2.5 2.5 2.6

61
Prosperous communitiesProsperous communitiesProsperous communitiesProsperous communities
Prosperous communitiesProsperous communitiesProsperous communitiesProsperous communities TotalTotalTotalTotal
GenderGenderGenderGender AgeAgeAgeAge
MaleMaleMaleMale FemaleFemaleFemaleFemale 18 to 3418 to 3418 to 3418 to 34 35 to 4935 to 4935 to 4935 to 49 50 to 6450 to 6450 to 6450 to 64 65+65+65+65+
Promotion of tourism 3.7 3.6 3.8 3.5 3.7 3.9 3.8
Appearance of CBD's (major
town centres) 3.1 3.1 3.1 3.0 3.1 3.0 3.3
Promoting economic
development (i.e. jobs
growth)
2.9 2.9 2.8 2.6 2.8 2.9 3.0
Prosperous communitiesProsperous communitiesProsperous communitiesProsperous communities TotalTotalTotalTotal Property OwnershipProperty OwnershipProperty OwnershipProperty Ownership
Owns Owns Owns Owns
propertypropertypropertyproperty
Does not Does not Does not Does not
ownownownown
Promotion of tourism 3.7 3.7 3.8
Appearance of CBD's (major
town centres) 3.1 3.0 3.3
Promoting economic
development (i.e. jobs
growth) 2.9 2.9 2.7

62
Responsible governance Responsible governance Responsible governance Responsible governance
Responsible governanceResponsible governanceResponsible governanceResponsible governance TotalTotalTotalTotal
GenderGenderGenderGender AgeAgeAgeAge
MaleMaleMaleMale FemaleFemaleFemaleFemale 18 to 3418 to 3418 to 3418 to 34 35 to 4935 to 4935 to 4935 to 49 50 to 6450 to 6450 to 6450 to 64 65+65+65+65+
Shoalhaven Entertainment
Centre 4.1 4.0 4.3 4.2 4.2 4.0 4.2
Swimming pools 4.1 4.0 4.1 4.2 4.0 3.9 4.1
Cemeteries 3.9 4.0 3.9 4.1 3.8 3.7 4.0
Sporting fields 3.9 3.9 3.9 4.1 3.8 3.8 4.0
Community buildings and
halls 3.7 3.6 3.8 3.8 3.6 3.6 3.8
Parks, playgrounds and
reserves 3.7 3.7 3.7 3.6 3.6 3.6 3.8
Council's customer service 3.6 3.6 3.7 3.6 3.5 3.5 3.9
Public toilets 3.2 3.2 3.1 3.0 3.3 3.1 3.3
Informing the community of
Council decisions, activities
and services
3.1 3.1 3.2 3.2 3.0 3.0 3.3
Opportunities to participate
in Council decision making
processes
2.9 2.9 3.0 2.9 2.9 2.8 3.1
Elected Council decision
making 2.8 2.7 2.9 3.0 2.7 2.6 3.0
Council's actions are in-line
with community
expectations 2.8 2.8 2.8 2.6 2.7 2.7 3.0
Responsible governanceResponsible governanceResponsible governanceResponsible governance TotalTotalTotalTotal Property OwnershipProperty OwnershipProperty OwnershipProperty Ownership
Owns Owns Owns Owns
propertypropertypropertyproperty
Does not Does not Does not Does not
ownownownown
Shoalhaven Entertainment
Centre 4.1 4.2 4.1
Swimming pools 4.1 4.0 4.1
Cemeteries 3.9 3.9 3.9
Sporting fields 3.9 3.8 4.1
Community buildings and
halls 3.7 3.7 3.7
Parks, playgrounds and
reserves 3.7 3.6 3.9
Council's customer service 3.6 3.6 3.7
Public toilets 3.2 3.1 3.3
Informing the community of
Council decisions, activities
and services
3.1 3.1 3.3
Opportunities to participate
in Council decision making
processes
2.9 2.9 2.9
Elected Council decision
making 2.8 2.8 2.9
Council's actions are in-line
with community
expectations
2.8 2.7 2.9
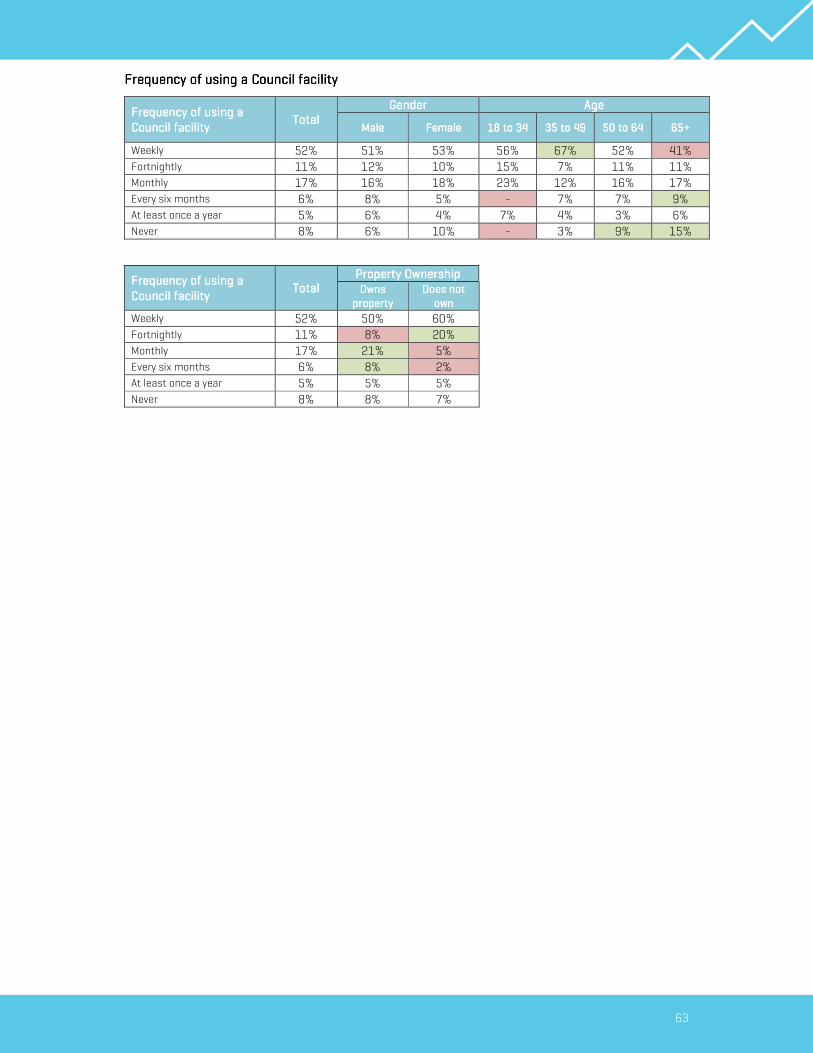
63
Frequency of using a Council facilityFrequency of using a Council facilityFrequency of using a Council facilityFrequency of using a Council facility
Frequency of Frequency of Frequency of Frequency of using a using a using a using a
Council facilityCouncil facilityCouncil facilityCouncil facility TotalTotalTotalTotal
GenderGenderGenderGender AgeAgeAgeAge
MaleMaleMaleMale FemaleFemaleFemaleFemale 18 to 3418 to 3418 to 3418 to 34 35 to 4935 to 4935 to 4935 to 49 50 to 6450 to 6450 to 6450 to 64 65+65+65+65+
Weekly 52% 51% 53% 56% 67% 52% 41%
Fortnightly 11% 12% 10% 15% 7% 11% 11%
Monthly 17% 16% 18% 23% 12% 16% 17%
Every six months 6% 8% 5% - 7% 7% 9%
At least once a year 5% 6% 4% 7% 4% 3% 6%
Never 8% 6% 10% - 3% 9% 15%
Frequency of using a Frequency of using a Frequency of using a Frequency of using a
Council facilityCouncil facilityCouncil facilityCouncil facility TotalTotalTotalTotal
Property OwnershipProperty OwnershipProperty OwnershipProperty Ownership
Owns Owns Owns Owns
propertypropertypropertyproperty
Does not Does not Does not Does not
ownownownown
Weekly 52% 50% 60%
Fortnightly 11% 8% 20%
Monthly 17% 21% 5%
Every six months 6% 8% 2%
At least once a year 5% 5% 5%
Never 8% 8% 7%

64
Resilient, safe and inclusive communities Resilient, safe and inclusive communities Resilient, safe and inclusive communities Resilient, safe and inclusive communities
Resilient, safe and Resilient, safe and Resilient, safe and Resilient, safe and
inclusive communitiesinclusive communitiesinclusive communitiesinclusive communities TotalTotalTotalTotal
GenderGenderGenderGender AgeAgeAgeAge
MaleMaleMaleMale FemaleFemaleFemaleFemale 18 to 3418 to 3418 to 3418 to 34 35 to 4935 to 4935 to 4935 to 49 50 to 6450 to 6450 to 6450 to 64 65+65+65+65+
Library services 4.3 4.2 4.4 4.3 4.3 4.2 4.5
Operation of sewerage and
quality water service 4.2 4.3 4.2 4.3 4.1 4.1 4.3
Solid waste and recycling
collection - wheelie bin
service
4.1 4.1 4.0 4.1 3.9 3.9 4.2
Hygiene standards of retail
food markets 4.1 4.0 4.1 4.0 4.0 4.0 4.2
Shoalhaven Regional Gallery
Nowra 4.0 3.9 4.1 4.0 3.8 4.1 4.1
Disaster response in the
Shoalhaven 3.9 3.9 3.9 3.7 3.9 3.8 4.1
Companion animal (dogs)
management 3.7 3.7 3.7 3.7 3.8 3.6 3.7
Landfill and resource
recovery services - waste
depots
3.7 3.6 3.7 3.5 3.6 3.6 3.8
Types of events in the
Shoalhaven 3.6 3.5 3.7 3.3 3.5 3.7 3.8
Council's support of events in
the Shoalhaven 3.5 3.5 3.6 3.4 3.5 3.6 3.7
Facilities and services for the
disabled 3.5 3.6 3.3 3.5 3.2 3.4 3.7
Resilient, safe and Resilient, safe and Resilient, safe and Resilient, safe and
inclusive communitiesinclusive communitiesinclusive communitiesinclusive communities TotalTotalTotalTotal
Property OwnershipProperty OwnershipProperty OwnershipProperty Ownership
Owns Owns Owns Owns
propertypropertypropertyproperty
Does not Does not Does not Does not
ownownownown
Library services 4.3 4.4 4.2
Operation of sewerage and
quality water service 4.2 4.2 4.2
Solid waste and recycling
collection - wheelie bin
service
4.1 4.1 4.0
Hygiene standards of retail
food markets 4.1 4.1 4.0
Shoalhaven Regional Gallery
Nowra 4.0 4.0 4.0
Disaster response in the
Shoalhaven 3.9 3.9 3.9
Companion animal (dogs)
management 3.7 3.7 3.6
Landfill and resource
recovery services - waste
depots
3.7 3.6 3.7
Types of events in the
Shoalhaven 3.6 3.6 3.5
Council's support of events in
the Shoalhaven 3.5 3.5 3.6
Facilities and services for the
disabled 3.5 3.4 3.5
Library services 4.3 4.4 4.2

65
Frequency of taking part in Shoalhaven eventsFrequency of taking part in Shoalhaven eventsFrequency of taking part in Shoalhaven eventsFrequency of taking part in Shoalhaven events
Frequency of taking part Frequency of taking part Frequency of taking part Frequency of taking part
in Shoalhaven eventsin Shoalhaven eventsin Shoalhaven eventsin Shoalhaven events TotalTotalTotalTotal
GenderGenderGenderGender AgeAgeAgeAge
MaleMaleMaleMale FemaleFemaleFemaleFemale 18 to 3418 to 3418 to 3418 to 34 35 to 4935 to 4935 to 4935 to 49 50 to 6450 to 6450 to 6450 to 64 65+65+65+65+
Weekly 5% 5% 5% - 9% 5% 5%
Fortnightly 4% 4% 4% 3% 8% 3% 3%
Monthly 29% 24% 35% 32% 27% 43% 18%
Every six months 29% 33% 25% 30% 37% 29% 24%
At least once a year 19% 21% 17% 15% 12% 17% 26%
Never 14% 14% 15% 19% 8% 4% 23%
Frequency of taking part Frequency of taking part Frequency of taking part Frequency of taking part
in Shoalhaven eventsin Shoalhaven eventsin Shoalhaven eventsin Shoalhaven events TotalTotalTotalTotal
Property OwnershipProperty OwnershipProperty OwnershipProperty Ownership
Owns Owns Owns Owns
propertypropertypropertyproperty
Does not Does not Does not Does not
ownownownown
Weekly 5% 5% 4%
Fortnightly 4% 3% 7%
Monthly 29% 29% 31%
Every six months 29% 30% 27%
At least once a year 19% 22% 7%
Never 14% 11% 24%

66
Contact with CouncilContact with CouncilContact with CouncilContact with Council
Recent contact with CouncilRecent contact with CouncilRecent contact with CouncilRecent contact with Council
Recent contact with Recent contact with Recent contact with Recent contact with
CouncilCouncilCouncilCouncil TotalTotalTotalTotal
GenderGenderGenderGender AgeAgeAgeAge
MaleMaleMaleMale FemaleFemaleFemaleFemale 18 to 3418 to 3418 to 3418 to 34 35 to 4935 to 4935 to 4935 to 49 50 to 6450 to 6450 to 6450 to 64 65+65+65+65+
Within the last week 13% 11% 14% 4% 19% 18% 9%
Within the last month 8% 8% 8% - 14% 12% 7%
Within the last three months 8% 9% 7% 8% 6% 9% 9%
Within the last six months 7% 7% 7% 7% 8% 6% 7%
Longer than six months ago 19% 21% 17% 15% 18% 21% 21%
Never 15% 14% 16% 24% 17% 8% 13%
Can't recall 30% 30% 31% 43% 18% 26% 34%
Recent contact with Recent contact with Recent contact with Recent contact with
CouncilCouncilCouncilCouncil TotalTotalTotalTotal
Property OwnershipProperty OwnershipProperty OwnershipProperty Ownership
Owns Owns Owns Owns
propertypropertypropertyproperty
Does not Does not Does not Does not
ownownownown
Within the last week 13% 16% 2%
Within the last month 8% 9% 4%
Within the last three months 8% 9% 4%
Within the last six months 7% 9% -
Longer than six months ago 19% 20% 16%
Never 15% 9% 34%
Can't recall 30% 27% 40%
Satisfaction with customer servicesSatisfaction with customer servicesSatisfaction with customer servicesSatisfaction with customer services
Satisfaction with Satisfaction with Satisfaction with Satisfaction with
customer servicescustomer servicescustomer servicescustomer services TotalTotalTotalTotal
GenderGenderGenderGender AgeAgeAgeAge
MaleMaleMaleMale FemaleFemaleFemaleFemale 18 to 3418 to 3418 to 3418 to 34 35 to 4935 to 4935 to 4935 to 49 50 to 6450 to 6450 to 6450 to 64 65+65+65+65+
The timeliness in Council
responding to your request 3.5 3.3 3.7 2.7 3.4 3.6 3.8
The overall performance of
Council in dealing with your
request
3.5 3.3 3.6 2.7 3.4 3.5 3.8
Satisfaction with Satisfaction with Satisfaction with Satisfaction with
customer servicescustomer servicescustomer servicescustomer services TotalTotalTotalTotal
Property OwnershipProperty OwnershipProperty OwnershipProperty Ownership
Owns Owns Owns Owns
propertypropertypropertyproperty
Does not Does not Does not Does not
ownownownown
The timeliness in Council
responding to your request 3.5 3.5 3.6
The overall performance of
Council in dealing with your
request
3.5 3.4 3.9

67
Community LivingCommunity LivingCommunity LivingCommunity Living
Community LivingCommunity LivingCommunity LivingCommunity Living TotalTotalTotalTotal
GenderGenderGenderGender AgeAgeAgeAge
MaleMaleMaleMale FemaleFemaleFemaleFemale 18 to 3418 to 3418 to 3418 to 34 35 to 4935 to 4935 to 4935 to 49 50 to 6450 to 6450 to 6450 to 64 65+65+65+65+
Shoalhaven is a liveable city 4.1 4.1 4.1 4.1 4.1 3.9 4.3
Shoalhaven is a vibrant city 3.4 3.4 3.4 3.3 3.3 3.4 3.6
Community LivingCommunity LivingCommunity LivingCommunity Living TotalTotalTotalTotal Property OwnershipProperty OwnershipProperty OwnershipProperty Ownership
Owns Owns Owns Owns
propertypropertypropertyproperty
Does not Does not Does not Does not
ownownownown
Shoalhaven is a liveable city 4.1 4.1 4.3
Shoalhaven is a vibrant city 3.4 3.3 3.7
Frequency of Frequency of Frequency of Frequency of walking for recreation, exercise or transportwalking for recreation, exercise or transportwalking for recreation, exercise or transportwalking for recreation, exercise or transport
Frequency of walking for Frequency of walking for Frequency of walking for Frequency of walking for
recreation, exercise or recreation, exercise or recreation, exercise or recreation, exercise or
transporttransporttransporttransport
TotalTotalTotalTotal
GenderGenderGenderGender AgeAgeAgeAge
MaleMaleMaleMale FemaleFemaleFemaleFemale 18 to 3418 to 3418 to 3418 to 34 35 to 4935 to 4935 to 4935 to 49 50 to 6450 to 6450 to 6450 to 64 65+65+65+65+
None 14% 17% 11% 10% 12% 11% 19%
Once 10% 11% 8% 14% 10% 7% 9%
Twice 8% 8% 8% 16% 8% 5% 6%
Three times 9% 11% 7% - 12% 12% 10%
Four times 6% 4% 8% 8% 5% 8% 5%
Five times 11% 7% 15% 17% 9% 11% 8%
More than 5 times 40% 39% 41% 36% 43% 45% 37%
N/A 3% 3% 2% - 3% 2% 6%
Frequency of walking for Frequency of walking for Frequency of walking for Frequency of walking for
recreation, exercise or recreation, exercise or recreation, exercise or recreation, exercise or
transporttransporttransporttransport
TotalTotalTotalTotal
Property OwnershipProperty OwnershipProperty OwnershipProperty Ownership
Owns Owns Owns Owns
propertypropertypropertyproperty
Does not Does not Does not Does not
ownownownown
None 14% 14% 12%
Once 10% 8% 16%
Twice 8% 8% 9%
Three times 9% 11% 3%
Four times 6% 6% 5%
Five times 11% 11% 11%
More than 5 times 40% 39% 44%
N/A 3% 3% 0.6%
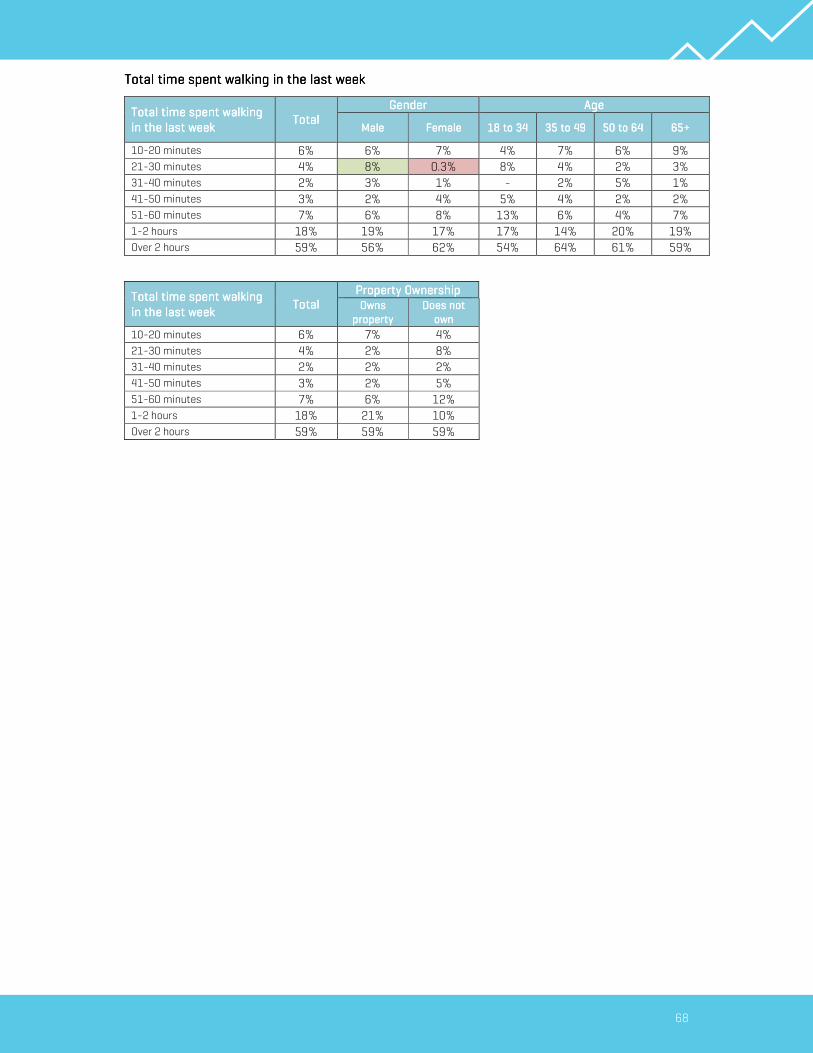
68
Total time spent walking in the last weekTotal time spent walking in the last weekTotal time spent walking in the last weekTotal time spent walking in the last week
Total time spent walking Total time spent walking Total time spent walking Total time spent walking
in the last weekin the last weekin the last weekin the last week TotalTotalTotalTotal
GenderGenderGenderGender AgeAgeAgeAge
MaleMaleMaleMale FemaleFemaleFemaleFemale 18 to 3418 to 3418 to 3418 to 34 35 to 4935 to 4935 to 4935 to 49 50 to 6450 to 6450 to 6450 to 64 65+65+65+65+
10-20 minutes 6% 6% 7% 4% 7% 6% 9%
21-30 minutes 4% 8% 0.3% 8% 4% 2% 3%
31-40 minutes 2% 3% 1% - 2% 5% 1%
41-50 minutes 3% 2% 4% 5% 4% 2% 2%
51-60 minutes 7% 6% 8% 13% 6% 4% 7%
1-2 hours 18% 19% 17% 17% 14% 20% 19%
Over 2 hours 59% 56% 62% 54% 64% 61% 59%
Total time spent walking Total time spent walking Total time spent walking Total time spent walking
in the last weekin the last weekin the last weekin the last week TotalTotalTotalTotal
Property Property Property Property OwnershipOwnershipOwnershipOwnership
Owns Owns Owns Owns
propertypropertypropertyproperty
Does not Does not Does not Does not
ownownownown
10-20 minutes 6% 7% 4%
21-30 minutes 4% 2% 8%
31-40 minutes 2% 2% 2%
41-50 minutes 3% 2% 5%
51-60 minutes 7% 6% 12%
1-2 hours 18% 21% 10%
Over 2 hours 59% 59% 59%

69
Purpose of walksPurpose of walksPurpose of walksPurpose of walks
Purpose of walksPurpose of walksPurpose of walksPurpose of walks TotalTotalTotalTotal
GenderGenderGenderGender AgeAgeAgeAge
MaleMaleMaleMale FemaleFemaleFemaleFemale 18 to 3418 to 3418 to 3418 to 34 35 to 4935 to 4935 to 4935 to 49 50 to 6450 to 6450 to 6450 to 64 65+65+65+65+
Exercise 80% 77% 83% 80% 74% 80% 87%
Walking to shops 24% 21% 26% 27% 23% 22% 24%
Walking to workplace 11% 9% 12% 17% 20% 8% 2%
Walking the dog 9% 13% 6% 4% 14% 11% 9%
Walking children to school 5% 6% 4% 9% 11% 3% -
Work 3% 5% 1% 4% 5% 5% -
Walking children to park 2% 2% 3% - 4% 4% 0.6%
Gardening 1% 1% 2% - 2% 1% 2%
Walking to public transport 0.2% - 0.4% - 1% - -
Other 8% 13% 4% 8% 9% 10% 7%
None of the above 0.4% 0.8% - - 2% - -
Purpose of walksPurpose of walksPurpose of walksPurpose of walks TotalTotalTotalTotal Property OwnershipProperty OwnershipProperty OwnershipProperty Ownership
Owns Owns Owns Owns
propertypropertypropertyproperty
Does not Does not Does not Does not
ownownownown
Exercise 80% 82% 76%
Walking to shops 24% 21% 33%
Walking to workplace 11% 11% 11%
Walking the dog 9% 11% 5%
Walking children to school 5% 5% 6%
Work 3% 4% 2%
Walking children to park 2% 2% 3%
Gardening 1% 2% -
Walking to public transport 0.2% 0.3% -
Other 8% 8% 7%
None of the above 0.4% 0.5% -

70
Community Engagement Projects & Initiatives Community Engagement Projects & Initiatives Community Engagement Projects & Initiatives Community Engagement Projects & Initiatives
AwareAwareAwareAwarenessnessnessness of Councilof Councilof Councilof Council----run projects or initiatives in the Shoalhaven run projects or initiatives in the Shoalhaven run projects or initiatives in the Shoalhaven run projects or initiatives in the Shoalhaven
AwarenessAwarenessAwarenessAwareness TotalTotalTotalTotal
GenderGenderGenderGender AgeAgeAgeAge
MaleMaleMaleMale FemaleFemaleFemaleFemale 18 to 3418 to 3418 to 3418 to 34 35 to 4935 to 4935 to 4935 to 49 50 to 6450 to 6450 to 6450 to 64 65+65+65+65+
Aware of Council-run
projects or initiatives in the
Shoalhaven
34% 37% 31% 28% 41% 43% 27%
AwarenessAwarenessAwarenessAwareness TotalTotalTotalTotal Property OwnershipProperty OwnershipProperty OwnershipProperty Ownership
Owns Owns Owns Owns
propertypropertypropertyproperty
Does not Does not Does not Does not
ownownownown
Aware of Council-run
projects or initiatives in the
Shoalhaven
34% 39% 19%
Recalled community engagement projects and initiatives Recalled community engagement projects and initiatives Recalled community engagement projects and initiatives Recalled community engagement projects and initiatives
Recalled community Recalled community Recalled community Recalled community
engagement projects engagement projects engagement projects engagement projects
and initiativesand initiativesand initiativesand initiatives
TotalTotalTotalTotal
GenderGenderGenderGender AgeAgeAgeAge
MaleMaleMaleMale FemaleFemaleFemaleFemale 18 to 3418 to 3418 to 3418 to 34 35 to 4935 to 4935 to 4935 to 49 50 to 6450 to 6450 to 6450 to 64 65+65+65+65+
Delivery Program and
Operational Plan (DPOP) 8% 13% 3% - 10% 14% 3%
A Strategic Planning
document (e.g. Local
Environment Plan, Local
Strategic Planning
Statement)
5% 4% 6% - 10% 5% 4%
Tourist and Visitor
Accommodation and Clause
2.8 (Temporary Use of Land)
Review
- - - - - - -
Other 49% 58% 38% 12% 51% 54% 63%
Can't name any 40% 29% 53% 88% 30% 30% 32%
Recalled community Recalled community Recalled community Recalled community
engagement projects engagement projects engagement projects engagement projects
and initiativesand initiativesand initiativesand initiatives
TotalTotalTotalTotal
Property OwnershipProperty OwnershipProperty OwnershipProperty Ownership
Owns Owns Owns Owns
propertypropertypropertyproperty
Does not Does not Does not Does not
ownownownown
Delivery Program and
Operational Plan (DPOP) 8% 9% -
A Strategic Planning
document (e.g. Local
Environment Plan, Local
Strategic Planning
Statement)
5% 5% 7%
Tourist and Visitor
Accommodation and Clause
2.8 (Temporary Use of Land)
Review
- - -
Other 49% 51% 33%
Can't name any 40% 36% 69%

71
ParticipatParticipatParticipatParticipationionionion in community engagement projects or initiativesin community engagement projects or initiativesin community engagement projects or initiativesin community engagement projects or initiatives
Participation Participation Participation Participation TotalTotalTotalTotal
GenderGenderGenderGender AgeAgeAgeAge
MaleMaleMaleMale FemaleFemaleFemaleFemale 18 to 3418 to 3418 to 3418 to 34 35 to 4935 to 4935 to 4935 to 49 50 to 6450 to 6450 to 6450 to 64 65+65+65+65+
Participated in community
engagement projects or
initiatives 26% 28% 24% - 23% 42% 26%
ParticipationParticipationParticipationParticipation TotalTotalTotalTotal Property OwnershipProperty OwnershipProperty OwnershipProperty Ownership
Owns Owns Owns Owns
propertypropertypropertyproperty
Does not Does not Does not Does not
ownownownown
Participated in community
engagement projects or
initiatives
26% 28% 13%

72
Communication & EngagementCommunication & EngagementCommunication & EngagementCommunication & Engagement
Likelihood of using methods to receive information from CouncilLikelihood of using methods to receive information from CouncilLikelihood of using methods to receive information from CouncilLikelihood of using methods to receive information from Council
Likelihood of using Likelihood of using Likelihood of using Likelihood of using
methods to receive methods to receive methods to receive methods to receive
information from Councilinformation from Councilinformation from Councilinformation from Council
TotalTotalTotalTotal
GenderGenderGenderGender AgeAgeAgeAge
MaleMaleMaleMale FemaleFemaleFemaleFemale 18 to 3418 to 3418 to 3418 to 34 35 to 4935 to 4935 to 4935 to 49 50 to 6450 to 6450 to 6450 to 64 65+65+65+65+
Direct mail 3.4 3.4 3.4 2.9 3.3 3.3 3.8
Email (including Newsletters) 3.2 3.2 3.3 3.5 3.5 3.3 2.8
Radio 3.1 3.0 3.1 3.1 3.3 3.1 2.9
Television 2.9 2.9 2.9 2.7 2.8 2.9 3.0
Social Media (e.g. Facebook,
Twitter, LinkedIn) 2.8 2.7 2.9 3.9 3.3 2.8 1.8
Newspapers 2.3 2.3 2.4 2.2 2.1 2.3 2.6
Council's Website (including
'Get Involved' website) 2.3 2.3 2.4 2.7 2.6 2.4 1.9
Community Noticeboards
(e.g. Library, Facilities, CBD) 2.2 2.3 2.2 2.4 2.0 2.4 2.1
Video 1.8 1.9 1.7 2.3 2.1 1.5 1.5
Likelihood of using Likelihood of using Likelihood of using Likelihood of using
methods to receive methods to receive methods to receive methods to receive
information from Councilinformation from Councilinformation from Councilinformation from Council
TotalTotalTotalTotal
Property OwnershipProperty OwnershipProperty OwnershipProperty Ownership
Owns Owns Owns Owns
propertypropertypropertyproperty
Does not Does not Does not Does not
ownownownown
Direct mail 3.4 3.5 3.1
Email (including Newsletters) 3.2 3.2 3.3
Radio 3.1 3.0 3.3
Television 2.9 2.9 2.9
Social Media (e.g. Facebook,
Twitter, LinkedIn) 2.8 2.6 3.4
Newspapers 2.3 2.2 2.7
Council's Website (including
'Get Involved' website) 2.3 2.3 2.3
Community Noticeboards
(e.g. Library, Facilities, CBD) 2.2 2.1 2.5
Video 1.8 1.6 2.3
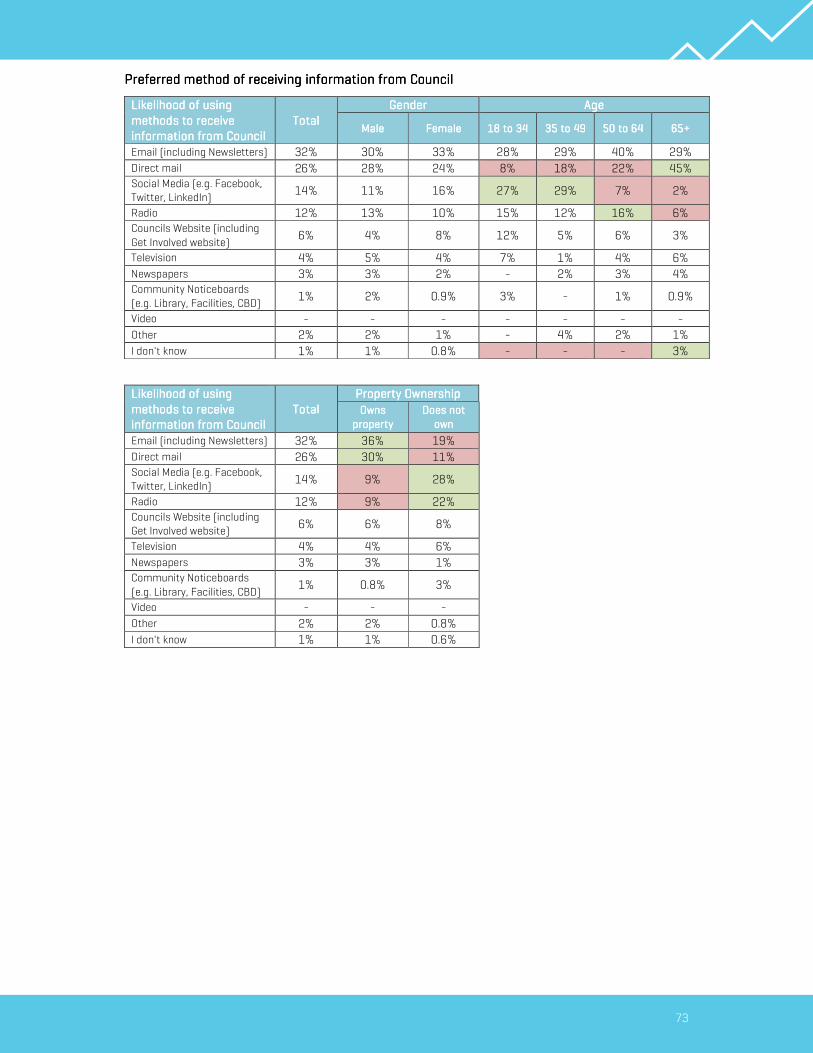
73
Preferred method of receiving information from CouncilPreferred method of receiving information from CouncilPreferred method of receiving information from CouncilPreferred method of receiving information from Council
Likelihood of Likelihood of Likelihood of Likelihood of using using using using
methods to receive methods to receive methods to receive methods to receive
information from Councilinformation from Councilinformation from Councilinformation from Council
TotalTotalTotalTotal
GenderGenderGenderGender AgeAgeAgeAge
MaleMaleMaleMale FemaleFemaleFemaleFemale 18 to 3418 to 3418 to 3418 to 34 35 to 4935 to 4935 to 4935 to 49 50 to 6450 to 6450 to 6450 to 64 65+65+65+65+
Email (including Newsletters) 32% 30% 33% 28% 29% 40% 29%
Direct mail 26% 28% 24% 8% 18% 22% 45%
Social Media (e.g. Facebook,
Twitter, LinkedIn) 14% 11% 16% 27% 29% 7% 2%
Radio 12% 13% 10% 15% 12% 16% 6%
Councils Website (including
Get Involved website) 6% 4% 8% 12% 5% 6% 3%
Television 4% 5% 4% 7% 1% 4% 6%
Newspapers 3% 3% 2% - 2% 3% 4%
Community Noticeboards
(e.g. Library, Facilities, CBD) 1% 2% 0.9% 3% - 1% 0.9%
Video - - - - - - -
Other 2% 2% 1% - 4% 2% 1%
I don't know 1% 1% 0.8% - - - 3%
Likelihood of using Likelihood of using Likelihood of using Likelihood of using
methods to receive methods to receive methods to receive methods to receive
information from Councilinformation from Councilinformation from Councilinformation from Council
TotalTotalTotalTotal
Property OwnershipProperty OwnershipProperty OwnershipProperty Ownership
Owns Owns Owns Owns
propertypropertypropertyproperty
Does not Does not Does not Does not
ownownownown
Email (including Newsletters) 32% 36% 19%
Direct mail 26% 30% 11%
Social Media (e.g. Facebook,
Twitter, LinkedIn) 14% 9% 28%
Radio 12% 9% 22%
Councils Website (including
Get Involved website) 6% 6% 8%
Television 4% 4% 6%
Newspapers 3% 3% 1%
Community Noticeboards
(e.g. Library, Facilities, CBD) 1% 0.8% 3%
Video - - -
Other 2% 2% 0.8%
I don't know 1% 1% 0.6%

74
Likelihood of using methods to engage with CouncilLikelihood of using methods to engage with CouncilLikelihood of using methods to engage with CouncilLikelihood of using methods to engage with Council
Likelihood of using Likelihood of using Likelihood of using Likelihood of using
methods to engage with methods to engage with methods to engage with methods to engage with
CouncilCouncilCouncilCouncil
TotalTotalTotalTotal
GenderGenderGenderGender AgeAgeAgeAge
MaleMaleMaleMale FemaleFemaleFemaleFemale 18 to 3418 to 3418 to 3418 to 34 35 to 4935 to 4935 to 4935 to 49 50 to 6450 to 6450 to 6450 to 64 65+65+65+65+
Speak with a Customer
Service person 3.3 3.3 3.3 3.1 3.4 3.4 3.2
Email 3.2 3.0 3.4 3.2 3.4 3.4 2.9
Online surveys 3.0 2.9 3.1 3.2 3.3 3.1 2.5
Direct mail 2.9 2.8 2.9 2.2 2.6 2.9 3.4
Face to Face or Virtual
Meetings 2.5 2.6 2.4 2.4 2.7 2.5 2.4
Use live chat function on
Council's website 1.9 1.8 1.9 2.2 2.1 1.9 1.4
Likelihood of using Likelihood of using Likelihood of using Likelihood of using
methods to engage with methods to engage with methods to engage with methods to engage with
CouncilCouncilCouncilCouncil
TotalTotalTotalTotal
Property OwnershipProperty OwnershipProperty OwnershipProperty Ownership
Owns Owns Owns Owns
propertypropertypropertyproperty
Does not Does not Does not Does not
ownownownown
Speak with a Customer
Service person 3.3 3.3 3.3
Email 3.2 3.2 3.1
Online surveys 3.0 3.0 3.0
Direct mail 2.9 3.0 2.5
Face to Face or Virtual
Meetings 2.5 2.5 2.4
Use live chat function on
Council's website 1.9 1.8 2.0

75
Preferred method of engaging with CouncilPreferred method of engaging with CouncilPreferred method of engaging with CouncilPreferred method of engaging with Council
Preferred method of Preferred method of Preferred method of Preferred method of
engaging with Councilengaging with Councilengaging with Councilengaging with Council TotalTotalTotalTotal
GenderGenderGenderGender AgeAgeAgeAge
MaleMaleMaleMale FemaleFemaleFemaleFemale 18 to 3418 to 3418 to 3418 to 34 35 to 4935 to 4935 to 4935 to 49 50 to 6450 to 6450 to 6450 to 64 65+65+65+65+
Email 32% 29% 34% 43% 33% 33% 23%
Speak with a Customer
Service person 18% 22% 14% 18% 15% 20% 19%
Direct mail 17% 13% 20% 9% 9% 9% 32%
Face to Face or Virtual
Meetings 12% 16% 8% 10% 11% 15% 11%
Online surveys 9% 6% 12% 4% 18% 13% 5%
Use live chat function on
Councils website 4% 6% 3% 11% 5% 3% -
Other 3% 4% 2% 4% 6% 2%
I don't know 5% 3% 6% 4% 4% 2% 8%
Preferred method of Preferred method of Preferred method of Preferred method of
engaging engaging engaging engaging with Councilwith Councilwith Councilwith Council TotalTotalTotalTotal
Property OwnershipProperty OwnershipProperty OwnershipProperty Ownership
Owns Owns Owns Owns
propertypropertypropertyproperty
Does not Does not Does not Does not
ownownownown
Email 32% 30% 37%
Speak with a Customer
Service person 18% 17% 24%
Direct mail 17% 18% 12%
Face to Face or Virtual
Meetings 12% 13% 9%
Online surveys 9% 9% 10%
Use live chat function on
Councils website 4% 4% 3%
Other 3% 3% 4%
I don't know 5% 6% 2%

76
Happiness IndexHappiness IndexHappiness IndexHappiness Index
Happiness IndexHappiness IndexHappiness IndexHappiness Index TotalTotalTotalTotal
GenderGenderGenderGender AgeAgeAgeAge
MaleMaleMaleMale FemaleFemaleFemaleFemale 18 to 3418 to 3418 to 3418 to 34 35 to 4935 to 4935 to 4935 to 49 50 to 6450 to 6450 to 6450 to 64 65+65+65+65+
Your personal relationships 4.4 4.4 4.5 4.5 4.3 4.3 4.6
How safe you feel 4.3 4.4 4.3 4.3 4.3 4.2 4.5
Your standard of living 4.3 4.3 4.4 4.4 4.1 4.2 4.6
Your life as a whole 4.3 4.2 4.4 4.3 4.1 4.2 4.5
Your future security 4.1 4.0 4.2 4.3 3.8 3.9 4.3
What you are currently
achieving in life 4.1 4.0 4.2 4.2 4.0 4.0 4.2
Your health 4.1 4.1 4.1 4.4 4.1 4.0 4.0
Feeling part of your
community 4.1 3.9 4.2 4.1 3.9 4.0 4.3
Happiness IndexHappiness IndexHappiness IndexHappiness Index TotalTotalTotalTotal Property OwnershipProperty OwnershipProperty OwnershipProperty Ownership
Owns Owns Owns Owns
propertypropertypropertyproperty
Does not Does not Does not Does not
ownownownown
Your personal relationships 4.4 4.5 4.3
How safe you feel 4.3 4.4 4.3
Your standard of living 4.3 4.4 4.3
Your life as a whole 4.3 4.4 4.1
Your future security 4.1 4.1 4.0
What you are currently
achieving in life 4.1 4.1 4.0
Your health 4.1 4.1 4.2
Feeling part of your
community 4.1 4.1 3.9
Frequency of speaking to a Frequency of speaking to a Frequency of speaking to a Frequency of speaking to a neighbour or someone in the streetneighbour or someone in the streetneighbour or someone in the streetneighbour or someone in the street
Frequency of speaking to Frequency of speaking to Frequency of speaking to Frequency of speaking to
a neighbour or someone a neighbour or someone a neighbour or someone a neighbour or someone
in the streetin the streetin the streetin the street
TotalTotalTotalTotal
GenderGenderGenderGender AgeAgeAgeAge
MaleMaleMaleMale FemaleFemaleFemaleFemale 18 to 3418 to 3418 to 3418 to 34 35 to 4935 to 4935 to 4935 to 49 50 to 6450 to 6450 to 6450 to 64 65+65+65+65+
Weekly 84% 83% 85% 71% 87% 85% 90%
Fortnightly 6% 6% 5% 11% 5% 4% 4%
Monthly 5% 5% 5% 7% 3% 8% 3%
Every six months 1% 2% 0.7% - 1% 2% 1%
At least once a year 1% 1% 1% 3% 1% 1% -
Never 3% 4% 3% 8% 3% 1% 2%
Frequency of speaking to Frequency of speaking to Frequency of speaking to Frequency of speaking to
a neighbour or someone a neighbour or someone a neighbour or someone a neighbour or someone
in the streetin the streetin the streetin the street
TotalTotalTotalTotal
Property OwnershipProperty OwnershipProperty OwnershipProperty Ownership
Owns Owns Owns Owns
propertypropertypropertyproperty
Does not Does not Does not Does not
ownownownown
Weekly 84% 88% 69%
Fortnightly 6% 4% 12%
Monthly 5% 4% 7%
Every six months 1% 1% -
At least once a year 1% 0.4% 4%
Never 3% 2% 8%


