Ships and Offshore Structures - orbi.uliege.be and Offshore Structures Publication details,...
9
This article was downloaded by:[Rigo, P.] On: 5 December 2007 Access Details: [subscription number 787846182] Publisher: Taylor & Francis Informa Ltd Registered in England and Wales Registered Number: 1072954 Registered office: Mortimer House, 37-41 Mortimer Street, London W1T 3JH, UK Ships and Offshore Structures Publication details, including instructions for authors and subscription information: http://www.informaworld.com/smpp/title~content=t778188387 Least cost optimization of large passenger vessels T. Richir ab ; J. -D. Caprace ac ; N. Losseau ab ; E. Pircalabu a ; C. Toderan a ; P. Rigo ac a ANAST, University of Liege, Liege, Belgium b Fund for training in research in industry and agriculture of Belgium (F.R.I.A.), c National fund of scientific research of Belgium (F.N.R.S.), Online Publication Date: 01 December 2007 To cite this Article: Richir, T., Caprace, J. -D., Losseau, N., Pircalabu, E., Toderan, C. and Rigo, P. (2007) 'Least cost optimization of large passenger vessels', Ships and Offshore Structures, 2:4, 339 - 345 To link to this article: DOI: 10.1080/17445300701699507 URL: http://dx.doi.org/10.1080/17445300701699507 PLEASE SCROLL DOWN FOR ARTICLE Full terms and conditions of use: http://www.informaworld.com/terms-and-conditions-of-access.pdf This article maybe used for research, teaching and private study purposes. Any substantial or systematic reproduction, re-distribution, re-selling, loan or sub-licensing, systematic supply or distribution in any form to anyone is expressly forbidden. The publisher does not give any warranty express or implied or make any representation that the contents will be complete or accurate or up to date. The accuracy of any instructions, formulae and drug doses should be independently verified with primary sources. The publisher shall not be liable for any loss, actions, claims, proceedings, demand or costs or damages whatsoever or howsoever caused arising directly or indirectly in connection with or arising out of the use of this material.
Transcript of Ships and Offshore Structures - orbi.uliege.be and Offshore Structures Publication details,...

This article was downloaded by:[Rigo, P.]On: 5 December 2007Access Details: [subscription number 787846182]Publisher: Taylor & FrancisInforma Ltd Registered in England and Wales Registered Number: 1072954Registered office: Mortimer House, 37-41 Mortimer Street, London W1T 3JH, UK
Ships and Offshore StructuresPublication details, including instructions for authors and subscription information:http://www.informaworld.com/smpp/title~content=t778188387
Least cost optimization of large passenger vesselsT. Richir ab; J. -D. Caprace ac; N. Losseau ab; E. Pircalabu a; C. Toderan a; P.Rigo aca ANAST, University of Liege, Liege, Belgiumb Fund for training in research in industry and agriculture of Belgium (F.R.I.A.),c National fund of scientific research of Belgium (F.N.R.S.),
Online Publication Date: 01 December 2007To cite this Article: Richir, T., Caprace, J. -D., Losseau, N., Pircalabu, E.,Toderan, C. and Rigo, P. (2007) 'Least cost optimization of large passengervessels', Ships and Offshore Structures, 2:4, 339 - 345To link to this article: DOI: 10.1080/17445300701699507URL: http://dx.doi.org/10.1080/17445300701699507
PLEASE SCROLL DOWN FOR ARTICLE
Full terms and conditions of use: http://www.informaworld.com/terms-and-conditions-of-access.pdf
This article maybe used for research, teaching and private study purposes. Any substantial or systematic reproduction,re-distribution, re-selling, loan or sub-licensing, systematic supply or distribution in any form to anyone is expresslyforbidden.
The publisher does not give any warranty express or implied or make any representation that the contents will becomplete or accurate or up to date. The accuracy of any instructions, formulae and drug doses should beindependently verified with primary sources. The publisher shall not be liable for any loss, actions, claims, proceedings,demand or costs or damages whatsoever or howsoever caused arising directly or indirectly in connection with orarising out of the use of this material.

Dow
nloa
ded
By:
[Rig
o, P
.] A
t: 17
:01
5 D
ecem
ber 2
007
Least cost optimization of large passengervessels
doi:10.1080/17445300701699507
T. Richira,b, J.-D. Capracea,c, N. Losseaua,b, E. Pircalabua,C. Toderana and P. Rigoa,c,∗aANAST, University of Liege, Liege, Belgium; bFund for training in research in industry and agriculture of Belgium(F.R.I.A.); cNational fund of scientific research of Belgium (F.N.R.S.)
Abstract: The LBR-5 software allows optimizing ship structures according to objectives of higherinertia, less weight and/or lower cost. This last criterion offers the choice between two approaches ofcalculation. The first approach is based on a simplified assessment of the cost in which the total costis described by rather simple analytical functions which bring into play on the one hand the designvariables and on the other hand empirical parameters. In the second approach, the calculation of the costis based on data specific to the shipyard. The material cost is analyzed according to the first approachwhile the cost of the labor considers each relevant operation of the ship building with respect to theLBR-5 model. A survey of all the tasks was carried out at Aker Yards France, and a thorough studymade it possible to develop assessment tools of the labor cost for each operation as functions of thedesign variables. Plate straightening operations are also considered in this analysis. This paper presentsa cost-based optimization study carried out on a large passenger ship structure with more than 600design variables, by the use of the detailed approach for the cost calculation. The structural model hasbeen formulated on the basis of technical documentation prepared by Aker Yards France. The loads andstrength criteria applied on the model are considered according to classification society rules (BureauVeritas). Results and conclusions of the study are presented.
Key words: LBR-5, cost, optimization, scantling, straightening
INTRODUCTION
LBR5 is a structural optimization tool that, in the prelim-inary design stage of the project, allows for
– a 3D structural analysis of a portion of the structure (usu-ally located in the mid-ship region);
– a scantling optimization of the structural elements (platethickness, size and spacing of the longitudinal andtransversal members), based on different objective func-tions as higher inertia, less weight and/or lower cost.
A cost-based optimization can be performed using oneof the two available cost modules.
Corresponding Author:P. RigoANASTUniversity of LiegeChemin des ChevreuilsLiege B-4000BelgiumTel: +32-4-3669366Email: [email protected]
The basic cost module (BCM) is based on a simplifiedassessment of labor and material costs. To calibrate themodule, the cost of a standard LBR-5 stiffened panel (Fig-ure 1) must be assessed using the unitary production costsof the shipyard. These unitary costs are related to assem-bling and welding for the plates and the longitudinal andtransversal members, transverse member prefabrication,slots, brackets etc.
The advanced cost module (ACM) is a more complexcost assessment tool that takes into account detailed ship-yard database. About 60 different fabrication operationsare considered, covering the different construction stages,such as girders and web-frames prefabrication, plate panelsassembling, blocks pre-assembling and assembling, as wellas 30 types of welding and their unitary costs.
BASIC COST MODULE
With the BCM, the objective function is the constructioncost that includes the labor costs and the material cost(proportional to the weight). In order to link the objec-tive function to the design variables, the unitary costs of
Copyright C© 2007 Taylor & Francis 339 SAOS 2007 Vol. 2 No. 4 pp. 339–345
Dow
nloa
ded
By:
[Rig
o, P
.] A
t: 17
:01
5 D
ecem
ber 2
007
T. Richir, J.-D. Caprace, N. Losseau, E. Pircalabu, C. Toderan and P. Rigo
Figure 1 Standard LBR-5 stiffened panel.
raw materials, the productivity rates for welding, cutting,assembling must be specified by the user.
These unitary costs vary according to the type andthe size of the structure, the manufacturing technology(manual welding, robots, etc.), the experience and facilitiesof the construction site, the country, etc. It is therefore ob-vious that the result of this optimization process (scantlingoptimization) will be valid only for the specified economicand production data. Sensitivity analyses of the economicdata on the optimum scantling can also be performed, thusproviding the manager with valuable information for im-proving the yard.
Global construction costs can be classified into threedistinctive categories: cost of raw materials, labor costs andoverhead costs (equation (1)).
TC = MatC + LabC + OvC. (1)
The overhead cost is not a function of the design vari-ables, so it can be ignored by the analytical cost model.Therefore, the considered cost will be:
TC = MatC + LabC. (2)
The material cost and the labor cost are expressed inequations (3)–(4):
MatC =k∑
j=1
Q j × Pj (3)
LabC =NT∑
i=1
Ti × Mi × Si , (4)
where j is the reference number of a given material, k is thenumber of materials, Q j is the expected quantity of the jmaterial;Pj is the unit price of the j material (euro/unit); iis the reference number of a given task, NT is the numberof tasks; Ti is the required working load for the standard itask (man-hours), Mi is the number of repetitions for theTi task, Si is the labor cost (euro/man-hour).
Detailed information about the BCM is given in Rigo(2001).
ADVANCED COST MODULE
Given the generalist nature of the BCM approach, thecost assessment made with this method for large complexship structures presents rather important differences withrespect to the shipyard predictions. A number of sensibleparameters related to production costs cannot be taken intoconsideration. ANAST carried out a study in collaborationwith Aker Yards, France for the development of a costmodule that will be a better answer to the shipyard’s needs.
The new module complies with a number of issues thatwere incompatible with the BCM:
– the specificity of each LBR-5 panel is considered accordingto the real structure (horizontal–vertical, straight–formedetc.), for a distinctive employment of the shipyard’s unitarycosts;
– better implementation of the unitary costs variation withthe thickness of the structural members, which is not al-ways linear;
– considering the costs related to the stiffening of importantweb height members (ex: flat bar stiffening of the web-frames);
– considering the plate straightening related costs;– considering that several workshops are involved in con-
struction, with different production costs;– introduction of an exhaustive representation of the fabri-
cation operations related to the existing design variables.
The cost for each operation is calculated with a generalanalytical expression (equation (5)).
COi k = Qi k × CUi k × Ki k × CAi k × CATi k, (5)
where i is the LBR-5 panel index, k is the operation index,COi k is the cost for operation k on panel i, Qi k is the oper-ation related quantity (welding length, number of bracketsetc.), CUi k is the operation related unitary cost, Ki k isthe corrective coefficient used to calibrate the operation-related quantity with respect to model particularities; CAi kis the accessibility coefficient for the operation k on paneli, CATi k = workshop coefficient for the operation k onpanel i .
Figure 2 Unitary cost variation for different weldingpositions.
340SAOS 2007 Vol. 2 No. 4 Copyright C© 2007 Taylor & Francis

Dow
nloa
ded
By:
[Rig
o, P
.] A
t: 17
:01
5 D
ecem
ber 2
007
Least cost optimization of large passenger vessels
Figure 3 Double hull panel.
The total structure cost will be the sum of all COi k(equation (6)).
CT =∑
i
∑
k
COi k. (6)
The LBR-5 optimization module (Fleury 1989) is agradient-based method; therefore, the simple cost assess-ment is not sufficient for the optimization process, an anal-ysis of the objective function sensitivities with respect toeach design variable is needed to give the direction ofsearch. When BCM is used, the cost function is contin-uous and its sensitivities could be calculated analytically.This advantage is lost if the cost function is evaluated byACM. Basically, the ACM sensitivities can be written withthe equation (7) for each LBR5 panel, each design variableand each operation.
δi j k = (T1 × CUik + T2 × Qik) × Kik × CAik × CATik(7)
where T1 is the sensitivity of the quantity by each designvariable Xj (equation (8)), which is calculated analytically,T2 is the sensitivity of the unitary cost by each design vari-able Xj (equation (9)), which is usually a discrete function(Figure 2) and its calculation requires a numerical proce-dure.
T1 = ∂ Qik
∂ Xj(8)
T2 = ∂CUik
∂ Xj. (9)
Equation (9) represents the first derivative of the uni-tary cost (CU) by a design variable (Xj ). For instance, itrepresents the variation of the unitary welding costs whenthe plate thickness changes.
A number of tests were performed on simplifiedstructures—double hull panel (Figure 3), and on real hullstructures in order to validate the ACM in terms of designvariables sensitivities and total costs.
The cost variation for some of the design variables on theselected double hull panel was analysed. Figure 4 shows
for instance the total cost variation as a function of thestrake 1 thickness. As can be noticed, the ACM calculationgives a clearly improved slope with respect to the directcalculated cost, compared to the BCM result. The averageuncertainty related to the ACM, taking as reference thedirect calculation, is about 4%.
PLATE STRAIGHTENING
Straightening costs are taken into account with both BCMand ACM. The welding of structural elements involvesheating within the material; this phenomenon causes defor-mations which have to be reduced to obtain an acceptablesurface flatness.
The straightening is the process that consists in elimi-nating/reducing these distortions in order to improve thestructure flatness for esthetical or service reasons. Thestraightening process involves non-negligible labor cost; itis thus interesting to estimate the straightening impact onthe production workload in order to improve the researchof an optimal solution. The cost assessment of the platestraightening is done by using a general formula linkingthe straightening cost to the scantlings and to other sec-tion characteristics (Caprace et al. 2006). This formula wasobtained through a data mining method, using statistical
Figure 4 Total production time versus plate thickness.
341Copyright C© 2007 Taylor & Francis SAOS 2007 Vol. 2 No. 4

Dow
nloa
ded
By:
[Rig
o, P
.] A
t: 17
:01
5 D
ecem
ber 2
007
T. Richir, J.-D. Caprace, N. Losseau, E. Pircalabu, C. Toderan and P. Rigo
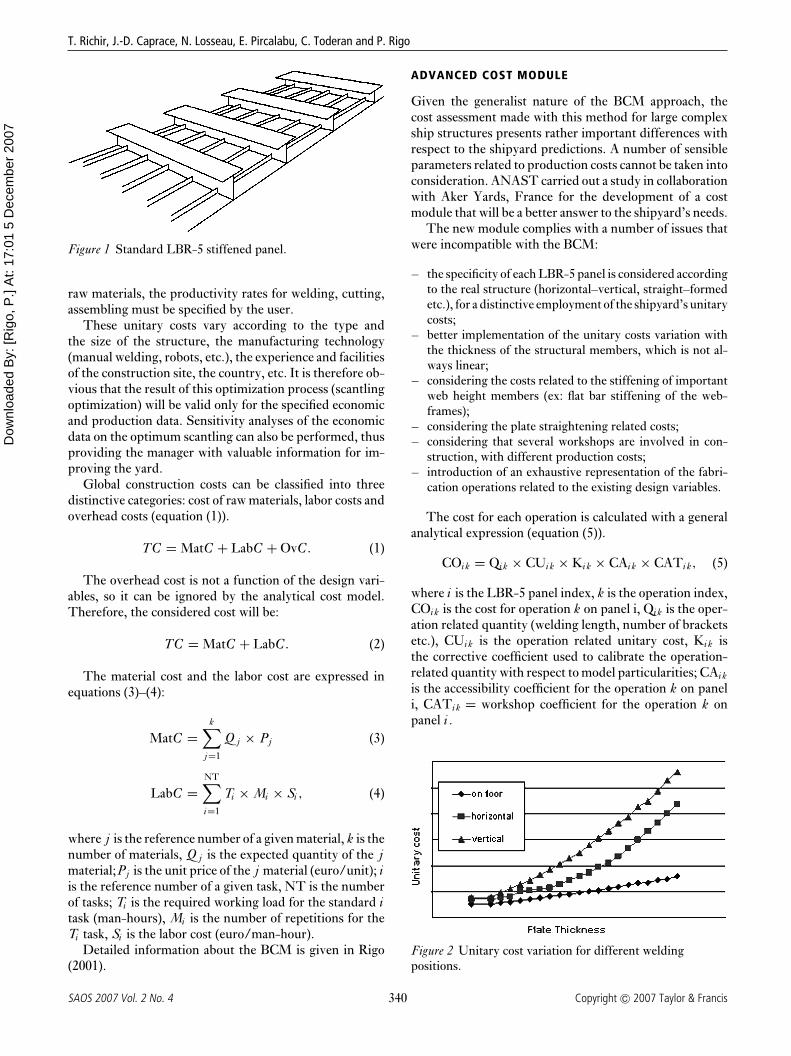
Figure 5 Straightening costs for different regions of the ship.
data on straightening costs for a number of 12 ships builtby Aker Yards, France. Figure 5 illustrates the variation ofthe straightening costs (in hours/m2), for different regionsof the ship, as a function of the weight of the defined lots.
STRUCTURAL MODEL
The ACM will be applied to study the cost minimizationof a large passenger vessel. With an overall length of over300 meters and a breadth of more than 32 meters, this isan “over-panama” class cruise ship.
The LBR-5 model of the ship’s mid-section was im-ported from an existing Mars2000 (scantling verificationsoftware based on Bureau Veritas Rules) model preparedby Aker Yards, France. LBR-5 disposes of a data-transfermodule allowing the importation of Mars2000 geometryand loads. Figure 6 shows an imported mid-ship section(transversal members and pillars were added manually).A number of 98 LBR-5 panels were used to define themodel (77 LBR-5 plates and 21 pillars). Based on structuresymmetry, only half of the structure was modelled.
Five load cases were considered for the calculation:
– sagging wave vertical bending moment with a probabilityof 10−8; still water pressures; static deck loads;
– hogging wave vertical bending moment with a probabilityof 10−8; still water pressures; static deck loads;
– sagging wave vertical bending moment with a probabilityof 10−5; still water and wave pressures; static deck loads;
– hogging wave vertical bending moment with a probabilityof 10−5; still water and wave pressures; static deck loads;
– no bending moments; still water and wave pressures; staticand inertial deck loads.
Bending efficiency coefficients were considered in orderto take into account the participation degree of each deck Figure 6 LBR-5 model of the mid-ship section.
342SAOS 2007 Vol. 2 No. 4 Copyright C© 2007 Taylor & Francis

Dow
nloa
ded
By:
[Rig
o, P
.] A
t: 17
:01
5 D
ecem
ber 2
007
Least cost optimization of large passenger vessels
to the longitudinal bending. These coefficients are directlyimported from the Mars2000 model.
Other load cases including shear forces must be consid-ered when shear stresses are significant in the consideredsection.
OPTIMIZATION MODEL
The design variables used in the optimization are (for eachLBR-5 stiffened panel):
– plate thickness;– web height (longitudinal and transversal members);– web thickness (longitudinal and transversal members);– flange width (longitudinal and transversal members);– spacing (longitudinal and transversal members).
Technological restrictions were assigned to the designvariables in order to define the search space for the op-timization problem. These restrictions are formulated onthe basis of technological limitations, like minimum platethickness considering corrosion, or the maximum size orthickness of plates and members with respect to weldingprocess.
The structural restrictions imposed throughout themodel to satisfy the limit states are related to:
– plate buckling based on Hughes formulations (Hughes1988);
– ultimate strength of beam column (Paik and Thayamballi2003);
– yielding in plates and longitudinal stiffeners;– yielding in transversal members at web-plate and web-
flange junction.
The structural restrictions are imposed for each loadcase, and when needed, on more than one point of theLBR-5 panel.
In order to preserve rational proportions between thedifferent design variables, the following geometrical re-strictions were applied, for both longitudinal and transver-sal members:
– plate thickness/web thickness ratio
δ � 2 × Tw (10)
– flange width/web height ratio
0.625 × D f � Dw � 2.5 × D f (11)
Table 1 Size of the optimization problem
Type of constraints Number of constraints
Technological 627Structural 4109Geometrical 622Equality 137Global 1
– plate thickness/web thickness ratio
0.5 × Tw � δ � 2 × Tw (12)
– web slenderness
Dw � 120 × Tw (13)
– flange thickness/web thickness ratio
Tf � 2 × Tw (14)
– flange width/flange thickness ratio
8 × Tf ≤ D f ≤ 32 × Tf , (15)
where δ is the plate thickness, Tw is the web thickness, D fis the flange width, Dw is the web height, Tf is the flangethickness.
Obviously the results will change if we select other ge-ometrical constraints, but not significantly.
A number of equality constraints between design vari-ables belonging to different panels were also imposed inorder to reach a rational and exploitable solution. For in-stance, transversal member’s spacing is considered equal allover the midship section, and plate thickness and transver-sal members web thickness are supposed to be constant oneach deck. These constraints are imposed by the shipyardto standardise the production.
Figure 7 Structural result—von Mises stress.
343Copyright C© 2007 Taylor & Francis SAOS 2007 Vol. 2 No. 4

Dow
nloa
ded
By:
[Rig
o, P
.] A
t: 17
:01
5 D
ecem
ber 2
007
T. Richir, J.-D. Caprace, N. Losseau, E. Pircalabu, C. Toderan and P. Rigo
Figure 8 Gain obtained with the BCM.
A global restriction relative to the gravity centre verticalposition was imposed to restrict its variation between fixedlower and upper limits.
The size of the optimization problem is illustrated inTable 1.
CALCULATIONS
Due to the international competition between shipyards,a lot of valuable information will not be mentioned inthe present paper. Nevertheless, the authors acknowledgeAker Yards, France for its courtesy for allowing use oftheir results. In this paper, data are mainly presented interms of ratios to avoid publishing sensitive confidentialquantitative data.
The structural optimization was performed with boththe BCM and ACM, and a comparative analysis has beencarried out on the optimal configurations. These config-urations (scantlings) are “feasible” solutions, which meanthat all the constraints imposed to optimization are sat-isfied. An example of structural result (von Mises stress)given by LBR5 graphical user interface is shown in Figure7. The convergence of the cost objective function requiredonly five iterations for both cost modules (Figures 8–9).
The results revealed differences between cost assess-ments of the two modules, but also in terms of cost savings,which was expectable as the sensitivities of the design vari-ables are less realistic with the BCM, compared to directcost calculation. Figures 8 and 9 show the BCM respec-tively ACM gains in terms of production costs, consideringas reference the initial design cost assessments.
Figure 9 Gain obtained with the ACM.
Table 2 Scantlings comparison
Structural item Ship region BCM % ACM %
Plate thickness Upper deck −100 −80Double bottom −30 −31
Stiffener modulus Upper deck −183 −286Double bottom −262 −260Neutral axis +32 +32
Stiffener spacing Upper deck +38 +38Lower decks +20 +20Double bottom −34 −34
Transversal spacing Overall +20 +20
The initial cost assessment shows a difference of 20.4%between the BCM and the ACM calculations. The optimalsolutions present a 7.7% gain for the BCM and a 5.5% gainfor the ACM, meaning a 2.2% difference in gain. This gapis given by the different cost assessments on one hand andthe different sensitivities on the other. A way to evaluatethe effect of sensitivities alone is to assess the costs ofBCM-based optimal scantlings using the ACM approachand then compare it with the ACM optimal solution. Thiscomparison resulted in a 0.93% gap, which means that42% of the difference between gains with BCM and ACMis due to the optimization process.
The general tendency for the ACM-based optimizationwas to increase the plate thickness with ∼80% on the upperdecks and ∼31% on the double bottom. The longitudinalmember’s section modulus also increased up to ∼286% onthe upper deck and ∼260% on the double bottom, whileit was reduced with ∼32% in the neutral axis region. Theplate and longitudinal members general increase is fullycompensated by a reduction of the number of stiffeners(∼27% for the transversals members respectively 20–38%for the longitudinal members), as well as a reduction by∼20% of the transversals section.
The same trend was observed with the BCM-based op-timization, the main differences in terms of scantlings arefound for the plate thickness and stiffener scantlings. Theplate thickness was increased with ∼100% on the upperdecks and ∼30% on the double bottom. The section mod-ulus for the longitudinal stiffeners increased with ∼183%on the upper deck and ∼262% on the double bottom; in theneutral axis region a 32% reduction is noted. The spacingof transversal members is the same for both methods, as itreaches each time the maximum limits of the technologicalrestrictions. Table 2 resumes the differences between thetwo calculations in terms of final scantlings.
CONCLUSIONS
This paper presents an example of scantling optimizationperformed with the LBR-5 software. The goal was to min-imise the production costs for a large passenger vessel usingthe two available cost assessment tools. Plate straighteningwas taken into account with both BCM and ACM.
344SAOS 2007 Vol. 2 No. 4 Copyright C© 2007 Taylor & Francis
Dow
nloa
ded
By:
[Rig
o, P
.] A
t: 17
:01
5 D
ecem
ber 2
007
Least cost optimization of large passenger vessels
A comparison was made between solutions found withthe two cost modules. The cost assessment made with theACM-based optimization was found to be about 20% lessoptimistic than the BCM approach. The ACM optimiza-tion found a 5.5% gain compared to the initial cost assess-ment, while the BCM found a 7.7% gain. The differencebetween these two ratios is the result of a more realistic costassessment and calculation of sensitivities for the ACM.
Nevertheless, the general optimization trend is similarto the two approaches, as plate thickness and longitudi-nal stiffeners section modulus grow, while the number oflongitudinal and transversal members decreases.
ACKNOWLEDGMENTS
The present research was achieved with the fundingand support of MARSTRUCT, Network of Excellencein Marine Structures (www.mar.ist.utl.pt/marstruct/),
IMPROVE (FP6 project - 031382 - funded by EU,www.anast-eu.ulg.ac.be) and AKER YARDS, France.
REFERENCES
Caprace JD, Bair F, Losseau N, Rigo P. 2006. A data mininganalysis applied to a straightening process database.COMPIT’07 Proceedings, pp. 186–196
Fleury C. 1989. CONLIN, an efficient dual optimizer based onconvex approximation concepts. Structural Optimization 1;81–89.
Hughes OF. 1988. Ship structural design: a rationally-based,computer-aided optimization approach, (Ed.) SNAME, NewJersey, p. 566.
Paik JK, Thayamballi AK. 2003. Ultimate limit state design ofsteel-plated structures, John Wiley and Sons, Chichester, UK.
Rigo P. 2001. A module-oriented tool for optimum design ofstiffened structures. Marine structures, vol. 14/6, Elsevier pp.611–629.
345Copyright C© 2007 Taylor & Francis SAOS 2007 Vol. 2 No. 4
Dow
nloa
ded
By:
[Rig
o, P
.] A
t: 17
:01
5 D
ecem
ber 2
007
346SAOS 2007 Vol. 2 No. 4 Copyright C© 2007 Taylor & Francis