Shipping Review 2014
32
Allianz Global Corporate & Specialty Safety and Shipping Review 2014 2014 Shipping Losses By location, type of vessel and cause An annual review of tre nds and developments in s hipping losses and saf ety 2013 in Review Trends and developments affecting shipping safety Future challenges Important issues and key risks Container ship MOL Comfort on fire off the coast of Yeme n in June 2013 (Photo: gcaptain.com)
Transcript of Shipping Review 2014

8/11/2019 Shipping Review 2014
http://slidepdf.com/reader/full/shipping-review-2014 1/32
Allianz Global Corporate & Specialty
Safety and Shipping
Review 2014
2014
Shipping Losses
By location, type of vessel
and cause
An annual review of trends and developments in shipping losses and safety
2013 in Review
Trends and developments
affecting shipping safety
Future challenges
Important issues and
key risks
Container ship MOL
Comfort on fire off
the coast of Yemen
in June 2013
(Photo: gcaptain.com)

8/11/2019 Shipping Review 2014
http://slidepdf.com/reader/full/shipping-review-2014 2/32
2
Allianz Global Corporate and Specialty
This review focuses on key developments in maritime safety during
2013, and analyzes shipping losses (of over 100 gross tons) during the
12 months prior to December 31, 2013. It follows the research published
in March 2013 by Allianz Global Corporate & Specialty (AGCS), entitled
“Safety and Shipping Review 2013”, available at www.agcs.allianz.com
Introduction
Sources: Wikimedia Commons, Gerolf Drebes/shipspotting.com, Lloyd’s List/MRCC Mumbai
Some of 2013’s notable losses included....
Tall Ship Astrid – in service since 1924 – which went
aground off Kinsale, on the south west coast of Ireland...
The 108-year-old Hantallar, which grounded off Tekirdag, Turkey
– the year’s oldest ship to be a total loss...
MOL Comfort, which broke in two and sank off the coast of Yemen
– the largest vessel lost in 2013

8/11/2019 Shipping Review 2014
http://slidepdf.com/reader/full/shipping-review-2014 3/32
3
Safety and Shipping Review 2014
• 94 large ships lost worldwide in 2013, down 20% year-on-year
• Losses centered on South China and South East Asia
• Cargo ships account for a third of losses. Foundering most common cause
• East Mediterranean & Black Sea region hotspot for incidents
• “Mega ships”, the Arctic and new fuels pose new risks
• Different piracy models present new challenges
With more than 90% of global trade estimated to be carried
by sea, the safety of international shipping vessels and
routes is critical to the health of the global economy. During
2013 there were 94 losses reported worldwide, ensuring
the annual total dropped under 100 for only the second
time in 12 years, continuing the recent downward trend.
Losses declined by 20% compared with 2012 when there
were 117 reported losses. The 2013 accident year also
represents a significant improvement on the previous
10-year loss average with total worldwide shipping losses
having declined by 45% since 2003 (174).
More than a third of 2013’s total losses were
concentrated in two maritime regions. As in 2012 (see page 12), South China, Indo China, Indonesia and the
Philippines was the region with the most losses (18),
closely followed by Japan, Korea and North China (17).
The most common cause of losses in 2013, and for the
last 12 years, was foundering (sinking or submerging)
[69], accounting for almost three quarters of all losses,
with bad weather a significant driver.
More than a third of the vessels lost were cargo ships
(32) with fishery (14) and bulk carriers (12), the onlyother vessel types to record double-digit losses.
For the first time the review also includes the total
number of shipping casualties/incidents by region.
There were 2,596 casualties during 2013 with the
East Mediterranean & Black Sea region the top hotspot
(464). The British Isles has been the scene of the most
casualties over the past decade (see page13).
January is the worst month for all casualties (including total
losses) in the Northern Hemisphere, with 23% more lossesin this month compared with the quietest month (June).
In the Southern Hemisphere it is July with 41% more
losses than April.
This year’s figures illustrate that the maritime industry
has continued to improve its safety record although
the quality of operations varies significantly in different
regions, underscoring the need for universal regulations
on ship safety to further reduce the risk of casualties and
loss of life.
More than two years after the Costa Concordia disaster
improving passenger ship safety continues to be a
priority with a particular focus on services in Asia, where
quality standards can be an issue. 2014 is likely to see the
100th loss of a passenger vessel since 2002. Meanwhile,
the total loss of two bulk carriers in 2013 – Harita
Bauxite and Trans Summer highlights the importance of
proper cargo handling and stowage.
An increasingly difficult operating climate for ship
operators has forced a number of innovations, including
larger ship sizes to capitalize on economies of scale
and the use of alternative fuels. Such scenarios present
new risks and challenges, particularly around crew
safety and training – it has been estimated that 80% * of
marine casualties are down to human error and lack of
skilled workforce is still an issue. The claims arising out
of maritime emergencies of “mega ships” can be huge,
such as if an accident was to block entrance to a port.
Trading routes are fast appearing in Arctic waters and
data shows the average number of shipping casualties
has increased to 45 per year between 2009 and
2013 from only seven during 2002-2007. Damage to
machinery caused a third of these incidents, higher than
the average elsewhere, reflecting the harsher operating
environment.
And although the number of piracy attacks declined by
over 10% during 2013, hotspots such as Indonesia andthe Gulf of Guinea saw their share of global incidents
increase. Differences in piracy models continue to create
challenges for the maritime community.
Executive Summary
Anticipated growth in
container ship capacity
by 2018
Time it can take to remove
all the containers from a
“mega ship” in the event
of an accident
30%
1 year
8/11/2019 Shipping Review 2014
http://slidepdf.com/reader/full/shipping-review-2014 4/32
4
2013: Losses in Focus
296
18
207
17
135
417
18
82 51
4
21573
96
6
9
8
505
Total Losses by region: from Jan 1 2002 - Dec 31 2013
Total Losses by region: from Jan 1 2013 - Dec 31 2013
All other regions
51
3
3
3
Source: Lloyd’s List Intelligence Casualty Statistics. Analysis: AGCS
Source: Lloyd’s List Intelligence Casualty Statistics. Analysis: AGCS
SHIPPING
LOSSES IN
NUMBERS
Total Losses by Top 10 Regions: 2002-2013 and 2013
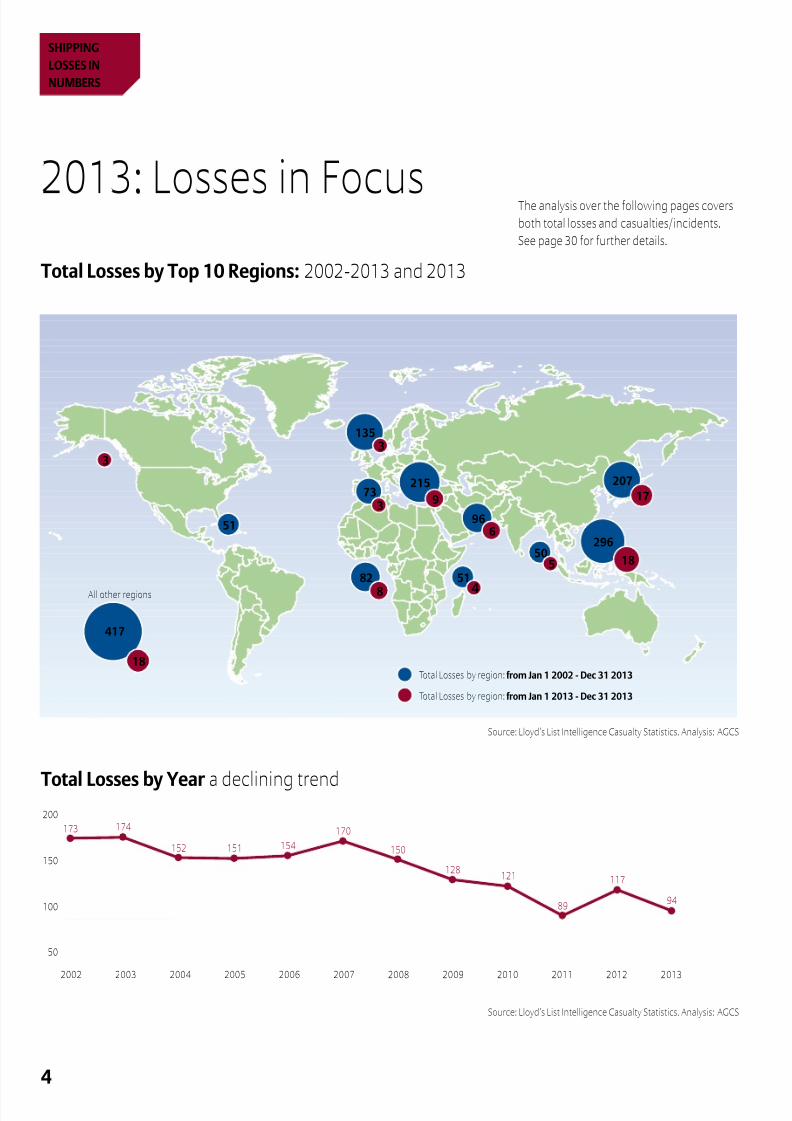
Total Losses by Year a declining trend
2002 2003 2004 2005 2006 2007 2008 2009 2010 2011 2012 2013
50
100
150
200
173 174
152 151 154
170
150
128121
89
117
94
The analysis over the following pages covers
both total losses and casualties/incidents.
See page 30 for further details.

8/11/2019 Shipping Review 2014
http://slidepdf.com/reader/full/shipping-review-2014 5/32
5
Safety and Shipping Review 2014
2013: More than a third of the losses were concentrated in two maritime regions. As in 2012, South China, Indo China,
Indonesia & Philippines had the most losses (18), down 11 year-on-year, closely followed by Japan, Korea and North
China (17), up 4, which replaced East Mediterranean & Black Sea in second position.
2002 - 2013: We have identified 1,673 losses worldwide over this period, an average of 139 per year. South China,Indo China, Indonesia & Philippines is the top “hot spot” while the British Isles, North Sea, English Channel and the Bay
of Biscay is still ranked fourth, despite improved loss activity in recent years. The US eastern seaboard dropped out of
the Top 10 regions in 2013 with 45 losses overall after not suffering a total loss last year.
We expect 2013 total losses to increase slightly as, based on previous years’ experience, developments in losses lead
to a number of total losses being confirmed after year-end. The average variance over the last 11 years has beenan increase of two total losses, but in some years this varies considerably with up to 11 additional total losses being
notified for one year.
Total Losses by Top 10 regions:
from January 1, 2002 to December 31, 2013
Total Losses by Top 10 regions:
from January 1, 2013 to December 31, 2013
S. China, Indo China, Indonesia & Philippines 18
Japan, Korea and North China 17
East Mediterranean & Black Sea 9
West African coast 8
Arabian Gulf and approaches 6
Bay of Bengal 5
East African Coast 4
British Isles, N. Sea, Eng. Channel, Bay of Biscay 3
Canadian Arctic and Alaska 3West Mediterranean 3
Others 18
Total Losses by Region 94
S. China, Indo China, Indonesia & Philippines 296
East Mediterranean & Black Sea 215
Japan, Korea and North China 207
British Isles, N. Sea, Eng. Channel, Bay of Biscay 135
Arabian Gulf and approaches 96
West African coast 82
West Mediterranean 73
West Indies 51
East African Coast 51
Bay of Bengal 50
Others 417
Total Losses by Region 1,673
Source: Lloyd’s List Intelligence Casualty Statistics. Analysis: AGCS
Source: Lloyd’s List Intelligence Casualty Statistics. Analysis: AGCS
Reported losses for 2013
currently run at eight
vessels per month
10 key shipping regions
contain 75% of losses
94losses
1,673losses

8/11/2019 Shipping Review 2014
http://slidepdf.com/reader/full/shipping-review-2014 6/32
6
Major Losses: 2013
SHIPPING
LOSSES IN
NUMBERS
Largest ships lost and all passenger vessel losses
MOL Comfort
Bulk
Cargo
Container
Passenger
Smart
Trans Summer
Fu Sheng Hai
Harita BauxiteAtlantik Confidence
Frotamerica
Branden
Kiani Satu
Setubal ExpressMassimo M
St Thomas of Aquinas
Spirit of Fiji Islands
Fajar SamuderaGP Ferry 2
Baleno 168Theodoros Maria Z
Vessels lost from Jan 1, 2013 to Dec 31, 2013
(including largest 10 vessels and all major passenger vessel losses) – showing location of
loss and type of vessel
Marks show the location of total losses reported between Jan 1, 2013 and Dec 31, 2013 with the largest 10 losses highlighted by ship type and all passenger losses.
8/11/2019 Shipping Review 2014
http://slidepdf.com/reader/full/shipping-review-2014 7/32
7
Safety and Shipping Review 2014
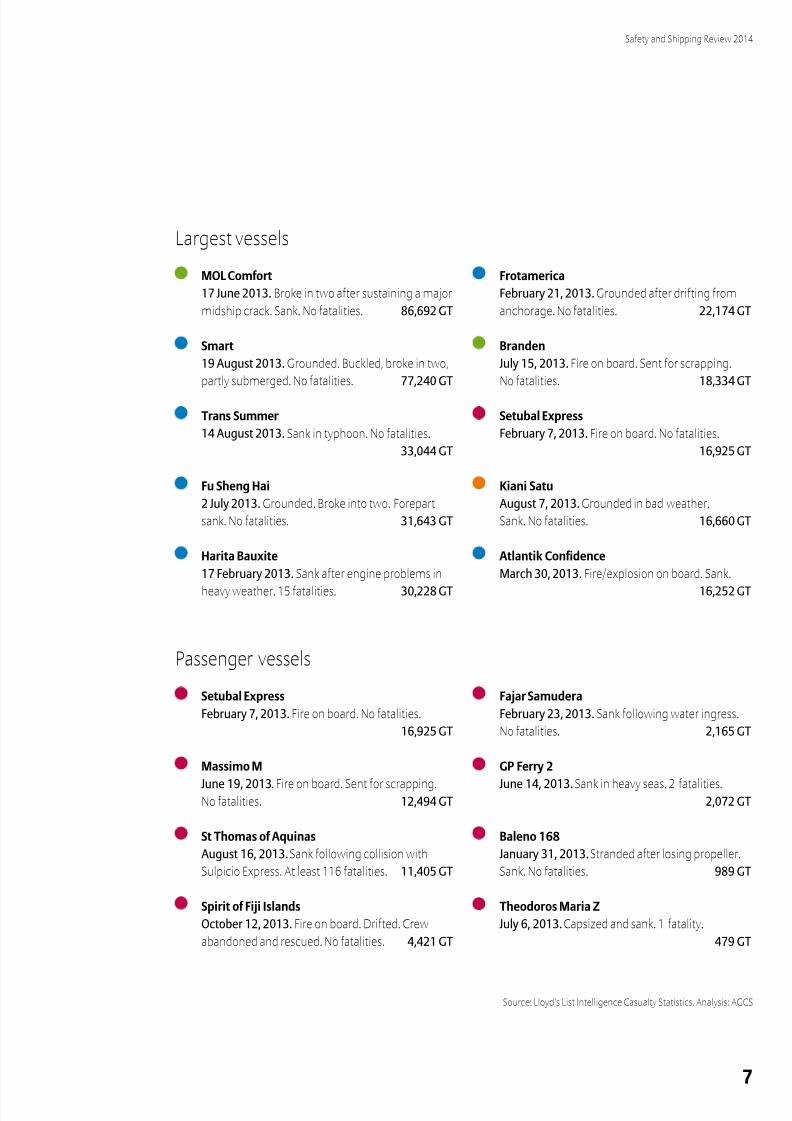
Largest vessels
MOL Comfort
17 June 2013. Broke in two after sustaining a major
midship crack. Sank. No fatalities. 86,692 GT
Smart
19 August 2013. Grounded. Buckled, broke in two,
partly submerged. No fatalities. 77,240 GT
Trans Summer
14 August 2013. Sank in typhoon. No fatalities.
33,044 GT
Fu Sheng Hai
2 July 2013. Grounded. Broke into two. Forepart
sank. No fatalities. 31,643 GT
Harita Bauxite
17 February 2013. Sank after engine problems in
heavy weather. 15 fatalities. 30,228 GT
Frotamerica
February 21, 2013. Grounded after drifting from
anchorage. No fatalities. 22,174 GT
Branden
July 15, 2013. Fire on board. Sent for scrapping.
No fatalities. 18,334 GT
Setubal Express
February 7, 2013. Fire on board. No fatalities.
16,925 GT
Kiani Satu
August 7, 2013. Grounded in bad weather.
Sank. No fatalities. 16,660 GT
Atlantik Confidence
March 30, 2013. Fire/explosion on board. Sank.
16,252 GT
Passenger vessels
Setubal Express
February 7, 2013. Fire on board. No fatalities.
16,925 GT
Massimo M
June 19, 2013. Fire on board. Sent for scrapping.No fatalities. 12,494 GT
St Thomas of Aquinas
August 16, 2013. Sank following collision with
Sulpicio Express. At least 116 fatalities. 11,405 GT
Spirit of Fiji Islands
October 12, 2013. Fire on board. Drifted. Crew
abandoned and rescued. No fatalities. 4,421 GT
Fajar Samudera
February 23, 2013. Sank following water ingress.
No fatalities. 2,165 GT
GP Ferry 2
June 14, 2013. Sank in heavy seas. 2 fatalities.2,072 GT
Baleno 168
January 31, 2013. Stranded after losing propeller.
Sank. No fatalities. 989 GT
Theodoros Maria Z
July 6, 2013. Capsized and sank. 1 fatality.
479 GT
Source: Lloyd’s List Intelligence Casualty Statistics. Analysis: AGCS

8/11/2019 Shipping Review 2014
http://slidepdf.com/reader/full/shipping-review-2014 8/32
8
Total Losses by type of vessel 2002-2013
SHIPPING
LOSSES IN
NUMBERS
Period B a r g e
B u l k
C a r g o
C h e m i c a l / P r o d u c t
C o n t a i n e r
D r e d g e r
F i s h e r y
L P G / L N G
O t h e r
P a s s e n g e r
R o - r o
S u p p l y / O f f s h o r e
T a n k e r
T u g
U n k n o w n
2002 4 7 63 7 2 3 40 2 16 13 6 1 2 7 173
2003 3 10 75 8 1 1 32 6 14 7 5 9 3 174
2004 2 8 58 10 4 33 1 4 9 8 3 2 9 1 152
2005 6 6 61 6 2 4 35 1 3 12 7 3 5 151
2006 6 8 61 11 4 3 23 3 12 10 3 2 7 1 154
2007 6 12 70 6 3 2 34 6 8 5 5 1 11 1 170
2008 3 8 58 7 2 4 37 1 6 4 8 1 3 7 1 150
2009 10 51 8 4 29 5 5 6 3 2 5 128
2010 1 11 60 5 5 1 22 3 3 1 2 3 4 121
2011 13 35 2 3 2 14 1 4 7 3 1 2 2 89
2012 8 57 8 5 2 12 1 3 6 5 3 1 6 117
2013 3 12 32 7 4 14 6 6 2 2 6 94
Total 34 113 681 85 35 26 325 7 65 99 68 27 23 78 7 1,673
Source: Lloyd’s List Intelligence Casualty Statistics. Analysis: AGCS
2002
2003
2004
2005
2006
2007
2008
2009
2010
2011
2012
2013
0 20 40 60 80 100 120 140 160 180
Barge Bulk Cargo Chemical / Product Container Dredger Fishery LPG/LNG
Other Passenger Ro-ro Supply / Offshore Tanker Tug Unknown

8/11/2019 Shipping Review 2014
http://slidepdf.com/reader/full/shipping-review-2014 9/32
9
Safety and Shipping Review 2014
Loss activity declined over the period in general. Together
cargo and fishing vessels have accounted for more than
1,000 losses since 2002, over 60% of the overall tally. Bulk
carriers are third (113). 2014 could see the 100th loss of
a passenger vessel since 2002.
Total Losses by type of vessel Jan 1 2013 - Dec 31 2013
Cargo
Other
Passenger
Ro-ro
Supply / Offshore
Tug
Fishery
Chemical / Product
Bulk
Container
Barge
Source: Lloyd’s List Intelligence Casualty Statistics. Analysis: AGCS
More than a third of losses were cargo ships (32) with
fishery (14) and bulk carriers (12) the only other vesselsrecording double-digit losses. Fishery and bulk losses are
up year-on-year.
Fishing vessels accounted for almost 15% of total shipping losses in 2013
Photo: Shutterstock
Barge 3
Bulk 12
Cargo 32
Chemical / Product 7
Container 4
Fishery 14
Other 6
Passenger 6
Ro-ro 2
Supply / Offshore 2
Tug 6
Total 94

8/11/2019 Shipping Review 2014
http://slidepdf.com/reader/full/shipping-review-2014 10/32
10
Causes of Total Losses 2002-2013
SHIPPING
LOSSES IN
NUMBERS
2 0 0 2
2 0 0 3
2 0 0 4
2 0 0 5
2 0 0 6
2 0 0 7
2 0 0 8
2 0 0 9
2 0 1 0
2 0 1 1
2 0 1 2
2 0 1 3
G r a n d T o t a l
Collision (involving vessels) 19 20 12 26 23 17 11 13 10 3 5 1 160
Contact (e.g. harbour wall) 2 2 3 5 2 2 1 1 2 20
Foundered (sunk, submerged) 48 63 75 57 64 70 75 61 65 43 55 69 745
Fire/explosion 35 21 20 16 19 17 16 14 11 7 12 11 199
Hull damage (holed, cracks, etc.) 22 12 5 8 4 11 4 7 4 3 5 85
Missing/overdue 1 3 1 1 1 7
Machinery damage/failure 16 13 9 8 11 14 8 6 4 6 12 2 109
Piracy 1 1 1 1 2 6
Wrecked/stranded (aground) 22 35 25 24 29 35 34 23 22 27 25 11 312
Miscellaneous 9 8 1 3 1 2 1 2 2 1 30
Grand Total 173 174 152 151 154 170 150 128 121 89 117 94 1,673
2002 2003 2004 2005 2006 2007 2008 2009 2010 2011 2012 2013
0
10
20
30
40
50
60
70
80
Collision (involving vessels)
Contact (e.g. harbour wall)
Foundered (sunk, submerged)
Fire/Explosion
Hull damage (holed, cracks, etc.)
Missing/overdue
Machinery damage/failure
Piracy
Wrecked/stranded (aground)
Miscellaneous
Source: Lloyd’s List Intelligence Casualty Statistics. Analysis: AGCS.
Foundering remains the main cause of loss, accounting for 45% of losses
since 2002. Piracy incidents regularly make the headlines but there
has not been a total loss from an attack since 2010 and just six in totalduring this period.

8/11/2019 Shipping Review 2014
http://slidepdf.com/reader/full/shipping-review-2014 11/32
11
Safety and Shipping Review 2014
Wrecked / Stranded
Machinery Damage / Failure
Fire/Explosion
Foundered
Collision
Number of losses
For the 12th successive year foundering (69) was the
most common cause of loss, accounting for almost three
quarters of all losses (73%). This was up on both 2012 –
55 (47%) and the previous 10-year average – 62 (44%).
Wrecking/running aground (11) and fire/explosion (11)
were the cause of the majority of the remaining losses,
although both were down on the prior year.
Source: Lloyd’s List Intelligence Casualty Statistics. Analysis: AGCS.
Causes of Total Losses Jan 1 2013 - Dec 31 2013
Collision 1
Wrecked / Stranded 11
Fire / Explosion 11
Machinery Damage /
Failure2
Foundered 69
Total 94

8/11/2019 Shipping Review 2014
http://slidepdf.com/reader/full/shipping-review-2014 12/32
12
Allianz Global Corporate and Specialty
Total losses by regions: 2002-2013, 2012 and 2013
Total losses
2002-2013
Total losses
2012
Total losses
2013
Year-on-year
Change
S. China, Indo China, Indonesia & Philippines 296 29 18 q 11
East Mediterranean & Black Sea 215 20 9 q 11
Japan, Korea and North China 207 13 17 Q 4
British Isles, N. Sea, Eng. Channel, Bay of Biscay 135 5 3 q 2
Arabian Gulf and approaches 96 4 6 Q 2
West African coast 82 2 8 Q 6
West Mediterranean 73 5 3 q 2
West Indies 51 4 2 q 2
East African Coast 51 4 4
Bay of Bengal 50 2 5 Q 3
United States eastern seaboard 45 3 q 3
Baltic 43 6 1 q 5
Gulf of Mexico 37 2 2
S. Atlantic and East coast S. America 37 1 1
Russian Arctic and Bering Sea 36 5 1 q 4
Iceland and Northern Norway 34 3 2 q 1
North American west coast 27 1 1
South Pacific 22 1 q 1
Canadian Arctic and Alaska 20 1 3 Q 2
Newfoundland 19
North Atlantic 14 1 2 Q 1
Red Sea 13
South American west coast 13 1 1
Australasia 13 2 2
North Pacific 13 1 q 1
Great Lakes 8 1 Q 1
Suez Canal 6
Not recorded (unknown location) 4 1 q 1
Indian Ocean 4 1 Q 1
Cape Horn 3
Kiel Canal 3 1 Q 1
Panama Canal 2
South Pole 1
Grand Total 1,673 117 94 q 23
2013 Total Losses in all regions
All figures based on
reported losses as of January 23, 2014

8/11/2019 Shipping Review 2014
http://slidepdf.com/reader/full/shipping-review-2014 13/32
13
Safety and Shipping Review 2014
2013: The East Mediterranean & Black Sea region was the location of the most casualties during 2013, accounting for
18% of all incidents. Of the 464 casualties just nine were total losses, less than two per cent.
All Casualties including Total Losses - Top 10 regions: 2013
East Mediterranean & Black Sea 464
British Isles, N. Sea, Eng. Channel, Bay of Biscay 360
S. China, Indo China, Indonesia & Philippines 252
Japan, Korea and North China 180
Baltic 174
Great Lakes 134Iceland and Northern Norway 122
Gulf of Mexico 97
West African Coast 93
West Mediterranean 72
Others 648
Total Casualties by Region 2,596
Source: Lloyd’s List Intelligence Casualty Statistics. Analysis: AGCSThese figures include
total losses of 94 during
this period
2,596total casualties
in 2013
1,94875% of casualtiesin top 10 regions
2002-2013: The British Isles, N. Sea, Eng. Channel, Bay of Biscay has been the location of the most shipping casualties
since 2002, reflecting the Strait of Dover’s status as the busiest international seaway. Nearly one in five of all losses
have occurred in this region. By comparison the S.China region, which has seen the most total losses during this period
(see page 5), is ranked only fourth for casualty incidents.
All Casualties including Total Losses - Top 10 regions: 2002 to 2013
British Isles, N. Sea, Eng. Channel, Bay of Biscay 5,025
East Mediterranean & Black Sea 3,940
Japan, Korea and North China 2,130S. China, Indo China, Indonesia & Philippines 1,991
Baltic 1,758
Great Lakes 1,542
West Mediterranean 956
Gulf of Mexico 868
North American West Coast 861
Iceland and Northern Norway 813
Others 7,231
Total Casualties by Region 27,115
Source: Lloyd’s List Intelligence Casualty Statistics. Analysis: AGCSThese figures includetotal losses of 1,673
during this period
27,115total casualtiesbetween 2002
and 2013
73%19,884 casualties
from the top10 regions

8/11/2019 Shipping Review 2014
http://slidepdf.com/reader/full/shipping-review-2014 14/32
14
2013 in Review
2013 IN
REVIEW
The maritime industry continued to improve its safety record in 2013, with a
particular focus on proper cargo handling and stowage. However, a disconnect
between quality operations in different regions has highlighted the need for a
blanket application of international regulations on ship safety to further reduce the
risk of casualties and loss of life.
The Costa Concordia wreck represented the industry’s largest salvage operation to date and highlighted the
concerns around the removal of today’s largest casualties. These are unchartered waters for salvors
Source: Titan Salvage

8/11/2019 Shipping Review 2014
http://slidepdf.com/reader/full/shipping-review-2014 15/32
15
Safety and Shipping Review 2014
Safety responses
The maritime industry’s regulatory body, the
International Maritime Organization (IMO) continued
its staunch focus on safety throughout 2013. It closely
monitors existing international legislation, while
working on new requirements resulting from increased
awareness of safety factors and the ever-changing
dynamics of the shipping industry.
As the IMO committee most in touch with shipping
safety, the Maritime Safety Committee (MSC) met in
June 2013 to discuss a number of recommendations and
amendments to safety-related regulations. Stemming
from concerns about passenger ship safety in the wake
of the Costa Concordia disaster off the coast of Italy in
January 2012, the committee adopted amendments to
the International Convention for the Safety of Life at Sea
(SOLAS) regulation III/19 to require musters of newly-
embarked passengers prior to or immediately upondeparture, instead of “within 24 hours”, as stated in the
current regulations. These amendments are expected
to enter into force on January 1, 2015. At the meeting,
the committee also discussed other recommendations
arising from the Costa Concordia incident, and approved
revised “Recommended interim measures for passenger
ship companies to enhance the safety of passenger
ships” and revised and updated a long-term action plan
on passenger ship safety i.
The MSC additionally discussed amendments to SOLASregulation III/19 on emergency training to mandate
enclosed-space entry and rescue drills, which will
require crew members with these responsibilities to
participate in a drill at least once every two months.
Enclosed and confined spaces can include cargo holds,
tanks, pump rooms and any other spaces which may
normally be kept closed or sealed. According to reports it
has been estimated that more than 50% of workers who
die in confined spaces are attempting to rescue other
workers who have found themselves in difficulty.
Amendments to the International Management
Code for the Safe Operation of Ships and for Pollution
Prevention (ISM Code) were also covered, including a
new requirement for companies to ensure that ships
are appropriately manned. Lifeboats were considered
with the approval, for adoption at MSC 93 in May 2014,
of a draft MSC resolution on requirements for periodic
servicing and maintenance of lifeboats and rescue boats,
as well as associated draft SOLAS amendments to make
these requirements mandatory.
Another regulatory adoption by the IMO in 2013
also promises to further improve safety of ships in
international waters. The IMO Assembly adopted the
IMO Instruments Implementation Code (III Code) in
December 2013, which provides a global standard to
enable states to meet their obligations as flag, port
and/or coastal states; the framework and proceduresfor the IMO Member State Audit Scheme; the 2013
non-exhaustive list of obligations under instruments
relevant to the III Code; and a resolution on transitional
arrangements from the voluntary to the mandatory
scheme.

8/11/2019 Shipping Review 2014
http://slidepdf.com/reader/full/shipping-review-2014 16/32
16
Liquefaction moves
While holistic safety regulations are to be welcomed,
some cargoes present particular challenges for the
shipping industry and require unique handling. In
this respect, the total loss of two bulk carriers in 2013
highlighted the importance of proper cargo handling
and stowage of bulk cargoes.
On February 17, 2013, the 1983-built, 48,891 dwt Harita
Bauxite sank off Cape Balinao in the South China Sea
carrying 47,450 metric tons of nickel ore – 15 of her 24
were crewmembers were killed. Then, the 2012-built,
56,824 dwt Trans Summer was on route from Indonesia
to China with a cargo of nickel ore when it sank on
August 14, 2013. While casualty reports have not beenreleased for either incident, AGCS experts believe high
moisture content and subsequent liquidization, leading
to free-flowing instability of the cargo to be the primary
cause of the accidents.
Dr. Sven Gerhard, Global Product Leader Hull & Marine
Liabilities, AGCS, explains that the large loss potential of
such an event is significant. “A brand new bulk carrier
could be insured for $20m; an even larger bulker could
be $40m. P&I Clubs have tried to make owners and
shippers aware of the risks and to promote efficientmitigation methods but time is money and commercial
pressures are great.”
Efforts are underway at the IMO to strengthen the
International Maritime Solid Bulk Code (IMSBC), which
regulates the loading and transport of bulk cargoes. The
IMO Sub-Committee on Carriage of Cargoes and Containers
(CCC) – formerly the Sub-Committee on Dangerous
Goods, Solid Cargoes and Containers (DSC) – adopted an
amendment with a nickel ore schedule and draft guidelines
to the IMSBC at its meeting in September 2013. Itentered into force on a voluntary basis from January 1,
2014 and becomes mandatory from January 1, 2015ii.
Recognizing the risk of liquefaction in other cargoes, the
CCC also agreed to a revised schedule for iron ore,
intended to address the dangers relating to liquefaction
of iron ore finesiii. The sub-committee also agreed draft
amendments to Appendix 2 to the IMSBC Code for the
inclusion of a new test procedure for determining the
transportable moisture limit (TML) for iron ore fines. A
draft DSC circular on early implementation of the
amendment was also agreed, which invites countries
that have ratified SOLAS to implement the draft
schedules ahead of the expected date of entry into force
of the IMSBC amendments (January 1, 2017).
There is particular concern that incidents of liquefaction
are centered on specific trades from Indonesia to China.
Singapore-based Captain Jarek Klimczak, Master Marinerand Senior Marine Risk Consultant at AGCS, believes that
there is an issue of quality and standards: “While the
IMO sets the regulation, each shipper must provide the
information on the moisture content of the cargo. So the
regulations are there, but, in some cases, they are not
always applied in Indonesia due to instances of
corruption and bureaucracy. While the quality carriers
will refuse to carry this cargo and quality insurance
companies will refuse to insure this cargo, some smaller
owners may decide to do so.”
Tim Donney, Global Head Marine Risk Consulting, AGCS
says one problem with cargoes that have a liquefaction
factor is that many of the loading ports for bulk cargo are
in areas that have a wet climate. They are often public
terminals with limited experience on the proper handling
and monitoring of these types of cargoes.
“A lesser risk would be a terminal that is dedicated to the
handling of a specific bulk product; then you have people
at the terminal that understand the risk better and have
tighter controls and procedures. Also, they’re not under asmuch time pressure to get ships loaded as a public terminal
with a backlog of ships waiting for dock space,” he says.
What is liquefaction?
All bulk ore and
concentrate cargoes
are likely to have some
moisture content.
However if the moisture
content of the cargo
reaches a specific level,
known as the flow
moisture point (FMP), the
frictional force will be lost
and the cargo will behave
as if it were a liquid. In
these circumstances it
will flow freely. As a result
of liquefaction, carrying
vessels may suddenly lose
stability, and take on a list
or even capsize.
Source:
www.martindale.com
The total loss of two bulk carriers in 2013 highlighted the importance of proper cargo handling and stowage of bulk cargoes Photo: Shutterstock
2013 IN
REVIEW

8/11/2019 Shipping Review 2014
http://slidepdf.com/reader/full/shipping-review-2014 17/32
17
Safety and Shipping Review 2014
Container crackdown
The container handling sector has also been the subject
of safety improvements, specifically to tackle the growing
concern around container weight misdeclaration and
misrepresentation. Inaccurate container weights have
an implication on safe transportation by road, rail and
sea as working limits of machinery can be compromised
by overloaded containers. A cross-industry debate was
encouraged by the IMO in 2013, which led to agreed
amendments to SOLAS Chapter VI to require verification
of gross weight of containers. The proposed changes to
SOLAS require verification of container weights before
loaded containers are placed aboard ships through one
of two accepted methods: weighing of boxes before they
are loaded or calculating overall weight through addition
of the weights of the constituent parts of a loaded container.
Senior Risk Consultant, Marine, AGCS, Captain Rahul
Khanna explains why the accurate declaration of thecontents of containers is an issue. “For shipping and
marine, a ship-owner or master has absolutely no control
on what’s inside the container, how it’s packed and
its declaration; it’s the responsibility of the shipper to
accurately declare the contents.”
Recognizing this, the
IMO, the International
Labour Organization
and the United Nations
Economic Commissionfor Europe have been
jointly working on a
new Code of Practice for
Packing of Cargo
Transport Units (CTUs).
The voluntary code
aims to clarify
responsibilities on
packing for everyone
involved in the chain.
“This is a very welcomeaddition to the IMO
technical publications
because it gives detailed calculations, procedures and
methods of handling packing of cargo in containers and
how the cargo inside the container is affect by external
forces. It also takes into account the road and rail legs of
the journey,” says Khanna.
Passenger ship quality issues
Improving passenger ship safety continues to be a
focus of attention for the IMO and the industry at large,
with a particular focus on services in Asia. In 2013, a
passenger ship casualty in the Philippines raised safety
concerns for smaller passenger ships operating in the
region. After a collision with the 1984-built, 11,464 dwt
cargo ship Sulpicio Express on August 16, the
Philippine-registered 1972-built ferry St Thomas of
Aquinas sank with the loss of at least 116 lives. The
incident has led to concerns that not all regional ferries
meet the IMO’s SOLAS and Stockholm standards, both ofwhich were adopted in response to the Herald of Free
Enterprise and Estonia passenger ship disasters.
AGCS’s Klimczak believes that the biggest problem with
ferry safety in Asia is quality. “The Thomas Aquinas was
built in 1972 – so quite an old vessel – and was under
Philippines class. Standards of local class in these areas are
completely different to international classification standards.
We have to ask how some Asian operators measure
safety and quality, particularly when speaking about
domestic trade shipping in South East Asia. Theunderstanding of quality and standards in parts of South
East Asia can sometimes appear 50 years behind Europe
– maybe even more – and it is difficult to find a solution
unless IMO is involved.”
“Understanding of quality and
standards in parts of South East
Asia sometimes appears 50 yearsbehind Europe”Safe working limits of machinery can be compromised byoverloaded containers
Photo: Shutterstock

8/11/2019 Shipping Review 2014
http://slidepdf.com/reader/full/shipping-review-2014 18/32
18
2013 IN
REVIEW
Structural challenges
While the loss of any ship is distressing, the rapid sinking
of the containership MOL Comfort ( pictured below )
off Yemen in June 2013 was particularly poignant. The
Bahamas-flagged, 2008-built, 90,613 dwt container
ship broke in two and both parts of the ship sank in
bad weather 200 nautical miles off the coast in deep
water. The crew was rescued but the total loss means
that ascertaining the cause of the incident is extremely
difficult. A primary report from classification society
ClassNK revealed that the fracture started at the bottom
of the vessel which could imply a structural weakness
in the hull. The effects of whipping and slamming – or
water impact loads – on the ship have also been studied.
On the back of this, ClassNK requested that all crews on
its ships undertake physical inspections of these areas
above and beyond what is normally done. Sister ships of
the MOL Comfort were all inspected from a structural
point of view and strengthened where appropriateiv .
“The other question is whether the ship could have been
improperly loaded,” says Donney. “They should be able to
resurrect those records, but were the container weights
accurate? Misdeclared cargo and overweight containersare still a problem in the maritime industry.”
Baltic Ace keeps focus on ro-ro safety
The sinking of another Bahamian-flagged ship at the
end of 2012 also kept the spotlight on ro-ro safety.
The 2007-built car carrier Baltic Ace (pictured)
collided with the Cyprus-registered container ship
Corvus J on December 5, 2012 and subsequently
sank in the North Sea. Carrying a cargo of 1,400 cars,
the collision occurred south of Rotterdam in one of
the world’s busiest shipping lanes. Thirteen of the
crew were rescued but five were confirmed dead
and a further six missing and presumed dead.
The rapid loss of the ship has raised questions on
the safety of ro-ro ships, which by design have large
open decks where relatively small water ingress can
have a serious impact on the stability of the ship. An
investigation of the casualty, led by flag state, the
Bahamas Maritime Authority is underway.
“Misdeclared cargo and overweight
containers are still a problem in
the maritime industry”
40%Percentage of hull
insurance claims caused
by machinery damage
Photo: gcaptain.com

8/11/2019 Shipping Review 2014
http://slidepdf.com/reader/full/shipping-review-2014 19/32
19
Safety and Shipping Review 2014
Technical test
Notwithstanding the structural concerns surrounding
the MOL Comfort loss, machinery damage continues
to be the cause of the majority of losses in marine
insurance, and insurers expect that this dominance
is only likely to increase further with the wider use of
low-sulfur fuels. Statistics from the International Union
of Marine Insurance (IUMI) report that 40% of hull claims
by number are machinery damage, accounting for 20%
of costs v . Posing the greatest threat to engines, cat fines
are a by-product of refining made up of small particles
of metal. These are deliberately added to marine fuels
to “crack” them. If they are not removed by purification
they can find their way into engine parts causing serious
damage and in the most extreme cases, lead to engine
failure. Marine fuel has long been filtered onboard ships;
however the fear is that a lack of knowledge on proper
handling for the grades of fuel available today is leading to
increased engine issues as a direct result of fuel damage.
The growing use of low sulfur fuels as a result of
stricter international legislation on sulfur limits of fuels
burnt on ships is exacerbating the problem. As these
require additional refining, more cat fines are present
in the fuel and once a cat fine finds its way into engine
parts, it is very difficult to dislodge.
There are a number of steps that can be taken to reduce
the scale of the problem including sampling and testing
of fuel before use, regular cleaning of filters, cleaningof settling and service tanks during dry dock, and better
monitoring of the fuel treatment efficiency.
“The fear is that we will see more and more cat fines
problems and more damaged engines,” says Khanna.
“In extreme cases the main engine might have to bestopped which could lead to a problem in a close quarter
situation, maybe even a collision or grounding,” he says.
“One of the problems has been the acceptable limit of
cat fines in the fuel as set by ISO, and accepted by IMO,
is quite high at 60mg. The engine manufacturers are
saying that as much as 15mg-20mg of cat fines in the
fuel could be enough to cause damage to the engine.
How to reduce this gap is a huge concern to the IMO
at the moment. Higher amounts of cat fines can be
dealt with by experienced and competent engineers onboard the ships but a lack of such engineers and lack of
training and awareness is also adding to the problem.”
What are cat fines?
Cat or catalyst fines
are hard, ceramic
compounds of aluminium
and silicon which are
used in the crude oil
refining process
“The fear is that we will see more and more cat
fines problems and more damaged engines.
In extreme cases the main engine might have
to be stopped which could lead to a problem
in a close quarter situation, maybe even acollision or grounding”
Lack of knowledge on proper handling for the grades of fuel
available today is leading to increased engine issues
Photo: Shutterstock

8/11/2019 Shipping Review 2014
http://slidepdf.com/reader/full/shipping-review-2014 20/32
20
Having first highlighted the need for additional research
into the damaging effect of cat fines in low sulfur fuels
in 2011, IUMI met with the International Association
of Classification Societies (IACS) Machinery Panel in
September 2013. The panel reported that possible
amendments with respect to facilities provided for
handling the fuel on board was still on their agenda for
consideration. Guidelines have also been issued by the
Joint Hull Committee explaining simple ways and
means of dealing with the problem, mainly revolving
around training and awareness of the crew in how to
handle cat fines.
Salvage evolution after Costa Concordia
With fears mounting on the increased risk of engine
failure due to cat fines, the challenges of salvage for
increasingly bigger ships remains. Here, the marine
salvage industry was put through its paces in 2013
when it embarked on the parbuckling of the grounded
cruise ship Costa Concordia off the coast of Italy.
The Costa Concordia wreck presented the industry’s
largest salvage operation to date and highlighted theconcerns around the removal of today’s largest casualties. “The salvage of the Costa Concordia was the largest
maritime salvage operation ever undertaken. It was an undertaking like we have never seen before and was a job
very well done,” says Global Head, Marine Risk Consulting, AGCS, Tim Donney.
“The Costa Concordia parbuckling has shown that the capacity is there to remove even larger vessels from
challenging parts of the world. From a wreck removal perspective size is not an issue, but it can increase the cost
quite significantly,” adds Dr. Sven Gerhard, Global Product Leader Hull & Marine Liabilities, AGCS.
However, while the parbuckling exercise was successful, the same approach cannot always be used as each
salvage operation for larger ships is unique to the incident, location, condition of the ship and other factors.
Cost can also be prohibitive: “According to reports, total cost of the salvage of the Costa Concordia will probably
exceed $2bn with the loss of the hull (value of the ship), the cost of wreck removal, third party P&I claims, oil spill
containment costs and environmental damage assessments. Not to mention the deaths of passengers and those
liabilities,” says Donney.
There is particular concern on the salvage limitations for the latest generation of container ships, and for the
larger versions expected in the medium term. “The sheer timescale of getting to the ships and getting the
containers off is staggering (in some cases it may take many months , or possibly a year or longer if the location is
remote). These are unchartered waters for salvors. I know that a few salvors are actively discussing what
equipment and procedures they would need. Some are going back to the drawing board,” adds Senior Risk
Consultant, Marine, AGCS, Captain Rahul Khanna.
Source: Titan Salvage
2013 IN
REVIEW

8/11/2019 Shipping Review 2014
http://slidepdf.com/reader/full/shipping-review-2014 21/32
21
Safety and Shipping Review 2014
Pollution control
Hand-in-hand with casualties and related salvage
operations is the threat of pollution either through leaked
bunker fuel or cargo. Prevention of oil pollution in US
waters has long been a priority for the American
government, a priority which was strengthened in 2013
by the publication of a new ruling. On September 30,
2013, the US Coast Guard published the “Nontank Vessel
Response Plans and Other Response Plan Requirements”
final rule, implementing the statutory requirement for an
owner or operator of self-propelled vessels of 400 gross
tons or greater operating on the navigable waters of the
US, and carrying oil of any kind as fuel for main propulsion,
to submit an oil spill response plan to the US Coast Guard.
The response plan requires operators to “plan for
responding to a worst-case discharge and a substantial
threat of such a discharge” vi. The rule became effective
on October 30, 2013.
While AGCS’ Gerhard believes that the ruling is not too
onerous for owners from a safety perspective, there are
issues around the contracting limitations of the
requirement. “There is a concern that there is a monopoly
being created as you can only contract with those
providers approved by the US Coast Guard, of which
there are a very limited number. It might take away the
steering of a casualty from ship-owners and insurers
towards the US authority.”
Donney adds: “Initially when the US started creating
national response requirements many states had their
own requirements above and beyond the federal
requirements, but the courts decided the federal
regulations would supersede these and that the US Coast
Guard would ultimately have the authority.
“It’s a fact of life for US operators, even for those that
only carry hazardous substances as fuel, and not cargo.
Now these regulations are being extended to any foreign
ships entering US waters. An international standard
would probably be better; each country having theirown environmental protection requirements for ships
entering their waters certainly makes it difficult for global
operators to be in compliance with all the regulations
and produce oil spill response plans for all countries
worldwide that their vessels might enter.”
Adequacy of fire-fighting capacity on board
large container ships called into question
Another safety challenge can be seen in the form of the fire-fighting capacity of
larger ships. Specifically, the adequacy of fire-fighting capacity on board largecontainer ships has come into question. In one incident in 2013, the 2010-built
Zim Rotterdam (pictured right of image) made an unscheduled call at the UK’S
London Gateway to offload cargo and undergo unspecified maintenance.
The ship was scheduled to call at Felixstowe to discharge cargo but a fire
on the previous journey had made maintenance necessary.
IUMI has noted that “insufficient fire-fighting capacity on board large container vessels is posing a challenge
that is only increasing with larger vessels”. In recognition of the growing problem, in June 2013, the IMO’s
MSC approved, for future adoption, draft amendments to SOLAS regulation II-2/10, concerning fire protection
requirements for on-deck cargo areas for new ships. Final approval is expected at MSC 93 in May 2014* .
*Source: (CURRENT ISSUES – IUMI POLITICAL FORUM, published 28 October 2013, http://www.iumi.com/committees/political-forum)

8/11/2019 Shipping Review 2014
http://slidepdf.com/reader/full/shipping-review-2014 22/32
22
In the pipelineAn increasingly difficult operating climate for ship operators has forced a number of
innovations, not least in growing ship sizes to take advantage of economies of scale, in the
use of alternative fuels and in ship designs, all of which are resulting in new risks. And while
potentially more economical trading routes are fast appearing in Arctic regions, other areas
of the world are becoming less attractive as piracy hotspots shift from the Gulf of Aden.
IN THE PIPELINE
Ship size issues
Last year’s deliveries and subsequent entry-into-service
of the largest container ships ever built had been eagerly
anticipated: the launch of Mærsk’s Triple-E class in
June 2013 came with a container carrying capacity of
18,000 teu. The arrival of “mega ships” is accompanied
by fears of increased insurance cost, increased risk,
concerns over salvage difficulties and safety concerns.
Yet 18,000 teu is not expected to be the cap on container
ship sizes; indeed, research anticipates the arrival of
24,000 teu ships by 2018. This continued growth offers
challenges for insurers.
By way of comparison in 2008 the largest vessel
accommodated 14,000 teu, resulting in an average
insured cargo value of approximately $280m, based on
an average value of $20,000 per teu. In 2013, an 18,000-
plus teu vessel resulted in an approximate insured cargo
value of $365m. AGCS calculates that capacity grows byaround 30% every four to five years, meaning the arrival
of 24,000 teu carriers can be anticipated around 2018,
“The large loss potential has increased for eventswhich are not extraordinary on these big ships”
The largest container ship in the world, the Maersk Mc-Kinney Møller. Capacity of container ships grows by 30% every four to five years creating challenges for insurers
Photo: Shutterstock

8/11/2019 Shipping Review 2014
http://slidepdf.com/reader/full/shipping-review-2014 23/32
23
Safety and Shipping Review 2014
taking the insured cargo value up to $480m. This, in
conjunction, with the vessel value, could push the total
exposure of one fully-loaded 24,000 teu container ship
over $700m.
AGCS’s Gerhard points to an incident with the 15,000-plus
teu Emma Mærsk in 2013 as an indicator of the issues
these larger ships could face in the future. The Mærsk
ship suffered propeller damage and subsequent water
ingress in February while transiting the Suez Canal.
Concerns were raised that the ship would sink, but
she was able to make an unscheduled stop at a port to
unload her cargo.
“A minor incident can really cause a major general
average claim on these ships. Port infrastructure to load
and unload such vessels is very limited, there are perhaps
eight or nine ports in the world where the Emma Maersk
can be unloaded and I doubt this will grow beyond say
16 in the next five to seven years,” he says. “The large
loss potential has increased for events which are not
extraordinary on these big ships.”
$700m
Insured value of fully-
loaded 24,000 teu
container ship, arrival
anticipated in 2018
Panamax (1980-) 3,000 – 3,400 teu 250x32x12.5m - $62m
Post Panamax (1988) 4,000 – 5,000 teu 285x40x13m - $49m
Post Panamax Plus (2000) 6,000 – 8,000 teu 300x43x14.5m - $98m
Triple E (2013) 18,000 teu 400x59x15.5m - $140m
Adapted with permission from
The Geography of TransportSystems, Jean-Paul Rodrigue
Insured vessel values: AGCS
Insured vessel values are
approximate. Based on value
on entering the fleet.
Allow +/- 10% variance
Cargo values not included
Fully cellular (1970-) 1,000 -2,500 teu 215x20x10m - $8m to $12m
Growth of container ship size and insured vessel values
The Triple E is equivalent to the length of 2 football fields, 2 ice hockey rinks and 2 basketball courts combined

8/11/2019 Shipping Review 2014
http://slidepdf.com/reader/full/shipping-review-2014 24/32
24
IN THE PIPELINE
Places of refuge
As very few ports in the world have the necessary
infrastructure to handle the Triple E series they have to
restrict the number of containers that can be loaded for
some calls. While ports are working to improve handling
capacity, this issue gives cause for wider concern on the
number of ports able to offer a safe place of refuge to a
ship of this size in distress.
The current practice concerning places of refuge is a
concern to insurers and while regulation exists to require
states to offer a place of refuge, these are not being
applied in all cases vii. In response to the concerns, the
European Commission created a Cooperation Group on
Places of Refuge which met for the first time on March
15, 2013 and is charged with assessing the need to
improve existing legislation.
On an international level, there are currently two IMOresolutions in place addressing the issue of places
of refuge for ships in distress: Resolution A.949(23)
“Guidelines on places of refuge for ships in need
of assistance” are for use when a ship is in need of
assistance but the safety of life is not involved; and
Resolution, A.950(23) Maritime Assistance Services,
which recommends that all coastal states should
establish a maritime assistance service to monitor a
ship’s situation, to act as a point of contact in the event of
an emergency, and to receive reports, consultations and
notifications required in a number of IMO instruments.
The issue is particularly acute in regions where a number
of countries border a body of water used for shipping,
such as in European Union waters.
“The current place of refuge regime and regulation is not
fully appropriate to cope with the risk that these larger
vessels present,” says AGCS’s Gerhard.
“What we have observed is as soon as the vessel transits
from one Exclusive Economic Zone (EEZ) to another
a new regime gets involved and every coastal state has
a different regime and various authorities that have
something to say.”
In this respect Gerhard refers to the UK’s approach to the jurisdictional problem. “The UK has had the Secretary
of States Representative for Maritime Salvage and
Intervention (SOSREP) regime since 1999 which gives
one authority the power to decide how to proceed with
a large casualty. This has been extremely successful and
the model is worth studying to see if this system could be
established on a European level in a similar way.
“The system we have at present where the ship in
distress gets handed to different authorities if it drifts
from one EEZ to the next is not the right way to deal withlarge vessels who present a risk of large environmental
claims and large financial liabilities.”
“The system we have at present
where the ship in distress gets
handed to different authorities if
it drifts from one EEZ to the next
is not the right way to deal with
large vessels who present a risk oflarge environmental claims and
large financial liabilities”
Singapore is one of the few ports that has the necessary infrastructure to handle the Triple E series
Photo: Shutterstock
161Number of container
ships in the Very Large
Container Ship (VLCS)
class (more than 10,000
teu), as of December 2012
Ports in the world that can
accomodate them
51

8/11/2019 Shipping Review 2014
http://slidepdf.com/reader/full/shipping-review-2014 25/32
25
Safety and Shipping Review 2014
New fuels pose increasing
safety questions
The demand for larger ships is in part related to the
operational savings that they offer and this drive for ever-
greater efficiencies and cost savings, in tandem with a
strict regulatory environment, has led to a rise in demand
for “greener” fuels.
Bio-fuels, hydrogen, compressed natural gas and
liquefied natural gas (LNG) all offer viable solutions
to power the global shipping fleet. Of these fuels, LNG
has captured the imagination of shipping lines. Last year
Bloomberg reported the global fleet of 42 LNG-powered
ships will almost triple by 2014 and increase 42-fold to
almost 1,800 vessels by 2020, according to DNV GL, the
largest company certifying the merchant fleet for safety.
Re-fueling of these ships is expected to take place atports and some European and Asian ports are already
preparing themselves to supply LNG. There are safety
concerns with this move, however, as the industry will
see the rise of ports that have never previously handled
LNG providing bunkering stations on dock.
Experts question whether this shift might compromise
the unblemished safety record of LNG. “We need to
ask what risks LNG-fueled ships will present to the
industry,” says Khanna. “The technology itself is not new;
the concern is storing the LNG as fuel and handling itonboard. LNG expertise is not easily available – there
needs to be a change in mindset and training.”
The Lloyd’s Market’s Joint Hull Committee has nominated
a committee to find out more about the risks associated
with LNG as a fuel, which will complement research
already completed, including the creation of a code by
classification societies on gas-fueled ships.
“The industry was well equipped to handle a few
ships here and there, but when this starts to become a
common choice of fueling ships then that changes the
game a little bit,” says Khanna. “We are not too late, but
this is the right time to start considering the challenges
and putting things in place to meet them. An even bigger
challenge is how do you actually bunker a ship with LNG?
How do you deal with LNG ashore? It is not something
that can be easily handled; it requires specialization,
technical expertise and know-how.”
“ An even bigger challenge is how
do you actually bunker a ship with
LNG? How do you deal with LNG
ashore? It is not something that
can be easily handled; it requires
specialization, technical expertise
and know-how”
A LNG carrier. LNG-fueled ships will present new risks to the industry
Photo: Shutterstock

8/11/2019 Shipping Review 2014
http://slidepdf.com/reader/full/shipping-review-2014 26/32
26
Arctic aspirations
While innovative designs and alternative fuels can help
improve profitability, potential new trading routes offering
reduced passages further boost savings. One area that is
being keenly watched in this respect is the Arctic, but an
interest in the opening up of trade routes in this region as
the permanent ice pack recedes brings with it environmental
protection concerns, salvage restrictions, navigation
complications and operations in freezing conditions.
According to the IMO, there has been a tenfold increase
in the number of vessels using the Northern Sea route
during recent years, with 46 ships recorded in 2012,
compared with 34 in 2011 and only four in 2010 viii.
Latest figures show 71 large ships, working mostly with
Russian icebreakers, navigated the route in 2013 but
Russia expects a 30-fold increase in shipping by 2020
and ice-free water over most of its length by 2050.Meanwhile, think tank, the Arctic Institute notes that the
polar research institute of China has suggested that , by
the year 2020, 5% to 15% of China’s trade value – about
$500bn – could pass through the Arcticix.
Development of logistics, supplies and infrastructure,
special qualifications for ships’ officers and the provisions
of adequate ice-breaking capacity all need consideration
in such a remote area, as do rescue and salvage operations.
Navigational technology in thehigh north is constrained as GPS
is not dependable at that latitude.
Also, there is currently a lack of
good charts, communication
systems and other navigational
aids, all of which pose challenges
for mariners.
Indeed, shipping casualties in
Arctic waters have increased to
an average of 45 per year during2009-2013 from only seven during
2002-2007. Damage to machinery
caused a third of these incidents, higher than the average
elsewhere, reflecting the harsher operating environment.
There are additional issues related to territorial waters
in the Arctic which has led to worry over the degree and
nature of the responsibility borne by coastal states for the
maintenance and support needed for Arctic navigation;
the implementation of the relevant provisions of the
United Nations Convention on the Law of the Sea
(UNCLOS) and other measures; the potential for offshore
exploration; and the protection of the unique marine
environment in the Arctic Ocean.
In recognition of the shift in traffic to these inhospitable
regions, the IMO has been proactively working to
establish a Polar Code.
This draft international code of safety for ships operating inpolar waters will cover the full range of design, construction,
equipment, operational, training, search and rescue and
environmental protection matters relevant to ships operating
in the inhospitable waters surrounding the two poles.
It is the combination of relevant requirements, provisions
and recommendations that have been developed by
the IMO over the yearsx. Currently, maritime activity in
the Polar regions is covered by four legislations: Marpol,
providing the mandatory level environmental protection
with zero discharge requirements for Antarctica; STCW,giving guidance and recommendations for training and
competency of officers and masters on ships in polar
regions; SOLAS, detailing safety requirements applicable
to all ships which are subject to the Convention and
operating in polar regions; and UNCLOS, offering the
legal framework governing the rights and responsibilities
of nations in their use of ocean space.
A working group aims to finalize the draft code in
2014 for adoption by the IMO’s MSC and the Marine
Environment Protection Committee (MEPC). “The PolarCode will be the first unified, comprehensive standard for
all operators in the Arctic,” adds AGCS’s Gerhard.
Opening up trade routes in polar regions brings navigationcomplications and environmental protection concerns
Photo: World Shipping Council
45
7
Average number ofcasualties in Arctic Circle
waters per year between
2009 and 2013
Average number of
casualties in Arctic Circle
waters per year between2002 and 2007
IN THE PIPELINE

8/11/2019 Shipping Review 2014
http://slidepdf.com/reader/full/shipping-review-2014 27/32

8/11/2019 Shipping Review 2014
http://slidepdf.com/reader/full/shipping-review-2014 28/32
28
The IMO has turned its focus to this region in an attempt
to emulate the success in reducing piracy incidents in the
Gulf of Aden.
But different piracy operating models will make the task
challenging as AGCS’s Donney explains. “For example, in
Indonesia and the Strait of Malacca, the modus
operandi isn’t to kidnap; these pirates just want the cash
aboard the vessel or to rob the crew of any valuables. It’s a
different situation to Somalia and Nigeria.”
“In Somalia , the model is to capture the ship and hold the
crew for ransom. While in the Gulf of Guinea, the model
seems to be kidnapping crew members off the ship and
holding them for ransom and, in some cases, rebel
groups simply attack and try to destroy a ship, particularly
oil tankers who are seen as “stealing” the nation’s wealth.
“Naval warships patrolling the waters and ships carrying
armed security contractors, has done a lot to mitigate
piracy in the Gulf of Aden. But in the Gulf of Guinea, only
the Nigerian navy can provide security services, which is
proving to be ineffective.”
Piracy model could be broken in Somalia in
“couple of years” if navies stay put
While there has been a significant drop in the number of reported
piracy attacks worldwide since 2012 – due in large part to the
dramatic reduction in Somali incidents, which accounted for over
50% of the attacks over the previous four years – the threat still
remains.
Crews should continue to be vigilant and to enforce all self-protection measures, the International Chamber of
Commerce’s International Maritime Bureau (IMB) tells Safety and Shipping Review 2014.
“We are not yet in a period where we can say that piracy has gone away. It would take just one successful
hijacking for the whole situation to quickly turn,” it says.
“The invaluable work done by navies around the Horn of Africa is a key reason for the reduction in piracy attacks
off Somalia. They have been able to use aerial surveillance and interdict pirate mother ships before they can
get into a position where they threaten shipping. They can also arrest and detain people on these vessels which
cannot be done in any other way.
“Therefore, it is absolutely vital that the international naval vessels remain in the Gulf of Aden; they play a role that
no one else can perform. Everything that has been gained over the past few years will quickly be whittled away if
governments decide to move their navies away from that area. In a couple of years we could well have broken the
piracy model in Somalia and that would be the time to think about this, but not before,” the IMB adds.
Actions taken by vessels themselves following the “Best Management Practices” and more determined resistance
to approaches by small boats have also helped, the IMB says, as has an increase in private armed security
professionals on board vessels.
Changes ashore in Somalia have played a part too. Although the crime happens at sea, the root causes of piracy
are ashore. Since September 2012, there has been a central government in Mogadishu. This has had a stabilising
influence which has led to the local coastal communities rejecting pirates. Without the support of thesecommunities, this form of piracy cannot take place.
IN THE PIPELINE

8/11/2019 Shipping Review 2014
http://slidepdf.com/reader/full/shipping-review-2014 29/32
29
Safety and Shipping Review 2014
As AGCS’s Khanna acknowledges: “It’s an area of concern
as we knew what worked in Aden, and we are hoping
that we do not have to start again in Nigeria.”
A significant challenge in the Gulf of Guinea is that there
are a number of states that need to be engaged to really
confront piracy. In recognition of this, in 2013, 22 states
signed a code of conduct concerning the prevention of
piracy, armed robbery against ships and illicit maritime
activity in west and central Africa. It was adopted formally
by a heads of state meeting in Yaoundé, Cameroon in Junexi.
The code requires signatories to assist in the prevention
of piracy, organized crime, terrorism, illegal fishing and
other illegal activities at sea and builds on the successful
Djibouti Code of Conduct, covering the repression of
piracy and armed robbery against ships in the Western
Indian Ocean and the Gulf of Aden.
The IMO has also called on countries to contribute to
a multi-donor trust fund to be established by the IMOfor the implementation of IMO projects for maritime
security in western and central Africaxii. Additionally, after
a successful pilot in Ghana in August 2012, in 2013 the
IMO pushed ahead with its “table-top exercises” which
determine procedures and responsibilities through a
number of evolving risk scenarios.
These discussions aim to develop and promote “a multi-
agency, whole of government approach to maritime
security and maritime law enforcement issues in states
throughout the region”xiii. The IMO also issued guidelines
on best practice in the Gulf of Guinea as a supplement
to its “Best Management Practices for Protection against
Somali-Based Piracy” (BMP4).
“To tackle piracy in the Gulf of Guinea, we need better
co-ordination and sharing of information between
coastal states. Unlike Somalia, there is no failed state in
the Gulf of Guinea; all the states are functioning entities.
These states need to be determined and take action to
wipe out piracy,” the IMB says.
“Human error is not something we can ignore;
a lack of skilled workforce is still an issue”
Key risks to the future safety of shipping
Eco ships
Alternative fuels
Piracy
Places of refuge
Increasing ship sizes
Ice shipping
Cargo handling and stowage
Salvage
Cat fines
Human errorOver-dependence
on technology
Lack of skilled workforce
Non-standardized training
Poor monitoring and
enforcement of regulation
Complacency
Reduced crewing numbers
Crew fatigue
Poor communications
Operational pressures
Inspections
Bureaucracy onboard
Source: Titan Salvage

8/11/2019 Shipping Review 2014
http://slidepdf.com/reader/full/shipping-review-2014 30/32
30
References
Data & sources
* BBC Radio 4’s Today Programme 27 February 2014
i http://www.imo.org/MediaCentre/PressBriefings/Pages/25-MSC-92outcome.aspx
ii http://www.gl-group.com/pdf/DSC_18_GL_Focus_News.pdf
iii http://www.imo.org/MediaCentre/MeetingSummaries/DSC/Pages/DSC-18.aspx
iv https://www.classnk.or.jp/hp/en/hp_news.aspx?id=622&type=press_release&layout=1
v CURRENT ISSUES – IUMI POLITICAL FORUM, published 28 October 2013,
http://www.iumi.com/committees/political-forum
vi http://www.regulations.gov/#!documentDetail;D=USCG-2008-1070-0049
Box source on pg 21 CURRENT ISSUES – IUMI POLITICAL FORUM, published 28 October 2013,
http://www.iumi.com/committees/political-forum
vii CURRENT ISSUES – IUMI POLITICAL FORUM, published 28 October 2013, http://www.iumi.com/committees/
political-forum
viii http://www.imo.org/MediaCentre/PressBriefings/Pages/37-arctic-voyage.aspx
ix The Guardian.com 1 February 2014 Russian Arctic city hopes to cash in
x http://www.imo.org/MediaCentre/HotTopics/polar/Pages/default.aspx
xi http://www.imo.org/MediaCentre/PressBriefings/Pages/23-westandcentralafricacode.aspx
xii http://www.imo.org/OurWork/Security/WestAfrica/Pages/WestAfrica.aspx
xiii http://www.imo.org/OurWork/Security/WestAfrica/Pages/WestAfrica.aspx
The primary data source for total loss and casualty
statistics is Lloyd’s List Intelligence Casualty Statistics
(data run January 23, 2014). Total losses are defined as
actual total losses or constructive total losses recordedfor vessels of 100 gross tons or over (excluding for
example pleasure craft and smaller vessels) as at the
time of the analysis.
Some losses may be unreported at this time, and as a
result, losses (especially for the most recent period) can
be expected to increase as late loss reports are made.
As a result, this report does not provide a comprehensive
analysis of all maritime accidents, due to the large
number of minor incidents, which do not result in a “total
loss” and to some casualties which may not be reportedin this database.
This year’s study analyzes reported shipping losses on a
January 1 to December 31 basis, as opposed to the 2013
study, which analyzed reported shipping losses during
the 12 months prior to November 25, 2012.
All $ US unless stated.
Allianz Global Corporate and Specialty

8/11/2019 Shipping Review 2014
http://slidepdf.com/reader/full/shipping-review-2014 31/32
31
Safety and Shipping Review 2014
Disclaimer & CopyrightCopyright © 2014 Allianz Global Corporate & Specialty SE. All rights reserved.
The material contained in this publication is designed to provide general information only. Whilst every effort has been
made to ensure that the information provided is accurate, this information is provided without any representation or
warranty of any kind about its accuracy and Allianz Global Corporate & Specialty SE cannot be held responsible for any
mistakes or omissions.
Allianz Global Corporate & Specialty SE Fritz-Schaeffer-Strasse 9, 81737 Munich, Germany
Commercial Register: Munich, HRB 208312
www.agcs.allianz.com
March 2014
Contact Us
Credits
For more information, please contact your local Allianz Global Corporate & Specialty Communications team.
Follow AGCS on Twitter @AGCS_Insurance
London
Jonathan Tilburn
+44 203 451 3128
Munich
Bettina Sattler
+49 89 3800 14303
Paris
Florence Claret
+33 158 858863
New York
Annika Schuenemann
+1 646 472 1580
Singapore
Wendy Koh
+65 6395 3796
Editor: Greg Dobie
Journalist: Carly Fields
Design: MediadesignCover image: gcaptain.com
Additional Image Credits: P16 - Shutterstock; P19: www.dnvusa.com; P21: Wikimedia Commons; P28: Shutterstock
www.agcs.allianz.com

8/11/2019 Shipping Review 2014
http://slidepdf.com/reader/full/shipping-review-2014 32/32
lli