
Shipping network design in a growing...
35
INSTITUTE of TRANSPORT and LOGISTICS STUDIES The Australian Key Centre in Transport and Logistics Management The University of Sydney Established under the Australian Research Council’s Key Centre Program. WORKING PAPER ITLS-WP-17-08 Shipping network design in a growth market: The case of Indonesia By Ningwen Tu 1 , Dimas Adiputranto 2 , Xiaowen Fu 2 and Zhi-Chun Li 1 1 School of Management, Huazhong University of Science and Technology, China 2 Institute of Transport and Logistics Studies (ITLS), The University of Sydney Business School, Sydney, Australia April 2017 ISSN 1832-570X
Transcript of Shipping network design in a growing...

INSTITUTE of TRANSPORT and LOGISTICS STUDIES The Australian Key Centre in
Transport and Logistics Management
The University of Sydney Established under the Australian Research Council’s Key Centre Program.
WORKING PAPER
ITLS-WP-17-08
Shipping network design in a growth market: The case of Indonesia
By Ningwen Tu1, Dimas Adiputranto2, Xiaowen Fu2 and Zhi-Chun Li1
1 School of Management, Huazhong University of Science and Technology, China
2 Institute of Transport and Logistics Studies (ITLS), The University of Sydney Business School, Sydney, Australia
April 2017 ISSN 1832-570X

NUMBER: Working Paper ITLS-WP-17-08
TITLE: Shipping network design in a growth market: The case of
Indonesia
ABSTRACT: This paper investigates the design issues of a shipping network when
cargo demand increases rapidly. A gravity-type model for origin-
destination (OD) demand estimation is first presented and calibrated
based on the current cargo volumes of the Indonesian maritime
market. A model for minimizing total system cost, which is the sum
of shippers' and carriers' costs, is then proposed to design the
shipping network with cargo demand levels forecasted for future
years. The results show that for the Indonesian maritime market,
although a hub-and-spoke (HS) network is appropriate for the
current low level of shipping demand, a point-to-point (PoP)
structure will be needed at higher traffic volumes in the future.
Additional domestic hub ports shall be developed as cargo demand
increases over time. The results suggest that a progressive policy can
be promising for infrastructure investments in developing countries:
government planning and regulations may be introduced in early
years to enhance infrastructure utilization and economic return.
With increased demand the market may be liberalized to promote
healthy competition.
KEY WORDS: Shipping network design, OD demand estimation, shipping cost,
hub port, international gateway, Indonesia
AUTHORS: Tu, Adiputranto, Fu and Li
Acknowledgements: Financial supports from the National Natural Science Foundation of
China (71525003, 71222107), University of Sydney and the Sydney
Southeast Asia Centre are gratefully acknowledged.
CONTACT: INSTITUTE OF TRANSPORT AND LOGISTICS STUDIES
(H73)
The Australian Key Centre in Transport and Logistics Management
The University of Sydney NSW 2006 Australia
Telephone: +612 9114 1813
E-mail: [email protected]
Internet: http://sydney.edu.au/business/itls
DATE: April 2017


Shipping network design in a growth market: The case of Indonesia
Tu, Adiputranto, Fu and Li
1
1. Introduction
The Republic of Indonesia, which consists approximately 17,500 islands, is an archipelago country in
Southeast Asia. According to BPS Statistics Indonesia 1 (2015), Indonesia is divided into 34
administrative provinces over five main islands and four archipelagos. The country shares land borders
with Malaysia, East Timor and Papua New Guinea, and marine boundaries with Singapore, Philippines
and Australia. As the world’s largest archipelago country, marine shipping is a major transportation
mode for Indonesia. The Indonesian president, Joko Widodo, has declared twice that he wants to
transform the country into a strong maritime nation, confirming the nation’s policy priority of
developing the maritime sector.
To achieve the vision of an economically strong maritime nation, the Indonesian government has
initiated several maritime programs. One program, called Pendulum Nusantara, was proposed by the
state corporation PELINDO 2 in 2012. The implementation, which started in January 2016, is
expected to be finished by 2018 (Desfika, 2016). This program plans to develop six main hub ports
connected with regular shipping services, as depicted in Figure 1 (Lino, 2012). The Pendulum
Nusantara program also includes the Sorong-West Pacific Hub Port Development Project, which aims
to develop the Port of Sorong into an international gateway in the West Pacific, connecting East Asia to
Oceania, as shown in Figure 2. The development of the new Sorong port alone is anticipated to cost
approximately IDR3.5 trillion (about US$245 million).2
Fig. 1. Proposed main routes for "Pendulum Nusantara".
(Source: Indonesian Ministry of National Development Planning, 2014)
1 BPS Statistics Indonesia (Badan Pusat Statistik Indonesia) is a national statistics office directly under the President of the
Republic of Indonesia. 2 IDR denotes the Indonesian Rupiah. As of 1 Dec 2016, US$1.0 approximates IDR14285.7. This exchange rate
will be used for currency conversion hereafter unless specified otherwise.

Shipping network design in a growth market: The case of Indonesia
Tu, Adiputranto, Fu and Li
2
Fig. 2. Sorong-West Pacific Hub Port Development Project.
(Source: Indonesian Ministry of National Development Planning, 2014)
Another major program is the Maritime Highway Initiative, which is an ambitious plan that consists of
the development of 24 strategic ports (5 hubs and 19 feeder ports) throughout the nation,
government-backed regular short sea shipping routes and the procurement of new vessels to be used on
those routes. The initiative also plans to upgrade regional hubs, Belawan or Bitung, into international
hubs that connect Indonesia's domestic network to international network. The Indonesian government
has allocated IDR700 trillion (approximately US$49 billion) to the Maritime Highway Initiative over a
course of 5 years. Figure 3 depicts the geographic location of the strategic ports and also one possible
scheme for how the feeder ports may connect to the proposed hub ports (Indonesian Ministry of
National Development Planning, 2014).
With great stakes for such mega-projects, a careful plan and policy assessment is needed before
significant investments are made into the related infrastructure. However, the above two programs, if
carried out independently, may lead to network and capacity redundancy, which would be very
inefficient for a developing country, such as Indonesia. For example, no consensus has been reached
with respect to the optimal development strategy for the Sorong port. The port serves as an international
gateway hub in the Pendulum Nusantara program, yet it only serves as a feeder port in the Maritime
Highway Initiative. Moreover, two separate international hub developments in the country’s east could

Shipping network design in a growth market: The case of Indonesia
Tu, Adiputranto, Fu and Li
3
cause unintended rivalry that might reduce the capacity utilization of both hubs. An inefficient domestic
shipping network could also reduce the operational efficiency and economic benefits linked to
international commodity trade (Halim et al., 2012). The Indonesian government thus needs to develop
a cost-efficient plan for the shipping network improvement at a strategic level.
Fig. 3. Geographic locations of 24 strategic ports.
(Source: Indonesian Ministry of National Development Planning, 2014)
Although the literature on shipping network design is well developed, few studies have analyzed the
case of Indonesia despite the huge investments involved. Cargo flow between origin-destination (OD)
pairs is the most significant input data for network formulation (Bell et al., 2011; Meng and Wang,
2011; Bell et al., 2013; Wang et al., 2015; Zheng and Yang, 2016). Data from different official
resources for Indonesia are, however, not entirely consistent. In certain cases, official figures from
provincial statistic agencies are inconsistent with national data. For example, the national statistics
record “Statistical Yearbook of Indonesia 2015” (BPS, 2016a) reports the amount of unloaded cargo in
Maluku province in 2015 to be over 1.7 million gross tons. However, Maluku’s own province record,
“Maluku Dalam Angka 2015” (BPS, 2016b) states that the amount of unloaded cargo in 2015 was
slightly less than 0.8 million gross tons. Such inconsistency in official records poses the challenges of
determining actual cargo volumes. Although data on loaded and unloaded cargoes (gross ton) are
available at the province level (BPS Statistics Indonesia, 2015), such data are aggregates of OD and
transshipment volumes for many destinations at a given port. They may not be directly usable for
network design, which requires port-to-port or province-to-province level data. Another challenge is
the consideration of shipping network design in a fast-growing market. Although there has been quite
some volatility in Indonesia’s economic growth over the past decades, it is generally believed that the
country can sustain fast expansion in economy and trade. This implies that an optimal design for the

Shipping network design in a growth market: The case of Indonesia
Tu, Adiputranto, Fu and Li
4
current market may not be the best choice for the future. In addition, as infrastructure investments
related to both ports and ships have been quite limited in previous years, a strategic plan for Indonesia
needs to take many cost items into consideration instead of focusing on a particular port or on
particular shipping companies. Such challenges probably explain why few studies are available in the
public domain.
In light of the above, to contribute to the development plan of ports and shipping networks in
Indonesia, we first propose an OD demand estimation model to forecast a reliable OD cargo demand
matrix for future years. A generalized shipping cost minimization model is then presented to optimize
the vessel type and vessel speed for carriers, and to minimize the total system cost (i.e., the sum of
shippers' and carriers' costs). This allows us to determine the optimal locations of hub and gateway
ports for the creation of an efficient hub-and-spoke (HS) network. The evolution of the optimal
network structure is subsequently discussed for different scenarios of cargo demand growth. Our
modeling results suggest that the total shipping cost decreases with the cargo handling rate and the
scale economy of ship size. At the current low level of cargo demand, an HS network is preferred
regardless of the cargo handling rate or the scale economy considered. However, as the cargo demand
increases and reaches a threshold, the optimal shipping network will prefer a point-to-point (PoP)
structure. Investments in ports and fleets should be planned accordingly in view of this changing
network pattern.
The remainder of this paper is organized as follows. Section 2 provides a brief review of the related
literature and highlights the contributions of the paper. Section 3 summarizes the market conditions,
input data compilations and the method to estimate the OD cargo demand matrix. Section 4 discusses
the details of model formulation for HS network design. In Section 5, the proposed models are applied
to the Indonesian maritime sector. The last section concludes the paper and provides recommendations
for further studies.
2. Literature review
HS networks offer many benefits, such as traffic flow consolidation, large network coverage and
simplified operations. They have been widely adopted by airlines, shipping companies,
telecommunication systems and logistics operations (Hendricks et al., 1995; Zhang, 1996; Hendricks
et al., 1999; Brueckner and Zhang, 2001; Hsu and Hsieh, 2005; Chong et al., 2006; Takano and Arai,
2008; Homsombat et al., 2011; Meng and Wang, 2011; Adler et al., 2014). Hubs serve as
transshipment points and replace large quantities of direct connections with fewer indirect connections.
O’Kelly (1987), one of the first to study the HS network, developed several heuristics to solve this
kind of problems. Several studies have examined waterborne networks based on the HS structure.
Shipping network design in a growth market: The case of Indonesia
Tu, Adiputranto, Fu and Li
5
Meng and Wang (2011) combined the HS and multiport-calling operations to study the liner shipping
service network design problems, but the candidate shipping lines were predetermined. Zheng and
Yang (2016) proposed a mixed-integer linear programming model to design an HS network for the
Yangtze River and supported the trends of cargo concentration. In Imai et al. (2009), the
multiport-calling and the HS network were compared and applied to the problem of the Asia-Europe
and Asia-North America trade lanes. Hsu and Hsieh (2005) applied a two-objective model to decide
whether to route a shipment through a hub or directly to the destination for a simple network. Chong
et al. (2006) proposed a heuristic procedure to solve the problem of scheduling and routing in a hybrid
HS network, which included direct delivery. Takano and Arai (2008) applied a new algorithm to solve
the p-hub median problem for containerized cargo transport networks. As HS networks have been
extensively used and studied, and have been chosen for the Indonesian Maritime Highway program,
we model the implications of such a network configuration for the Indonesian market. We consider
the 24 “strategic ports” included in the Maritime Highway program and compare alternative hub
schemes for the shipping network.
A large number of studies on shipping networks have been conducted. Tran and Haasis (2013) reviewed
the relevant literature and concluded that network design can be carried out with alternative objectives,
such as cost minimization, sailing and dwelling time minimization, shipping distance minimization,
travel and transit time minimization, profit and/or revenue maximization, shipping volume
maximization and other alternative objectives adopted in the industry and/or imposed by government
agencies in the case of container liner shipping. Network efficiency indicators have also been used, such
as Nagurney-Qiang measures, which reflect the weighted average of shipping volume per unit cost
(Nagurney and Qiang, 2008). Cost minimization has been widely applied to shipping problems, such
as several global-scale simulation models, namely, the World Container Model (Tavasszy et al., 2011),
Container World (Sinha-Ray et al., 2003) and GloTram-2 (Smith et al., 2011), and models developed
for the regional and national levels (see the multilevel modeling framework developed by Halim et al.,
2012). As shipping companies’ profits and revenues depend on market dynamics, which are difficult to
precisely predict in the long term, we choose the cost minimization as the objective function in this
paper to optimize the service quality of carriers and the choice of hub ports. As Indonesia is a
developing country with low average income, shippers and carriers are likely to be sensitive to transport
costs in the foreseeable future. Therefore, focusing on cost minimization is likely to offer more relevant
insights and recommendations to policymakers and the maritime industry in Indonesia.
As an important starting point for any network design, estimation of OD demand is of critical
importance for the Indonesian maritime sector. Munizaga and Palma (2012) argued that an OD
demand matrix is a fundamental prerequisite in a transport analysis for both research and policy
Shipping network design in a growth market: The case of Indonesia
Tu, Adiputranto, Fu and Li
6
planning purposes. However, they also emphasized that it is common to have major data gaps for
reliable estimation of cargo movements. This is a major challenge in the case of container shipping in
Indonesia, as there is no reliable cargo movement data at the province-to-province or port-to-port level.
Many studies have tried to estimate an OD matrix or point-to-point trade volumes through using
gravity type models or other mathematical solutions. To estimate a full OD matrix with limited data,
Levine et al. (2009) formulated an optimization model with which a disaggregated OD demand
representation can be generated with aggregated data and a gravity model. They used a case study to
identify the movement of containers shipped from international ports to final destinations in the U.S.
However, this method cannot be directly applied to the case of Indonesia due to significant differences
in data availability and aggregation level. Luo and Grigalunas (2003) developed a gravity model to
distribute U.S. containerized imports to states based on population. However, distance factor was not
included in the specification. Firdaus and Widyasanti (2010) applied a general gravity model to
measure the trade volumes between the domestic regions within Indonesia and found that interregional
trade tends to be higher in the Java region, which is the economic center of Indonesia. Banitya (2013)
applied a gravity model to identify the variables that affect Indonesia’s domestic trade. Because gross
domestic regional product (GRDP) and transport distance are important determinants of trade volume,
based on the findings of previous studies on network design and Indonesian trade and transport, a
gravity function similar to the specification in Silva and Tenreyro (2005) will be adopted in the
problem of estimating OD cargo demand matrix. As different port facilities and vessels are needed for
different types of cargoes (Zhuang et al., 2014), we focus on container shipping only. Compared to dry
bulk and tanker transport, container shipping plays a more important role in trade and economic growth
(Lau et al., 2013). In addition, bulk goods shipping mostly uses PoP networks, thus the associated
planning is relatively straightforward. The following section first introduces the input data used for the
analysis, followed by the specification of the models.
3. OD demand estimation and parameter calibration
3.1. Market definition and ports considered
Both the Pendulum Nusantara and the Maritime Highway programs planned in Indonesia involve a
large number of ports. Therefore, we consider shipping networks based on the 24 strategic ports that are
to receive funding and development support from the programs. Table 1 provides a list of the strategic
ports; their locations are displayed in Figure 3.

Shipping network design in a growth market: The case of Indonesia
Tu, Adiputranto, Fu and Li
7
Table 1 Strategic ports.
No. Port Name Abbrev. Status No. Port Name Abbrev. Status
1 Malahayati P1 Feeder 13 Banjarmasin P13 Feeder
2 Belawan P2 Hub 14 Balikpapan P14 Feeder
3 Batam P3 Hub 15 Samarinda P15 Feeder
4 Teluk Bayur P4 Feeder 16 Pantoloan P16 Feeder
5 Jambi P5 Feeder 17 Makassar P17 Hub
6 Palembang P6 Feeder 18 Kendari P18 Feeder
7 Panjang P7 Feeder 19 Bitung P19 Hub
8 Tanjung Priok P8 Hub 20 Tenau Kupang P20 Feeder
9 Tanjung Emas P9 Feeder 21 Ternate P21 Feeder
10 Tanjung Perak P10 Hub 22 Ambon P22 Feeder
11 Pontianak P11 Feeder 23 Sorong P23 Hub
12 Sampit P12 Feeder 24 Jayapura P24 Feeder
To transform the data for loaded and unloaded cargoes from the provincial level to the port level, each
province is allocated to one of the 24 strategic ports based on the shortest distance from the province
capital to a port, and the ports’ loaded and unloaded cargoes are gathered from the provinces they
serve. To avoid data inconsistency problems, all of the data used for cargo and container movements
should come from the same source. Indonesia’s national records are used because they are more
detailed and cover all regions. The province-port pairs are shown in Table 2.
Table 2 Indonesian province-port pair.
No. Province Name Port No. Province Name Port
1 Aceh P1 18 Lampung P7
2 Bali P10 19 Maluku P22
3 Banten P8 20 Maluku Utara P21
4 Bengkulu P4 21 Nusa Tenggara Barat P20
5 Gorontalo P19 22 Nusa Tenggara Timur P20
6 Jakarta P8 23 Papua P24
7 Jambi P5 24 Papua Barat P23
8 Jawa Barat P8 25 Riau P2
9 Jawa Tengah P9 26 Sulawesi Barat P17
10 Jawa Timur P10 27 Sulawesi Selatan P17
11 Kalimantan Barat P11 28 Sulawesi Tengah P16
12 Kalimantan Selatan P13 29 Sulawesi Tenggara P18

Shipping network design in a growth market: The case of Indonesia
Tu, Adiputranto, Fu and Li
8
13 Kalimantan Tengah 12 30 Sulawesi Utara P19
14 Kalimantan Timur P14 31 Sumatera Barat P4
15 Kalimantan Utara P15 32 Sumatera Selatan P6
16 Kepulauan Bangka Belitung P6 33 Sumatera Utara P2
17 Kepulauan Riau P3 34 Yogyakarta P9
Both domestic and international shipping demands should be considered in the choice of shipping
networks. Currently, approximately 80% of the international trade in Indonesia is routed through the
Port of Tanjung Priok before entering or leaving international routes and thus this port is assumed to be
the international gateway for the current shipping network. In our model, international shipping to and
from other markets are aggregated to six major hub ports, as summarized in Table 3. This assumption is
consistent with the reality and allows us to focus on network modeling within Indonesia, which is the
main target of government investment plans.
Table 3 International port destination.
No. Region Port Name Abbrev.
1 ASEAN Singapore I1
2 North & East Asia Shanghai I2
3 The Americas Los Angeles I3
4 Oceania Melbourne I4
5 Europe Rotterdam I5
6 Africa & Rest of Asia Dubai I6
3.2. Specifications of cargo volume
Although we focus on container shipping, the available data on cargo movements are mostly in gross
tons. This requires a conversion of gross ton cargo to container volume. Statistics Indonesia (2015)
reported that in 2014, a total of 1,550,271,403 gross tons of cargos were shipped through the sea and the
World Bank (2016) reported that a total of 11,900,763 TEUs (twenty-foot equivalent unit) were shipped
in Indonesia. Leonardi and Browne (2010) indicated that 1 TEU carries approximately 10 tons of
cargos, which implies that container shipping accounts for approximately 7.7% of Indonesia’s sea
shipping. However, PELINDO 2 (2015) stated that there were 599,425,593 gross tons of cargos and
approximately 5,710,000 TEUs handled in Port of Tanjung Priok in 2015. This implies that container
shipping accounts for approximately 9.5% of Tanjung Priok’s sea shipping. PELINDO 3 (2015) also
reported that there were 463,851,457 gross tons of cargos and approximately 3,100,000 TEUs moving
into Port of Tanjung Perak in 2015, which suggests a market share of 6.7% for container shipping in
terms of tonnage. Based on these observations, the ratio of 7.7% for the overall Indonesia is between

Shipping network design in a growth market: The case of Indonesia
Tu, Adiputranto, Fu and Li
9
the ratio of 9.5% for Port of Tanjung Priok and the 6.7% for Port Tanjung Perak, which means that it
is feasible to transform the tonnage traffic to the container traffic by 7.7% in the model calibration.
Loaded and unloaded cargo tonnage at the strategic ports is gathered from BPS Statistics Indonesia
(2015), for which the same conversion rule with ratio 7.7% is used.
Still, detailed information about the shipping network in Indonesia and the operation details, such as
vessel size and number, shipping speed and transshipment volume, are not available to us. To make
the estimation process tractable, it is assumed that the current shipping network within Indonesia is
PoP and the loaded/unloaded cargo volume at ports can be treated as the demand generated at the
origin/attracted to the destination. The only exception is the Port of Tanjung Priok, which is the
biggest international gateway. It is assumed that the cargos from foreign ports enter Indonesia through
specific Indonesian gateways (e.g., Tanjung Priok). Thereby, the transportation of the international
cargos involves two networks: an international network and a domestic network. For the international
cargo demand, one thus needs to collect the data of the international cargo volume between foreign
ports and Indonesian international gateways, and the data of the cargo volume between the gateways
and other domestic ports. These data can be gathered directly from BPS Statistics Indonesia (2015).
We will discuss the related costs separately for domestic network and the international network later.
3.3. OD demand estimation
When both the total traffic volume generated at origin ports and the total traffic volume attracted to
destination ports are known, we can adopt a doubly constrained gravity model and the likelihood
estimation of parameters to estimate a reliable OD cargo demand matrix for Indonesian shipping
network. A general OD demand matrix pattern is shown in Table 4.
Table 4 OD demand matrix.
Destination
Origin 1 2 n
1 0 12q 1nq 1O
2 21q 0 2nq 2O
n 1nq 2nq 0 nO
1D 2D nD

Shipping network design in a growth market: The case of Indonesia
Tu, Adiputranto, Fu and Li
10
In Table 4, n is the total number of ports and ijq denotes the cargo demand between OD pair (i, j).
The last column represents the total cargo volume originating at each origin port and the last row
represents the total cargo volume attracted to each destination port (i.e. the sum of elements in each
row/column must equal to the total traffic generation or attraction).
The doubly constrained model has been widely used in transportation demand forecast and trip
distribution analysis (see Sheffi, 1985), and is specified as follows:
exp( ), , ,ij ij i j ijq K O D u i j (1)
subject to
, ,ij i
j
q O i (2)
, ,ij j
i
q D j (3)
where the OD cargo demand ijq is proportional to the total cargo volume originating at the origin
port i, iO and the total cargo volume attracted to the destination port j, jD . ijq is dependent on
the service level between that OD pair, exp( )iju , which is a negative exponential function of the
OD travel time iju . ijK is a constant, and is an unknown parameter to be estimated. Eqs. (2)
and (3) are the conservation constraints.
After some algebraic operations, the doubly constrained model (1)-(3) can further be written as
exp( ), , ,ij i j i j ijq A B O D u i j (4)
where
1, ,
exp( )i
j j ij
j
A iB D u
(5)
1, .
exp( )j
i i ij
i
B jAO u
(6)
Substituting Eqs. (5) and (6) into (4), one can indicate that the resultant OD demand ijq satisfies
constraints (2) and (3).
In Eq. (4), is an unknown parameter and needs to be calibrated. In this paper, the maximum
likelihood method can be adopted. To do so, we define the maximum likelihood function L as follows.
Shipping network design in a growth market: The case of Indonesia
Tu, Adiputranto, Fu and Li
11
( )!max ,
!
ijM
ij
ijij
ij
qML
M M
(7)
where ijM is the number of cargos observed to be transported from port i to port j and M is the total
number of cargos in the system, i.e., ,
ij
i j
M M . After rewriting Eq. (7) as the logarithm function
and deleting the constant parts, the calibration for the parameter in the OD demand can be stated
as follows (Boyce and Zhang, 1998).
max ln ( ) ln ( ),ij ij
ij
L M q
(8)
subject to Eqs. (4)-(6).
Boyce and Zhang (1998) showed that the likelihood function (8) is quite flat and the variation in the
value of could result in negligible changes in ln ( )L . Therefore, once one finds a value of
such that the estimated total cargo travel cost ,
( )ij ij
i j
q u approximately equals the actual observed
total cargo travel cost ,
ij ij
i j
M u , then that value of can be considered as its calibrated value. The
step-by-step procedure for estimating the value of in Eq. (8) is shown as below.
Step 1. Choose an initial value for parameter , represented as (1) , set the iteration counter to k = 1.
Step 2. Determine ( )( )k k
ijq in terms of Eqs. (4)-(6) by using furness iteration method (see Sheffi,
1985).
Step 3. If ( )
, ,
( ) 1k k
ij ij ij ij
i j i j
q u M u
( is a pre-specified precision), stop; otherwise,
update the value of as follows and return to Step 2.
( 1) ( ) ( )
, ,
( ) .k k k k
ij ij ij ij
i j i j
q u M u
(9)
The estimated and observed values are compared to produce a new value of for the next
iteration.
However, in reality the observed cargo flow moving from origins to destinations is not available for
most of OD pairs. Therefore, we adopt a minimization problem together with a exponential function

Shipping network design in a growth market: The case of Indonesia
Tu, Adiputranto, Fu and Li
12
as used in Silva and Tenreyro (2005) to generate an initial OD cargo flow to replace ijM in model
(8), expressed as
min ,i ij i j ij j
i j j i
O M O D M D
(10)
subject to
0 1 2 3exp ln( ) ln( ) ,ij ij i j i j ijM a a YY a O D a D (11)
where iY and jY are the GRDPs of regions i and j, respectively.
ijD is the distance between i and
j. ij is the error factor, and 0 3, ,a a are the unknown parameters to be estimated. ijM is
determined by the aggregated GRDP of the regions where the ports are serving for, the trade volumes
and the transport distance between the two ports. The objective function (10) aims to minimize the total
relative error between the observed volume and the volume predicted by the exponential function (11).
Inputting initial cargo flow ijM into model (8), can be updated in a subsequent search process
to produce an OD cargo demand matrix with minimum error.
3.4. Parameter calibration for the Indonesian maritime market
In order to estimate the OD cargo demand matrix for the Indonesian shipping network, the
expressions (10) and (11) are used to obtain an initial OD cargo demand matrix ijM that
minimizes the relative error between the estimated and observed cargo demands. Using 2014 domestic
data of Indonesia, the coefficients of the exponential function (11) are estimated as 0 19.4346a ,
1 0.0107a , 2 1.0085a , 3 0.0015a and 0.5746ij . Inputting the initial cargo volume
ijM into model (8) and adopting the solving procedure introduced above, the parameter can be
calibrated as a value of 0.3711, with an average error of less than 10-7 between the estimated OD cargo
demand ijq and the actual demand data. The future OD cargo demand matrix can then be
estimated using the gravity model (4)-(6) with value of 0.3711.
4. Shipping network design model
The shipping network design in this paper aims to determine an optimal HS network by locating
domestic hub ports and international gateway ports. Domestic hubs have the function to agglomerate
the domestic cargos, whereas the international gateways agglomerate the export/import cargos before
leaving/entering the domestic network. Without loss of generality, the following basic assumptions
are made for simplifying the modeling process:

Shipping network design in a growth market: The case of Indonesia
Tu, Adiputranto, Fu and Li
13
A1. The feeder ports, candidate domestic hubs and international gateways are pre-determined.
A2. Three stakeholders are considered in the shipping network to be designed, namely the authority
(the government), the shippers, and the carriers. The authority aims to determine the optimal
locations of hub and gateway ports in the HS network. The carriers seek to optimize the vessel
type and vessel speed to minimize its total shipping cost. The shippers choose their routes with
minimum travel cost.
A3. Each domestic feeder port could be linked to at least one domestic hub. Domestic hubs are fully
connected to each other. Each representative international port of the regions is directly linked to
unique gateway(s). Therefore, the whole network can be decomposed into the domestic network
and the international network.
A4. Cargo transfers at hub ports en route do not exceed twice. If the sailing distance between the
origin and the destination is less than threshold, direct delivery must be used.
For presentation purposes, some notations used in this paper are defined as follows.
N set of all ports, which consists of domestic ports and international ports
DN set of domestic ports
IN set of international ports i.e., D IN N N
A set of shipping legs
a a shipping leg which is defined as the direct linkage between ports, a A
ijR set of routes between OD pair (i, j)
H set of all hub ports
G set of all gateways
H set of candidate hub ports , DH N
G set of candidate gateways, DG N
4.1. Shippers' route choices
A shipping network involves three types of participants: ports, carriers and shippers. Ports are the
interfaces between ground transportation and waterborne transportation, where many cargo handling
activities can be performed. Carriers provide transport services, whereas shippers aim to minimize the
generalized transport costs, which include the price paid to carriers and the time cost during cargo
transportation (Hsu and Hsieh, 2005, 2007; Talley, 2014). According to assumption A3, the
transportation of international cargo includes that in the domestic network and that in the international
network. The shippers' route choices on these two networks are thus presented as follows.
Shipping network design in a growth market: The case of Indonesia
Tu, Adiputranto, Fu and Li
14
4.1.1. Travel cost and route choice in domestic network
The transport time on route ijr R , represented as
rT , includes the voyage time, rTS , on the sea
and handling time at the transshipment port, rTH . The voyage time per TEU,
rTS , is determined by
the nautical distance and the ship’s velocity as follows:
, , , ,24
a ar
r ij D
a A a
DTS r R i j N
V
(12)
where aD , measured in nautical mile, is the shipping distance of leg a. aV is the vessel speed (in
knot). 1ar means route r contains leg a, and 0ar , otherwise.
Port handling time can be separated into two categories, namely the handling time at
origin/destination ports and the handling time at hub ports. The handling time at origin/destination
ports is composed of the loading or discharging time, while the handling time at transshipment hubs
contains both discharging and loading time, which are all proportional to the handling rate and
transshipment volume. Let iA
represents the set of legs with port i N as a head node and iA
represents the set of legs with i N as a tail node. Therefore, the total handling time per TEU by
using route r is computed as
, , , ,24 24 24 24
i h h j
a ar a ar a ar a ar
r ij
h Ha A a A a A a A
S S S STH r R i j N
(13)
where aS (in TEU) is the vessel size on leg a and (TEUs/h) is the number of containers that can
be discharged or loaded at the port per hour.
Let rU be the total time cost for cargo shipping on route r. The minimum time cost between OD pair
(i, j) can then be expressed as
* min( , ), , ,r r ij DU U r R i j N (14)
where
( ), ,r r r ijU TS TH r R (15)
where is the shipper’s value of shipping time. r denotes the optimal shipping route between
OD pair (i, j).

Shipping network design in a growth market: The case of Indonesia
Tu, Adiputranto, Fu and Li
15
Once the optimal shipping route r is determined for each OD pair, the shipping demand is then
assigned to that route, i.e.,
, , , , ,
0, otherwise,
ij
r ij D
q r rf r R i j N
(16)
where rf is the cargo shipping demand on route r and the shipping demand
ijq is the aggregated
demand between port pair (i, j). If both ports i and j are not the gateway ports, then ijq represents
only the domestic demand (i.e., ijq ), which can be obtained by the OD demand estimation model
proposed in the previous section. However, if one of the two ports, port i or j, is a gateway, ijq is the
sum of the domestic demand and the international demand passing through that gateway.
4.1.2. Travel cost and route choice in international network
The international network adopts the PoP structure, and the international cargos are transported
directly between foreign ports and Indonesian gateways. The minimum time cost between origin
Ii N and the international gateway can be expressed as
* min( , ), ,r r ig Ig G
U U r R i N
(17)
where
2 , , ,24 24
a ar a ar
r ig Ig G
a A a
D SU r R i N
V
(18)
where the bracket in Eq. (18) represents the total time consumption on leg a of route r, in which the
first term in the bracket denotes the sailing time and the second term denotes the handling time at
origin and destination port. Therefore, the international shipping demand is assigned according to the
following shortest-route rule:
, , , ,
0, otherwise,
D
ij
j Nr ig I
g G
q r rf r R i N
(19)
where
D
ij
j N
q
is the total export cargo demand leaving international port Ii N . The import cargo
demand entering port Ii N ,
D
ji
j N
q
, can also be assigned to the corresponding routes in the same
way.

Shipping network design in a growth market: The case of Indonesia
Tu, Adiputranto, Fu and Li
16
4.2. Carriers' decisions on vessel size and velocity
Carriers determine the service quality and shipping operations for their operating network, such as
vessel type, velocity and frequency, to attract cargos and minimize their shipping costs. The total
shipping cost for a carrier contains three categories of costs, namely sailing-related costs, port-related
costs and container-related costs. Sailing-related costs include the fuel cost during voyage and the
daily charter and operating cost. The daily fuel cost per vessel is estimated to be proportional to the
cube of vessel velocity and the fuel efficiency of the vessel, the vessel capacity and the fuel price
(Corbett et al., 2009; Wang et al., 2015). The specified expression for daily fuel cost, FCC , (in US$)
is as follows.
3 ,FCC SV (20)
where V (in knot) is the vessel velocity. S (in ton) is the vessel capacity. (in ton1/2/knot3) is the fuel
efficiency parameter that changes with vessel size (Notteboom and Vernimmen, 2009); and is the
fuel price, measured in US$ per ton of fuel.
The daily capital and operating cost per vessel are influenced by several factors, such as crew, ship
size, insurance policy and maintenance (Hsu and Hsieh, 2007; Tran, 2011). We can approximate the
daily capital and operating cost for each vessel as follows.
2
1 ,OPC S
(21)
where 1 0 (in US$) is the capital cost parameter, S (in ton) is the ship size and 20 1 is
the factor modeling the effect of scale economy due to vessel size.
Port-related charges mainly include each vessel’s port dues and the stevedoring costs for containers at
ports. Port dues are paid for pilotage, towage and berth occupancy (Hsu and Hsieh, 2007; Tran, 2011),
and are determined by the gross tonnage of a vessel (Tran, 2011). Port dues PUC are computed as
follows (Wijnolst et al., 2000).
,PUC W (22)
1 2 ,W S (23)
where is the expense rate per gross ton. The gross tonnage W is converted from the vessel
capacity S (in TEU); and 1 and 2 are relative parameters.
Shipping network design in a growth market: The case of Indonesia
Tu, Adiputranto, Fu and Li
17
The stevedoring costs are paid for container loaded and unloaded at ports, and increase with the
number of transshipment operations during a voyage. In the domestic network, total stevedoring costs
per TEU at all ports on route r, represented as ,N rc , are specified as
, 2 1 , , , ,N r hr ij D
h H
c r R i j N
(24)
where is the fee charged per container. 1hr means hub port h H is on route r, and
0hr otherwise. hr
h H
is the total number of transshipments on route r. For the international
network, each route traverses two ports only, namely an international port and a gateway. Thus, the
stevedoring costs per TEU at all ports on each route in the international network is 2 . Additionally,
container-related costs are the lease costs for the usage of containers during transportation, which are
determined by the unit rent cost, the total quantity of containers used by the vessels and the whole
transportation duration.
Based on the above specifications, the total shipping cost minimization model for determining optimal
vessel size and speed for carriers is as follows.
,
,
min ( ) 2 2D ij I D D I
r N r ij ji
i j N r R i N j N j N i N
f c q q
V,S
V,S
2 ,24 24 24
a a aa a a
PU a FC a L a OP a
a A a a
D D SC F C F c q C F
V V
(25
where V and S are the vectors of vessel velocities and ship sizes, respectively.
, , ,D ij D ig D gi
a r ar r ar r ar
i j N r R i N g G r R g G i N r R
q f f f
is the total cargo flow on leg a.
inta a aF q S represents the round-off value of the annual number of voyages for vessel aS on
leg a. Lc is the lease cost per container. a
PUC , a
FCC , and a
OPC are, respectively, the daily port due,
daily fuel cost and daily operating cost for specific leg a. 24a aD V is the sailing time on leg a and
24aS is the discharging/loading time at the head port/the tail port of leg a for vessel aS . The
right hand of the objective function (25) contains four parts: the first part represents the total
stevedoring costs at all ports in the domestic network; the second and third parts represent the
stevedoring costs at all ports in the international network; the fourth part represents the total cost at all
shipping legs, including the total port dues of vessels, the fuel costs, the container rental costs and the
capital and operating costs of vessels during the whole year’s voyage.

Shipping network design in a growth market: The case of Indonesia
Tu, Adiputranto, Fu and Li
18
4.3. Total system cost minimization for design of hub ports and gateways for the authority
To design the shipping network, the government determines the optimal locations of hubs and
international gateways from given sets of candidate ports to minimize the total maritime system cost.
The total system cost is the sum of the carriers’ total shipping cost and shippers’ total cost in the
whole shipping network. The network design problem can be formulated as the following cost
minimization model
,
min , , , ,D ij
r r
i j N r R
U f
y
V x,y S x,y V x,y S x,y V x,y S x,y U V x,y S x,yx,
,
, , ,I gi ig
r r
g G i N r R R
U f
V y S y U V y S y (26)
subject to
,h
h H
x P
(27)
,g
g G
y Q
(28)
1, port is set to be a hub, ,
0, otherwise,h
hx h H
(29)
1, port is set to be a gateway, ,
0, otherwise,g
gy g G
(30)
where x and y are the decision variables. , which is a function in x and y through V and S, is
determined by the carrier’s shipping cost minimization model (20)-(25). U, which is a function in y
and x through V and S, is determined by the shipper’s route choice model (12)-(19). The objective
function (26) includes three kinds of costs, namely the total carriers' shipping cost and the total
shippers' time cost in the domestic and international shipping networks. Constraints (27) and (28)
state that P new domestic hubs and Q new gateways will be built in the network. Constraints (29) and
(30) define 0-1 decision variables.
In order to solve the 0-1 integer programming problem (26)-(30), we develop a heuristic solution
algorithm as follows.
Step 1. Initialization. Set as the upper bound of the objective function in Eq. (26).
Step 2. First loop operation (determining optimal locations of gateway ports). Given the set of
candidate gateways G , check all possible gateway schemes sequentially with one scheme at
a time. Let (1)G denote the initial gateway scheme. Set the scheme counter to k = 1.
Shipping network design in a growth market: The case of Indonesia
Tu, Adiputranto, Fu and Li
19
Step 3. Second loop operation (determining optimal locations of domestic hub ports). Given the set
of candidate domestic hubs H , check all possible hub schemes sequentially with one
scheme at a time. Let (1)H denote the initial hub scheme. Set the scheme counter to l = 1.
Step 3.1. If all possible gateway schemes are checked, then go to Step 4.
Step 3.2. Solve the carriers’ shipping cost minimization model (20)-(25) to obtain the optimal velocity
and ship size patterns l
V and l
S and the shippers’ route choice model (12)-(19) to
generate the route flow l l
rff and the transportation time cost l l
rUU . Then,
compute the objective value l
for the current hub scheme ( )lH with the fixed
gateway scheme ( )kG .
Step 3.3. Termination check for the second loop operation. If l , then put
l V V ,
l S S , l f f ,
l , ( ) ( ), ,l k x y x y , and l = l + 1, and go to Step 3.1.
Otherwise, set l = l + 1 and go to Step 3.1.
Step 4. Termination check for the first loop operation. If all possible hub schemes are checked, then
terminate the algorithm and output the optimal solution , , , , V S x y f and the
corresponding objective function value . Otherwise, set k = k + 1, and go to Step 3.
5. Case study for Indonesian maritime market
5.1. Parameter calibrations and specifications
The OD demand estimation model and the cost-minimization model for shipping network design are
applied to the Indonesian maritime market. Data for the 2014 GRDPs of provinces and the loaded and
unloaded cargos in 2013 are collected for all provinces. We first forecast the GRDPs and the cargo
volumes for year 2014, 2019 and 2024 based on the observed data. According to BPS Statistics
Indonesia (2015), Indonesia’s GDP in 2014 was approximately IDR10,542 trillion (approximately
US$737 billion) with an annual growth rate of 5.21%. BPS Statistics Indonesia (2015) forecasted an
average annual growth of 5.50% over the next 5 years (i.e., 2014-2019), whereas the Indonesian
Ministry of National Development Planning (2014) forecasted an average annual growth of 7.00% over
the sequential period of 5 years when the proposed government development initiatives are applied
nationwide (i.e., 2019-2024). The GDP forecasts for specific future years are summarized in Table 5.
Table 5 Indonesian GDP forecast (trillion IDR).
Year 2014 2019 2024
GDP 10,542 13,778 19,324
Note: “IDR” stands for Indonesian currency and US$1.0 approximates IDR14285.7 on 1 December 2016
Shipping network design in a growth market: The case of Indonesia
Tu, Adiputranto, Fu and Li
20
The annual GRDP growth rates of provinces in 2014 are obtained from BPS Statistics Indonesia
(2015). With reference to the national annual growth and the regional annual growth in 2014, the
growth rate of GRDP for each province from 2014 to 2019 can be predicted to be proportional to the
growth rate of the national GDP (BPS Statistics Indonesia, 2016c). The cargo volume at the province
level is also predicted to be proportional to the GRDP, as trade volume is significantly influenced by
the overall economy. Voyage distance data are compiled for port-pairs from searates.com and Google
Earth.
In our analysis, seven candidate ports may serve as domestic hubs, including the ports of Belawan,
Batam, Tanjung Priok, Tanjung Perak, Makassar, Bitung and Sorong. Four candidate ports may serve
as international gateway ports, including the ports of Belawan, Tanjung Priok, Bitung and Sorong. A
port can be a domestic hub and an international gateway at the same time. In a hybrid HS network,
cargo may be delivered directly or via transshipment. We first consider scenarios with only one
international gateway, although there can be one to seven domestic hubs. If a port is not chosen to be a
hub by the total system cost minimization model, it is then set to be a feeder port. Hub ports are fully
connected to each other. To make the model tractable, it is assumed that domestic cargo can pass
through at most two hubs, whereas direct delivery is used when the sailing distance between an origin
and a destination is less than 1,000 nautical miles. Direct delivery has the advantage of short travel
time and no transshipment cost. However, direct delivery may lead to legs not well served and cause
higher costs for the whole PoP structure when cargo volumes are not very large.
Five types of vessels with capacities of 3,000 TEU, 4,000 TEU, 5,000 TEU, 8,000 TEU and 10,000
TEU are considered for the network. The values of the various relevant parameters are collected from
previous studies. With reference to Notteboom and Vernimmen (2009), the approximate values of fuel
efficiency of vessel for the ship types are 5 35.434 10 ton knot ,
5 35.129 10 ton knot ,
5 34.750 10 ton knot , 5 35.809 10 ton knot and
5 35.643 10 ton knot , respectively.
The bunker fuel price is set to be 375US$/ton (Tran, 2011), 1 is assumed to be
240US$/day ton
and 2 0.6257 (Tran, 2011). The lease cost per container, Lc , is assumed to
be US$4.5/TEU/day and the rate of depreciation or time cost related to the shipment, , for each
container is assumed to be US$20/TEU/day (Bell et al., 2013). Wijnolst et al. (2000) notes that gross
tonnage can be calculated as 12.556 1087.2W S and 0.1884(US$) per gross tonnage.
The handling charge per movement of container, , is assumed to be US$100/TEU and a port
handles 100 TEUs per hour with six cranes (Tran, 2011).
With the above parameters, the routes between each OD pair can be uniquely chosen and the optimal
Shipping network design in a growth market: The case of Indonesia
Tu, Adiputranto, Fu and Li
21
1.2
1.4
1.6
1.8
2.0
2.2
2.4
2.6
0 1 2 3 4 5 6 7
To
tal
cost
of
do
mes
tic
net
wo
rk w
ith
op
tim
al
do
mes
tic
hu
b s
chem
e (b
illi
on
US
$)
Total number of domestic hubs
PoP
PoP
PoP
[8]
[8]
[8]
[2,10]
[2,8]
[2,8]
[2,8,10][2,3,8,10] [2,3,8,10,17] [2,3,8,10,17,19]
[2,8,10]
[2,8,10]
[2,3,8,10]
[2,3,8,10]
[2,3,8,10,17]
[2,3,8,10,17]
[2,3,8,10,17,19]
[2,3,8,10,17,19]
velocity for the vessel on leg a can be obtained by 3 (c C ) 2a
a L a OP a a a aV q F F S , which
increases with container lease rate and operation cost and decreases with fuel price and fuel efficiency.
More modeling results are presented as follows.
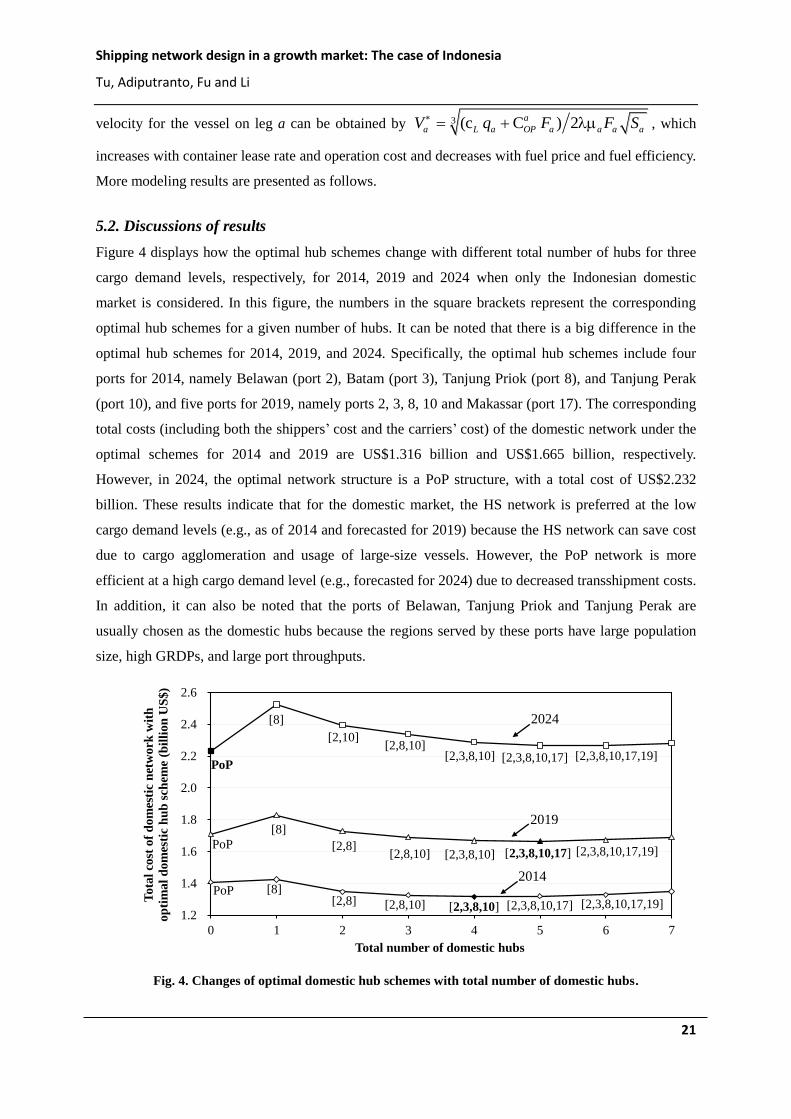
5.2. Discussions of results
Figure 4 displays how the optimal hub schemes change with different total number of hubs for three
cargo demand levels, respectively, for 2014, 2019 and 2024 when only the Indonesian domestic
market is considered. In this figure, the numbers in the square brackets represent the corresponding
optimal hub schemes for a given number of hubs. It can be noted that there is a big difference in the
optimal hub schemes for 2014, 2019, and 2024. Specifically, the optimal hub schemes include four
ports for 2014, namely Belawan (port 2), Batam (port 3), Tanjung Priok (port 8), and Tanjung Perak
(port 10), and five ports for 2019, namely ports 2, 3, 8, 10 and Makassar (port 17). The corresponding
total costs (including both the shippers’ cost and the carriers’ cost) of the domestic network under the
optimal schemes for 2014 and 2019 are US$1.316 billion and US$1.665 billion, respectively.
However, in 2024, the optimal network structure is a PoP structure, with a total cost of US$2.232
billion. These results indicate that for the domestic market, the HS network is preferred at the low
cargo demand levels (e.g., as of 2014 and forecasted for 2019) because the HS network can save cost
due to cargo agglomeration and usage of large-size vessels. However, the PoP network is more
efficient at a high cargo demand level (e.g., forecasted for 2024) due to decreased transshipment costs.
In addition, it can also be noted that the ports of Belawan, Tanjung Priok and Tanjung Perak are
usually chosen as the domestic hubs because the regions served by these ports have large population
size, high GRDPs, and large port throughputs.
Fig. 4. Changes of optimal domestic hub schemes with total number of domestic hubs.
2024
2019
2014

Shipping network design in a growth market: The case of Indonesia
Tu, Adiputranto, Fu and Li
22
Table 6 indicates the optimal network configurations and the corresponding total system cost,
including those for the domestic market and the international market, for different levels of OD cargo
demand in 2014, 2019 and 2024 when only one port is chosen as the international gateway. It can be
noted that the Port of Tanjung Priok (port 8) is always the optimal choice. This is consistent with the
fact that approximately 80% of the international trades in Indonesia currently pass through the Port of
Tanjung Priok. Table 6 also shows that at the demand level of 2014, the scheme with four domestic
hubs, which include the ports of Belawan (port 2), Batam (port 3), Tanjung Priok (port 8), and
Tanjung Perak (port 10), is the best choice. With growth in cargo demand, the corresponding total
number of the optimal hubs is increasing. Specifically, compared to 2014, with an increased GRDP,
population and port throughputs, the Port of Makassar (port 17) is added as the fifth domestic hub for
2019. However, in 2024, the optimal domestic network structure changes to a PoP structure which
offers lower cost at a high demand level.
Table 6 Optimal scheme for Indonesian shipping network when only one port is chosen as the gateway.
Year 2014 2019 2024
Optimal gateway Tanjung Priok
(Port 8)
Tanjung Priok
(Port 8)
Tanjung Priok
(Port 8)
Optimal domestic
hub scheme [2,3,8,10] [2,3,8,10,17] PoP
Total cost for the domestic
network (billion US$) 1.797 2.333 3.182
Total cost for the international
network (billion US$) 1.392 1.862 2.654
Total system cost (billion US$) 3.189 4.195 5.836
As mentioned, without a careful plan establishing two independent international gateways in the east
area of Indonesia (i.e., the development of the Port of Bitung as planned in the Maritime Highway and
the Port of Sorong as planned in the Pendulum Nusantara program) may cause an unintended rivalry
that reduces the overall economic benefits. Therefore, we investigate the scenarios in which one of the
two candidate ports of Bitung (port 19) and Sorong (port 23) is also chosen as an international
gateway in addition to Tanjung Priok (port 8). Table 7 shows the optimal domestic hub schemes and
the corresponding cost for different years. It can be seen that the Port of Bitung is always a better
candidate than the Port of Sorong in terms of the total system cost for 2014, 2019, and 2024.
Specifically, the total system cost with the additional gateway port Bitung are US$0.069 billion,
US$0.094 billion, and US$0.123 billion lower than those with the additional gateway port Sorong in
the three years, respectively. In addition, in 2024, the optimal shipping network structure for
Indonesia becomes the PoP structure regardless of the choices of international gateways.
Shipping network design in a growth market: The case of Indonesia
Tu, Adiputranto, Fu and Li
23
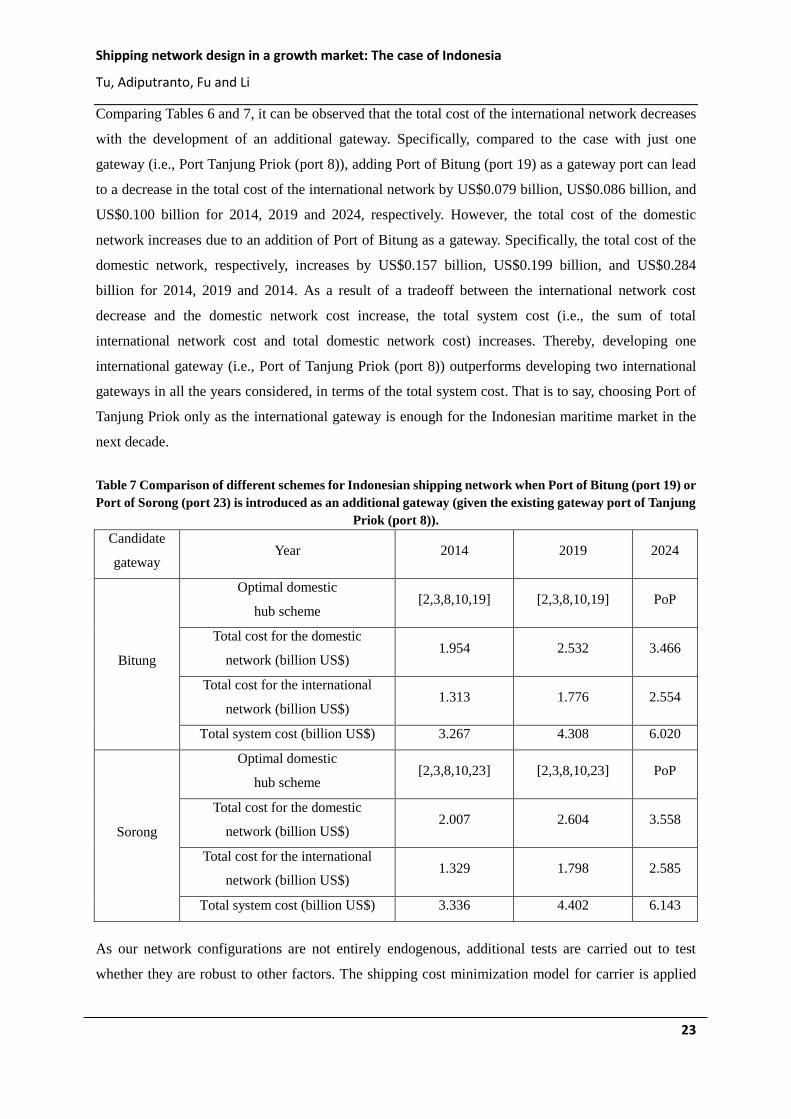
Comparing Tables 6 and 7, it can be observed that the total cost of the international network decreases
with the development of an additional gateway. Specifically, compared to the case with just one
gateway (i.e., Port Tanjung Priok (port 8)), adding Port of Bitung (port 19) as a gateway port can lead
to a decrease in the total cost of the international network by US$0.079 billion, US$0.086 billion, and
US$0.100 billion for 2014, 2019 and 2024, respectively. However, the total cost of the domestic
network increases due to an addition of Port of Bitung as a gateway. Specifically, the total cost of the
domestic network, respectively, increases by US$0.157 billion, US$0.199 billion, and US$0.284
billion for 2014, 2019 and 2014. As a result of a tradeoff between the international network cost
decrease and the domestic network cost increase, the total system cost (i.e., the sum of total
international network cost and total domestic network cost) increases. Thereby, developing one
international gateway (i.e., Port of Tanjung Priok (port 8)) outperforms developing two international
gateways in all the years considered, in terms of the total system cost. That is to say, choosing Port of
Tanjung Priok only as the international gateway is enough for the Indonesian maritime market in the
next decade.
Table 7 Comparison of different schemes for Indonesian shipping network when Port of Bitung (port 19) or
Port of Sorong (port 23) is introduced as an additional gateway (given the existing gateway port of Tanjung
Priok (port 8)).
Candidate
gateway Year 2014 2019 2024
Bitung
Optimal domestic
hub scheme [2,3,8,10,19] [2,3,8,10,19] PoP
Total cost for the domestic
network (billion US$) 1.954 2.532 3.466
Total cost for the international
network (billion US$) 1.313 1.776 2.554
Total system cost (billion US$) 3.267 4.308 6.020
Sorong
Optimal domestic
hub scheme [2,3,8,10,23] [2,3,8,10,23] PoP
Total cost for the domestic
network (billion US$) 2.007 2.604 3.558
Total cost for the international
network (billion US$) 1.329 1.798 2.585
Total system cost (billion US$) 3.336 4.402 6.143
As our network configurations are not entirely endogenous, additional tests are carried out to test
whether they are robust to other factors. The shipping cost minimization model for carrier is applied

Shipping network design in a growth market: The case of Indonesia
Tu, Adiputranto, Fu and Li
24
to compute the total shipping cost of domestic network for a PoP network versus an HS network, with
the ports of Belawan (port 2), Tanjung Priok (port 8) and Tanjung Perak (port 10) serving as the
domestic hubs and the Port of Tanjung Priok serving as the international gateway. Figure 5 reports the
total shipping cost for the domestic network with different handling rates . Improved handling rates
at ports reduce the dwelling time at the origin port, transshipment hubs and destination port, thus
reducing the associated operation costs. Reduced transport time also reduces shippers’ time cost.
These benefits are confirmed as shown in Figure 5, where costs at different cargo volumes decline
with the handling rate.
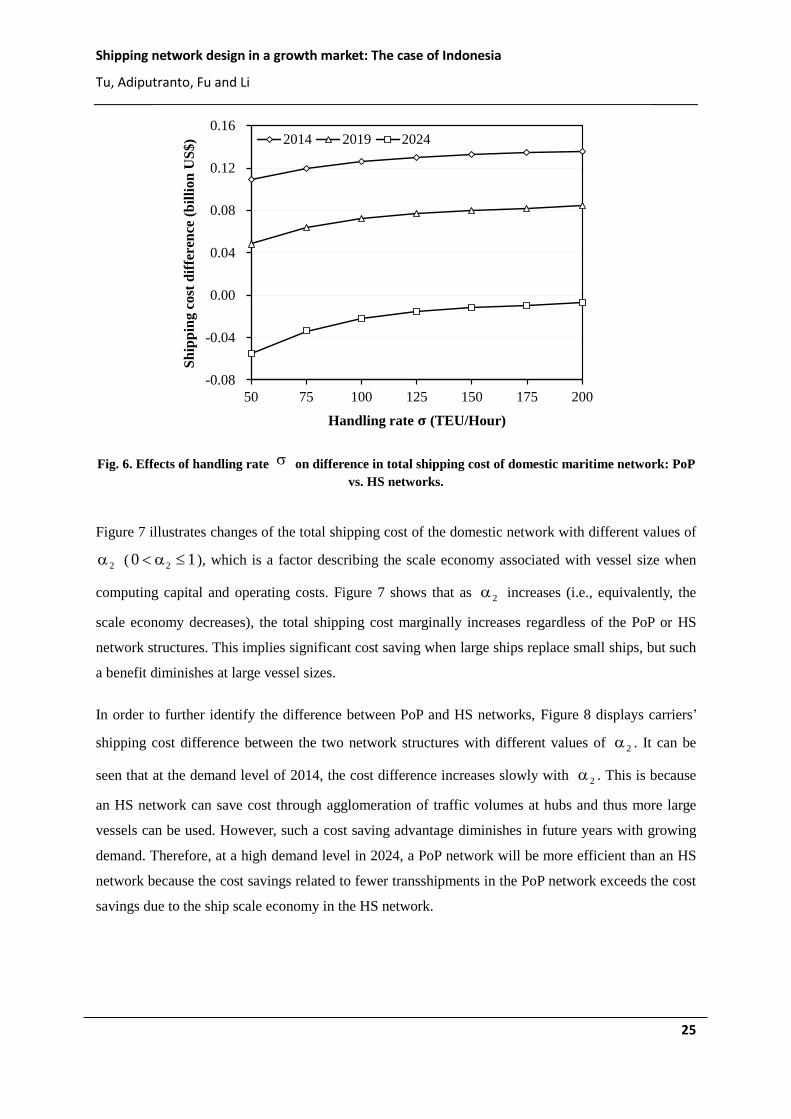
Figure 5 also shows that the total shipping cost of the HS network is lower than that of PoP direct
delivery for the demand levels of 2014 and 2019, but exceeds the cost of the PoP network at the 2024
level. The cost differences are presented in Figure 6. Note that in 2014 and 2019, cost differences
between PoP network and HS network are positive and increase with handling rate, as higher handling
rates are particularly beneficial for HS networks, which involve more transshipment activities.
However, when the demand becomes sufficiently high, such as the forecasted 2024 level, a PoP
network is more efficient than an HS network, although higher handling rates still reduce the cost
gaps of these two types of networks. Therefore, if the handling rate is low, direct delivery via a PoP
network may be preferred when shipping demand is high.
1.2
1.5
1.8
2.1
2.4
2.7
3.0
50 75 100 125 150 175 200
2014(HS) 2019(HS) 2024(HS)
2014(PoP) 2019(PoP) 2024(PoP)
Tota
l sh
ipp
ing c
ost
of
dom
esti
c
net
work
(b
illi
on
US
$)
Handling rate (TEU/Hour)
Fig. 5. Effects of handling rate on total shipping cost of domestic maritime network:
PoP vs. HS networks.
Shipping network design in a growth market: The case of Indonesia
Tu, Adiputranto, Fu and Li
25
-0.08
-0.04
0.00
0.04
0.08
0.12
0.16
50 75 100 125 150 175 200
2014 2019 2024
Sh
ipp
ing
cost
dif
fere
nce
(bil
lion
US
$)
Handling rate (TEU/Hour)
Fig. 6. Effects of handling rate on difference in total shipping cost of domestic maritime network: PoP
vs. HS networks.
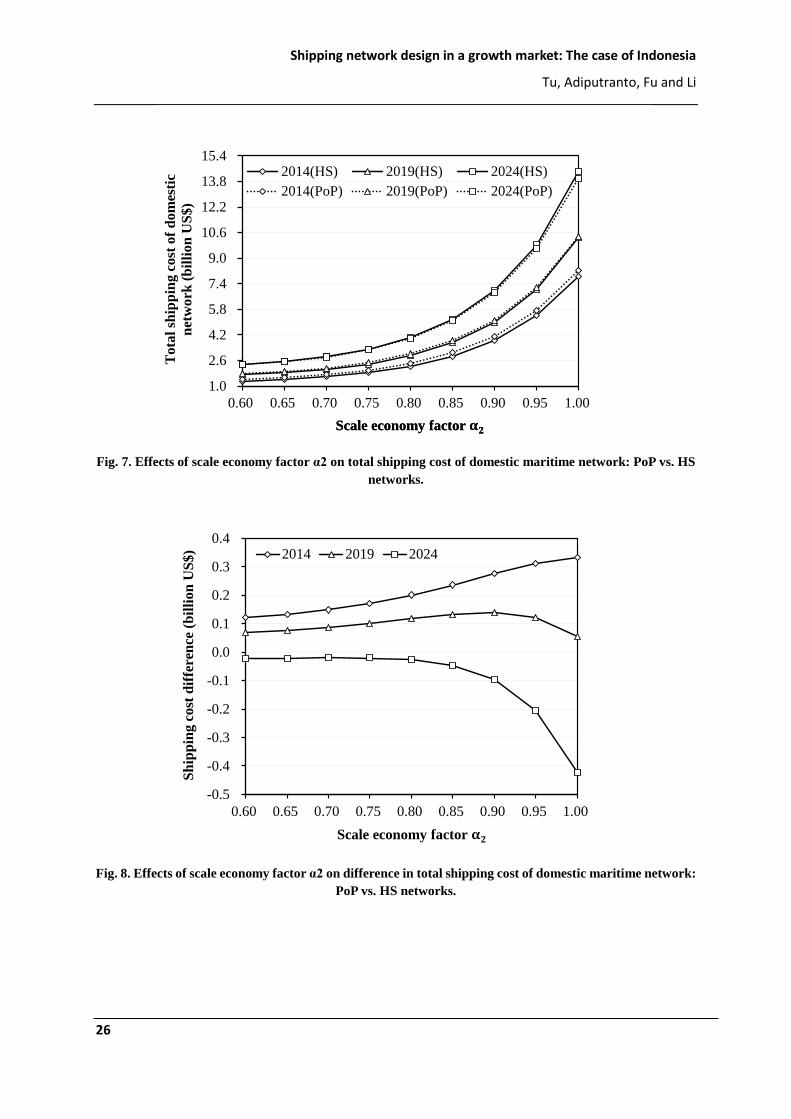
Figure 7 illustrates changes of the total shipping cost of the domestic network with different values of
2 ( 20 1 ), which is a factor describing the scale economy associated with vessel size when
computing capital and operating costs. Figure 7 shows that as 2 increases (i.e., equivalently, the
scale economy decreases), the total shipping cost marginally increases regardless of the PoP or HS
network structures. This implies significant cost saving when large ships replace small ships, but such
a benefit diminishes at large vessel sizes.
In order to further identify the difference between PoP and HS networks, Figure 8 displays carriers’
shipping cost difference between the two network structures with different values of 2 . It can be
seen that at the demand level of 2014, the cost difference increases slowly with 2 . This is because
an HS network can save cost through agglomeration of traffic volumes at hubs and thus more large
vessels can be used. However, such a cost saving advantage diminishes in future years with growing
demand. Therefore, at a high demand level in 2024, a PoP network will be more efficient than an HS
network because the cost savings related to fewer transshipments in the PoP network exceeds the cost
savings due to the ship scale economy in the HS network.
Shipping network design in a growth market: The case of Indonesia
Tu, Adiputranto, Fu and Li
26
1.0
2.6
4.2
5.8
7.4
9.0
10.6
12.2
13.8
15.4
0.60 0.65 0.70 0.75 0.80 0.85 0.90 0.95 1.00
2014(HS) 2019(HS) 2024(HS)
2014(PoP) 2019(PoP) 2024(PoP)
Scale economy factor
Tota
l sh
ipp
ing c
ost
of
dom
esti
c
net
work
(b
illi
on
US
$)
Scale economy factor
Fig. 7. Effects of scale economy factor α2 on total shipping cost of domestic maritime network: PoP vs. HS
networks.
-0.5
-0.4
-0.3
-0.2
-0.1
0.0
0.1
0.2
0.3
0.4
0.60 0.65 0.70 0.75 0.80 0.85 0.90 0.95 1.00
2014 2019 2024
Sh
ipp
ing
co
st d
iffe
ren
ce (
bil
lio
n U
S$
)
Scale economy factor
Fig. 8. Effects of scale economy factor α2 on difference in total shipping cost of domestic maritime network:
PoP vs. HS networks.

Shipping network design in a growth market: The case of Indonesia
Tu, Adiputranto, Fu and Li
27
6. Concluding remarks
As a major archipelago country with a huge population, substantial investment in Indonesia’s maritime
sector is needed to promote the nation’s trade and economic growth. Despite the huge stakes involved,
there is significant inconsistency between strategic government plans, such as the Pendulum
Nusantara and Maritime Highway initiatives. Large investments in the maritime sector usually take a
very long time to finish, during which rapid growth in cargo volumes are expected for Indonesia. All
of these issues call for careful planning by the country’s maritime sector and government policy.
However, few studies have investigated the optimal design of the shipping network in Indonesia and
even less is known about how government policies and investment plans should adapt to changing
demand over time. This paper aims to fill these gaps in research and policy planning by conducting a
comprehensive study of shipping network design.
To overcome the severe shortage of detailed cargo flow data, a doubly constrained gravity model
combined with the parameter estimation procedure is first applied to the Indonesian markets to
calibrate a full OD cargo demand matrix for the current and future markets. A total system cost
minimization model is then developed, which consists of carriers' total shipping cost related to
port-to-port cargo delivery (such as cargo bunker fuel cost, capital and operating cost, container lease
cost, port dues and handling cost), and shippers’ time cost which is related to the total delivery time.
The proposed model considers both domestic and international cargo flows to determine the optimal
domestic hubs and international gateways for the Indonesian maritime market.
Some important findings and new insights have been obtained. First, as a result of the tradeoff
between scale economy of large ships and transshipment costs, an HS network is preferred at low
cargo demand levels (e.g., in 2014 and 2019), whereas a PoP network is more efficient at high
demand levels (e.g., in 2024). Specifically, an HS network configuration is more cost effective for
Indonesia at the current traffic volume. With rapid growth in cargo demand, however, a PoP network
structure will outperform an HS network structure in 2024. Second, the ports of Belawan, Tanjung
Priok and Tanjung Perak have good potential to become the domestic hubs because they serve regions
that have large population size, high GRDPs, and large cargo throughputs. Third, only one
international gateway (i.e. Tanjung Priok) is needed for the Indonesia maritime market for the next
decade.
In addition to these detailed recommendations for shipping network design in Indonesia, our study
also reveals the importance of considering market dynamics in strategic planning and government
policy. One major policy decision is whether government intervention and planning should be
imposed. Government intervention may avoid duplicate investments and thus increase the utilization
Shipping network design in a growth market: The case of Indonesia
Tu, Adiputranto, Fu and Li
28
and return of infrastructure investment. However, market-based mechanisms tend to be more
responsive and efficient, bringing competition and innovations in the long term. Our analysis suggests
that the optimal decision may evolve dynamically with market conditions. For the case of the
Indonesian maritime sector, when demand is relatively low, only one international gateway and four
domestic hubs are needed. With increased traffic volumes, additional domestic hubs should be built.
However, when the demand is large enough, the PoP structure will be optimal. These modeling results
suggest that a progressive policy may be promising for developing countries that are usually short of
capital. In the early stages when demand is relatively low, government intervention and planning can
avoid duplicate investments and promote operational efficiency. However, as traffic volume and
demand increase over time, it may be optimal to liberalize the maritime sector and promote healthy
competition between ports and regions. We also highlight the interactive dynamics between port
operations and shipping networks. As shown in our sensitivity tests in Figures 5 to 8, increased port
capacity and handling rates influence the optimal network configuration of container carriers (HS vs
PoP). However, the scale economy of large ships also affects the network configuration and thus the
throughput and transshipment volumes at ports. Therefore, government policy and planning should be
both long term and comprehensive. Finally, because the OD cargo flows are one of the key
determinants of optimal shipping networks, it is important for governments to compile more detailed
data. Compared to advanced economies, statistical agencies in developing countries often compile
less detailed data. This can be an expensive mistake, as more infrastructure investment and associated
planning are often needed in developing countries.
Although we have tried to conduct a comprehensive study using real market data, some simplifying
assumptions and model calibrations have been imposed due to the lack of some critical data. The
network configuration is not entirely endogenous and we have not considered more complex hybrid
networks. Although our modeling results suggest that a progressive government policy is promising,
in reality government interventions often give rise to corruption and bureaucracy, especially in
developing countries. These issues, however, are difficult to model in quantitative analysis. Our study
is a step toward better planning and policymaking, yet more advanced studies should be carried out
when more detailed data are available. Such efforts are particularly important for the maritime sector,
in which infrastructure development involves substantial investment over extended periods.

Shipping network design in a growth market: The case of Indonesia
Tu, Adiputranto, Fu and Li
29
References
Adler, N., Fu, X., Oum, T.H., Yu, C., 2014. Air transport liberalization and airport slot allocation: The
case of the Northeast Asian transport market. Transportation Research Part A 62, 3-19.
Banitya, R.R., 2013. Gravity Model of Trade in Indonesian Market. Paper presented at the 6th
Conference of Indonesian Students Association in Korea, Daejeon, July 7, 2013.
Bell, M.G.H., Liu, X., Angeloudis, P., Fonzone, A., Hosseinloo, S.H., 2011. A frequency-based
maritime container assignment model. Transportation Research Part B 45(8), 1152-1161.
Bell, M.G.H., Liu, X., Rioult, J., Angeloudis, P., 2013. A cost-based maritime container assignment
model. Transportation Research Part B 58(3), 58-70.
Boyce, D.E., Zhang, Y., 1998. “Parameter estimation for combined travel choice models,” in
Lundqvist, L., Mattsson, L.G., Kim, T.J. (eds.), Network Infrastructure and the Urban Environment.
Berlin: Springer-Verlag Berlin Heidelberg, pp. 177-193.
Brueckner, J.K., Zhang, Y., 2001. A model of scheduling in airline networks: How a hub-and-spoke
system affects flight frequency, fares and welfare. Journal of Transport Economics and Policy 35(2),
195-222.
BPS - Statistics Indonesia, 2015. Statistical Yearbook of Indonesia 2015, catalogue no. 1101001, BPS
- Statistics Indonesia, Jakarta.
BPS - Statistics Indonesia, 2016a. Statistical Yearbook of Indonesia 2015, catalogue no. 1101001,
BPS - Statistics Indonesia, Jakarta.
BPS - Statistics Indonesia, 2016b. Maluku in Figures 2015, catalogue no. 1102001.81, BPS - Statistics
Maluku, Ambon.
BPS - Statistics Indonesia, 2016c. [Seri 2010] Laju Pertumbuhan Produk Domestik Regional Bruto
per Kapita Atas Dasar Harga Konstan 2010 Menurut Provinsi, 2011-2014, viewed April 3, 2016,
<https://www.bps.go.id/linkTableDinamis/view/id/964>.
Chong, L., Kennedy, D., Chan, W.M., 2006. Direct shipping logistic planning for a hub-and-spoke
network with given discrete intershipment times. International Transactions in Operational
Research 13(1), 17-32.
Corbett, J.J., Wang, H., Winebrake, J.J., 2009. The effectiveness and costs of speed reductions on
emissions from international shipping. Transportation Research Part D 14(8), 593-598.
Desfika, T.S., 2016. Pembangunan Pelabuhan Sorong Dimulai Januari 2016, Berita Satu, November
17, viewed March 15,
<http://www.beritasatu.com/ekonomi/322774-pembangunan-pelabuhan-sorong-dimulai-januari-201
6.html>.
Firdaus, M., Widyasanti, A.A., 2010. Indonesian Interprovincial Trade: What Can Be Revealed from a
Gravity Modeling? Paper presented at the 10th Indonesian Regional Science Association
International Conference, Surabaya, July 28-29, 2010.
Halim, R.A., Tavasszy, L.A., Seck, M.D., 2012. Modeling the global freight transportation system: A
multi-level modeling perspective. Proceedings of the 2012 Winter Simulation Conference, pp. 1-13.
Hendricks, K., Piccione, M., Tan, G., 1995. The economics of hubs: The case of monopoly. Review of
Economic Studies 62(1), 83-99.
Hendricks, K., Piccione, M., Tan, G., 1999. Equilibria in networks. Econometrica 67(6), 1407-1434.
Homsombat, W., Lei, Z., Fu, X., 2011. Development status and prospects for aviation hubs—A

Shipping network design in a growth market: The case of Indonesia
Tu, Adiputranto, Fu and Li
30
comparative study of the major airports in Southeast Asia. Singapore Economic Review 56(4),
573-591.
Hsu, C.I., Hsieh, Y.P., 2005. Direct versus terminal routing on a maritime hub-and-spoke container
network. Journal of Marine Science and Technology 13(3), 209-217.
Hsu, C.I., Hsieh, Y.P., 2007. Routing, ship size, and sailing frequency decision-making for a maritime
hub-and-spoke container network. Mathematical and Computer Modelling 45(7/8), 899-916.
Imai, A., Shintani, K., Papadimitriou, S., 2009. Multi-port vs. hub-and-spoke port calls by
containerships. Transportation Research Part E 45(5), 740-757.
Indonesian Ministry of National Development Planning, 2014. Pengembangan Tol Laut Dalam Rpjmn
2015-2019 dan Implementasi 2015, Directorate of Transportation, Jakarta, viewed February 29,
2016.
Lau, J., Ng, A., Fu, X., Li, K., 2013. The evolution and research trend of container shipping. Maritime
Policy & Management 40(7), 654-674.
Lino, R.J., 2012. Transporting Light to the Nation: Indonesia Maritime Infrastructure, World Export
Development Forum 2012, at Jakarta, October 15.
Leonardi, J., Browne, M., 2010. A method for assessing the carbon footprint of maritime freight
transport: European case study and results. International Journal of Logistics Research &
Applications 13(5), 349-358.
Levine, B., Nozick, L., Jones, D., 2009. Estimating an origin-destination table for us exports of
waterborne containerised freight. Transportation Research Part E 45(4), 611-626.
Luo, M., Grigalunas, T.A., 2003. A spatial-economic multimodal transportation simulation model for
us coastal container ports. Maritime Economics and Logistics 5(2), 158-178.
Meng, Q., Wang, S., 2011. Liner shipping service network design with empty container
repositioning. Transportation Research Part E 47(5), 695-708.
Munizaga, M.A., Palma, C., 2012. Estimation of a disaggregate multimodal public transport
origin–destination matrix from passive smartcard data from Santiago, Chile. Transportation
Research Part C 24(9), 9-18.
Nagurney, A., Qiang, Q., 2008. An efficiency measure for dynamic networks modeled as evolutionary
variational inequalities with application to the Internet and vulnerability analysis. Netnomics 9(1),
1-20.
Notteboom, T.E., Vernimmen, B., 2009. The effect of high fuel costs on liner service configuration in
container shipping. Journal of Transport Geography 17(5), 325-337.
O'Kelly, M.E., 1987. A quadratic integer program for the location of interacting hub facilities.
European Journal of Operational Research 32(3), 393-404.
PELINDO 2 2015, Annual Report 2014, Jakarta.
PELINDO 3 2015, Annual Report 2014, Surabaya.
Sheffi, Y., 1985. Urban Transportation Networks: Equilibrium Analysis with Mathematical
Programming Methods. Englewood Cliffs, New Jersey: Prentice-Hall, Inc.
Silva, J.M.C.S., Tenreyro, S., 2005. The log of gravity. Review of Economics and Statistics 88(4),
641-658.
Sinha-Ray, P., Carter, J., Field, T., Marshall, J., Polak, J., Schumacher, K., Song, D., Woods, J., Zhang,
J., 2003. Container World: Global agent-based modelling of the container transport

Shipping network design in a growth market: The case of Indonesia
Tu, Adiputranto, Fu and Li
31
business. In Proceedings of 4th International Workshop on Agent-Based Simulation.
Smith, T., Barrett, M., Parker, S., Eoin, O., 2011. Description of GloTraM-2, a prototype model to
calculate the future energy emissions and costs of the global shipping industry. Transport and
Logistic Group, Delft University of Technology.
Takano, K., Arai, M., 2008. A genetic algorithm for the hub-and-spoke problem applied to
containerized cargo transport. Journal of Marine Science and Technology 14(2), 256-274.
Talley, W.K., 2014. Maritime transport chains: Carrier, port and shipper choice effects. International
Journal of Production Economics 151, 174-179.
Tavasszy, L., Minderhoud, M., Perrin, J.F., Notteboom, T., 2011. A strategic network choice model for
global container flows: Specification, estimation and application. Journal of Transport
Geography 19(6) 1163-1172.
Tran, N.K., 2011. Studying port selection on liner routes: An approach from logistics
perspective. Research in Transportation Economics 32(1), 39-53.
Tran, N.K., Haasis, H.D., 2013. Literature survey of network optimization in container liner
shipping. Flexible Services and Manufacturing Journal 27(2/3), 139-179.
Wang, K., Fu, X., Luo, M., 2015. Modeling the impacts of alternative emission trading schemes on
international shipping. Transportation Research Part A 77, 35-49.
Wijnolst, N., Waals, F., Bello, F., Gendroneau, Y., Kempen, D.V., 2000. Malacca-Max 2: Container
Shipping Network Economy. Delft: DUP.
World Bank 2016, Container port traffic (TEU: 20 foot equivalent units), World Bank, viewed 10
March 2016, <http://data.worldbank.org/indicator/IS.SHP.GOOD.TU>
Zhang, A., 1996. An analysis of fortress hubs in network-based markets. Journal of Transport
Economics and Policy 30, 293-308.
Zheng, J., Yang, D., 2016. Hub-and-spoke network design for container shipping along the Yangtze
River. Journal of Transport Geography 55, 51-57.
Zhuang, W., Fu, X., Luo, M., 2014. A game theory analysis of port specialization—Implications to the
Chinese port industry. Maritime Policy and Management 41(3), 268-287.