Shipping Market Overview - Clarksons Market Overview... · Shipping Market Overview Presentation to...
30
19/05/2014 1 www.clarksons.com Shipping Market Overview Presentation to Maritime HR Forum 8 th May 2014 (Ref: A3315) May 2014 Steve Gordon, Managing Director, Clarkson Research. Presentation not for circulation outside of Maritime HR Forum attendees. www.clarksons.com 2 About us Broking Clarksons’ shipbroking services are unrivalled: for the number and calibre of our brokers; breadth of market coverage; geographical spread and depth of market intelligence; analysis and support. We aspire to be best-in-class and market leaders in all key sectors. Support Clarkson Port Services provides the highest level of support to vessel owners, operators and charterers at strategically located ports in the UK and Egypt. Offering ship’s agency services, we are also engaged in stevedoring and warehousing at UK ports and support to the Offshore industry. Financial From derivative products that have been pioneered at Clarksons to full investment banking services and tailored debt solutions, we help our clients manage risk and fund and conclude deals that would often be impossible via more traditional routes. Research Up-to-the-minute intelligence is the cornerstone of any shipping organisation and Clarksons Research Services is recognised worldwide as the market-leading provider of comprehensive and reliable maritime information.
Transcript of Shipping Market Overview - Clarksons Market Overview... · Shipping Market Overview Presentation to...

19/05/2014
1
www.clarksons.comwww.clarksons.comwww.clarksons.comwww.clarksons.com
Shipping Market Overview
Presentation to Maritime HR Forum 8th May 2014 (Ref: A3315)
May 2014
Steve Gordon, Managing Director, Clarkson Research.
Presentation not for circulation outside of Maritime HR Forum attendees.
www.clarksons.com 2
About us
BrokingClarksons’ shipbroking services are unrivalled: for the number and calibre of our brokers; breadth of market coverage; geographical spread and depth of market intelligence; analysis and support. We aspire to be best-in-class and market leaders in all key sectors.
SupportClarkson Port Services provides the highest level of support to vessel owners, operators and charterers at strategically located ports in the UK and Egypt. Offering ship’s agency services, we are also engaged in stevedoring and warehousing at UK ports and support to the Offshore industry.
FinancialFrom derivative products that have been pioneered at Clarksons to full investment banking services and tailored debt solutions, we help our clients manage risk and fund and conclude deals that would often be impossible via more traditional routes.
ResearchUp-to-the-minute intelligence is the cornerstone of any shipping organisation and Clarksons Research Services is recognised worldwide as the market-leading provider of comprehensive and reliable maritime information.

19/05/2014
2
www.clarksons.com 3
Research
Offshore and energy
The leading provider of data to the offshore industry for more than 30 years. Providing clients with the key information they need to operate their business more effectively. Market intelligence is available on more than 25,000 structures, vessels and companies and 6,000 oil and gas fields.
Shipping and trade
Market leaders in providing timely and authoritative information on all aspects of shipping. Data is available on over 100,000 vessels either in service or on order, 10,000 companies and 600 shipyards as well as extensive trade and commercial data, and over 100,000 time series.
Valuations
The world’s leading provider of valuations to the shipping industry and financial community. More than 20,000 valuations are handled annually, covering the full range of vessel types.
www.clarksons.com 4
Agenda
1.Shipping Today2.World Trade3.The World Fleet and Orderbook4.Other Issues5.Summary
January 2014
19/05/2014
3
www.clarksons.com 5
1. Shipping Today
January 2014
www.clarksons.com 6
0
10
20
30
40
50
60
1965
1967
1969
1971
1973
1975
1977
1979
1981
1983
1985
1987
1989
1991
1993
1995
1997
1999
2001
2003
2005
2007
2009
2011
2013
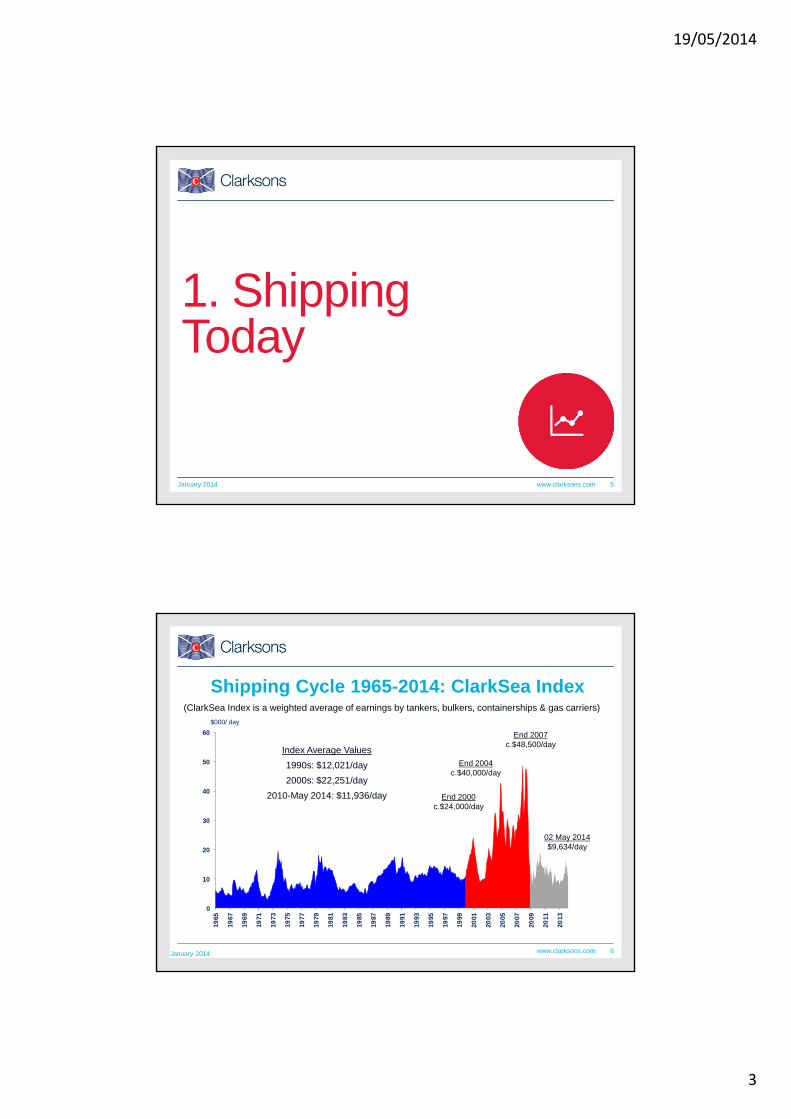
(ClarkSea Index is a weighted average of earnings by tankers, bulkers, containerships & gas carriers)
End 2004c.$40,000/day
End 2007c.$48,500/day
End 2000c.$24,000/day
Shipping Cycle 1965-2014: ClarkSea Index
$000/ day
Index Average Values
1990s: $12,021/day
2000s: $22,251/day
2010-May 2014: $11,936/day
02 May 2014$9,634/day
January 2014

19/05/2014
4
www.clarksons.com 7
0
5
10
15
20
25
30
35
40
45
50
Jan
'08
May
'08
Sep
t '0
8
Jan
'09
May
'09
Sep
t '0
9
Jan
'10
May
'10
Sep
t '1
0
Jan
'11
May
'11
Sep
'11
Jan
'12
May
'12
Sep
'12
Jan
'13
May
'13
Sep
'13
Jan
'14
Five Years of Shipping Downturn
OPEX
$000/day
2nd May 2014 - $9,634 / day but touched
$7,574 / day in February 2013
ClarkSea Index 2008-14
February 2014
1.Huge Cash Pressures & Cost Focus
2.Surplus in the Volume Markets
3.Cash is King
4.Some Sectors Have Done Better e.g. LPG
5.Ships Still Trading & Slow Steaming but Not Laid Up
6.Big Change in Ship Economics – Fuel & Regulations
7.Big change in Financial landscape
8.Recent recovery in part driven by seasonal factors but there are some encouraging signs
www.clarksons.com 8
Earnings versus OPEX
ClarkSeaIndex
OpexIndex
$/day $/day
2008 32,947 6,861
2009 11,407 6,636
2010 15,346 6,830
2011 12,466 6,976
2012 9,588 7,101
2013 10,335 7,229
2014 11,780 7,410
Source: Clarkson Research, Moore Stephens, January 2014
• The Opex index is generated using the same assumptions as the ClarkSea Index for comparison purposes.
• In February 2013, the two indexes reached their smallest differential in the downturn – just $508 per day across the 20,000 ships in the “ClarkSea fleet”.
• In May 2008, the differential was $40,633 per day and equated to $680 million dollars a day across the “ClarkSea” fleet.
May 2014

19/05/2014
5
www.clarksons.com 9
-80% -60% -40% -20% 0% 20% 40% 60% 80% 100% 120%
VLCCSuezmax
AframaxClean Products
CapesizePanamax
HandymaxHandy
Container 3,500 teuContainer 1,700 teu
Offshore - JackupsOffshore - Floaters
Offshore - PSV
LPGLNG
% deviation from 7 year average
Cycle Position May 2014
This chart shows average 1 year TC rate for each ship type, compared to
the average earnings during the last 7
years.
Crosses – x - mark the position in the market cycle one
year ago.
Tankers still tough but Products
better
Earnings still low, but notably less bad
than a year ago
Gas and Offshore positive,
particularly LPG
Improvements in Q4 2013 but markets softening again
x
x
x
x
x
x
x
x
x
x
x
x
x
x
x
www.clarksons.com 10
Source: Compiled from several sources including CRSL, Fearnleys.
Newbuilding Prices – Bottomed Out & Firming
April 2014

19/05/2014
6
www.clarksons.com 11
0
10
20
30
40
50
60
70
80
90
100
1980
1981
1982
1983
1984
1985
1986
1987
1988
1989
1990
1991
1992
1993
1994
1995
1996
1997
1998
1999
2000
2001
2002
2003
2004
2005
2006
2007
2008
2009
2010
2011
2012
2013
Aframax Tanker 5 Year Old
Panamax Bulk Carrier 5 Year Old
Price $ Million
Panamax bulker peaked at around $90m in 2007/08
Secondhand Price Development
January 2014
Panamax bulker declined 72% from market peak.
Panamax bulker has increased 37% from recent trough.
www.clarksons.com 12
S&P Activity Has Increased

19/05/2014
7
www.clarksons.com 13
2. World Trade
January 2014
www.clarksons.com 14
Seaborne Trade Growth & The World Economy
Historically, world seaborne trade expansion has generally been relatively well correlated to global economic growth.
Sea trade cycles generally follow cycles in world GDP – but not precisely. 2014 – 3.6% GDP growth and 4.2% growth in trade?
-8.0%
-4.0%
0.0%
4.0%
8.0%
12.0%
199
61
997
199
81
999
200
02
001
200
22
003
200
42
005
200
62
007
200
82
009
201
02
011
201
22
013
201
4 (
f)2
015
(f)
Seaborne Trade GrowthWorld GDP Growth
April 2014
0
2
4
6
8
10
12
0.0
0.2
0.4
0.6
0.8
1.0
1.2
1.4
1.6
1.8
2.0
1985
1987
1989
1991
1993
1995
1997
1999
2001
2003
2005
2007
2009
2011
2013
bt tradetonnes pp
Source: Clarkson Research Services
Global Trade per Capita
Trade per Capita (LHS)
Global Seaborne Trade (RHS)
Milestone 12014: Trade reaches 10bt
Milestone 22002: Trade passes
1t per person

19/05/2014
8
www.clarksons.com 15
Two Speed World ?Index
1993=100
IP : Atlantic Economies
IP : Pacific Economies
April 2014
www.clarksons.com 16
World Seaborne Trade Growth in world seaborne trade in
last decade led by
Iron Ore
Containers
LNG
Coal
Vehicles
Average CAGR of 4.1%.
In 2013 growth of 3.9% - a good performance given general economic conditions.
Expected growth of 4.2% in 2014.
Some upside if business cycle improves.
2000-13 Trade Growth by Commodity, CAGR %
January 2014
4.1% average
19/05/2014
9
www.clarksons.com 17
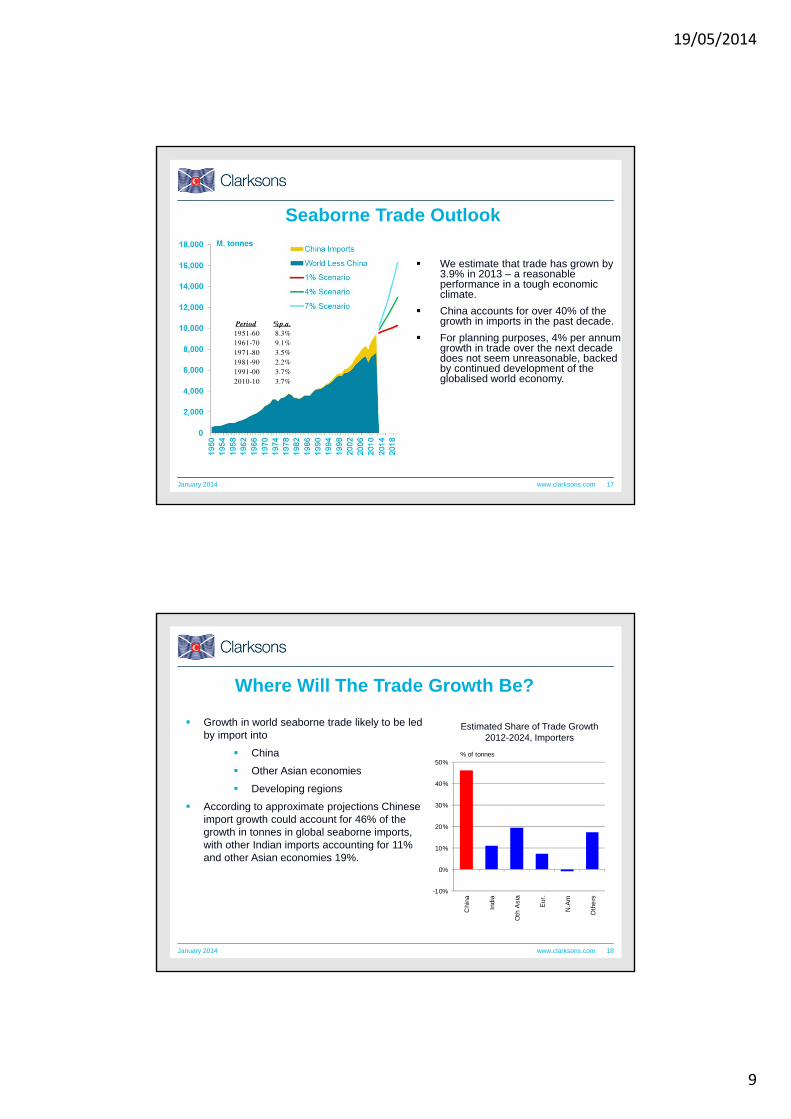
Seaborne Trade Outlook
We estimate that trade has grown by 3.9% in 2013 – a reasonable performance in a tough economic climate.
China accounts for over 40% of the growth in imports in the past decade.
For planning purposes, 4% per annum growth in trade over the next decade does not seem unreasonable, backed by continued development of the globalised world economy.
January 2014
Period %p.a.1951-60 8.3%1961-70 9.1%1971-80 3.5%1981-90 2.2%1991-00 3.7%2010-10 3.7%
www.clarksons.com 18
Where Will The Trade Growth Be?
Estimated Share of Trade Growth 2012-2024, Importers
Growth in world seaborne trade likely to be led by import into
China
Other Asian economies
Developing regions
According to approximate projections Chinese import growth could account for 46% of the growth in tonnes in global seaborne imports, with other Indian imports accounting for 11% and other Asian economies 19%.
-10%
0%
10%
20%
30%
40%
50%
Chi
na
Indi
a
Oth
Asi
a
Eur
.
N.A
m
Oth
ers
% of tonnes
January 2014
19/05/2014
10
www.clarksons.com 19
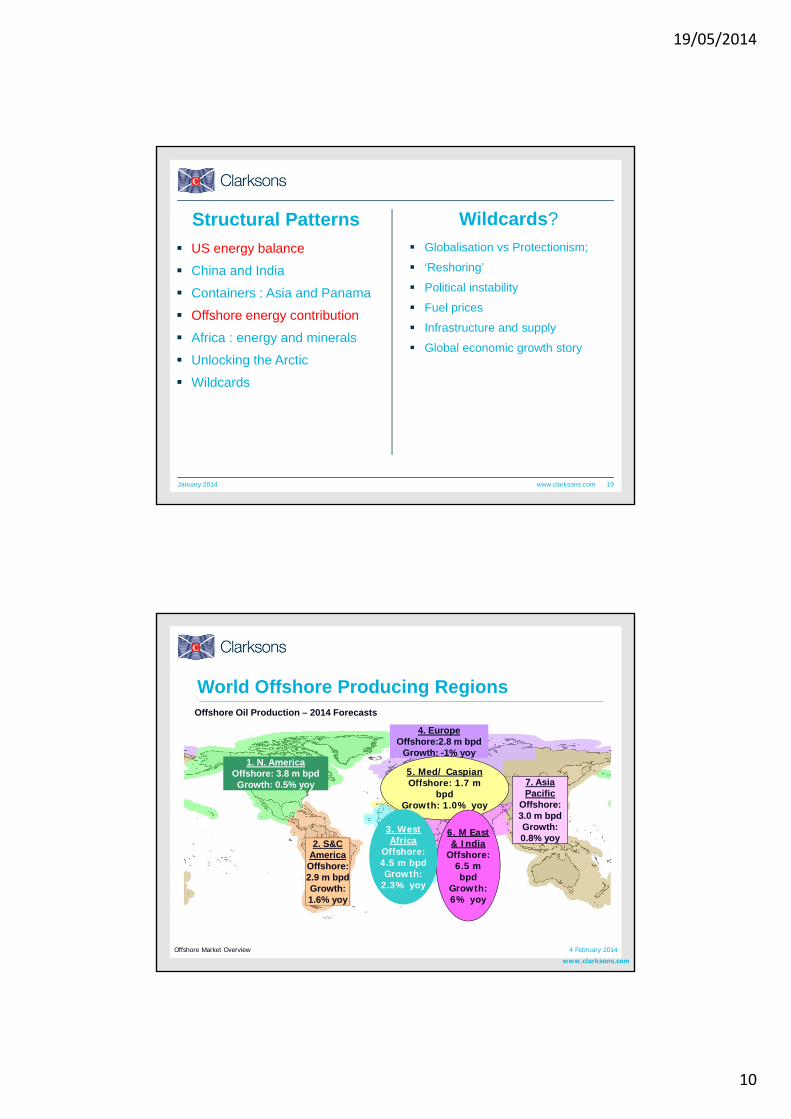
Structural Patterns
US energy balance
China and India
Containers : Asia and Panama
Offshore energy contribution
Africa : energy and minerals
Unlocking the Arctic
Wildcards
Globalisation vs Protectionism;
‘Reshoring’
Political instability
Fuel prices
Infrastructure and supply
Global economic growth story
Wildcards?
January 2014
www.clarksons.com
World Offshore Producing Regions
Offshore Market Overview 4 February 2014
1. N. AmericaOffshore: 3.8 m bpdGrowth: 0.5% yoy
2. S&C America
Offshore:2.9 m bpdGrowth: 1.6% yoy
4. EuropeOffshore:2.8 m bpd
Growth: -1% yoy
7. Asia Pacific
Offshore: 3.0 m bpdGrowth: 0.8% yoy
5. Med/ CaspianOffshore: 1.7 m
bpdGrowth: 1.0% yoy
6. M East & India
Offshore: 6.5 m bpd
Growth: 6% yoy
3. West Africa
Offshore: 4.5 m bpdGrowth:
2.3% yoy
Offshore Oil Production – 2014 Forecasts

19/05/2014
11
Oil & Gas ProductionLong-Term Oil Production Long-Term Gas Production
May 2014
Projected offshore oil production growth 2013-23 :World 2.4% paNorth America -2.5% paLatin America 5.2% pa
Projected offshore gas production growth 2013-23 :World 4.3% paNorth America 1.3% paLatin America 5.4% pa
www.clarksons.com 22
3. The World Fleet and Orderbook
January 2014

19/05/2014
12
www.clarksons.com 23
The World Fleet: GT
1. Long-term: 1986-2013 CAGR: 3.9%.
2. Medium-term: 1996-2013 CAGR: 5.0%.
• Largest growth in containerships (CAGR of 9.0%) and gas carriers (7.4%).
3. Short-term: 2006-2013 CAGR: 6.7%.
• In 2010, the fleet increased by 8.7%, the fastest rate of growth in recent history. In 2013, the fleet has grown by a further 3.8%, indicating a marginal slow-down in the rate of deliveries.
• At the start of January 2014, the fleet totalled 1,133 million GT.
The Size of the World Fleet (GT)
Numbers
% Share
Tonnage
(GT)%
Share
Growth 2009-12
(GT) 2014
(f)
O/B as % Fleet
Crude and Products Tankers
9,243 10% 265.0 23% 13% 1% 13%
Bulkers 10,046 11% 403.00 36% 48% 4% 21%
Containerships 5,087 6% 188.0 17% 24% 5% 22%
MPP 3,237 4% 21.0 2% 6% 0% 7%
Ro Ro 1,315 1% 15.0 1% -2% -2% 7%
Other Dry 15,837 23% 28.2 6% -3% 0% 2%Chemical and Specialised
4,034 2% 26.93 2% 12% 1% 8%
LPG 1,255 1% 14.0 1% 7% 6% 34%
LNG 387 0% 38.5 3% 13% 9% 30%
PCC 757 1% 35.1 3% 20% 3% 13%
Reefer 1,439 2% 4.9 0% -28% -7% 0%
Offshore 10,199 12% 49.8 4% 25% 5% 23%
Dredgers 2,186 2% 4.5 0% 20% 4% 4%
Tugs 16,297 18% 4.5 0% 16% 3% 2%
Cruise 360 0% 17.7 2% 15% 4% 17%
Ferries 6,034 7% 15.8 1% -2% -2% 3%
Other 617 1% 1.0 0% 1% 3% 12%
Merchant Fleet
1. 88,000 vessels over 100 GT
2. 1,138 million GT
3. $944 billion value
April 2014

19/05/2014
13
Contracting, Deliveries & DemolitionsMillion GT
April 2014
Orderbook As & % Of Fleet
Orderbook % Fleet By (Dwt), Start Year
Orderbook % Fleet
Orderbook has increased – up to
17% in March 2014 from a low of 14.8%
February 2014
O/B as at January 2014 was 284m
dwt $ 292bn
19/05/2014
14
www.clarksons.com 27
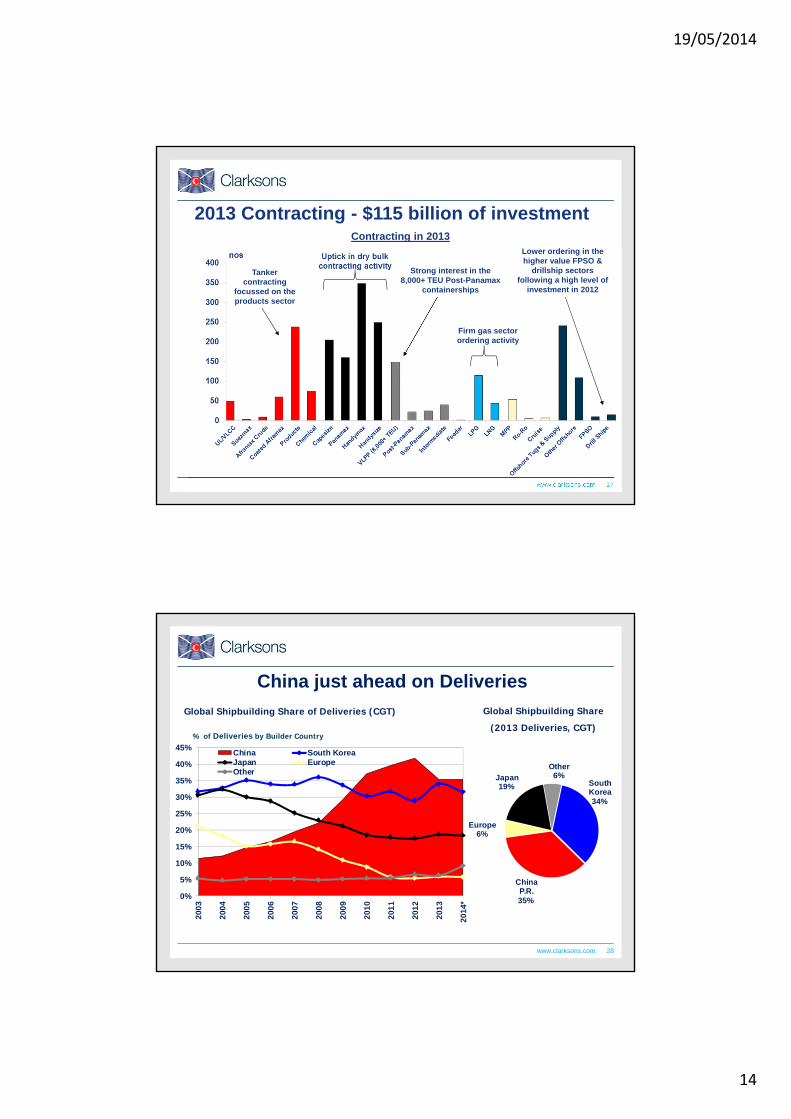
2013 Contracting - $115 billion of investmentContracting in 2013
Tanker contracting
focussed on the products sector
Strong interest in the 8,000+ TEU Post-Panamax
containerships
Firm gas sector ordering activity
Lower ordering in the higher value FPSO &
drillship sectors following a high level of
investment in 2012
www.clarksons.com 28
China just ahead on Deliveries
Global Shipbuilding Share of Deliveries (CGT)
0%
5%
10%
15%
20%
25%
30%
35%
40%
45%
20
03
20
04
20
05
20
06
20
07
20
08
20
09
20
10
20
11
20
12
20
13
20
14
*
China South KoreaJapan EuropeOther
South Korea34%
China P.R.35%
Europe6%
Japan19%
Other6%
Global Shipbuilding Share
(2013 Deliveries, CGT)% of Deliveries by Builder Country
19/05/2014
15
www.clarksons.com 29
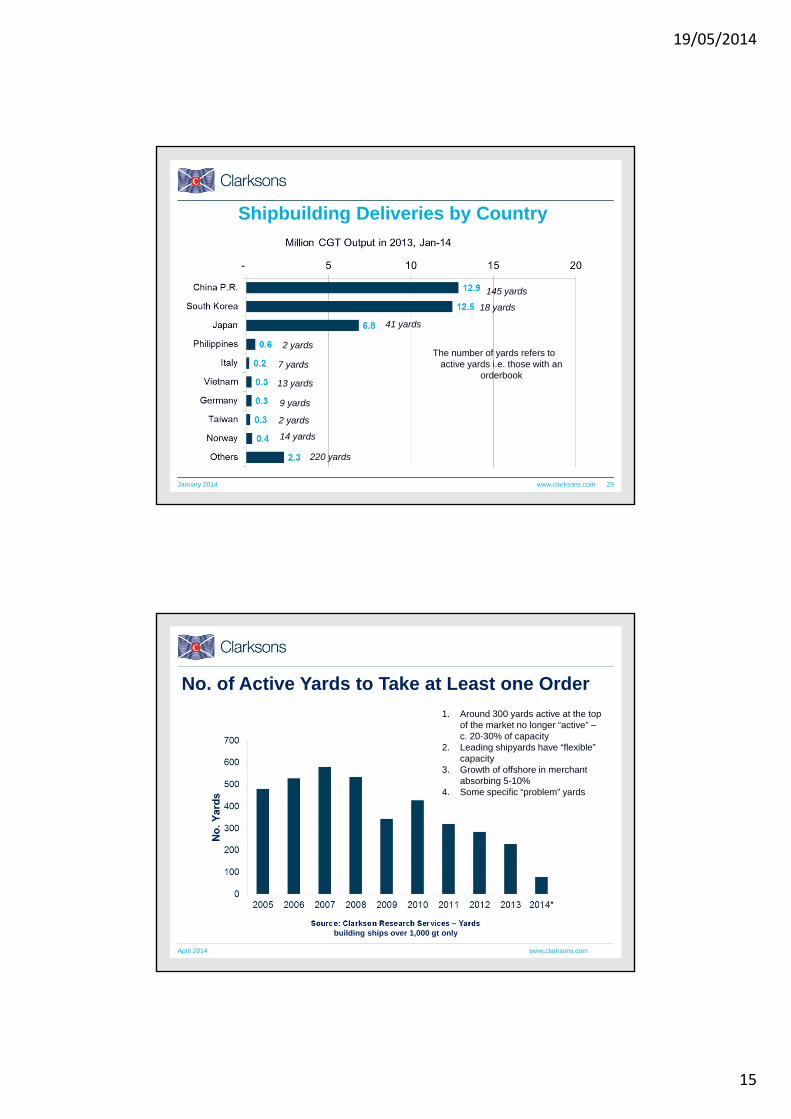
Shipbuilding Deliveries by Country
145 yards
18 yards
41 yards
2 yards
7 yards
13 yards
9 yards
2 yards
14 yards
220 yards
The number of yards refers to active yards i.e. those with an
orderbook
January 2014
www.clarksons.com
No. of Active Yards to Take at Least one Order
April 2014
Source: Clarkson Research Services – Yards building ships over 1,000 gt only
1. Around 300 yards active at the top of the market no longer “active” –c. 20-30% of capacity
2. Leading shipyards have “flexible” capacity
3. Growth of offshore in merchant absorbing 5-10%
4. Some specific “problem” yards
19/05/2014
16
www.clarksons.com
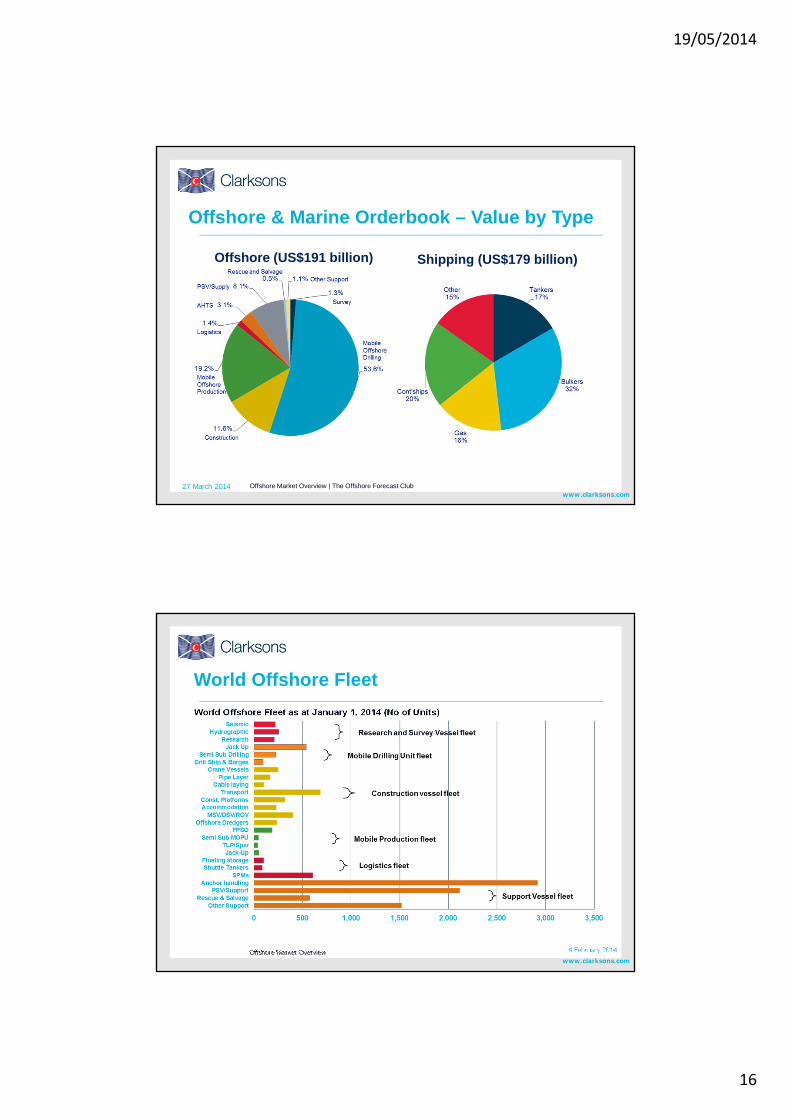
Offshore & Marine Orderbook – Value by Type
Offshore (US$191 billion)
27 March 2014 Offshore Market Overview | The Offshore Forecast Club
Shipping (US$179 billion)
www.clarksons.com
World Offshore Fleet
World Offshore Fleet as at January 1, 2014 (No of Units)
Offshore Market Overview 4 February 2014

19/05/2014
17
www.clarksons.com
Mobile Offshore Age Profile
www.clarksons.com 34
Age Profile – 8% of fleet above 25 years
0
10
20
30
40
50
60
70
80
90
100
110
1971 1975 1979 1983 1987 1991 1995 1999 2003 2007 2011 2015
Mill
ion
GT
De
live
rie
s
Orderbook
Deliveries
Note: Owing to slippage and cancellation, not everything on
order as of 1st Jan-14 will deliver into the fleet.
Relatively few vessels built in the 1980s so limited replacement requirement
January 2014

19/05/2014
18
www.clarksons.com 35
Model makes allowance for vessel productivity trends.
Vessel speed estimates focus on the key volume sectors.
Less clear picture in the more industrial/niche sectors.
It appears that compared to pre-recession standard speeds, current average speeds for bulkers and tankers are around 2.0 knots down and containerships around c.4.0 knots down.
Compared to six months ago we have adjusted 2013 bulker speeds down by 0.5 knots and containership speeds down by 0.25 knots.
Vessel requirement projections assume trending out of average service speeds for containerships at around current speed levels, with averages for tankers and bulkers trending back to around 2010/11 levels in the long-term.
Vessel Productivity TrendsVessel Speed Indices
www.clarksons.com 36
0%
2%
4%
6%
8%
10%
12%
0
200
400
600
800
1,000
1,200
1996
1997
1998
1999
2000
2001
2002
2003
2004
2005
2006
2007
2008
2009
2010
2011
2012
2013
2014
2015
Fleet, end year
Fleet Growth % (RHS)
World Fleet Growth Development
Million GT
1. Fleet growth peaked at c. 9% in 2010
2. In numeric terms growth is ½ to a third of tonnage growth
Projected deliveries based on current orderbook.
By 2023 our forecasts
suggest the fleet will top 1.5 billion GT
Shipbuilding production down 20% in 2013 in dwtand 2012 a record demolition year.

19/05/2014
19
www.clarksons.com 37
Estimated World Cargo Fleet Supply-Demand Growth
Supply growth projected to move back below demand growth
Challenge : Surplus Capacity
May 2014
www.clarksons.com
Newbuild Investment Forecast
Average Annual Investment $billion
Including Merchant & Offshore investment, forecasts suggest a trillion US dollars of newbuild investment needed 2014 – 2020!

19/05/2014
20
www.clarksons.com 39
4. Other Issues
January 2014
www.clarksons.com 40
Regional Ownership – Europe v Asia• During the market boom, European ownership
grew strongly and maintained market share with around 45% of global fleet by GT.
• There has been a long term trend towards Asia/Pacific ownership which topped 40% in 2013.
• Greece and Japan are the two biggest fleets, with the Greek fleet overtaking the Japanese fleet in 2013. China has overtaken Germany to take third position and the fleet is growing rapidly. German fleet declined in 2013.
• In the past five years, Brazil, China, Turkey, South Korea and Indonesian fleets have grown the most in percentage terms.
• 70% of the world is in Open Registries compared to 30% in the 1980s,
Asian Owners Growing Market Share

19/05/2014
21
www.clarksons.com 41
The World Fleet: By Owner Nationality
0 50 100 150 200 250 300 350 400
Others
Denmark
Italy
Singapore
Norway
United States
South Korea
Germany
China P. R.
Japan
Greece
January 2014
Chinese owned fleet: up 7.5% in 2013
German owned fleet: down 2.4% in 2013
www.clarksons.com 42
Regional Ownership – Top Five Nations• The Greek fleet grew by 8.4% in 2013, following
on from growth of 5.8% in 2012.
• The Japanese fleet increased by 2.4% in 2013, the lowest level of annual growth since 2009. Japanese owners were net sellers in 2013.
• China’s fleet has grown by 92.4m GT since the start of 1996, increasing by 24.4% in 2009 and 25.5% in 2010. Whilst the rate of growth was much lower at 6.9% in 2013, this was still relatively strong globally.
• Owners from the top five nations control over 50% of global capacity in GT terms.
Top Nations

19/05/2014
22
www.clarksons.com
Three European “Heavyweights”
Wet & Dry
Greek Fleet
Bulkers
Gas
Norwegian Fleet
Specialised
German Fleet
Containerships
www.clarksons.com 44
World Fleet by Company Size
Company SizeNumber of Companies
Number of vessels
m.GT% of fleet
(no. of vessels)% of fleet
(GT)Ships per Company
Small (1-5) 5,577 9,818 167.0 25% 15% 1.8
Small (6-10) 999 5,878 124.5 15% 11% 5.9
Medium (11-20) 657 7,405 192.0 19% 17% 11.3
Large (21-50) 373 8,326 300.3 21% 27% 22.3
Very Large (51-100) 101 5,196 183.7 13% 17% 51.4
XXL (100+) 22 2,899 141.2 7% 13% 131.8
Total 7,729 39,522 1108.7 5.1
*Based on Beneficial Owner, excludes unknown owners
For vessels >2,000 GT
19/05/2014
23
www.clarksons.com 45
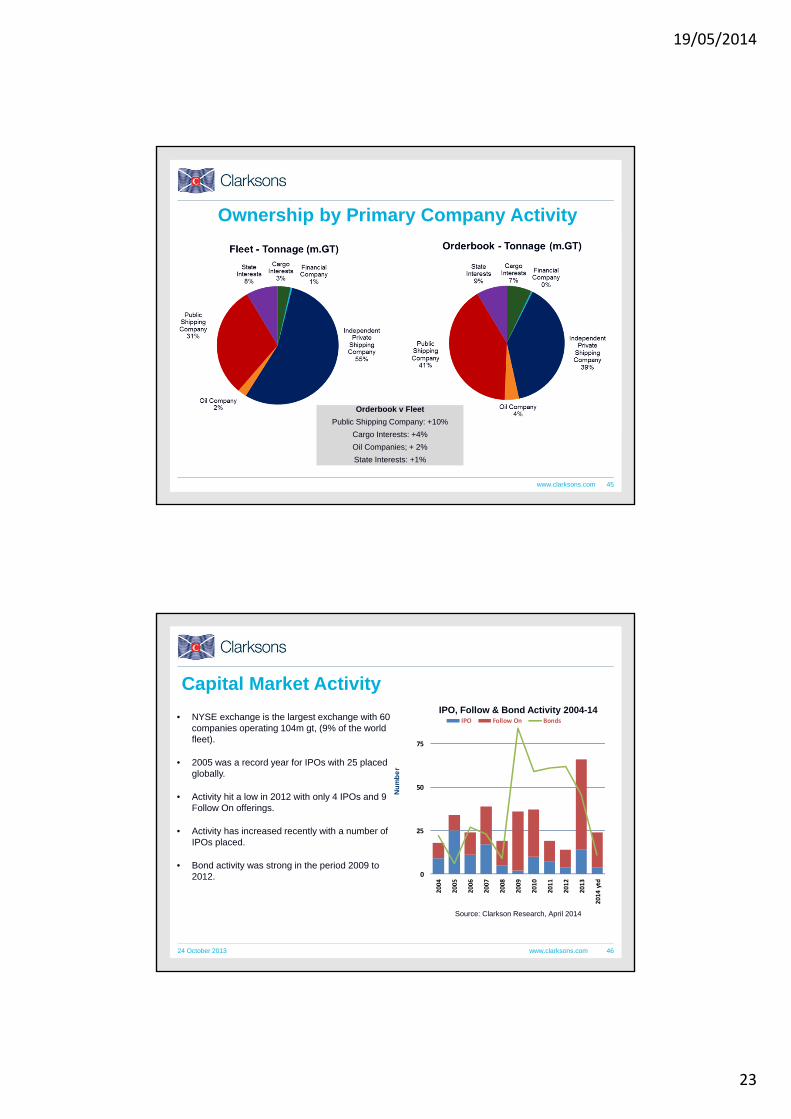
Ownership by Primary Company Activity
Orderbook v Fleet
Public Shipping Company: +10%
Cargo Interests: +4%
Oil Companies; + 2%
State Interests: +1%
www.clarksons.com 46
0
25
50
75
2004
2005
2006
2007
2008
2009
2010
2011
2012
2013
2014
ytd
Nu
mb
er
IPO Follow On Bonds
IPO, Follow & Bond Activity 2004-14• NYSE exchange is the largest exchange with 60
companies operating 104m gt, (9% of the world fleet).
• 2005 was a record year for IPOs with 25 placed globally.
• Activity hit a low in 2012 with only 4 IPOs and 9 Follow On offerings.
• Activity has increased recently with a number of IPOs placed.
• Bond activity was strong in the period 2009 to 2012.
Capital Market Activity
24 October 2013
Source: Clarkson Research, April 2014

19/05/2014
24
www.clarksons.com 4726 March 2014 Shipbuilding Forecast Club
Number of Private Equity Deals
Capital Markets & Private EquityNumber of Maritime IPOs and Follow-Ons
www.clarksons.com 48
0
100
200
300
400
500
600
700
800
1973
1974
1975
1976
1977
1978
1979
1980
1981
1982
1983
1984
1985
1986
1987
1988
1989
1990
1991
1992
1993
1994
1995
1996
1997
1998
1999
2000
2001
2002
2003
2004
2005
2006
2007
2008
2009
2010
2011
2012
2013
2014
Rising Fuel Costs Turning Shipping Economics On Its Head
Bunker Prices
Bunker prices take off In early 2005
Bunker $/tonne
Bunker price below $150/tonne
Bunkers $700/tonne
April 2014

19/05/2014
25
www.clarksons.com 49
0
5,000
10,000
15,000
20,000
25,000
30,000
1997
1998
1999
2000
2001
2002
2003
2004
2005
2006
2007
2008
2009
2010
2011
2012
2013
Fuel Economics $/day
MR 1 Year Timecharter Rate $/day
MR Bunker Cost $/day
January 2014
1. Consumption improvements stabilising.
2. Monitoring very important.
3. Micro Management
4. Cost Control
www.clarksons.com 50
Environmental Legislation: Timeline
* Draft amendments delaying implementation to 2021 will be considered, with a view to adoption, at the MEPC 66 in 2014.** Subject to review into availability of low sulphur fuel, with option to delay implementation to 2025.

19/05/2014
26
www.clarksons.com 51
Environmental Issues: OverviewIssue Regulation Overview Latest Position
Vessel Design/ Efficient
Technology
MARPOL Annex VI - Energy Efficiency Design Index (EEDI)
Economic factors: High Bunker Prices
Low Vessel Earnings
Energy-efficiency and regulatory concerns have seen a number of developments in vessel design and
technology in recent years. These include hull, propeller, rudder and engine improvements.
E.g. Ulstein X-Bow, Becker Mewis Duct, rudder bulb, Kappel Propeller, bulbuous bows, diesel-electric engines, Waste Heat Recycling System,
Mitsubishi Air Lubrication System.
Emission Control Areas (ECAs)
MARPOL Annex VI "Regulations for the Prevention of Air Pollution from
Ships"
Vessels operating within ECAs are subject to stricter emission (SOx and NOx) limits
Current ECAs: Baltic Sea (SOx, 2006), North Sea (SOx, 2008), North American Sea (SOx, NOx and PM, 2012), US Caribbean Sea (SOx,
NOx and PM, 2014)
NOx MARPOL Annex VI NOx emission limits are set in three tiers for diesel
engines depending on the engine maximum operating speed and year of build
Tier I - 2008, Global limit for ships built 2000 – 2011
Tier II -2011, Global limit for ships built > 2010
Tier III – 2016*, ECA limit for ships built > 2015 (Tier II outside ECAs)
SOX and Particulate
Matters (PM)MARPOL Annex VI
Caps on the sulphur content of fuel oil to control SOx
emissions and, indirectly, PM emissions Sulphur Limit in Fuel (% m/m) Inside ECAs - 1.0% (0.1% in 2015)
Global - 4.5% trimmed to 3.5% with effect in 2012 (0.5% in 2020**)
CO2 MARPOL Annex VI
Introduction of an EEDI for newbuilds > 400 GT, with an aim to reduce a vessel's CO2 emissions per capacity
mile, and a SEEMP for existing vessels, so as to improve operational efficiency
EEDI for newbuilds & SEEMP for existing vessels mandatory - 2013 Reduction of EEDI reference line in three stages (2015, 2020, 2025)
Ballast WaterInternational Convention for the
Control and Management of Ships' Ballast Water and Sediments
Aims to prevent the transfer of harmful aquatic organisms and pathogens through the control and management of ships´ ballast water and sediments
Adopted by IMO in 2004, the convention will enter into force 24 months after the date on which 15 states (40% of global GT) have ratified it.
Currently 38 signatories (30.6% of global GT)
Inert GasSOLAS "International Convention
for the Safety of Life at Sea"
Tankers >20,000 dwt are required to protect cargo tanks by a fixed inert gas system in compliance with the IMO's
Fire Safety Systems Code
Effective as of 1974. Draft amendments, which will lower the dwtrequirement to 8,000 dwt for newbuilds, have been discussed
OilSTS Plan Ship-to-Ship transfer plan
New chapter and clearer definition of tanks (regulation 1) entered into force January 1, 2011
Heavy Grade Oil Prohibition of heavy grade oil in the Antarctic Sea. Effective as of August 1, 2011
Ship RecyclingThe Hong Kong Convention for the Safe and Environmentally Sound
Recycling of Ships
Once ratified, shipowners will need: an inventory of hazardous materials, a ship recycling plan, permission from the flag state to to conduct a final survey and an
international ready for recycling certificate
The convention will enter into force 24 months after the date on which 15 states (40% of global GT) have ratified it. Norway is currently the
only signatory (1.5% of global GT)
* draft amendments delaying implementation to 2021 will be considered, with a view to adoption, at the MEPC 66 in 2014 ** subject to review into availability of low sulphur fuel due to be completed in 2018, with option to delay implementation to 2025
www.clarksons.com 52
Emission Control Areas (ECAs)
North SeaSOx
Baltic SeaSOx
North AmericaSOx, NOx and PM
US Caribbean SeaSOx, NOx and PM

19/05/2014
27
www.clarksons.com 53
Global Crewing RequirementsAverage
CrewTotal Crew
Example Crew
Oil Tankers 18 120,705 VLCC ‐ 21
Bulkers 21 209,158 Capesize‐ 20
Container 19 98,933 Handy – 19
LPG 16 19,997 VLGC – 21
LNG 27 10,567 LNG – 26
PCC & Ro Ro 20 32,366 6,000 cars – 20
Passenger 164 245,260Large Cruise
1,246
Offshore 14 148,596
World Fleet 21 1.2 million
Source: Clarkson Research / International Labour Organization, January 2014
• Across the global fleet above 2,000gt (50,000 ships), the global crewing requirements are approximately 1.2 million.
• In numeric terms the global fleet is growing at around at approximately one third to a half of the growth in tonnage terms due to upsizing.
• This suggests the rate of growth in crew requirements is slowing
www.clarksons.com
Shipping Industry OPEX – $90 billion a year
Shipping OPEX (USD 90 billion per year)
• Across the global cargo fleet of 50,000 vessels, total annual OPEX is approximately $90 billion per year.
• $37.4 billion is crew costs followed by $9 billion in management fees
Source: Clarkson Research, Moore Stephens, May 2014

19/05/2014
28
www.clarksons.com
Vessel Earnings, OPEX and Wages 2008-2013
• Wage data for UK, Greece, Norway and Germany from OECD – https://stats.oecd.org – basis 2012 US$ Ex Rates, 2012 Prices.• Wage data for China and Singapore from Trading Economics – www.tradingeconomics.com – annual wage series.• Clarksea Index data is the annual average for each year from 2008-2013, indexed to 2008.
www.clarksons.com 56
5. Summary
January 2014

19/05/2014
29
www.clarksons.com 57
Summary• In 2013 we were at the bottom of the cycle and while market conditions are still challenging there are a few
encouraging signs. Some of the niche sectors have been better positioned – Offshore, Gas, Chemicals, Products. The year ended with some better markets - in part driven by seasonal demand.
• Following the demand shock in 2009, trade has recovered well and we estimate 3.9% growth in full year 2013. In 2014 we forecast trade will top 10 billion tonnes for the first time and there is upside on 2013 growth if the business cycle moves forward. 4% is a reasonable base case for the future assuming globalisation but watch out for “wildcards”. Offshore activity has been growing strongly but recent oil major “push back” on cost.
• Fleet growth is slowing, from 8% in 2011 to 5% in 2012. We recorded growth of 3.8% in 2013 - this was 1% lower than our forecast in December 2012 due to slower output at Chinese yards. Our forecast for 2014 and 2015 is region 3.6% but keep an eye on increased ordering and speed.
• Despite the difficult spot market conditions, there was a significant increase in newbuilding contracting and sale and purchase activity during 2013. Financing remains difficult for smaller owners and has limited investment but availability improving for “top tier” and Private Equity & Capital Markets are important.
• Some consolidation trends and growth of public listed fleets. Asian owners growing market share with double the fleet growth of Europeans in 2013. Greeks and Japanese the largest owners but China has surged past Germany. Norwegian’s, Greeks and Chinese have topped investment charts in recent years.
• Fuel economics has had a major impact on investment decisions and monitoring now important – large owners able to micro manage and have an advantage. Regulation a large and growing issue but decisions are difficult.
May 2014
www.clarksons.com 58
Contact
Stephen Gordon or James Coldwell
Clarkson Research Services Ltd.
Tel: + 44 (0)207 334 3439
Email: [email protected]
Trial Shipping Intelligence Network (SIN) at: www.clarksons.net
Trial World Fleet Register (WFR) at: www.clarksons.net/wfr
For more information on our product range, please visit: www.crsl.com
January 2014

19/05/2014
30
www.clarksons.com 59
Disclaimer
January 2014
The information supplied herewith is believed to be correct but the accuracy thereof is not guaranteed and the Company and its employees cannot accept liability for loss suffered in consequence of reliance on the information provided. Provision of this data does not obviate the need to make further appropriate enquiries and inspections.
The information is for the use of the recipient only and is not to be used in any document for the purposes of raising finance without the written permission of Clarkson Research Services Ltd.
The statistical and graphical information contained under the heading is drawn from the Clarkson Research Services Limited ("CRSL") database and other sources. CRSL has advised that: (i) some information in CRSL's database is
derived from estimates or subjective judgments; and (ii) the information in the databases of other maritime data collection agencies may differ from the information in CRSL's database; and (iii) whilst CRSL has taken reasonable care in the compilation of the statistical and graphical information and believes it to be accurate and correct, data
compilation is subject to limited audit and validation procedures and may accordingly contain errors; and (iv) CRSL, its agents, officers and employees do not accept liability for any loss suffered in consequence of reliance on such information or in any other manner; and (v) the provision of such information does not obviate any need to make
appropriate further enquiries; (vi) the provision of such information is not an endorsement of any commercial policies and/or any conclusions by CRSL; and (vii) shipping is a variable and cyclical business and any forecasting
concerning it cannot be very accurate.