Shipping by the crowd - empirical analysis of operations and behavior
33
A. Stathopoulos Shipping by the crowd: empirical analysis of opera:ons and behavior Amanda Stathopoulos, CEE Northwestern University Choice Modelling Centre Seminar, Institute for Transport Studies at the University of Leeds Thursday 10th November 2016
-
Upload
institute-for-transport-studies-its -
Category
Economy & Finance
-
view
257 -
download
2
Transcript of Shipping by the crowd - empirical analysis of operations and behavior

A. Stathopoulos
Shipping by the crowd: empirical analysis of opera:ons and behavior
Amanda Stathopoulos, CEE Northwestern University
Choice Modelling Centre Seminar, Institute for Transport Studies at the University of Leeds Thursday 10th November 2016

A. Stathopoulos
Outline
1. The concept Crowd-sourced delivery project - Capacity saver? Freight side-liner?
3. Models of crowdshipping Examine operations & Behavior of on-the-go shipping
4. First insights and outlook
2. Literature Drawing on related sectors/issues

Behavior
Consumer
Ecological
Technology
Demographic
Regulation
Economic
Trends & Challenges for urban delivery
54% urban, 12% mega-cities
E-commerce B2C 1.9 trl E-logistics ‘logsumer’
Speedy e-tailer delivery Multiple channels
Sharing economy - Collaborative
consumption - Collaborative
business
Quality of life Competing objectives
Real time big data + analytics Automotive tech. advances UAV. IoT for freight
Insurance Regulate new technology/models

A. Stathopoulos
Research ra:onale
• Crowd-sourced, on-the-go goods delivery
• Limited understanding of disruptive models
Technology - Device enabled
Sharing - Culture of collective ownership
Enabled by: Operating in the context of: Growing expectations • Personalization • Transparency • Speed/cost
Growing pressures • E-commerce • Single parcel
Sharing economy
crowdshipping

A. Stathopoulos
Northwestern + UIC research
Designing a new system – interdisciplinary challenge
Crowd-shipping
Behavior New agents: needs, preferences, aspirations?
Operations City-logistics routing, collaborative delivery, consolidation
Economics Design pricing, Bidding, Incentives
Computation Predictive analytics, Big data analysis, Integrated system
Legal? Insurance, labor
Stathopoulos (NU)
Nie, Lin (NU+UIC)
NSF Partnership for innovation CROUD project Schumer (NU)
Wolfson (UIC)

A. Stathopoulos
A crowd-‐based delivery system
Sender/ Customers • Models; B2B,
B2C?
Carrier • Commuter • Dedicated non-
professional • Professional
Definition: “Crowdshipping” delivery of goods by non-professional tapping into existing travel routes
Exchange – Revenue • Fixed or Negotiated,
bidding
Need – Generate task – Match with driver – Negotiate price – Deliver – Reception -- Rating
Value system Company goal ranging from • efficiency to • community oriented

A. Stathopoulos
Research challenge
Sender/ Customers • Models; B2B,
B2C?
Carrier • Commuter • Dedicated non-
professional • Professional
Research to date on crowdshipping:
Exchange – Revenue • Fixed or Negotiated,
bidding
q Unclear what value customers give to price, speed, tailoring, access specific to crowdshipping
Obstacles revealed q Trust in new
setting q Critical mass
and hen-and-egg problems
q Unclear motivation for drivers
Rogues & Montreuil 2014 BCG surveys

A. Stathopoulos
Research challenge
Urban logistics
Connected research
q Models of parcel pickup behaviour (Collins 2015)
q Collaborative city logistics (Chowdhury 2016)
Peer-based eco.
q Varying motivations (Bellotti et al. 2015)
Sharing transport
q Age and education relate to on-demand rides (Rayle et al., 2016, Shaheen et al., 2016)
q Attributes relevant in ride sourcing (Agatz 2012, Furuhata 2013)
q Urban location and transit use separate ‘sharers’ (Clewlow 2016)
Industry
q Didi Kuadi 250mln users in China (includes express)
q GrabTaxi 9mln downloads
Urban delivery; like ride-‐hailing
dynamic organiza:on of delivery, efficiency
Long distance; Like carpoolign,
slower organiza:on, community-‐based

A. Stathopoulos
Research ra:onale
• This research empirically examines 2 parts of this problem
Part 1: Opera:onal performance of on-‐demand delivery
Delivery rate • Logistic regression of delivery • Performance variation?
Chain-of-event dynamics • Hazard models of duration • Performance variation?
Part 2: Behavior analysis
Customer choice of delivery • Acceptance of crowd-delivery • Preference by context and
heterogeneity
Driver choice of shipment • Willingness to work • Value of time and preference
heterogeneity
Delivery not guaranteed Dynamics unknown
Behavior unexplored Critical mass, acceptance

A. Stathopoulos
The data
• Collaboration with crowdshipping startup in the US
Bubble plot: users who have published on platform (size # publ, darkness = date of enrolling)
Ca. 250’000 enrolled in system (majority are drivers) Operations for about 2 years • Working with posted (12’000) and delivery instances
• Varying type of goods and distances • Around 40 variables including time-stamp, location, delivery features
• Little know about users/drivers

A. Stathopoulos
Func:oning of system: what is the delivery performance?
Part 1: deliverability
Indep.Variables Coef.t-statistic exp(Coef.)
constant 0.5199 2.90 1.682total_distanceX100m -0.0463 -4.14 0.955sender_business_binary(baseprivate) 0.9856 6.80 2.679size_smallpackage(baselarge+long) 0.4514 4.26 1.571carrier_age25_34(basemissing+18_24) 0.4776 2.89 1.612carrier_age35over(basemissing+18_24) 0.7801 4.71 2.182category_perishable(baseallother) 0.8242 3.79 2.280region_southernUS(baseallother) 0.3796 3.25 1.462 Summarystatistics Loglikelihoodatconstants -5425.849 Loglikelihoodofmodel -1525.081 McFadden'spseudor-squared 0.724 Nagelkerkepseudor-squared 0.896 AIC 3068.2
1
Binary logistic regression model of delivery Lower delivery prob. • Each extra 100 miles
reduces odds of delivery by 5%
Increase prob. • Small package 1.6
times the odds • Perishable good have
2.3 times the delivery odds
Y= if the posted object was delivered
logit (π i) = β ' xi

A. Stathopoulos
Part 1: deliverability
0.8
0.9
0 250 500 750 1000total_distance
PredictedProb
as.factor(category_perish)0
1
Conditiontotal
distancesenderstatus
packagesize
carrierage
goodscategory region
probabilityofdelivery
1:leastadvantageous Average private large 25_34 allother rest 0.708
2 Average private large over35 allotherSouthUSA 0.828
3 Average business small 25_34 perishable rest 0.9594:mostadvantageous Average business small over35 perishable
SouthUSA 0.979
1
Applying deliverability model on specific contexts reveals systematic variation
4 scenarios Delivery probability
ranges from 0.71 to 0.98 depending on scenario
Probability of delivery success for scenario 2 (red) and 3 (blue) by varying distance (10-1000 miles)

A. Stathopoulos
Time-‐of-‐event models Survival analysis on delivery (prob. to survive past :me t undelivered) Different events and explanatory factors
Part 1b: dura:on models
1 2 3 4 5 6 7
-20
24
68
Dur. publish-deliver
weekday published
log(duration)
posted to acceptance 75% 90% 95% 99% hours 4 49 123 574 days 0.2 2.0 5.1 23.9
posted to pickup 75% 90% 95% 99% hours 22 113 207 652 days 0.9 4.7 8.6 27.2
posted to delivery 75% 90% 95% 99% hours 25 127 240 765 days 1.0 5.3 10.0 31.9
pickup to delivery 75% 90% 95% 99% hours 2 14 30 146 days 0.1 0.6 1.3 6.1
Performance in real data
From a consumer posting –driver accepting a delivery – source of delay
Coordinating pickup, initial delay

A. Stathopoulos
0 50 100 150
0.0
0.2
0.4
0.6
0.8
1.0
Hours: Published to delivery - cumulative
Sur
viva
l Pro
babi
lity
0 20 40 60 80 100 120 140
0.0
0.2
0.4
0.6
0.8
1.0
Hours: Pickup to delivery - cumulative
Sur
viva
l Pro
babi
lity
Connec:ng peers – dynamics of pos:ng?
Part 1b: dura:on models
From hour of posting, uneven dynamics in first 2
days
KM plot Posted -‐> delivered
KM plot Pickup -‐> delivered
Non-parametric Duration models reveal timing of delays
Once picked up: The delivery is satisfied
quickly

A. Stathopoulos
dura:on models for crowdshipping
0 50 100 150
0.0
0.2
0.4
0.6
0.8
1.0
Hours: Published to delivery − cumulative
Del
ivery
Pro
babi
lity
s1_smalls2_mediums3_larges4_xlarges5_xlarge−long
Smaller package delivered earlier (red)
0 50 100 150
0.0
0.2
0.4
0.6
0.8
1.0
Hours: Published to delivery − cumulative
Del
ivery
Pro
babi
lity
012345678
01234567891011121314151617181920212223
Hour of posting has an impact
0 50 100 150
0.0
0.2
0.4
0.6
0.8
1.0
Hours: Published to delivery − cumulative
Del
ivery
Pro
babi
lity
10miles11−50miles50p_miles
Longer distance -> slower delivery (purple)

A. Stathopoulos
dura:on models for crowdshipping
Hazard form
Exponential Constant
Time variation
inc if p>1, dec if p<1, const.p=1
inc then dec
Weibull
Lognormal Not prop. hazard
Focus on parametric models • Give structure (shape) to the hazard function • Hazard can be used for forecasting • Many functions to try; estimate with standard
likelihood methods
Prop. hazard
Prop. hazard
Ratio of hazards

A. Stathopoulos
dura:on models for crowdshipping
Prop.Hazard duration modes Delivery Risk over the 250 hours: • For delivery ⇨ 50 miles 1/3 of the
speed • For perishable good ⇨ 2-3 times
faster
• Evidence of non-monotonic hazard rate (lognormal model best fit)
Exponent. Weibull Lognormal exp(beta) exp(beta) exp(beta) (Intercept) 0.00* 0.00* 0.00* Pack.size.med 0.81* 0.81* 0.78* Pack.size.large 0.80* 0.79* 0.69* Pack.size.xlarge 0.54* 0.51* 0.46* Pack.size.xlarge-‐long 0.72* 0.70* 0.57* Distance_11-‐50m 0.97 0.95 0.80* Distance_50p_m 0.33* 0.31* 0.27* Perish. (base rest) 3.46* 3.30* 2.36* Day: mo_sat 1.53* 1.48* 1.24* Day: tu_we_th 2.03* 1.84* 1.26* Hour: 11_13 1.46* 1.48* 1.39* Hour: 14_18 1.88* 1.97* 1.90* Shape param. 0.77* 0.78*
df 11 12 12
LL final model -‐39199.4 -‐38778.1 -‐38283.9
AIC 78420.8 77580.2 76591.8
Obs. 5158, * sig at p= 0.99
0.00 0.50 1.00 1.50 2.00 2.50 3.00 3.50 4.00
Pack.size.med
Pack.size.large
Pack.size.xlarge
Pack.size.xlarge-long
Distance_11-50m
Distance_50p_m
Perish.(baserest)
Day:mo_sat
Day:tu_we_th
Hour:11_13
Hour:14_18
Lognormalexp(beta) Weibullexp(beta) ExponenKalexp(beta)
Slo
wer
(lon
ger s
urvi
val)
Qui
cker
del
iver
y
A. Stathopoulos
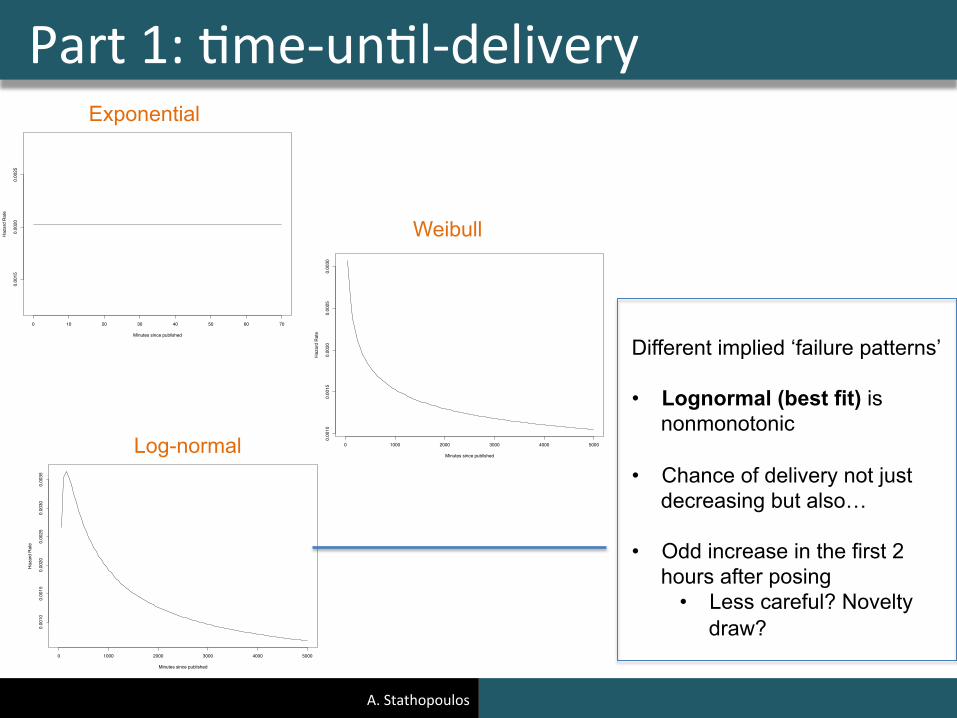
Part 1: :me-‐un:l-‐delivery
0 10 20 30 40 50 60 70
0.00
150.
0020
0.00
25
Exponential
Minutes since published
Haz
ard
Rat
e
Exponential
0 1000 2000 3000 4000 5000
0.00
100.
0015
0.00
200.
0025
0.00
300.
0035
Log−normal
Minutes since published
Haz
ard
Rat
e
Log-normal 0 1000 2000 3000 4000 5000
0.00
100.
0015
0.00
200.
0025
0.00
30
Weibull
Minutes since published
Haz
ard
Rat
e
Weibull
Different implied ‘failure patterns’
• Lognormal (best fit) is nonmonotonic
• Chance of delivery not just decreasing but also…
• Odd increase in the first 2 hours after posing
• Less careful? Novelty draw?

A. Stathopoulos
Summary: real opera:ons
• Analysis of delivery performance • Varies significantly over space, by
good shipped, shipment distance
• Duration models reveal critical stages between posting and delivery
• Systematic differences by covariates
• Critical elements: not guaranteed to find match or be delivered in reasonable time
Key findings
Useful for
Issues / Forward looking
• Identifying inefficiencies • E.g. delay posting until
more drivers attentive • Improve matching assistance
on platform
• More advanced model that joins stages of delivery • Account for repeat delivery (efficiency inc?) • Better rationale for non-monotonic delivery pattern

But… Platform design and shared data does not allow: q Price/performance trade-off analysis -> price is
‘engineered’ and does not vary
q Transactions are available but cannot run choice model -> rating and other features not recorded at time-of-choice -> choices deterministic
q Nearly no personal / motivational data to study acceptance
q Sensitive nature of data; non-disclosure

A. Stathopoulos
Discrete choice experiments to study:
Part 2: behavior Miller, Stathopoulos, and Nie 6
Experimental Design 1 The experimental design required many variables to make the choices relevant. Research 2
has shown response quality likely increases when most important information is included (27). To 3 give the respondents a general sense of the current situation, the SP experiment included changing 4 three main variables for the current situation setting. These setting variables varied across 5 questions, but held steady across the alternatives in a given question. The variables included the 6 purpose for travel (3 levels), whether it is a workday (2 levels), and time of day (3 levels). These 7 variables were chosen based on research by Paleti et al. that showed VOT varies as a function of 8 the individual daily activity pattern, and the schedule for that day (28). This resulted in 18 9 combinations, before adding any alternative variables. After careful consideration of the 10 combinations, three did not make logical sense, and were removed. The three settings included a 11 work trip on a non-work day. It technically is possible for that scenario to exist, but uncommon 12 for most responders and could be confusing. That left 15 “main” combinations. However, the 13 combinations increased when considering the length (5 levels, 10 to 120 minutes) and travel time 14 variability (3 levels, 5% to 60% of original travel time) of the current planned trip. This increased 15 the number of possible settings to 225. To see an example of a setting, consider Figure 1, in the 16 “Current Planned Trip Information” section in the center of the figure. 17
18
19 FIGURE 1 Example of stated preference experiment web interface. 20
21
A. Commuter willingness to take on delivery B. Sender preference over (crowd)drivers

A. Stathopoulos
Part 2: behavior
Miller, Stathopoulos, and Nie 6
Experimental Design 1 The experimental design required many variables to make the choices relevant. Research 2
has shown response quality likely increases when most important information is included (27). To 3 give the respondents a general sense of the current situation, the SP experiment included changing 4 three main variables for the current situation setting. These setting variables varied across 5 questions, but held steady across the alternatives in a given question. The variables included the 6 purpose for travel (3 levels), whether it is a workday (2 levels), and time of day (3 levels). These 7 variables were chosen based on research by Paleti et al. that showed VOT varies as a function of 8 the individual daily activity pattern, and the schedule for that day (28). This resulted in 18 9 combinations, before adding any alternative variables. After careful consideration of the 10 combinations, three did not make logical sense, and were removed. The three settings included a 11 work trip on a non-work day. It technically is possible for that scenario to exist, but uncommon 12 for most responders and could be confusing. That left 15 “main” combinations. However, the 13 combinations increased when considering the length (5 levels, 10 to 120 minutes) and travel time 14 variability (3 levels, 5% to 60% of original travel time) of the current planned trip. This increased 15 the number of possible settings to 225. To see an example of a setting, consider Figure 1, in the 16 “Current Planned Trip Information” section in the center of the figure. 17
18
19 FIGURE 1 Example of stated preference experiment web interface. 20
21
Commuter willingness to take on delivery
Online survey designed as a ‘game’ to analyze willingness-to-work as crowdshipper during a commute Trade detour for profit: Willingness-to-work • Presented different context+
Day + Timing (18 comb) • Time detour, variability and
profit • Included indicators for: sharing factor, income discontent, life and work balance, new endeavors

A. Stathopoulos
the crowdshipping driver Main findings
More likely to do shipment • Short commute, leisure trip, low
earning • Agtudes; like :me in car, don’t
work well with others, low earnings expecta:on, have free :me
Less likely to accept crowdshipment • Graduate, lowest+highest income,
female in evening travel • Agtudes; high earning expecta:on
No support for: • Desire to try new things, be their own
boss, awareness of crowdshipping, living paycheck to paycheck
Baseline MixedLogit
MLwithAttitudinal
Coeff.
RobT-stat Coeff.
RobT-Stat Coeff.
RobT-Stat
InterceptforStatusQuo -0.197 -2.72 -0.649 -1.60 1.250 3.10
Attributes
TravelTime -0.314 -13.58 ProfitEarned 0.085 13.17 RandomParameterStandard
DeviationforStatusQuo*
-2.02 -9.59 -1.450 -9.16
TravelTime≤45min
-0.0687 -9.04 -0.069 -9.04TravelTime>45min
-0.0317 -9.16 -0.032 -9.14
ProfitEarned≤$4
0.742 7.74 0.728 7.81ProfitEarned>$4&≤$18
0.161 8.15 0.160 8.12
ProfitEarned>$18
0.0510 5.32 0.051 5.32
Alternativelevelfeatures
OriginalTripTimeis10min
-0.757 -3.36 -0.767 -3.36Incomeis<$35Kor≥$90K 1.67 4.04 OriginalTripisLeisure
-0.770 -3.67 -0.749 -3.57
HoldsGraduateDegree
1.47 3.45 0.806 2.41OriginalTripEvening*Male
-0.608 -2.00 -0.662 -2.21
ReasonisNeverWouldWork
4.62 4.67 2.240 2.35Min.ExpectedtoEarn≥$18/hr.
2.270 5.40
Min.ExpectedtoEarn<$8/hr.
-1.150 -2.50Wouldnotmindextratimeincartomakemoney:low
4.390 8.35
Ihaveenoughfreetime:high
-2.090 -3.79Ihaveenoughfreetime:medium
-1.010 -3.00
Iusemytimewellinthecar:high
-1.790 -3.61
Iworkwellwithothers:low
-6.430 -2.85
ModelFitStatistics Baseline MixedLogitMLwith
Attitudinal Observations(Individuals) 1430 1430(143) 1430(143) NullLogLikelihood -1982.40 -1982.40 -1982.40 ConstantsOnlyLogLikelihood -1971.43 -1971.43 -1971.43 FinalLogLikelihood -1849.95 -1510.98 -1481.27 Rho2 0.067 0.238 0.253 adj.Rho2 0.065 0.231 0.243 NumberofDraws 1000 10001

A. Stathopoulos
the crowdshipping driver: WTW
Decreasing returns • Piece-‐wise linear spec. • Bigger drop for profit than for
added trip :me • Most willingness for 20-‐40min
commute & 4-‐8$ profit range
0 1 2 3 4 5 6 7 8
0 10 20 30 40 50 -‐8 -‐7 -‐6 -‐5 -‐4 -‐3 -‐2 -‐1 0
0 40 80 120
Util
ity v
aria
tion
Profit earned [$] Time detour [min]
Baseline Mixed Logit ML with Am. adj. Rho2 0.065 0.231 0.243 Value of Time (WTW) ($/hr.) $22.16
Median WTW ($/hr.) $18.71 $18.86
Willingness-to-work estimates: required pay-off
0%
5%
10%
15%
20%
25%
30%
10 25 45 75 120 Travel Time of Chosen Alternative (min)
Difficult to compensate driver: high ‘required compensa:on’

A. Stathopoulos
Summary: poten:al drivers
• Decreasing marginal impact of detour and profit
• WTW for short trips • Personal: U-shaped acceptance curve
income • Setting: purpose [leisure], timing
[eve*male] • Motivations: earnings expectations,
sharing attitude, time-use
Key findings Useful for
Issues / Forward looking
• Defining the detour and profit compensation that works for driver and minimizes impact
• Design collaborative delivery schemes
• Design incentives for recruitment and retention
• Should base experiment on drivers real experience • Attention to interaction between driver – public • Longer trips, deeper analysis of motivations

A. Stathopoulos
Part 2: behavior General acceptance of crowdshipping
Find general acceptance crowdshipping option for parcel or personal objects Trade traditional shipping guarantees for new service? • Focus on context • Selection of attributes • Identify other drivers of the
decision • Altruistic/community oriented • Self-centered reasons
ResultsStated Preference QuestionnaireLimle experience
How translate into experiment?

A. Stathopoulos
0%10%20%30%40%50%60%70%80%
CSN1-NoTrust
CSN2-ShareofPrivateInforma@on
CSN3-NoProfessionalCarriers
CSN4-DeliveryCondi@onsWorries
CSN5-ComplicatedSystem
CSN6-LessEfficient
PercentageofAgreementonNega@veStatements
Global
Male
Female
LowIncome
MediumIncome
HighIncome
ShippingExperience
NoShippingExperience
CrowdshippingExperience
NoCrowdshippingExperience
Age:15to24
Age:25to34
Age:35to44
Age:45to54
the crowdshipping sender
Focus-‐groups to iden:fy amributes (3 groups) • Tradi:onal (:me + cost) • Flexibility and control over delivery condi:ons • Driver creden:al

A. Stathopoulos
The sender Sender willingness to try crowdshipping
Shipping scenario (587 resp) Context A short distance (5 m) for a large package (size of a television); A medium distance (100 m) for a medium package (size of a backpack); A long distance (1,400 miles) for an extra-large package (size of a mattress). Attributes • Traditional (time + cost) • Flexibility and control over
delivery conditions • Driver credential Follows up with 3 options: use traditional service, not ship at all,
…

A. Stathopoulos
MODELS MNLShortDistance
MNLMediumDistance
ECMediumDistance
MNLLongDistance
ECLongDistance
df 16 16 17 14 15FinalLog-L -2158.594 -1339.481 -1326.282 -1812.330 -1768.260Rho-Square 0.244 0.531 0.535 0.365 0.380
Value R t-test Value R t-test Value R t-test Value R t-test Value R t-test
Cost($) -0.114 -10.01 -0.126 -11.09 -0.174 -9.12 -0.0202 -21.92 -0.0251 -18.10Time(h) -0.0720 -3.88 -0.0146 -2.56 -0.0209 -2.68 - - - -ExpertDriver[occasional] 0.294 3.42 - - - - 0.831 9.43 1.22 10.47ExperiencedDriver(nshipm.) 0.830 5.86 1.26 5.17 1.62 5.23 1.78 12.49 2.29 11.884.5StarRating[4stars] 0.643 5.79 - - - - - - - -5StarRating[4stars] 0.914 7.65 0.479 3.60 0.506 2.86 - - - -4.5&5StarRating[4stars] - - - - - - 1.02 10.84 1.33 11.61DeliveryCond(Day)[driversets] - - - - - - 0.411 4.11 0.469 3.80Pick-UpCond.(Day)[driversets] 0.815 10.05 0.376 2.32 0.778 3.35 0.899 10.34 1.14 10.03Pick-UpCond(Time)[driversets] 0.466 5.39 0.430 3.32 0.511 2.62 0.465 4.95 0.811 6.78Male - - - - -0.357 -2.40 -1.44 -1.9915-24-Year-OldMale 0.769 1.99 - - - - - - - -25-34-Year-OldMale 0.644 3.94 1.57 3.01 - - - -45-54-Year-OldMale -0.594 -1.99 -0.985 -2.24 -2.23 -2.04 - - - -55-Year-OldandOver - - 0.653 3.44 1.59 2.74 0.632 2.34 2.40 1.99LowIncome - - 0.638 3.36 1.52 2.68 - - - -MediumIncome - - 0.522 2.77 1.22 2.39 - - - -Experienceshipm. 0.377 2.35 - - - - - - - -CrowdshippingSTD - - - - -3.96 -3.66 - - -7.55 -3.39
The sender
Big changes for distance context • Time mamers less for long distance • Exper:se mamers more/ stars less • Different age and income effects
Attr
ibut
es
Acc
epta
nce
fact
ors
Urban delivery • Experience -‐> ra:ng bonus • Strong :me sensi:vity • Don’t care about delivery • Accñ: Young/male, used to
shipping 100 mile delivery • Ra:ng less impact • Less impact of pick-‐up
arrangements • Accñ: low inc, higher age
Long distance • Time insig./ cost low • Delivery control mamers • Accñ: female, older

A. Stathopoulos
Summary of findings
• We looked at 2 sides of crowdshipping
Part 1: Opera:onal performance of on-‐demand delivery
Delivery rate • Identified impacts (distance) • Scenario application reveals
wide variation • Reveals performance gaps
Time-to-delivery • Identified impacts (time-of-posting) • Rate goes down over time • Unstable dynamics with peer-
matching
Part 2: Behavior analysis
Sender choice of shipper • Identified factors that drive
choice of crowdshipment • Acceptance depends on age
and income • Context changes preference
Driver choice of shipment • Only small detour from commute
accepted • Identified motivations (solitary,
like time in car, earnings) • Non-linear profit sensitivity makes
difficult compensation

A. Stathopoulos
Next steps
• Deliverability models: improve with non-linearity and spatial variation
• Time-to-delivery: improve duration analysis with multi-stage models
• Sender and driver behavior models Ø Run extended experiments with real crowdshippers Ø Analyze motivations for participation (from pecuniary to
community) Ø Begin to design systems that will have joint acceptance
• Broader analysis; do these systems increase welfare, efficiency, sustainability?

A. Stathopoulos
Next steps
Which companies and service models will remain?
Permanence
How do sharing systems sustain when mo:va:ons are disconnected? (local) Behaviors are self-‐oriented / demands professional service?
Mo:va:ons
Effec:ve impact? Difficult to isolate the ‘detour’ and induced driving
Impact Which model framework will allow to build fleet and customer base in tandem
Cri:cal mass
Analysis can help design bidding plauorm, opera:ons (consolid/collab), behavior incen:ves and mining of the travel data of app-‐users
Mul:ple perspec:ves
Driver: low tolerance for devia:on Goal: build system around actual travel, mine user data
Non-‐delivery, transac:on problems Goal: design incen:ves / business models
Goal: Defining the latent constructs and impact
Dis-‐harmony in sender-‐driver rela:on Goal: design incen:ves / business models

A. Stathopoulos
Ques:ons?
Behavior analysis papers Miller, Stathopoulos, and Nie ‘Crowdsourced Urban Package Delivery: modelling traveler Willingness to Work as Crowdshippers’ (awai:ng publica:on decision in TRR 2017) Punel, Stathopoulos ‘Exploratory analysis of crowdsourced delivery service through a stated preference experiment’ (to be presented in TRB 2017)
For more discussion [email protected] Thanks to: US National Science Foundation Partnerships for Innovation: Building Innovation Capacity (PFI:BIC) Grant No. 1534138 'Enhancing Intelligence of Crowdsourced Urban Delivery (CROUD)'.