Ship traffic noise distribution in the Polish Baltic ...€¦ · Ship traffic noise distribution in...
34
Ship traffic noise distribution in the Polish Baltic waters – results of BIAS EU project Jarosław Tęgowski 1 , Thomas Folegot 2 , Radomił Koza 1 , Karolina Trzcińska 1 , Iwona Pawliczka 1 , Jakub Zdroik 1 , Krzysztof Skóra 1 1 Institute of Oceanography, University of Gdansk, al. Marszałka Piłsudskiego 46 81-378 Gdynia, Poland 2 QUIET-OCEANS, 65 Place Nicolas Copernic, 29280 Plouzané, France 10th EAA INTERNATIONAL SYMPOSIUM ON HYDROACOUSTICS XXXIII Symposium on Hydroacoustics, May 17-20, 2016, Jastrzębia Góra, Poland
Transcript of Ship traffic noise distribution in the Polish Baltic ...€¦ · Ship traffic noise distribution in...
Ship traffic noise distribution in the Polish Baltic
waters – results of BIAS EU project
Jarosław Tęgowski1, Thomas Folegot2, Radomił Koza1, Karolina Trzcińska1,
Iwona Pawliczka1, Jakub Zdroik1, Krzysztof Skóra1
1 Institute of Oceanography, University of Gdansk, al. Marszałka Piłsudskiego 46
81-378 Gdynia, Poland2 QUIET-OCEANS, 65 Place Nicolas Copernic, 29280 Plouzané, France
10th EAA INTERNATIONAL SYMPOSIUM ON HYDROACOUSTICSXXXIII Symposium on Hydroacoustics, May 17-20, 2016, Jastrzębia Góra, Poland

10th EAA International Symposium on Hydroacoustics, Jastrzebia Gora, May 17-20, 2016
Since World War II, the average level of the ambient noise increased by 12-15 dB (Bjørnø, 1998)
Bjørnø, L., 1998, Man-made contributions to ambient noise in the seas. Alippi, A. and Cannelli, G. B. Proceedings of the Fourth European Conference on Underwater Acoustics, Rome 2, 543-548.

10th EAA International Symposium on Hydroacoustics, Jastrzebia Gora, May 17-20, 2016
The hearing ranges of different kinds of fish and mammals together with
the overlap in frequency with different sources of human-generated noise
from Slabbekoorn et al. (2010)

Baltic Sea Information on the Acoustic Soundscape - BIAS
• EU-Life+ project (2012-2016)
• Goals:
Implementation of MSFD Descriptor 11 in the Baltic Sea region
Establishing a baseline for continuous sound by measurements and
soundscape modeling
Establishing of a joint management, for e.g. handling of data and registry –
standards
Developing tools for handling of Descriptor 11.2.
10th EAA International Symposium on Hydroacoustics, Jastrzebia Gora, May 17-20, 2016
MSFD - Marine Strategy Framework Directive

10th EAA International Symposium on Hydroacoustics, Jastrzebia Gora, May 17-20, 2016
What the EC (LIFE +) is expected from the BIAS project?What will be the main result of the project?
BIAS - brochure

10th EAA International Symposium on Hydroacoustics, Jastrzebia Gora, May 17-20, 2016
EQUIPMENT
WildLife Acoustics SM2M24 kHz – sampling frequency16 bits – resolution216=65536Dynamics: 20log10(216)=96 dB
POSITIONS OF 38 ACOUSTIC DATA LOGGERS DEPLOYEDIN THE BALTIC SEA
Swedish Defence Research Agency (FOI)
Finnish Environment Institute (SYKE)
Tallinn University of Technology (TUT)
Foundation of the Development ofUniversity of Gdansk (FRUG)
Institute for Technical and Applied Physics (ITAP)
German Maritime and Hydrographic Agency (BSH)
University of Southern Denmark (SDU)
Aarhus University (A)

POSITIONS OF 38 ACOUSTIC DATA LOGGERS DEPLOYEDIN THE BALTIC SEA
377 000 km2
1 601 km max length
459 m max depth
40+ monitoring stations
12 months of continuous
measurement
2 monitoring categories (A & B)
10th EAA International Symposium on Hydroacoustics, Jastrzebia Gora, May 17-20, 2016
• Category A Monitoring - to establish
information on the ambient noise in
a location and to ground truth noise
prediction, < 5 km?
• Category B Monitoring- to reduce
uncertainty on source levels to be used
as the input for modelling, close to shipping
lane

POSITIONS OF 38 ACOUSTIC DATA LOGGERS DEPLOYEDIN THE BALTIC SEA
10th EAA International Symposium on Hydroacoustics, Jastrzebia Gora, May 17-20, 2016
• Recording minimum one channel
• Gain 0/20 dB
• Hydrophone bandwidth min 10 Hz - 12 kHz
• Sampling rate: min 24 kHz
• Duty cycle: min 17 min per hour

10th EAA International Symposium on Hydroacoustics, Jastrzebia Gora, May 17-20, 2016
Puck Bay
Gulf of Gdansk
2
1
b)a) Map of the areas where buoys were deployed
1) Gulf of Gdańsk (71m)
2) Puck Bay (30m)
3) Łeba (16.4m)
4) Darłowo – Ustka (40m)
5) Świnoujście (12 m)
b) Number of ship routes at Puck Bay and Gulf of
Gdansk
POSITINS OF 5 ACOUSTIC DATA LOGGERS DEPLOYEDIN THE POLISH PART OF THE BIAS PROJECT
a)

OUR BOAT „ZELINT”
10th EAA International Symposium on Hydroacoustics, Jastrzebia Gora, May 17-20, 2016
Hel Marine Station of the UG Institute of Oceanography

DEPLOYMENT
Hel Marine Station of the UG Institute of Oceanography
10th EAA International Symposium on Hydroacoustics, Jastrzebia Gora, May 17-20, 2016

RIG ON THE BOTTOM
10th EAA International Symposium on Hydroacoustics, Jastrzebia Gora, May 17-20, 2016
Hel Marine Station of the UG Institute of Oceanography

RECOVERY
10th EAA International Symposium on Hydroacoustics, Jastrzebia Gora, May 17-20, 2016

10th EAA International Symposium on Hydroacoustics, Jastrzebia Gora, May 17-20, 2016
RESULT OF THE TRAWL-NET STRIKE ON THE RIGS

The reasons of data gaps:
Station 1 – one of the SD cards was found thrown out of the socket, possible reason – trawl net strike
Station 2 – battery failure
StationLast deployment
dateDays since 1st of January till last
deploymentDays of recording Rec/Total
1 05-10-2014 278 239 0,86
2 21-11-2014 325 319 0,98
3 15-10-2014 288 288 1
4 17-10-2014 290 290 1
5 13-10-2014 286 286 1
ACOUSTIC DATA TIME COVERAGE
QUALITY OF MEASUREMENTS
10th EAA International Symposium on Hydroacoustics, Jastrzebia Gora, May 17-20, 2016

𝑀𝑆𝑃 = 𝑝𝑟𝑚𝑠2 =
1
𝑇න
0
𝑇
𝑝 𝑡 2𝑑𝑡
𝑝𝑟𝑒𝑓 = 1 µPa
• MSP – Mean Square Pressure
• RMS – Root Mean Square
• SPL – Sound Pressure Level
• SEL – Sound Exposure Level
• PSL – Peak Sound Level
• SNR – Signal to Noise Ratio
• PSD – Power Spectra Density
• PDF – Probability Density Function
𝑆𝑃𝐿 = 10𝑙𝑜𝑔10𝑝𝑟𝑚𝑠2
𝑝𝑟𝑒𝑓2 [dB 𝑟𝑒 1µPa]
METRICS USED IN SOUND LEVEL ASSESSMENT
SPL is the mean square pressure (MSP) relative to reference pressure pref
10th EAA International Symposium on Hydroacoustics, Jastrzebia Gora, May 17-20, 2016

10th EAA International Symposium on Hydroacoustics, Jastrzebia Gora, May 17-20, 2016
EXAMPLE OF SPL63Hz AND SPL125Hz VARIATION AT B1
WIND AND HEAVY SHIPPING TRAFFIC
1/3 octave bands
SPL63,125 independed
on wind speed
Depth 71m-80 m
AIS and VMS data
10th EAA International Symposium on Hydroacoustics, Jastrzebia Gora, May 17-20, 2016
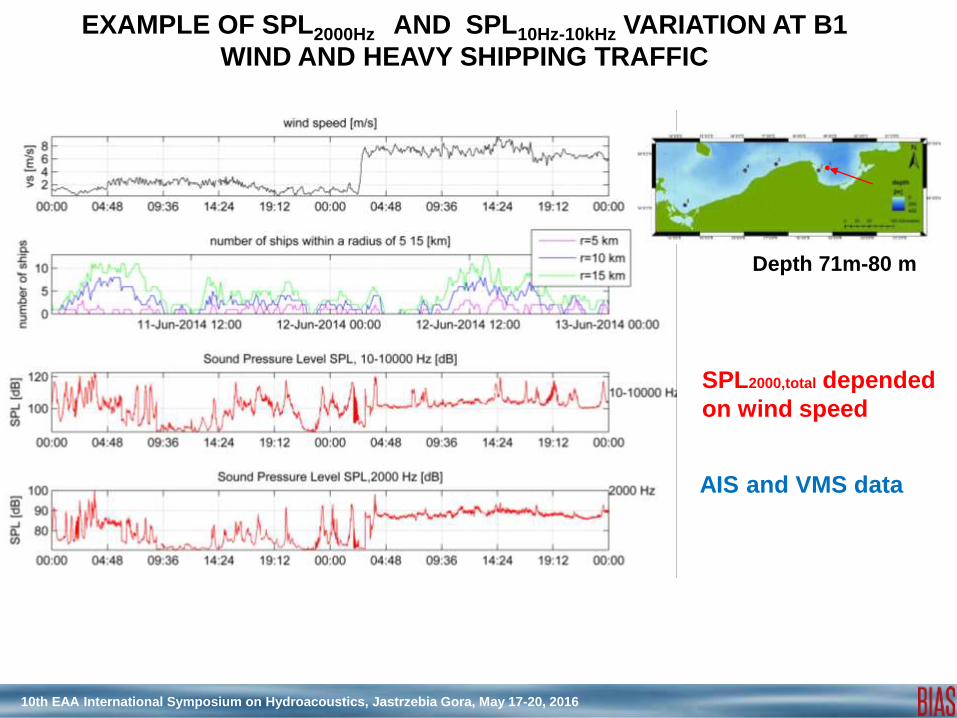
SPL2000,total depended
on wind speed
EXAMPLE OF SPL2000Hz AND SPL10Hz-10kHz VARIATION AT B1
WIND AND HEAVY SHIPPING TRAFFIC
AIS and VMS data
Depth 71m-80 m

MONTHLY AVERAGED NOISE SPECTRUM LEVEL, STATION B1, JANUARY – DECEMBER 2014
10th EAA International Symposium on Hydroacoustics, Jastrzebia Gora, May 17-20, 2016

10th EAA International Symposium on Hydroacoustics, Jastrzebia Gora, May 17-20, 2016
AVERAGED NOISE SPECTRUM LEVEL, STATION B1, JANUARY 2014
10th EAA International Symposium on Hydroacoustics, Jastrzebia Gora, May 17-20, 2016
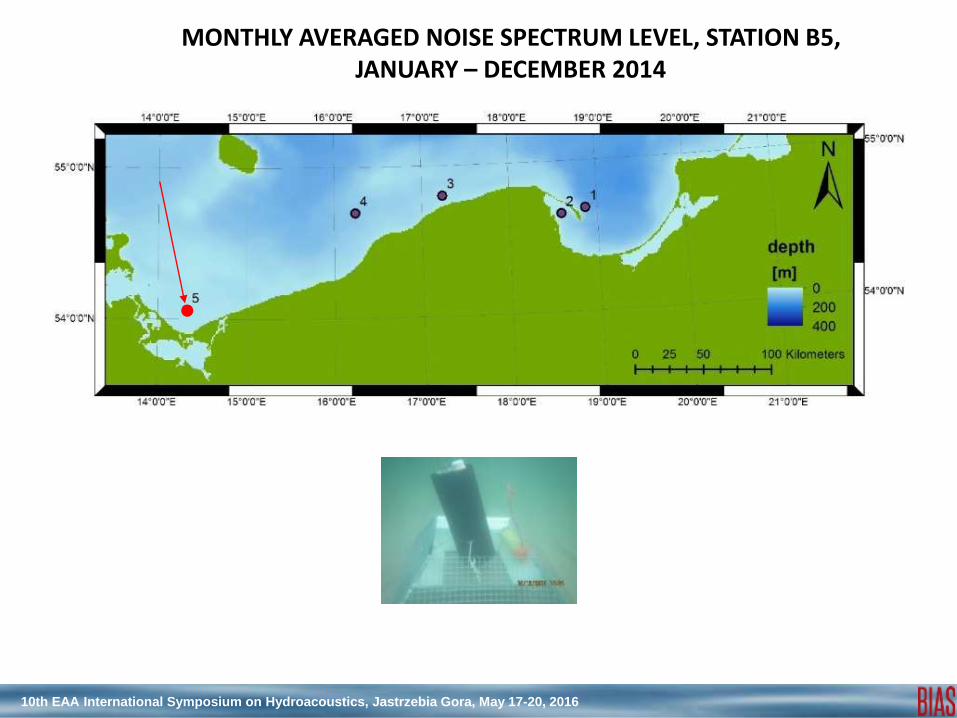
MONTHLY AVERAGED NOISE SPECTRUM LEVEL, STATION B5, JANUARY – DECEMBER 2014
10th EAA International Symposium on Hydroacoustics, Jastrzebia Gora, May 17-20, 2016
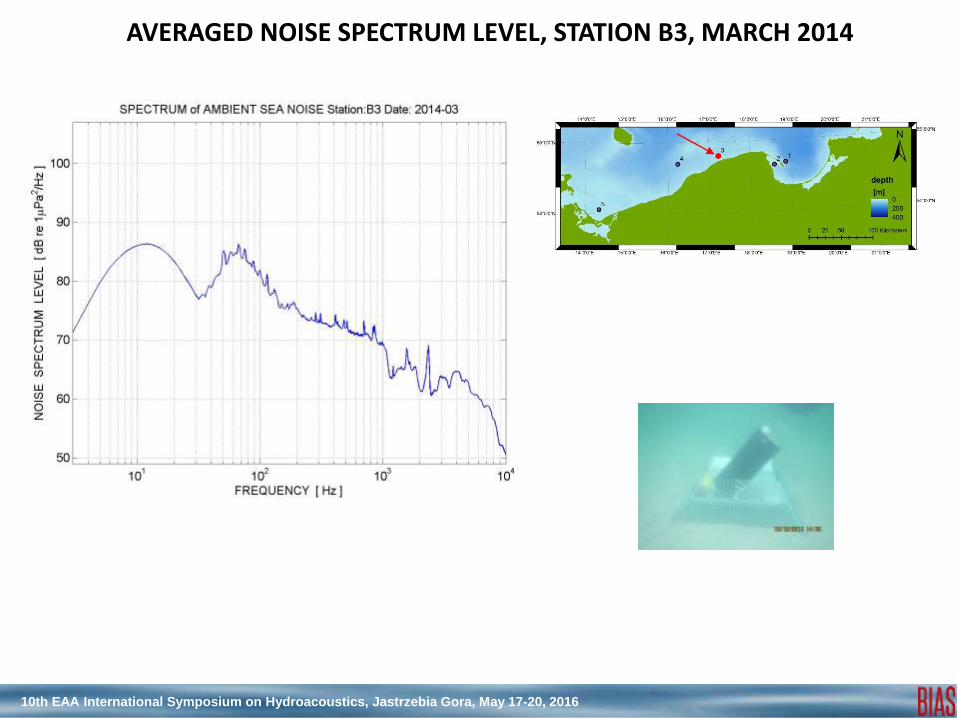
AVERAGED NOISE SPECTRUM LEVEL, STATION B3, MARCH 2014

10th EAA International Symposium on Hydroacoustics, Jastrzebia Gora, May 17-20, 2016
CUMULATIVE CURVES OF SPL FOR 63 Hz, 125 Hz AND 10 Hz – 10 kHz - 2014 YEAR
1
23
4
5
1
23
4
5
1
23
4
5
ships
ships
ships

10th EAA International Symposium on Hydroacoustics, Jastrzebia Gora, May 17-20, 2016
SOUND PRESSURE LEVEL, 1/3 OCTAVE 125 Hz, FEB. – NOV. 2014POLISH ECONOMICAL ZONE, DEPTH = 10 m

10th EAA International Symposium on Hydroacoustics, Jastrzebia Gora, May 17-20, 2016
SOUND PRESSURE LEVEL, 1/3 OCTAVE 63 Hz, JANUARY 2014BALTIC SEA
Percentile 05%Layer 1Depth 10 m

10th EAA International Symposium on Hydroacoustics, Jastrzebia Gora, May 17-20, 2016
HOW TO CLASSIFY DIFFERENT SOURCES OF UNDERWATER AMBIENT NOISE?
PARAMETRICAL ANALYSIS
Example of 12 hours and 25 min continuous underwater ambient noise
registration by recorder number 1 at 11th of June 2014.
ships

10th EAA International Symposium on Hydroacoustics, Jastrzebia Gora, May 17-20, 2016
Example of 12 hours and 25 min continuous underwater ambient noise
registration by recorder number 1 at 11th of June 2014
63Hz and 125Hz

10th EAA International Symposium on Hydroacoustics, Jastrzebia Gora, May 17-20, 2016
1Alog1log~
10
max
10
S
SAS
The normalized power spectrum of ambient noise is defined as:
where A=105 – const., S() - power spectral density function and its maximum
value Smax(). The classification parameters were defined as the relationships
between parts of spectral density functions:
where m=2, 4, 8, 16 and fNy is the Nyquist frequency.
Ny
1
fm
1
0f
)(~1
dffSS
Dqm
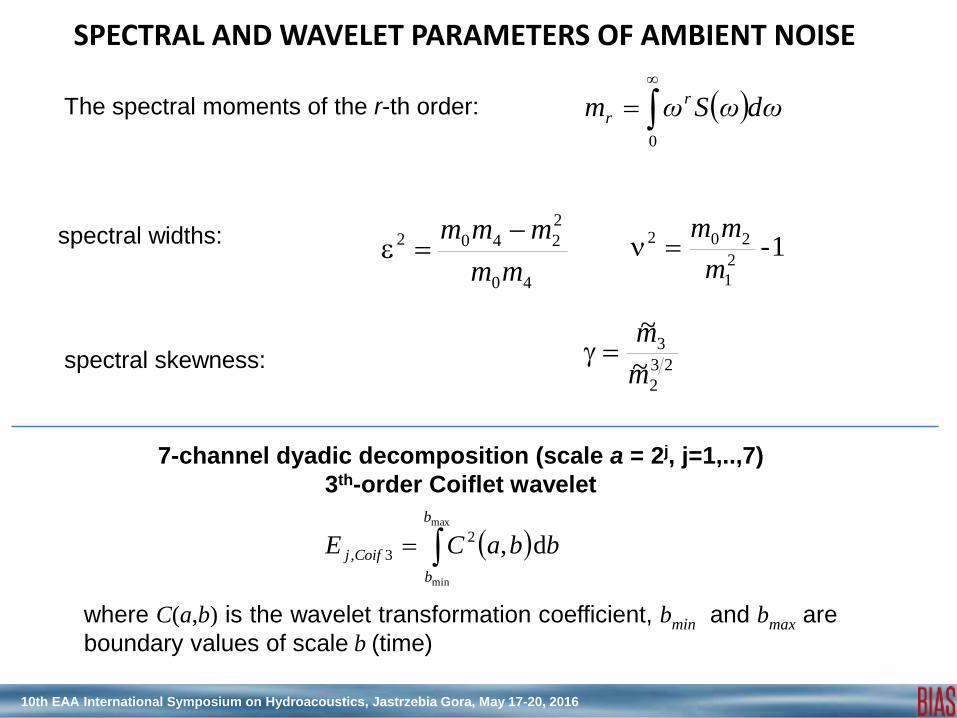
PARAMETRICAL ANALYSIS OF AMBIENT NOISESPECTRAL AND WAVELET PARAMETERS OF AMBIENT NOISE
Ny
1
m
fm
1
0f
f
~1dfS
SS
10th EAA International Symposium on Hydroacoustics, Jastrzebia Gora, May 17-20, 2016
The spectral moments of the r-th order: ωdωSωm r
r
0
spectral skewness:
40
2
2402
mm
mmm 1-
2
1
202
m
mm
23
2
3
m~
m~
spectral widths:
max
min
d,2
3,
b
b
Coifj bbaCE
SPECTRAL AND WAVELET PARAMETERS OF AMBIENT NOISE
7-channel dyadic decomposition (scale a = 2j, j=1,..,7)
3th-order Coiflet wavelet
where C(a,b) is the wavelet transformation coefficient, bmin and bmax are
boundary values of scale b (time)

10th EAA International Symposium on Hydroacoustics, Jastrzebia Gora, May 17-20, 2016
NOISE SOURCES CLASSIFICATION ALGORITHM
Input vector of 23 spectraland wavelet parameters
computed for each 1 second segment of signal
Reduction of inputdata quantity
Principal ComponentAnalysis
3 uncorrelatedPrincipal Components
Segmentation algorithm Unsupervised Kohonen’s
neural networkor
Fuzzy c-meanscluster analysis
Decision about thenumber of clusters
Calinski-Harabaszstatistical criterion
or (and)Subtractive Cluster
Analysis
Clu
ste
rs

10th EAA International Symposium on Hydroacoustics, Jastrzebia Gora, May 17-20, 2016
PRINCIPAL COMPONENTS
Ship noise

10th EAA International Symposium on Hydroacoustics, Jastrzebia Gora, May 17-20, 2016
Clu
ste
rs
Samples x 108
Results of fuzzy logic clusterization algorithm
bottom picture – indication of ships

10th EAA International Symposium on Hydroacoustics, Jastrzebia Gora, May 17-20, 2016
CONCLUSIONS
We have knowledge about levels and sources of underwater
ambient noise in the Baltic Sea.
Goals of project were accomplished successfully.
BIAS standards.

THANK YOU FOR YOUR ATTENTION
10th EAA International Symposium on Hydroacoustics, Jastrzebia Gora, May 17-20, 2016