Ship-borne FTIR measurements of CO and O in the Western ... · absorption FTIR measurements in the...
14
Atmos. Chem. Phys., 12, 815–828, 2012 www.atmos-chem-phys.net/12/815/2012/ doi:10.5194/acp-12-815-2012 © Author(s) 2012. CC Attribution 3.0 License. Atmospheric Chemistry and Physics Ship-borne FTIR measurements of CO and O 3 in the Western Pacific from 43 ◦ N to 35 ◦ S: an evaluation of the sources T. Ridder 1 , C. Gerbig 2 , J. Notholt 1 , M. Rex 3 , O. Schrems 4 , T. Warneke 1 , and L. Zhang 5 1 Institute of Environmental Physics (IUP), University of Bremen, Otto-Hahn-Allee 1, 28359 Bremen, Germany 2 Max Planck Institute (MPI) for Biogeochemistry, Hans-Knoell-Str. 10, 07745 Jena, Germany 3 Alfred Wegener Institute for Polar and Marine Research (AWI) Potsdam, Telegrafenberg A43, 14473 Potsdam, Germany 4 Alfred Wegener Institute for Polar and Marine Research (AWI) Bremerhaven, Am Handelshafen 12, 27570 Bremerhaven, Germany 5 School of Engineering and Applied Sciences (SEAS), Harvard University, 29 Oxford Street, Cambridge, MA 02138, USA Correspondence to: T. Ridder ([email protected]) Received: 4 July 2011 – Published in Atmos. Chem. Phys. Discuss.: 15 August 2011 Revised: 11 January 2012 – Accepted: 13 January 2012 – Published: 18 January 2012 Abstract. Carbon monoxide (CO) and ozone (O 3 ) have been measured in the Western Pacific (43 ◦ N to 35 ◦ S) dur- ing a ship campaign with Research Vessel Sonne in fall 2009. Observations have been performed using ship-based solar ab- sorption Fourier Transform infrared spectrometry, flask sam- pling, balloon sounding, and in-situ Fourier Transform in- frared analysis. The results obtained are compared to the GEOS-Chem global 3-D chemistry transport model for at- mospheric composition. In general, a very good agreement is found between the GEOS-Chem model and all instruments. The CO and O 3 distributions show a comparable variability suggesting an impact from the same source regions. Tagged-CO simulations implemented in the GEOS-Chem model make it possible to differentiate between different source processes and source regions. The source regions are verified with HYSPLIT backward trajectory calculations. In the Northern Hemisphere fossil fuel combustion in Asia is the dominant source. European and North American fossil fuel combustion also contribute to Northern Hemispheric CO pollution. In the Southern Hemisphere contributions from biomass burning and fossil fuel combustion are dominant; African biomass burning has a significant impact on West- ern Pacific CO pollution. Furthermore, in the tropical West- ern Pacific enhanced upper tropospheric CO within the tropi- cal tropopause layer mainly originates from Indonesian fossil fuel combustion and can be transported into the stratosphere. The source regions of the measured O 3 pollution are simulated with a tagged-O 3 simulation implemented in the GEOS-Chem model. Similar source regions compared to the tagged-CO simulations are identified by the model. In the Northern Hemisphere contributions from Asia, Europe, and North America are significant. In the Southern Hemisphere emissions from South America, south-east Africa, and Ocea- nia significantly contribute to the measured O 3 pollution. 1 Introduction Measurements of the global distribution of trace gases are in- dispensable to understand the dynamical and chemical pro- cesses in the atmosphere. Ground-based solar absorption Fourier Transform infrared (FTIR) spectrometry is a well established remote sensing technique for the observation of atmospheric trace gases (Rao, 1992; Notholt et al., 2003). Two global ground-based solar absorption FTIR networks (TCCON 1 , NDACC 2 ) are well established (Wunch et al., 2011; Kurylo, 1991). Besides observations from land-based FTIR stations, measurements have been performed in the At- lantic aboard Research Vessel (RV) Polarstern (Notholt et al., 2000; Velazco et al., 2005; Warneke et al., 2006). However, solar absorption FTIR measurements in the Pacific have not been previously performed. Here, we present the first solar absorption FTIR measurements in the Western Pacific com- plemented with in-situ observations. 1 Total Carbon Column Observing Network (http://www.tccon. caltech.edu/) 2 Network for the Detection of Atmospheric Composition Change (http://www.ndsc.ncep.noaa.gov/) Published by Copernicus Publications on behalf of the European Geosciences Union.
Transcript of Ship-borne FTIR measurements of CO and O in the Western ... · absorption FTIR measurements in the...
Atmos. Chem. Phys., 12, 815–828, 2012www.atmos-chem-phys.net/12/815/2012/doi:10.5194/acp-12-815-2012© Author(s) 2012. CC Attribution 3.0 License.
AtmosphericChemistry
and Physics
Ship-borne FTIR measurements of CO and O3 in the WesternPacific from 43◦ N to 35◦ S: an evaluation of the sources
T. Ridder1, C. Gerbig2, J. Notholt1, M. Rex3, O. Schrems4, T. Warneke1, and L. Zhang5
1Institute of Environmental Physics (IUP), University of Bremen, Otto-Hahn-Allee 1, 28359 Bremen, Germany2Max Planck Institute (MPI) for Biogeochemistry, Hans-Knoell-Str. 10, 07745 Jena, Germany3Alfred Wegener Institute for Polar and Marine Research (AWI) Potsdam, Telegrafenberg A43, 14473 Potsdam, Germany4Alfred Wegener Institute for Polar and Marine Research (AWI) Bremerhaven, Am Handelshafen 12,27570 Bremerhaven, Germany5School of Engineering and Applied Sciences (SEAS), Harvard University, 29 Oxford Street, Cambridge, MA 02138, USA
Correspondence to:T. Ridder ([email protected])
Received: 4 July 2011 – Published in Atmos. Chem. Phys. Discuss.: 15 August 2011Revised: 11 January 2012 – Accepted: 13 January 2012 – Published: 18 January 2012
Abstract. Carbon monoxide (CO) and ozone (O3) havebeen measured in the Western Pacific (43◦ N to 35◦ S) dur-ing a ship campaign with Research Vessel Sonne in fall 2009.Observations have been performed using ship-based solar ab-sorption Fourier Transform infrared spectrometry, flask sam-pling, balloon sounding, and in-situ Fourier Transform in-frared analysis. The results obtained are compared to theGEOS-Chem global 3-D chemistry transport model for at-mospheric composition. In general, a very good agreement isfound between the GEOS-Chem model and all instruments.The CO and O3 distributions show a comparable variabilitysuggesting an impact from the same source regions.
Tagged-CO simulations implemented in the GEOS-Chemmodel make it possible to differentiate between differentsource processes and source regions. The source regions areverified with HYSPLIT backward trajectory calculations. Inthe Northern Hemisphere fossil fuel combustion in Asia isthe dominant source. European and North American fossilfuel combustion also contribute to Northern Hemispheric COpollution. In the Southern Hemisphere contributions frombiomass burning and fossil fuel combustion are dominant;African biomass burning has a significant impact on West-ern Pacific CO pollution. Furthermore, in the tropical West-ern Pacific enhanced upper tropospheric CO within the tropi-cal tropopause layer mainly originates from Indonesian fossilfuel combustion and can be transported into the stratosphere.
The source regions of the measured O3 pollution aresimulated with a tagged-O3 simulation implemented in theGEOS-Chem model. Similar source regions compared to thetagged-CO simulations are identified by the model. In the
Northern Hemisphere contributions from Asia, Europe, andNorth America are significant. In the Southern Hemisphereemissions from South America, south-east Africa, and Ocea-nia significantly contribute to the measured O3 pollution.
1 Introduction
Measurements of the global distribution of trace gases are in-dispensable to understand the dynamical and chemical pro-cesses in the atmosphere. Ground-based solar absorptionFourier Transform infrared (FTIR) spectrometry is a wellestablished remote sensing technique for the observation ofatmospheric trace gases (Rao, 1992; Notholt et al., 2003).Two global ground-based solar absorption FTIR networks(TCCON1, NDACC2) are well established (Wunch et al.,2011; Kurylo, 1991). Besides observations from land-basedFTIR stations, measurements have been performed in the At-lantic aboard Research Vessel (RV)Polarstern(Notholt et al.,2000; Velazco et al., 2005; Warneke et al., 2006). However,solar absorption FTIR measurements in the Pacific have notbeen previously performed. Here, we present the first solarabsorption FTIR measurements in the Western Pacific com-plemented with in-situ observations.
1Total Carbon Column Observing Network (http://www.tccon.caltech.edu/)
2Network for the Detection of Atmospheric CompositionChange (http://www.ndsc.ncep.noaa.gov/)
Published by Copernicus Publications on behalf of the European Geosciences Union.
816 T. Ridder et al.: Sources of CO and O3 in the Western Pacific
The tropical Western Pacific is considered to be the mainregion of troposphere to stratosphere transport (Holton et al.,1995; Fueglistaler et al., 2004, 2009). In the tropical warmpool (Yan et al., 1992) upwelling processes are enforced byhigh sea surface temperature and high air humidity. Thus, inthis region tropospheric air has a relatively high probabilityof reaching the stratosphere (Notholt et al., 2005). The en-try of tropospheric air into the stratosphere has a strong im-pact on stratospheric composition. However, the significanceof various transport processes for the transport of differentspecies is not yet fully understood.
The Western Pacific is of great interest with respect totrans-Pacific air mass transport. In the Northern Hemisphere(NH) the influence of the increasing anthropogenic pollutiondue to the fast economic growth in Asia and its impact onNorthern Hemispheric air quality is studied (Zhang et al.,2008; Jacob et al., 2003). In the Southern Hemisphere (SH)biomass burning emissions and its global distribution are an-alyzed (Andreae et al., 2001; Thompson et al., 2001).
In the present study we concentrate on the evaluation ofthe source processes and source regions of carbon monox-ide (CO) and ozone (O3) in the Western Pacific during aship campaign with RVSonnein fall 2009. CO is producedduring fossil fuel combustion, biomass burning, and oxida-tion of methane (CH4) and other non-methane hydrocarbons(NMHC). The major sink of CO is the oxidation by OH. Thelifetime of CO ranges from weeks to several months. Ac-cording to the 2007 IPCC (Intergovernmental Panel on Cli-mate Change) report (Solomon et al., 2007) O3 is the fourthmost important contributor to global warming. The main tro-pospheric source processes of O3 are the photochemical ox-idation of CO, CH4, and volatile organic compounds (VOC)in the presence of nitrogen oxides (NOx) and hydrogen ox-ides (HOx). The main sink of O3 is photochemical degrada-tion forming OH.
In this study measurements of CO and O3 in the WesternPacific (43◦ N to 35◦ S) are presented. Since observations ofCO and O3 are rare in the Western Pacific, these measure-ments aim to contribute to a better understanding of the com-position of the Western Pacific atmosphere. The observationsare compared to model simulations which test the current un-derstanding of Western Pacific composition. Furthermore,this study provides an evaluation of the source processes andsource regions of Western Pacific CO and O3 pollution toimprove the knowledge of the contribution of these sources.
In Sect.2 the underlying ship campaign is introduced. InSect.3 the instrumental setup and the model are described.This includes remote sensing and in-situ observations. InSect.4 results from the ship campaign and a model com-parison are presented and discussed. Sources of CO and O3pollution are analyzed in Sect.5.
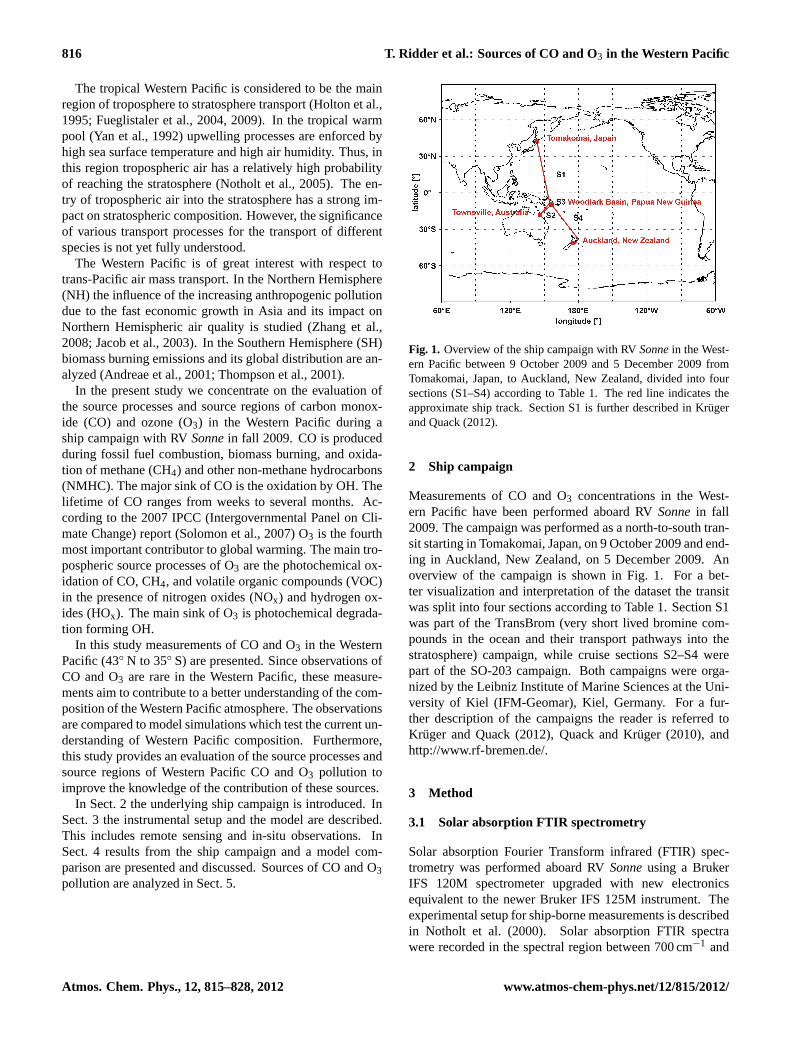
Fig. 1. Overview of the ship campaign with RVSonnein the West-ern Pacific between 9 October 2009 and 5 December 2009 fromTomakomai, Japan, to Auckland, New Zealand, divided into foursections (S1–S4) according to Table1. The red line indicates theapproximate ship track. Section S1 is further described inKrugerand Quack(2012).
2 Ship campaign
Measurements of CO and O3 concentrations in the West-ern Pacific have been performed aboard RVSonnein fall2009. The campaign was performed as a north-to-south tran-sit starting in Tomakomai, Japan, on 9 October 2009 and end-ing in Auckland, New Zealand, on 5 December 2009. Anoverview of the campaign is shown in Fig.1. For a bet-ter visualization and interpretation of the dataset the transitwas split into four sections according to Table1. Section S1was part of the TransBrom (very short lived bromine com-pounds in the ocean and their transport pathways into thestratosphere) campaign, while cruise sections S2–S4 werepart of the SO-203 campaign. Both campaigns were orga-nized by the Leibniz Institute of Marine Sciences at the Uni-versity of Kiel (IFM-Geomar), Kiel, Germany. For a fur-ther description of the campaigns the reader is referred toKruger and Quack(2012), Quack and Kruger (2010), andhttp://www.rf-bremen.de/.
3 Method
3.1 Solar absorption FTIR spectrometry
Solar absorption Fourier Transform infrared (FTIR) spec-trometry was performed aboard RVSonneusing a BrukerIFS 120M spectrometer upgraded with new electronicsequivalent to the newer Bruker IFS 125M instrument. Theexperimental setup for ship-borne measurements is describedin Notholt et al. (2000). Solar absorption FTIR spectrawere recorded in the spectral region between 700 cm−1 and
Atmos. Chem. Phys., 12, 815–828, 2012 www.atmos-chem-phys.net/12/815/2012/

T. Ridder et al.: Sources of CO and O3 in the Western Pacific 817
Table 1. Description of the four sections (S1–S4) of the ship campaign with RVSonneaccording to Fig.1. Section S1 is further describedin Kruger and Quack(2012).
Section Location Latitude Date
S1 Tomakomai, Japan–Townsville, Australia 43◦ N–20◦ S 9 Oct 2009–24 Oct 2009S2 Townsville, Australia–Woodlark Basin, Papua New Guinea 20◦ S–10◦ S 26 Oct 2009–30 Oct 2009S3 Woodlark Basin, Papua New Guinea 10◦ S 30 Oct 2009–28 Nov 2009S4 Woodlark Basin, Papua New Guinea–Auckland, New Zealand 10◦ S–35◦ S 28 Nov 2009–5 Dec 2009
Fig. 2. Representative averaging kernels of the FTIR(a) CO re-trieval and(b) O3 retrieval. The colored lines indicate the sensitivityand resolution of each individual layer.
15 780 cm−1 with a maximum resolution of 0.005 cm−1. Themeteorological conditions were permanently monitored tominimize the influence of clouds on solar absorption FTIRspectra. Small unavoidable intensity fluctuations caused bythin clouds were corrected using the method described byRidder et al.(2011).
The retrieval of trace gas concentrations from solar absorp-tion FTIR spectra was performed using the SFIT-2 (Spec-tral Least Squares Fitting) software developed at the NASALangley Research Center and the National Institute for Wa-ter and Atmospheric Research in New Zealand (Rinslandet al., 1998). A priori pressure and temperature profileswere obtained from the NCEP (National Center for Envi-ronmental Prediction,http://www.ncep.noaa.gov/) database.Meteorological observations from radiosondes, which werelaunched four times per day during cruise section S1 (Krugeret al., 2012), were delivered to the World Meteorolog-ical Organization (WMO) global database to be assimi-lated into the NCEP database. Spectral line parameterswere taken from the HITRAN2004 (high-resolution trans-mission molecular absorption) database including the 2006updates for H2O. A priori profiles were kept constant for
the entire campaign and were extracted from the WACCAMmodel (Garcia et al., 2007) at the location of the NDACCand TCCON station in Wollongong, Australia (34◦ S,151◦ E). CO was retrieved simultaneously in three mi-crowindows (2057.70 cm−1–2057.91 cm−1, 2069.55 cm−1–2069.72 cm−1, 2157.40 cm−1–2159.20 cm−1) including theinterfering gases H2O, N2O, and O3. O3 was retrieved in asingle microwindow (1000 cm−1–1005 cm−1) with a simul-taneous fit of H2O.
The sensitivity of the retrieval is expressed by the aver-aging kernels (AK) showed in Fig.2. The height of eachindividual averaging kernel is an indicator for the sensitivityof the corresponding layer, while the width is an indicatorfor the vertical resolution (Rodgers, 2000). The degree offreedom (DOF) for signal is an expression for the number ofindependent layers in the retrieval (Rodgers, 1990). CO ismainly sensitive in the troposphere with a DOF between 3.0and 4.0. O3 is sensitive in the troposphere and stratospherewith a DOF of up to 5.0.
3.2 In situ data
3.2.1 FTIR analyzer
Surface concentrations of CO were continuously measuredaboard RVSonnewith a FTIR in-situ trace gas analyzer(Griffith et al., 2010; Esler et al., 2000) developed and con-structed by the Centre for Atmospheric Chemistry at the Uni-versity of Wollongong. The system uses a low-resolutionFTIR spectrometer (1 cm−1) to quantify the volume mixingratios (vmr) of CO, CH4, CO2, N2O, andδ13C in CO2. TheFTIR spectrometer measures the transmission spectrum ofan air sample within a multipass White cell (White, 1942).The transmission spectrum is then analyzed with the Mul-tiple Atmospheric Layer Transmission (MALT) nonlinearleast squares-fitting software (Griffith, 1996, 2002). A de-tailed description of the instrument can be found inGriffithet al.(2010).
3.2.2 Flasks
Approximately 30 flasks were taken aboard RVSonneandwere analyzed by the Max Planck Institute for Biogeo-chemistry in Jena, Germany. Air samples were dried duringcollection using magnesium perchlorate and compressed to2 bar absolute yielding a sample size of 2 l. Concentrations
www.atmos-chem-phys.net/12/815/2012/ Atmos. Chem. Phys., 12, 815–828, 2012

818 T. Ridder et al.: Sources of CO and O3 in the Western Pacific
Fig. 3. Tropospheric source regions of the GEOS-Chem tagged-COsimulation. NA: North America, EU: Europe, AS: Asia, SA: SouthAmerica, AF: Africa, and OC: Oceania.
of CO, CO2, CH4, N2O, SF6, δ13C in CO2, andδ18O in CO2were determined by gas chromatography and mass spec-trometry. For measurement accuracy the reader is referredto http://www.bgc.mpg.de/service/isogaslab/gaslab/techniquesresults/index.shtmland to http://www.bgc.mpg.de/service/isogaslab/techniquesresults/irmeams.shtml.
3.2.3 Balloon sondes
Daily O3-sondes (Science Pump Corporation ECC-6A) werelaunched during cruise section S1. Meteorological con-ditions obtained from radiosonde observations during S1(Kruger and Quack, 2012) were delivered to the WMOglobal database.
3.3 GEOS-Chem
CO and O3 concentrations in the Western Pacific were sim-ulated using version v8-02-04 of the global 3-D chemistrytransport model GEOS-Chem for atmospheric composition.The model is described inBey et al.(2001b). GEOS-Chemis driven by GEOS-5 (Rienecker et al., 2008) assimilated me-teorological observations from the NASA Global Modelingand Assimilation Office (GMAO). Model profiles were sam-pled along the ship track every three hours with a horizontalresolution of 2◦×2.5◦ and a vertical resolution of 47 layersusing the GEOS-Chem full chemistry simulation. Model re-sults for carbon monoxide (CO) are scaled by a factorβ = 1.2to balance a consistent low bias in the GEOS-Chem simula-tion (Kopacz et al., 2010).
In order to identify CO sources from different source re-gions the tagged-CO simulation (Duncan et al., 2007) imple-mented in the GEOS-Chem model is applied using monthlymean OH concentrations from a previous full-chemistry run
as the primary CO sink. The tagged-CO simulation calcu-lates source processes of CO such as fossil fuel combustion,biomass burning, biofuel, oxidation of CH4, and volatile or-ganic compounds (VOC) from various source regions. Anoverview of the standard source regions within the tagged-CO simulation is shown in Fig.3. Similar approaches havebeen previously used byBey et al. (2001a); Staudt et al.(2001).
In order to identify the source regions of the measuredO3 pollution, the tagged-Ox simulation implemented in theGEOS-Chem model has been used. The tagged-Ox sim-ulation calculates the contributions of the trace regions inFig. 3 using daily production rates and loss frequenciesof odd oxygen (Ox = O3 + NO2 + 2× NO3 + HNO3 + PAN +HNO4 + 3× N2O5). In the following tagged-Ox will be re-ferred to as tagged-O3 since ozone generally represents morethan 95 % of odd oxygen. Model output was generated forozone production in the lowest five layers of the model; thissimulation provides information about the direct productionof O3 over the continent and hints at the origin of the pol-lution. However, the simulation does not account for a sec-ondary production of ozone from ozone precursors in the freetroposphere and, thus, underestimates the simulated contri-butions. Similar approaches have previously been used bySauvage et al.(2007); Li et al. (2002); Liu et al. (2002).
3.4 Intercomparison
CO and O3 concentrations from different instruments andfrom model simulations are compared in this study. Thus,it is necessary to take the different characteristics of the dif-ferent observing systems into account (Rodgers and Connor,2003; Palm et al., 2005). In-situ observations and model re-sults are generally compared directly to each other. However,when comparing solar absorption FTIR profiles to GEOS-Chem model profiles, the characteristics of the FTIR retrievalhave to be considered; the FTIR measurements do not pro-vide simple measurements of the true statex, rather they pro-vide the estimated state of the atmospherex which can bederived from the weighted contribution of the true state andthe a priori statexa (Rodgers, 1990, 2000).
x = xa + A (x − xa) + εx (1)
In Eq. (1) εx represents the error inx andA represents theaveraging kernel matrix. To account for the characteristicsof the FTIR retrieval, model profilesxm are expressed assmoothed model profilesxs retrieved with the resolution ofthe FTIR instrument in the absence of the error term.
xs = xa + A (xm − xa) (2)
The GEOS-Chem model simulates CO and O3 concentra-tions only in the troposphere. For the smoothing in Eq. (2)a full model profile is needed. The standard method forhandling this problem is to create a composite profile by
Atmos. Chem. Phys., 12, 815–828, 2012 www.atmos-chem-phys.net/12/815/2012/

T. Ridder et al.: Sources of CO and O3 in the Western Pacific 819
combining the modeled tropospheric profile with the FTIRa priori profile above the tropopause3.
CO total column concentrations calculated from the FTIRprofiles and the smoothed composed model profiles are com-pared directly to each other in Sect.4. Although the modeldoes not reproduce stratospheric variations, the error in thecolumn is negligible since more than 90 % of atmosphericCO is located in the troposphere. Furthermore, the CO re-trieval is not very sensitive in the stratosphere (Fig.2a) andmainly reproduces the a priori profile.
O3 tropospheric columns are calculated from the FTIRprofiles and are directly compared to the raw model tropo-spheric columns and the tropospheric columns derived fromthe sondes following the approach inSchneider et al.(2008).For the calculation of the FTIR tropospheric columns themodel tropopause height is used.
4 Results and discussion
4.1 CO
Figure4 shows the CO distribution during the four sectionsof the ship campaign with RVSonne. Each plot in Fig.4is divided into the four cruise sections described in Table1;sections S1, S2, and S4 are plotted over latitude, and sec-tion S3 is displayed over time. Figure4a shows the CO sur-face volume mixing ratio measured with the FTIR in-situanalyzer compared to flask measurements and the GEOS-Chem model. To exclude contamination by the ship plume,the FTIR in-situ data is filtered by wind direction (α ≥30◦)and relative wind speed (vrel≥5 m s−1). Individual peaks inthe dataset may originate from nearby ship traffic. In gen-eral, CO concentrations from flask measurements and theFTIR in-situ analyzer agree well. Small-scale variations re-solved by the FTIR in-situ analyzer are not reproduced by themodel. The cause of the overestimation in the beginning ofcruise section S1 is discussed in Sect. 5.1. Figure4b displaysthe CO total column amounts derived from the solar absorp-tion FTIR spectrometer and the GEOS-Chem model. Themodel reproduces the main features in the CO total columndistribution. Figures4c–e show the CO volume mixing ratio(vmr) profiles from panel c: the solar absorption FTIR spec-trometer, panel d: the GEOS-Chem model smoothed with theFTIR averaging kernels, and panel e: the raw GEOS-Chemmodel. The agreement between the model profiles and theFTIR profiles is good. Additionally, the model tropopauseheight (TPH) is shown. A typical equatorial TPH of around17 km is simulated as well as the typical tropopause heightdecrease at 30◦ N and 30◦ S, respectively. The simulated
3The tropopause is defined as the lowest level at which the tem-perature lapse rate decreases to 2 K km−1 or less, and the lapse rateaveraged between this level and any level within the next 2 km doesnot exceed 2 K km−1 (WMO definition).
Table 2. CO pollution events (PE1–PE4) during the ship campaignwith RV Sonnein the Western Pacific (TPH: tropopause height, LT:lower troposphere).
Pollution Section Latitude Altitude
PE1 S1 43◦ N–20◦ N 0 km-TPHPE2 S1–S2 10◦ S–20◦ S 0 km, 4–8 kmPE3 S3 9◦ S 12–17 kmPE4 S3–S4 9◦ S–20◦ S LT
TPH coincides with the measured TPH from radiosonde ob-servations during cruise section S1 (Kruger et al., 2012).
Figure 4 especially reveals the impact of several pollu-tion events (PE). At the location corresponding to the begin-ning of cruise section S1 the GEOS-Chem model simulates astrong pollution event from the surface up to the tropopause(PE1). It was not possible to observe the pollution by the so-lar absorption FTIR spectrometer due to bad measurementconditions during that time period caused by the typhoonMelor. FTIR in-situ data, however, does not support pollutedsurface air simulated by the GEOS-Chem model and shows,on the contrary, clean surface air of about 60 ppb. Betweensections S1 and S2 around 20◦ S all instruments show a fur-ther CO enhancement (PE2). Surface volume mixing ratiossuggest local pollutants in the harbor of Townsville, Aus-tralia, at 19◦ S. Local pollutants are captured by the modelbut underestimated due to resolution effects. Total columnconcentrations suggest the influence of a further CO sourcein this region since the concentrations start to rise at 10◦ S.Profiles obtained by solar absorption FTIR spectrometry re-veal enhanced CO concentrations in 4–8 km altitude to be themain contributor to the increased total column amounts. Thismid tropospheric CO pollution is reproduced but underesti-mated by the GEOS-Chem model. Within section S3 at 10◦ Sthe solar absorption FTIR instrument and the GEOS-Chemmodel reveal a CO band in the upper troposphere (PE3).FTIR and smoothed model profiles, both reveal the pollu-tion at similar heights between 6–12 km altitude. Thus, theactual height of the CO pollution can be determined fromthe raw model output, which pictures PE3 in 12–17 km al-titude within the tropical tropopause layer (TTL). Based onFueglistaler et al.(2009) it can be assumed that CO pollutionwithin the TTL is transported by radiative heating into thestratosphere in this area. Between section S3 and S4 a fourthCO pollution event (PE4) occurs. Surface volume mixing ra-tios and model profiles, both picture PE4 as a near surfaceevent. Solar absorption FTIR measurements also suggest theimpact of mid tropospheric CO pollution.
An overview of the four pollution events discussed in thissection is presented in Table2.
www.atmos-chem-phys.net/12/815/2012/ Atmos. Chem. Phys., 12, 815–828, 2012

820 T. Ridder et al.: Sources of CO and O3 in the Western Pacific
Fig. 4. CO distribution during the four sections of the ship campaign with RVSonnein the Western Pacific;(a) surface volume mixing ratiosobtained from FTIR in-situ measurements (black dots) and flask sampling (red crosses) compared to the GEOS-Chem model (green circles),(b) total column concentrations obtained from solar absorption FTIR measurements (blue markers, the error bars represent the theoreticaluncertainty in the FTIR retrieval) compared to the GEOS-Chem model (green circles),(c) solar absorption FTIR profiles,(d) GEOS-Chemprofiles smoothed with FTIR averaging kernels,(e) raw GEOS-Chem profiles. The black lines in(d) and(e) represent the model tropopauseheight.
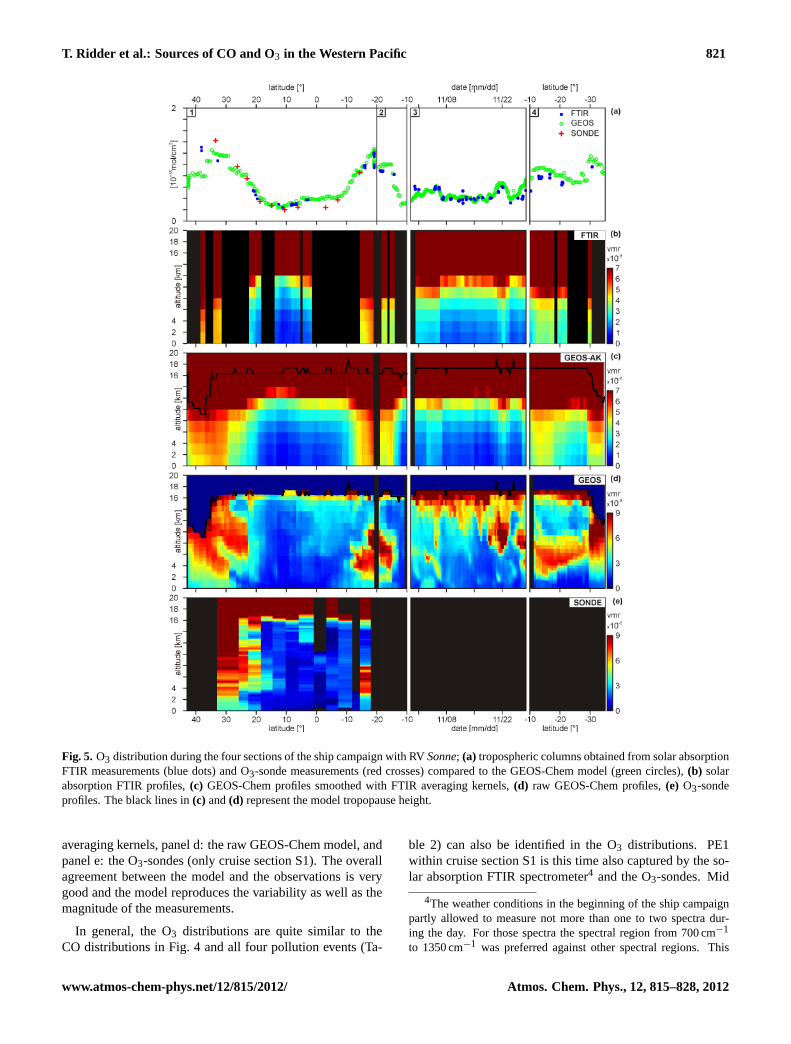
4.2 O3
Figure5 shows the O3 distribution during the four sectionsof the ship campaign with RVSonne(Table 1). Figure5adisplays the tropospheric partial column concentrations of
O3 derived from the solar absorption FTIR spectrometer incomparison to tropospheric columns derived from O3-sondesand the GEOS-Chem model. Figures5b–e show the O3 vol-ume mixing ratio profiles from panel b: the FTIR spectrom-eter, panel c: the GEOS-Chem model smoothed with FTIR
Atmos. Chem. Phys., 12, 815–828, 2012 www.atmos-chem-phys.net/12/815/2012/
T. Ridder et al.: Sources of CO and O3 in the Western Pacific 821
Fig. 5. O3 distribution during the four sections of the ship campaign with RVSonne; (a) tropospheric columns obtained from solar absorptionFTIR measurements (blue dots) and O3-sonde measurements (red crosses) compared to the GEOS-Chem model (green circles),(b) solarabsorption FTIR profiles,(c) GEOS-Chem profiles smoothed with FTIR averaging kernels,(d) raw GEOS-Chem profiles,(e) O3-sondeprofiles. The black lines in(c) and(d) represent the model tropopause height.
averaging kernels, panel d: the raw GEOS-Chem model, andpanel e: the O3-sondes (only cruise section S1). The overallagreement between the model and the observations is verygood and the model reproduces the variability as well as themagnitude of the measurements.
In general, the O3 distributions are quite similar to theCO distributions in Fig.4 and all four pollution events (Ta-
ble 2) can also be identified in the O3 distributions. PE1within cruise section S1 is this time also captured by the so-lar absorption FTIR spectrometer4 and the O3-sondes. Mid
4The weather conditions in the beginning of the ship campaignpartly allowed to measure not more than one to two spectra dur-ing the day. For those spectra the spectral region from 700 cm−1
to 1350 cm−1 was preferred against other spectral regions. This
www.atmos-chem-phys.net/12/815/2012/ Atmos. Chem. Phys., 12, 815–828, 2012

822 T. Ridder et al.: Sources of CO and O3 in the Western Pacific
tropospheric pollution (PE2) between cruise sections S1 andS2 is clearly observed by the FTIR spectrometer, the GEOS-Chem model, and the O3-sondes. Upper tropospheric pol-lution in the Woodlark Basin (PE3) can not be resolved bythe FTIR spectrometer since high O3 concentrations are con-volved from the stratosphere into the troposphere by the aver-aging kernels and overlay the tropospheric O3 signal. How-ever, raw model volume mixing ratio profiles show enhancedupper tropospheric O3. PE4 is seen in the mid troposphererather than at the surface. Furthermore, enhanced O3 at theend of cruise section S4 between 26◦ S and 32◦ S is observed.
Due to the fact that the O3 and CO distributions are sim-ilar, one can hypothesize that the source regions of the ob-served CO and O3 pollution are related. This aspect will bediscussed in more detail in Sect.5.
5 Sources of CO and O3
To identify the source processes and source regions of themeasured CO and O3 pollution in the Western Pacific,the GEOS-Chem model tagged tracer simulations for CO(Sect. 5.1) and O3 (Sect. 5.4) are applied. Model taggedtracer simulations deliver the contributions of various sourceprocesses and source regions to the modeled Western Pa-cific pollution. In addition, backward trajectory calcula-tions combined with firemaps (Sect. 5.2) and solar absorptionFourier Transform infrared HCN measurements (Sect. 5.3)are presented. Trajectory studies reveal the transport path-ways of Western Pacific air parcels. HCN measurements andfiremaps show the impact of biomass burning. The discus-sion focuses on emissions from fossil fuel combustion andbiomass burning.
5.1 Tagged-CO simulation
To identify the contributions of different source processesand source repetitive regions to the measured CO pollu-tion (Fig. 4) in the Western Pacific with the GEOS-Chemmodel, CO is decomposed into tagged tracers as describedin Sect. 3.3. The sum of all tagged tracers reproducesclosely the results from the standard full-chemistry simula-tion shown at the top of Fig.6. Below, the main CO contribu-tions (with contributions> 10%) calculated with the tagged-CO simulation are presented as the relative contributions tothe total CO concentration.
During PE1 the main contribution is from Asian fossil fuelcombustion (ASFF) (≈40 %). European fossil fuel combus-tion (EUFF) (≈15 %) and North American fossil fuel com-bustion (NAFF) (≈10 %) contribute to lower troposphericCO pollution between 43◦ N and 30◦ N. The impact of Eu-ropean and North American CO emissions on the WesternPacific and their transport pathways have been discussed
spectral region includes the O3 microwindow but not the CO mi-crowindows.
Fig. 6. Total CO vertical profiles (top) simulated with the GEOS-Chem tagged-CO simulation and relative contributions of varioustracers from different trace regions (ASFF: Asian fossil fuel, EUFF:European fossil fuel, NAFF: North American fossil fuel, BBAF:African biomass burning, BBSA: South American biomass burn-ing, BBOC: biomass burning from Oceania, SHFF: Southern Hemi-spheric fossil fuel, VOC: volatile organic compounds, CH4: oxida-tion of methane). The black line in each graph indicates the modeltropopause height.
Atmos. Chem. Phys., 12, 815–828, 2012 www.atmos-chem-phys.net/12/815/2012/

T. Ridder et al.: Sources of CO and O3 in the Western Pacific 823
Fig. 7. HYSPLIT backward ensemble (120 h) and single (315 h) tra-jectories calculated at one representative altitude for the four char-acteristic locations;(a) PE1, (b) PE2, (c) PE3, and(d) PE4. Thealtitude of the trajectories is expressed by the color bar. MODISfire counts (red dots) are displayed to picture the impact of biomassburning.
in Jaegle et al.(2003); Bey et al.(2001a). The GEOS-Chemmodel simulates contributions from ASFF, EUFF, and NAFFto the surface layer, whereas the FTIR in-situ analyzer sug-gest clean air concentrations of 60 ppb. This suggests a prob-lem with the representation of the boundary layer in themodel, which seems to mix free tropospheric air into theboundary layer too readily in this meteorological situation.
The main contributions to the pollution close to Aus-tralia (PE2) are from African biomass burning (BBAF)(>20 %). Significant contributions (≈15 %) originate fromSouth American biomass burning (BBSA). Small contribu-tions from biomass burning from Oceania (OCBB) (≈10 %)are also apparent. The upper tropospheric pollution PE3mainly originates from fossil fuel combustion in the South-ern Hemisphere (SHFF) (≈15 %). Biomass burning from theOceania region contributes around 10 % to the total PE3 pol-lution. PE4 pollution mainly originates from biomass burn-ing in Oceania (≈10 %). The most dominant backgroundsource is oxidation of methane (CH4), which contributes upto 70 % in unpolluted regions. The strong variability in CH4relative contributions is mainly due to the variability in allother contributions. The absolute CH4 contributions (notshown) ranges between 25 ppb and 35 ppb. Oxidation ofvolatile organic compounds (VOC) provides a backgroundof around 20 % in unpolluted regions, but is also responsiblefor part of the CO variability in the Southern Hemisphere.
5.2 Backward trajectories
In order to verify the source regions of the measured COpollution, backward trajectories were calculated with theNOAA HYSPLIT (National Oceanic and Atmospheric Ad-ministration Hybrid Single Particle Lagrangian IntegratedTrajectory) model (Draxler and Hess, 1997, 1998) at the fourcharacteristic points PE1, PE2, PE3, and PE4 (Fig. 7). Forthe calculations the NCEP-GDAS meteorological assimila-tion with a 1◦×1◦ grid resolution was used. One single back-ward trajectory (max. 315 h) embedded by ensemble back-ward trajectories (120 h) are presented for each pollutionevent. The trajectory ensemble starts multiple trajectories (intotal 27) around the starting location. Each member of thetrajectory ensemble is calculated by offsetting the meteoro-logical data by a fixed grid factor (one grid meteorologicalgrid point in the horizontal and 0.01 sigma units in the ver-tical). The altitude of the backward trajectories is expressedby the adjacent color bar. In addition, MODIS (MOderateResolution Imaging Spectroradiometer) firemaps5 are shownfor the 5-day period prior to the corresponding trajectories inorder to assess the influence of biomass burning.
Backward trajectories corresponding to PE1 show nearsurface air parcels (100 m) originating from northern direc-tions indicating that European and American CO emissions(finding in Sect. 5.2) are transported over northern latitudestowards the Western Pacific. However, high altitude airparcels (2000 m) have their origin further to the west. Trans-port of pollution from Asia into the Western Pacific is veri-fied. Backward trajectories corresponding to PE2 and start-ing at 4000 m show that enhanced CO concentrations closeto Australia do not have their origin in the Australian con-tinent. Air parcels are transported from the westerly South-ern Hemisphere around the continent to the east of Australia.African biomass burning is confirmed to be the major sourceof the measured CO pollution since MODIS firemaps showstrong fires in south-east of Africa during that time period.Backward trajectories corresponding to PE3 and starting at14 000 m altitude show air parcels to be transported from In-donesia into the Western Pacific. The trajectories start at theIndonesian ground level, are elevated quickly into high alti-tude, and are then transported into the Western Pacific. SinceMODIS firemaps only show a small influence of biomassburning, combustion of fossil fuel is the more likely source ofthe upper tropospheric CO pollution. PE4 corresponding tra-jectories starting at 150 m altitude show air parcels comingfrom the Australian continent, and MODIS firemaps showextensive fire counts in eastern Australia supporting the im-pact of biomass burning to pollution PE4.
5.3 HCN
Hydrogen cyanide (HCN) is a common tracer for biomassburning emissions with a lifetime of a few months and is
5http://rapidfire.sci.gsfc.nasa.gov/firemaps/
www.atmos-chem-phys.net/12/815/2012/ Atmos. Chem. Phys., 12, 815–828, 2012
824 T. Ridder et al.: Sources of CO and O3 in the Western Pacific
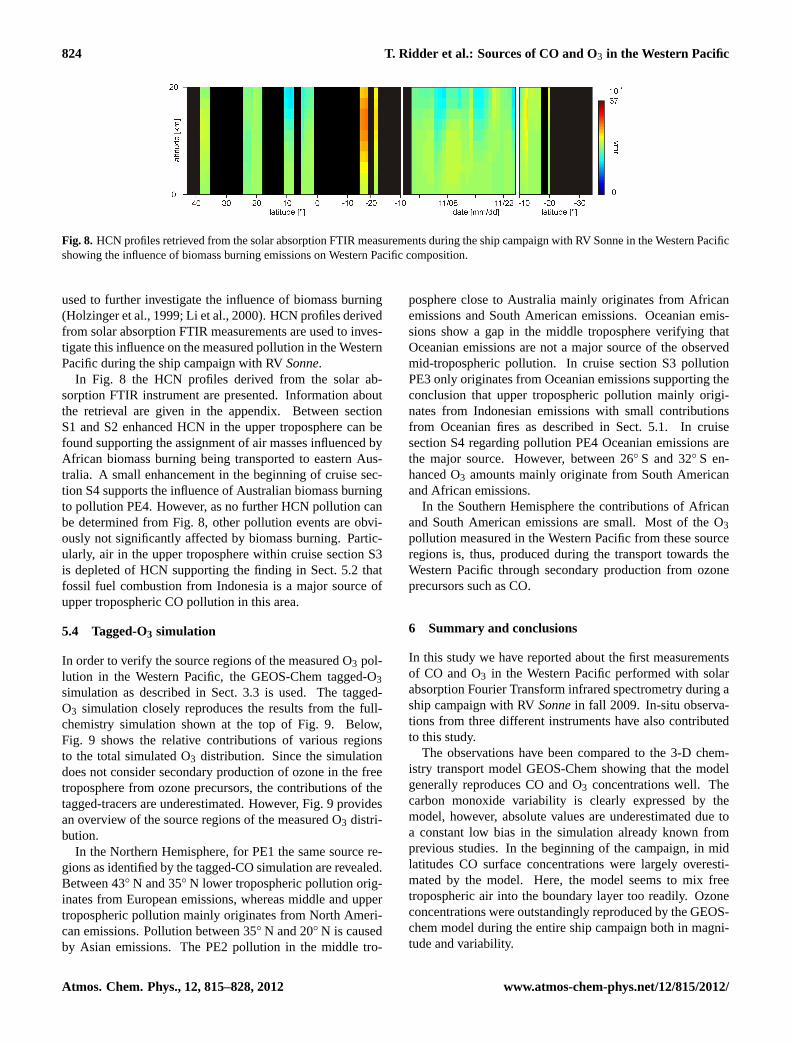
Fig. 8. HCN profiles retrieved from the solar absorption FTIR measurements during the ship campaign with RV Sonne in the Western Pacificshowing the influence of biomass burning emissions on Western Pacific composition.
used to further investigate the influence of biomass burning(Holzinger et al., 1999; Li et al., 2000). HCN profiles derivedfrom solar absorption FTIR measurements are used to inves-tigate this influence on the measured pollution in the WesternPacific during the ship campaign with RVSonne.
In Fig. 8 the HCN profiles derived from the solar ab-sorption FTIR instrument are presented. Information aboutthe retrieval are given in the appendix. Between sectionS1 and S2 enhanced HCN in the upper troposphere can befound supporting the assignment of air masses influenced byAfrican biomass burning being transported to eastern Aus-tralia. A small enhancement in the beginning of cruise sec-tion S4 supports the influence of Australian biomass burningto pollution PE4. However, as no further HCN pollution canbe determined from Fig.8, other pollution events are obvi-ously not significantly affected by biomass burning. Partic-ularly, air in the upper troposphere within cruise section S3is depleted of HCN supporting the finding in Sect. 5.2 thatfossil fuel combustion from Indonesia is a major source ofupper tropospheric CO pollution in this area.
5.4 Tagged-O3 simulation
In order to verify the source regions of the measured O3 pol-lution in the Western Pacific, the GEOS-Chem tagged-O3simulation as described in Sect.3.3 is used. The tagged-O3 simulation closely reproduces the results from the full-chemistry simulation shown at the top of Fig.9. Below,Fig. 9 shows the relative contributions of various regionsto the total simulated O3 distribution. Since the simulationdoes not consider secondary production of ozone in the freetroposphere from ozone precursors, the contributions of thetagged-tracers are underestimated. However, Fig.9 providesan overview of the source regions of the measured O3 distri-bution.
In the Northern Hemisphere, for PE1 the same source re-gions as identified by the tagged-CO simulation are revealed.Between 43◦ N and 35◦ N lower tropospheric pollution orig-inates from European emissions, whereas middle and uppertropospheric pollution mainly originates from North Ameri-can emissions. Pollution between 35◦ N and 20◦ N is causedby Asian emissions. The PE2 pollution in the middle tro-
posphere close to Australia mainly originates from Africanemissions and South American emissions. Oceanian emis-sions show a gap in the middle troposphere verifying thatOceanian emissions are not a major source of the observedmid-tropospheric pollution. In cruise section S3 pollutionPE3 only originates from Oceanian emissions supporting theconclusion that upper tropospheric pollution mainly origi-nates from Indonesian emissions with small contributionsfrom Oceanian fires as described in Sect.5.1. In cruisesection S4 regarding pollution PE4 Oceanian emissions arethe major source. However, between 26◦ S and 32◦ S en-hanced O3 amounts mainly originate from South Americanand African emissions.
In the Southern Hemisphere the contributions of Africanand South American emissions are small. Most of the O3pollution measured in the Western Pacific from these sourceregions is, thus, produced during the transport towards theWestern Pacific through secondary production from ozoneprecursors such as CO.
6 Summary and conclusions
In this study we have reported about the first measurementsof CO and O3 in the Western Pacific performed with solarabsorption Fourier Transform infrared spectrometry during aship campaign with RVSonnein fall 2009. In-situ observa-tions from three different instruments have also contributedto this study.
The observations have been compared to the 3-D chem-istry transport model GEOS-Chem showing that the modelgenerally reproduces CO and O3 concentrations well. Thecarbon monoxide variability is clearly expressed by themodel, however, absolute values are underestimated due toa constant low bias in the simulation already known fromprevious studies. In the beginning of the campaign, in midlatitudes CO surface concentrations were largely overesti-mated by the model. Here, the model seems to mix freetropospheric air into the boundary layer too readily. Ozoneconcentrations were outstandingly reproduced by the GEOS-chem model during the entire ship campaign both in magni-tude and variability.
Atmos. Chem. Phys., 12, 815–828, 2012 www.atmos-chem-phys.net/12/815/2012/

T. Ridder et al.: Sources of CO and O3 in the Western Pacific 825
Fig. 9. Relative contributions of various GEOS-Chem tagged re-gions to the measured O3 pollution calculated with the tagged-O3simulation. AS: Asia, EU: Europe, NA: North America, AF: Africa,SA: South America, OC: Oceania. The black line in each graph in-dicates the model tropopause height.
The variability of the CO and O3 distributions is largelysimilar suggesting impacts from similar source regions. Thisis verified with a subjective assessment of the source pro-cesses and source regions of the measured CO and O3 pollu-tion using tagged tracer simulations, MODIS firemaps, HYS-PLIT trajectory calculations, and solar absorption FTIR mea-surements of HCN.
Large parts of the West Pacific belong to Earth’s most re-mote areas. While much of the air observed in this region isconsidered the cleanest air world wide, the presented obser-vations show the presence of distinct plumes of elevated car-
bon monoxide and ozone. Trajectory based transport studiesand studies with a full chemical transport model show thatthe cause of this pollution is global scale transport of pollu-tants with contributions from source regions as far away asEurope.
The analysis of several different carbon monoxide andozone pollution events sampled during the RVSonneshipcampaign has demonstrated that in the Northern Hemispherethe main contributor to Western Pacific tropospheric air pol-lution is Asian fossil fuel combustion. Contributions fromEuropean emissions and North American emissions in thelower and middle troposphere are significant as well.
In the Southern Hemisphere biomass burning and fossilfuel combustion are determined to cause carbon monoxideand ozone pollution observed during the RVSonneship cam-paign. In particular, African and South American biomassburning significantly contribute to Western Pacific air pollu-tion. Fossil fuel combustion in Indonesia is a major contri-bution to upper tropospheric pollution in the tropical WesternPacific. This pollution within the tropical tropopause layer istransported by radiative heating into the stratosphere and hasan impact on stratospheric composition.
The presented analysis provides a detailed evaluation ofthe source processes and source regions of Western Pacificcarbon monoxide and ozone pollution measured during aship campaign from Japan to New Zealand in fall 2009.Thus, the analysis is limited on the abovementioned periodob time. In order to obtain a better knowledge of WesternPacific air contamination, future measurements in this regionwith high temporal and spatial resolution are needed as theyare currently performed by, for example, the HIAPER Pole toPole Observation (HIPPO) aircraft campaign (Wofsy, 2011)and the SHIVA (Stratospheric ozone: Halogen Impacts in aVarying Atmosphere) campaign.
Appendix A
HCN retrieval
In Fig. 8 the solar absorption FTIR profiles of HCNduring the ship campaign with RVSonnewere shown.HCN was simultaneously fitted in four microwindows(3268.1800 cm−1–3268.2700 cm−1, 3287.1800 cm−1–3287.3200 cm−1, 3299.4600 cm−1–3299.5800 cm−1,3305.4000 cm−1–3305.7000 cm−1) with H2O, C2H2, andCO2 also fitted as interfering gases. HCN reaches a DOF ofaround 2 with the main sensitivity in the upper troposphere.The corresponding averaging kernels are presented inFig. A1.
Acknowledgements.We acknowledge the financial support pro-vided by the German Ministry for Research and Education (BMBF)within the grant 03G0731B and the TransBrom-SONNE project.We kindly acknowledge the financial support by the Leibniz
www.atmos-chem-phys.net/12/815/2012/ Atmos. Chem. Phys., 12, 815–828, 2012

826 T. Ridder et al.: Sources of CO and O3 in the Western Pacific
Fig. A1. Representative averaging kernels of the FTIR HCN re-trieval. The colored lines indicate the sensitivity and resolution ofeach individual layer.
Association (WGL) within the TransBrom project. Funding bythe Earth System Science Research School (ESSReS), an initiativeof the Helmholtz Association of German research centers (HGF)at the Alfred Wegener Institute for Polar and Marine Researchis gratefully acknowledged. The German Academic ExchangeService (DAAD) is gratefully acknowledged for financial support.
Edited by: K. Krueger
References
Andreae, M. O., Artaxo, P., Fischer, H., Freitas, S. R., Gregoire,J.-M., Hansel, A., Hoor, P., Kormann, R., Krejci, R., Lange, L.,Lelieveld, J., Lindinger, W., Longo, K., Peters, W., de Reus, M.,Scheeren, B., Silva Dias, M. A. F., Strom, J., van Velthoven, P.F. J., and Williams, J.: Transport of biomass burning smoke to theupper troposphere by deep convection in the equatorial region,Geophys. Res. Lett., 28, 951–954,doi:10.1029/2000GL012391,2001.
Bey, I., Jacob, D. J., Logan, J. A., and Yantosca, R. M.:Asian chemical outflow to the Pacific in spring: Origins,pathways, and budgets, J. Geophys. Res., 106, 23097–23113,doi:10.1029/2001JD000806, 2001a.
Bey, I., Jacob, D. J., Yantosca, R. M., Logan, J. A., Field, B. D.,Fiore, A. M., Li, Q., Liu, H. Y., Mickley, L. J., and Schultz,M. G.: Global modeling of tropospheric chemistry with as-similated meteorology: Model description and evaluation, J.Geophys. Res., 106, 23073–23095,doi:10.1029/2001JD000807,2001b.
Draxler, R. R. and Hess, G. D.: Description of the HYSPLIT4 mod-eling system, NOAA Tech. Memo. ERL ARL-224, NOAA AirResources Laboratory, 24 pp., 1997.
Draxler, R. R. and Hess, G. D.: An overview of the HYSPLIT4modeling system of trajectories, dispersion, and deposition,Aust. Meteorol. Mag., 47, 295–308, 1998.
Duncan, B. N., Logan, J. A., Bey, I., Megretskaia, I. A., Yan-tosca, R. M., Novelli, P. C., Jones, N. B., and Rinsland, C. P.:Global budget of CO, 1988–1997: Source estimates and val-idation with a global model, J. Geophys. Res., 112, D22301,doi:10.1029/2007JD008459, 2007.
Esler, M. B., Griffith, D. W. T., Wilson, S. R., and Steele, L. P.: Pre-cision Trace Gas Analysis by FT-IR Spectroscopy, 1. Simultane-ous Analysis of CO2, CH4, N2O, and CO in Air, Anal. Chem.,72, 206–215,doi:10.1021/ac9905625, 2000.
Fueglistaler, S., Wernli, H., and Peter, T.: Tropical troposphere-to-stratosphere transport inferred from trajectory calculations, J.Geophys. Res., 109, D03108,doi:10.1029/2003JD004069, 2004.
Fueglistaler, S., Dessler, A. E., Dunkerton, T. J., Folkins, I., Fu, Q.,and Mote, P. W.: Tropical tropopause layer, Rev. Geophys., 47,RG1004,doi:10.1029/2008RG000267, 2009.
Garcia, R. R., Marsh, D. R., Kinnison, D. E., Boville, B. A.,and Sassi, F.: Simulation of secular trends in the mid-dle atmosphere, 1950–2003, J. Geophys. Res., 112, D09301,doi:10.1029/2006JD007485, 2007.
Griffith, D., Deutscher, N., Krummel, P. Fraser, P., van der Schoot,M., and Allison, C.: The UoW FTIR trace gas analyser: com-parison with LoFlo, AGAGE and tank measurements at CapeGrim and GASLAB, in: Baseline Atmospheric Program (Aus-tralia) 2007–2008, edited by: Derek, N. and Krummel, P. B.,Australian Bureau of Meteorology and CSIRO Marine and At-mospheric Research, Melbourne, Australia, 7–22, 2011.
Griffith, D. W.: FT-IR Measurements of AtmosphericTrace Gases and their Fluxes, John Wiley & Sons, Ltd,doi:10.1002/0470027320.s6802, 2002.
Griffith, D. W. T.: Synthetic Calibration and Quantitative Analysisof Gas-Phase FT-IR Spectra, Appl. Spectrosc., 50, 59–70, 1996.
Holton, J. R., Haynes, P. H., McIntyre, M. E., Douglass, A. R.,Rood, R. B., and Pfister, L.: Stratosphere-troposphere exchange,Rev. Geophys., 33, 403–439,doi:10.1029/95RG02097, 1995.
Holzinger, R., Warneke, C., Hansel, A., Jordan, A., Lindinger, W.,Scharffe, D. H., Schade, G., and Crutzen, P. J.: Biomass burn-ing as a source of formaldehyde, acetaldehyde, methanol, ace-tone, acetonitrile, and hydrogen cyanide, Geophys. Res. Lett.,26, 1161–1164,doi:10.1029/1999GL900156, 1999.
Jacob, D. J., Crawford, J. H., Kleb, M. M., Connors, V. S., Bendura,R. J., Raper, J. L., Sachse, G. W., Gille, J. C., Emmons, L., andHeald, C. L.: Transport and Chemical Evolution over the Pacific(TRACE-P) aircraft mission: Design, execution, and first results,J. Geophys. Res., 108, 9000,doi:10.1029/2002JD003276, 2003.
Jaegle, L., Jaffe, D. A., Price, H. U., Weiss-Penzias, P., Palmer, P. I.,Evans, M. J., Jacob, D. J., and Bey, I.: Sources and budgets forCO and O3 in the northeastern Pacific during the spring of 2001:Results from the PHOBEA-II Experiment, J. Geophys. Res., 108,8802,doi:10.1029/2002JD003121, 2003.
Kopacz, M., Jacob, D. J., Fisher, J. A., Logan, J. A., Zhang, L.,Megretskaia, I. A., Yantosca, R. M., Singh, K., Henze, D. K.,Burrows, J. P., Buchwitz, M., Khlystova, I., McMillan, W. W.,Gille, J. C., Edwards, D. P., Eldering, A., Thouret, V., andNedelec, P.: Global estimates of CO sources with high resolu-tion by adjoint inversion of multiple satellite datasets (MOPITT,AIRS, SCIAMACHY, TES), Atmos. Chem. Phys., 10, 855–876,
Atmos. Chem. Phys., 12, 815–828, 2012 www.atmos-chem-phys.net/12/815/2012/

T. Ridder et al.: Sources of CO and O3 in the Western Pacific 827
doi:10.5194/acp-10-855-2010, 2010.Kruger, K. and Quack, B.: Introduction to special issue: the
TransBrom Sonne expedition in the tropical West Pacific, At-mos. Chem. Phys. Discuss., 12, 1401–1418,doi:10.5194/acpd-12-1401-2012, 2012.
Kruger, K., Immler, F., Tegtmeier, S., Fuhlbrugge, S., Mohr, V.,Wache, S., Rex, M., and Quack, B.: High resolution radiosondedata above the tropical West Pacific, Atmos. Chem. Phys. Dis-cuss., in preparation, 2012.
Kurylo, M. J.: Network for the detection of stratospheric change(NDSC), in: Society of Photo-Optical Instrumentation Engineers(SPIE) Conference Series, edited by: McElroy, J. L. and McNeal,R. J., vol. 1491 of Society of Photo-Optical Instrumentation En-gineers (SPIE) Conference Series, 168–174, 1991.
Li, Q., Jacob, D. J., Bey, I., Yantosca, R. M., Zhao, Y., Kondo, Y.,and Notholt, J.: Atmospheric hydrogen cyanide (HCN): Biomassburning source, ocean sink?, Geophys. Res. Lett., 27, 357–360,doi:10.1029/1999GL010935, 2000.
Li, Q., Jacob, D. J., Bey, I., Palmer, P. I., Duncan, B. N., Field, B. D.,Martin, R. V., Fiore, A. M., Yantosca, R. M., Parrish, D. D., Sim-monds, P. G., and Oltmans, S. J.: Transatlantic transport of pollu-tion and its effects on surface ozone in Europe and North Amer-ica, J. Geophys. Res., 107, 4166,doi:10.1029/2001JD001422,2002.
Liu, H., Jacob, D. J., Chan, L. Y., Oltmans, S. J., Bey, I., Yantosca,R. M., Harris, J. M., Duncan, B. N., and Martin, R. V.: Sourcesof tropospheric ozone along the Asian Pacific Rim: An anal-ysis of ozonesonde observations, J. Geophys. Res., 107, 4573,doi:10.1029/2001JD002005, 2002.
Notholt, J., Toon, G. C., Rinsland, C. P., Pougatchev, N. S.,Jones, N. B., Connor, B. J., Weller, R., Gautrois, M., andSchrems, O.: Latitudinal variations of trace gas concentra-tions in the free troposphere measured by solar absorption spec-troscopy during a ship cruise, J. Geophys. Res., 105, 1337–1349,doi:10.1029/1999JD900940, 2000.
Notholt, J., Kuang, Z., Rinsland, C. P., Toon, G. C., Rex, M., Jones,N., Albrecht, T., Deckelmann, H., Krieg, J., Weinzierl, C., Binge-mer, H., Weller, R., and Schrems, O.: Enhanced Upper TropicalTropospheric COS: Impact on the Stratospheric Aerosol Layer,Science, 300, 307–310,doi:10.1126/science.1080320, 2003.
Notholt, J., Luo, B. P., Fueglistaler, S., Weisenstein, D., Rex,M., Lawrence, M. G., Bingemer, H., Wohltmann, I., Corti,T., Warneke, T., von Kuhlmann, R., and Peter, T.: Influ-ence of tropospheric SO2 emissions on particle formation andthe stratospheric humidity, Geophys. Res. Lett., 32, L07810,doi:10.1029/2004GL022159, 2005.
Palm, M., v. Savigny, C., Warneke, T., Velazco, V., Notholt, J.,Kunzi, K., Burrows, J., and Schrems, O.: Intercomparisonof O3 profiles observed by SCIAMACHY and ground basedmicrowave instruments, Atmos. Chem. Phys., 5, 2091–2098,doi:10.5194/acp-5-2091-2005, 2005.
Quack, B. and Kruger, K.: Cruise Report TransBrom SONNE,Berichte aus dem Leibniz-Institut fur Meereswissenschaften ander Christian-Albrechts-Universitat zu Kiel, 37, 1–86, 2010.
Rao, K. N.: Spectroscopy of the Earth’s Atmosphere and InterstellarMedium, Academic Press, Boston, USA, 1–536, 1992.
Ridder, T., Warneke, T., and Notholt, J.: Source brightness fluctua-tion correction of solar absorption fourier transform mid infraredspectra, Atmos. Meas. Tech., 4, 1045–1051,doi:10.5194/amt-4-
1045-2011, 2011.Rienecker, M. M., Suarez, M. J., Todling, R., Bacmeister, J.,
Takacs, L., Liu, H.-C., Gu, W., Sienkiewicz, M., Koster, R. D.,Gelaro, R., Stajner, I., and Nielsen, J. E.: The GEOS-5 DataAssimilation System – Documentation of Versions 5.0.1, 5.1.0,and 5.2.0, Technical Report Series on Global Modeling and DataAssimilation, 27, NASA/TM–2007–104606, 2008.
Rinsland, C. P., Jones, N. B., Connor, B. J., Logan, J. A.,Pougatchev, N. S., Goldman, A., Murcray, F. J., Stephen, T. M.,Pine, A. S., Zander, R., Mahieu, E., and Demoulin, P.: Northernand southern hemisphere ground-based infrared spectroscopicmeasurements of tropospheric carbon monoxide and ethane,J. Geophys. Res., 103, 28197–28217,doi:10.1029/98JD02515,1998.
Rodgers, C. D.: Characterization and Error Analysis of Profiles Re-trieved From Remote Sounding Measurements, J. Geophys. Res.,95, 5587–5595,doi:10.1029/JD095iD05p05587, 1990.
Rodgers, C. D.: Inverse Methods for Atmospheric Sounding: The-ory and Practice, World Scientific Publishing Company, London,UK, 1–240, 2000.
Rodgers, C. D. and Connor, B. J.: Intercomparison of re-mote sounding instruments, J. Geophys. Res., 108, 4116,doi:10.1029/2002JD002299, 2003.
Sauvage, B., Martin, R. V., van Donkelaar, A., and Ziemke, J. R.:Quantification of the factors controlling tropical troposphericozone and the South Atlantic maximum, J. Geophys. Res., 112,D11309,doi:10.1029/2006JD008008, 2007.
Schneider, M., Hase, F., Blumenstock, T., Redondas, A., andCuevas, E.: Quality assessment of O3 profiles measured bya state-of-the-art ground-based FTIR observing system, At-mos. Chem. Phys., 8, 5579–5588,doi:10.5194/acp-8-5579-2008,2008.
Solomon, S., Qin, D., Manning, M., Chen, Z., Marquis, M., Av-eryt, K. B., Tignor, M., and Miller, H. L.: Climate Change 2007:The Physical Science Basis. Contribution of Working Group I tothe Fourth Assessment Report of the Intergovernmental Panel onClimate Change, Cambridge University Press, Cambridge, UKand New York, NY, USA, 2007.
Staudt, A. C., Jacob, D. J., Logan, J. A., Bachiochi, D., Kr-ishnamurti, T. N., and Sachse, G. W.: Continental sources,transoceanic transport, and interhemispheric exchange of carbonmonoxide over the Pacific, J. Geophys. Res., 106, 32571–32589,doi:10.1029/2001JD900078, 2001.
Thompson, A. M., Witte, J. C., Hudson, R. D., Guo, H.,Herman, J. R., and Fujiwara, M.: Tropical TroposphericOzone and Biomass Burning, Science, 291, 2128–2132,doi:10.1126/science.291.5511.2128, 2001.
Velazco, V., Notholt, J., Warneke, T., Lawrence, M., Bremer, H.,Drummond, J., Schulz, A., Krieg, J., and Schrems, O.: Lat-itude and altitude variability of carbon monoxide in the At-lantic detected from ship-borne Fourier transform spectrome-try, model, and satellite data, J. Geophys. Res., 110, D09306,doi:10.1029/2004JD005351, 2005.
Warneke, T., Meirink, J. F., Bergamaschi, P., Grooß, J.-U., Notholt,J., Toon, G. C., Velazco, V., Goede, A. P. H., and Schrems, O.:Seasonal and latitudinal variation of atmospheric methane: Aground-based and ship-borne solar IR spectroscopic study, Geo-phys. Res. Lett., 33, L14812,doi:10.1029/2006GL025874, 2006.
White, J. U.: Long Optical Paths of Large Aperture, J. Opt. Soc.
www.atmos-chem-phys.net/12/815/2012/ Atmos. Chem. Phys., 12, 815–828, 2012
828 T. Ridder et al.: Sources of CO and O3 in the Western Pacific
Am., 32, 285,doi:10.1364/JOSA.32.000285, 1942.Wofsy, S. C.: HIAPER Pole-to-Pole Observations (HIPPO): fine-
grained, global-scale measurements of climatically important at-mospheric gases and aerosols, Phil. Trans. R. Soc. A, 369, 2073–2086,doi:10.1098/rsta.2010.0313, 2011.
Wunch, D., Toon, G. C., Blavier, J.-F. L., Washenfelder, R. A.,Notholt, J., Connor, B. J., Griffith, D. W. T., Sherlock,V., and Wennberg, P. O.: The Total Carbon Column Ob-serving Network, Philos. T. Roy. Soc. A, 369, 2087–2112,doi:10.1098/rsta.2010.0240, 2011.
Yan, X.-H., Ho, C.-R., Zheng, Q., and Klemas, V.: Temperatureand Size Variabilities of the Western Pacific Warm Pool, Science,258, 1643–1645,doi:10.1126/science.258.5088.1643, 1992.
Zhang, L., Jacob, D. J., Boersma, K. F., Jaffe, D. A., Olson, J. R.,Bowman, K. W., Worden, J. R., Thompson, A. M., Avery, M.A., Cohen, R. C., Dibb, J. E., Flock, F. M., Fuelberg, H. E.,Huey, L. G., McMillan, W. W., Singh, H. B., and Weinheimer,A. J.: Transpacific transport of ozone pollution and the effect ofrecent Asian emission increases on air quality in North Amer-ica: an integrated analysis using satellite, aircraft, ozonesonde,and surface observations, Atmos. Chem. Phys., 8, 6117–6136,doi:10.5194/acp-8-6117-2008, 2008.
Atmos. Chem. Phys., 12, 815–828, 2012 www.atmos-chem-phys.net/12/815/2012/