Shin Dissertation - Harvard University
153
Essays on Corporate Governance and Shareholder Activism Citation Shin, Sa-Pyung. 2016. Essays on Corporate Governance and Shareholder Activism. Doctoral dissertation, Harvard Business School. Permanent link http://nrs.harvard.edu/urn-3:HUL.InstRepos:32744405 Terms of Use This article was downloaded from Harvard University’s DASH repository, and is made available under the terms and conditions applicable to Other Posted Material, as set forth at http:// nrs.harvard.edu/urn-3:HUL.InstRepos:dash.current.terms-of-use#LAA Share Your Story The Harvard community has made this article openly available. Please share how this access benefits you. Submit a story . Accessibility
Transcript of Shin Dissertation - Harvard University

Essays on Corporate Governance and Shareholder Activism
CitationShin, Sa-Pyung. 2016. Essays on Corporate Governance and Shareholder Activism. Doctoral dissertation, Harvard Business School.
Permanent linkhttp://nrs.harvard.edu/urn-3:HUL.InstRepos:32744405
Terms of UseThis article was downloaded from Harvard University’s DASH repository, and is made available under the terms and conditions applicable to Other Posted Material, as set forth at http://nrs.harvard.edu/urn-3:HUL.InstRepos:dash.current.terms-of-use#LAA
Share Your StoryThe Harvard community has made this article openly available.Please share how this access benefits you. Submit a story .
Accessibility


!

Essays on Corporate Governance and Shareholder Activism
A thesis presented
by
Sa-Pyung Sean Shin
In partial fulfillment of the requirements
For the degree of
Doctor of Business Administration
Harvard University
Graduate School of Business Administration
Cambridge, Massachusetts
April 2016

! ii!
© 2016 Sa-Pyung Sean Shin
All rights reserved

! iii!
Paul M. Healy Sa-Pyung Sean Shin
ESSAYS ON CORPORATE GOVERNANCE AND SHAREHOLDER ACTIVISM
ABSTRACT
In these essays, I explore the relation between shareholder activism and corporate
governance, mainly the board of directors and takeover defense measures.
In the first essay, “Takeover defenses in the era of shareholder activism,” I examine
whether or not takeover defense measures that were originally developed to protect the
management have differential effects on the probability of shareholder activism. I also examine
what are the types of demands activists make when there are defense measures in place and look
at the outcomes following activist campaigns. I find that firms with a staggered board or dual-class
shares are less likely to be targeted while firms with a poison pill in place are more likely to be
targeted. Also, staggered board and poison pill are more likely to be removed following activism
and target firms are more likely to be taken over following activism despite having defense
measures in place.
In the second essay, “Consequences to Directors of Shareholder Activism,” co-authored
with Ian D. Gow and Suraj Srinivasan, we examine how shareholder activists can influence
accountability of the board of directors. We find that the directors are more likely to leave the
board in the two years following activist engagement and their turnover is more sensitive to their
performance in the period leading up to shareholder activism. However, we do not find evidence
of reputational consequences for the directors as we do not find changes in the number of other
board seats.

! iv!
In the third essay, “Activist directors – determinants and consequences,” also co-authored
with Ian D. Gow and Suraj Srinivasan, we examine whom the directors shareholder activists put
in when they are granted a board seat or when they win proxy fights and whether having these
board seats can help them achieve their goals more effectively. We identify 1,369 activist directors
during the period of 2004–2015. Activists remain as shareholders longer when they have board
seats and having activist directors is associated with significant strategic and operational actions
by firms.

! v!
ACKNOWLEDGEMENTS
First of all, I would like to express my sincere gratitude to my dissertation committee:
Paul M. Healy, my dissertation chair, who devoted much of his time reading numerous drafts of
my thesis; Suraj Srinivasan, who has been a foremost mentor during the past six years of my
doctoral study; and Ian D. Gow, who has helped me become an empirical researcher with his
invaluable resources and guidance.
Also, I would like to thank all the faculty at the Accounting and Management unit as well
as all the staff at the Doctoral Programs Office for their help and encouragement. I would also like
to thank all other accounting DBA students, especially Akash Chattopadhyay, Carolyn Deller,
Rajesh Vijayaraghavan, and Shelley Xin Li, who shared every moment of my doctoral studies. I
would not have been able to endure the program without the support of my friends at HBS,
including Sanghyup Kwak, Doyoon Kim and Yosub Jung, who have been like brothers to me. I
appreciate all the prayers and care from my Godfather, Jin Hyung Kim, and my Godmother, Doory
Kim. I would like to give special thanks to a couple, Seil Kim and Jihwon Park, who have been
more than just colleagues in the same field. Additionally, Harvard Korea Society, HBS Section K,
and Daewon Alumni in Boston have been special groups that enriched my life during the doctoral
years.
Lastly, I am most grateful to my family: my father, Hae Ryong Shin, my mother, Jung
Sook Kim, and my little sister, Yoon Ji Shin. Their love and support have been and are always
beyond words of description. And I am thankful to the most special and the most important
addition to my life, Woo Rhi Suh, for all the luck she has brought me.
To all my family and friends, I dedicate this thesis.

! vi!
TABLE OF CONTENTS 1. Introduction 1 2. Takeover Defenses in the Era of Shareholder Activism 4 2.1. Introduction 4 2.2. Prior research and institutional setting 9
2.2.1. Shareholder activism 9 2.2.2. Takeover defenses 11
2.2.2.1. Dual-class shares 2.2.2.2. Staggered board 2.2.2.3. Poison pill 2.2.2.4. Takeover defenses and consequences
2.2.3. Takeover defenses and shareholder activism 15 2.3. Data and descriptive statistics 18
2.3.1. Activism events 18 2.3.2. Defense measures 21 2.3.3. Other variables 21
2.4. Takeover defenses and activist target selection 23 2.4.1. Empirical analysis 23 2.4.2. Cross-sectional variation: size 30
2.5. Takeover defenses and activist demand and outcomes 31 2.5.1. Activist demand 31 2.5.2. Activism outcomes 34
2.5.2.1. Removal of defense measures 2.5.2.2. Takeover probabilities 2.5.2.3. Financial policies
2.6. Board response to shareholder activism 41 2.6.1. Poison pill adoption 41 2.6.2. Effectiveness of poison pill adoption 44
2.7. Conclusion 47 3. Consequences to Directors of Shareholder Activism 49 3.1. Introduction 49 3.2. Prior research and institutional setting 53
3.2.1. Director turnover 53 3.2.2. Effect of shareholder votes and institutional shareholder activism 54 3.2.3. Director elections and proxy fights 55 3.2.4. Hedge fund and other institutional activism 56

! vii!
3.3. Data and sample description 58 3.3.1. Directorship data 58 3.3.2. Firm-level data 59 3.3.3. Activism events 59
3.4. Director turnover in targeted companies 64 3.4.1. Shareholder activism and director turnover 64 3.4.2. Shareholder activism and performance sensitivity of director turnover 72 3.4.3. Settlements with activists and director turnover 73 3.4.4. CEO turnover and outside directors 76
3.5. Voting in director elections 77 3.5.1. Determinants of shareholder support 77 3.5.2. Do shareholder votes matter for board turnover? 79
3.6. Directorships on other boards 81 3.7. Analysis of individually targeted directors 84 3.8. Additional analyses 86
3.8.1. Within-firm analyses 86 3.8.2. Propensity score matching 90
3.9. Conclusion 93 4. Activist Directors: Determinants and Consequences 95 4.1. Introduction 95 4.2. Institutional background and prior literature 99
4.2.1. Illustrative cases 99 4.2.2. Causes and consequences of hedge fund activism 101 4.2.3. Other shareholder activism 103 4.2.4. Director elections and proxy fights 104 4.2.5. Specialist outside directors 105
4.3. Data and descriptive statistics 106 4.3.1. Activism events 106 4.3.2. Activist directors 107 4.3.3. Activist holdings 108 4.3.4. Director characteristics 108 4.3.5. Other data 110
4.4. Activist target selection 111 4.5. Activist holding periods 115 4.6. Stock returns 117 4.7. Firm outcomes 120
4.7.1. Profitability 120 4.7.2. Divestiture and acquisitions 123 4.7.3. CEO turnover and compensation 124

! viii!
4.7.4. Capital structure and payouts 126 4.7.5. Investment 127
4.8. Conclusion 129 Bibliography 131 Appendix A: Descriptive statistics by sample 136 Appendix B: Variable definitions 137 Appendix C: Activism classification – examples 139 Appendix D: Identification of targeted directors – examples 141

! ix!
LIST OF TABLES Table 2.1. Shareholder activism events 19 Table 2.2. Takeover defense measures 22 Table 2.3. Activist target selection 26 Table 2.4. Activist demands and success rates 32 Table 2.5. Defense measures and activist demands 33 Table 2.6. Probability of removing defense measures 35 Table 2.7. Probability of sale of the target 36 Table 2.8. Changes in financial policies by defense measure 38 Table 2.9. Probability of poison pill adoption 44 Table 2.10. Poison pill adoption and activism consequences 46 Table 3.1. Descriptive statistics 60 Table 3.2. Effect of shareholder activism on director turnover 67 Table 3.3. Effect of shareholder activism on director turnover 74 Table 3.4. Shareholder activism and director elections 79 Table 3.5. Shareholder activism, director elections, and director turnover 81 Table 3.6. Impact of shareholder activism on other directorships 82 Table 3.7. Impact of shareholder activism on individually targeted directors 84 Table 3.8. The effect of proxy fights on directorships: Within-firm analysis 88 Table 3.9. Propensity score matching analysis 91 Table 4.1. Activism events 107 Table 4.2. Activist directors 108 Table 4.3. Director characteristics 109 Table 4.4. Activist target selection 113 Table 4.5. Activist holding periods 116 Table 4.6. Stock returns 118 Table 4.7. Operating performance 122 Table 4.8. Divestiture and acquisitions 124 Table 4.9. CEO turnover and compensation 125 Table 4.10. Capital structure 127 Table 4.11. Investment 128
LIST OF FIGURES Figure 2.1. Activism events by year 20 Figure 2.2. Takeover defenses by year 23

1
CHAPTER 1
INTRODUCTION
Corporate governance is a mechanism that helps investors monitor and hold managers
accountable in the existence of agency problems coming from separation of ownership and control
(Shleifer and Vishny, 1997). Examples of these corporate governance mechanisms include internal
corporate governance mechanisms such as the board of directors and external corporate
governance mechanisms such as the market for corporate control.
Recently, a new force has become a big stimulus to corporate governance environment –
shareholder activism. Shareholder activism, mainly driven by hedge funds, has gained lots of
traction from the media as well as the academic literature. Activists generally buy stakes in
undervalued firms and push for improvement in performance and governance. If management
resists, they would convince other shareholders to side with them to push for changes further. In
the end, when the value is unleashed, they sell their stakes and leave.
Many studies have looked at the types of firms being targeted for activism and what
happens to activism targets. In these essays, I focus on the relation between shareholder activism
and corporate governance, mainly the board of directors and takeover defense measures put in
place to protect the management.
In the first essay, “Takeover defenses in the era of shareholder activism,” I examine the
interplay between takeover defenses and shareholder activism. Using a comprehensive sample of
shareholder activism events between 2006 and 2014, I find a differential impact of takeover
defense measures on the likelihood of being targeted for activism; a dual-class structure or a
staggered board deters activism, whereas firms with a poison pill in place are more likely to

2
become targets. Activists are more likely to demand removal of takeover defense measures and/or
sale of the target firm if the firm has a staggered board or a poison pill in place, suggesting that
when takeover defenses block the market for corporate control, activists promote changes through
their interventions. I also find that target firms with takeover defenses are more likely to remove
those defenses and to be acquired following activism, which suggests that activism can act as an
antidote to takeover defenses. Finally, while many target firms adopt a poison pill in response to
activist approaches, I do not find evidence that it makes for an effective defense.
In the second essay, “Consequences to Directors of Shareholder Activism,” co-authored
with Ian D. Gow and Suraj Srinivasan, we examine how shareholder activist campaigns affect the
careers of directors of the targeted firms. Using a comprehensive sample of shareholder activism
between 2004 and 2012, we find that directors are almost twice as likely to leave over a two-year
period if the firm is the subject of a shareholder activist campaign. We examine a broad class of
shareholder activism including proxy contests. While proxy contests sometimes succeed in
replacing directors, they are costly and they rarely succeed in getting a majority of shareholder
support. Our evidence suggests that director turnover takes place following shareholder activism
even without shareholder activists engaging in, let alone winning, proxy contests. Performance-
sensitivity of director turnover is also higher in the presence of shareholder activism, even when
such activism does not result in a proxy fight. We find evidence of activism being associated with
lower shareholder support in director elections and with both activism and lower shareholder
support being incrementally associated with director turnover. In contrast to prior research, we
find that director election results matter for director retention: directors are more likely to leave in
the year following activism when they receive lower shareholder support. Overall, our evidence

3
suggests that shareholder activism is associated with greater accountability for independent
directors of US firms.
In the third essay, “Activist directors - determinants and consequences,” also co-authored
with Ian D. Gow and Suraj Srinivasan, we examine the determinants and consequences of hedge
fund activism with a focus on activist directors, i.e., those directors appointed in response to
demands by activists. Using a sample of 2,765 activism events over the period 2004-2015, we
identify 1,369 activist directors. We find that activists are more likely to gain board seats at smaller
firms and those with weaker stock price performance. Activists remain as shareholders longer
when they have board seats, with holding periods consistent with conventional notions of “long-
term” institutional investors. As in prior research, we find positive announcement-period returns
of around 4-5% when a firm is targeted by activists, and a 1.1% increase in return on assets over
the subsequent one to five years. We find that activist directors are associated with significant
strategic and operational actions by firms. We find evidence of increased divestiture, decreased
acquisition activity, higher probability of being acquired, lower cash balances, higher payout,
greater leverage, higher CEO turnover, lower CEO compensation, and reduced investment. With
the exception of the probability of being acquired, these estimated effects are generally greater
when activists obtain board representation, consistent with board representation being an important
mechanism for bringing about the kinds of changes that activists often demand.

4
CHAPTER 2
TAKEOVER DEFENSES IN THE ERA OF SHAREHOLDER ACTIVISM
2.1. Introduction
This essay examines the interplay between takeover defense measures and
shareholder activism. While defense measures have evolved to protect companies from the threat
of hostile takeovers, they can potentially play an important role in shareholder activism campaigns
led by hedge funds and other investors. Such campaigns have become a significant phenomenon
in recent years. While shareholder activists attempt to bring about changes at target firms with
their significant ownership and specific plans, boards and management often resist these demands
and seek to defend their strategies and existing governance mechanisms. In fact, many companies
now adopt defense measures traditionally used to prevent hostile takeovers as protection from
hedge fund activists. In this essay, I examine how these defense measures now play a role in
shaping activism.
I focus on three defense mechanisms which are most relevant to shareholder activism: dual-
class shares, staggered boards, and poison pills (Gill et al., 2014; Schulte, Roth, and Zabel, 2014).1
In a multi-class (mostly dual-class) capital structure,2 insiders can hold shares with majority voting
power, making it almost impossible for minority shareholders, including activists, to win a proxy
contest. A staggered board acts to prevent activists from gaining control of a board in a single
election − historically, no activist or hostile bidder has ever won two consecutive elections (Gill et
!!!!!!!!!!!!!!!!!!!!!!!!!!!!!!!!!!!!!!!!!!!!!!!!!!!!!!!!1 My interviews with legal and strategic advisors involved on the side of both activists and boards suggest that both sides consider takeover defenses in the context of their decision to target companies or how to prevent the company from being approached by activists, in deciding the tactics during the campaign and in the likelihood of success. 2 I use the term “dual-class” for all multi-class capital structures.

5
al., 2014). A poison pill is designed to limit activist influence over a firm by preventing the activists
from acquiring more than a specified percentage of the shares.
Using a sample of 1,845 publicly disclosed activism events involving hedge fund activists
and other major shareholders that commenced between 2006 and 2014, I examine the dynamics
between takeover defenses and shareholder activism by answering the following questions: (1)
What is the effect of each takeover defense on target selection? (2) What is the effect of takeover
defenses on activist demands? (3) What is the effect of shareholder activism on a company’s
existing takeover defenses and takeover probabilities? (4) Do companies adopt a poison pill in
response to activism and is it an effective defense against activists?
The first set of empirical tests examines how the three defense measures—dual-class
shares, a staggered board, and a poison pill—are associated with activists’ decisions to target
companies. For activists, target selection is a function of (a) the extent of potential valuation gains
arising from undervaluation, or opportunities for improvement in the target company and (b) the
probability of successfully bringing about desired changes in the target company. In this context,
takeover defenses can have two opposing effects on activists’ target selection. On one hand, prior
research suggests that takeover defense measures are associated with management entrenchment,
itself a possible cause of the undervaluation. Activists are likely to consider how much
improvement they can bring to a firm, and firms with entrenched managers hold the promise of
higher returns. Activists can also use the presence of takeover defenses as a public relations tool,
emphasizing the entrenchment of the board and management in order to convince other
shareholders to take the activists’ side in a proxy fight.
On the other hand, defense mechanisms can deter activism by lowering the probability of
success and increasing the costs for activists. The activists’ expected costs increase if the defense

6
mechanisms lower their chances of success, thus reducing their expected returns. Therefore, just
as takeover defense measures deter takeover attempts, they can discourage attempts to engage in
activism campaigns.
The effectiveness of the defense mechanisms against activism varies, given that they have
distinct characteristics. A dual-class structure can block activist influence and a chance to win a
proxy fight, as management or management-friendly shareholders own the majority of voting
power in most cases. Since activists are likely to end up in a proxy contest that is practically
impossible to win, a dual-class structure can provide an effective defense against activists. A
staggered board can increase costs for activists by restricting the pool of directors that they can
target to one third of the board. In addition, an activist is required to hold onto shares for at least
two years to make a credible threat that it would control the board, which would be costlier and
riskier for the activist.
While dual-class structures and staggered boards have characteristics that make activism
more difficult, poison pills may be less effective at preventing activism. Most activists do not
intend to take over the firm; rather they seek support from other shareholders in enacting their
policies. Given that activists do not need to own a majority of voting rights by themselves, a poison
pill that limits their ownership is unlikely to prevent them from gathering support from other
shareholders. In summary, the presence of defense measures is likely to be a signal of
undervaluation, but whether they limit the success of activism is an empirical question.
My first empirical analysis provides evidence that having a staggered board or dual-class
shares is associated with a lower likelihood of being targeted for activism, while having a poison
pill is associated with a higher likelihood of being approached by activists. This result is consistent

7
with the differential effectiveness of each defense measure as a deterrent against shareholder
activism.
Second, I examine the types of demands that activists make to boards of target firms with
any of the three defense measures in place. If an activist believes that a target is undervalued due
to the presence of defense mechanisms, the activist will likely seek to remove such defense
mechanisms and improve corporate governance. Furthermore, if an activist believes that a
company is an attractive takeover target, but defense measures are blocking the market for
corporate control, the activist will demand that the board seek a potential acquirer. I find that, when
defense mechanisms are in place, not only do activists ask for their removal, but they also demand
that the target firm sell itself as a whole or in parts, often referred to as exploring “strategic
alternatives.” This evidence is consistent with the failure of the market for corporate control and
activism arising to address frictions in the market for corporate control associated with takeover
defenses.
Third, I analyze whether activists succeed in repealing takeover defenses and removing
frictions in the market for corporate control. If activist campaigns are effective, takeover defenses
are likely to be removed and target firms sold. My findings suggest that, even after controlling for
the recent trend towards removing poison pills and staggered boards, an activism campaign is
followed by a higher likelihood of removal of a staggered board and a poison pill within two years.
In addition, I find an increase in the probability of takeover within two years for the sample of
target firms, despite having a staggered board or a poison pill in place. I also find that financial
leverage increases and capital expenditures decrease following activism, but do not find that the
effect differs according to the existence of defense measures.

8
Lastly, I study defensive responses to activism by target firms and their effects on activism
outcomes. I test how often boards adopt a poison pill in response to an activism announcement
and how that response varies with the activist’s equity stake and demands. I focus on poison pill
adoption because, unlike the other defenses, a poison pill can easily be adopted without
shareholder approval when a firm is faced with the threat of activism (Coates, 2000). I find that,
controlling for other factors, the announcement of activism increases the likelihood of poison pill
adoption by 6.2%. I also find that a board’s decision to adopt a poison pill is positively related to
the percentage of activist ownership, demand for board seats, and demand for sale of the target.
However, I do not find evidence that these poison pills adopted in response to shareholder activism
are a successful defense against activist demand. I observe that the likelihood of takeover or CEO
turnover is no lower in cases where companies adopted a poison pill compared to ones where they
did not.
This study contributes to our understanding of defense mechanisms and their role in
shareholder activism. There is a large stream of literature on takeover defenses that examines the
effects of defense measures on firm performance, valuation, and the probability of takeover. There
is also an emerging stream of research on shareholder activism that studies the determinants and
consequences of this new phenomenon. However, these studies have neglected to consider the
effects of defense measures on shareholder activism – and especially their effects on activist target
selection. Brav et al. (2008) show that poor corporate governance is associated with a higher
likelihood of being targeted for activism, but they do not examine which particular defenses matter
most and whether the presence or absence of defense measures affects the interaction between the

9
target firms and activists. My results show that the effect of a poison pill differs from those of dual-
class shares and a staggered board.3
This study also contributes to the literature on the effect of institutional investors’ direct
intervention on corporate governance and firm outcomes (Edmans, 2013). It provides evidence
that shareholder activism can function to reduce friction in the market for corporate control
associated with takeover defenses that might otherwise entrench managers and boards altogether.
While hostile takeovers have become rare due to the availability of poison pills and other defensive
measures, activism has become a new force in the market for corporate control. Activists target
firms that are undervalued, in part because their management is protected by the defense measures
in place, and attempt to promote changes in the defense measures themselves and push for sale of
the targets. Activism thus potentially improves corporate governance of the target firm and opens
up the possibility of improving the market for corporate control.
The rest of the essay proceeds as follows: Section 2.2 describes the prior literature on
shareholder activism and takeover defenses. Section 2.3 describes the data and offers descriptive
statistics. Section 2.4 examines the role of takeover defenses on activist target selection. Section
2.5 examines the relation between defense measures and activist demands and outcomes. Section
2.6 examines the board adoption of a poison pill in response to activism and the effectiveness of
adopting a poison pill as a defensive strategy. Section 2.7 concludes the analysis.
2.2. Prior research and institutional setting
2.2.1. Shareholder activism
!!!!!!!!!!!!!!!!!!!!!!!!!!!!!!!!!!!!!!!!!!!!!!!!!!!!!!!!3 Boyson and Pichler (2014) examine poison pill adoptions during activism, but do not examine a) the effect of having a poison pill on target selection or b) the two other defense measures covered in this study.

10
It is common these days to see headlines about companies being targeted by shareholder
activists. Activists, mainly driven by hedge funds, buy stakes in firms that they deem undervalued
and push for improvement in performance and governance. Gantchev (2013) describes shareholder
activism as a sequential process. Activists initially attempt friendly negotiations with management,
as a hostile campaign is costly. However, when they cannot reach an agreement, they often end up
in a proxy fight, in which the activists seek board representation to pass their proposals. In such
circumstances, it is crucial for the activists to convince other shareholders to side with them.
Many recent studies have examined the new phenomenon of hedge fund activism. Brav et
al. (2008), Klein and Zur (2009), and Gow et al. (2014) identify several firm characteristics that
are associated with the likelihood of being targeted for activism. In general, smaller firms (small
market capitalization), undervalued firms (high book-to-market), poorly performing firms (low
growth or low returns) and firms in which leverage or dividend payout is low are associated with
a higher likelihood of being targeted for activism (Brav et al., 2010). The present analysis
hypothesizes that another factor affecting this likelihood is the presence of one of the three defense
measures.
Prior studies have generally found positive consequences of shareholder activism. Brav et
al. (2008), Klein and Zur (2009), and Gow et al. (2014) find a positive and significant stock market
reaction to announcements of activism campaigns. Studies have also investigated reasons for these
positive returns. Klein and Zur (2009) find that activists’ ability to transfer wealth from debtholders
to stockholders generates positive returns as activists demand reductions in a target firm’s cash
holdings and increases in its leverage. Bebchuk et al. (2013) also find increases in operating
performance, such as return on assets, both in the short and long run. Greenwood and Schor (2009)
emphasize activists’ ability to force target firms into takeovers as a source of shareholder gains. I

11
contribute to the literature by providing evidence that activists also bring changes to those firms
with defense measures, such as the removal of the defense measures themselves and a drive
towards more takeover activities.
2.2.2. Takeover defenses
Takeover defenses have been developed to protect companies from outside pressures,
especially hostile takeover attempts by corporate raiders. Examples of takeover defenses include
a dual-class capital structure, a staggered board, and a poison pill.
2.2.2.1. Dual-Class shares
A dual-class capital structure is a type of stock structure that involves two or more classes
of stocks, such as Class A and B shares. These different classes of stocks have different voting
rights; for example, the superior class would have ten votes per share, while the inferior class has
one vote per share. The superior class with higher voting rights is owned by management or
management-friendly investors, and is usually not publicly traded (Gompers et al., 2010). This
structure limits the level of influence the non-management shareholders can have on the
management or insiders. Gompers et al. (2010) find that insiders on average hold 60% of the voting
rights compared to 40% of the cash-flow rights in dual-class firms. Even though the management
does not actually own a majority of shares, it can still hold voting control with a majority of voting
rights. This arrangement effectively prevents the management from losing any kind of proxy
contest. Therefore, a corporate raider or even an activist would be reluctant to target these firms.
The New York Stock Exchange (NYSE) and NASDAQ do not allow a dual-class capital structure
to be introduced at a post-IPO stage.

12
2.2.2.2. Staggered Board
A staggered board is a type of board structure in which only a fraction (usually a third) of
directors are elected each year. For example, if a board consists of nine directors, three directors
would be elected for a term of three years. When a staggered board is in place, it takes at least two
years for any hostile bidder or dissident to control the board. This structure thus effectively
prevents a potential acquirer from taking control of the board and delays takeover attempts.
Bebchuk et al. (2002) point out that neither a hostile bidder nor an activist has ever won two
successive elections in a staggered board.
While it is not impossible, it is difficult to introduce a staggered board following a
company’s IPO. Doing so requires shareholder approval, and it is highly likely that institutional
investors would disapprove the proposal. ISS and Glass Lewis also oppose proposals to stagger a
board, while they support proposals to de-stagger a board.
2.2.2.3. Poison Pill
A poison pill, more formally called a shareholder rights plan, gives all current shareholders
with the exception of a potential acquirer the right to buy an extra share at a discounted price. A
poison pill is triggered when the potential acquirer holds more than the threshold level of stocks
in a firm (typically 15-20%). It prevents a potential acquirer, or a corporate raider, from
accumulating more than a threshold ownership level, since holding more than this level would
dilute its ownership, typically by half. Historically, a poison pill has been the most powerful tool
against any hostile takeover attempt (Catan and Kahan, 2015).

13
A special kind of poison pill has been developed recently in response to the popularity of
hedge fund activism– the 13D poison pill. Such a poison pill is triggered if an activist shareholder,
who files a Schedule 13D with the SEC, gains more than 10 percent ownership, while a passive
shareholder, who files a Schedule 13G, can hold up to 20 percent before the poison pill is
triggered.4 The 13D pill is specifically designed to limit activists’ influence, since their maximum
ownership is limited to 10 percent. In this study, I examine whether these poison pills are effective
against activists.
Unlike a dual-class capital structure or a staggered board structure, a poison pill requires
minimal effort to adopt or repeal. It does not need approval from shareholders; it can be instituted
at a board meeting. More and more firms, therefore, are repealing their poison pill and instead
waiting until a poison pill becomes necessary to adopt one, commonly called a “shadow pill”
(Coates, 2000).
2.2.2.4. Takeover defenses and consequences
Ambrose and Megginson (1992) and Bebchuk et al. (2002) find that poison pills and
staggered boards reduce the likelihood of a takeover. These defenses can be beneficial for
shareholders if the board has adopted them to increase its bargaining power with potential
acquirers, which would increase the control premium received by shareholders.
However, they can also be harmful to shareholders if they have been adopted to personally
benefit the board or specific managers—for example, by allowing them to retain their positions as
top executives (Ruback, 1988). Prior research suggests that these takeover defense measures are
!!!!!!!!!!!!!!!!!!!!!!!!!!!!!!!!!!!!!!!!!!!!!!!!!!!!!!!!4 Under Rule 13D, an investor with ownership of stock over 5% of the company needs to file a Schedule 13D with the SEC. The information has to be disclosed within 10 days of the transaction. Schedule 13G, which is shorter than Schedule 13D, can be used if an investor’s ownership of stock is over 5% of the company, but the owner does not intend to actively get involved with the management.

14
indeed associated with management entrenchment and firm undervaluation. Malatesta and
Walking (1988) and Ryangaert (1988) find negative market reactions to announcements of poison
pills, which the authors attribute primarily to management entrenchment.5 Bebchuk and Cohen
(2005) and Cohen and Wang (2013) find lower value associated with staggered boards while
Masulis et al. (2007) find more value-destroying acquisitions by firms with staggered boards.6
Gompers et al. (2010) find that firm value decreases with higher voting rights held by insiders in
dual-class firms. While existing research has mainly focused on the effect of defense measures on
takeover activities and valuation outcomes, this study addresses the interplay between defense
measures and shareholder activism, which can potentially affect each other.
Prior research has developed measures that, using multiple takeover defense provisions,
can comprehensively capture the quality of corporate governance. Gompers et al. (2003) created
the shareholder rights index, called the G-Index, based on 24 provisions. Bebchuk et al. (2009)
created a sub-index of the G-Index, called the Entrenchment Index (E-Index), focusing on (a)
supermajority voting requirements for charters, bylaws, and mergers, (b) classified boards, (c)
poison pills, and (d) golden parachutes. However, these indices do not capture the effects of
individual measures on the quality of corporate governance, and there is no single “best” measure
of corporate governance since firms’ circumstances vary (Bhagat et al., 2008). For this reason,
Cremers and Ferrell (2014) look at the effects of individual takeover defenses in their examination
of firm values.
!!!!!!!!!!!!!!!!!!!!!!!!!!!!!!!!!!!!!!!!!!!!!!!!!!!!!!!!5 Brickley et al. (1994), however, show that "the average stock-market reaction to announcements of poison pills is positive when the board has a majority of outside directors and negative when it does not.” Comment and Schwert (1995) also find that poison pills increase takeover premiums without decreasing takeover likelihood. 6 On the other hand, other papers have found opposite results. Faleye (2007), for example, found higher bid premiums for firms with staggered boards and firms with poison pills.

15
Brav et al. (2008) include the G-index in one of their models of activist target selection so
as to see how a firm’s governance characteristics are associated with the likelihood of activism.
While they find that a higher G-index (that is, lower governance quality) is associated with a higher
likelihood of activism, the model sheds no light on which defenses matter in which direction in
the context of shareholder activism. Instead of looking at an aggregated measure, I focus separately
on the three specific provisions—dual-class capital structure, staggered board, and poison pill—
which are most relevant to boards and activists during an activism campaign.7
2.2.3. Takeover defenses and shareholder activism
Activists investigate potential target companies and assess the probability of bringing about
positive changes given the potential opposition from management, the board, and other investors.
After careful assessment, they will engage in a campaign only if the expected returns outweigh the
expected costs. Takeover defenses can have two opposing effects on this decision-making process.
On one hand, as prior literature suggests, firms protected by takeover defenses are likely to be the
very firms that are undervalued, and are thus more likely to be targeted by activists. If defense
measures are a signal of entrenched management or weak governance, activists may be able to add
value by negotiating changes such as replacing management or removing the defense mechanisms.
Furthermore, the presence of takeover defenses can be a useful public relations tool against
management. Proxy advisory services such as Institutional Shareholder Services (ISS) and Glass-
!!!!!!!!!!!!!!!!!!!!!!!!!!!!!!!!!!!!!!!!!!!!!!!!!!!!!!!!7 There also exist shareholder-friendly mechanisms that can help activists. The ability to call a special meeting can be used by activists to initiate an activism campaign at any time they want instead of waiting for a regular shareholder meeting, which only happens once a year. Action by written consent can be used by activists to pass some shareholder proposals with a certain level of shareholder consent without holding a shareholder meeting. These mechanisms enable an activist to bring a surprise attack against the target firm. However, because I have found their effects to be insignificant, I do not discuss or report their results.

16
Lewis (GL) are generally against takeover defenses, and powerful takeover defense measures such
as poison pills are often considered harmful to shareholders.
On the other hand, defense measures can deter activist approaches if they reduce activists’
expected returns by increasing the cost and decreasing the probability of success. Activists need
to invest resources and energy into each campaign when faced with opposition from management
and the board (Gantchev, 2013), and if the probability of success decreases due to takeover
defenses, their expected costs will be higher and expected return lower. Thus, just as takeover
defense measures deter takeover attempts, they can also discourage attempts to engage in activism
campaigns.
Each of the three takeover defense measures examined in this study has been effective
against hostile takeover attempts by corporate raiders in different ways. However, despite their
efficacy in preventing hostile takeovers, the effectiveness of the defense measures in the context
of shareholder activism may differ. What might have been a powerful defense against corporate
raiders may not be a strong defense against shareholder activists. With a dual-class capital
structure, management or management-friendly shareholders often own the majority of voting
rights. For this reason, if management or the board disagrees with an activist's thesis and plan, it
would be practically impossible for the activist to win a proxy fight to force changes on
management. This means that a dual-class voting structure is ex-ante likely to preclude an activist
fund from engaging in a campaign, making it a powerful defense against shareholder activism.
A staggered board can also be an effective defense against shareholder activism. On a
staggered board, only one-third of the directors are replaced in each election. This means that even
the best possible outcome—winning one-third of the seats—would not give the activists enough
leverage to take control of the firm. Also, a staggered board makes it harder for activists to replace

17
the directors they consider the weakest or poorest-performing, since those directors may not be up
for election that year. If the most talented and best-performing directors are up for election, it
would be much more difficult to convince other shareholders to vote for the activists’ candidates.
It is therefore more difficult for an activist to make a credible threat to gain control of the board.
Such a threat can itself be a powerful tool for an activist, as illustrated by Starboard’s campaign
against Darden Restaurants. Starboard waged a proxy fight against Darden and successfully
replaced the entire board, winning all Darden’s board seats. Had a staggered board been in place,
Starboard would have been unable to make this change in a single year, and may not have even
opted to initiate the campaign.
A poison pill, on the other hand, may not be an effective defense against shareholder
activism. While a poison pill can limit the percentage of shares an activist can own in a target firm,
it does not prevent an activist from winning a proxy contest. When management or the board
disagrees with the activist's agenda, activists can convince other shareholders to side with them to
win a proxy contest. The possibility of gaining support from other shareholders can therefore limit
the effectiveness of a poison pill as a defense.
Overall, while all three measures are likely to be an indicator to an activist of potential
value to be unlocked, the effectiveness of each defense measure is likely to be differentially
associated with the probability that activists will achieve their objectives. This situation raises the
empirical question of how each of the takeover defenses is differentially associated with the
likelihood of activism. I examine the following aspects of this question about activism and defense
measures. First, what is the effect of each takeover defense on target selection? Second, what is
the effect of takeover defenses on activist demands? Third, what is the effect of shareholder
activism on a company’s existing takeover defenses and takeover probabilities? And fourth, do

18
companies adopt a poison pill in response to activism, and if so, is it an effective defense against
activists?
2.3. Data and descriptive statistics
2.3.1. Activism events
My data on shareholder activism come from the FactSet SharkWatch database, which
contains information on activism events—primarily in the United States—including the types of
demand the activists made and whether they resulted in success. I include all publicly disclosed
activism events that started in the period of 2006–2014 in the United States. I exclude corporate
control contests initiated by another corporation and target firms that are investment trusts or
mutual funds; I also exclude activism consisting only of routine shareholder proposals submitted
under Rule 14a-8. The resulting sample consists of 1,845 activism events (see Table 2.1), primarily
conducted by hedge fund activists or other major shareholders (i.e., Schedule 13D filers).
Panel A of Table 2.1 presents the number of activism events by year. While there are more
activism events during the period of financial crisis, there is a consistent stream of events
throughout the sample period (see Figure 2.1). Panel B of Table 2.1 presents the number of
activism events by industry. 13% of the target firms were from the business-to-business service
industry and 8% and 7% of the targets were from the banking and electronic equipment industry,
respectively. The proportion is consistent with the percentage of firms found in each industry for
the population of listed firms in the United States. Panel C of Table 2.1 presents the number of
activism events by state of incorporation. The largest percentage (i.e., 62%) of target firms were
incorporated in Delaware, consistent with the percentage of firms incorporated in Delaware in the
population.

19
TABLE 2.1. Shareholder activism events
Panel A. Activism events by year This panel presents the number of activism events by year (Source: FactSet SharkWatch).
Year Events Percent 2006 258 14% 2007 305 17% 2008 252 14% 2009 133 7% 2010 174 9% 2011 167 9% 2012 205 11% 2013 182 10% 2014 169 9% Total 1,845 100%
Panel B. Activism events by industry This panel presents the number of activism events by Fama-French 48 industry (Source: FactSet SharkWatch).
Industry Events Percent Business Services 231 13%
Banking 145 8% Electronic Equipment 121 7%
Retail 119 6% Pharmaceutical Products 116 6%
Communication 81 4% Computers 75 4%
Restaurants, Hotels, Motels 75 4% Petroleum and Natural Gas 73 4%
Trading 68 4% Medical Equipment 48 3%
Machinery 45 2% Personal Services 44 2% Consumer Goods 42 2%
Healthcare 39 2% Insurance 38 2% Wholesale 33 2%
Transportation 32 2% Chemicals 29 2%
Entertainment 26 1% Others 365 20% Total 1,845 100%

20
TABLE 2.1. Shareholder activism events (Continued)
Panel C. Activism events by state This panel presents the number of activism events by state of incorporation (Source: FactSet SharkWatch).
State of incorporation Events Percent Delaware 1144 62% Maryland 79 4% New York 50 3% California 45 2%
Ohio 44 2% Pennsylvania 41 2%
Indiana 40 2% Nevada 37 2%
Washington 36 2% Minnesota 36 2%
Florida 33 2% Massachusetts 28 2%
New Jersey 25 1% Virginia 22 1%
Wisconsin 19 1% Texas 19 1% Others 147 8% Total 1,845 100%
FIGURE 2.1. Activism events by year

21
2.3.2. Defense measures
My data on defense measures come from the FactSet SharkRepellent database, which
contains information on each firm’s use of such measures as poison pills, staggered boards, and
unequal voting structures. It also provides a detailed history of charter and bylaw changes and
poison pill replacements and amendments.
Descriptive statistics on takeover defense measures by year (see Panel A of Table 2.2)
show that two of the three defense measures that I focus on have been widely used: from 2006 to
2013, 52.5% of the firms in the sample had a staggered board and 23.0% had a poison pill. In
contrast, only 8.2% of the firms had a multi-class capital structure. Figure 2.2 shows a decreasing
trend of having a staggered board or a poison pill over the sample period; while 58.1% of the firms
had a staggered board and 32.6% had a poison pill in 2006, those percentages had dropped to
42.6% and 15.6%, respectively, by 2013.8 Panels B and C of Table 2.2 look at the activism and
non-activism samples, separately. Univariately, we see that fewer companies in the activism
sample have a staggered board whereas more companies in the activism sample have a poison pill
(See Figure 2.2).
2.3.3. Other variables
Consistent with prior literature (Brav et al., 2008; Gow et al., 2014), I control for the
following variables when examining the relation between takeover defenses and shareholder
activism: firm performance (Size-adj. return, Return on assets, Sales growth), firm size (Market
value), book-to-market ratio (Book-to-market), leverage (Leverage), cash holdings (Cash),
!!!!!!!!!!!!!!!!!!!!!!!!!!!!!!!!!!!!!!!!!!!!!!!!!!!!!!!!8 In the meantime, a Factiva search provides anecdotal evidence for the increasing use of poison pill against activism campaigns. While search result numbers decrease over time for the keyword “poison pill” by itself, the combined results for the keywords “poison pill” and “activism” increase year by year.

22
TABLE 2.2. Takeover defense measures
This table presents the number of firms with each takeover defense measure in place by year (source: FactSet SharkRepellent). The sample in Panel A contains all firm-years between 2006 and 2013. The sample in Panel B contains all firm-years with activism. The sample in Panel C contains all firm-years without activism.
Panel A: All firm-years
Dual-class Staggered board Poison pill Year Percent Count Percent Count Percent Count 2006 7.7% 258 58.2% 2,272 32.6% 1,273 2007 7.5% 244 57.2% 2,169 28.9% 1,097 2008 7.8% 245 56.2% 2,018 26.5% 953 2009 7.9% 244 55.3% 1,923 23.8% 828 2010 8.2% 254 52.4% 1,778 21.2% 720 2011 8.6% 266 50.1% 1,666 19.6% 653 2012 8.8% 272 46.4% 1,518 17.6% 575 2013 9.1% 293 42.2% 1,400 15.7% 522 Total 8.2% 2,076 52.5% 14,744 23.6% 6,621
Panel B: Activism sample
Dual-class Staggered board Poison pill Year Percent Count Percent Count Percent Count 2006 6.2% 13 56.3% 121 44.2% 95 2007 5.5% 9 58.0% 98 36.1% 61 2008 7.4% 7 53.6% 52 39.2% 38 2009 7.6% 8 56.9% 62 24.8% 27 2010 1.8% 2 43.8% 49 36.6% 41 2011 8.0% 12 38.8% 57 21.1% 31 2012 4.3% 6 40.3% 56 20.9% 29 2013 8.5% 11 46.2% 61 19.7% 26 Total 6.2% 68 49.6% 556 31.1% 348
Panel C: Non-activism sample
Dual-class Staggered board Poison pill Year Percent Count Percent Count Percent Count 2006 7.8% 245 58.3% 2,151 31.9% 1,178 2007 7.6% 235 57.2% 2,071 28.6% 1,036 2008 7.8% 238 56.3% 1,966 26.2% 915 2009 7.9% 236 55.2% 1,861 23.8% 801 2010 8.5% 252 52.7% 1,729 20.7% 679 2011 8.7% 254 50.6% 1,609 19.6% 622 2012 9.0% 266 46.6% 1,462 17.4% 546 2013 9.1% 282 42.0% 1,339 15.6% 496 Total 8.3% 2,008 52.6% 14,188 23.3% 6,273

23
dividend payout ratio (Dividend), the number of analysts covering the firm (Analyst), institutional
holdings (Institutional holdings), and history of the firm (Firm age). I also control for governance
characteristics such as the board size (Board size) and the percentage of outside directors (Outside
directors).
FIGURE 2.2. Takeover defenses by year
2.4. Takeover defenses and activist target selection
2.4.1. Empirical analysis
To examine how each of the takeover defense measures in place is differentially associated
with the probability of being targeted for activism, I estimate the following specification for all
firm-years in my sample:
Pr(Activism) = F(Dual-class, Staggered board, Poison pill, Controls, Year fixed effects, Industry fixed effects), (1)

24
where the dependent variable, Activism, equals one if a firm was the target of an activist campaign
during the year, and the main variables, Dual-class, Staggered board, and Poison pill, equal one
if a firm had each defense measure in place at the beginning of each year.
Panel A of Table 2.3 presents the results from estimating Equation (1) as a linear
probability model, in which the sample is all firms listed on both CRSP and Compustat between
2006 and 2014. The findings are similar when I run logistic regression models.9 The dependent
variable measures whether an activist targeted a given firm during each fiscal year. All control
variables are measured at the fiscal year-end of the previous year to control for the effects of
financial position, operating performance, and other governance characteristics in the previous
year. The status of each takeover defense is also measured at the fiscal year-end of the previous
year (i.e., at the beginning of the year). For example, if an activist filed a Schedule 13D on May
12, 2012, I measure whether each takeover defense was in place as of December 31, 2011. Because
a poison pill can be adopted without shareholder approval, boards can adopt one whenever there
are suspicious stock-trading activities. If a board suspects that an activist is approaching the firm,
it might preemptively adopt a poison pill, which can result in reverse causality; that is, adoption
of a poison pill would not cause activism, but rather activism would cause the adoption of a poison
pill. Therefore, I exclude observations in which a poison pill was adopted within the three months
preceding the announcement of an activism event.
Columns (1) through (3) separately examine the effect of having a dual-class capital
structure (Dual-class), a staggered board structure (Staggered board), and a poison pill (Poison
pill), respectively, on the probability of being targeted for activism (Activism). The negative
coefficients for Dual-class in Column (1) and Staggered board in Column (2) imply a decrease of
!!!!!!!!!!!!!!!!!!!!!!!!!!!!!!!!!!!!!!!!!!!!!!!!!!!!!!!!9 For ease of interpretation of the regression results, I report only the results from using linear probability models.

25
1.3 and 0.6 percentage points, respectively, in the likelihood that a firm with those defenses will
be targeted. On the other hand, the positive coefficient for Poison pill in Column (3) implies an
increase of 1.3 percentage points in the likelihood that a firm with a poison pill will be targeted for
activism.
Column (4) includes all three defense measures in one regression in order to control for the
effect of each takeover defense on the others. The effects are consistent with those reported in
Columns (1) through (3). Given that about 4.5% of the sample is targeted for activism, the
existence of defense measures is not only statistically but also economically significantly
associated with the probability of being targeted for shareholder activism. The estimates in Column
(4) suggest that having a dual-class capital structure or a staggered board is associated with a 30%
decrease or a 13% decrease in the likelihood of being targeted for activism, whereas having a
poison pill is associated with a 30% increase in the likelihood of being targeted for activism. These
results suggest that the three defense measures have differential effectiveness on shareholder
activism.
I also test whether the effectiveness estimates of the defense mechanisms are statistically
distinguishable from each other. The estimate for Poison pill is statistically different from that for
Dual-class as well as from Staggered board (F-stat of 16.43 and 15.39, respectively). However,
while a difference in the coefficients is visible (0.57) between Dual-class and Staggered board,
they are not statistically distinguishable from each other (F-stat = 0.86, p-value = 0.35).
Beyond the potential ineffectiveness of the poison pill as a defense device against activists,
plausible explanations for the attraction effect of poison pills include its signaling of managerial
entrenchment and its usefulness as a public relations tool against management during the activism

26
TABLE 2.3. Activist target selection
Panel A: Baseline regressions This panel presents linear probabilities model results where the dependent variable is an indicator for being targeted for activism. The sample includes firm-years with and without activism. I calculate Analyst, the number of analyst forecasts for each firm-year, using data from I/B/E/S. I derive the proportion of the firm’s outstanding stock held by institutions (Institution) using data from WhaleWisdom. Data for three-month stock market performance (Size-adj. return) come from CRSP. The following variables come from Compustat: Market value, the logged value of market capitalization; Book-to-market, market capitalization divided by the book value of common equity; Leverage, the sum of long-term debt and current liabilities divided by the sum of long-term debt, current liabilities, and the book value of common equity; Payout, the ratio of the sum of dividends and repurchases to earnings before interest, tax, depreciation, and amortization (EBITDA); Return on assets, EBITDA divided by the lagged total assets; and Sales growth, sales divided by lagged sales. I count the number of years the firm has been on CRSP for Firm age. From BoardEx and Equilar, I obtain the following variables: Board size, the number of directors on the board, and Outside percent, the percentage of outside directors. Values in parentheses are standard errors clustered by firm. *** (**, *) indicates significance at the 1% (5%, 10%) level.
(1) Activism
(2) Activism
(3) Activism
(4) Activism
(5) Activism
Dual-class -1.336** -1.338** -1.331** (0.539) (0.536) (0.536) Staggered board -0.592* -0.768** -0.760** (0.309) (0.309) (0.309) Poison pill 1.274*** 1.351*** 1.107*** (0.412) (0.414) (0.425) Pill adopted < 1 year 3.399** (1.483) Cash 2.007* 2.050* 2.039* 2.044* 2.024* (1.069) (1.066) (1.066) (1.067) (1.063) Analyst 0.081** 0.083** 0.083** 0.079** 0.081** (0.039) (0.039) (0.039) (0.039) (0.039) Institutional holdings 2.516*** 2.646*** 2.451*** 2.433*** 2.442*** (0.716) (0.716) (0.722) (0.718) (0.716) Size-adj. return -1.947*** -1.959*** -1.974*** -1.998*** -2.013*** (0.623) (0.623) (0.630) (0.629) (0.631) Market value -1.766*** -1.854*** -1.726*** -1.713*** -1.806*** (0.448) (0.445) (0.447) (0.446) (0.445) Book-to-market 2.088*** 2.048*** 2.046*** 2.052*** 1.927*** (0.432) (0.432) (0.430) (0.430) (0.417) Leverage 1.609** 1.550** 1.550** 1.539** 1.534** (0.627) (0.629) (0.627) (0.628) (0.624) Dividend -0.969 -0.934 -0.851 -0.863 -0.856 (0.737) (0.735) (0.735) (0.737) (0.734) Return on assets -0.653 -0.736 -0.681 -0.630 -0.311 (0.921) (0.923) (0.923) (0.921) (0.835) Sales growth -0.216 -0.175 -0.159 -0.167 -0.119 (0.428) (0.428) (0.428) (0.428) (0.413) Firm age 0.056*** 0.054*** 0.054*** 0.050*** 0.051*** (0.012) (0.012) (0.012) (0.012) (0.012)

27
TABLE 2.3. Activist target selection (Continued)
Board size -0.047 -0.051 -0.057 -0.040 -0.027 (0.081) (0.080) (0.080) (0.080) (0.087) Outside directors 5.411*** 6.111*** 5.687*** 5.219*** 5.255*** (1.695) (1.696) (1.693) (1.695) (1.790) Year fixed effects Yes Yes Yes Yes Yes Industry fixed effects Yes Yes Yes Yes Yes Adj. R2 0.016 0.016 0.016 0.017 0.017 Num. obs. 22,295 22,295 22,295 22,295 22,295
F-Test of Column (4) F-stat P-value Dual-class = Poison pill 16.43 0.000*** Staggered board = Poison pill 15.39 0.000*** Dual-class = Staggered board 0.86 0.354
Panel B: Propensity score matching This panel presents results from analysis using propensity score matching. Coefficients represent the estimated effect on Activism, an indicator for shareholder activism during the year. One control firm was selected for each treated firm, using propensity scores in Column (1), while multiple control firms within a caliper of 0.0001 could be selected for each treatment firm via radius matching in Column (2). Propensity scores are estimated using a logistic regression in which the dependent variable is an indicator for takeover defenses and the independent variables are the controls reported in Panel A. *** (**, *) indicates significance at the 1% (5%, 10%) level. Standard errors are in parentheses.
(1) (2) Activism
(radius matching: caliper = 0.0001)
Activism
Dual-class -0.988 -1.005* (0.741) (0.565)
Num. obs. (Treatment) 1,923 1,509 Staggered board -0.973*** -1.045 ***
(0.403) (0.337) Num. obs. (Treatment) 10,998 10,180
Poison pill 1.194*** 1.669*** (0.498) (0.415)
Num. obs. (Treatment) 5,443 4,918

28
TABLE 2.3. Activist target selection (Continued)
Panel C: Defense measures and size This panel presents a linear regression in which the dependent variable is an indicator for being targeted for activism. The sample includes firm-years with and without activism. Market value is the logged value of market capitalization. Other controls include the control variables reported in Panel A. Values in parentheses are standard errors clustered by firm. *** (**, *) indicates significance at the 1% (5%, 10%) level.
(1) Activism
(2) Activism
(3) Activism
(4) Activism
Dual-class -3.847 -3.348 (3.183) (3.118) Staggered board 2.875** 2.336* (1.379) (1.370) Poison pill 3.886** 3.306* (1.731) (1.730) Market value × Dual-class 0.847 0.687 (1.062) (1.041) Market value × Staggered board -1.221*** -1.093** (0.455) (0.452) Market value × Poison pill -0.935 -0.699 (0.576) (0.576) Market value -1.932*** -1.419*** -1.563*** -1.212** (0.444) (0.503) (0.469) (0.516) Other controls Yes Yes Yes Yes Year fixed effects Yes Yes Yes Yes Industry fixed effects Yes Yes Yes Yes Adj. R2 0.016 0.016 0.016 0.017 Num. obs. 22,295 22,295 22,295 22,295
campaign, especially given the current trend of repealing poison pills. Most companies with poison
pills have been rescinding and putting them on the shelf (Coates, 2000), as we have seen in Figure
2. Unlike a dual-class structure or a staggered board, a poison pill is easily repealed, as doing so
requires only board approval. Therefore, the presence of a poison pill is entirely dependent on the
willingness of the board. Some boards, however, have not caught up on this trend and still retain
poison pills from years ago. Activists are in the business of shaking up weak boards and correcting
poor performance and/or undervaluation rooted in board and management entrenchment; a legacy
poison pill gives a signal to activists that they might have found a good target.

29
Moreover, a poison pill can be a good public relations tool against the target firm. A poison
pill is often portrayed as harmful to shareholders, and proxy advisory services such as Institutional
Shareholder Services (ISS) and Glass-Lewis (GL) generally oppose the measure, especially when
it lasts for more than a year without shareholder approval. Therefore, the presence of a poison pill
can help activists convince other investors to side with them against entrenched (and presumably
underperforming) management if it comes to a proxy fight.
Additionally, the recent adoption of a poison pill can signal to activists that the firm may
recently have been or is likely to be a takeover target and that there is an opportunity to push it
into a takeover deal. As stated above, many companies still have a poison pill “on the shelf,” which
means that their boards can adopt it in the event of a threat. Therefore, if a board has recently
adopted a poison pill, it probably experienced—or at least sensed—a takeover threat. I examine
whether recently adopted poison pills are associated with the probability of activism because there
is a high potential for future takeover attempts and management resistance to them. In Column (5)
of Panel A of Table 2.3, I include an indicator for a poison pill adopted less than a year before the
year-end. I find that the coefficient for Pill adopted < 1 year is positive and significant, suggesting
that activists are more likely to target firms that have adopted a poison pill most recently. This, in
turn, implies that activists might believe that other investors are interested in a takeover and
therefore might intervene in order to take advantage of the opportunity.10
The coefficients for the control variables are consistent with the results found in prior
studies. Higher cash holdings, a higher number of analysts covering the firm, and higher
institutional ownership are associated with a higher likelihood of activism, while higher market
value and stock market performance are associated with a lower likelihood of activism.
!!!!!!!!!!!!!!!!!!!!!!!!!!!!!!!!!!!!!!!!!!!!!!!!!!!!!!!!10 As discussed earlier, in order to control for a potential threat of activism, I do not include any poison pill that was adopted within three months prior to the activism announcement.

30
I use a propensity score matching procedure to ensure that my results are not driven by
significant differences between the firms with and without defense measures. Overall, the results
in Panel B of Table 2.3 show once again that while a poison pill is associated with a higher
likelihood of being targeted for activism, a staggered board is associated with a lower likelihood.
In order to achieve better covariate balance, I impose a caliper (radius) of 0.0001 in Column (2);
the differences in the control variables between the treatment and control samples are insignificant.
The results are consistent, and I additionally find that a dual-class structure is also associated with
a lower likelihood of being targeted.
2.4.2. Cross-sectional variation: size
I next examine the circumstances under which takeover defenses matter in activists’ target
selection. The importance of takeover defenses can vary depending on firm characteristics. I
therefore use a cross-sectional test to examine the circumstances under which a given takeover
defense would matter more in the context of target selection and in which direction.
I specifically investigate whether larger firms with takeover defenses are less likely than
smaller firms with takeover defenses to be targeted for activism. An activist would have to acquire
a large number of shares to become a threat to management. Activists hold onto shares for 2-3
years on average (Gow et al., 2014b), as it is very costly for them to hold a large amount of shares
in one firm for a longer time. Holding onto shares is especially costly in the case of target firms
with staggered boards, because it generally takes a long time for activists to gain a significant
number of board seats. It costs them even more to hold onto significant ownership of stocks when
the target firm is large. Therefore, the larger the firm, the more powerful the defense effect of a
staggered board and the less likely it is to become a target. Consistent with this hypothesis, Column

31
(1) and Column (4) of Panel C of Table 2.3 show that the coefficient for the interaction between
Market value and Staggered board is negative and significant. The coefficient for Market value is
negative and significant, suggesting that the size of the firm is negatively associated with the
likelihood of activism.11 I do not, however, find significant interaction effects between Market
value and Dual-class or Poison pill.
2.5. Takeover defenses and activist demand and outcomes
2.5.1. Activist demand
Having established the circumstances under which activists are likely to target companies,
I now examine what types of demand activists are most likely to make when target firms have
defense measures in place. In general, takeover defenses block the market for corporate control;
firms that otherwise would be targets for takeover due to poor management performance are
protected and the management is more likely to be entrenched. Firms with strong defense measures
are therefore more likely than firms with weaker defense measures to receive demands to remove
them so as to improve governance of the target and also improve its performance.
If takeover defenses have been blocking the functioning of the market for corporate control,
activists would not only demand removal of those defenses, but also directly demand the sale of
the target. Indeed, Karpoff et al. (2015) find that staggered boards and unequal voting structures
do deter takeovers, though they find mixed evidence for poison pills. It makes sense, then, for
activists to demand a sale of the company, as they can then obtain their returns more quickly and
reliably. Therefore, I predict that activists are more likely to demand that a target firm seek a
potential acquirer if the firm has takeover defenses in place than otherwise.
!!!!!!!!!!!!!!!!!!!!!!!!!!!!!!!!!!!!!!!!!!!!!!!!!!!!!!!!11 Note that the positive and significant coefficients for Staggered board are due to the existence of interaction terms. The mean value of Market value is 2.8, so the average effect of Staggered board is still negative and significant.

32
I focus on the sample of activist target firms and examine what kinds of activist demand
and future outcomes are associated with defense mechanisms in place prior to an activism
campaign. The FactSet SharkWatch database provides data on the types of demand activists make
for the majority of activism campaigns as well as whether those demands were successfully
implemented. Table 2.4 describes the types of demands for the sample firms. The most popular
demand is board representation (Board seat), followed by looking for opportunities to sell the
target (Sale of target) and finding strategic alternatives12 (Strategic alternatives). The success rates
for Board seat, Strategic alternatives, and Sale of target are 64%, 38%, and 23%, respectively.
The rate of 23% represents a high degree of success, considering the low frequency of mergers in
a given year.
TABLE 2.4. Activist demands and success rates This table presents the types of demand activists have made for 1,354 events (source: FactSet SharkWatch). Multiple demands can be made for each activism event. Demand / Success reports the probability of activist demand being met by the boards successfully.
(1) Demand (N)
(2) Demand (%)
(3) Success (N)
(4) Demand / Success
Board seat 724 53% 462 64% Sale of target 433 32% 98 23% Strategic alternatives 336 25% 127 38% Payout 226 17% 97 43% Other governance 200 15% 75 38% Divestiture 157 12% 68 43% Remove defense 146 11% 44 30% Compensation 133 10% 25 19% Block sale of target 106 8% 59 56% Add independent director 96 7% 40 42% Leverage 74 5% 15 20% Remove director 70 5% 26 37% Remove officer 67 5% 27 40% Block acquisition 15 1% 9 60% Total activism events 1,354
!!!!!!!!!!!!!!!!!!!!!!!!!!!!!!!!!!!!!!!!!!!!!!!!!!!!!!!!12 The term “strategic alternatives” is commonly used by activists to broadly demand mergers, acquisitions or divestitures.

33
TABLE 2.5. Defense measures and activist demands This table presents results from reverse regressions without an intercept, in which each takeover defense measure is regressed on types of activist demand. Dependent variables are indicators for existence of dual-class shares, staggered board, and poison pill, respectively, for columns (1) through (3).
(1) Dual-class
(2) Staggered board
(3) Poison pill
Remove defense 0.050* 0.253*** 0.334*** (0.027) (0.046) (0.043) Sale of target -0.000 0.057 0.132*** (0.016) (0.038) (0.035) Strategic alternatives 0.051*** 0.458*** 0.223*** (0.018) (0.048) (0.044) Block sale of target 0.112** 0.024 -0.048 (0.044) (0.062) (0.045) Block acquisition -0.089 -0.166 -0.041 (0.086) (0.135) (0.124) Divestiture -0.011 -0.020 0.063 (0.020) (0.046) (0.042) Board seat -0.041*** -0.010 0.004 (0.014) (0.030) (0.025) Payout 0.011 -0.027 -0.034 (0.021) (0.041) (0.032) Leverage -0.005 0.059 -0.001 (0.033) (0.067) (0.051) Remove director 0.060 -0.044 -0.040 (0.042) (0.072) (0.059) Add independent director 0.020 -0.045 0.071 (0.030) (0.054) (0.049) Remove officer -0.029 -0.057 0.028 (0.028) (0.069) (0.060) Compensation -0.025 0.059 0.049 (0.022) (0.053) (0.044) Other governance 0.025 -0.047 -0.032 (0.023) (0.041) (0.035) Adj. R2 0.081 0.476 0.352 Num. obs. 1,166 1,163 1,354
Activists tailor their demands to the target firm’s problems and consider whether existing
takeover defenses are at least one of the causes of undervaluation. Therefore, I examine how the
three takeover defenses, when already in place, relate to the types of demand activists make. Table
2.5 describes which of the demands is significantly associated with each defense measure. The

34
results from estimating the reverse regression without an intercept 13 show that all three defense
measures are significantly associated with demands for Removal of takeover defense and Strategic
alternatives. Furthermore, Poison pill is associated with demand for Sale of target, which suggests
that a poison pill might have been blocking the market for corporate control, leading to seek its
removal. Also, Dual class is negatively associated with demand for Board Seat, which implies that
dual-class structure is such a powerful mechanism that activists do not think it would be possible
to get a board seat. Overall, the results suggest that having defense mechanisms in place is
associated with defense-related and takeover-related demands.
2.5.2. Activism outcomes
2.5.2.1. Removal of defense measures
Having demanded removal of takeover defenses and sale of the target, do activists bring
about real changes? Here I examine whether takeover defenses are more likely to be removed and
whether the target is more likely to be taken over despite having defense measures following
activist intervention.
Table 2.6 presents results from estimating the following equation:
Pr(Removal of takeover defense in year t + 2) = F(Activism, Controls) (2)
where the dependent variable is an indicator for takeover defense measures in place in the two
years following the activism event (t + 2). The samples for each analysis are firms that have,
respectively, a dual-class capital structure, a staggered board, and a poison pill. Coefficients for
Activismt in Columns (1) and (2) are positive and significant, suggesting that activism is associated
with a higher likelihood of removal of staggered boards and poison pills.
!!!!!!!!!!!!!!!!!!!!!!!!!!!!!!!!!!!!!!!!!!!!!!!!!!!!!!!!13 I do not include an intercept so that all demands are present in the table of results.

35
TABLE 2.6. Probability of removing defense measures
This table examines the likelihood of rescinding each of the three takeover defenses. The sample consists of firms with dual-class shares, a staggered board, and a poison pill in year t for columns (1), (2) and (3), respectively. The dependent variables are indicators for the particular takeover defense in place as of year t + 2. Controls include the control variables reported in Panel A of Table 2.3. Values in parentheses are standard errors clustered by firm. *** (**, *) indicates significance at the 1% (5%, 10%) level.
(1)
Dual-class removalt+2
(2) Staggered board
removalt+2
(3) Poison pill removalt+2
Activism 0.042 0.113*** 0.055* (0.043) (0.024) (0.033) Sample Dual-classt Staggered boardt Poison pillt Controls Yes Yes Yes Industry fixed effects Yes Yes Yes Year fixed effects Yes Yes Yes Adj. R2 0.026 0.062 0.047 Num. obs. 1,572 10,436 4,963
Specifically, a staggered board is 11.3 percentage points more likely to be de-staggered and a
poison pill is 5.5 percentage points more likely to be repealed in the following two years after a
firm is the target of activism. In other words, shareholder activism is associated with removing the
takeover defenses that have been documented to entrench managers and thus is associated with
improvement in shareholder rights and positive changes in corporate governance. In contrast, a
dual-class structure seems rigid and is unlikely to change following activism campaigns.
2.5.2.2. Takeover probabilities
To test whether takeover probabilities increase after shareholder activism, I estimate the
following model:
Pr(Sale of target by year t + 2) = F(Activism, Dual-class, Staggered board, Poison pill, Controls) (3)
where the dependent variable is an indicator for sale of the target within two years from the year-
end. Control variables include performance variables that can affect both the probability of being

36
targeted for activism and the probability of being taken over by another firm (Palepu, 1986;
Ambrose and Megginson, 1992).
TABLE 2.7. Probability of sale of the target
This table examines the likelihood of being taken over for firms with each of the three takeover defenses in place. Controls include the control variables reported in Panel A of Table 2.3. Values in parentheses are standard errors clustered by firm. *** (**, *) indicates significance at the 1% (5%, 10%) level.
(1) Takeover(t, t+2)
(2) Takeover(t, t+2)
(3) Takeover(t, t+2)
(4) Takeover(t, t+2)
(5) Takeover(t, t+2)
Dual-class -0.034*** -0.031*** -0.032*** -0.032*** -0.031*** (0.008) (0.008) (0.008) (0.008) (0.008) Staggered board -0.010** -0.010** -0.008* -0.010** -0.008* (0.005) (0.005) (0.005) (0.005) (0.005) Poison pill -0.000 -0.001 -0.001 -0.002 -0.001 (0.006) (0.006) (0.006) (0.006) (0.006) Pill adopted < 1 year 0.062*** 0.058*** 0.058*** 0.058*** 0.049*** (0.018) (0.018) (0.018) (0.018) (0.018) Activism 0.119*** 0.131*** 0.116*** 0.131*** (0.014) (0.018) (0.016) (0.020) Activism × Dual-class
-0.021 -0.025 (0.049) (0.050)
Activism × Staggered board
-0.029 -0.032 (0.026) (0.026)
Activism × Poison pill
0.005 -0.002 (0.029) (0.030)
Activism × Pill adopted < 1 year
0.109 (0.087)
Controls Yes Yes Yes Yes Yes Industry fixed effects Yes Yes Yes Yes Yes Year fixed effects Yes Yes Yes Yes Yes Adj. R2 0.029 0.036 0.036 0.036 0.036 Num. obs. 22,338 22,338 22,338 22,338 22,338 F-Test of Column (5) F-stat P-value Activism + Dual-class + (Activism × Dual-class) 2.35 0.126 Activism + Staggered board + (Activism × Staggered board) 16.73 0.000*** Activism + Poison pill + (Activism × Poison pill) 17.42 0.000***
Table 2.7 presents the results from estimating the model above. The coefficients for
Activismt in Columns (2) through (5) are positive and significant, suggesting that the firms targeted

37
by activists are 11.6 to 13.1 percentage points more likely to be taken over in the two years
following activism. In order to test whether activism has incremental effects for firms with a poison
pill, a staggered board or a dual-class capital structure, I interact Activismt with each takeover
defense indicator. None of the interaction effects are significant, suggesting that activism has no
incremental effect on the takeover probability of firms with these three defenses. However, F-tests
on activism estimates for the poison pill and staggered board samples suggest that firms with these
defense mechanisms are more likely to be taken over in the two years following activism despite
having the defense in place. Consistent with Greenwood and Schor (2009), shareholder activism
plays a role in improving the market for corporate control. These results apply even to firms with
a poison pill and/or a staggered board. In contrast, I do not find evidence that activism is associated
with higher likelihood of takeover when a dual-class structure is in place, suggesting the power of
a dual-class structure as a defense mechanism.
2.5.2.3. Financial policies
Table 2.8 examines changes in financial policies and capital expenditures around activism.
Prior literature has found that activism generally reduces agency costs as evidenced by increased
leverage and reduced capital expenditures (Brav et al., 2010; Klein and Zur, 2009), and that
defense measures are associated with a higher probability of management entrenchment. If
activists are successful at bringing about positive changes to the target firms, it is possible that the
effects would be larger for the firms with defense mechanisms, as these firms are more likely to
have entrenched managers with potentially more room for improvement in these areas. However,
it might be difficult to bring about these changes in the short-term when defense mechanisms

38
Table 2.8. Changes in financial policies by defense measure
Panel A: Leverage This panel examines changes in leverage ratio at target firms. Pre-activism, Activism and Post-activism are indicators for the two years prior to, the year of, and the two years following activism announcement, respectively. I divide these indicators into two by the existence of each defense measure. F-tests (A) and (B) examine whether differences in coefficients between Pre-activism and Post-activism are statistically significant for each subsample with or without a takeover defense. F-test (C) examines whether there is difference in the effect of activism on the dependent variable between the activism sample with and without a defense measure. Values in parentheses are standard errors clustered by firm. *** (**, *) indicates significance at the 1% (5%, 10%) level.
(1) Leverage
(2) Leverage
(3) Leverage
Dual class Pre-activism 0.105*
Staggered board Pre-activism 0.004
Poison pill Pre-activism -0.002
(0.058) (0.015) (0.017) Dual class Activism 0.077*
Staggered board Activism 0.017
Poison pill Activism 0.041**
(0.046) (0.015) (0.019) Dual class Post-activism 0.152**
Staggered board Post-activism 0.033*
Poison pill Post-activism 0.084***
(0.064) (0.017) (0.020) Non-dual class Pre-activism -0.005
Non-staggered board Pre-activism 0.000
No poison pill Pre-activism 0.003
(0.010) (0.014) (0.013) Non-dual class Activism 0.019*
Non-staggered board Activism 0.029**
No poison pill Activism 0.014
(0.010) (0.013) (0.012) Non-dual class Post-activism 0.037***
Non-staggered board Post-activism 0.051***
No poison pill Post-activism 0.019
(0.012) (0.015) (0.014) Market value 0.027*** Market value 0.027*** Market value 0.027*** (0.005) (0.005) (0.005) Industry fixed effects Yes Industry fixed effects Yes Industry fixed effects Yes Year fixed effects Yes Year fixed effects Yes Year fixed effects Yes Adj. R2 0.199 Adj. R2 0.198 Adj. R2 0.199 Num. obs. 22961 Num. obs. 22961 Num. obs. 22961
∆Coeff.
(P-value) ∆Coeff.
(P-value) ∆Coeff.
(P-value) (A) Dual class 0.047 (A) Staggered board 0.029* (A) Poison pill 0.086*** Post – Pre (0.352) Post – Pre (0.094) Post – Pre (0.000) (B) Non-dual class 0.042*** (B) Non-staggered board 0.051*** (B)No poison pill 0.022 Post – Pre (0.001) Post – Pre (0.002) Post – Pre (0.265) (C) Dual class vs. Non-dual class 0.005
(C) Staggered vs. Non-staggered -0.022
(C) Poison vs. No poison pill 0.064**
Post – Pre (0.918) Post – Pre (0.367) Post – Pre (0.011)

39
Table 2.8. Changes in financial policies by defense measure (Continued)
Panel B: Capital expenditure This panel examines changes in capital expenditure at target firms. Pre-activism, Activism and Post-activism are indicators for the two years prior to, the year of, and the two years following activism announcement, respectively. I divide these indicators into two by the existence of each defense measure. F-tests (A) and (B) examine whether differences in coefficients between Pre-activism and Post-activism are statistically significant for each subsample with or without a takeover defense. F-test (C) examines whether there is difference in the effect of activism on the dependent variable between the activism sample with and without a defense measure. Values in parentheses are standard errors clustered by firm. *** (**, *) indicates significance at the 1% (5%, 10%) level.
(1) Capex
(2) Capex
(3) Capex
Dual class Pre-activism -0.004
Staggered board Pre-activism 0.005
Poison pill Pre-activism 0.001
(0.010) (0.004) (0.005) Dual class Activism -0.007
Staggered board Activism -0.004
Poison pill Activism -0.005
(0.011) (0.004) (0.005) Dual class Post-activism -0.022**
Staggered board Post-activism -0.010**
Poison pill Post-activism -0.013**
(0.010) (0.005) (0.005) Non-dual class Pre-activism 0.006*
Non-staggered board Pre-activism 0.006
No poison pill Pre-activism 0.008**
(0.003) (0.004) (0.004) Non-dual class Activism -0.003
Non-staggered board Activism -0.003
No poison pill Activism -0.003
(0.003) (0.004) (0.003) Non-dual class Post-activism -0.011***
Non-staggered board Post-activism -0.013***
No poison pill Post-activism -0.011***
(0.003) (0.004) (0.004) Market value -0.018*** Market value -0.018*** Market value -0.018*** (0.002) (0.002) (0.002) Industry fixed effects Yes Industry fixed effects Yes Industry fixed effects Yes Year fixed effects Yes Year fixed effects Yes Year fixed effects Yes Adj. R2 0.425 Adj. R2 0.425 Adj. R2 0.425 Num. obs. 23078 Num. obs. 23078 Num. obs. 23078
∆Coeff. (P-value)
∆Coeff. (P-value)
∆Coeff. (P-value)
(A) Dual class -0.018** (A) Staggered board -0.015*** (A) Poison pill -0.014* Post – Pre (0.016) Post – Pre (0.010) Post – Pre (0.051) (B) Non-dual class -0.017*** (B) Non-staggered board -0.019*** (B)No poison pill -0.019*** Post – Pre (0.000) Post – Pre (0.000) Post – Pre (0.000) (C) Dual class vs. Non-dual class -0.001
(C) Staggered vs. Non-staggered 0.004
(C) Poison vs. No poison pill 0.005
Post – Pre (0.906) Post – Pre (0.644) Post – Pre (0.587)

40
protect management and boards at the same time. Therefore, I examine the effect of activism on
the financial policies of targeted firms with and without defense measures.
In Table 2.8, Pre-activism, Activism and Post-activism are indicators for the two years prior
to, the year of, and the two years following the activism announcement, respectively. I divide these
indicators into two by the existence of each defense measure.14 Dependent variables are Leverage
and Capital expenditure, respectively, for Panels A and B. The coefficients for these indicators
show the level of the dependent variable in each period compared to the control sample (i.e. non-
activism years). The F-test between Pre-activism and Post-activism shows the significance of the
difference between periods before and after activist intervention. Lastly, the F-test between the
activism sample with a takeover defense and the one without shows the difference in the effect of
activism on the dependent variable between the activism sample with and without the defense
measure.
As reported in Panel A of Table 2.8, leverage increases by 2.9% for the sample with a
staggered board and by 5.1% for firms without a staggered board. Leverage also increases by 8.6%
for firms with a poison pill, but not for firms without a poison pill. The increases in leverage are
not significantly different between the subsamples (Poison pill vs. No poison pill, Staggered board
vs. No staggered board, Dual class vs. No dual-class) except for the poison pill sample; the increase
in the leverage ratio following activism is significantly larger for the sample with a poison pill in
place than for the sample without.
I find similar effects with capital expenditure, except for the opposite sign. Panel B of Table
2.8 reports that capital expenditure significantly decreases by 1.4% - 1.9% for each category of the
!!!!!!!!!!!!!!!!!!!!!!!!!!!!!!!!!!!!!!!!!!!!!!!!!!!!!!!!14 For instance, Staggered board Pre-activism is an indicator for firms with a staggered board during the two years prior to the activism announcement.
41
activism sample. However, the reduction in capital expenditure is not significantly different
between the subsamples with and without each defense measure.
2.6. Board response to shareholder activism
2.6.1. Poison pill adoption
In this last section, I study whether target firms without a poison pill adopt one in response
to an activist approach. Many studies have focused on poison pills (with their more formal name
“shareholder rights plans”) since Marty Lipton of Wachtell, Lipton, Rosen & Katz invented the
measure in 1982 in response to the wave of takeovers by corporate raiders. A poison pill makes it
costly for a potential acquirer to own more than the threshold level that triggers the pill, which
would typically dilute that acquirer’s ownership by half. A flip-in poison pill, in particular, is so
powerful that no company with one in place has ever been acquired (Catan and Kahan, 2015). This
powerful defense tool is now being adopted by boards to thwart activists. For example, when
Daniel Loeb of Third Point approached Sotheby’s in 2013, asking for changes in strategy and
leadership, Sotheby’s responded by adopting a poison pill, limiting activist ownership to no more
than 10 percent.15 Here I test whether such cases happen frequently.
For a sample of firms without a poison pill in place, I test whether having an activism event
during the year is associated with adopting a poison pill. Column (1) of Table 2.9 shows the
positive and significant coefficient for Activism; controlling for other factors, firms that are
targeted by activists are 6.2 percentage points more likely to adopt a poison pill than firms that are
not.
!!!!!!!!!!!!!!!!!!!!!!!!!!!!!!!!!!!!!!!!!!!!!!!!!!!!!!!!15 Despite this effort, Loeb eventually gained three seats on Sotheby’s board.

42
Although poison pills may not be a good defense mechanism against activism, as discussed,
there are several reasons why boards still might want to adopt one in response to activism. First,
even though activists do not typically intend to take over the company, a board may want to rule
out the possibility, especially when activists are capable of such actions. It is also helpful to limit
activists’ influence through stock ownership in preparation for a potential proxy fight. Second,
poison pills prevent multiple activists from forming a group (a method called “wolf-packing”16).
Finally, poison pills that include derivative-based positions in the definition of the term “beneficial
ownership” can prevent activists from using derivatives to accumulate ownership.17
Despite the poison pill’s success against takeovers, however, it is not clear whether this
method can successfully defend management against activists. As discussed earlier, most
activists are not seeking control, unlike corporate raiders. Rather, they seek to change the
management or the strategy of the target, often by obtaining seats on the board. The threat of
diluting ownership does not necessarily prevent activists from achieving these goals. If activists
can convince other shareholders to vote for their director nominees or to vote against
management in shareholder elections, then a poison pill would not matter. Also, as powerful as the
poison pill is in deterring hostile takeovers, shareholders do not universally welcome it. Sikes et
al. (2014) show a significant negative market reaction to poison pill adoptions related to net
operating losses (NOLs). They find that investors appreciate a poison pill only when it is truly
adopted to protect against NOLs and not to entrench management. The same logic seems
applicable to activism, especially because activism brings more investor scrutiny and shareholder
!!!!!!!!!!!!!!!!!!!!!!!!!!!!!!!!!!!!!!!!!!!!!!!!!!!!!!!!16 This is when a number of hedge funds with relatively small stakes in the target corporation communicate informally and share strategies and goals for an activism campaign (Latham and Watkins, 2014). 17 Activists do not have to disclose their derivative positions until their physical stock ownership crosses five percent, whereupon they must file a Schedule 13D (Latham and Watkins, 2014).
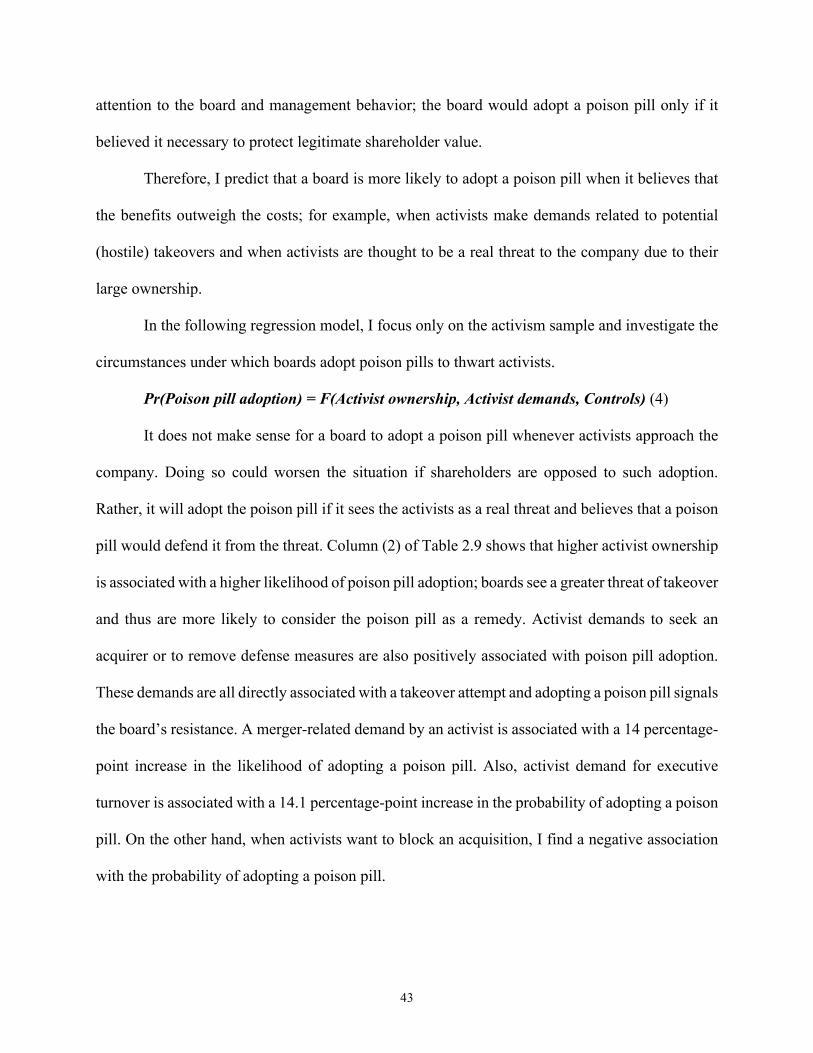
43
attention to the board and management behavior; the board would adopt a poison pill only if it
believed it necessary to protect legitimate shareholder value.
Therefore, I predict that a board is more likely to adopt a poison pill when it believes that
the benefits outweigh the costs; for example, when activists make demands related to potential
(hostile) takeovers and when activists are thought to be a real threat to the company due to their
large ownership.
In the following regression model, I focus only on the activism sample and investigate the
circumstances under which boards adopt poison pills to thwart activists.
Pr(Poison pill adoption) = F(Activist ownership, Activist demands, Controls) (4)
It does not make sense for a board to adopt a poison pill whenever activists approach the
company. Doing so could worsen the situation if shareholders are opposed to such adoption.
Rather, it will adopt the poison pill if it sees the activists as a real threat and believes that a poison
pill would defend it from the threat. Column (2) of Table 2.9 shows that higher activist ownership
is associated with a higher likelihood of poison pill adoption; boards see a greater threat of takeover
and thus are more likely to consider the poison pill as a remedy. Activist demands to seek an
acquirer or to remove defense measures are also positively associated with poison pill adoption.
These demands are all directly associated with a takeover attempt and adopting a poison pill signals
the board’s resistance. A merger-related demand by an activist is associated with a 14 percentage-
point increase in the likelihood of adopting a poison pill. Also, activist demand for executive
turnover is associated with a 14.1 percentage-point increase in the probability of adopting a poison
pill. On the other hand, when activists want to block an acquisition, I find a negative association
with the probability of adopting a poison pill.

44
TABLE 2.9. Probability of poison pill adoption
This table presents results from regression analyses in which the dependent variable is an indicator for adoption of a poison pill. Column (1) looks at all firm-years; Column (2) looks at the activism sample. Controls include the control variables reported in Panel A of Table 2.3. Values in parentheses are standard errors clustered by firm in Column (1). *** (**, *) indicates significance at the 1% (5%, 10%) level.
(1)
Adoption of poison pill (2)
Adoption of poison pill (activism sample)
Activism 0.062*** (0.009) Dual-class -0.004* -0.070** (0.002) (0.035) Staggered board 0.000 0.004 (0.001) (0.022) Activist ownership 0.006*** (0.002) Merger-related demand 0.140*** (0.028) Block-merger-related demand 0.046 (0.035) Block-acquisition-related demand -0.111* (0.059) Demand for divestiture -0.014 (0.033) Demand for board seat 0.046** (0.023) Demand to remove director 0.080 (0.063) Demand to remove officer 0.141** (0.071) Demand to remove defense 0.221*** (0.060) Controls Yes Yes Year fixed effects Yes Yes Industry fixed effects Yes Yes Adj. R2 0.020 0.232 Num. obs. 20,035 611
2.6.2. Effectiveness of poison pill adoption
I also examine how poison pill adoption is associated with eventual outcomes for activism
targets. If adoption thwarted activists, there would be less likelihood of takeover, CEO turnover,
or board seats granted to activists. However, if it were not so effective, for the reasons mentioned

45
in the previous section, its relation with such outcomes would be insignificant. I also investigate
shareholder perceptions of poison pill adoptions by examining shareholder support in director
elections. Poison pill adoption does not have to be approved by shareholders, but if they disagree
with the board, their dissatisfaction could be reflected in director elections.
My test examines whether poison pill adoption around activism is associated with (1)
whether a firm is less likely to be taken over, (2) whether a board seat is less likely to be granted
or won, (3) whether CEO turnover is less likely, and (4) whether shareholder support during
director elections is affected. The main variables of interest are Pill adopted, an indicator for a
firm that adopted a poison pill after an activism announcement, and Pill in force, an indicator for
a firm that already had a poison pill in place before an activism announcement. I estimate the
following equation and the results are presented in Table 2.10.
Activism outcomes = F(Pill adopted, Takeover defenses, Controls) (5)
Columns (3) and (5) of Table 2.10 suggest that poison pill adoption (Pill adopted) is
positively associated with gaining board seats and CEO turnover. However, as reported in Table
2.9, boards seem more likely to adopt a poison pill the greater the activists’ ownership and the
more extensive their demands. Therefore, these positive coefficients might reflect the power that
activists have over the target firm, which leads to the adoption of poison pills.
Column (7) of Table 2.10 shows that poison pill adoption is not welcomed by other
shareholders. Pill adopted is associated with a 3.8% decrease in the average support for directors
up for election. In Columns (2), (4), (6), and (8) of Table 2.10, I interact poison pill status with
staggered board status (Staggered board × Pill adopted and Staggered board × Pill in force) and
find that having a staggered board can weaken the effect of poison pill adoption, while poison pill
adoption is associated with lower shareholder support for directors only if a staggered board is in

46
place. This suggests that while a staggered board plays a powerful role in protecting management,
shareholders become more sensitive to the likelihood of management entrenchment when a firm
has both a staggered board and a poison pill in place when activists approach.
TABLE 2.10. Poison pill adoption and activism consequences
This table presents results from regression analyses in which the sample consists of activism targets and the dependent variables are Sale of the target, an indicator for takeover within two years of activism, Board seat granted, an indicator for any board seat granted to activists, CEO turnover, an indicator for CEO turnover within two years of activism, and Average votes (%), an average percentage of shareholder votes for directors in director elections. Controls include the control variables reported in Panel A of Table 2.3. *** (**, *) indicates significance at the 1% (5%, 10%) level.
(1) Sale of
the target
(2) Sale of
the target
(3) Board
seat granted
(4) Board
seat granted
(5) CEO
turnover (t, t+2)
(6) CEO
turnover (t, t+2)
(7) Average
votes (%)
(8) Average
votes (%)
Dual-class -0.116*** -0.117*** -0.083* -0.083* -0.083 -0.097* 0.025 0.026 (0.044) (0.044) (0.047) (0.046) (0.057) (0.057) (0.021) (0.021) Staggered board -0.045* -0.075** -0.028 0.000 -0.003 -0.020 -0.028*** -0.030** (0.024) (0.029) (0.025) (0.031) (0.040) (0.053) (0.010) (0.012) Pill adopted -0.012 -0.033 0.204*** 0.323*** 0.223** 0.304** -0.038** -0.003 (0.044) (0.061) (0.054) (0.071) (0.097) (0.117) (0.018) (0.020) Pill in force -0.030 -0.054 0.104*** 0.090** 0.002 -0.072 -0.035*** -0.050*** (0.027) (0.036) (0.030) (0.039) (0.052) (0.070) (0.012) (0.015) Pill in force < 1 year 0.095* -0.142*** -0.135 -0.010 (0.054) (0.055) (0.082) (0.024) Staggered board × Pill adopted
0.048 -0.274** -0.240 -0.067* (0.088) (0.107) (0.200) (0.036)
Staggered board × Pill in force
0.084* -0.026 0.077 0.024 (0.051) (0.054) (0.100) (0.022)
Proxy fight -0.042** -0.042** (0.019) (0.019) Activist ownership -0.022 -0.044 (0.107) (0.104) Proxy fight × Activist ownership
0.132 0.116 (0.197) (0.195)
Controls Yes Yes Yes Yes Yes Yes Yes Yes Year fixed effects Yes Yes Yes Yes Yes Yes Yes Yes Industry fixed effects Yes Yes Yes Yes Yes Yes Yes Yes Adj. R2 0.078 0.077 0.070 0.070 0.297 0.295 0.091 0.095 Num. obs. 1,307 1,307 1,362 1,362 390 390 840 840
Overall, I do not find evidence that a poison pill adopted in response to activism is an
effective defense mechanism. This is not surprising given my prior finding that a poison pill does

47
not deter activists from targeting the firm. Together these findings imply that a poison pill does
not serve a defensive purpose.
2.7. Conclusion
I have examined the interplay between takeover defense measures, which have existed for
more than thirty years and have been at the core of the corporate governance environment, and
shareholder activism, a new stimulus to the corporate governance environment. While one of the
main goals of shareholder activism is to improve target firms’ corporate governance, takeover
defense measures are important factors when choosing a target as well as important outcome
measures to investigate.
I first examine how different defense measures are associated with activist target selection
and find that a staggered board and a dual-class structure deter activists from targeting the
company. I argue that the deterrent effect of a staggered board comes from the fact that it not only
makes it more difficult for activists to control the board, but prevents them from targeting poorly
performing directors for replacement during a proxy fight. On the other hand, I find that a poison
pill that is already in force does not deter activists, but rather attracts them. I argue that this is
because the poison pill signals poor board engagement and entrenched management, especially in
this era of repealing poison pills. It can also be used as a public relations tool against management
during an activism campaign. Furthermore, if a poison pill has been recently adopted, it signals a
potentially better takeover opportunity.
I next examine the types of demand activists make and the resulting outcomes in relation
to defense measures. When defense measures are already in place, activists are more likely to
demand their removal and push for a takeover in the case of a poison pill. This suggests that

48
activists act as an antidote to poison pills and other defense measures and make efforts to
strengthen the market for corporate control. Do activists achieve what they wanted to achieve? The
outcome results suggest that targets with a staggered board and a poison pill are more likely to
remove those measures following activism and are more likely to be taken over in the two years
following activism than non-targeted firms with the same defenses. It is unclear whether the
removal of takeover defenses and advocating a takeover are necessarily value-maximizing for
companies or shareholders, but activism reduces managerial control and creates new options for
investors and management. I also report an increase in leverage ratio and a decrease in capital
expenditure following activism, but do not find significant difference between targets with and
without defense measures in place.
In the last section, I find that the percentage of activist ownership and activist demands for
merger- or takeover-defense-related demands are associated with a higher likelihood of poison pill
adoption following activist engagement. However, it is not clear whether a poison pill provides a
successful defense for such firms.
Takeover defenses are still important and relevant factors in the era of shareholder activism
with differential effectiveness as a defense. Overall, I contribute to the literature on the effects of
shareholder activism on corporate governance and firm performance by providing evidence that
activists seek to improve corporate governance and revive the market for corporate control.

49
CHAPTER 3
CONSEQUENCES TO DIRECTORS OF SHAREHOLDER ACTIVISM
3.1. Introduction
We examine career consequences for directors when firms are subject to activist
shareholder interventions. Activism by hedge fund and other investors to improve governance and
performance of companies has become a significant phenomenon in recent years. Many recent
papers (e.g., Brav et al., 2008; Bebchuk et al., 2013) examine the performance consequences of
such activism with a focus on identifying whether and how hedge fund activism improves firm
performance. Our focus is on the consequences for the board of directors, a group that occupies a
central place in corporate governance and in interactions with shareholders involved in activism.
We use a sample of 1,490 activism events comprising all publicly disclosed shareholder
activism conducted by hedge funds or other major shareholders between 2004 and 2012 to examine
a number of different consequences for directors.18 First, we examine director turnover at firms
subject to activism, including the effect of settlement with activists and the impact of activism on
the performance-sensitivity of director turnover. Next, we examine whether activism is associated
with reduced shareholder support in director elections and the relation between activism,
shareholder support in director elections, and subsequent departure of directors. Finally, we
examine changes in the number of board positions held by directors at other public firms as a proxy
for reputational effects of shareholder activism.
Our paper contributes to the literature in a number of ways. First, we provide evidence that
an important class of shareholder activism is associated with career costs for directors, even when
!!!!!!!!!!!!!!!!!!!!!!!!!!!!!!!!!!!!!!!!!!!!!!!!!!!!!!!!18 “Major shareholders” being defined as those that own more than five percent of shares and file a Form 13D with the Securities and Exchange Commission.

50
such activism does not result in a proxy contest or even relate to demand for board representation.
While proxy contests rarely succeed in getting a majority of shareholder support (Bebchuk, 2007),
Fos and Tsoutsouras (2014) show that proxy contests are associated with director turnover. This
result is to be expected since proxy contests explicitly target incumbent directors with activists
proposing an alternate slate of candidates. Consistent with Fos and Tsoutsouras (2014), we find
that directors targeted by activists in proxy fights are significantly more likely to leave the board
after the activism event: 21.4 percent of directors are no longer on the board of targeted firms at
the end of the year after the activism is initiated compared to 12.5 percent for non-targeted firms.
However, proxy contests represent just 25% of the events in the total set of activist contests
that we study, and those that proceed to contested elections are just 8%. Among the larger set of
activism events that do not lead to a proxy fight, we find that even when activists target firms
without any board-related demands, director turnover is 15.7% by the end of the second year after
the activism is initiated. And when activists seek board representation without it leading to a proxy
contest, turnover is 20.7%, essentially similar to the 21.4% when proxy contests do occur. Thus,
our results complement those of Fos and Tsoutsouras (2014) by showing that shareholder activism
is associated with higher levels of director turnover even when such activism does not involve
proxy contests, let alone proxy contests that get majority shareholder support. These higher
departure rates hold for both inside and independent directors. All these results hold after
controlling for firm performance and other factors driving director turnover and activism.
Second, we provide evidence on the complex nature of negotiations between shareholders
(including activists) and firms. Gantchev (2013) models an activism campaign as a sequential
multi-period game involving escalating costs to the activist and provides empirical estimates of
the costs of each stage. By providing evidence of increased levels of director turnover in categories

51
of activism that fall short of proxy contests, or even observable demands for board representation,
our paper provides evidence consistent with the existence of the kind of complex process modeled
by Gantchev (2013). For example, we show that director turnover is actually higher when firms
settle with activists than when activists cease campaigns, but indistinguishable from turnover from
proxy contest that actually proceed to shareholder votes.
Third, we provide evidence on the interplay between activism and other dimensions of
director accountability. We show that activism is associated with higher levels of performance
sensitivity of director turnover suggesting higher director accountability for poor firm
performance. Greater turnover sensitivity to poor firm performance occurs even when such
activism does not involve a proxy contest.
Fourth, we provide new evidence on director elections - we find that shareholders penalize
directors with lower support in director elections when the firm is targeted by activists but that the
effect is relatively limited. We find that directors receive 8.6 percent negative vote in the year of
activism and 8.1 percent in the year after activism compared with less than 6 percent for non-
targeted firms. One plausible explanation for this seemingly small effect is that many activism
events are settled, perhaps when anticipated shareholder support is even lower than in cases that
go to election.
We also find that negative votes in director elections (i.e., votes withheld from a director
or votes for a rival candidate) are associated with director turnover. This is in contrast to Cai et al.
(2009) who, using a sample of director elections from 2003 and 2004, do not find an association
between a measure of negative votes and director turnover. This suggest that, in the context of
activism, directors heed the message in the negative vote and resign their position, though it is
unclear what compels them to do so given that they still receive majority support in most cases.

52
Finally, our paper also adds to the body of research that examines labor market
consequences of director performance. Empirical research has provided evidence consistent with
the Fama and Jensen (1983) conjecture that the market for directorships rewards or penalizes
director performance (e.g., Srinivasan, 2005; Fich and Shivdasani, 2007). Prior research has
considered directorships as an indication of director prestige (Fich and Shivdasani, 2007;
Yermack, 2004), suggesting that if being targeted by activists were viewed as an indication of poor
director performance, directors would lose seats on other boards. We find no evidence of an impact
of activism on director reputation as reflected in directorships on other boards. Even directly
targeted directors experience no loss in other directorships and this apparent non-effect holds for
both inside and independent directors. In this regard, our results stand in contrast to those in Fos
and Tsoutsoura (2014), who find evidence of other directorships being affected by proxy fights;
this difference is likely due to difficult-to-reconcile differences in measurement of outside
directorships and sample period.
While our results are robust to a variety of control variables and to using a propensity score
matched sample, there are some caveats we should point out. First, it is difficult to draw
unequivocally causal inferences from our results because activists do not select target firms at
random. It is possible that activists target those firms possessing unobserved characteristics
associated with director turnover. To partially address this concern, we conduct within-firm
analyses comparing directors that are individually targeted by activists with directors who are not.
We believe causal inference is more appropriate with these tests (see Table 3.8), which provide
results that are consistent with our main analyses. Second, even if the causal explanation is valid,
it is difficult to discern from public data the precise mechanism through which activism causes
director turnover. A director who leaves the board in response to activist demands for his or her

53
departure is difficult to distinguish empirically from one who leaves the board because the activism
imposes additional personal costs on directors. Third, our paper does not speak to the optimality
of activist-driven director turnover. While prior research has found evidence consistent with
increased performance-sensitivity increasing firm value (Weisbach, 1988) and we find evidence
of shareholder activism being associated with greater performance sensitivity of director turnover,
it is difficult to conclude from our evidence whether turnover following activism is optimal.
However, whether departure is voluntary, optimal, or otherwise, our evidence does suggest that
activism is associated with career consequences for directors.
The rest of the essay proceeds as follows. Section 3.2 describes features of shareholder
activism campaigns and the prior literature. Section 3.3 describes our data and descriptive
statistics. Section 3.4 discusses director turnover in targeted companies. Section 3.5 examines
voting results. Section 3.6 examines reputational impact on other boards. Section 3.7 examines
consequences to directors targeted individually by activists. Section 3.8 provides additional
analyses and Section 3.9 concludes.
3.2. Prior research and institutional setting
3.2.1. Director turnover
Prior papers provide evidence that directors lose their positions when firms experience
financial crises or financial misconduct. For instance, greater director turnover is observed in firms
subject to securities litigation (Romano, 1991; Brochet and Srinivasan, 2013), firms in financial
distress (Gilson, 1990), companies that report accounting restatements (Srinivasan, 2005), and
firms that backdated options (Ertimur et al. 2012).19 Overall, the evidence points to higher board
!!!!!!!!!!!!!!!!!!!!!!!!!!!!!!!!!!!!!!!!!!!!!!!!!!!!!!!!19 In contrast with these papers, other papers find that director turnover is unchanged after fraud (Agarwal, Jaffe, and Karpoff, 1999) and after litigation (Fich and Shivdasani, 2007).

54
turnover after poor performance, consistent with directors being held accountable for monitoring
failures. While prior papers examine board turnover, they do not explore the mechanism that brings
this about. We identify shareholder activism as one such mechanism and seek to understand the
effect of different kinds of direct shareholder action on director turnover.
While we focus on director turnover at firms targeted by activist shareholders, we also
examine directors’ reputational consequences by looking at the effect of shareholder activism on
directorships at other firms. Our paper is therefore related to the literature on director reputation,
which shows that directors incur labor market penalties when they are perceived as weak monitors
(Srinivasan, 2005; Fich and Shivdasani, 2007).
3.2.2. Effect of shareholder votes and institutional shareholder activism
Prior research has found that shareholders use voting in director elections as a way to
communicate dissatisfaction with performance. Cai, Garner, and Walking (2009) find that
directors receive fewer votes after a securities lawsuit and when the director serves on the board
of another firm that faces a shareholder lawsuit. Ertimur, Ferri, and Maber (2012) find that
compensation committee members of option backdating firms receive fewer votes than other
directors in these firms.20
Grundfest (1993) suggests that directors value their reputation as monitors and therefore
respond to negative shareholder votes even when such votes are not binding. Consistent with this,
prior literature provides evidence consistent with shareholder voting having some efficacy in
bringing about changes in corporate policy. Del Guercio, Seery, and Woidtke (2008) provide
evidence that firms respond to “vote no” campaigns by activist institutional investors by improving
!!!!!!!!!!!!!!!!!!!!!!!!!!!!!!!!!!!!!!!!!!!!!!!!!!!!!!!!20 Yermack (2010) contains a comprehensive review of the larger shareholder voting literature.

55
operating performance, increasing CEO turnover-performance sensitivity, and making governance
changes. Ertimur et al. (2010) find that CEOs who receive excess pay and are targeted by “vote
no” campaigns subsequently receive lower compensation.
While prior research suggests directors heed the message conveyed by these campaigns, it
is not clear that directors are more likely to leave the board in the face of weak shareholder support.
Under a plurality-voting system, a director is elected even if minority of investors vote in his or
her favor since shareholders can only withhold votes and cannot vote against a director. Consistent
with such voting being ineffective, Cai et al. (2009) find no relationship between the percent of
withheld votes and subsequent director turnover. In contrast, Fischer et al. (2009) find that board-
level shareholder approval is negatively associated with board-level turnover, albeit using a much
smaller sample. While under a majority-voting regime a director is not elected unless a majority
of votes are cast in their favor, Ertimur et al. (2013) find that votes withheld are not related to
director turnover even under that regime. Even when directors fail to win a majority vote, which
is itself a rare occurrence, turnover is infrequent and is not related to the voting outcome, regardless
of the election standard. We add to this literature by examining how shareholder activism and
shareholder voting coexist in affecting director turnover and, by providing evidence that
shareholder voting has a significant effect on board turnover. Our results can help explain why
directors are responsive to shareholder concerns expressed by votes in director elections.
3.2.3. Director elections and proxy fights
The apparent ineffectiveness of uncontested elections has led to the concern that the only
way for shareholders to remove underperforming directors is to initiate a proxy solicitation
campaign in a contested election. Contested elections are contests between the incumbent set of

56
directors put forward by the company and a dissident slate nominated by an outside investor. Dodd
and Warner (1983) provide early evidence consistent with proxy fights being value-creating for
shareholders. They find a statistically significant positive share price effect associated with a proxy
contest regardless of whether the contest was successful or not. However, a number of studies find
limits to the effectiveness of proxy contests. While Mulherin and Poulsen (1998) find evidence
“that proxy contests create value” using a sample of 270 proxy contests covering 1979−1994, they
also find that “the bulk of the wealth gains stemming from firms that are acquired.” Pound (1988)
identifies cost of waging a proxy contest and management incumbency as impediments to
successful proxy fights. More recently, Bebchuk (2007) claims that shareholders’ power to replace
the board is largely a “myth,” due to free-rider issues associated with investing in costly proxy
contents. We contribute to this debate by providing evidence consistent with directors being held
accountable for firm performance in the presence of shareholder activism, even when such
activism does not involve a proxy contest.
3.2.4. Hedge fund and other institutional activism
Over the last decade, the phenomenon of shareholder activism has been driven in large part
by activist hedge funds. Brav, Jiang, and Kim (2010) identify structural benefits enjoyed by hedge
funds—such as fewer regulations and better incentives—that have allowed them to be more active
than mutual funds or pension funds in pursuing governance changes in companies.
While hedge fund activism is a recent phenomenon, a body of prior research has examined
the effect of shareholder activism by pension and labor union funds. Early research focused on the
activities of pension plans, such as CalPERS (Smith, 1996) and TIAA-CREF (Carleton, Nelson,
and Weisbach, 1998). While pension plans have typically focused on governance changes

57
generally proposed as 14a-8 shareholder proposals, hedge funds often seek to make more wide-
ranging changes to the firms they target (see Appendix C for examples). One conclusion from
research on pension plan activism is that activist shareholders and firms often reach agreement
without a formal 14a-8 proposal being voted upon – for instance Carleton, Nelson, and Weisbach
(1998) find that TIAA-CREF is able to reach agreements with targeted companies 95 percent of
the time and in over 70 percent of cases without a shareholder vote on the proposal. In the UK,
Becht et al. (2008) study a mutual fund (Hermes) and find that this fund acts “predominantly
through private interventions.” This is consistent with our finding that activism is associated with
board turnover, even when there is no formal proxy fight.
While our paper is similar in some respects to Fos and Tsoutsoura (2014), it also differs in
a number of respects. First and most importantly, while Fos and Tsoutsoura (2014) focus
exclusively on proxy contests, we examine other forms of shareholder activism and find that these
are also associated with director turnover. Director turnover in the context of proxy contests should
be less surprising, whereas our finding that director turnover accompanies hedge fund activism
provides a broader context for understanding how board governance is shaped by activism. In
addition, we examine voting outcomes and performance sensitivity of director turnover. In these
regards, our paper complements and extends the findings of Fos and Tsoutsoura (2014). Finally,
Fos and Tsoutsoura (2014) find that other directorships decline for directors targeted in proxy
fights relative to their non-targeted colleagues on the same boards, while we do not find evidence
of this effect in our sample.21
Our paper also relates to Gantchev (2013), who models activism as a sequential decision
process with activism potentially escalating from negotiations with management and requests for
!!!!!!!!!!!!!!!!!!!!!!!!!!!!!!!!!!!!!!!!!!!!!!!!!!!!!!!!21 We discuss our attempt to reconcile our results with theirs in Section 8.1 below.

58
board representation to, ultimately, proxy contests. A key element of the analysis in Gantchev
(2013) is an estimate of $10.71 million as the cost of a typical proxy contests, an amount equal to
two-thirds of the gross returns from an activism campaign. Focusing on director turnover, our
paper complements Gantchev (2013) by showing that activists appear to effect change without
pursuing costly proxy contests.
Prior research suggests that hedge fund activists typically target smaller firms, value-oriented
firms (low market-to-book), and firms with sound operating cash flows but low sales growth,
leverage and dividend payouts (Brav et al., 2010). This evidence motivates us to introduce firm-
level covariates to control for factors causing firms to be targeted by activist investors.
3.3. Data and sample description
Our analysis uses data on directors, firms, and activism events. Each of these is described
in turn.
3.3.1. Directorship data
Our sample consists of all directorships held in firms in the Equilar database for fiscal years
ending between January 1, 2004 and December 31, 2012. The data in Equilar comprises directors
of every company that files both an annual report and an annual proxy statement (forms 10-K and
DEF 14A, respectively) with the SEC. This database provides us with names and other director
characteristics. Drawing on data from both Equilar and BoardEx (another widely used board of
director database), we construct an identifier for each director that allows us to track directors
across firms and over time.

59
3.3.2. Firm-level data
Most firm-level financial data come from Compustat and CRSP. Our source for data on
voting is ISS Voting Analytics, which provides data about matters voted on at shareholder
meetings between 2001 and 2012 for a sample that roughly corresponds to the Russell 3000 index.
We get analyst coverage from I/B/E/S and institutional ownership data from WhaleWisdom, which
provides comprehensive coverage of 13F and 13F/A filings.
3.3.3. Activism events
Our data on activism comes from the FactSet SharkWatch database, which contains
information on shareholder activism events, primarily in the United States. From SharkWatch, we
collect information on all publicly disclosed activism events that commenced in the period
2004−2012, where the event is not a corporate control contest initiated by another corporation and
the targeted firm is incorporated in the United States and is not an investment trust or mutual fund.
This provides us with 1,490 activism events, which are primarily conducted by hedge fund activists
or other major shareholders (i.e., 13D filers). Note that this does not include activism consisting
only of routine shareholder proposals submitted under Rule 14a-8.
We classify these 1,490 activism (Targeted Firm) events into three mutually exclusive
subcategories: Targeted Firm – Non-Board, Targeted Board – Non-Proxy, and Targeted Board –
Proxy. All activism events not related to a demand for board representation are classified as
Targeted Firm – Non-Board. We classify as Targeted Board – Non-Proxy all events identified by
SharkWatch as relating to “Board Representation,” “Board Control,” “Remove Directors(s),” or
“Withhold Vote for Director(s),” but which do not result in a formal declaration of a contested
director election (proxy fight). We classify as Targeted Board – Proxy as activism events that

60
resulted in a declared proxy fight. This is measured as both (i) activism events involving filings on
forms DEFC14A and PREC14A and (ii) cases where the dissident publicly disclosed that it
delivered formal notice to the company that it intends to solicit proxies from stockholders.
Appendix B provides definitions of all variables used in the analysis. Appendix C provides
examples of activism events in each of the above categories.
Table 3.1. Descriptive statistics
Panel A: Activism events by year This panel reports number of activism events by year. Our sample of targeted firms comes from FactSet SharkRepellent. Activism events that do not involve board related demands by the activist are classified as Targeted Firm – Non-Board. Targeted Board – Non-Proxy are board of directors related activism events identified by SharkRepellent as relating to “Board Representation,” “Board Control,” “Remove Directors(s),” or “Withhold Vote for Director(s)” but that do not lead to a declared proxy contest. Targeted Board – Proxy are declared proxy contests including both (i) activism events involving filings on forms DEFC14A and PREC14A and (ii) activism events where the dissident publicly disclosed that it delivered formal notice to the company that it intends to solicit proxies from stockholders. Proxy Fight Went to Election, a subset of Targeted Board – Proxy, are those declared proxy contests that went to a shareholder vote. We match data on directorships in Equilar (sourced from proxy filings) with activism events that begin in the twelve-month period after proxy filings.
Year
Activism events matched to Equilar
Targeted Firm Targeted Firm – Non-Board
Targeted Board – Non-
Proxy
Targeted Board – Proxy
Proxy Fight Went to Election
2004 67 32 7 28 10 2005 126 72 18 36 9 2006 229 137 31 61 17 2007 291 200 38 53 22 2008 256 147 40 69 26 2009 131 69 22 40 15 2010 158 92 30 36 12 2011 142 75 27 40 10 2012 90 52 24 14 0 Total 1,490 876 237 377 121
Panel B: Director observations by year and activism category
2004 2005 2006 2007 2008 2009 2010 2011 2012 Total Targeted Firm 586 1,116 1,950 2,556 2,230 1,133 1,437 1,200 813 13,021 Targeted Firm – Non-Board 286 651 1,128 1,734 1,269 619 863 628 496 7,674 Targeted Board – Non-Proxy 72 150 268 328 351 179 273 216 210 2,047 Targeted Board – Proxy 228 315 554 494 610 335 301 356 107 3,300

61
Table 3.1. Descriptive statistics (Continued) Panel C: Director departure We classify directorship-year observations on Equilar into categories based on activism related to the firm in the subsequent year (t + 1). See Panel A for explanation of the classification of activism events. Non-Targeted Firm comprises all firms in Equilar database that were not targeted by activists.
Year t t+1 t+2 t+3 t+4 t+5 Non-Targeted Firm 0.000 0.070 0.125 0.166 0.199 0.223 Targeted Firm 0.000 0.118 0.180 0.209 0.215 0.214 Targeted Firm – Non-Board 0.000 0.107 0.157 0.185 0.190 0.186 Targeted Board – Non-Proxy 0.000 0.136 0.209 0.221 0.246 0.252 Targeted Board – Proxy 0.000 0.132 0.214 0.256 0.256 0.258
Panel D: Shareholder support in director elections Against Votes represents the percentage of votes against the director in director elections, calculated as (votes against + votes withheld) divided by (votes for + votes against + votes withheld). ISS Against represents an unfavorable recommendation by Institutional Shareholder Services (ISS) for each individual director nominee. See Panel A for explanation of the classification of activism events. Non-Targeted Firm comprises all firms in Equilar database that were not targeted by activists.
Against Votest Against Votest+1 Against Votest+2 ISS
Againstt+1 ISS
Againstt+2 Non-Targeted Firm 0.052 0.054 0.057 0.104 0.103
Targeted Firm 0.075 0.086 0.081 0.138 0.135 Targeted Firm – Non-Board 0.073 0.076 0.081 0.110 0.143 Targeted Board – Non-Proxy 0.079 0.100 0.092 0.120 0.118 Targeted Board – Proxy 0.080 0.096 0.072 0.207 0.125
Panel E: Number of directorships in other firms The panel indicates the number of directorships a director has with companies other than the company of interest each year. See Panel A for explanation of the classification of activism events.
Year t t+1 t+2 t+3 t+4 t+5 Non-Targeted Firm 0.610 0.592 0.583 0.571 0.560 0.546 Targeted Firm 0.688 0.679 0.653 0.630 0.608 0.579 Targeted Firm – Non-Board 0.734 0.729 0.713 0.685 0.653 0.620 Targeted Board – Non-Proxy 0.649 0.625 0.570 0.546 0.545 0.516 Targeted Board – Proxy 0.605 0.593 0.565 0.554 0.539 0.519 Year-on-year ratio (Non-Targeted) 0.970 0.985 0.979 0.981 0.975

62
Of the total sample of 1,490 events, 614 events are board-related (377 as Targeted Board
– Proxy and 237 Targeted Board – Non-Proxy) and the remaining 876 relate to other campaigns
by shareholders. Table 3.1 Panel A provides a distribution of the sample by year and by category.
We observe no particular time series patterns in the nine years of data for any of the subgroups
except for a slightly higher overall rate of activism in 2007 and 2008. There are no specific patterns
in the activism subcategories. Nevertheless, we include year fixed effects in all our multivariate
tests to account for any year specific effects. Several of our analyses use director-firm-years as the
units of observation and Table 3.1 Panel B provides the number of such observations by year and
category of activism.
Table 3.1 Panel C provides univariate statistics on director turnover on the board for the
five years after shareholder activism. As a benchmark, in the measurement window that we use
for our multivariate tests (two-year window from t to t + 2), we observe a director turnover rate of
12.5 percent for firms that are not targeted for any form of activism (Non-Targeted Firm) that
remain in our sample for that period. The comparable turnover rate for companies targeted for
shareholder activism (Targeted Firm) is significantly higher at 18.0 percent in the two-year period
that includes the initiation of the activism and the year following it. For non-proxy fight, board-
related activism (Targeted Board – Non-Proxy), 20.9 percent of directors leave in two years. Proxy
fights (Targeted Board – Proxy) also see greater director turnover with a 21.4 percent departure
rate. We explore these results further using multivariate regressions of director departure in the
next section.
Table 3.1 Panel D presents univariate statistics for voting support in director elections for
the year prior to activism (t) to the year after initiation of activism (t + 2). Against Votes represents
the percentage of votes from director election voted “against” each director, calculated for

63
uncontested elections as (voted against + voted withheld) divided by (voted for + voted against +
voted withheld). For contested elections, the calculation is similar, but we treat votes for one
director as votes against the rival director. ISS Against represents an unfavorable voting
recommendation for each individual director nominee by Institutional Shareholder Services (ISS),
a leading proxy advisory firm. The average director in a firm not targeted for activism (Non-
Targeted Firm) receives 5.4 percent negative votes from shareholders and an unfavorable ISS
recommendation in 10.4 percent of cases. Levels of negative votes and recommendations are
higher for targeted companies. The average level of negative votes for directors of targeted firms
(Targeted Firm) is 8.6 percent in the year of activism and 8.1 percent in the year after activism
suggesting a continued negative sentiment against directors. The negative votes are 10.0 percent
and 9.2 percent in years t + 1 and t + 2, respectively, for non-proxy, board-related activism
(Targeted Board – Non-Proxy) and 9.6 percent and 7.2 percent for proxy fight events (Targeted
Board – Proxy). The lingering negative effect against directors of targeted firms is explored in our
multivariate regression analysis.
In Table 3.1 Panel E, we provide univariate statistics for other directorships of our sample
directors. The average director in a non-targeted firm has 0.610 directorships in other firms. This
number reduces over next five years to 0.546. Other directorships of directors in targeted firms
display a somewhat similar decline over time and this pattern is repeated in each category of
targeted firms. While the univariate statistics do not suggest a pattern of differential impact
between targeted and non-targeted firms, we explore the impact of activism on other directorships
in a multivariate regression framework in section 3.6.

64
3.4. Director turnover in targeted companies
In this section, we discuss our analyses of the relationship of shareholder activism and
director turnover.
3.4.1. Shareholder activism and director turnover
We first examine how shareholder activism affects director turnover in target companies
estimating the following specification for all director-firm-years in our sample.
Departure(t, t+2) = F(Targeted Firm – Non-Board, Targeted Board – Non-Proxy, Targeted Board – Proxy, firm controls, director controls, (1) year fixed effects),
where the dependent variable, Departure(t, t+2), takes the value 1 if a director of the firm in year t
is no longer on the board in year t + 2. Targeted Firm – Non-Board takes the value 1 for all directors
of a firm that is the target of a non-board related activism event in year t + 1. We classify activism
events in which the activist seeks either the removal of existing directors or appointment of new
ones into two groups—those that result in a declared proxy fight (Targeted Board – Proxy) and
those that do not, due to settlement with the activist or the activist dropping its demands (Targeted
Board – Non-Proxy). Declared proxy fights do not necessarily result in contested elections—the
company and dissident might settle before going to a vote even after a proxy fight is initiated. The
benchmark group consists of director-firm-years in the Equilar database related to firm-years
where the firms were not targeted by activists.
We also include firm, director, and activism characteristics as controls. Poor firm
performance has been shown to be an important cause of director turnover (Gilson, 1990;
Yermack, 2004). Brav et al. (2008) identify several firm characteristics that distinguish activism
targets from other firms. We include these variables in the regression model so as to control for

65
firm characteristics associated with activism. Firm-level controls include firm performance (Ind.
Adj. Return, ROA, Sales Growth), log of market capitalization for firm size (Market Value), book-
to-market ratio (Book-to-Market), leverage (Leverage), dividend payout ratio (Dividend), the
number of analysts covering the firm (Analyst) and percent of shares held by institutional investors
(Institution).
Director characteristics include director age (Age), director tenure (Tenure) as we expect
age and tenure to be positively associated with director turnover. We identify directors that are on
the audit (Audit Committee) and compensation committees (Compensation Committee) as these
directors are more likely to play a prominent role on the board (Yermack, 2004). We include year
fixed effects to control for unobserved time-related effects. All standard errors are clustered at the
firm level.22
We examine director departure over a two-year period including the activism event. This
allows us to examine up to two nomination cycles for companies with unitary boards. While
directors in companies with staggered boards typically serve three-year terms and are not up for
nomination within two years, this does not prevent these directors from leaving boards before their
tenure is up. Ertimur, Ferri, and Maber (2012) also use a two-year measurement window, arguing
that the effect of a shareholder campaign dissipates over time and longer time windows increase
the likelihood of unrelated events affecting director turnover.
Table 3.2 presents the results of an OLS regression of Equation 1. We tabulate an OLS
regression for ease of interpretation of coefficients. (Note that all inferences are identical when we
conduct a logit regression). Table 3.2 Panel A presents results for all directors—independent,
inside, and related or “gray” directors. Column 1 of Panel A presents results for all firms, including
!!!!!!!!!!!!!!!!!!!!!!!!!!!!!!!!!!!!!!!!!!!!!!!!!!!!!!!!22 Clustering by both firm and director does not change our inferences.
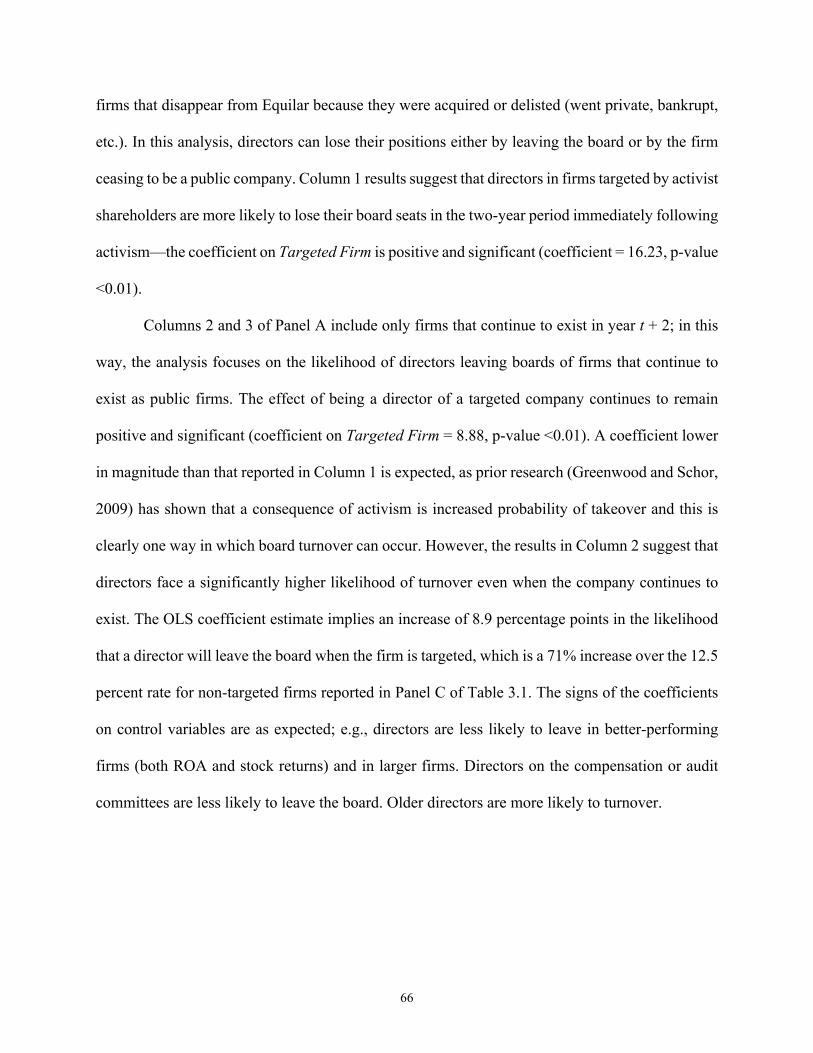
66
firms that disappear from Equilar because they were acquired or delisted (went private, bankrupt,
etc.). In this analysis, directors can lose their positions either by leaving the board or by the firm
ceasing to be a public company. Column 1 results suggest that directors in firms targeted by activist
shareholders are more likely to lose their board seats in the two-year period immediately following
activism—the coefficient on Targeted Firm is positive and significant (coefficient = 16.23, p-value
<0.01).
Columns 2 and 3 of Panel A include only firms that continue to exist in year t + 2; in this
way, the analysis focuses on the likelihood of directors leaving boards of firms that continue to
exist as public firms. The effect of being a director of a targeted company continues to remain
positive and significant (coefficient on Targeted Firm = 8.88, p-value <0.01). A coefficient lower
in magnitude than that reported in Column 1 is expected, as prior research (Greenwood and Schor,
2009) has shown that a consequence of activism is increased probability of takeover and this is
clearly one way in which board turnover can occur. However, the results in Column 2 suggest that
directors face a significantly higher likelihood of turnover even when the company continues to
exist. The OLS coefficient estimate implies an increase of 8.9 percentage points in the likelihood
that a director will leave the board when the firm is targeted, which is a 71% increase over the 12.5
percent rate for non-targeted firms reported in Panel C of Table 3.1. The signs of the coefficients
on control variables are as expected; e.g., directors are less likely to leave in better-performing
firms (both ROA and stock returns) and in larger firms. Directors on the compensation or audit
committees are less likely to leave the board. Older directors are more likely to turnover.

67
Table 3.2. Effect of shareholder activism on director turnover
Panel A: Entire sample
The table presents results from OLS regressions where the dependent variable is Departure(t, t+2), i.e., an indicator for the director leaving the board of the firm by year t + 2 (i.e., the year after the activism event, if any). Column 1 presents OLS results for all directors where the firm is present in year t + 2 in the Equilar database. Columns 2 through 5 exclude observations where the firm is not in Equilar in year t + 2, presumably due to bankruptcy, delisting, mergers, etc. All variables are defined in Appendix B. All regressions include year fixed-effects and robust standard errors (in parentheses) clustered at the firm level. *** (**, *) indicates significance at the 1% (5%, 10%) level.
(1) (2) (3) (4) (5) All directors,
all firms All directors All directors Departure
(t, t+1) Departure (t+1, t+2)
Targeted Firm 16.23*** 8.88*** (1.38) (0.90) Targeted Firm – Non-Board 6.67*** 4.48*** 2.19*** (1.10) (0.84) (0.70) Targeted Board – Non-Proxy 9.97*** 4.85*** 5.11*** (1.75) (1.22) (1.37) Targeted Board – Proxy 12.77*** 3.14*** 9.63*** (1.53) (1.01) (1.18) Control Variables Ind. Adj. Return -1.68*** -0.77*** -0.75*** -0.35*** -0.41*** (0.25) (0.14) (0.14) (0.11) (0.08) ROA -11.30*** -7.50*** -7.49*** -3.66*** -3.83*** (1.35) (0.84) (0.84) (0.48) (0.46) Sales Growth 0.84 0.88*** 0.90*** 0.25 0.66*** (0.54) (0.32) (0.32) (0.21) (0.21) Market Value -9.31*** 0.00 0.01 -0.20 0.21 (0.48) (0.28) (0.28) (0.16) (0.14) Book-to-Market 3.08*** 1.04*** 1.02*** 0.59*** 0.43** (0.54) (0.35) (0.35) (0.21) (0.20) Leverage 4.69*** 0.75 0.78 0.36 0.43 (0.86) (0.50) (0.50) (0.29) (0.26) Dividend -18.87* 0.75 1.11 3.84 -2.73 (10.72) (6.27) (6.27) (4.01) (3.40) Analyst 0.14*** 0.03 0.03 0.02 0.01 (0.05) (0.03) (0.03) (0.02) (0.01) Institution 0.13 1.74*** 1.73*** 0.83*** 0.90*** (0.25) (0.19) (0.19) (0.11) (0.10) Age 0.21*** 0.31*** 0.31*** 0.16*** 0.15*** (0.02) (0.02) (0.02) (0.01) (0.01) Tenure -0.05** 0.08*** 0.08*** 0.05*** 0.03*** (0.02) (0.02) (0.02) (0.01) (0.01) Audit Committee -3.03*** -3.86*** -3.86*** -2.62*** -1.24*** (0.23) (0.21) (0.21) (0.13) (0.11) Compensation Committee -0.99*** -1.28*** -1.27*** -1.16*** -0.11 (0.23) (0.21) (0.21) (0.13) (0.11)

68
Table 3.2. Effect of shareholder activism on director turnover (Continued)
Independent Director -2.50*** -2.39*** -2.40*** -1.03*** -1.37*** (0.37) (0.31) (0.31) (0.19) (0.16)
Adj. R2 0.08 0.02 0.02 0.01 0.01 Num. obs. 297,202 245,774 245,774 245,774 245,774
F-Test for Column (3)
H0: Targeted Firm – Non-Board = Targeted Board – Non-Proxy for All Directors
F-stat = 2.76, Pr(>F) = 0.10*
H0: Targeted Board – Non-Proxy = Targeted Board – Proxy for All Directors
F-stat = 1.66, Pr(>F) = 0.20
H0: Targeted Firm – Non-Board = Targeted Board – Proxy for All Directors
F-stat = 12.48, Pr(>F) = 0.00***
Panel B: Independent and inside directors
The table presents results from OLS regressions where the dependent variable is Departure(t,t+2), i.e., an indicator for the director leaving the board of the firm by year t + 2 (i.e., the year after then activism event, if any) with the sample partitioned into independent and inside directors, as classified by Equilar (no results are provided for related directors). Columns 1 and 4 present results for directors where year t + 2 is covered by Equilar, even when the firm is not on Equilar in year t + 2, presumably due to bankruptcy, delisting, mergers, etc.. The remaining columns include only observations where the firm is in the Equilar database in t + 2. Control variables include all variables in Panel A of Table 2 and are suppressed for parsimony. All regressions include year fixed-effects and robust standard errors (in parentheses) clustered at the firm level. *** (**, *) indicates significance at the 1% (5%, 10%) level.
(1) (2) (3) (4) (5) (6) Independent
directors, all firms
Independent directors
Independent directors
Inside directors, all firms
Inside directors
Inside directors
Targeted Firm 16.30*** 8.29*** 16.54*** 11.81*** (1.43) (0.93) (1.84) (1.62) Targeted Firm – Non-Board
6.73*** 7.65*** (1.16) (1.87)
Targeted Board – Non-Proxy
7.87*** 16.44*** (1.84) (3.64)
Targeted Board – Proxy
11.57*** 18.67*** (1.61) (2.92)
Controls Yes Yes Yes Yes Yes Yes Adj. R2 0.09 0.03 0.03 0.09 0.03 0.03 Num. obs. 211,696 174,858 174,858 53,691 44,146 44,146

69
Table 3.2. Effect of shareholder activism on director turnover (Continued)
F-Test for Column (3) of Table 3.2 Panel B
H0: Targeted Firm – Non-Board = Targeted Board – Non-Proxy for All Directors
F-stat = 0.31, Pr(>F) = 0.58
H0: Targeted Board – Non-Proxy = Targeted Board – Proxy for for All Directors
F-stat = 2.65, Pr(>F) = 0.10
H0: Targeted Firm – Non-Board = Targeted Board – Proxy for All Directors
F-stat = 6.78, Pr(>F) = 0.01***
F-Test for Column (6) of Table 2 Panel B
H0: Targeted Firm – Non-Board = Targeted Board – Non-Proxy for All Directors
F-stat = 4.96, Pr(>F) = 0.03**
H0: Targeted Board – Non-Proxy = Targeted Board – Proxy for for All Directors
F-stat = 0.26, Pr(>F) = 0.61
H0: Targeted Firm – Non-Board = Targeted Board – Proxy for All Directors
F-stat = 11.48, Pr(>F) = 0.00***
Column 3 presents results using a finer classification of activism events. We find not only
that directors from targeted firms are more likely to leave their company, but directors are also
incrementally more likely to leave if their company is targeted by activists not seeking board
representation or the removal of directors: the coefficients on Targeted Firm – Non-Board,
Targeted Board – Non-Proxy, and Targeted Board – Proxy are all positive and significant and the
coefficients are progressively higher (coefficients of 6.67, 9.97 and 12.77, respectively, with p-
values < 0.01 in each case). Surprisingly, the coefficients on Targeted Board – Non-Proxy and
Targeted Board – Proxy are not statistically distinguishable from each other (F-stat of 1.66, p-

70
value = 0.20), suggesting that directors on boards targeted by activism resulting in a formal proxy
fight have no greater likelihood of leaving than directors in firms with board-related activism that
does not reach that level. In short, these results show that directors in firms targeted by shareholder
for activism campaigns face increased likelihood of leaving the board of targeted firms, even when
the activism is not explicitly directed at board representation and does not result in a proxy fight.
In untabulated analysis, we include an indicator variable SharkWatch50, which identifies
activism by the top 50 hedge fund activists (classified by FactSet based on the number of publicly
disclosed campaigns waged and size of companies targeted). This set includes noted activist hedge
funds such as Pershing Square, Relational Investors, Third Point, and Icahn Enterprises. Overall,
501 of the 1,490 events include SharkWatch50 hedge funds as part of the dissident group. We use
this classification to examine if outcomes are different when the activism is directed by these
prominent activists. While we might expect that activism by more prominent investors would
result in higher levels of turnover due to these investors being taken more seriously, we do not find
evidence supporting this in our analysis; in fact, the coefficient on SharkWatch50 is negative and
equal to -2.83 (p-value < 0.10) suggesting that turnover is less likely in these cases. We also
interacted SharkWatch50 with the activism classification variables, but found no statistically
significant effects.
In columns 4 and 5, we divide Departure(t, t+2) into Departure(t, t+1) and Departure(t+1, t+2),
separately looking at directors who leave in year t + 1 (Column 4) and year t + 2 (Column 5),
respectively. We do this to identify to what extent directors leave before the first election (t to t +
1) when activism is announced and the extent to which directors leave after the first election (t +
1 to t + 2). Note that the coefficient on the activism variables in Column 3 will be the sum of the
coefficients on the same variable in columns 4 and 5. The significant and positive coefficients on

71
all activism classifications suggest directors involved in activism events leave in the year of, as
well as in the year after, activism.
The results in Columns 4 and 5 highlight that much director turnover occurs before the
annual meeting in the year of the activism event—i.e., in the period (t, t + 1)—especially when the
activism does not involve a proxy fight. The positive and significant coefficient in Column 4
(Departure(t, t+1)) for Targeted Board – Non-Proxy is consistent with board seats being granted to
dissidents as part of settlement negotiation with the activist investors thereby preventing a proxy
fight; in such cases, some incumbent directors would step down as part of the settlement. Some
proxy fights likely represent cases where the firm and the activist did not reach a settlement and
the activist escalated to a formal proxy fight. While turnover is greater in the period (t + 1, t + 2)
for proxy fights, there is some increased turnover in the period (t, t + 1) as well, consistent with
directors yielding board seats prior to a vote when confronted with a potential proxy fight.
Separating director turnover into two periods shows that a significant amount of turnover occurs
concurrently with activism likely as a conflict-avoidance mechanism.
In Panel B of Table 3.2 we separate the sample into independent directors and inside
directors to examine possibly differential effects of activism on the two groups. Columns 1 through
3 present coefficient estimates for the sample of independent directors and Columns 4 through 6
for inside directors (“gray” or affiliated directors are dropped from the sample). In general, the
results are very similar to those reported in Panel A of Table 3.2, so we focus on the differences.
The estimated impact of being targeted is greater for inside directors (coefficient on Targeted Firm
= 11.81, p-value < 0.01) than for independent directors (coefficient = 8.29, p-value < 0.01); the
difference is statistically significant (p-value < 0.05). The coefficients between insider directors

72
and independent directors are different in a statistically significant way when we examine by
activism types as well except for cases of Targeted Firm – Non-Board.
3.4.2. Shareholder activism and performance sensitivity of director turnover
We next examine if activism increases the sensitivity of director turnover to poor firm
performance. Prior literature (e.g., Weisbach, 1988) suggests that increased turnover-performance
sensitivity can be viewed as a positive governance effect. In Panel A of Table 3.3, we examine the
effect of activism on the performance sensitivity of director turnover. As the measure of
performance, we use industry-adjusted returns over the twelve-month period ending four months
after the fiscal year-end (i.e., the approximate time of the annual shareholder meeting). By
extending the returns into the fiscal year after the activism event, if any, we pick up performance
that is observed by shareholders and thus plausibly affects voting at the annual meeting.
We find that performance sensitivity is significantly increased by shareholder activism: the
coefficients on Ind. Adj. Return interacted with Targeted Firm is negative and significant (p-value
< 0.01). In the presence of activism, a one percentage-point decrease in industry-adjusted is
associated with an incremental increase in the probability of turnover of all directors of 2.79% (p-
value < 0.01) and 2.44% and 3.19% for independent and inside directors, respectively). We also
examine performance sensitivity effects for for each classification of activism events (Targeted
Firm – Non-Board, Targeted Board – Non-Proxy, and Targeted Board – Proxy) and, while the
coefficients are all negative, they are most often not statistically significantly different from zero
or from each other.23 Overall, the results in Panel A of Table 3.3 suggest that shareholder activism
!!!!!!!!!!!!!!!!!!!!!!!!!!!!!!!!!!!!!!!!!!!!!!!!!!!!!!!!23 Note that the effects are generally not significant when the sample includes firms that are delisted. This presumably reflects the fact that directors’ loss of such board seats is a function of acquisitions, etc., rather than of performance.

73
is a mechanism for enhancing board accountability for poor performance even when it does not
involve a proxy fight.
3.4.3. Settlements with activists and director turnover
In Panel B of Table 3.3, we examine the effect of settlements with activists on director
turnover. We define settlements as cases where board seats were granted, but the activism did not
proceed to a contested election (i.e., a proxy fight). We distinguish between activism events with
and without formal proxy filings. In the former category of events, we find differences in
coefficients between settled (Non-Proxy – Settled) and non-settled (Non-Proxy – Not Settled) cases
(6.06 = 12.09 – 6.03, p-value < 0.10). For cases with formal proxy filings, we distinguish cases
that were not settled (Proxy – Not Settled), from cases that were settled before the shareholder
meeting (Proxy – Not Settled) and cases that went to election (Proxy – Went to Election). The
difference in the coefficient estimates for the first two cases is positive and significant as well
(Proxy – Settled less Proxy – Not Settled = 13.18 – 4.97 = 8.21, p-value < 0.05), suggesting that
settlement with activists is positively associated with turnover of directors. However, there is no
significant difference between Proxy – Settled and Proxy – Went to Election (14.91 – 14.33 = 0.58,
p-value = 0.87). Overall, these coefficients are consistent with boards deciding to settle in cases
where they are less likely to prevail in a proxy fight and with contested elections in proxy fights
being just the tip of the iceberg in terms of driving director turnover.

74
Table 3.3. Effect of shareholder activism on director turnover
Panel A: Impact of activism on performance-sensitivity
The table presents results from OLS regressions where the dependent variable is Departure(t,t+2), i.e., an indicator for the director leaving the board of the firm by year t + 2 (i.e., the year after then activism event, if any). Ind. Adj. Return is the industry-adjusted return, calculated as raw return minus the return for the relevant Fama/French 48-industry portfolio, over the 12-month period ending 4 months after the fiscal year-end (i.e., the approximate time of the annual meeting). Control variables include all variables in Panel A of Table 2 and are suppressed for parsimony. All regressions include year fixed-effects and robust standard errors (in parentheses) clustered at the firm level. *** (**, *) indicates significance at the 1% (5%, 10%) level.
(1) (2) (3) (4) (5) (6)
All directors
All directors
Independent directors
Independent directors
Inside directors
Inside directors
Targeted Firm 8.84*** 8.31*** 11.82*** (0.85) (0.90) (1.52) Targeted Firm – Non-Board 6.85*** 6.91*** 7.90*** (1.04) (1.13) (1.77) Targeted Board – Non-Proxy 8.18*** 6.35*** 12.85*** (1.78) (1.88) (3.76) Targeted Board – Proxy 12.46*** 11.46*** 18.26*** (1.68) (1.85) (2.97) Targeted Firm -2.79*** -2.44*** -3.19** × Ind. Adj. Return (0.81) (0.88) (1.44) Targeted Firm – Non-Board × Ind. Adj. Return
-2.23*** -2.05** -2.27* (0.74) (0.80) (1.34)
Targeted Board – Non-Proxy × Ind. Adj. Return
-9.61** -8.86* -18.32* (4.90) (5.15) (10.05)
Targeted Board – Proxy × Ind. Adj. Return
-2.31 -1.50 -1.81 (4.16) (5.07) (5.86)
Ind. Adj. Return -1.07*** -1.07*** -0.83*** -0.83*** -1.95*** -1.95*** (0.19) (0.19) (0.19) (0.19) (0.44) (0.44) Controls Yes Yes Yes Yes Yes Yes Adj. R2 0.02 0.02 0.03 0.03 0.03 0.03 Num. obs. 255,031 255,031 181,196 181,196 45,964 45,964

75
Table 3.3. Effect of shareholder activism on director turnover (Continued)
Panel B: Impact of settlement
The table presents results from OLS regressions where the dependent variable is Departure(t,t+2), i.e., an indicator for the director leaving the board of the firm by year t + 2 (i.e., the year after the activism event, if any). Non-Proxy – Settled and Proxy – Settled are indicators for non-proxy fight and proxy fight events, respectively, where an activism event resulted in a board seat for dissidents, but did not go to shareholder election. Non-Proxy – Not Settled and Proxy – Not Settled are indicators for non-proxy fight and proxy fight events, respectively, where an activism event did not result in any board seat for dissidents. Proxy - Went to Election is an indicator variable for those proxy fights that went to election. All activism classification variables are mutually exclusive. All columns exclude observations when the firm is not on Equilar in year t + 2, due to bankruptcy, delisting, mergers, etc. Column 1 presents results for all directors, Column 2 presents results for independent directors and Column 3 presents results for inside directors. Control variables include all variables in Panel A of Table 2 and are suppressed for parsimony. All regressions include year fixed-effects and robust standard errors (in parentheses) clustered at the firm level. *** (**, *) indicates significance at the 1% (5%, 10%) level.
(1) (2) (3)
All directors Independent
directors Inside directors
Targeted Firm – Non-Board 6.67*** 6.73*** 7.65*** (1.10) (1.16) (1.87) Non-Proxy – Not Settled 6.03** 5.96** 8.82 (2.47) (2.76) (5.37) Non-Proxy – Settled 12.09*** 8.86*** 21.17*** (2.26) (2.37) (4.67) Proxy – Not Settled 6.65*** 4.97** 14.94*** (2.05) (2.11) (5.18) Proxy – Settled 14.33*** 13.18*** 20.81*** (2.32) (2.41) (4.31) Proxy – Went to Election 14.91*** 13.99*** 18.82*** (2.88) (3.11) (5.19) Equality of coefficients: p-values Non-Proxy – Settled = Non-Proxy – Not Settled 0.07* 0.42 0.08*
Proxy – Settled = Proxy – Not Settled 0.01** 0.01*** 0.39
Proxy – Went to Election = Proxy – Settled 0.87 0.84 0.76
Proxy – Went to Election = Proxy – Not Settled 0.01** 0.01** 0.59
Controls Yes
Yes Yes Adj. R2 0.02 0.03 0.03 Num. obs. 245,774 174,858 44,146

76
Table 3.3. Effect of shareholder activism on director turnover (Continued)
Panel C: Impact of CEO turnover
The table presents results from OLS regressions where the dependent variable is Departure(t,t+2), i.e., an indicator for the director leaving the board of the firm by year t + 2 (i.e., the year after then activism event, if any). All columns exclude observations where the firm is not on Equilar in year t + 2, presumably due to bankruptcy, delisting, mergers, etc. Column 1 and 2 presents results for independent directors. Control variables include all variables in Panel A of Table 2 and are suppressed for parsimony. All regressions include year fixed-effects and robust standard errors (in parentheses) clustered at the firm level. *** (**, *) indicates significance at the 1% (5%, 10%) level.
(1) (2) Independent directors Independent directors
Targeted Firm 6.56*** (0.91) Targeted Firm – Non-Board 5.33*** (1.12) Targeted Board – Non-Proxy 6.81*** (1.88) Targeted Board – Proxy 8.98*** (1.57) CEO Turnover 5.39*** 5.39*** (0.50) (0.50) Targeted Firm × CEO Turnover
8.09*** (2.98)
Targeted Firm – Non-Board × CEO Turnover
7.53* (4.21)
Targeted Board – Non-Proxy × CEO Turnover
3.64 (5.56)
Targeted Board – Proxy × CEO Turnover
10.39** (4.55)
Controls Yes Yes Adj. R2 0.03 0.03 Num. obs. 174,858 174,858
3.4.4. CEO turnover and outside directors
One possible reason for outside director turnover is CEO turnover. A new CEO may seek
to replace outside directors associated with prior management. To the extent that CEO turnover is
associated with activism, the effect of activism on outside directors may simply reflect this
association. To account for this possibility, we include a CEO turnover indicator as control in all
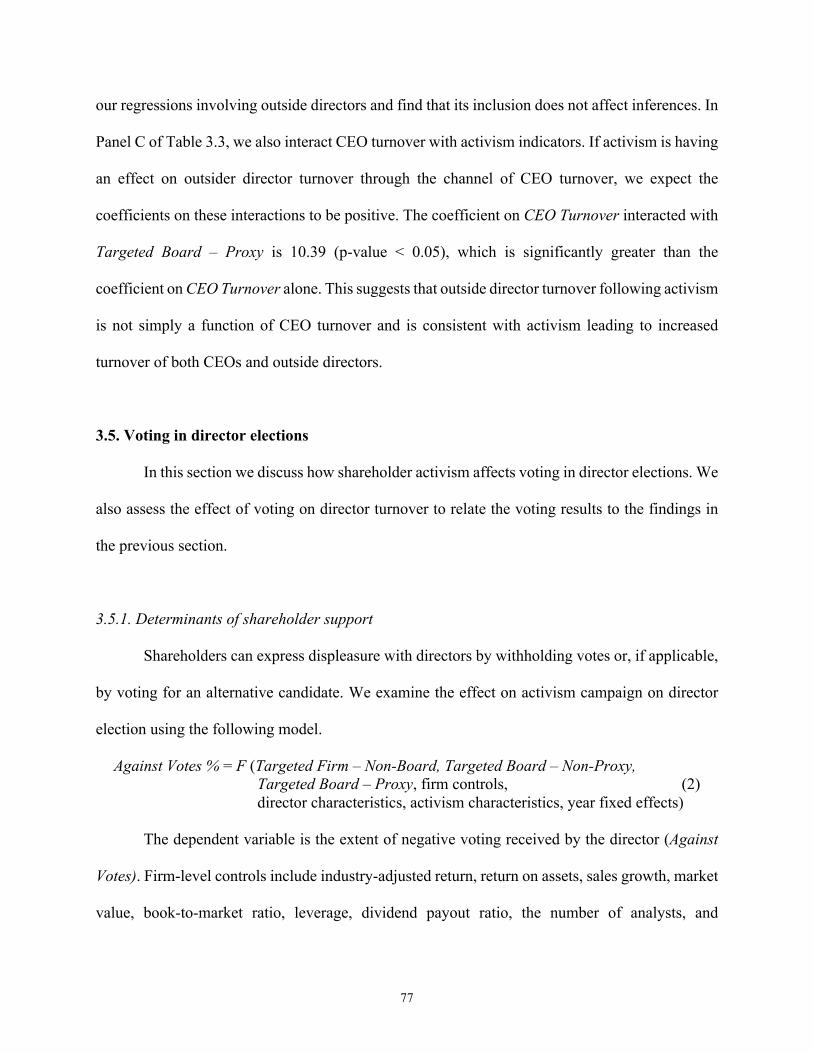
77
our regressions involving outside directors and find that its inclusion does not affect inferences. In
Panel C of Table 3.3, we also interact CEO turnover with activism indicators. If activism is having
an effect on outsider director turnover through the channel of CEO turnover, we expect the
coefficients on these interactions to be positive. The coefficient on CEO Turnover interacted with
Targeted Board – Proxy is 10.39 (p-value < 0.05), which is significantly greater than the
coefficient on CEO Turnover alone. This suggests that outside director turnover following activism
is not simply a function of CEO turnover and is consistent with activism leading to increased
turnover of both CEOs and outside directors.
3.5. Voting in director elections
In this section we discuss how shareholder activism affects voting in director elections. We
also assess the effect of voting on director turnover to relate the voting results to the findings in
the previous section.
3.5.1. Determinants of shareholder support
Shareholders can express displeasure with directors by withholding votes or, if applicable,
by voting for an alternative candidate. We examine the effect on activism campaign on director
election using the following model.
Against Votes % = F (Targeted Firm – Non-Board, Targeted Board – Non-Proxy, Targeted Board – Proxy, firm controls, (2) director characteristics, activism characteristics, year fixed effects)
The dependent variable is the extent of negative voting received by the director (Against
Votes). Firm-level controls include industry-adjusted return, return on assets, sales growth, market
value, book-to-market ratio, leverage, dividend payout ratio, the number of analysts, and

78
institutional ownership percentage. Director-level controls include director age, director tenure,
director shareholding, and audit and compensation committee position. We include voting
recommendations by ISS (ISS Againstt+1), since ISS vote recommendation has been shown to have
a significant influence on director elections (Cai et al., 2009).24
In our first analysis we examine shareholder votes in the year of the activism campaign.
Columns 1 to 3 of Table 3.4 present results of regressions with a dependent variable Against
Votest+1, the percentage of votes against the director in elections in the year of the shareholder
activism. Columns 1 and 2 present results when the sample includes all directors and columns 3
and 4 (5 and 6) present results for independent (inside) directors. As expected, directors in targeted
firms receive more negative votes than directors of firms that are not targeted. This is a significant
increase over the mean negative vote for directors of non-targeted firms of about 5.4 percent (see
Table 3.1 Panel D). These effects exist after controlling for unfavorable ISS recommendation (ISS
Againstt+1) and votes against the director in the previous year (Against Votest), which is the year
prior to activism, if any.
While meaningful, the extent of the negative vote is unlikely to directly lead to director
turnover, e.g., by denying a majority for firms with majority-voting policies. But our results are
consistent with either activists targeting firms whose shareholders are dissatisfied with their
directors or the activists influencing shareholder perceptions of director performance.
Interestingly, the effects are observed for all kinds of activism and there is no statistically
significant difference between Targeted Firm – Non-Board and Targeted Board – Non-Proxy
cases.25
!!!!!!!!!!!!!!!!!!!!!!!!!!!!!!!!!!!!!!!!!!!!!!!!!!!!!!!!24 Inferences are unaffected when ISS Againstt+1 is omitted. 25 We would have expected a greater level of negative voting in the cases involving proxy fights due simply to the existence of alternative candidates for shareholders to vote for.

79
Table 3.4. Shareholder activism and director elections
The table presents results from OLS regressions where the dependent variable is Against Votest+1, the percentage votes against the director in director elections in the year of activism (t + 1), if any. Columns 2, 4, and 6 include Against Votest, shareholder opposition for the director in the year before activism, and ISS Againstt+1, an indicator for an ISS recommendation to withhold votes from a director in year t + 1. Columns 1 and 2 present results for all directors, Columns 3 and 4 present results for independent directors and Columns 5 and 6 present results for inside directors. Firm-level controls are industry-adjusted return, return on assets, sales growth, market value, book-to-market ratio, leverage, dividend payout ratio, the number of analysts, and institutional ownership. Director-level controls are director age, director tenure, and audit and compensation committee position. All variables are defined in Appendix B. Controls are suppressed for parsimony. All regressions include year fixed-effects and robust standard errors (in parentheses) clustered at the firm level. *** (**, *) indicates significance at the 1% (5%, 10%) level.
(1) (2) (3) (4) (5) (6) Dependent Variable: Against Votest+1
All directors
All directors
Ind. directors
Ind. directors
Inside directors
Inside directors
Targeted Firm – Non-Board
5.49*** 3.28*** 4.28*** 2.63*** 6.88*** 3.18*** (0.57) (0.59) (0.61) (0.67) (0.83) (0.78)
Targeted Board – Non-Proxy
1.92*** 1.67*** 2.02*** 1.59*** 1.69*** 1.43* (0.45) (0.52) (0.47) (0.52) (0.60) (0.75)
Targeted Board – Proxy 4.31*** 3.25*** 4.50*** 2.87** 3.74*** 3.44** (1.00) (1.25) (1.06) (1.22) (1.34) (1.54) Against Votest 3.84*** 4.26*** 4.04*** 4.18*** 3.90*** 3.97*** (0.71) (1.08) (0.79) (1.19) (1.11) (1.43) ISS Againstt+1 35.46*** 34.36*** 38.73*** (1.85) (2.06) (3.17) Controls Yes Yes Yes Yes Yes Yes Adj. R2 0.04 0.16 0.05 0.14 0.02 0.20 Num. obs. 131,297 80,591 97,199 59,376 22,964 14,572
3.5.2. Do shareholder votes matter for board turnover?
In this sub-section we relate negative votes in director elections to director departure in the
year after the vote. Prior research suggests that, while negative votes are not large in magnitude,
directors appear to heed the message they deliver. Shareholder dissatisfaction expressed via
negative votes is associated with subsequent governance and performance changes by firms,
consistent with directors responding to shareholder disapproval. Cai, Garner, and Walking (2009)
document a decrease in excess CEO compensation in the year following a higher negative vote for
the compensation committee directors. They also find that the likelihood of CEO turnover

80
increases when independent directors receive lower votes. Interestingly, Cai, Garner and Walking
(2009) do not find an effect of votes against directors on director turnover. Fischer, Gramlich,
Miller, and White (2009) show that firms whose directors receive fewer votes are more likely to
experience subsequent CEO turnover and to hire an outside CEO. These firms also subsequently
exhibit lower excess CEO compensation and make better acquisition and spin-off decisions.
Ertimur, Ferri, and Muslu (2011) show that excess CEO compensation declines following “vote
no” campaigns.
We extend our voting results and findings in the prior literature by examining whether
negative votes are associated with subsequent director turnover in the presence of activism. Results
of this analysis are presented in Table 3.5, where the dependent variable is the director turnover in
the year after shareholder activism. Column 1 presents results from the specification used in Panel
A of Table 3.2 with Departure(t,t+2) as the dependent variable, but with the sample restricted to the
cases where we have data on voting in year t + 1. Columns 2, 3 and 4 present results for all
directors, independent directors and insider directors, respectively. The main variable of interest
is Against Votest+1, which is the percentage of negative votes in the year of activism. The positive
and significant coefficients on Against Votest+1 in all three columns show that directors, both
independent ones and insiders, are less likely to depart if they receive greater support. While
activism itself contributes to the greater extent of negative vote in year t + 1, the effect of activism
on director turnover exists even after controlling for the effect of negative shareholder votes.26
!!!!!!!!!!!!!!!!!!!!!!!!!!!!!!!!!!!!!!!!!!!!!!!!!!!!!!!!26 Inferences are identical when we run logit regressions.

81
Table 3.5. Shareholder activism, director elections, and director turnover
The table presents results from OLS regressions where the dependent variable is Departure(t,t+2), i.e., an indicator for the director leaving the board of the firm by year t + 2 (i.e., the year after the activism event, if any). Classification into independent and inside directors comes from Equilar (no results are provided for related directors). Against Votest+1 represents shareholder opposition for the director in the year of activism. Columns 1 and 2 study all directors while Column 3 focuses on independent directors and Column 4 focuses on insider directors. We include all control variables from Panel A of Table 2 but these are not tabulated for parsimony. All regressions control for year fixed-effects and robust standard errors (in parentheses) clustered at the firm level. *** (**, *) indicates significance at the 1% (5%, 10%) level.
(1) (2) (3) (4) All directors All directors Independent
directors Inside directors
Targeted Firm – Non-Board 2.84** 2.69** 2.71** 4.70* (1.17) (1.17) (1.29) (2.67) Targeted Board - Non-Proxy 5.79** 5.50* 3.01 14.66** (2.92) (2.93) (3.07) (6.02) Targeted Board - Proxy 9.91*** 9.57*** 9.99*** 5.67 (2.88) (2.85) (3.21) (4.96) Against Votest+1 7.81*** 7.29*** 15.86***
(1.61) (1.74) (4.47) Controls Yes Yes Yes Yes Adj. R2 0.01 0.01 0.01 0.02 Num. obs. 100,688 100,688 73,718 17,811
3.6. Directorships on other boards
We extend our voting and director turnover results to other directorships of directors
subject to shareholder activism. The impact of activism in the targeted firm on other directorships
allows us to examine the reputational impact on directors of targeted firm and inform the literature
on reputational penalties for directors. Fama (1980) and Fama and Jensen (1983) posit that firm
performance affects directors’ reputations as corporate stewards, which are rewarded or penalized
in the market for directorships. Prior papers have found evidence that directors lose their positions
on other boards when they serve as directors of firms experiencing a financial crisis or financial
misconduct (e.g., Srinivasan, 2005; Fich and Shivdasani, 2007; Ertimur, Ferri and Maber, 2012).

82
As before, directors in firms in the Equilar database with no shareholder activism provide the
baseline. We use the following regression specification.
Other Boardst+2 = F(Targeted Firm – Non-Board, Targeted Board – Non-Proxy, �Target Board – Proxy, firm controls, director characteristics, activism characteristics, year fixed effects) (3)
The dependent variable is the number of other directorships held in year t + 2 by a director who
was on the board in year t. The independent variables are as defined earlier.
Table 3.6. Impact of shareholder activism on other directorships
The table presents results from OLS regressions where the dependent variable is Other Boardst+2, which is the number of directorships a director has with firms other than the firm of interest in year t + 2 (i.e., the year after then activism event, if any). Columns 1 and 2 present results for all directors. Columns 3 and 4 present results for independent directors and Columns 5 and 6 present results for inside directors. Firm-level controls include industry-adjusted return, return on assets, sales growth, market value, book-to-market ratio, leverage, dividend payout ratio, the number of analysts, and institutional ownership. Director-level controls include director age, director tenure, and audit and compensation committee position. All variables are defined in Appendix B. All regressions include year fixed-effects and robust standard errors (in parentheses) clustered at the firm level. *** (**, *) indicates significance at the 1% (5%, 10%) level. Intercept is not tabulated.
(1) (2) (3) (4) (5) (6) All
directors All
directors Ind.
directors Ind.
directors Inside
directors Inside
directors Other Boardst 0.76*** 0.76*** 0.76*** 0.77*** 0.74*** 0.75*** (0.00) (0.00) (0.00) (0.00) (0.01) (0.01) Targeted Firm – Non-Board 0.04*** 0.02** 0.05*** 0.03** 0.02 -0.01 (0.01) (0.01) (0.01) (0.01) (0.02) (0.02) Targeted Board – Non-Proxy -0.04*** -0.03* -0.03* -0.03 -0.03 0.01 (0.01) (0.02) (0.02) (0.02) (0.02) (0.03) Targeted Board – Proxy -0.00 0.01 -0.00 0.01 0.01 -0.02 (0.01) (0.01) (0.01) (0.02) (0.02) (0.02) Departure(t, t+2) 0.00 -0.00 0.05*** (0.00) (0.00) (0.01) Targeted Firm – Non-Board × Departure(t, t+2)
0.02 0.04 0.04 (0.02) (0.02) (0.04)
Targeted Board – Non-Proxy × Departure(t, t+2)
-0.01 0.01 -0.10** (0.02) (0.03) (0.05)
Targeted Board – Proxy × Departure(t, t+2)
-0.02 -0.03 0.02 (0.02) (0.02) (0.04)
Controls Yes Yes Yes Yes Yes Yes Adj. R2 0.67 0.67 0.68 0.69 0.57 0.58 Num. obs. 309,265 307,773 217,780 216,882 57,609 57,171

83
Table 3.6 presents results of an OLS regression of Equation 3. As before, we present results
for the full board (Column 1 and 2), independent directors (Column 3 and 4) and inside directors
(Column 5 and 6). In columns 1, 3, and 5, we find limited evidence of activism being associated
with loss of seats on other boards. We find a small positive effect for all directors and independent
directors for Targeted Firm – Non-Board and a small negative effect for all directors and
independent directors for Targeted Board – Non-Proxy. One possible explanation for a positive
coefficient is that independent directors have increased availability for other directorships when
they lose a board seat and are more likely to lose a board seat when the firm is targeted. To account
for this possibility, we include an indicator for departure from the targeted board—
Departure(t, t+2)—and interact this with the activism indicators. These results are in columns 2, 4,
and 6. The coefficient on Departure(t, t+2) for independent directors (Column 3) is not economically
nor statistically significant. For inside directors (Column 4), the coefficient on Departure(t, t+2)
(coef. = 0.05, p-value < 0.01) plausibly reflects executives gaining other board seats when they
lose their positions independent of activism, but we find limited effects of activism when the
executive loses his or her seat (e.g. Targeted Board – Non-Proxy × Departure(t, t+2), coef. = –0.10,
p-value < 0.05). The statistically insignificant coefficients on Targeted Firm – Non-Board ×
Departure(t, t+2) and Targeted Board – Non-Proxy × Departure(t, t+2) in Column 4 provide no
evidence for the notion that activism could lead to more directorships at other firms when it results
in loss of a board seat for an independent director. Overall, Table 3.6 provides no evidence of
directors bearing reputational costs through loss of other directorships following shareholder
activism.

84
3.7. Analysis of individually targeted directors
In this section we examine the consequences for the directors who are specifically targeted
by shareholder activism involving proxy fights. We identify directors as targeted directors
(Targeted Board – Proxy – Targeted Director) if they are either (i) explicitly named as a target by
activists or, (ii) when activists do not explicitly identify the directors they seek to replace, those
directors that are up for election during an activism year. Appendix D provides examples of each
type.
Table 3.7. Impact of shareholder activism on individually targeted directors
Panel A: Effects on director turnover
The table presents results from OLS regressions where the dependent variable is Departure(t+1, t+2), i.e., an indicator for the director who was on the board in year t + 1 leaving the board by year t + 2 (i.e., the year after the activism event, if any). Targeted Board – Proxy – Targeted Director is an indicator for targeted directors who are either (i) up for election during an activism year when dissidents do not explicitly identify the directors they seek to replace or (ii) explicitly named as a target by activists. Targeted Board – Proxy – Non-Targeted Director is an indicator for the rest of directors in Targeted Board – Proxy. Observations where the firm is not on Equilar in year t + 2, presumably due to bankruptcy, delisting, mergers, etc. are excluded. We include all control variables from Panel A of Table 2 but these are not tabulated for parsimony. All regressions include year fixed-effects and robust standard errors (in parentheses) clustered at the firm level. *** (**, *) indicates significance at the 1% (5%, 10%) level.
(1) (2) (3) All directors Independent
directors Inside directors
Targeted Firm – Non-Board 1.90*** 2.13*** 1.50 (0.70) (0.80) (1.11) Targeted Board – Non-Proxy 5.06*** 4.87*** 7.29*** (1.37) (1.51) (2.75) Targeted Board – Proxy 7.08*** 7.11*** 6.02*** – Non-Targeted Director (1.08) (1.22) (2.20) Targeted Board – Proxy 21.34*** 18.88*** 34.66*** – Targeted Director (3.71) (4.11) (7.34) Controls Yes Yes Yes Adj. R2 0.01 0.01 0.01 Num. obs. 245,774 174,858 44,146

85
Table 3.7. Impact of shareholder activism on individually targeted directors (Continued)
Panel B: Other directorships
The table presents results from OLS regressions where the dependent variable is how many directorships a director has with firms other than the firm of interest in year t + 2 (i.e., the year after then activism event, if any). Targeted Board – Proxy – Targeted Director is an indicator for targeted directors who are either (i) up for election during an activism year when dissidents do not explicitly identify the directors they seek to replace or (ii) explicitly named as a target by activists. Targeted Board – Proxy – Non-Targeted Director is an indicator for the rest of directors in Targeted Board – Proxy. Columns 1 and 2 present results for all directors. In Columns 2, 4, and 6 we include interaction variables with Departure(t,t+2), i.e., an indicator for the director leaving the board of the firm by year t + 2 (i.e., the year after the activism event, if any). Columns 3 and 4 present results for independent directors and Columns 5 and 6 present results for inside directors. All control variables from Table 6 are included but not tabulated for parsimony. All regressions include year fixed-effects and robust standard errors (in parentheses) clustered at the firm level. *** (**, *) indicates significance at the 1% (5%, 10%) level.
(1) (2) (3) (4) (5) (6) All
directors All
directors Ind.
directors Ind.
directors Inside
directors Inside
directors Other Boards 0.76*** 0.76*** 0.76*** 0.77*** 0.74*** 0.75*** (0.00) (0.00) (0.00) (0.00) (0.01) (0.01) Targeted Firm – Non-Board 0.04*** 0.02** 0.05*** 0.03** 0.02 -0.01 (0.01) (0.01) (0.01) (0.01) (0.02) (0.02) Targeted Board – Non-Proxy -0.04*** -0.03* -0.03* -0.03 -0.03 0.01 (0.01) (0.02) (0.02) (0.02) (0.02) (0.03) Targeted Board – Proxy -0.00 0.01 -0.00 0.01 -0.01 -0.03 – Non-Targeted Director (0.01) (0.02) (0.01) (0.02) (0.02) (0.03) Targeted Board – Proxy 0.01 0.02 -0.01 -0.02 0.04 0.07 – Targeted Director (0.02) (0.03) (0.03) (0.04) (0.05) (0.07) Departure(t,t+2) 0.00 -0.00 0.05*** (0.00) (0.00) (0.01) Targeted Firm – Non-Board × Departure(t,t+2)
0.02 0.04 0.04 (0.02) (0.02) (0.04)
Targeted Board – Non-Proxy × Departure(t,t+2)
-0.01 0.00 -0.10** (0.02) (0.03) (0.05)
Targeted Board – Proxy – Non-Targeted Director × Departure(t,t+2)
-0.03 -0.03 0.03
(0.02) (0.03) (0.04)
Targeted Board – Proxy – Targeted Director × Departure(t,t+2)
-0.01 0.02 -0.08
(0.04) (0.05) (0.08)
Controls Yes Yes Yes Yes Yes Yes Adj. R2 0.67 0.67 0.68 0.69 0.57 0.58 Num. obs. 309,265 307,773 217,780 216,882 57,609 57,171

86
Panel A of Table 3.7 presents results from a regression analogous to those in Panel A of
Table 3.2. We focus on Departure(t+1, t+2) as the dependent variable, as a director generally needs
to be on the board at the time of activism (year t + 1) to be explicitly or implicitly targeted, so
turnover of targeted directors is only possible from t + 1. The coefficient on Targeted Board –
Proxy – Targeted Director is large and significant (21.34, p-value < 0.01), which suggest that the
targeted directors are 21 percentage points (19 and 35 percentage points for independent and inside
directors, respectively) more likely to leave the board by the year after activism than non-targeted
directors (21.34– 7.08 = 14.26, p-value < 0.01).
Panel B of Table 3.7 presents regressions analogous to those in Table 3.6, where the
dependent variable is Other Boardst+2. We find no evidence that directors suffer reputational
consequences from being individually targeted.
In short, Table 3.7 presents evidence consistent with consequences for individually targeted
directors being greater in terms of loss of seats on the targeted firm, but provides no evidence of
reputational consequences in the form of loss of directorships on other boards.
3.8. Additional analyses
In this section we provide additional tests of our prior results using within-firm analysis
and a propensity score matched sample.
3.8.1. Within-firm analyses
One issue with our results is that activists are unlikely to target firms at random and it is
difficult to control for all determinants of activists’ targeting decisions, as it is likely that some of
these are not observable by us. If some of these omitted determinants are correlated with director
turnover, our estimates will be biased. With a view to address this concern, we examine directors

87
on boards of two distinct sets of firms. The first set of firms comprises those with staggered boards
and the second set comprises non-staggered boards.
The presence of a staggered board means that only some directors will be nominated for
election during the activism event and we find that it is these nominated directors that are targeted
by activists (see Example 2 of Appendix D for an instance of this). This gives rise to within-firm
variation in whether an individual director was targeted that is plausibly exogenous, as there is no
reason to expect that the class of directors up for election in the year of activism to be inherently
different from the other classes of directors.27 Estimating a regression using such firms and
including firm-year fixed effects allows us to estimate the effect of being a targeted director
independent of any characteristics that led the firm to be targeted in the first place. As such,
estimated coefficients from this regression are more plausibly capturing the causal effect of
activism. We use ISS Voting Analytics to identify directors who were subject to a director election
in the year of activism (t + 1).
Panel A of Table 3.8 presents these results. Columns 1 to 3 present results for sample firms
that have staggered boards. Columns 1 and 2 include firm and firm and year fixed effects,
respectively. We find that directors of targeted firms (Targeted Firm) are more likely to leave their
boards within three months of the shareholder meeting when the firm is subject to activism
(coefficient = 2.67 in Column 1, p-value < 0.01). Further, we find that being up for election (Up
for Election) is positively associated with director turnover; directors up for election are more
likely to have left the board within three months following shareholder meetings (coefficient =
3.95 in column 1, p-value < 0.01). In Column (3), we include firm-year fixed effects and the
coefficient on Targeted Firm × Up for Election remains positive and significant. This suggests
!!!!!!!!!!!!!!!!!!!!!!!!!!!!!!!!!!!!!!!!!!!!!!!!!!!!!!!!27 The possibility that the timing of activism is prompted by the identity of directors up for election in that year is one caveat to our analysis.

88
that the director turnover result is simply not a function of being up for election but it is an effect
related to activism.
To complete the picture, we also consider directors on non-staggered boards and again
include firm-year fixed effects to isolate the impact on targeted directors independent of firm-
characteristics. Columns 4, 5, and 6 present these results where we regress director turnover on
Targeted Director. Given that all directors are up for election in each year, activists who seek
board positions through proxy fights generally explicitly identify the directors who their candidates
would replace (e.g., Example 1 of Appendix D). Columns 4, 5, and 6 include firm, firm and year,
and firm-year fixed effects, respectively. Estimates in Columns 4 and 5 show that our earlier results
from Table 3.7 are robust to the inclusion of firm and firm and year fixed effects. In column (6)
we find that explicitly targeted directors are indeed the ones who are more likely to turn over
(coefficient 10.39, p-value < 0.05) than their peers (i.e., directors at the same firm in the same year)
who were not targeted. As explicitly targeted directors are deliberately selected by activists, they
are plausibly the ones most likely to suffer broader reputational consequences from being targeted.
Table 3.8. The effect of proxy fights on directorships: Within-firm analysis
Panel A: Effects on director turnover
This table reports results from OLS regression where the dependent variable is Departure in 3 months, i.e., an indicator for the director leaving the board of the firm by 3 months from shareholder meeting date following activism (i.e., the year after the activism event). Sample comprises director-years of firms with staggered boards for the first three columns and director-years of firms with non-staggered boards for the last three columns. Up for Election indicates that the director was up for director election according to ISS Voting Analytics in year t + 1. Targeted Director indicates that the director was targeted by activists due to being explicitly targeted by activists. Numbers in parentheses are robust standard errors. *** (**, *) indicates significance at the 1% (5%, 10%) level.

89
Table 3.8. The effect of proxy fights on directorships: Within-firm analysis (Continued)
Staggered boards
Non-staggered boards
(1) (2) (3) (4) (5) (6)
Departure in 3 months
Departure in 3 months
Departure in 3 months
Departure in 3 months
Departure in 3 months
Departure in 3 months
Targeted Firm 2.67*** 3.20*** 4.60*** 6.22*** (0.83) (0.81) (0.70) (0.68)
Up for Election 3.95*** 3.64*** 3.48*** (0.19) (0.17) (0.13) Targeted Firm × Up for Election
3.11** 3.20** 3.17*** (1.43) (1.41) (1.05)
Targeted Director 8.15* 8.24* 10.39** (4.34) (4.37) (4.04) Fixed effects Firm Firm & Year Firm-Year Firm Firm & Year Firm-Year
Adj. R2 0.18 0.33 0.67 0.16 0.27 0.59 Num. obs. 106,974 106,974 106,974 106,123 106,123 106,123
Panel B: Other directorships
This table reports results from OLS regression where the dependent variable is Other Boardst+2, which is the number of directorships a director has with firms other than the firm of interest in year t + 2 (i.e., the year after then activism event, if any). Sample comprises director-years of firms with staggered boards for the first three columns and director-years of firms with non-staggered boards for the last three columns. Up for Election indicates that the director was up for director election according to ISS Voting Analytics in year t + 1. Targeted Director indicates that the director was targeted by activists due to being explicitly targeted by activists. Numbers in parentheses are robust standard errors. *** (**, *) indicates significance at the 1% (5%, 10%) level.
Staggered boards
Non-staggered boards
(1) (2) (3) (4) (5) (6)
Other Boardst+2
Other Boardst+2
Other Boardst+2
Other Boardst+2
Other Boardst+2
Other Boardst+2
Other Boards 0.75*** 0.75*** 0.76*** 0.75*** 0.75*** 0.76*** (0.00) (0.00) (0.00) (0.00) (0.00) (0.00) Targeted Firm -0.02 -0.01 0.02 0.03** (0.02) (0.02) (0.01) (0.01)
Up for Election 0.01*** 0.01*** 0.01** (0.00) (0.00) (0.00) Targeted Firm × Up for Election
-0.01 -0.01 0.00 (0.02) (0.02) (0.02)
Targeted Director 0.04 0.04 0.00 (0.06) (0.06) (0.08)
Fixed effects Firm Firm & Year Firm-Year Firm Firm & Year Firm-Year
Adj. R2 0.72 0.72 0.74 0.70 0.70 0.73 Num. obs. 100,617 100,617 100,617 95,427 95,427 95,427

90
In Panel B of Table 3.8 we examine the impact of activism on other directorships of
targeted directors using the same fixed effects design as discussed in Panel A results above. For
staggered boards (columns 1 to 3) we find no effect on targeted firm directors or for the interaction
of targeted firm with directors up for election (Targeted Firm × Up for Election). Similarly, we
find no effect on these variables in non-staggered boards (columns 4 to 6). These results suggest
that there is no reputational impact on other directorships from activism consistent with our results
in Table 3.6 and Panel B of Table 3.7.
While consistent with our earlier results, these inferences are quite different from those in
Fos and Tsoutsoura (2014), who find evidence consistent with directors’ seats on other boards
being negatively affected by proxy fights in which they are up for election. Our analysis suggests
that these differences in inferences are not attributable to research design, but are possibly
attributable to differences in sample period and data source (i.e., Fos and Tsoutsoura (2014) use
BoardEx, which includes unlisted and non-profit boards).28
3.8.2. Propensity score matching
To confirm that our results are not driven by significant differences between targeted and
non-targeted firms that are not effectively controlled for in a linear regression framework, we
employ a propensity score matching procedure to achieve covariate balance between the treatment
(targeted) and control (non-targeted) firms. We create a control sample of directors whose firms
were not targeted, but comparable on all observed covariates to a treatment sample of directors
!!!!!!!!!!!!!!!!!!!!!!!!!!!!!!!!!!!!!!!!!!!!!!!!!!!!!!!!28 The average number of other directorships in Fos and Tsoutsoura (2013) is 2.2, which is significantly greater than our 0.613 for non-targeted firms and 0.689 for firms targeted for shareholder activism. This difference is likely attributable to Fos and Tsoutsouras’s inclusion of directorships in private companies. We follow most prior research in considering only public companies, as this is where the reputational effect is expected to be stronger. Our numbers are fairly consistent with prior research. For example, Fich and Shivdasani (2007) report 0.95 other directorships for a sample of sued firms in 2002, and Ertimur et al. (2012) report 0.797 other directorships for their sample of firms.

91
whose firms were targeted by activists. We first use a logit regression using the control variables
from Table 3.2 to estimate the probability (propensity score) that a firm would be targeted by an
activist (Pr(Targeted Firm)) and match each targeted firm with a non-targeted firm from the same
year with the nearest propensity score. Then we compare the difference in outcome variables (in
particular, Departure(t, t+2), Other Boardst+2) for the treatment and control firms. We verify that
difference in means for each covariate after the match is insignificant, implying covariate balance
between the treatment and control samples.
Table 3.9. Propensity score matching
Panel A: Effect of shareholder activism on director turnover The table presents results from analysis using propensity score matching. Coefficients represent estimated effect on Departure(t,t+2), i.e., an indicator for the director leaving the board of the firm by year t + 2 (i.e., the year after the activism event, if any) of being targeted by activists in the respective category relative to directors at non-targeted firms. One control firm is selected for each treated firm using propensity scores and exact matching on years. Propensity scores are estimated using a logit regression where the dependent variable is an indicator for being targeted and the independent variables are the controls reported in Panel A of Table 2. *** (**, *) indicates significance at the 1% (5%, 10%) level. Standard errors are in parentheses.
(1) (2) (3) All directors Independent directors Inside directors
Targeted Firm 0.089*** 0.081*** 0.127*** (0.006) (0.007) (0.016)
N (Treatment) 8,015 5,840 1,336 Targeted Firm – Non-Board 0.067*** 0.064*** 0.071**
(0.008) (0.009) (0.020) N (Treatment) 4,520 3,237 790
Targeted Board – Non-Proxy 0.105*** 0.081*** 0.154*** (0.016) (0.017) (0.045)
N (Treatment) 1280 947 201 Targeted Board – Proxy 0.131*** 0.106*** 0.165***
(0.012) (0.014) (0.033) N (Treatment) 2215 1,656 345
Targeted Director 0.137*** 0.104*** 0.167*** (0.029) (0.032) (0.071)
N (Treatment) 423 328 60

92
Table 3.9. Propensity score matching (Continued)
Panel B: Effect of shareholder activism on other directorships The table presents results from analysis using propensity score matching. Coefficients represent estimated effect on how many directorships a director has with firms other than the firm of interest in year t + 2 (i.e., the year after then activism event, if any) of being targeted by activists in the respective category relative to directors at non-targeted firms. One control firm is selected for each targeted firm using propensity scores and exact matching on years. Propensity scores are estimated using a logit regression where the dependent variable is an indicator for being targeted and the independent variables are the controls reported in Panel A of Table 2. *** (**, *) indicates significance at the 1% (5%, 10%) level. Standard errors are in parentheses.
(1) (2) (3) All directors Independent directors Inside directors
Targeted Firm 0.007 0.003 0.039 (0.013) (0.016) (0.023)
N (Treatment) 11,714 8,561 1,957 Targeted Firm – Non-Board 0.006 0.028 0.033
(0.018) (0.021) (0.031) N (Treatment) 6,934 5,025 1,194
Targeted Board – Non-Proxy -0.005** -0.031 0.058 (0.031) (0.037) (0.052)
N (Treatment) 1,754 1,301 274 Targeted Board – Proxy 0.022 0.030 -0.006
(0.024) (0.030) (0.046) N (Treatment) 3,026 2,235 489
Targeted Director 0.011 -0.051 0.201*** (0.048) (0.061) (0.079)
N (Treatment) 703 514 144
Results for director turnover are presented in Panel A of Table 3.9. Consistent with our
results in Panel A of Table 3.2, directors of targeted firms have higher likelihood of leaving the
board of a targeted firm (estimated effect of 0.089, p-value < 0.01) than directors of matched firms,
the estimated effect increases as the activism becomes more board-related (estimated effects for
Targeted Board – Non-Proxy and Targeted Board – Proxy of 0.105 and 0.131 respectively, both
with p-values < 0.01) and targeted at individual directors (coefficient = 0.137, p-value < 0.01).

93
Results for other directorships are presented in Panel B of Table 3.9. These are consistent
with those found in Panel B of Table 3.7. When the number of directorships held by a director on
other boards is the outcome, the differences in means are small and statistically insignificant,
consistent with our earlier results.
3.9. Conclusion
We examine career consequences for directors when firms are subject to activist
shareholder interventions. First, we study director turnover on the board of the firm subject to
activism, including whether activism increases director turnover-performance sensitivity. Next,
we examine voting outcomes for directors in elections to assess if shareholders express their
displeasure through their votes. We then examine the role of voting in precipitating departures of
targeted directors. Finally, we examine reputational consequences of shareholder actions by
looking at changes in the number of board positions held by directors at other public firms.
Our results suggest that directors exit the board at higher rates when their firms are targeted
for shareholder actions: 18.0 percent of directors are no longer on the boards of firms targeted for
shareholder activism at the end of the year after the activism event compared to 12.5 percent for
firms that are not targets of activism. Unsurprisingly, directors targeted by activists in proxy fights
are significantly more likely to leave the board after the activism event. We find that directors not
directly targeted by dissident shareholders are also likely to leave the board, as are directors at
targeted firms even when no board-related demands are made as part of the activism, let alone a
formal proxy fight. All these results hold after controlling for factors driving director turnover and
targeting by activists. The increased turnover exists for both inside and independent directors.
Activism is associated with higher performance sensitivity of director turnover, with the
association between industry-adjusted stock returns and director turnover being greater when a

94
firm is targeted by activists. We also find that shareholder voting matters for director turnover.
Directors that receive a greater negative vote percentage in the year of shareholder activism are
less likely to remain on the board in the year after activism. This finding may provide some relief
to skeptics who worry that shareholder voting is ineffective in disciplining directors: Directors
appear to heed the message in the negative vote and resign, though it is unclear what compels them
to do so given that they receive majority support in most cases.
Director reputation as measured by number of directorships at other firms is not associated
with activism. Neither proxy fights nor other forms of shareholder activism have any apparent
association with the number of other directorships in the year after the activism event. Even
directly targeted directors experience no loss in directorships and the lack of association holds for
both inside and independent directors.
Our paper provides evidence consistent with shareholder activism imposing career costs
on directors, even when such activism is not directed explicitly at board representation and does
not result in a proxy contest. Evidence from prior research suggests that proxy contests are not an
effective mechanism for disciplining boards since they rarely succeed in getting a majority of
shareholder support. Our results suggest that activists need not even engage in, let alone win, proxy
contests to remove directors. Overall, our results are consistent with shareholder activism
increasing board turnover and accountability for poor performance, but we do not find evidence
of broader reputational consequences.

95
CHAPTER 4
ACTIVIST DIRECTORS: DETERMINANTS AND CONSEQUENCES
4.1. Introduction
Hedge fund activism has become a significant phenomenon in recent years. This kind of
activism differs from more traditional forms of shareholder activism, such as shareholder proposals
filed under SEC Rule 14a-8, both in the nature of the activists, as well as in the scale and type of
intervention. More traditional activism has often been initiated by pension funds and individual
activists (sometimes called “gadflies”) with relatively weaker incentives to generate higher returns
by influencing the management of a firm. In contrast, as pointed out by Brav, Jiang and Kim (2010),
hedge funds have stronger incentives to produce higher returns, fewer conflicts of interest, and
“much more flexibility to intervene in the invested companies.” (Brav et al. 2010, p.187). These
differences appear to have led to hedge fund activists making a broader range of demands and
adopting a wider range of tactics to have those demands met than traditional shareholder activists.
One approach used by hedge fund activists to influence companies, in which they have
invested, is to seek to join the board of directors of these companies. But this is not costless. First,
there are direct costs associated with getting on the board, which Gantchev (2013) finds to be
significant. Second, by joining the board the activists (or their nominees) stake their reputations
by taking on a role in implementing their demands. Third, board positions also come with fiduciary
responsibilities towards all shareholders. Given the additional cost and commitment required of
activists that get board representation—and the tendency for such investors to take “long-term”
positions when they do so—studying the actions of firms with such directors can provide new
insight into the motives and effects of hedge fund activists.

96
Hedge fund activism is not without its critics. Some have argued that hedge fund activism
is potentially harmful due to the possibility that the activist interests are “not necessarily aligned
with the interests of long-term investors” (Stringe Jr, 2014). Given the potentially greater influence
that activists have when they get in the boardroom, by focusing on such cases, our paper aims to
deepen our understanding of the effects of hedge fund activism.
Our paper addresses a number of questions related to activist directors. First, we focus on
the circumstances surrounding the appointment of activist directors to the board. When do activists
seek board representation? And when are they successful in obtaining it? How do activist directors
differ from other directors? Second, what impact do activists have when they get on the board?
Does their impact differ from that of other cases of activism? Finally, is there evidence of short-
termism?
Our sample of 2,756 activism events comprises all activism events targeted at US
companies from 2004 to 2015.29 In each case, we code whether the activist made demands for
board representation and whether the activist obtained seats on the board. We identify 1,369
directors who were appointed to the board in response to activist demands. With regard to the first
set of questions, we find, consistent with prior research, that activists tend to target firms with more
institutional shareholders, smaller market capitalization, and worse recent stock performance.
Additionally, conditional on being targeted by activists, we find that activists are more likely to
demand board representation when the firm has worse performance, less leverage and is smaller.
With regard to performance, we find evidence that board representation is demanded at firms with
worse stock market performance, but with higher institutional ownership; this is consistent with
board representation being sought for objectives other than reversing poor operating performance.
!!!!!!!!!!!!!!!!!!!!!!!!!!!!!!!!!!!!!!!!!!!!!!!!!!!!!!!!29 We additionally require that the target firm is matched to CRSP, is not an investment trust or mutual fund, and that the event is not a control contests involving another corporation.

97
But we also find that firms with older directors and with staggered boards are more likely to be
targeted. Conditional on a firm being targeted for activism, we find little that explains when
activists get board seats.
We describe the characteristics of activist directors and compare them with new directors
appointed at other firms.30 We find that activist director characteristics differ according to whether
the director is affiliated with activists or not. Activist-affiliated directors (i.e., employees or
principals of members of the activist group) are about 9 years younger than other new directors
and much less frequently female. Activist directors are appointed to key committees just as often
as other new directors, suggesting that they quickly move into key board positions. About 40
percent (541 of 1,369) of activist directors are directly employed at the activist hedge fund; the
rest (828) appear to be unaffiliated directly to the hedge fund despite being sponsored by the
activist for the board position.
Using methods that account for censoring, we find that activists hold stock in a target firm
for a median of about 2.3 years when their demands do not include board representation, and that
this increases to 3.5 years in cases where the activists obtain board representation. Greater than a
three-year holding period implies that these activists can be considered as “long-term” investors.31
We then examine a number of possible consequences of activist directors for the firms
whose boards they join. Consistent with prior research, we find significant risk-adjusted returns
around the announcement of activism, with size-adjusted returns from -20 to +20 trading days
around the announcement ranging from 5% to 14%. We find no evidence of a market reaction at
the appointment of activist directors, perhaps reflecting the difficulty of identifying precisely when
!!!!!!!!!!!!!!!!!!!!!!!!!!!!!!!!!!!!!!!!!!!!!!!!!!!!!!!!30 Gow, Shin and Srinivasan (2014) shows that activism is often associated with departure of incumbent directors. 31 As discussed in Section 5, pension funds have a typical duration of 2 years and investor relation professionals consider a horizon of more than 2.8 years to warrant the label “long-term.”

98
the market learns about activist board appointments. Looking beyond positive announcement-
period returns, operating performance seems to improve, with return on assets increasing by 1-2%
over the five years after activism. In terms of underlying actions, we find evidence of increased
divestiture, decreased acquisition activity, higher probability of being acquired, lower cash
balances, higher payout, greater leverage, higher CEO turnover, lower CEO compensation, and
lower capital expenditure, research and development. With the exception of the probability of
being acquired, the estimated effects are generally greater when activists obtain board
representation (though not always statistically so), consistent with board representation being an
important mechanism for bringing about the kinds of changes that activists often demand.
The primary goal of our paper is to contribute to the understanding of the increasingly
important phenomenon of hedge fund activism. Overall, we find that activist directors are
associated with significant strategic and operational actions by firms. While the observational data
available to us do not permit unequivocal causal inferences, the associations we document appear
consistent with hedge fund activists having an impact, especially when they obtain board
representation.
The breadth and depth of these apparent effects suggest that, when activists get board
representation, their impact is not simply about the “ability of activists to force target firms into a
takeover” (Greenwood and Schor, 2009, p.362). However, even if given a causal interpretation, it
is unclear whether all of these effects are beneficial to shareholders. For instance, while our
evidence is consistent with activist directors playing a significant role in curbing expenditures on
capital and research and development (R&D), it is unclear whether this reflects curtailment of
excessive investments or, as critics of activists might suggest, underinvestment with a focus on the
short term. However, the relatively long-term holding period in cases where activists become

99
directors, positive stock market effect, and long-term operating performance improvements seem
inconsistent with activist directors being short-termist.
The rest of the essay proceeds as follows. Section 4.2 describes features of shareholder
activism campaigns and related literature. Section 4.3 describes our data and descriptive statistics.
Section 4.4 examines the circumstances in which activists seek and obtain board representation.
Section 4.5 examines the association with activist board representation and activist holding periods.
Section 4.6 examines stock returns for activism targets with and without board-related demands
and for firm where activists get board representation. Section 4.7 examines the association between
activist directors and firm outcomes, such as operating performance, investment behavior and CEO
incentives. Section 4.8 concludes.
4.2. Institutional background and prior literature
In this section we discuss institutional details and related research. We first provide some
illustrative examples of activist engagements with companies to provide a flavor of the wide
variety of tactics and strategies employed by activists, the types of demands made, and outcomes
that are associated with activism. These examples show how seeking directorships in target firms
is an important element of the activist approach.
4.2.1. Illustrative cases
In some cases, activists make pointed demands that yield swift reaction from the target
firms. For example, on June 6, 2012, Becker Drapkin Management LP filed a 13D reporting a 5%
stake in Tuesday Morning Corporation. In a letter to the board, Becker Drapkin complained that
the company’s performance had suffered since Kathleen Mason became CEO in 2000, and that
100
shareholder representation on the board was necessary to instill accountability. Later that same
day, the company announced the departure of Kathleen Mason as president and CEO and that it
had commenced a search for a new CEO. On June 26, 2012, Becker Drapkin disclosed that it was
engaged in discussions with the company regarding board representation. On July 2, 2012, the
company announced the appointment of two representatives of Becker Drapkin to the board, that
it would work with Becker Drapkin to add two additional independent directors, and Becker
Drapkin agreed to standstill provisions lasting two years.32
In other cases, board demands emerge only after continued poor performance and
resistance to the activist’s demands. For example, on June 28, 2007, Barington Capital Group L.P.
sent a letter to the Chairman and CEO of Dillard’s Inc. requesting a meeting to discuss measures
to achieve better financial performance and operational efficiency. After this request was declined,
on August 30, 2007, Barington sent yet another letter to the board expressing disappointment with
the company’s poor operating performance and poor corporate governance. On January 29, 2008,
Barington jointly filed a 13D with the Clinton Group and RJG Capital Management, LLC, asking
for a review of executive pay and measures to improve performance and enhance corporate
governance. The dissident group gave formal notice to the company of its intent to nominate
directors for the upcoming election on March 19, 2008. On April 1, 2008, Dillard’s settled with
Barington and other dissidents and nominated two candidates proposed by the dissident group for
election to the board of directors.
Another example is Blockbuster Inc. which was the target of prominent activist Icahn
Associates Corp. This event started on April 7, 2005, when Carl Icahn disclosed that he had
requested Blockbuster extend the deadline for nominating directors for election at the company’s
!!!!!!!!!!!!!!!!!!!!!!!!!!!!!!!!!!!!!!!!!!!!!!!!!!!!!!!!32 Material in this subsection draws primarily from synopses provided by StreetEvents.

101
2005 annual meeting. The company rejected the request and on April 8, 2005, Icahn sent formal
notice that he was nominating himself and two others for election to Blockbuster’s board. In his
communications with stockholders, Icahn criticized Blockbuster’s compensation practices and
management’s business plan and stated that if elected his nominees would bring discipline to the
“spending spree.” Icahn also stated that he believed the company should put itself up for sale. At
the annual meeting, Icahn received 63% of the votes cast and his two other nominees received 68%
of the votes cast.
Following these illustrative examples, we examine several outcomes in activist director
companies. These include firm performance outcomes measured using stock returns and
accounting performance; governance outcomes such as CEO turnover and CEO compensation;
strategic outcomes such as divestitures and acquisitions; financial policy outcomes such as
leverage and payouts; and investment policy decisions such as capital expenditures, research and
development, and advertising. While we examine these outcomes in the context of activist
directors, prior papers have examined some of these outcomes in the context of hedge fund
activism in general. We discuss this research next.
4.2.2. Causes and consequences of hedge fund activism
The phenomenon of shareholder activism that we examine is driven in large part by activist
hedge funds over the last decade. Brav, Jiang, Partnoy and Thomas (2008) identify structural
benefits enjoyed by hedge funds—such as fewer regulations and better incentives—that have
allowed such funds to be more active in pursuing governance changes in companies than mutual
fund or pension managers. Like prior research (Brav et al. 2008), the ultimate source for much of
the data we use to identify activism events comes from 13D filings with the SEC. According to

102
the SEC, “when a person or group of persons acquires beneficial ownership of more than 5% of a
voting class of a company’s equity securities registered under Section 12 of the Securities
Exchange Act of 1934, they are required to file a Schedule 13D with the SEC.”33 This filing should
be made within 10 days of the trade date of the securities transaction triggering the requirement to
file. If a shareholder has not “acquired the securities with any purpose, or with the effect of,
changing or influencing the control of the issuer,” then a more abbreviated filing on Form 13G
may be used.34 As hedge fund activists when launching a campaign look to change or influence
the target and quite often exceed the 5% threshold, 13D filings are a typical concomitant of such
campaigns.
In terms of firm characteristics that attract activist hedge fund attention, prior research
suggests that hedge fund activists typically target smaller firms, value-oriented firms (low market-
to- book), and firms with sound operating cash flows but low sales growth, leverage and dividend
payouts (Brav et al. 2010). This evidence motivates us to use firm-level covariates to control for
factors causing firms to be targeted by activist investors. Gantchev (2013) models activism as
involving a sequence of decisions beginning with broad activist demands, followed by demands
for board representation, then threatened, then actual, proxy contests. Gantchev (2013) estimates
costs associated with these stages using a system of recursive logistic regressions and finds that
such costs reduce activist returns by more than two-thirds, but net returns are not negative. Our
paper complements Gantchev (2013) by providing evidence on the kinds of actions facilitated by
escalation of activism to the level of obtaining board representation.
!!!!!!!!!!!!!!!!!!!!!!!!!!!!!!!!!!!!!!!!!!!!!!!!!!!!!!!!33 https://www.sec.gov/answers/sched13.htm, accessed 2014-05-26. 34 6http://www.sec.gov/divisions/corpfin/guidance/reg13d-interp.htm, accessed 2014-05-26. Also see SEC Rule 13d-1(c)(1).

103
In terms of consequences, prior research (see Brav et al. 2008, Klein and Zur 2009,
Greenwood and Schor 2009) finds a positive stock price reaction of about five percent to the
announcement of activist campaigns, typically centered around the 13D announcement dates.
Greenwood and Schor (2009) find that the positive market reaction arises from cases where the
activists are able to force the target firms to be sold following the activist campaign. They find no
significant market reaction at the 13D filing date for firms that are not acquired ex-post. Klein and
Zur (2009) suggests that one source of shareholder gains is the transfer of wealth from debtholders
to stockholders. This likely occurs because activists demand reduction in cash holdings and
increase in leverage in target firms. Brav et al. (2008) and Bebchuk et al. (2013) also find that
operating performance as measured by return on assets is higher in the three to five-year period
following the launch of activism. The mechanisms that drive possible performance improvements
in firms that continue to be independent have not been explored much in research with the
exception of Brav et al. (2013). Using plant-level information from the US Census Bureau they
find that the average target firm improves production efficiency in the three years after the activist
engagement. Employees exhibit increase in labor productivity but a stagnation in wages. In related
research, Brav et al. (2014) find that targets of hedge fund activism exhibit reduction in research
and development spending but an increase in innovation output suggesting an improvement in
innovation efficiency. Our paper complements this research by identifying a role for activist
directors in the changes brought about by activism thereby identifying a mechanism by which
activists carry out the changes they demand.
4.2.3. Other shareholder activism

104
While hedge fund activism is a relatively recent phenomenon, a body of prior research has
examined the effect of shareholder activism by pension and labor union funds. Early research
focused on the activities of pension plans, such as CalPERS (Smith 1996) and TIAA-CREF
(Carleton, Nelson and Weisbach 1998). While pension plans have typically focused on governance
changes generally proposed as part of 14a-8 shareholder proposals, hedge funds often seek to make
more wide-ranging changes to the firms they target. One conclusion from research on pension plan
activism is that activist shareholders and firms often reach agreement without a formal 14a-8
proposal being voted upon—for instance, Carleton et al. (1998) find that TIAA-CREF is able to
reach agreements with targeted companies 95 percent of the time and in over 70 percent of cases
without a shareholder vote on the proposal. In the UK, Becht, Franks, Mayer and Rossi (2010)
study a mutual fund (Hermes) and find that this fund acts—predominantly through private
interventions. This is consistent with our finding that activists often obtain board representation
without a formal proxy fight.
4.2.4. Director elections and proxy fights
The routine mechanism for someone to become a director is to be nominated for election
by the incumbent board. Unless invited onto the board, the only way for activist shareholders to
obtain board representation is to initiate a proxy solicitation campaign in a contested election.
Contested elections are contests between the incumbent set of directors put forward by the
company and a dissident slate nominated by an outside investor. Dodd and Warner (1983) provide
early evidence consistent with proxy fights creating value for shareholders. They find a statistically
significant positive share price effect associated with a proxy contest regardless of whether the
contest was successful or not. However, a number of studies find limits to the effectiveness of

105
proxy contests. While Mulherin and Poulsen (1998) find evidence “that proxy contests create value”
using a sample of 270 proxy contests covering 1979–1994, but they also find that “the bulk of the
wealth gains stemming from firms that are acquired.” Pound (1988) identifies cost and
management incumbency as impediments to successful proxy fights. More recently, Bebchuk
(2007) claims that shareholders’ power to obtain board representation is largely a “myth” due to
free-rider issues associated with investing in costly proxy contents. While activist directors often
join boards as a result of a proxy contest, the majority of activist directors in our sample join
through negotiation with the incumbent board. We contribute to this debate by providing evidence
consistent with an important class of investors being able to get board representation even absent
a contested election.
4.2.5. Specialist outside directors
Our paper is also related to prior literature that examines the impact of specialist directors,
such as financial experts, since activist directors are often associated with hedge funds or are
unaffiliated directors selected for particular expertise. DeFond, Hann, and Hu (2005) find a
positive stock price reaction when directors with accounting expertise are appointed to the audit
committee. Guner, Malmendier, and Tate (2008) find evidence consistent with bankers influencing
financing and investing decisions, but perhaps in ways that reflect conflicts of interests. Huang,
Jiang, Lie and Yang (2014) find that firms with investment bankers on their boards make more
acquisitions and experience higher takeover announcement returns and pay lower premiums than
other firms.
Overall, this literature shows that directors bring specific types of expertise to boards and
firms appear to use this expertise. One difference of our paper from this research stream is that we

106
examine a class of directors that are not voluntarily invited by the boards that they join. Even in
cases that do not involve a proxy fight, activist directors join boards as a result of a negotiated
outcome between the activist and the incumbent board and management. Given that activist
directors join the board for a specific activist purpose, their role on the board is likely to be different
from that of other directors.
4.3. Data and descriptive statistics
4.3.1. Activism events
Our data on activism events come from the FactSet SharkWatch database, which contains
information on shareholder activism events, primarily in the United States and generally involving
hedge fund activists. From SharkWatch, we collect information on all publicly disclosed activism
events that commenced between January 1, 2004 and December 31, 2015 where the target firm is
matched to CRSP, is incorporated in the United States, and is not an investment trust or mutual
fund, and where the event is not a control contest involving another corporation. This provides us
with 2,756 activism events. Note that our sample consists only of those events with no pending
action and does not include activism consisting only of shareholder proposals submitted under
Rule 14a-8. Table 4.1 provides details of the number of activism events over our sample period.
We divide the 2,756 activism events into three mutually exclusive categories: Activist director
events in which an activist won board representation (746 events), Board demand events in which
the activist sought, but did not win, board seats (627 events), and Non-board activism events in
which activists targeted the firm, but board representation was neither sought nor obtained (1,383
events).

107
Table 4.1. Activism events Table presents number of activism events by year. Activism refers to activism events in any of the following three mutually exclusive categories: Non-board activism refers to the number of non-board related activism events. Board demand refers to the number of activism events where activists demanded, but did not win, board seats. Activist director refers to activism events where activists were granted one or more board seats.
Year Activism Non-board activism Board demand Activist director 2004 104 46 30 28 2005 194 91 58 45 2006 315 163 73 79 2007 365 209 82 74 2008 332 165 83 84 2009 175 86 55 34 2010 207 121 39 47 2011 211 95 55 61 2012 245 135 50 60 2013 235 122 38 75 2014 209 85 36 88 2015 164 65 28 71 Total 2,756 1,383 627 746
4.3.2. Activist directors
For each activism event in which SharkWatch indicated that the activist obtained board
representation, we used proxy statements (DEF 14A) and current filings (Form 8-K, Item 5.02) to
collect names of the directors who were appointed as a result of the activist campaign. We also
collected appointment dates and basic biographical details. We then examined subsequent SEC
filings to determine whether and, if so, when the director subsequently left the board during our
sample period. We classified directors into two categories. The Affiliated category comprises
directors that we identified as employees or principals of the members of the activist group, and
Unaffiliated covers the rest. Table 4.2 provides the yearly distribution of Affiliated and Unaffiliated
directors. Of 1,369 activist directors appointed as the result of activism campaigns in our sample,
541 are Affiliated and 828 are Unaffiliated. For illustration, in the Blockbuster case discussed in
Section 4.2, Carl Icahn is clearly an affiliated director, while the other two nominees, “veteran
entertainment industry executives” Edward Bleier and Strauss Zelnick, are unaffiliated.

108
Table 4.2. Activist directors Table presents number of activist directors by year. Activist directors are directors who were appointed to the board in response to demands by activists. Affiliated (Unaffiliated) indicates activist directors who are (are not) employees or principals of a member of the dissident group. Elected indicates that the director was elected by shareholders through a shareholder vote. Settled indicates that the director was appointed to the board without a shareholder vote.
Year Activist director Affiliated Unaffiliated Elected Settled 2004 56 21 35 14 42 2005 86 36 50 16 70 2006 151 61 90 37 114 2007 140 68 72 44 96 2008 149 62 87 42 107 2009 59 26 33 17 42 2010 82 36 46 15 67 2011 103 39 64 31 72 2012 124 45 79 17 107 2013 153 47 106 59 94 2014 168 59 109 30 138 2015 98 41 57 6 92 Total 1,369 541 828 328 1,041
4.3.3. Activist holdings
To identify activist holdings of the stock of targeted firms, we use data from WhaleWisdom,
which provides comprehensive coverage of SEC Form 13F and 13F/A filings related to holdings
in at quarter-ends from 2001 onward.35 These filings are required on a quarterly basis for investors
having more than $100 million in assets under management. We find that 1,373 (50.31%) of the
activism events in our sample are associated with an activist that files on Form 13F.
4.3.4. Director characteristics
Our director-level data come from BoardEx.36 BoardEx database comprises directors of
every company that files both an annual report and an annual proxy statement (SEC Forms 10-K
and DEF 14A, respectively). For each director on a company’s board, BoardEx provides director-
!!!!!!!!!!!!!!!!!!!!!!!!!!!!!!!!!!!!!!!!!!!!!!!!!!!!!!!!35 See www.whalewisdom.com. 36 BoardEx is an executive compensation and corporate governance data firm.

109
level information such as committee memberships, gender, age, equity holding, etc. Panel A of
Table 4.3 presents director characteristics for each classification of directors. While we have data
on 426,891 directors since 2004, the more appropriate comparison group for activist directors, for
whom we present data in their first year on the board, is their fellow new directors. We identify
34,204 directors as new directors. We identify 727 activist directors (of our full sample of 1369)
on BoardEx; we find that some activist directors leave within a year (e.g., if the firm is acquired)
and BoardEx appears not to capture most such directors, as they often do not appear in the proxy
statement (DEF 14A).
Table 4.3. Director characteristics This table presents descriptive statistics for directors. Panel A presents data on directors matched to BoardEx. N refers to the number of observations. Age refers to mean age of directors in each category. Values for Female, Comp, Audit are means of indicator variables for being female, being a member of the audit committee, being a member of the compensation committee, being a member of the nominating committee, and being designated a financial expert of the audit committee, respectively. Panel A includes all directors, with Activist directors relating to activist directors in their first year on their respective boards. Panel B presents data on all activist directors (i.e., no requirement for BoardEx match). Tenure is measured in days and is censored for directors still active on February 29, 2016. Panel A: Director characteristics by activism classification
Category N Audit Comp Nom Listed Unlisted Female Age All directors 426,891 0.56 0.52 0.46 2.11 2.37 0.10 60.32 New directors 34,024 0.55 0.43 0.35 2.01 2.27 0.14 55.45 Activist directors 727 0.47 0.49 0.43 1.82 2.22 0.03 51.92 Affiliated directors 278 0.37 0.51 0.45 2.01 2.30 0.01 46.32 Unaffiliated directors 449 0.53 0.48 0.43 1.71 2.18 0.05 55.35
Panel B: Activist director tenure
Category N Left board Tenure Still active Tenure Unaffiliated directors 828 343 746 485 1,079 Affiliated directors 541 236 724 305 1,243
In general, the unaffiliated directors are similar to other new directors on most dimensions
except that there is a noticeably smaller number who are female (0.05 versus 0.10). However,

110
affiliated directors (i.e., employees or principals of members of the activist group) appear different;
they are younger (46 years of age) and rarely female (0.01). While activist directors appear more
likely to become members of the compensation or nomination committee in their first year of
service (0.49 or 0.43, respectively) versus (0.43 or 0.35, respectively, for directors not associated
with activism campaigns), they are less frequently added to the audit committee (0.47), especially
affiliated directors (0.37), than non-activism directors (0.55).37
Panel B of Table 4.3 presents data on the tenure of activist directors. About 60% of both
affiliated and unaffiliated activist directors remain on their respective boards at the time of our
data collection (February 2016). Affiliated (unaffiliated) directors who have left their respective
boards, did so after being on the board for 724 (746) days on average (i.e., they remained on the
board for about two years). In many cases, their departure was associated with the company being
acquired, going private, or going bankrupt. Affiliated and unaffiliated activist directors who are
still on their respective boards in February 2016 have an average tenure of about three or more
years. There is no apparent difference between affiliated and unaffiliated directors in these tenure
statistics.
4.3.5. Other data
Data on divestitures and acquisitions as used in Table 4.8 come from Capital IQ and CRSP.
In Tables 4.4 and 4.8–4.11, we use a number of controls drawn from several sources. We calculate
Analyst, the number of analyst forecasts for each firm-year using data from IBES. We derive the
proportion of the firm’s outstanding stock held by institutions (Institutional) using data from
!!!!!!!!!!!!!!!!!!!!!!!!!!!!!!!!!!!!!!!!!!!!!!!!!!!!!!!!37 SEC rules require a company to disclose whether it has at least one “audit committee financial expert” serving on its audit committee, and if so, the name of the expert and whether the expert is independent of management. See http://www.sec.gov/rules/final/33-8177.htm.

111
WhaleWisdom. Data on stock market performance come from CRSP and Ken French’s website.
The following variables come from Compustat: Market value, the value of market capitalization;
Book-to-market, market capitalization divided by the book value of common equity; Leverage,
sum of long-term debt and current liabilities divided by sum of long-term debt, current liabilities
and the book value of common equity; Payout, the ratio of the sum of dividends and repurchases
divided to EBITDA); ROA, EBITDA divided by the lagged total assets; Sales growth, Sales
divided by lagged sales. From BoardEx, we get the following variables: Num. directors, the
number of directors on the board; Outside percent, the percentage of outside directors; Age, the
average age of directors on the board; Tenure, the average years of directorship on the board; and,
Staggered board, an indicator for a classified board.
4.4. Activist target selection
Prior research suggests that hedge fund activists typically target smaller firms, value-
oriented firms (low market-to-book), and firms with sound operating cash flows but low sales
growth, leverage and dividend payouts (Brav et al., 2010). We extend this analysis to our sample
and additionally examine whether the factors that are associated with activists seeking, or getting,
board representation differ from those associated with activism in general.
We first examine the circumstances in which firms find themselves as the targets of
activists. Panel A of Table 4.4 reports the results of logistic regressions where the dependent
variables are indicators for activism and the sample is the universe of firm-years meeting our
sample requirements for the years 2004 to 2015.
The first column looks at the probability of being targeted for any kind of activism event,
the second column examines the determinants of an activist making demands for board

112
representation, and the third column examines the determinants of an activist getting representation
on a firm’s board.38 Consistent with prior research (Brav et al. 2008), we find that size-adjusted
returns and growth are negatively associated with being targeted by activists, consistent with
activists targeting poorly performing firms. Also, consistent with prior research, we find that
smaller companies are more likely to be targeted. However, the significantly positive coefficient
on Outside percent is difficult to explain in the same way, as this measure is suggested by some to
be a proxy for good governance (Bhagat and Bolton 2008). We also see evidence that activists are
more likely to target firms with greater portion of their shares held by institutional investors,
consistent with these investors being more open to supporting activists.
In Panel B of Table 4.4, we focus on activism events in examining two questions. First,
given that a firm has been targeted by activists, what are the factors that are associated with the
activist demanding board seats? Second, given that an activist has demanded board seats, what
factors are associated with the activist’s demands being met? We find evidence that conditional on
selecting a firm as a target, an activist is more likely to demand board representation when the firm
is smaller, and when leverage is lower. In the second column, we see that performance and leverage
are still negatively associated with getting a board seat conditional on asking for one. We also see
evidence that activists are more likely to get board representation when targeting firms with greater
portion of their shares held by institutional investors, consistent with these investors being more
open to supporting activist candidates. We see some evidence staggered boards prevent activists
from getting board representation (coef. −0.211, p > 0.10), suggesting that the effect observed in
Column (3) of Panel A may arise due to deterrence of activism entirely.
!!!!!!!!!!!!!!!!!!!!!!!!!!!!!!!!!!!!!!!!!!!!!!!!!!!!!!!!38 Note that, in contrast to our other analyses, for the purpose of this table, our activism indicators are not mutually exclusive. That is, Activism includes cases in any of the categories Non-board activism, Board demand, and Activist director, while Board demand includes cases of Activist director as well as cases where the board demands are not successful.

113
Table 4.4. Activist target selection All regressions in this table include the following controls measured for the prior fiscal year-end: Analyst, the number of analyst forecasts for each firm-year (I/B/E/S); Institutional, the proportion of the firms outstanding stock held by institutions; Size-adj. ret, twelve-month size-adjusted returns calculated as raw return over a year minus return for the size-matched decile provided by CRSP; Market value, the value of market capitalization; Book-to-market, market capitalization divided by the book value of com- mon equity; Leverage, sum of long-term debt and current liabilities divided by sum of long-term debt, current liabilities and the book value of common equity; Payout the ratio of the sum of dividends and repurchases divided to EBITDA); ROA, EBITDA divided by the lagged total assets; Sales growth, Sales divided by lagged sales; Num. directors, the number of directors on the board; Outside percent, the percentage of outside directors; Age, the average age of directors on the board; Tenure, the average years of directorship on the board; Staggered board, indicator for staggered board. All controls are winsorized at the 1% and 99% levels. Values in parentheses are standard errors clustered by firm. *** (**, *) indicates significance at the 1% (5%, 10%) level. Panel A: Activism, board demands and activist directors
Panel A presents logit regression where the dependent variables are indicators for being targeted for activism in any category (Non-board activism, Board demand, or Activist director, column 1), being the target of an activist demanding or getting board seats (Board demand or Activist director, Column 2) and activists getting board seats (Activist director, Column 3). Sample includes firm-years with and without activism.
Dependent variable: Activism Board demand Activist director (1) (2) (3) Analyst 0.020** 0.018* 0.008 (0.008) (0.011) (0.012) Inst 1.187*** 1.495*** 1.727*** (0.156) (0.184) (0.225) Size-adj. ret -0.487*** −0.603*** −0.770*** (0.101) (0.123) (0.167) Market value -0.434*** −0.699*** −0.526*** (0.102) (0.112) (0.132) Book-to-market 0.117* 0.033 0.012 (0.066) (0.073) (0.091) Leverage 0.288** 0.038 −0.137 (0.141) (0.151) (0.185) Payout -0.289 −0.347 −0.610 (0.217) (0.270) (0.373) ROA 0.235 0.123 −0.050 (0.158) (0.188) (0.229) Sales growth -0.173* −0.188 −0.331** (0.095) (0.116) (0.163) Num. directors -0.035** −0.039* −0.040 (0.018) (0.023) (0.027) Outside percent 1.116*** 1.902*** 2.111*** (0.428) (0.589) (0.732) Age 0.029*** 0.035*** 0.049*** (0.008) (0.010) (0.012) Tenure -0.011 −0.004 −0.019 (0.010) (0.012) (0.013)

114
Table 4.4. Activist target selection (Continued)
Staggered board -0.188*** −0.274*** −0.331*** (0.072) (0.089) (0.109) Pseudo-R2 0.221 0.235 0.238 Observations 37,801 36,998 36,998
Panel B: Activism, board demand and activist director (activism only)
Panel B presents logit regression where the dependent variables are indicators for activist demanding or getting board seats (Board demand or Activist director, Column 1) and activists getting board seats (Activist director, Column 2) conditional on the firm being targeted by activists.
Dependent variable: Board demand Activist director (1) (2) Analyst 0.004 −0.010 (0.012) (0.013) Inst 0.361 0.740*** (0.254) (0.273) Size-adj. ret −0.240* −0.313** (0.141) (0.152) Market value −0.409*** −0.151 (0.134) (0.135) Book-to-market −0.098 −0.139 (0.117) (0.121) Leverage −0.344* −0.441** (0.182) (0.189) Payout −0.087 −0.296 (0.286) (0.318) ROA −0.540 −0.664 (0.499) (0.487) Sales growth −0.073 −0.252 (0.135) (0.179) Num. directors −0.013 −0.011 (0.031) (0.032) Outside percent 1.846** 1.507* (0.732) (0.789) Age 0.014 0.027* (0.014) (0.014) Tenure 0.018 −0.008 (0.018) (0.017) Staggered board −0.205* −0.211* (0.117) (0.123) Sample Activism Activism Pseudo-R2 0.776 0.702 Observations 1,600 1,600

115
4.5. Activist holding periods
We next examine whether the category of activism is associated with the length of time the
activist holds the stock. We use 13F filing data to determine when an activist acquires and disposes
of stock. Because 13F filings are quarterly, our measures of holding period (expressed in days)
have some measurement error. We examine three holding periods: Entry–Exit, which runs from
the first date on which the stock was held to the last date the stock was held; Annc–Exit, which
runs from the date on which activism was first announced (typically with a 13D filing) to exit; and
Appt–Exit, which runs from the first appointment of an activist director through to the date of
exit.39
One issue with measuring holding periods is that censoring is significant in our sample.
This occurs because many of the activism campaigns in our sample are recent and the activist
continues to hold stock at the time we measure the holding period. Thus to estimate the association
between activism category and holding period, we use censored median regression (Portnoy 2003).
Table 4.5 presents these results. We find that, relative to Activism without board demands, Board
demand events have holding periods that are a half year shorter. Turning to Activist director cases,
we find a highly significant incremental holding period of 455 days from entry to exit and 523
days from announcement of activism to exit.40 While the estimated median holding period for
Activism events is 822 days (i.e., about 2.3 years), the equivalent for Activist director events is
1,277 days (i.e., about 3.5 years). From announcement to exit, Activist director activists hold the
stock for 956 days (2.6 years) and for 667 days (1.8 years) from first appointment of an activist
director.
!!!!!!!!!!!!!!!!!!!!!!!!!!!!!!!!!!!!!!!!!!!!!!!!!!!!!!!!39 We measure the exit date as the record date of the first 13F filing in which the stock is no longer part of the activist’s portfolio. 40 This is consistent with Activist director having a shorter period from entry to announcement of activism.

116
Table 4.5. Activist holding periods
Table presents results of censored median regression analysis of holding period (days) on activism category. Entry–exit refers to the time (in days) between the record date of the first filing by the activist where the target stock is listed in the activist’s portfolio through to the record date of the first filing where it is not (exit date) Annc–exit refers to the time between announcement of activism and the exit date. Appt–exit refers to the time between the first activist director appointment and the exit date. *** (**, *) indicates significance at the 1% (5%, 10%) level. Regression coefficients
Entry–exit Annc–exit Intercept 822.443*** 432.753*** (2.699) (22.520) Board demand -184.000*** -26.362 (46.958) (36.262) Activist director 455.000*** 523.672*** (95.826) (42.460)
Implied median holding periods (days)
Entry–exit Annc–exit Appt–exit Non-board activism 822 433
Board demand 638 406 Activist director 1,277 956 667
To put these statistics into perspective, it is helpful to consider some benchmarks. Cremers
et al. (2013) examine the holding period of various kinds of investors. They examine four
categories of investors (banks, pension funds, investment companies, and others) and find that
pension funds have the longest duration at 2 years. They also examine the holdings of some
institutional investors and provide only one example of an investor with a duration greater than
three years, namely the well-known long-term investor, Berkshire Hathaway, which had a duration
of between 3 and 4 years during our sample period. Another reference point is provided by the
Beyer et al. (2014) survey of investor relation professionals, who consider 2.8 years as a cutoff
beyond which investors can be considered “long-term” investors. These benchmarks suggest the
three-year holding period of activists getting representation on boards provides them with a
relatively long investment horizon.

117
4.6. Stock returns
We follow prior research in examining the impact of activism on stock returns, but examine
whether stock market reactions to activism differ by the three categories of activism: Activism,
Board demand, and Activist director.
We begin by looking at short-window returns around the announcement of activism.
Because prior research has documented a run-up in the 10 days prior to the public announcement
of activism and some drift thereafter, we follow Brav et al. (2008) in using a window beginning
20 days before and ending 20 days after the announcement of activism. For short-window tests,
we consider raw, market-adjusted, and size-adjusted returns (R, RMKT, and RSZ, respectively).
Results are reported in Panel A of Table 4.6. Consistent with prior research, (Brav et al. 2008), we
find significant announcement-period returns for activism events, with market-adjusted returns
ranging from 5.7% to 15.6% for the three categories. The returns for Activist director is
significantly higher than the others. Note that while the market would not know which category
the activism would ultimately fall into at the time of the announcement of activism, it might have
affected the likelihood of winning a board seat for activists. We get very similar results when we
consider returns windows such as (−10, +10) and (−1, +1) days.
In Panel B of Table 4.6, we examine the market reaction around the appointment of activist
director. We do not find any significant market reaction around this date, perhaps due to the
difficulty in measuring exactly when the market learned about the appointment in many cases.
Because we did not find any reaction around this date, we partition Activist director cases into
large and small investments using a cut-off of $100 million, denoted Invest < $100m and Invest >
$100m, respectively. This allows for the possibility that the market may react more to activism

118
when the activist’s stake is higher. However, the results in Panel B suggest the opposite; that we
see more significant market reaction for Invest < $100m.
Table 4.6. Stock returns
Table presents returns by category of activism where R, RMKT, RSZ denote raw, market-adjusted, and size-adjusted returns respectively. RFFV (RFFE)denotes value-weighted (equal-weighted) Fama-French three-factor adjusted returns. *** (**, *) indicates significance at the 1% (5%, 10%) level. Panel A: Days −20 to +20 around announcement of activism
Dependent variable: R RMKT RSZ (1) (2) (3) Non-board activism 0.067*** 0.057*** 0.058*** (0.008) (0.008) (0.008) Board demand 0.060*** 0.051*** 0.051*** (0.015) (0.014) (0.014) Activist director 0.172*** 0.156*** 0.143*** (0.058) (0.052) (0.044) Observations 2,160 2,160 2,160
Panel B: Days −1 to +1 around appointment
Dependent variable: R RMKT RSZ (1) (2) (3) Invest. > $100m 0.001 0.002 0.003 (0.005) (0.004) (0.004) Invest. < $100m 0.009** 0.010*** 0.010*** (0.004) (0.004) (0.004) Observations 641 641 641
Panel C: From activism announcement (month t) to month t + 12
Dependent variable: R RMKT RSZ RFFV RFFE (1) (2) (3) (4) (5) Non-board activism 0.138*** 0.067*** 0.067*** 0.058*** 0.053***
(0.020) (0.018) (0.018) (0.020) (0.019) Board demand 0.243*** 0.165*** 0.140*** 0.154*** 0.151*** (0.059) (0.056) (0.053) (0.058) (0.057) Activist director 0.084*** -0.002 -0.010 -0.010 -0.011 (0.022) (0.020) (0.020) (0.020) (0.020) Observations 2,050 2,050 2,047 1,946 1,946

119
Table 4.6. Stock returns (Continued) Panel D: From activism announcement (month t) to month t + 36
Dependent variable: R RMKT RSZ RFFV RFFE (1) (2) (3) (4) (5) Non-board activism 0.277*** 0.106*** 0.076** 0.071* 0.057 (0.038) (0.035) (0.035) (0.038) (0.038) Board demand 0.378*** 0.176*** 0.117* 0.150** 0.138** (0.071) (0.065) (0.063) (0.067) (0.066) Activist director 0.235*** 0.029 −0.008 0.012 0.002 (0.047) (0.042) (0.043) (0.043) (0.043) Observations 1,677 1,677 1,676 1,597 1,597
Panel E: From activist appointment date (month t) to month t + 12
Dependent variable: R RMKT RSZ RFFV RFFE (1) (2) (3) (4) (5) Invest. > $100m 0.132*** 0.027 0.014 -0.005 -0.007 (0.040) (0.035) (0.034) (0.036) (0.035) Invest. < $100m 0.099*** -0.002 -0.012 -0.011 -0.017 (0.031) (0.027) (0.027) (0.028) (0.027) Observations 550 550 549 534 534
Panel F: From activist appointment date (month t) to month t + 36
Dependent variable: R RMKT RSZ RFFV RFFE (1) (2) (3) (4) (5) Invest. > $100m 0.391*** 0.118 0.068 0.057 0.041 (0.089) (0.082) (0.081) (0.084) (0.084) Invest. < $100m 0.288*** 0.057 0.027 0.007 -0.006 (0.063) (0.055) (0.056) (0.053) (0.052) Observations 397 397 396 387 387
In Panels C and D of Table 4.6, we examine returns over the 12-month and 36-month
periods from the announcement of activism. Due to the greater importance of controlling for risk
over longer periods, we also consider Fama-French abnormal returns, using both equal-weighted
and value-weighted returns for the associated benchmark portfolios. While we see some large,
statistically significant returns for Non-board activism and Board demand, we do not find
significant returns for Activist director, which is in contrast to the short-term results.

120
One issue with interpreting the returns for the activist director cases is that the director
appointments generally occur well after the announcement of activism events. Thus we consider
longer-window returns for activist director cases beginning from the appointment of these directors
to the board. Results are reported in Panels E (12-month returns) and F (36-month returns) of Table
4.6. In general, we do not find non-zero risk-adjusted returns over either period for either category.
4.7. Firm outcomes
While stock market reaction provides a useful measure for evaluating the impact of
activists, it is not without issues. First, we need to identify the time at which the market learned
about the prospect of activist involvement. Second, we need the market to estimate the impact of
activism in an unbiased manner and impound this estimate into price promptly. Finally, even if
these difficulties are addressed, the stock market reaction does not provide insight into how
activists affect corporate policy and firm value. In this section, we examine the impact of activists,
especially activist directors, on a number of outcomes, with a focus on outcomes that are
commonly sought by activists.
4.7.1. Profitability
We first examine the association between activism and operating performance. Our
empirical approach follows that of Bebchuk et al. (2013), which is a modification of the approach
used in Brav et al. (2008). Thus we measure operating performance as return on assets calculated
as earnings before interest, taxes, depreciation, and amortization (Compustat item oibdp) divided
by lagged total assets (at). For each firm-year t, we construct indicators for activism in year t + s

121
where s � {−3, …, +5}, where, for example, Activistt−3 takes the value 1 for t = 2004 and a given
firm if an activism campaign began in 2007.
We estimate three models. Following Bebchuk et al. (2013), all models include year fixed
effects, market value, and firm age, and indicators for activism. Following, Bebchuk et al. (2013),
models (A) and (B) add industry and firm fixed effects, respectively. To examine a possible
incremental effect of an activist getting board representation, Model (C) refines model (B) by
including indicators for activist director appointments in years ranging from three years prior
(Activist directort−3) to five years subsequent (Activist directort+5).
Table 4.7 presents results. The quantities presented in the table represent estimates of the
impact of activism and activist directors, and are calculated as the difference between the estimated
coefficients on the respective activism indicators for years t + s and t, where s � {1, . . . , 5}. With
model (A), we find significant increases in ROA for years t +3 to t + 5. Once we add firm fixed
effects, i.e., in models (B) and (C), we find statistically significant increases in ROA in all five
years. These effects are economically significant, with the five-year increase in ROA exceeding
1.1% in both models.
Looking at the incremental effect of getting an activist candidate on the board, we do not
detect a statistically significant effect. The incremental effects are statistically indistinguishable
from zero. If an incremental effect does exist, our failure to detect it statistically may be attributed
to a lack of power stemming from a small number of observations (e.g., we have just 40
observations with Activist directort+5 equal to one) and multicollinearity between our activism
indicators (in many cases, the activist director is appointed in the same year that the activist
campaign commences).

122
Table 4.7. Operating performance Table presents estimates of the impact of activism on return on assets over 5 years after the announcement of activism. The empirical approach follows that of Bebchuk et al. (2013). We regress return on assets on indicators for activism events in any of the three categories, including Board demand and Activist director, ranging from three years prior (Activismt−3) to five years subsequent (Activismt+5). We estimate three models. Following Bebchuk et al. (2013), all models include year fixed effects, market value, and firm age, and indicators for activism. Models (A) and (B) add industry and firm fixed effects, respectively. Model (C) also adds firm fixed effects, as well as indicators for activist director appointments in years ranging from three years prior (Activist directort−3) to five years subsequent (Activist directort+5). The quantities presented in the table represent estimates of the impact of activism and activist directors, and are calculated as the difference between the estimated coefficients on the respective activism indicators for years t + s and t, where s � {1, …, 5}. Numbers in parentheses are heteroscedasticity-robust standard errors. *** (**, *) indicates significance at the 1% (5%, 10%) level.
(1) (2) (3) (4) Activism Activism Activism Activist director ROAt+1 - ROAt 0.006 0.005* 0.005* 0.001 (0.007) (0.003) (0.004) (0.007) ROAt+2 - ROAt 0.008 0.010** 0.010** -0.004 (0.007) (0.005) (0.005) (-0.011) ROAt+3 - ROAt 0.011* 0.016*** 0.016*** -0.006 (0.008) (0.005) (0.005) (-0.015) ROAt+4 - ROAt 0.012* 0.011** 0.012** -0.005 (0.008) (0.005) (0.006) (-0.012) ROAt+5 - ROAt 0.024*** 0.011* 0.011* 0.005 (0.010) (0.008) (0.008) (0.013) Model: (A) (B) (C) (C) Fixed effects: Industry, year Firm, year Firm, year Firm, year
Number of observations with activism indicator equal to 1
Activism Activist director Yeart-3 1,032 237 Yeart-2 1,080 242 Yeart-1 1,117 245 Yeart 1,132 248 Yeart+1 913 159 Yeart+2 763 111 Yeart+3 584 79 Yeart+4 431 56 Yeart+5 342 40
Having demonstrated an effect of activism on operating performance, we next turn to a
range of other outcomes that activists often seek to influence more directly. The examples
discussed above in Section 4.2 suggest that activists often seek to influence corporate policy or
decisions on a wide range of matters. They include matters related to mergers and acquisitions

123
(including divestitures of businesses), CEO turnover and compensation, capital structure
(including cash holdings and dividend payout), and investment policy.
4.7.2. Divestiture and acquisitions
The first set of outcomes we examine relate to mergers and acquisitions. The examples
discussed above suggest that one concern activists have is with excessive spending on acquisitions
by target firms. Thus, the first outcome we consider is Acquisition, an indicator for whether the
firm completed any acquisitions in the two years after a given fiscal year. Greenwood and Schor
(2009, p.362) suggest that announcement returns associated with activism “are largely explained
by the ability of activists to force target firms into a takeover.” Thus one outcome we consider,
Acquired, is an indicator for whether the firm was acquired in the two years after a given fiscal
year. Finally, often activists urge firms to divest businesses. Thus our third outcome is Divestiture,
an indicator for whether the firm divested significant assets in the two years after a given fiscal
year. We regress these indicators on industry and year dummies as well as the following controls
(as described in Section 4.3), Analyst, Institutional, Market value, Book-to-market, Leverage,
Payout, ROA, Sales growth, Outside percent, Age, Tenure, and Staggered board.
Table 4.8 presents these results. Examining the first column in Table 4.8, we see all three
categories of activism are associated with significantly lower probability of acquisitions (coefs.
−0.066 to −0.074). On the other hand, activism is positively associated with being acquired (coefs.
0.016 to 0.121), but the association is strongest when activism is in the category Non-board
activism and lower when an activist director is appointed (the difference between Non-board
activism and the other two forms of activism is statistically significant at the 5% level). Finally,

124
divestitures are associated with activism of the forms Board demand and Activist director (coefs.
0.076 and 0.069).
Table 4.8. Divestitures and acquisitions Table presents regressions of outcome variables on firm-year level activism indicators. Acquisition indicates the firm completed acquisitions within two years after year t. Acquired indicates delisting within two years of year t with CRSP delisting code dlstcd � [200, 399]. Divestiture indicates the firm completed divestitures and spinoffs within two years of year t. Regressions include industry and year fixed effects and the following controls (Control variables are measured for the fiscal year-end of year t): Total assets, book value of total assets; Analyst, number of analyst forecasts for each firm-year (I/B/E/S); Institutional, proportion of the firm’s outstanding stock held by institutions; Size-adj. ret, twelve-month size-adjusted returns; Market value, the value of market capitalization; Book-to-market, market capitalization divided by the book value of common equity; Leverage, ratio of debt to debt plus book value of common equity; Payout, the ratio of the sum of dividends and repurchases divided to EBITDA; ROA, EBITDA divided by the lagged total assets; Sales growth, sales divided by lagged sales; Num. directors, the number of directors on the board; Outside percent, the percentage of outside directors; Age, the average age of directors; Tenure, the average tenure of directors; Staggered board, indicator for staggered board. All controls and CEO comp are winsorized at the 1% and 99% levels. Values in parentheses are standard errors clustered by firm. *** (**, *) indicates significance at the 1% (5%, 10%) level.
Dependent variable: Acquisition Acquired Divestiture (1) (2) (3) Non-board activism -0.066*** 0.121*** 0.026 (0.020) (0.018) (0.019) Board demand -0.067** 0.113*** 0.076*** (0.033) (0.026) (0.029) Activist director -0.074*** 0.016 0.069*** (0.027) (0.015) (0.024) Observations 36,908 36,588 36,908 Adjusted R2 0.145 0.035 0.180 F-test for equal coefficients (p-values) Board demand = Activist director 0.855 0.001 0.853 Non-board activism = Activist director 0.798 0.000 0.135 Non-board activism = Board demand 0.990 0.783 0.139
4.7.3. CEO turnover and compensation
We next consider the association of activism with CEO turnover and compensation. We
conjecture that activists may seek CEO turnover and may also seek to alter the level or structure
of CEO compensation. While it seems plausible that activists would seek to decrease CEO

125
compensation, it is unclear whether they would reduce the percentage of compensation that is
variable or increase it to enhance performance sensitivity.
We code the indicator CEO turnover equal to 1 if the CEO at the end of year t is no longer
the CEO (but the company still exists) in year t + 2. For total CEO pay, we regress total CEO
compensation in year t + 2 on controls, including CEO compensation in year t, and indicators for
each category of activism. To assess change in performance-based compensation, we regress the
proportion of CEO compensation that is variable (i.e., not salary) on its lagged value, controls, and
activism indicators. We regress these variables on their lagged (year t) values, industry and year
dummies as well as the following controls (as described in Section 4.3), Analyst, Institutional,
Market value, Book-to-market, Leverage, Payout, ROA, Sales growth, Outside percent, Age,
Tenure, and Staggered board.
Table 4.9. CEO turnover and compensation Table presents regressions of variables on firm-year level activism categorical variables. CEO exit indicates a change in CEO between the end of year t and the end of year t + 2. CEO compt+2 is log of total CEO compensation in year t + 2. Perf comp is the percentage of CEO compensation that not salary. Controls are as described in Table 8. Values in parentheses are standard errors clustered by firm. *** (**,*) indicates significance at the 1% (5%, 10%) level.
Dependent variable: CEO exit(t+1,t+2) CEO compt+2 Perf compt+2 (1) (2) (3) Non-board activism 0.047 -0.029 -0.015 (0.031) (0.045) (0.018) Board demand 0.042 -0.136** -0.054* (0.046) (0.059) (0.029) Activist director 0.128** -0.112** -0.021 (0.052) (0.055) (0.021) Dep. Var.t -0.007 0.466*** 0.125* (0.012) (0.012) (0.065) Observations 16,185 18,491 18,497 Adjusted R2 0.037 0.716 0.161 F-test for equal coefficients (p-values) Board demand = Activist director 0.185 0.763 0.359 Non-board activism = Activist director 0.168 0.234 0.848 Non-board activism = Board demand 0.936 0.139 0.246

126
Results of our analysis are presented in Table 4.9. We find no statistically significant
association between Non-board activism nor Board demand and CEO turnover. However, we find
positive associations between CEO turnover and Activist director (coef. 0.128, p < 0.05). We find
negative associations between CEO compensation and Board demand (coef. −0.136, p < 0.05) as
well as Activist director (coef. −0.112, p < 0.05). These results point to a higher degree of
monitoring and consequences to CEOs in the presence of activist directors. Finally, we see weak
evidence of reduction in the proportion of compensation that is non-salary associated with Board
demand (coef. −0.054, p < 0.10), but not with Non-board activism and Activist director.
4.7.4. Capital structure and payouts
Among the most common demands activists make are requests for firms to increase the
payment of dividends, reduce cash holdings, and to increase leverage. In Table 4.10, we examine
the association between activism and measures of cash holding, leverage, and shareholder payout
(dividends and share repurchases). As outcome variables we consider Cash, calculated as the ratio
of total cash and short-term investments to the book value of total assets; Leverage, measured as
the ratio of book value of debt to the sum of the book value of debt and equity; and, Payout,
measured as the ratio of total dividends and share repurchases to EBITDA for the two years after
year t. We regress these variables on their year-t values, industry and year dummies as well as the
following controls (as described in Section 4.3), Analyst, Institutional, Market value, Book-to-
market, Leverage, Payout, ROA, Sales growth, Outside percent, Age, Tenure, and Staggered board.
We find that Board demand (coef. −0.041, p < 0.01) and Activist director (coef. −0.017, p
< 0.10) are associated with reduced cash holdings. We find that leverage is associated with both
Non-board activism (coef. 0.022, p < 0.01) and Activist director (coef. 0.020, p < 0.05). Finally,

127
Board demand (coef. 0.147, p < 0.01) and Activist director (coef. 0.092, p < 0.05) are associated
with increased payout. Overall, the evidence in Table 4.10 points to activist directors being
associated with the kinds of capital structure and payout changes demands frequently demanded
by activists.
Table 4.10. Capital structure
Cash is calculated as the ratio of total cash and short-term investments to the book value of total assets. Leverage is measured as the ratio of book value of debt to the sum of the book value of debt and equity. Payout is measured as the ratio of total dividends and share repurchases to EBITDA for the two years after year t. Controls are as described in Table 8. Values in parentheses are standard errors clustered by firm. *** (**, *) indicates significance at the 1% (5%, 10%) level.
Dependent variable: Cash Leverage Payout (1) (2) (3) Non-board activism 0.008 0.022*** -0.043 (0.007) (0.007) (0.054) Board demand -0.041*** 0.004 0.147*** (0.009) (0.008) (0.044) Activist director -0.017* 0.020** 0.092** (0.010) (0.009) (0.036) Dep. var.t 0.907*** 0.892*** 0.360*** (0.014) (0.008) (0.014) Observations 31,231 31,228 29,957 Adjusted R2 0.595 0.856 0.275 F-test for equal coefficients (p-values) Board demand = Activist director 0.048 0.185 0.308 Non-board activism = Activist director 0.027 0.825 0.031 Non-board activism = Board demand 0.000 0.081 0.005
4.7.5. Investment
Finally, we examine the association between activism and three areas of spending
commonly regarded as investment: capital expenditures, research and development (R&D), and
advertising. We measure investment using the following proxies: CapEx, measured as the ratio of
capital expenditure for two years after announcement of activism to the lagged book value of total
assets; R&D, measured as the ratio of total R&D expenditure for two years after announcement of

128
activism to the lagged book value of total assets; and, Advertising, measured as the ratio of
advertising expenditure for three years after announcement of activism to the lagged book value
of total assets. We regress these variables on their year-t values, industry and year dummies as
well as the following controls (as described in Section 4.3), Analyst, Institutional, Market value,
Book-to-market, Leverage, Payout, ROA, Sales growth, Outside percent, Age, Tenure, and
Staggered board.
Results are presented in Table 4.11. We find negative associations between all three
categories of activism and capital expenditure, the coefficient on Activist director (coef. −0.015, p
< 0.01) is more negative than that on Non-board activism (coef. −0.009, p < 0.01). Only with
Activist director do we see a negative association with R&D spending (coef. −0.006, p < 0.05).
Table 4.11. Investment
Table presents regressions of variables on firm-year level activism categorical variables. CapEx is measured as the ratio of capital expenditure for two years after announcement of activism to the lagged book value of total assets. R&D is measured as the ratio of total R&D expenditure for two years after announcement of activism to the lagged book value of total assets. Advertising is measured as the ratio of advertising expenditure for two years after announcement of activism to the lagged book value of total assets. Controls are as described in Table 8. Values in parentheses are standard errors clustered by firm. *** (**, *) indicates significance at the 1% (5%, 10%) level.
Dependent variable: CapEx R&D Advertising (1) (2) (3) Non-board activism -0.009** -0.002 -0.001 (0.004) (0.002) (0.001) Board demand -0.014** -0.004 -0.001 (0.007) (0.005) (0.002) Activist director -0.015*** -0.006** -0.001 (0.004) (0.003) (0.001) Dep. var.t 1.614*** 2.129*** 2.018*** (0.035) (0.032) (0.020) Observations 31,274 31,274 31,274 Adjusted R2 0.714 0.859 0.887 F-test for equal coefficients (p-values) Board demand = Activist director 0.884 0.688 0.813 Non-board activism = Activist director 0.307 0.152 0.750 Non-board activism = Board demand 0.556 0.703 0.683

129
Overall, the evidence in Table 4.11 is consistent with activist directors playing a significant
role in curbing expenditures on capital, R&D, and advertising. However, it is unclear whether this
reflects curtailment of excessive investments or, as critics of activists might suggest,
underinvestment and a focus on the short term.
4.8. Conclusion
In recent years, the phenomenon of hedge fund managers attempting to actively intervene
in the governance of firms they invest in has gained prominence. These fund managers often layout
an investment thesis regarding their target firms and vigorously engage with their targets to realize
their thesis.
Instead of passively waiting for an investment hypothesis to validate itself (like most
institutional fund managers do), activist hedge fund managers often demand seats on the board of
their targets as a mechanism to effect change in investee firms and thereby actively control the
outcome of their investment. While attaining directorship might not be the end goal, it is perhaps
the stick that activists use to force companies to take their demands seriously. Given the importance
that the demand for board positions has in the activist game plan, we examine hedge fund activism
thorough the lens of activist directors, i.e., cases where candidates sponsored by the activists
become directors of the target companies.
We find that activists are more likely to gain board seats at smaller firms and those with
weaker stock price performance. As in prior research, we find positive announcement-period
returns of around 5–14% when a firm is targeted by activists, including in cases where the activists
ex-post gain board seats, and a 1–2% increase in return on assets over the subsequent one to five
years. When they have board seats, activists remain as shareholders long enough to be considered

130
long-term investors by conventional standards, with holding periods averaging more than three
years. The long-term shareholding combined with positive stock-price and operating performance
effects suggests that the short-termism concern often expressed in the context of hedge fund
activists may be less apparent in cases when activists become directors.
Activist directors appear to be associated with significant strategic and operational changes
in target firms. We find evidence of increased divestiture, decreased acquisition activity, higher
probability of being acquired, lower cash balances, higher payout, greater leverage, higher CEO
turnover, lower CEO compensation, and reduced investment. With the exception of the probability
of being acquired, the estimated effects are generally greater when activists obtain board
representation, consistent with board representation being an important mechanism for bringing
about the kinds of changes that activists often demand.
Our results do not allow us to conclude that these actions themselves are value-enhancing
even if they are concomitant with better operating performance and stock returns. Moreover, the
data available to us do not permit causal inferences. Despite these limitations, the range of
associations that we document suggest that gaining board positions is an important mechanism
that allows hedge fund activists to have an impact in ways that line up with the demands that they
make of companies.

131
BIBLIOGRAPHY
Agrawal, A., Jaffe, J., and Karpoff, J., 1999. Management turnover and governance changes
following the revelation of fraud. Journal of Law and Economics. 42, 23–56. Bebchuk, L., 2005. The case for increasing shareholder power. Harvard Law Review. 118, 833–
917. Bebchuk, L.A., 2007. The myth of the shareholder franchise. Virginia Law Review. 93, 675–732. Bebchuk, L.A., Brav, A., and Jiang, W., 2013. The long-term effects of hedge fund activism.
Working paper. Bebchuk, L., Cohen, A., 2005. The costs of entrenched boards. Journal of Financial Economics.
78, 409–433. Bebchuk, L., Cohen, A., Ferrell, A., 2009. What matters in corporate governance. Review of
Financial Studies. 22, 783–827. Becht, M., Franks, J., Mayer, C., and Rossi, S., 2010. Returns to shareholder activism: Evidence
from a clinical study of the Hermes UK Focus Fund. Review of Financial Studies. 23, 3093–3129.
Beyer, A., Larcker, D. F. and Tayan, B.: 2014, 2014 study on how investment horizon and
expectations of shareholder base impact corporate decision-making, Technical report. Bhagat, S. and Bolton, B.: 2008, Corporate governance and firm performance, Journal of
Corporate Finance. 14, 257–273. Brav, A., Jiang, W., and Kim, H., 2010. Hedge fund activism: A review. Foundations and Trends
in Finance. 4, 185. Brav, A., Jiang, W., Kim, H., 2015. Recent Advances in Research on Hedge Fund Activism: Value
Creation and Identification. Annual Review of Financial Economics. 7, 579–595. Brav, A., Jiang, W., Partnoy, F., and Thomas R., 2008. Hedge fund activism, corporate governance,
and firm performance. Journal of Finance. 63, 1729–75. Brav, A., Jiang, W. and Tian, X.: 2014, Shareholder power and corporate innovation: Evidence
from hedge fund activism, SSRN Electronic Journal. Brickley, J. a., Coles, J.L., Terry, R.L., 1994. Outside directors and the adoption of poison pills.
Journal of Financial Economics. 35, 371–390.

132
Brochet, F., and Srinivasan, S., 2014. Accountability of independent directors: Evidence from firms subject to securities litigation. Journal of Financial Economics. 111, 430–449.
Cai, J., Garner, J., Walkling, R., 2009. Electing directors. Journal of Finance. 64, 2389–2421. Carleton, W. T., Nelson, J. M., and Weisbach, M. S., 1998. The influence of institutions on
corporate governance through private negotiations: Evidence from TIAA-CREF. The Journal of Finance. 53, 1335–1362.
Catan, E., Kahan, M., 2015. The Law and Finance of Anti-Takeover Statutes. Working Paper. Coates, J., 2000. Takeover defenses in the shadow of the pill: a critique of the scientific evidence.
Texas Law Review. 79, 271. Coffee, J.C., Palia, D., 2014. The Impact of Hedge Fund Activism: Evidence and Implications.
Working Paper. Cohen, A., Wang, C., 2013. How do staggered boards affect shareholder value? Evidence from a
natural experiment. Journal of Financial Economics. 110, 627–641. Comment, R., Schwert, G.W., 1995. Poison or placebo? Evidence on the deterrence and wealth
effects of modern antitakeover measures. Journal of Financial Economics. 39, 3–43. Core, J.E., Guay, W.R., Rusticus, T.O., 2004. Does weak governance cause weak stock returns?
An examination of firm operating performance and investors’ expectations. Journal of Finance. 61, 655–687.
Cremers, M., Ferrell, A., 2014. Thirty Years of Shareholder Rights and Firm Value. Journal of
Finance. 69, 1167–1196. Cremers, K., Nair, V., 2005. Governance mechanisms and equity prices. Journal of Finance. 60,
2859–2894. Cremers, M., Pareek, A. and Sautner, Z., 2013, Stock duration and misvaluation, Working paper Datta, S., Iskandar-Datta, M., 1996. Takeover defenses and wealth effects on security holders: The
case of poison pill adoptions. Journal of Banking and Finance. 20, 1231–1250. Del Guercio, D., Seery, L., and Woidtke, T., 2008. Do boards pay attention when institutional
investor activists just vote no? Journal of Financial Economics. 90, 84–103. Dodd, P., and J. B. Warner., 1983. On corporate governance. Journal of Financial Economics. 11,
401–438. Edmans, A., 2014. Blockholders and Corporate Governance. Annual Review of Financial
Economics. 6, 23–50.
133
Ertimur, Y., Ferri, F., Maber, D., 2012. Reputation penalties for poor monitoring of executive pay: Evidence from option backdating. Journal of Financial Economics. 104, 118–144.
Ertimur, Y., Ferri, F., Muslu, V., 2010. Shareholder activism and CEO pay. Review of Financial
Studies. 24, 535–592. Ertimur, Y., Ferri, F. Oesch, D., 2013. Shareholder votes and proxy advisors: Evidence from say
on pay. Journal of Accounting Research. 51, 951–996. Faleye, O., 2007. Classified boards, firm value, and managerial entrenchment. Journal of Financial
Economics. 83, 501–529. Fama, E., 1980. Agency problems and the theory of the firm. Journal of Political Economy. 88,
288-307. Fama, E., Jensen, M., 1983. Separation of ownership and control. Journal of Law and Economics.
26, 301–25. Ferris, S., Jagannathan, M., Pritchard, A., 2003. Too busy to mind the business? Monitoring by
directors with multiple board appointments. Journal of Finance. 58, 1087–1112. Fich, E., Shivdasani, A., 2007. Financial fraud, director reputation, and shareholder wealth. Journal
of Financial Economics. 86, 306–336. Fischer, P., Gramlich, J., Miller, B., White, H., 2009. Investor perceptions of board performance:
Evidence from uncontested director elections. Journal of Accounting and Economics. 48, 172–189.
Fos, V., Tsoutsoura, M., 2014. Shareholder democracy in play: Career consequences of proxy
contests. Journal of Financial Economics. 114, 316-340. Gantchev, N., 2013. The costs of shareholder activism: Evidence from a sequential decision model.
Journal of Financial Economics. 107, 610–631. Gill, B.S.M., Liekefett, K.H.E., Wood, L., 2014. Structural defenses to shareholder activism.
Review of Securities and Commodities Regulation. 47, 151–170. Gilson, S.C., 1990. Bankruptcy, boards, banks, and bondholders: Evidence on changes in corporate
ownership and control when firms default. Journal of Financial Economics. 27, 355–88. Gompers, P., Ishii, J., Metrick, A., 2003. Corporate governance and equity prices. Quarterly
Journal of Economics. 118, 107–155. Gompers, P., Ishii, J., Metrick, A., 2010. Extreme Governance: An Analysis of Dual-Class Firms
in the United States. Review of Financial Studies. 23-3, 1051–1088.

134
Greenwood, R., and Schor, M., 2009. Investor activism and takeovers. Journal of Financial Economics. 92, 362–375.
Grundfest, J. A., 1993. Just vote no: A minimalist strategy for dealing with barbarians inside the
gates, Stanford Law Review. 45, 857–937. Guner, A. B., Malmendier, U. and Tate, G.: 2008, Financial expertise of directors, Journal of
Financial Economics. 68, 323–354. Huang, Q., Jiang, F., Lie, E. and Yang, K.: 2014, The role of investment banker directors in M&A,
Journal of Financial Economics. 112, 269–286. Jensen, M., 1983. Organization theory and methodology. Accounting Review. 56, 319–338. Karpoff, J., Schonlau, R., Wehrly., E., 2015. Do takeover defenses deter takeovers? Working Paper. Klein, A., Zur, E., 2009. Entrepreneurial Shareholder Activism: Hedge Funds and Other Private
Investors. Journal of Finance. LXIV, 187–229. Malatesta, P.H., Walkling, R. a, 1988. Poison Pill Securities: Shareholder Wealth, Profitability,
and Ownership Structure. Journal of Financial Economics. 20, 347–376. Masulis, R.W., Wang, C., Xie, F., 2005. Corporate Governance and Acquirer Returns. Journal of
Finance. 62, 1851–1889. Mulherin, J. H., Poulsen, A. B., 1998. Proxy contests and corporate change: implications for
shareholder wealth. Journal of Financial Economics. 47, 279–313. Palepu, K., 1987. Predicting Takeover Targets. Journal of Accounting and Economics. 8, 3–35. Portnoy, S.: 2003, Censored regression quantiles, Journal of the American Statistical Association.
98(464), 1001–1012. Pound, J., 1988. Proxy contests and the efficiency of shareholder oversight. Journal of Financial
Economics. 20, 237–265. Romano, R., 1991. The shareholder suit: Litigation without foundation? Journal of Law,
Economics, and Organization. 7, 55–87. Ruback, R., 1988. An Overview of Takeover Defenses and Mergers Acquisitions. In Mergers and
Acquisitions, edited by A. Auerback. Chicago: University of Chicago Press. Ryngaert, M., 1988. The effect of poison pill securities on shareholder wealth. Journal of Financial
Economics. 20, 377–417. Sikes, S.A., Tian, X., Wilson, R., 2014. Investors’ reaction to the use of poison pills as a tax loss
preservation tool. Journal of Accounting and Economics. 57, 132–148.

135
Smith, M. P. 1996. Shareholder activism by institutional investors: Evidence from CalPERS.
Journal of Finance. 51, 227–252. Srinivasan, S., 2005. Consequences of financial reporting failure for outside directors: Evidence
from accounting restatements and audit committee members. Journal of Accounting Research. 43, 291–334.
Strine Jr, L. E.: 2014, Can we do better by ordinary investors? A pragmatic reaction to the dueling
ideological mythologists of corporate law, Columbia Law Review. 449–502. Weisbach, M. S. 1988. Outside directors and CEO turnover. Journal of Financial Economics. 20,
431–460. Yermack, D., 2004. Remuneration, retention, and reputation incentives for outside directors.
Journal of Finance. 59, 2281–2308. Yermack, D., 2010. Shareholder voting and corporate governance. Annual Review of Finance and
Economics. 2, 103–125.

136
Appendix A. Descriptive statistics by sample
This table presents the mean value of cash, analyst, institutional holdings, size-adjusted returns, market value, book-to-market ratio, leverage, dividend, return on assets, sales growth, firm age, board size, and percentage of outside directors for firms by the status of activism events and by existence of takeover defense measures (staggered board, poison pill, and dual-class structure).
(1) Activism
(2) Dual-class
(3) Staggered board
(4) Poison pill
No Yes No Yes No Yes No Yes
Cash 0.195 0.203 0.199 0.157 0.186 0.205 0.190 0.213 Analyst 7.192 7.100 7.176 7.308 7.737 6.623 7.407 6.510 Institutional holdings 0.621 0.648 0.626 0.590 0.628 0.617 0.619 0.634 Size-adj. return 0.007 -0.042 0.005 0.006 0.009 0.002 0.005 0.005 Market value 2.873 2.755 2.859 2.964 2.948 2.786 2.903 2.758 Book-to-market 0.610 0.695 0.614 0.607 0.613 0.615 0.613 0.617 Leverage 0.330 0.337 0.326 0.383 0.338 0.323 0.333 0.323 Dividend 0.104 0.081 0.102 0.110 0.108 0.099 0.112 0.076 Return on assets 0.094 0.088 0.089 0.136 0.103 0.083 0.098 0.077 Sales growth 1.131 1.111 1.132 1.101 1.117 1.143 1.132 1.124 Firm age 19.079 20.394 19.277 17.660 21.574 16.636 18.887 19.916 Board size 8.676 8.456 8.644 8.902 8.716 8.615 8.732 8.463 Outside percent 0.826 0.835 0.830 0.783 0.824 0.828 0.824 0.833
Num. obs. 21,299 996 20,372 1923 11,297 10998 16,852 5443

137
Appendix B. Variable definitions Variable Definition
Classification of activism events Targeted Firm Indicator for firm being targeted by an activism event commencing in a
given fiscal year (Source: FactSet SharkRepellent) Targeted Firm – Non-Board
All activism events that are neither Targeted Board – Proxy nor Targeted Board – Non-Proxy
Targeted Board – Non-Proxy
Activism events not included in Targeted Board – Proxy, but identified by SharkRepellent as relating to “Board Representation,” “Board Control,” “Remove Directors(s),” or “Withhold Vote for Director(s).”
Targeted Board – Proxy (i) Activism events identified based on SEC filings on Form DEFC14A or PREC14A filed by dissident and (ii) activism events where the dissident publicly disclosed that it delivered formal notice to the company that it intends to solicit proxies from stockholders
Targeted Board – Proxy – Targeted Director (also Targeted Director)
Indicator for a director being either (i) up for election during an activism year when dissidents do not explicitly identify the directors they seek to replace or (ii) explicitly named as a target by activists
Targeted Board – Proxy – Non-Targeted Director
Indicator for a director being involved in a proxy fight (Targeted Board – Proxy), but not being individually targeted by activists
Classification of activism events by settlement (Table 3.3 Panel B) Non-Proxy – Settled Indicator for a non-proxy fight event resulting in a board seat for
dissidents, but did not go to shareholder election Non-Proxy – Not Settled Indicator for a non-proxy fight event not resulting in board seats for
activists Proxy – Settled Indicator for a proxy fight event resulting in a board seat for dissidents,
but not going to shareholder election Proxy – Not Settled Indicator for a proxy fight event not resulting in any board seats for
activists Proxy – Went to Election Indicator for a proxy fight going to shareholder election Dependent variables Departure(t, t+2) Indicator for the director leaving the board of the firm between years t and
t + 2 (i.e., the year after the activism event, if any) Against Votest+2 Percentage of votes against the director in director elections in year t + 2
(votes against + votes withheld) / (votes for + votes against + votes withheld)
Other Boardst+2 Number of directorships a director has with companies other than the company of interest in year t + 2
Firm controls Ind.-Adj. Return Twelve-month industry-adjusted return, calculated as raw return minus
the return for the relevant Fama/French 48-industry portfolio ROA EBITDA divided by lagged total assets Sales Growth Sales divided by lagged sales Market Value Natural log of market capitalization Leverage Sum of long-term debt and current liabilities divided by sum of long-term
debt, current liabilities and the book value of common equity

138
Appendix B. Variable definitions (Continued)
Variable Definition CEO Turnover Indicator for CEO Turnover in year t + 1 Dividend
Sum of common dividends and preferred dividends divided by earnings before depreciation, interest, and tax
Analyst Number of analyst forecasts for each firm-year (Source: I/B/E/S) Institution Percentage of shares held by institutions (Source: WhaleWisdom) Director characteristics Age Director’s age in year t Tenure Number of years a director served on the firm’s board at time t Percent Owned Number of shares held by a director divided by shares outstanding at
fiscal year-end (Source: Equilar) Audit Committee Indicator for the director being on the audit committee at time t Compensation Committee Indicator for the director being on the compensation committee at time t Independent Director Indicator for director being independent ISS Againstt+2 Unfavorable recommendation by Institutional Shareholder Services (ISS)
in year t + 2 for each individual director nominee Up for Election Indicator for the director up for election in year t + 1 (Source: ISS Voting
Analytics)

139
Appendix C: Activism classification – examples Case 1: Firm is targeted for activism but not for board-related issues (Targeted Firm and Targeted Firm – Non-Board) Target: Bioenvirion, Inc. Dissident: Elliott Management Corporation Dates: 5/30/2007 – 10/4/2007 Proposals/Outcome: Campaign to vote against company’s acquisition by Genzyme Corporation for $5.60 per share. Court granted company’s petition to reconvene the special meeting and re-open the polls. At the reconvened special meeting the merger was approved.
Target: 99 Cents Only Stores Dissident: Akre Capital Management LLC Dates: 1/4/2008 – 9/18/2008 Proposals/Outcome: Campaign urged board to concentrate resources on markets other than Texas. Company announced on 9-18-2008 it will exit the Texas market. Case 2. Firm is targeted for a board related issue not resulting in a proxy fight (Targeted Firm and Targeted Board – Non-Proxy)
Target: American Bank Note Holographics, Inc. Dissident: Levy, Harkins & Co., Inc. Dates: 3/30/2007 – 5/24/2007 Proposals/Outcome: Dissident seeking 5 of 5 seats on the company’s board and threatened a formal proxy fight if the company failed to address its concerns. Later company settled with the Dissident whereby 2 dissident nominees were appointed on the board.
Target: Exide Technologies Dissident: Soros Fund Dates: 12/22/2004 – 4/19/2005 Proposals/Outcome: Dissident met with company to discuss its operating and board concerns. Company appointed one dissident nominee to nine-person board and submitted proposals to declassify the board and to allow 15% of shareholders to call special meetings. Target: Southwest Gas Corporation Dissident: GAMCO Asset Management Inc. (2/18/2004 – 5/6/2004) Proposals/Outcome: Dissident campaign to nominate Salvatore J. Zizza to board. Dissident did not solicit proxies for its nominee, but instead nominated candidate from the floor of the annual meeting. Company’s nominees overwhelmingly elected to Board.

140
Appendix C: Activism classification – examples (Continued) Case 3. Firm is target of a proxy fight which is settled without going to a shareholder vote (Targeted Firm, Targeted Board – Proxy and Proxy – Settled)
Target: Alloy, Inc. Dissident: Becker Drapkin Management LP/Kleinheinz Capital Partners, Inc. Dates: 3/17/2010 – 7/15/2010 Proposals/Outcome: Proxy fight for three board seats settled. Company increased the size of the board by one seat and appointed a dissident nominee to fill the vacancy. Target: The Brink’s Company Dissident: MCM Management, LLC Dates: 11/30/2007 – 5/2/2008 Proposals/Outcome: Proxy fight for four board seats settled, with company agreeing to nominate two dissident representatives at the 2008 annual meeting and announcing plans to spin-off its Home Security Unit. Case 4. Firm is target of a proxy fight that goes to a shareholder vote (Targeted Firm, Targeted Board – Proxy and Proxy – Went to Election)
Target: Blockbuster Inc. Dissident: Icahn Associates Corp. Dates: 4/8/2005 – 5/11/2005 Proposals/Outcome: Dissident slate elected, winning three of three seats up for election to seven-member board). Target: Alaska Air Group, Inc. Dissident: Richard D. Foley/Stephen Nieman/Terry K. Dayton/William Davidge Dates: 3/20/2006 – 5/16/2006 Proposals/Outcome: Three-person dissident slate defeated (management won all four seats up for election to twelve-person board). Management’s proposals to declassify board and remove supermajority vote for mergers was passed and implemented. Case 5. Firm is target of a proxy fight that is not settled, but does not go to a shareholder vote (Targeted Firm, Targeted Board – Proxy and Proxy – Not Settled) Target: Friendly Ice Cream Corporation Dissident: Biglari Capital Corp. Dates: 11/8/2006 – 6/17/2007 Proposals/Outcome: Proxy fight to elect two people to the five-person board at the 2007 annual meeting was withdrawn after company agreed to be acquired. Dissident entered into agreement to vote for the merger.

141
Appendix D: Identification of targeted directors – examples In some proxy fights, dissidents specifically name on DEFC14A filings those directors they seek to replace with their own nominees, in which case we consider these directors as explicitly targeted. In other cases, dissident do not specify the directors they are trying to replace, but we infer the targeted directors from proxy filings by management. We recognize those director nominees as implicitly targeted.
Example 1: Explicitly Targeted Directors Target: Lions Gate Entertainment Corp. Dissident: Carl C. Icahn Duration: 12/6/2010 – 12/14/2010 Excerpt from DEFC14A filed by Carl C. Icahn: “If no specification is made, your shares will be voted (i) FOR Mr. Jay Firestone; (ii) FOR Dr. Michael Dornemann; (iii) FOR Mr. Christopher J. McGurk; (iv) FOR Mr. Daniel A. Ninivaggi; (v) FOR Dr. Harold T. Shapiro; (vi) FOR the persons who have been nominated by Lions Gate to serve as directors, OTHER THAN Mr. Michael Burns, Mr. Harald Ludwig, Mr. G. Scott Paterson, Mark H. Rachesky, M.D. and Mr. Hardwick Simmons.” Full list of director nominees from DEFC14A filed by Lions Gate Entertainment Corp.:
Management Nominees
Targeted Director Management Nominees
Targeted Director
Michael Burns Harald Ludwig G. Scott Paterson Mark H. Rachesky Hardwick Simmons
True True True True True
Norman Bacal Arthur Evrensel Jon Feltheimer Frank Giustra Morley Koffman Daryl Simm Phyllis Yaffe
False False False False False False False
Example 2: Implicitly Targeted Directors Target: Target Corp. Dissident: Pershing Square LP Duration: 4/21/2009 – 5/28/2009 Excerpt from DEFC14A filed by Target Corp. “Proxies solicited by the Board of Directors will, unless otherwise directed, be voted for the election of four nominees to serve as Class III directors for three-year terms expiring in 2012 and until their successors are elected. The four nominees are Mary N. Dillon, Richard M. Kovacevich, George W. Tamke, and Solomon D. Trujillo. All of the nominees are currently directors and have consented to be named in this proxy statement and to serve if elected.” Excerpt from DEFC14A filed by Pershing Square LP “PROPOSAL 2A: To elect William A. Ackman, Michael L. Ashner, James L. Donald and Richard W. Vague as directors of Target Corporation.”
Management Nominees Targeted Director Mary N. Dillon Richard M. Kovacevich George W. Tamke Solomon D. Trujillo
True True True True