Shielding Calculation: Radiographic · PDF file · 2009-09-03Radiographic Room...
33
Shielding Calculation: Radiographic Room Jerry Williams
Transcript of Shielding Calculation: Radiographic · PDF file · 2009-09-03Radiographic Room...

Shielding Calculation:Radiographic Room
Jerry Williams

h d kWhat you need to know
• Room use and layout– DAP workload– DAP averaged kV– DAP averaged kV– Distance to barrier
• Construction details– Walls– Ceilings/ floors
• Surrounding areas• Surrounding areas– Rooms above or below– Occupancy

kl dDAP Workload
Two approaches:1. Predict clinical usage and use typical 1. Predict clinical usage and use typical
DAP values per exam2. Assume typical total DAP valuesyp

Method 1: DAP data• UK Dose Surveysy
– HPA-RPD-029 – http://www.hpa.org.uk/radiation/
Room doses for 50 90 kg patient sub set – Room doses for 50 – 90 kg patient sub-set – Mean– Min/ max– 25th/ 50th/ 75th percentile values25 / 50 / 75 percentile values
– kV and mAs values
• National Diagnostic Reference Levels– Based on 3rd quartile values – “Boundary between good and normal practice and
bad and abnormal practice”
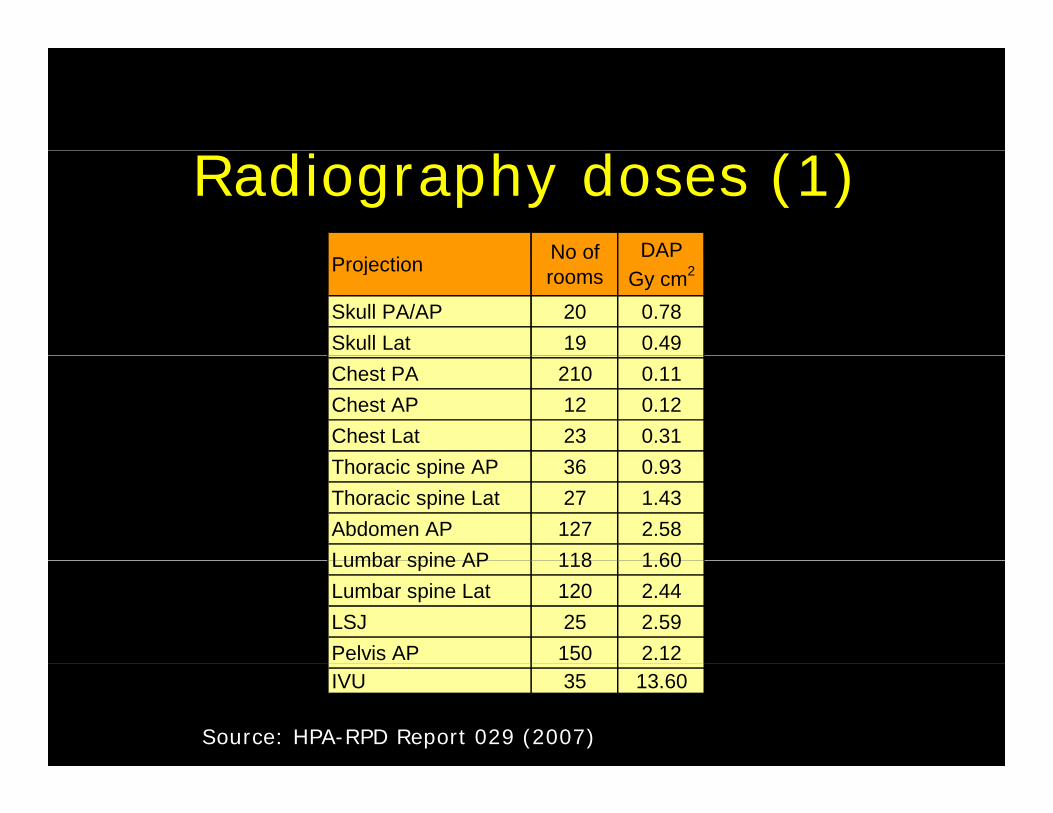
Radiography doses (1)No of DAP
Projection No of rooms
DAPGy cm2
Skull PA/AP 20 0.78Skull Lat 19 0.49Chest PA 210 0.11Chest AP 12 0.12Chest Lat 23 0.31Thoracic spine AP 36 0.93Thoracic spine Lat 27 1.43Abdomen AP 127 2.58Lumbar spine AP 118 1 60Lumbar spine AP 118 1.60Lumbar spine Lat 120 2.44LSJ 25 2.59Pelvis AP 150 2.12
Source: HPA-RPD Report 029 (2007)
IVU 35 13.60
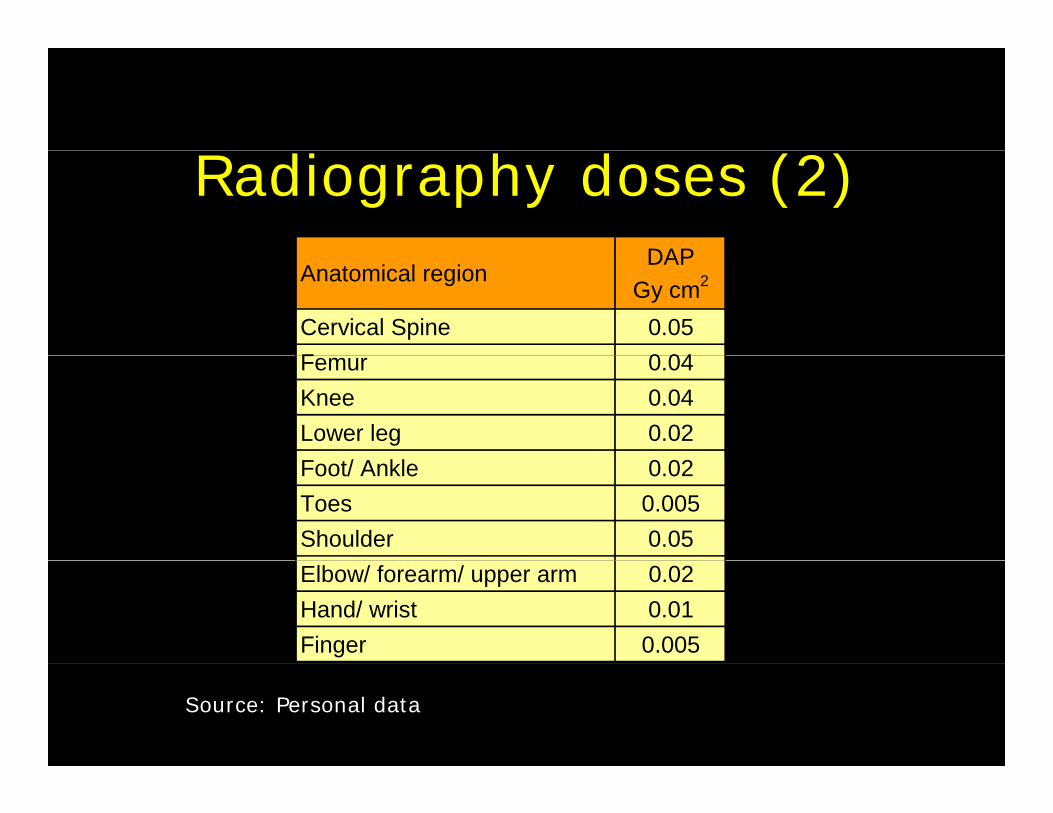
Radiography doses (2)DAP
Anatomical regionDAP
Gy cm2
Cervical Spine 0.05F 0 04Femur 0.04Knee 0.04Lower leg 0.02Foot/ Ankle 0.02Toes 0.005Shoulder 0.05Elbow/ forearm/ upper arm 0.02Hand/ wrist 0.01Finger 0.005
Source: Personal data

Radiographic workload (UK)0% 10% 20% 30% 40%Frequency 0% 10% 20% 30% 40%
Head
Chest
q yDAP
Abdomen
Pelvis
Spine
Upper extremity
Lower extremity
Data from:
UK examination frequencies – in NRPB Report W4 (2002)
DAP data * HPA-RPD Report 029 (2007)
* personal data (extremities)

Radiographic workload (UK)g p ( )
0% 10% 20% 30% 40%Frequency • Abdo/ pelvis/ spineHead
Chest
Abdomen
DAP Abdo/ pelvis/ spine– 23% frequency– 87% DAP
• ChestPelvis
Spine
Upper extremity
• Chest– 35% frequency– 8% DAP
• ExtremitiesLower extremity
• Extremities– 37% frequency– 1.5% DAP
• Conclusion– To predict DAP workload
– estimate number of abdomen/ spine/ pelvis examinations– Ignore extremities– Chest workload only required for primary beam shielding

Method 2:Method 2:DAP workload in typical rooms
• Survey data from 10 CR consoles– Collection period: 9 to 43 weeks– Number/ type of examination– Number of patients
• Assumption – Images processed on console correspond to
specific X ray roomspecific X-ray room– Average DAP values
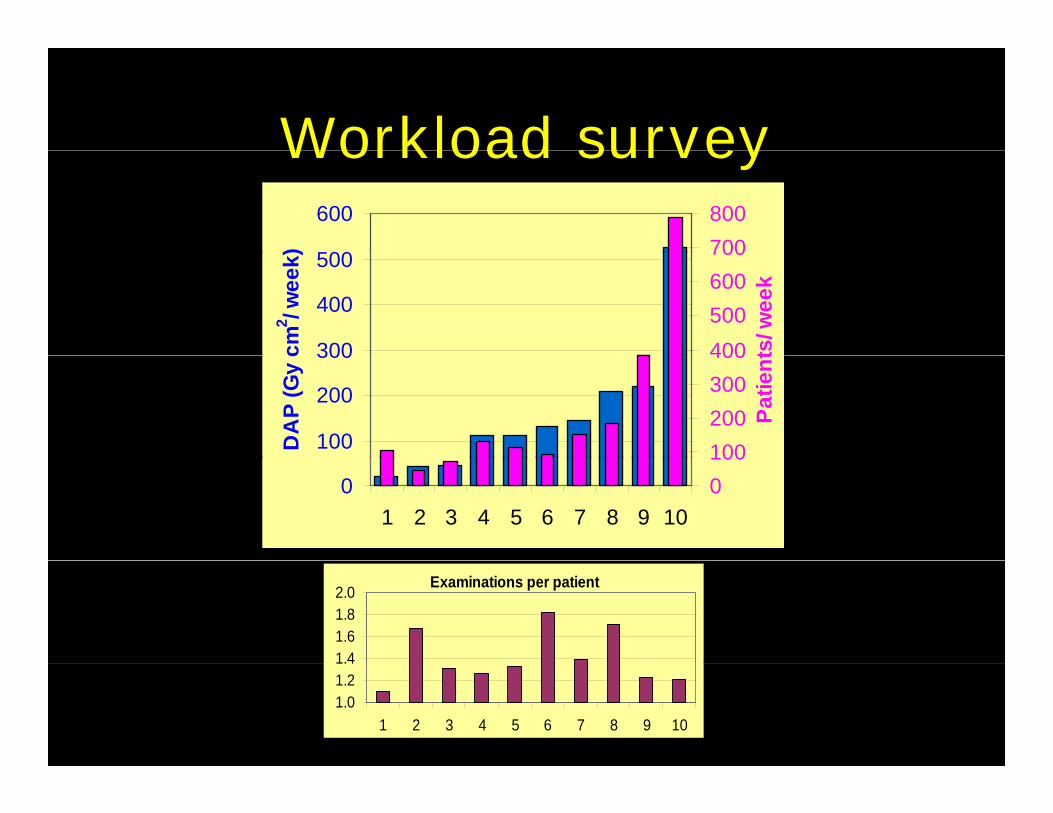
Workload surveyWorkload survey
500
600
) 700800
300
400
500cm
2 / wee
k)
400500600700
ts/ w
eek
100
200
300
DA
P (G
y c
100200300400
Patie
nt
01 2 3 4 5 6 7 8 9 10
0100
Examinations per patient
1.41.61.82.0
1.01.21.4
1 2 3 4 5 6 7 8 9 10
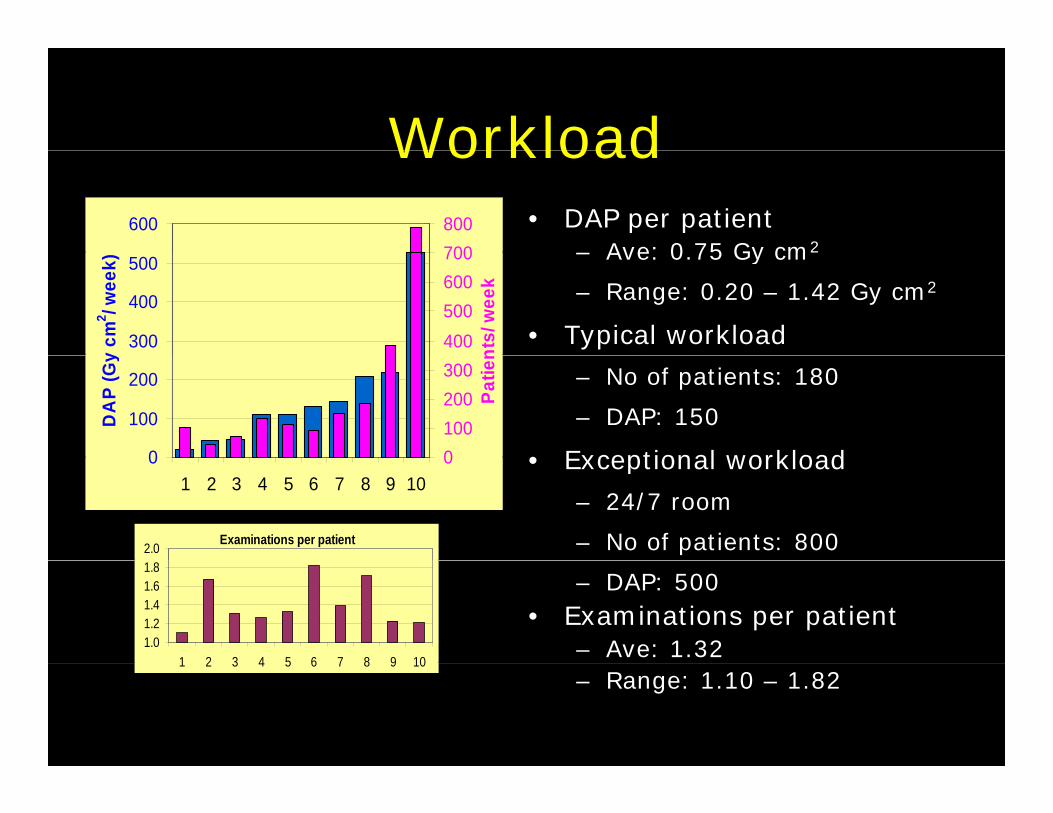
Workload• DAP per patient
– Ave: 0 75 Gy cm2
Workload600
700800
– Ave: 0.75 Gy cm
– Range: 0.20 – 1.42 Gy cm2
• Typical workload300
400
500
y cm
2 / wee
k)
400500600700
nts/
wee
k
– No of patients: 180
– DAP: 150
• Exceptional workload0
100
200
DA
P (G
y
0100200300
Patie
n• Exceptional workload
– 24/7 room
– No of patients: 800
01 2 3 4 5 6 7 8 9 10
0
Examinations per patient2.0
– DAP: 500• Examinations per patient
– Ave: 1.321.01.21.41.61.8
1 2 3 4 5 6 7 8 9 10– Range: 1.10 – 1.82
1 2 3 4 5 6 7 8 9 10

DAP averaged kVDAP averaged kV
84868890
kV
78808284
P av
erag
ed
70727476
DA
P
1 2 3 4 5 6 7 8 9 10
Weighted average: 78.2 kV

d lConstruction details
• Floors/ ceilings–Concrete thicknessConcrete thickness–Profile
• Wall construction• Wall construction–Stud partition?
Blockwork?–Blockwork?

dAdjacent areas
• Occupancy–New buildings – assume 100%New buildings assume 100%
• Layout

d hRadiographic Room
1.5 m
6.3 m3.5 m
3 m
1 m
6 m6 m

Lead shielding vs DAP workloadg
1
1.2d = 1 m
d = 1.5 m
0.4
0.6
0.8
d sh
ield
ing
mm
0
0.2
0 100 200 300 400 500 600 700
Lead
Occupancy = 100%• Typical room (DAP = 150 Gy cm2)
DAP workload Gy cm2
Typical room (DAP 150 Gy cm )– 0.45 mm (d = 1.5 m)– 0.6 mm (d = 1 m)
• Exceptional room (DAP = 500 Gy cm2)p ( y )– 0.7 mm (d = 1.5 m)– 0.9 mm (d = 1 m)

UK/ NCRP ComparisonUK/ NCRP Comparison
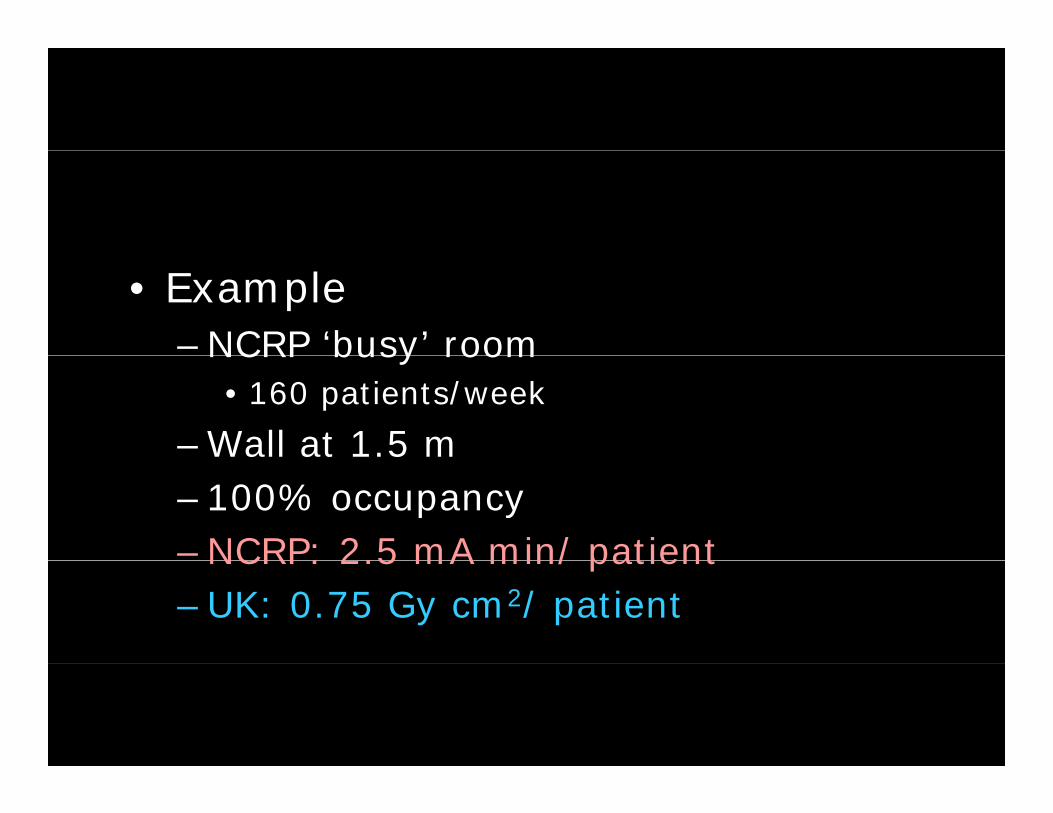
• Example–NCRP ‘busy’ roomNCRP busy room
• 160 patients/week
–Wall at 1.5 m –100% occupancy–NCRP: 2.5 mA min/ patientNCRP: 2.5 mA min/ patient–UK: 0.75 Gy cm2/ patient
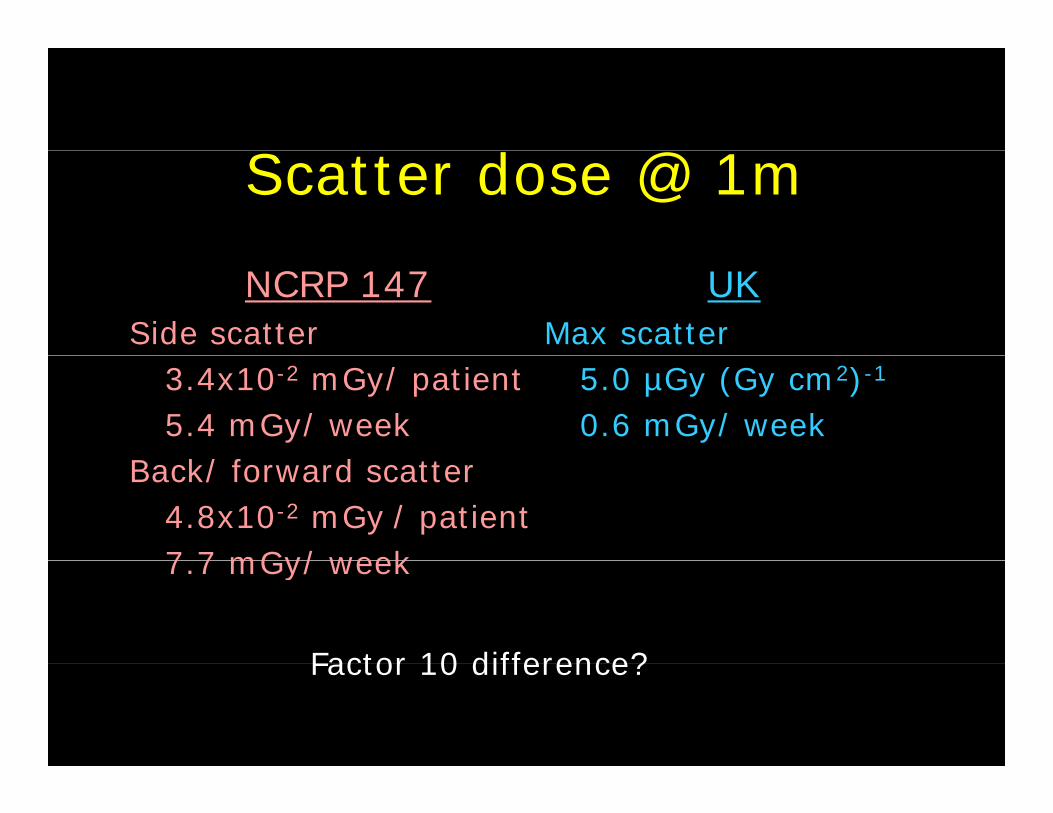
dScatter dose @ 1m
NCRP 147Side scatter
UKMax scatter
3.4x10⁻² mGy/ patient5.4 mGy/ weekk/ f d
5.0 µGy (Gy cm2)-1
0.6 mGy/ weekBack/ forward scatter
4.8x10⁻² mGy / patient7 7 mGy/ week7.7 mGy/ week
Factor 10 difference?Factor 10 difference?

h ld l lShielding calculation
NCRP• Dose constraint = 20 µSv
B < 0 02/5 4 x 1 52
UK• Dose constraint = 6 µSv
B < 0 006/0 6 x 1 52• B < 0.02/5.4 x 1.52
= 0.8%• Shielding @ workload
h d k
• B < 0.006/0.6 x 1.52
= 2.3%• Shielding @ 80 kV
weighted kV= 0.81 mm Pb
= 0.41 mm Pb

ffDifferences
• Scatter model• Field area assumption• Field area assumption• Patient workload data
D t i t• Dose constraints• Transmission data

d lScatter modelScatter fraction (S) @ 85 kV
10
12
2 )-1
UK
NCRP 147
MonteCarlokV UK NCRP
Smax analysis
4
6
8
µG
y (G
y cm
MonteCarlo
50 4.05 4.1070 4.67 4.4185 5 14 4 64
0
2
0 30 60 90 120 150 180Angle
S 85 5.14 4.64100 5.60 4.87125 6.38 5.26

ldField area
• NCRPF = 1000 cm2F 1000 cm
• UKF incorporated into DAPF incorporated into DAP
F cm2Plate size
8" x 10" 20 x 24 cm2 48010" x 12" 24 x 30 cm2 72014" 17" 35 43 2 150514" x 17" 35 x 43 cm2 1505
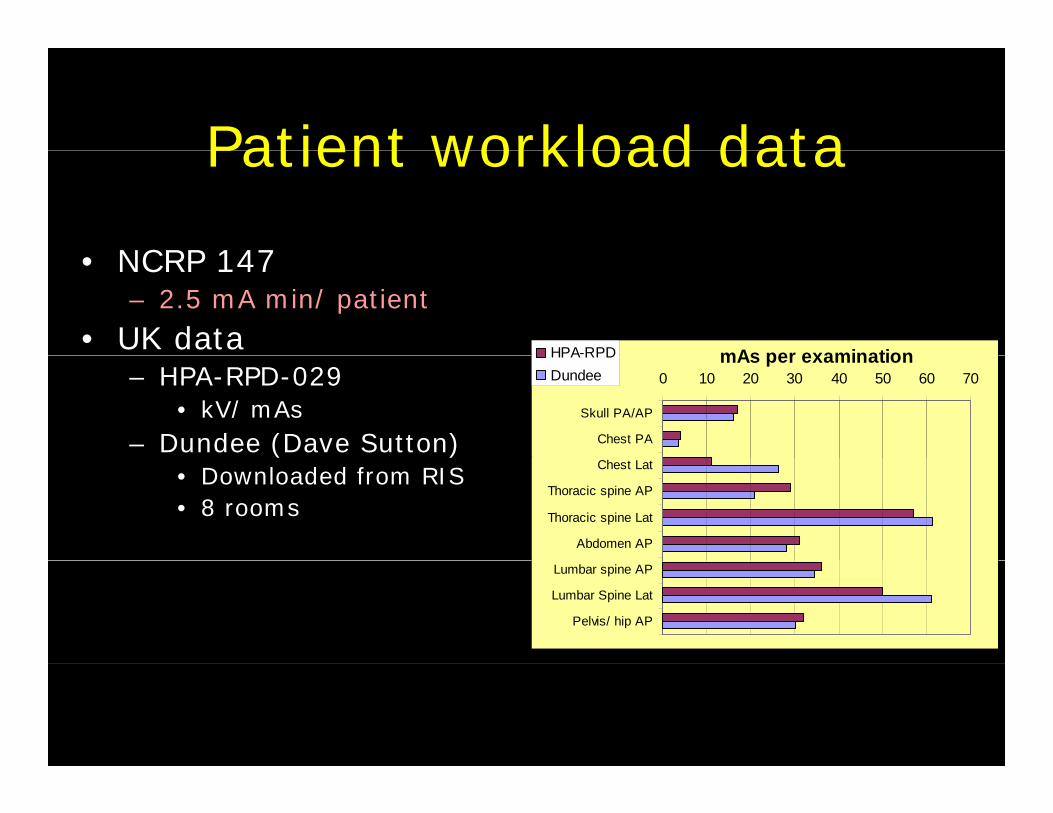
Patient workload data
NCRP 147
Patient workload data
• NCRP 147– 2.5 mA min/ patient
• UK datamAs per examinationHPA-RPD
– HPA-RPD-029• kV/ mAs
– Dundee (Dave Sutton)
0 10 20 30 40 50 60 70
Skull PA/AP
Chest PA
mAs per examinationHPA RPDDundee
• Downloaded from RIS• 8 rooms
Chest Lat
Thoracic spine AP
Thoracic spine Lat
Abdomen AP
Lumbar spine AP
Lumbar Spine Lat
Pelvis/ hip AP

Patient workload data
• NCRP 147
Patient workload data
• NCRP 147– 2.5 mA min/ patient
• UK data– HPA-RPD-029
• kV/ mAs high dose exams– Dundee (Dave Sutton)
• Downloaded from RIS• 8 rooms
– Combined with CR workload data– 0.27 mA min/ patient
Factor of 10??

Patient workload data
• Examinations per patient
Patient workload data
• Examinations per patient– US: 3.37– UK: 1.32⇒US: UK Ratio = 2.5
• Types of examination?Period of survey ESD (normalised to 1986)• Period of survey– US: early 1990s– UK: early 2000s
ESD (normalised to 1986)
60%
80%
100%
19861996
20%
40%
60% 199620022007
0%Lat Skull PA Chest AP Lumbar
spineLat Lumbar
spineAP Pelvis

Dose constraints
• NCRP –20 µGy (100 µGy Radiology staff)20 µGy (100 µGy Radiology staff)
• UK6 µGy–6 µGy

Transmission factorsTransmission factors
• NCRP• NCRP– Workload weighted transmission factors
• UK • UK – Workload weighted kV
• For this analysis 78 kV• For this analysis 78 kVB NCRP 80 kV
0.05 0.34 0.270.02 0.54 0.430.01 0.74 0.56
0.005 0.96 0.710.002 1.29 0.920.001 1.55 1.08

WARNING!
• UK workload data apply only in UK• UK workload drivers• UK workload drivers
–Legislation• Justification/ Optimisation• Justification/ Optimisation
–Public Healthcare provision
Derive your own workload dataDerive your own workload data

• Standard specification:–1 mm lead for all radiographic rooms1 mm lead for all radiographic rooms