Shellfish water quality monitoring using chemical tracers ... · Fishing and shellfishing...
24
Shellfish water quality monitoring using chemical tracers, environmental microbiology and satellite remote sensing Carlos J. A. Campos Water Quality Scientist Cefas, Weymouth Laboratory
Transcript of Shellfish water quality monitoring using chemical tracers ... · Fishing and shellfishing...
Shellfish water quality monitoring using chemical tracers, environmental microbiology and satellite remote sensing
Carlos J. A. Campos
Water Quality Scientist
Cefas, Weymouth Laboratory
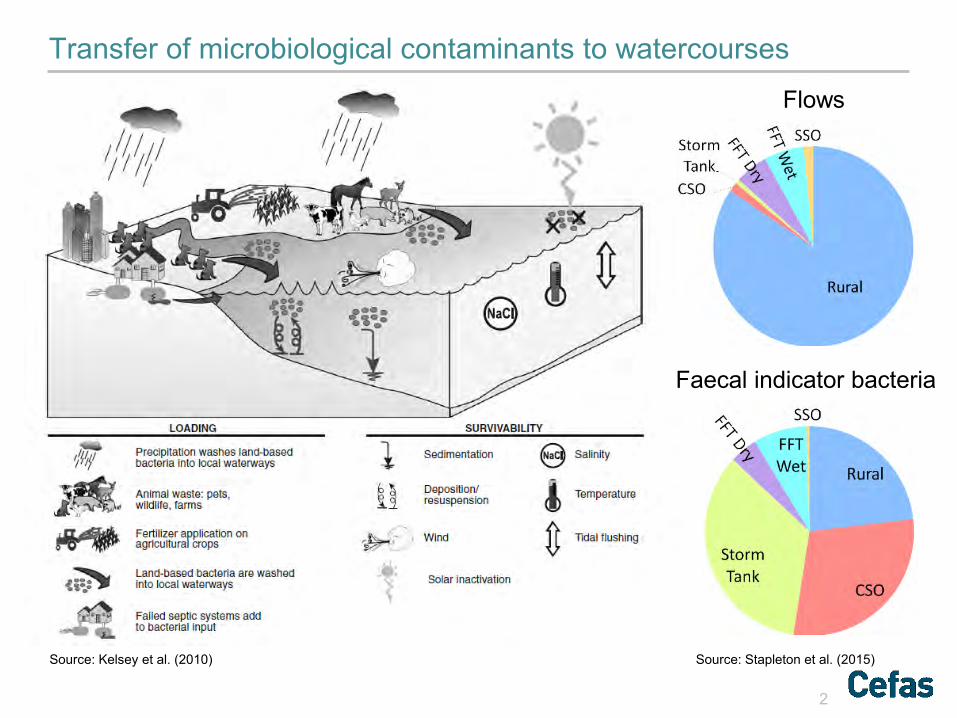
Transfer of microbiological contaminants to watercourses
2
Faecal indicator bacteria
Flows
Source: Kelsey et al. (2010) Source: Stapleton et al. (2015)
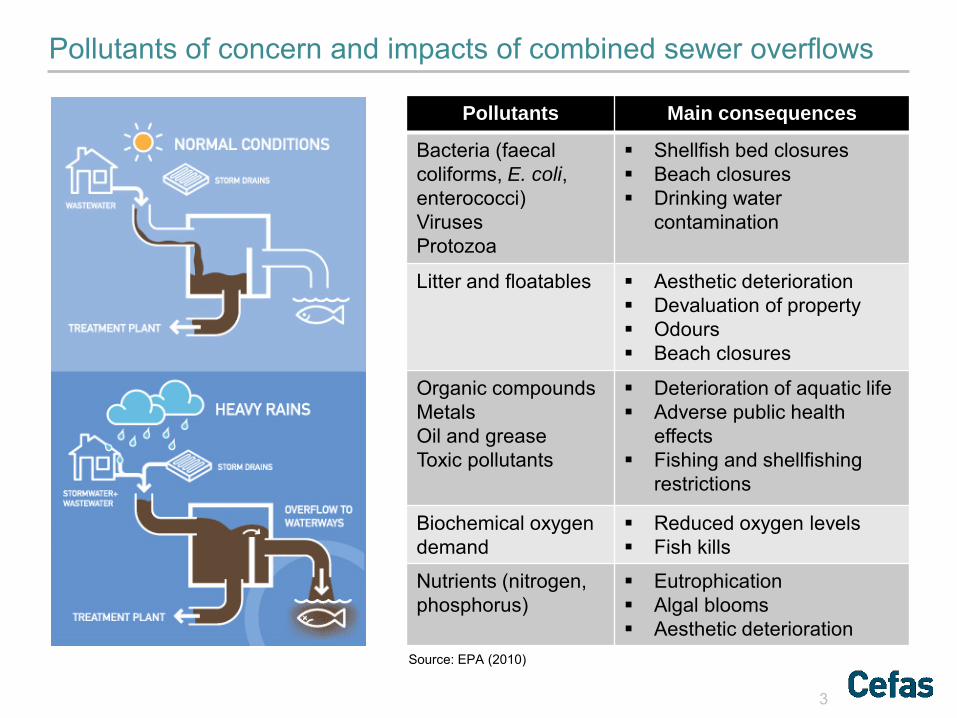
Pollutants of concern and impacts of combined sewer overflows
3
Pollutants Main consequences
Bacteria (faecal coliforms, E. coli, enterococci) Viruses Protozoa
Shellfish bed closures Beach closures Drinking water
contamination
Litter and floatables
Aesthetic deterioration Devaluation of property Odours Beach closures
Organic compounds Metals Oil and grease Toxic pollutants
Deterioration of aquatic life Adverse public health
effects Fishing and shellfishing
restrictions
Biochemical oxygen demand
Reduced oxygen levels Fish kills
Nutrients (nitrogen, phosphorus)
Eutrophication Algal blooms Aesthetic deterioration
Source: EPA (2010)
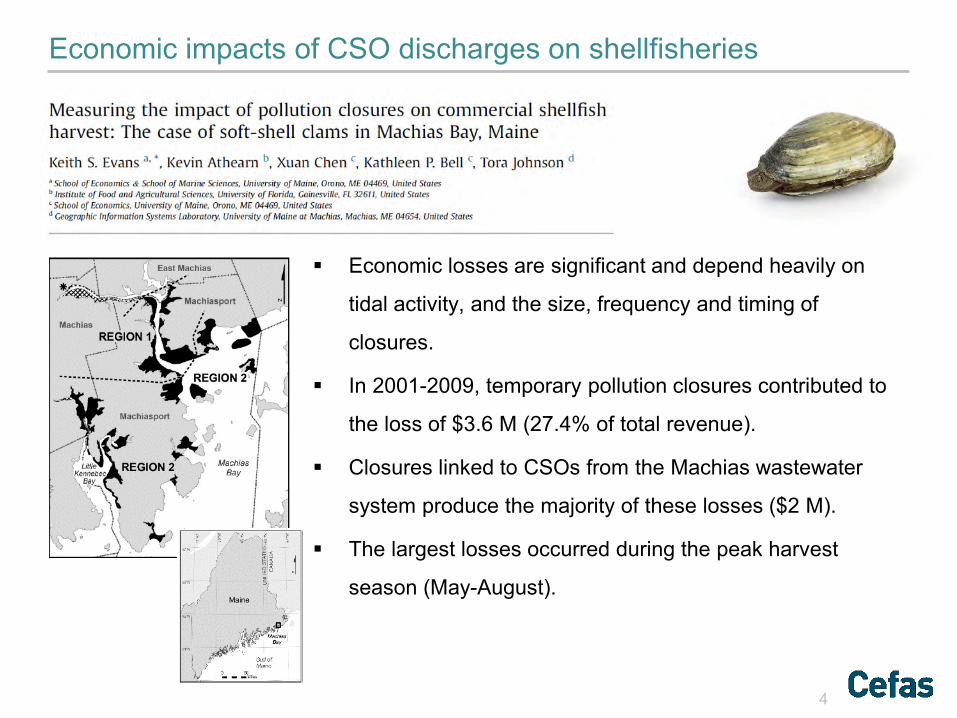
Economic impacts of CSO discharges on shellfisheries
4
Economic losses are significant and depend heavily on
tidal activity, and the size, frequency and timing of
closures.
In 2001-2009, temporary pollution closures contributed to
the loss of $3.6 M (27.4% of total revenue).
Closures linked to CSOs from the Machias wastewater
system produce the majority of these losses ($2 M).
The largest losses occurred during the peak harvest
season (May-August).
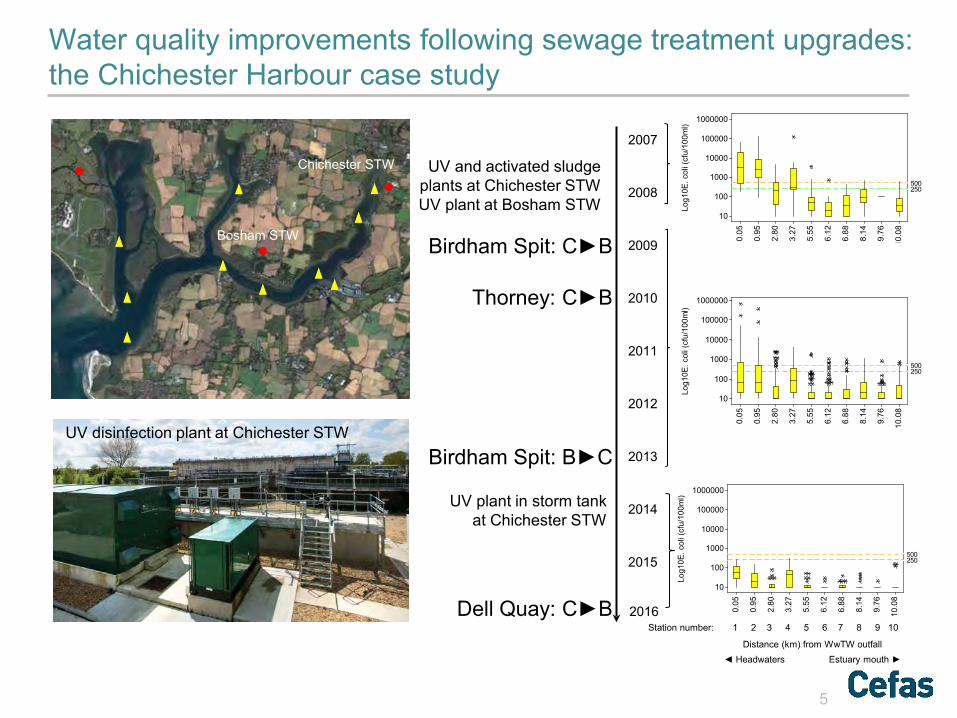
Water quality improvements following sewage treatment upgrades: the Chichester Harbour case study
5
2007
2008
2009
2010
2011
2012
2013
2014
2015
10.0
8
9.76
8.14
6.88
6.12
5.55
3.27
2.80
0.95
0.05
1000000
100000
10000
1000
100
10
Log1
0E. c
oli (
cfu/
100m
l)
250500
10.0
8
9.76
8.14
6.88
6.12
5.55
3.27
2.80
0.95
0.05
1000000
100000
10000
1000
100
10
Log1
0E. c
oli (
cfu/
100m
l)
250500
10.0
8
9.76
8.14
6.88
6.12
5.55
3.27
2.80
0.95
0.05
1000000
100000
10000
1000
100
10
Log1
0E. c
oli (
cfu/
100m
l)
250500
◄ Headwaters Estuary mouth ► Distance (km) from WwTW outfall
Station number: 1 2 3 4 5 6 7 8 9 10
UV and activated sludge plants at Chichester STW UV plant at Bosham STW
UV plant in storm tank at Chichester STW
Birdham Spit: C►B
Birdham Spit: B►C
Thorney: C►B
Dell Quay: C►B
Bosham STW
Chichester STW
2016
UV disinfection plant at Chichester STW
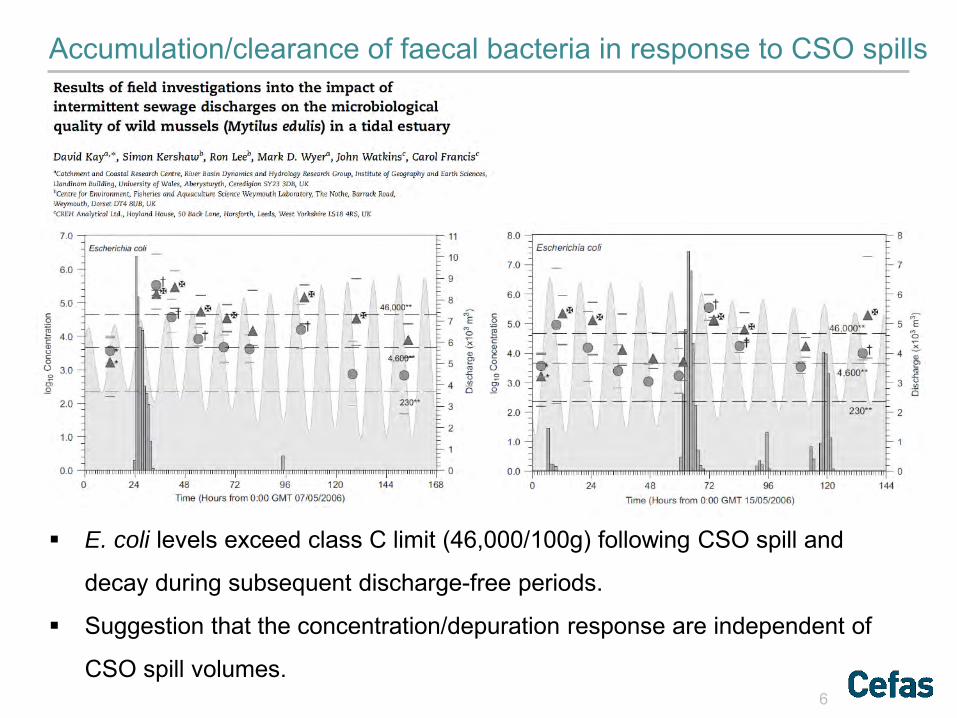
Accumulation/clearance of faecal bacteria in response to CSO spills
6
E. coli levels exceed class C limit (46,000/100g) following CSO spill and
decay during subsequent discharge-free periods.
Suggestion that the concentration/depuration response are independent of
CSO spill volumes.
7
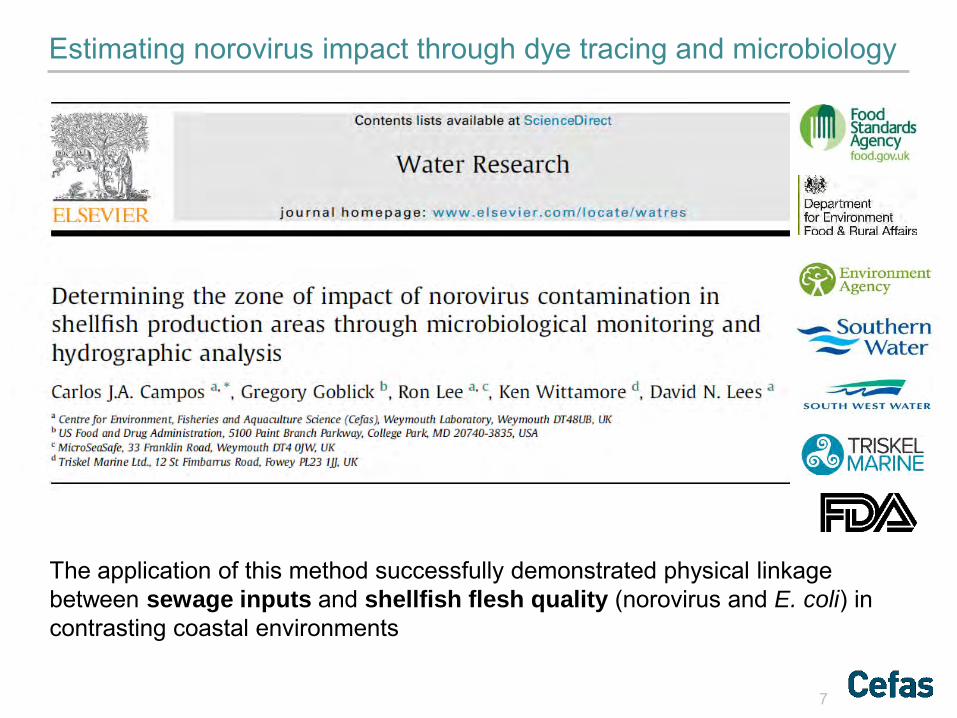
Estimating norovirus impact through dye tracing and microbiology
The application of this method successfully demonstrated physical linkage between sewage inputs and shellfish flesh quality (norovirus and E. coli) in contrasting coastal environments
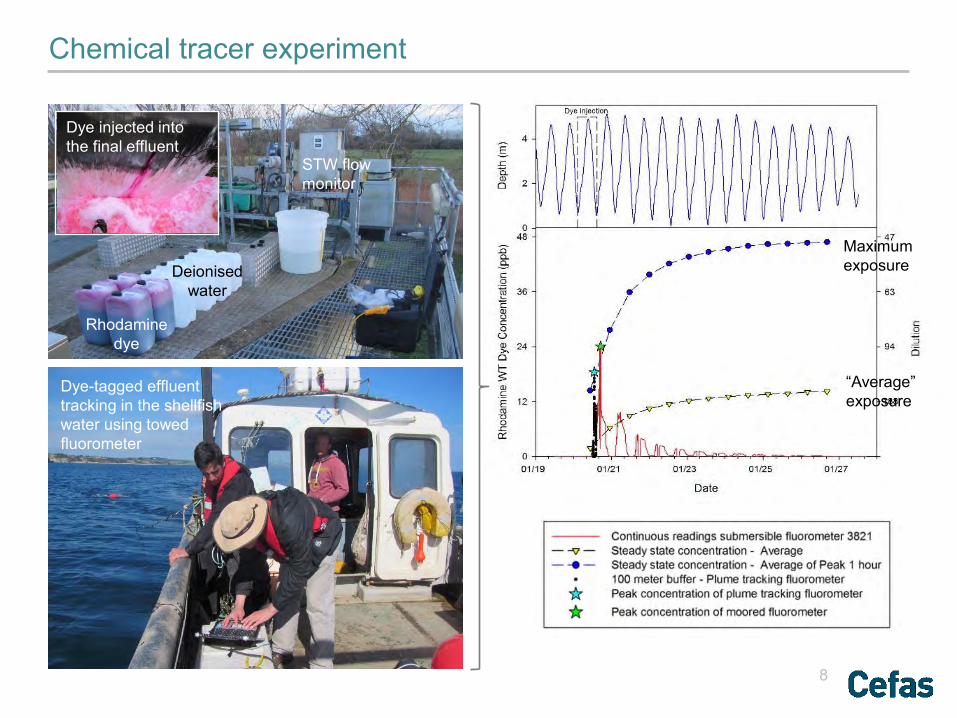
Rhodamine dye
Dye injected into the final effluent
Deionised water
STW flow monitor
Chemical tracer experiment
8
Dye-tagged effluent tracking in the shellfish water using towed fluorometer
“Average” exposure
Maximum exposure
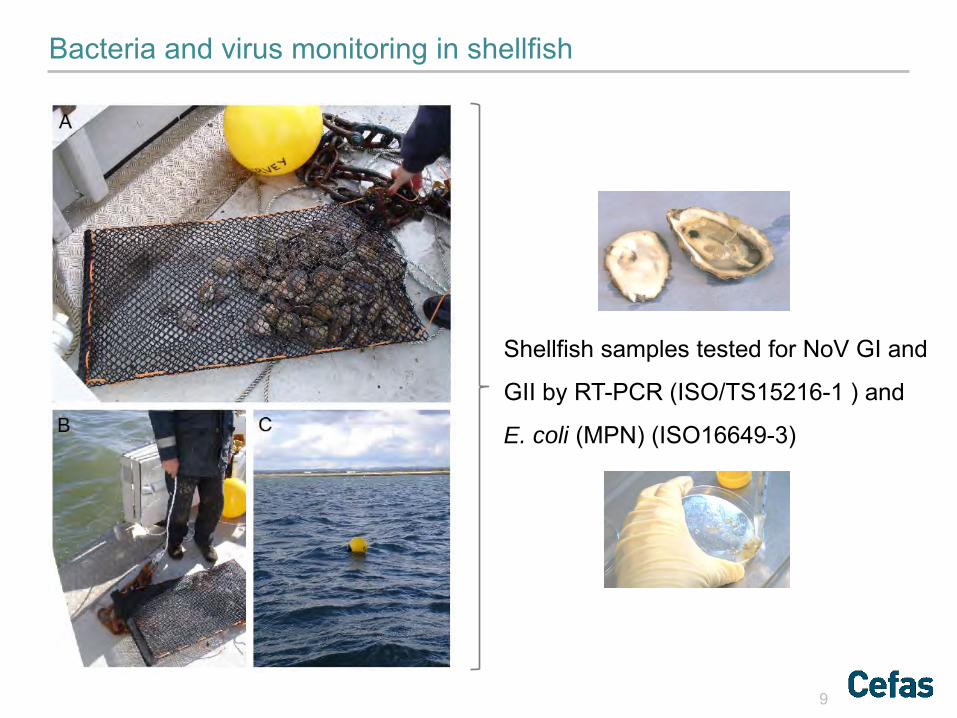
Bacteria and virus monitoring in shellfish
9
Shellfish samples tested for NoV GI and
GII by RT-PCR (ISO/TS15216-1 ) and
E. coli (MPN) (ISO16649-3)
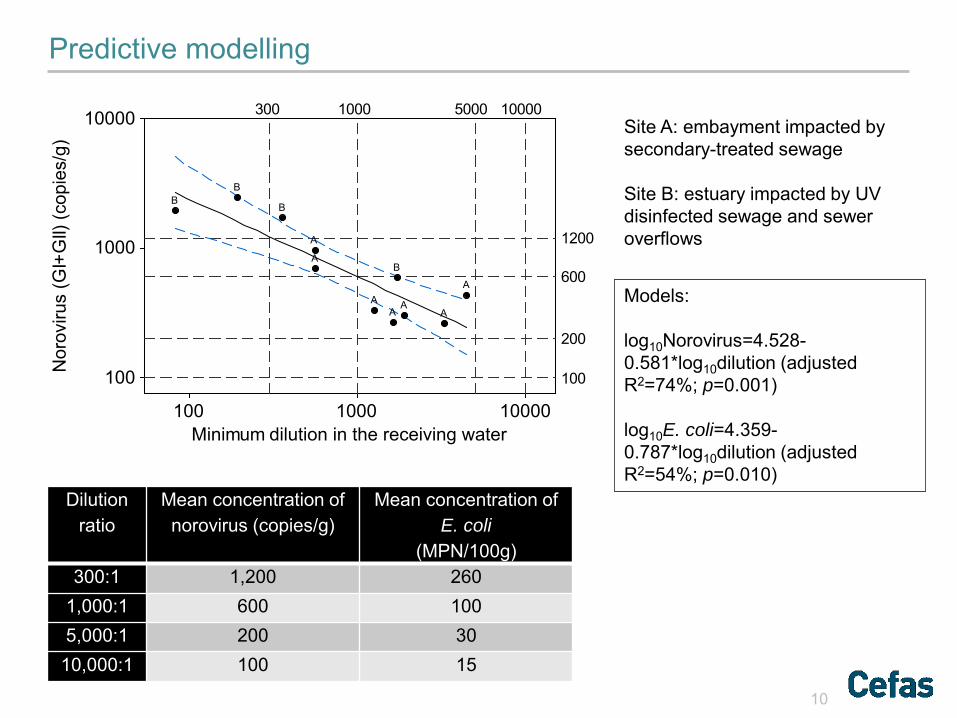
Predictive modelling
10
Dilution ratio
Mean concentration of norovirus (copies/g)
Mean concentration of E. coli
(MPN/100g) 300:1 1,200 260
1,000:1 600 100 5,000:1 200 30
10,000:1 100 15
100001000100
10000
1000
100
Minimum dilution in the receiving water
Nor
oviru
s (G
I+G
II) (c
opie
s/g)
300 1000 5000 10000
1200
600
200
100
AAA
A
A
A
A
B
B
BB
Site A: embayment impacted by secondary-treated sewage Site B: estuary impacted by UV disinfected sewage and sewer overflows
Models: log10Norovirus=4.528-0.581*log10dilution (adjusted R2=74%; p=0.001) log10E. coli=4.359-0.787*log10dilution (adjusted R2=54%; p=0.010)
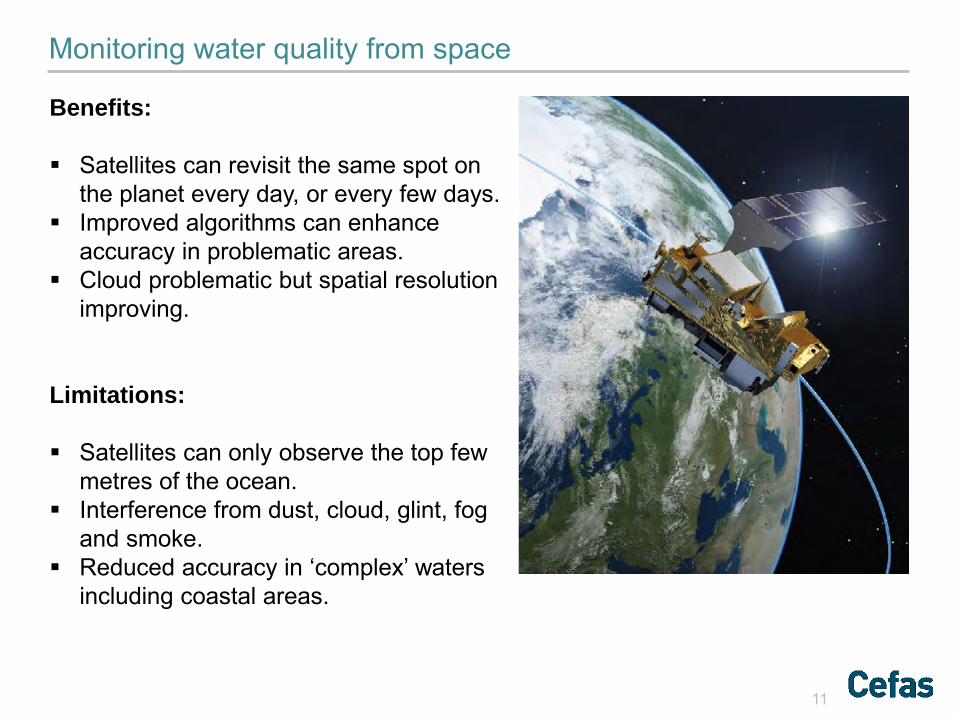
Monitoring water quality from space
11
Benefits: Satellites can revisit the same spot on
the planet every day, or every few days. Improved algorithms can enhance
accuracy in problematic areas. Cloud problematic but spatial resolution
improving. Limitations: Satellites can only observe the top few
metres of the ocean. Interference from dust, cloud, glint, fog
and smoke. Reduced accuracy in ‘complex’ waters
including coastal areas.
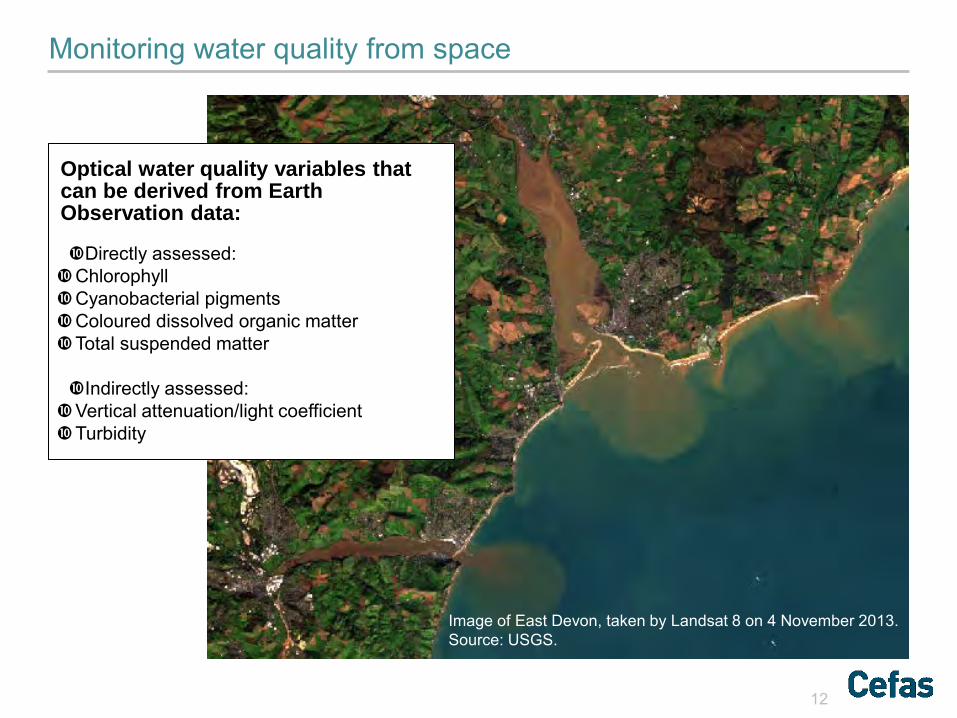
Monitoring water quality from space
12
Optical water quality variables that can be derived from Earth Observation data:
Directly assessed: Chlorophyll Cyanobacterial pigments Coloured dissolved organic matter Total suspended matter
Indirectly assessed: Vertical attenuation/light coefficient Turbidity
Image of East Devon, taken by Landsat 8 on 4 November 2013. Source: USGS.
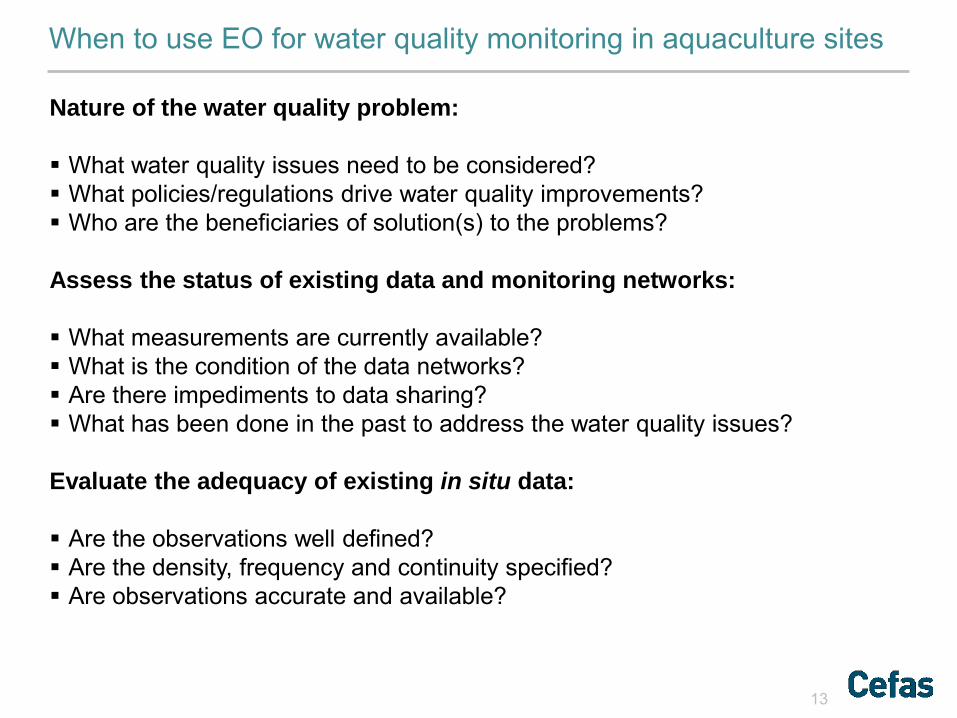
When to use EO for water quality monitoring in aquaculture sites
13
Nature of the water quality problem: What water quality issues need to be considered? What policies/regulations drive water quality improvements? Who are the beneficiaries of solution(s) to the problems?
Assess the status of existing data and monitoring networks: What measurements are currently available? What is the condition of the data networks? Are there impediments to data sharing? What has been done in the past to address the water quality issues? Evaluate the adequacy of existing in situ data: Are the observations well defined? Are the density, frequency and continuity specified? Are observations accurate and available?
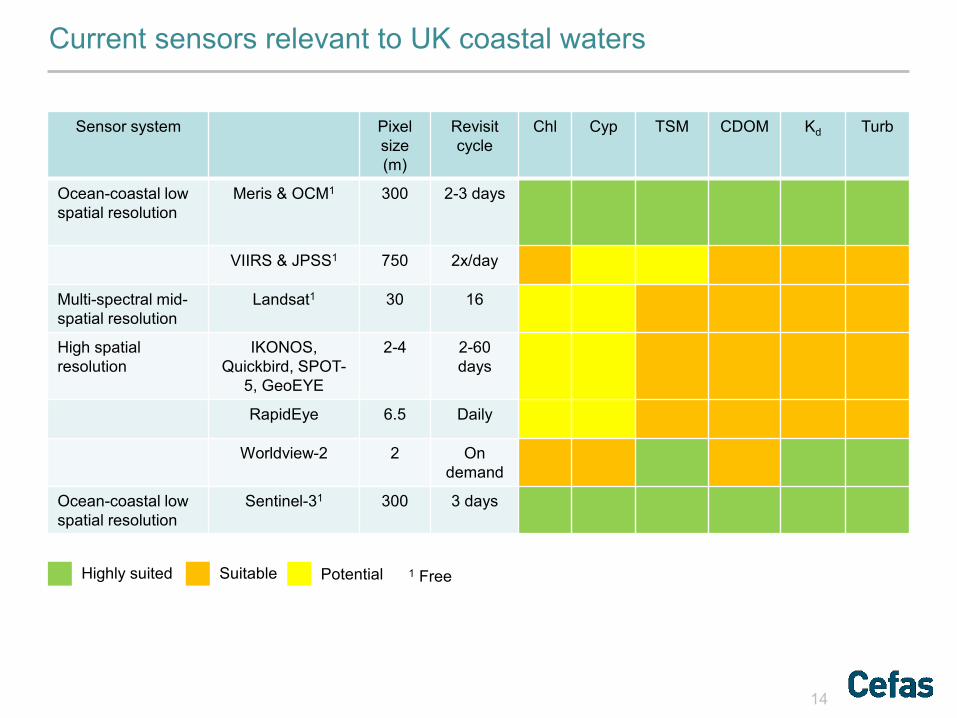
Current sensors relevant to UK coastal waters
14
Sensor system Pixel size (m)
Revisit cycle
Chl Cyp TSM CDOM Kd Turb
Ocean-coastal low spatial resolution
Meris & OCM1 300 2-3 days
VIIRS & JPSS1 750 2x/day
Multi-spectral mid-spatial resolution
Landsat1 30 16
High spatial resolution
IKONOS, Quickbird, SPOT-
5, GeoEYE
2-4 2-60 days
RapidEye 6.5 Daily
Worldview-2 2 On demand
Ocean-coastal low spatial resolution
Sentinel-31 300 3 days
Highly suited Suitable Potential 1 Free
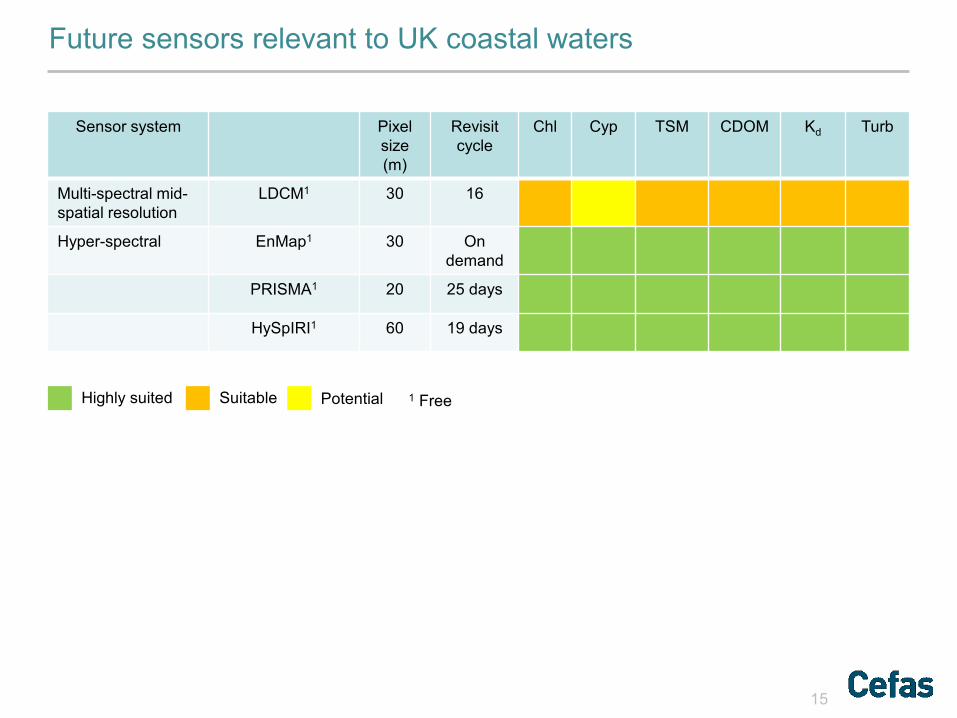
Future sensors relevant to UK coastal waters
15
Highly suited Suitable Potential 1 Free
Sensor system Pixel size (m)
Revisit cycle
Chl Cyp TSM CDOM Kd Turb
Multi-spectral mid-spatial resolution
LDCM1 30 16
Hyper-spectral EnMap1 30 On demand
PRISMA1 20 25 days
HySpIRI1 60 19 days
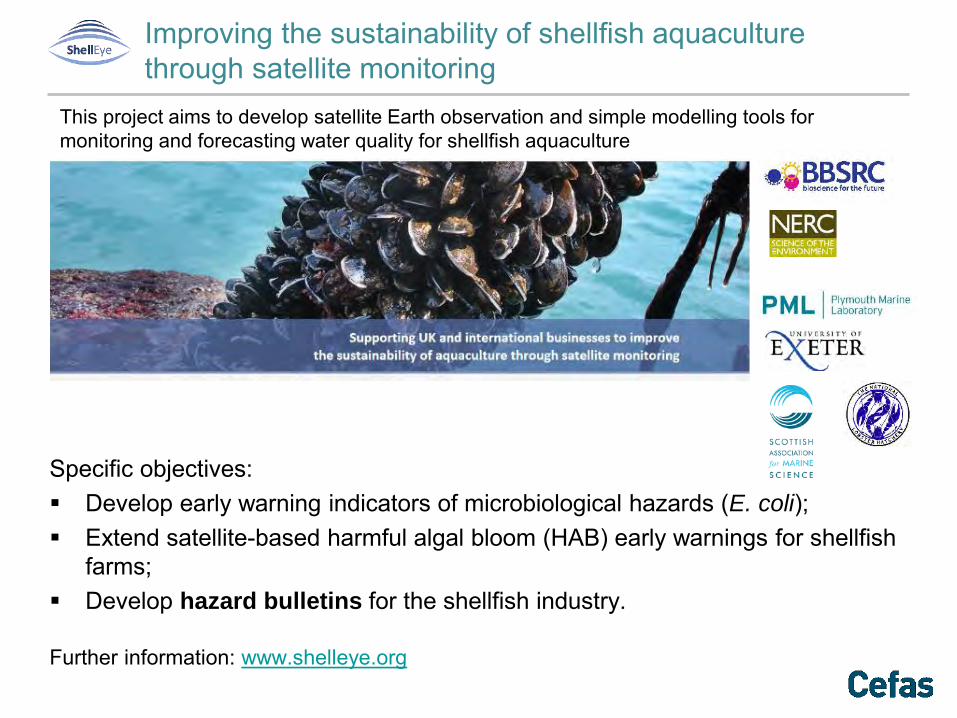
Specific objectives: Develop early warning indicators of microbiological hazards (E. coli); Extend satellite-based harmful algal bloom (HAB) early warnings for shellfish
farms; Develop hazard bulletins for the shellfish industry.
Further information: www.shelleye.org
This project aims to develop satellite Earth observation and simple modelling tools for monitoring and forecasting water quality for shellfish aquaculture
Improving the sustainability of shellfish aquaculture through satellite monitoring
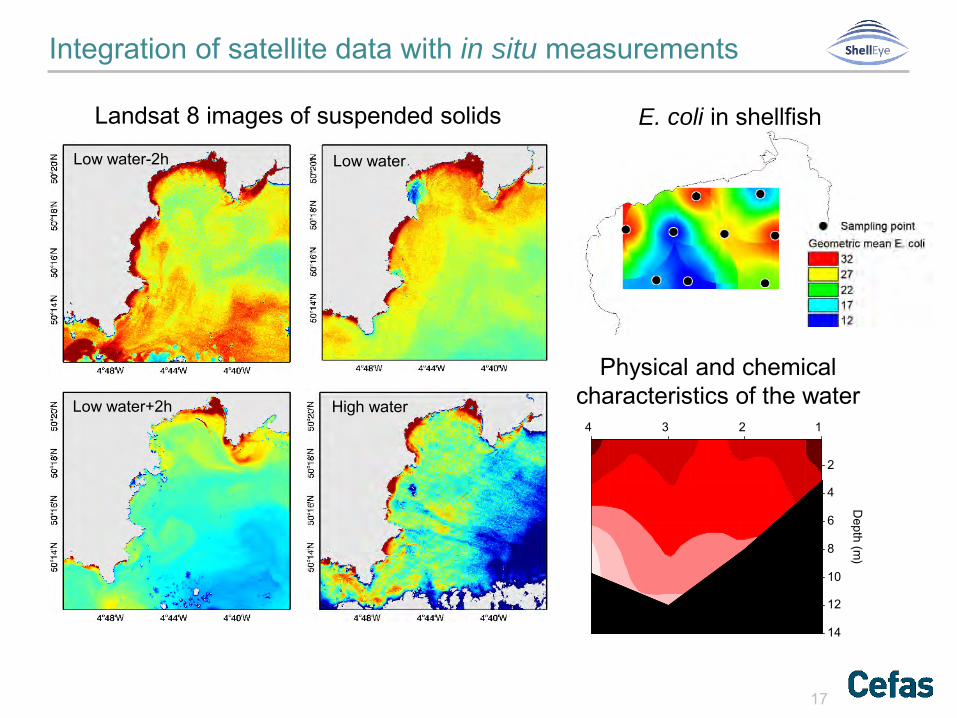
Integration of satellite data with in situ measurements
17
Low water Low water-2h
Low water+2h High water
E. coli in shellfish D
epth (m)
4 3 2 1
14
12
10
8
6
4
2
Physical and chemical characteristics of the water
Landsat 8 images of suspended solids
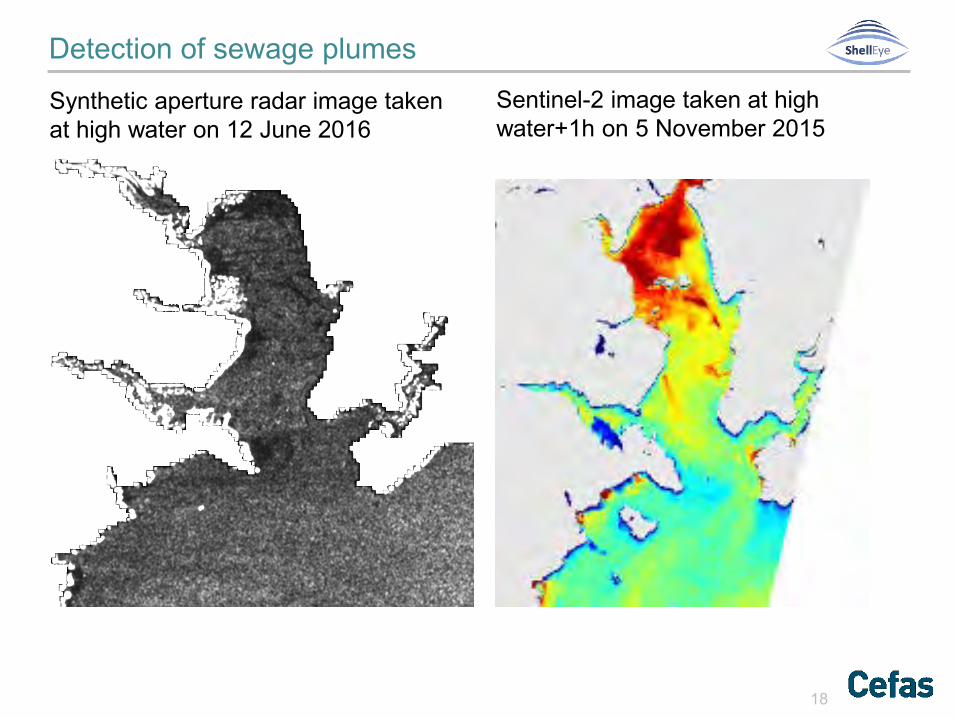
Detection of sewage plumes
18
Synthetic aperture radar image taken at high water on 12 June 2016
Sentinel-2 image taken at high water+1h on 5 November 2015
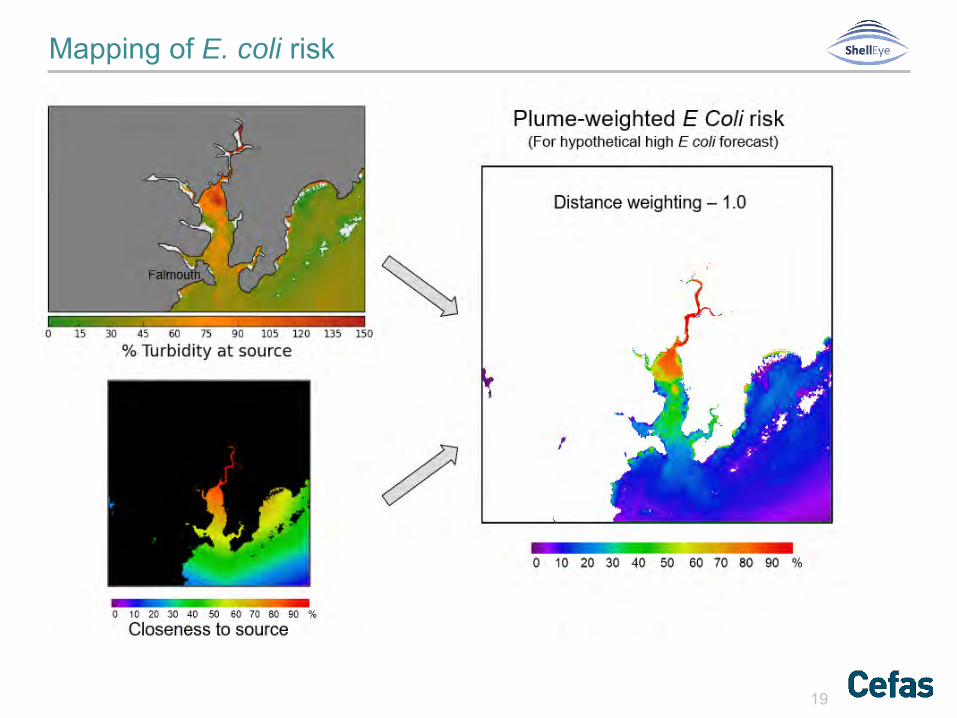
Mapping of E. coli risk
19
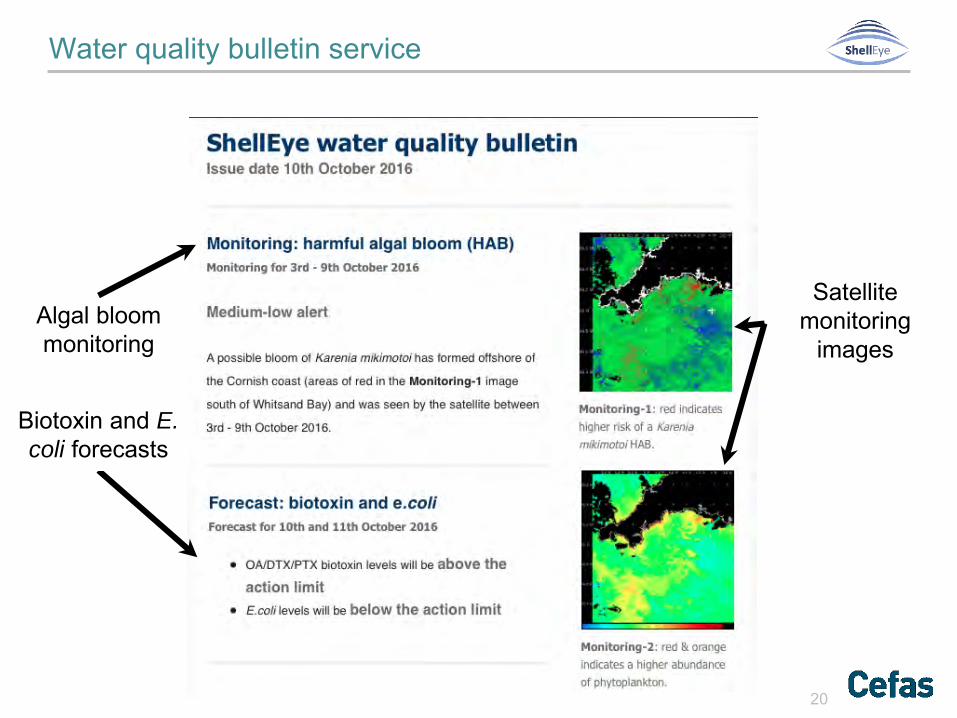
Water quality bulletin service
20
Algal bloom monitoring
Satellite monitoring
images
Biotoxin and E. coli forecasts
21
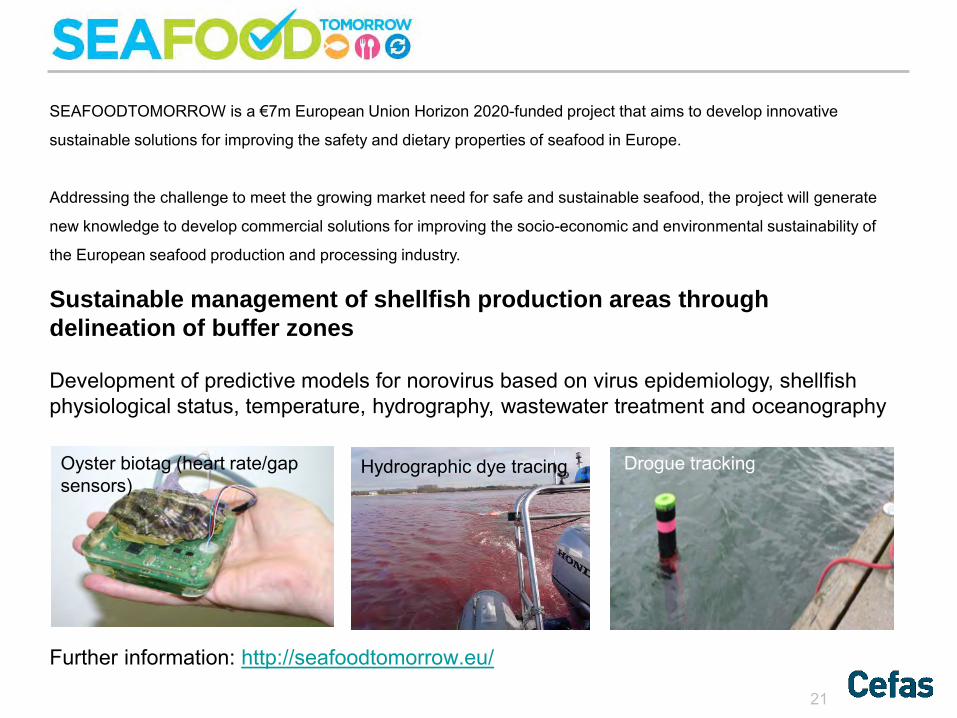
SEAFOODTOMORROW is a €7m European Union Horizon 2020-funded project that aims to develop innovative
sustainable solutions for improving the safety and dietary properties of seafood in Europe.
Addressing the challenge to meet the growing market need for safe and sustainable seafood, the project will generate
new knowledge to develop commercial solutions for improving the socio-economic and environmental sustainability of
the European seafood production and processing industry.
Sustainable management of shellfish production areas through delineation of buffer zones
Development of predictive models for norovirus based on virus epidemiology, shellfish physiological status, temperature, hydrography, wastewater treatment and oceanography
Oyster biotag (heart rate/gap sensors)
Hydrographic dye tracing Drogue tracking
Further information: http://seafoodtomorrow.eu/
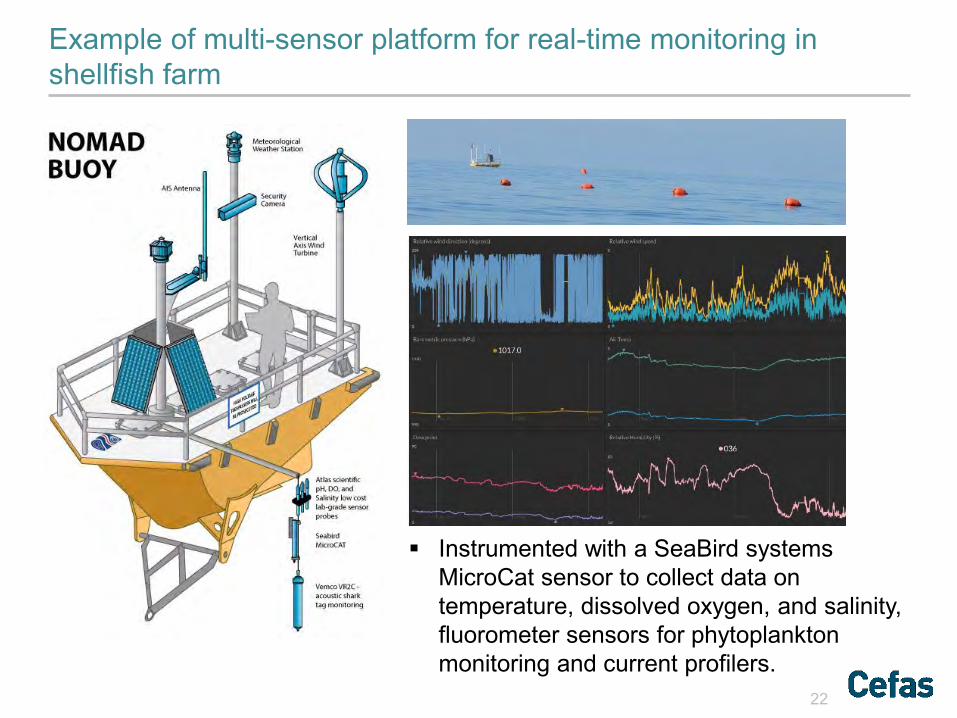
Example of multi-sensor platform for real-time monitoring in shellfish farm
22
Instrumented with a SeaBird systems MicroCat sensor to collect data on temperature, dissolved oxygen, and salinity, fluorometer sensors for phytoplankton monitoring and current profilers.
Summary
23
Characterisation of the variability in relative contributions from catchment (diffuse), sewage treatment works and CSOs requires carefully designed monitoring programmes to quantify adequately the relative magnitude of these sources through events.
The integration of tracers and environmental microbiology provides accurate quantitative information on individual sources and the movement of sewage pollution in the marine environment.
A significant amount of environmental information is available within satellite image archives.
The state of the science is sufficiently advanced to produce satellite remote sensing‐based water quality information at multiple spatial and temporal scales to benefit shellfish farming.
Acknowledgements
24
Reports and papers:
Tel: 01305 206749
Food Standards Agency
Defra
BBSRC/NERC
Cefas Seedcorn