Shellfish and bivalve markets in the UK - seafish.org · Clam – In XO sauce with lily bulb and...
24
JULIA BROOKS, MARKET INSIGHT ANALYST, SEAFISH Shellfish and bivalve markets in the UK Sources: CEFAS 2015, MMO UK And Foreign Vessels Landings By UK Port And UK Vessel Landings Abroad Underlying Dataset March 2017: 2014, 2015, 2016 And 2017 (Year To Date) Published 26 May’17, HMRC via BTS 2016, The NPD Group/CREST® YE June '17, Tecnmonic Menu Monitor Q1 2017, NPD Group Food Service UK, State of the Nation Presentation YE December 2016, Nielsen ScanTrack & HomeScan MAT 09.09.17, Nielsen State of the Nation
Transcript of Shellfish and bivalve markets in the UK - seafish.org · Clam – In XO sauce with lily bulb and...

JULIA BROOKS, MARKET INSIGHT ANALYST, SEAFISH
Shellfish and bivalve markets in the UK
Sources: CEFAS 2015, MMO UK And Foreign Vessels Landings By UK Port And UK Vessel Landings Abroad Underlying Dataset March 2017: 2014, 2015, 2016 And 2017 (Year To Date) Published 26 May’17, HMRC via BTS 2016, The NPD Group/CREST® YE June '17, Tecnmonic Menu Monitor Q1 2017, NPD Group Food Service UK, State of the Nation Presentation YE December 2016, Nielsen ScanTrack & HomeScan MAT 09.09.17, Nielsen State of the Nation

Aquaculture Landings Imports
Commercial Foodservice
Retail Exports
Consumers
Opportunities

Aquaculture* Shellfish: 24,157t (+12%), £37m (+5%), £1.55/kg (-6%)
Sea mussels 79.7% Sea mussels
67.9%
Common edible cockle 12.6% Common edible
cockle 20.3%
Pacific cupped oyster 7.5% Pacific cupped oyster 11.2%
0%
10%
20%
30%
40%
50%
60%
70%
80%
90%
100%
24,157t £37mSea mussels £1.32/kg Common edible cockle £2.50/kg
Pacific cupped oyster £2.30/kg European flat oyster £6.27/kg
Japanese carpet shell (=Manila clam) £3.50/kg Great Atlantic scallop £15.69/kg
Northern quahog (=Hard clam) £3.50/kg Queen scallop £2.75/kg
All others 0.2% All others 0.6%
Sources: *CEFAS 2015

UK Vessel Landings into UK* Shellfish: 134,346t (+2%), £307m (+21%), £2.29/kg (+19%)
Sources:2016 MMO UK And Foreign Vessels Landings By UK Port And UK Vessel Landings Abroad Underlying Dataset March 2017: 2014, 2015, 2016 And
2017 (Year To Date) Published 26 May’17 *Live Weight
Crusteacean 49%
Crusteacean 62%
Bivalve 45%
Bivalve 29%
Other 6% Other 9%
0%
10%
20%
30%
40%
50%
60%
70%
80%
90%
100%
134,346t (+2%) £307m (+21%)
Crusteacean £2.89/kg Bivalve £1.49/kg
Other £3.27/kg
Scallops 53%
Scallops 71%
Whelks 36%
Whelks 25%
Cockles 8%
Cockles 4%
0%
10%
20%
30%
40%
50%
60%
70%
80%
90%
100%
59,992t (-8%) £89m (+11%)
Scallops £2.01/kg Whelks £1.01/kg
Cockles £0.71/kg Mussels £0.13/kg
Oysters £3.14/kg
All others 3% All others 0.4%
Bivalve

Imports* Shellfish: 102,825t (+9%), £793m (+11%), £7.71/kg (+2%)
Sources: HMRC via BTS 2016 *Includes landings by foreign vessels into UK
Bivalve: 10,422t (+27%), £61.9m (+34%), £5.94/kg (+6%)
1,463t (2%)

Aquaculture
24,157t / 10% £37m / 3%
Landings
134,346t / 51% £307m / 27%
Imports
102,825t / 39% £793m / 70%
Commercial Foodservice
Retail Exports
Consumers
Opportunities
261,328t (+5%), £1,137m (+13%)

15.6 20.7
15.6
23.3 10.9
13.4 9.7
8.1 16.8 1.1
30.9 33.2
0.5 0.2
% Total SeafoodServings (+4.1%)
% Total ShellfishServings (+1.4%)
All Others
Quick ServiceRestaurants (excl F&C)
Fish & Chips
Workplace/educationCanteens
Travel & Leisure
Full Service Restaurants
Pubs
Source: The NPD Group/CREST® YE June '17
3.2
%
3.3
%
2.2
%
1.3
%
0.7
%
1.2
%
0.0
%
% Visits Including Shellfish
Commercial Foodservice Shellfish: 208m servings (+1.4%)

516
139
417 (-19%)
120 (-14%)
Menu Incidence Operators Menuing
Q1 2016 Q1 2017
Contemporary CDR
12%
Fast Casual
1%
Fine Dining 43%
Midscale 1%
Pub Groups
8%
Quick Service
0%
Traditional CDR 23%
Upscale CDR 12%
Commercial Foodservice Menus Bivalve: 417 listings (-19%)
Source: Tecnmonic Menu Monitor Q1 2017. Base: Menu Items Across 254 Restaurant Operators in the UK. Key: CDR = Casual Dining Restaurant

San Carlo: King Scallop
Horseback – Wrapped in
bacon and served on a bed
of wild rice. £9.95
Simon Radley: Helford
Oysters – Poached and
fried. Yuzu curd and Hass
avocado
The Florentine: Josper
Roasted Mussels – Fresh
lemon, parsley, and skinny
fries. £10.95
akkasan: Wok-Fried Razor
Clam – In XO sauce with lily
bulb and bamboo shoot,
available on the Only At
Hanway Menu, locally
sourced ingredients are
subject to availability.
£28.80
Dean Street Townhouse:
Cod – Pumpkin, cockles
and pickled walnut. £24.00
Bentley’s Oyster Bar &
Grill: Seashore Sharing
Platter – Oysters, mussels,
cockles, whelks, Clams,
Crevettes. £45.00
Source: Tecnmonic Menu Monitor Q1 2017. Base: Menu Items Across 254 Restaurant Operators in the UK
Commercial Foodservice Menus In 2017 bivalves are increasingly being used in Asian noodle mains.
Both rich and fresh flavours are growing among dishes.
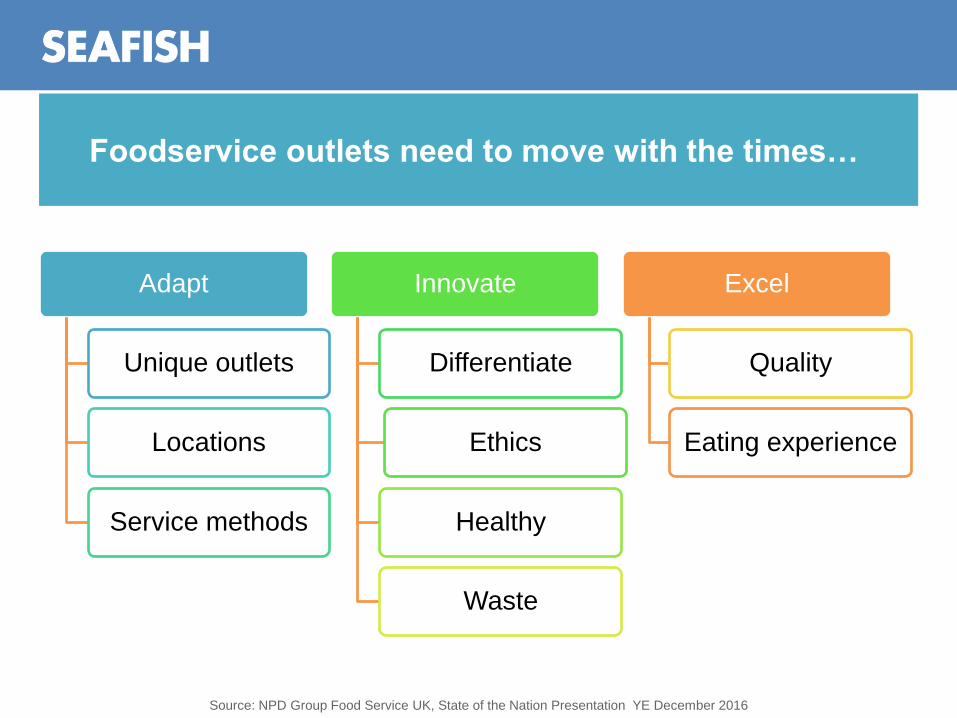
Adapt
Unique outlets
Locations
Service methods
Innovate
Differentiate
Ethics
Healthy
Waste
Excel
Quality
Eating experience
Source: NPD Group Food Service UK, State of the Nation Presentation YE December 2016
Foodservice outlets need to move with the times…

Retail Shellfish: 176m units (+2%)
Total Seafood £3.2bn (+3%)
322,348t (-2%) £9.97/kg (+5%)
1.2bn units (-2%) £2.74/unit (+5%)
Shellfish £538m (+1%)
39,453t (+2%) £13.65/kg (-0.4%)
176m units (+2%) £3.07/unit (-0.04%)
62.4
(+0.7%)
£2.75
(-0.2%)
8.8
(+0.4%)
11.4kg
(+0.4%)
SHELLFISH
96.9
(+0.2%)
30.8
(-0.4%)
15.1kg
(-2.5%)
Penetration
Frequency
AWoP
Volume
£ per
Unit
£2.49
(+4.5%)
TOTAL
Source: Nielsen ScanTrack & HomeScan MAT 09.09.17

Mussels (+10%)
48% Scallops (-7%) 34%
Cockles (+1%) 12%
Clams (+98%)
3%
Oysters (-20%)
3%
Winkles (-69%)
0%
Bivalve £47m (+3%)
5,137t (+6%) £9.2/kg (-2.8%)
18m units (+3%) £2.59/unit (+0.01%)
£47m
(+3%)
17.4
(+2.3%)
£2.26
(+5.1%)
3.7
(+0.9%)
4.5kg
(-0.1%)
Penetration
Frequency
AWoP
Volume
£ per
Unit
Retail Bivalve: 18m units (+3%)
Source: Nielsen ScanTrack & HomeScan MAT 09.09.17

Retail What’s in store …

Retail What’s in store …

Retail What’s in store …
Retail What’s in store …

Retail What’s in store …

Seeking
Good value
Promotions
Range
Convenience
Positive in-store experience
Influencers
Economic change
Informed decision making
Omni channel
Disparate lifestages
Time pressures
Source: Nielsen State of the Nation (Homescan Survey (GB), Nielsen Shopper Trends January 2017)
Retailers need to keep ahead of changing demands of
shoppers…

Seafood 62.6%, 60.1%
Shellfish 68.4%, 58.4%
Seafood 58.0%, 87.1%
Shellfish 60.0%, 88.1%
55
60
65
70
75
80
85
90
95
57 58 59 60 61 62 63 64 65 66 67 68 69
% S
ale
s V
alu
e £
/Se
rvin
gs
Ag
ed
Ove
r 3
5
% Sales Value £/Servings Social Class ABC1
Retail
Foodservice
Source: Nielsen HomeScan MAT 12.08.17, The NPD Group/Crest® YE June '17
Consumers

Consumer Motivations
Traditional Favourite
Premium Treat
Food Theatre / Interaction
Confidence in Prepared Options
Healthy Finger Food
New Exotic Flavours
Consumer Barriers
Old Fashioned
Lack of Recipe Inspiration
Expensive Indulgence
Wasteful
Intimidating
Appearance / Messy / Smelly
Quality Misconceptions / Preparation Concerns
Time Consuming

Netherlands
5,909t (-11%)
Italy
3,272t (-5%)
I.Republic
1,036t
(+93%)
Spain
2,345t
(-10%)
Exports** Shellfish: 71,580t (+11%), £472.5m (+27%), £6.60/kg (+15%)
Source: HMRC via BTS 2016, ** Includes landings by UK vessels abroad
Bivalve: 22,931t (+8%), £145.8m (+27%), £6.36/kg (+18%)
Scallops
12,898t (+10%)
Clams.
cockles &
arkshells
4,686t (+55%) Mussels
3,607t
(-31%)
Oysters
1,740t
(+34%)
16,392t (-7%)

Aquaculture
24,157t / 10% £37m / 3%
Landings 134,346t / 51% £307m / 27%
Imports
102,825t / 39% £793m / 70%
Commercial Foodservice 208m servings
(+1%)
Retail 176m units (+2%)
39,453t (+2%)
Exports 71,580t (+11%)
Opportunities
261,328t (+5%), £1,137m (+13%)
111,033t (+7%) 384 items (+1%)

Foodservice
Quick service restaurants
Food on the move
Innovative options
Retail
Molluscs innovation
Convenience
Savvy shopper
Consumer
Younger
More affordable
Convenience
Exports
Target key markets
• New recipes & flavours
• Recreate favourites with twist Inspire
• Meal occasions e.g. snacking, sharing
• Cater for different budgets Range
Development
• Minimise mess, smell, time, waste
• Alternative packaging options Convenience
• Value for money
• Health and quality credentials Assurance
Opportunities

Defra 2040 Market Insight
6 - 13 October 2017