shell_energy_scenarios_2050.pdf
52
1 Shell energy scenarios to 2050
-
Upload
mohamed-mo-galal-hassan-ghariba -
Category
Documents
-
view
213 -
download
0
Transcript of shell_energy_scenarios_2050.pdf

8/14/2019 shell_energy_scenarios_2050.pdf
http://slidepdf.com/reader/full/shellenergyscenarios2050pdf 1/52
1
Shell energy scenariosto 2050

8/14/2019 shell_energy_scenarios_2050.pdf
http://slidepdf.com/reader/full/shellenergyscenarios2050pdf 2/52
8/14/2019 shell_energy_scenarios_2050.pdf
http://slidepdf.com/reader/full/shellenergyscenarios2050pdf 3/52
Shell energy scenariosto 2050
1

8/14/2019 shell_energy_scenarios_2050.pdf
http://slidepdf.com/reader/full/shellenergyscenarios2050pdf 4/52
Acknowledgements
Our thanks go to Shell colleagues and
the many external experts who have
contributed to the development of these
Shell energy scenarios.
Other Shell scenario material can be found
at www.shell.com/scenarios
The publications “Shell Global Scenarios
to 2025”and “Signposts” are available
through this website.
Designed by Peter Grundy
© 2008 Shell International BV
All rights reserved. No part of this publication may be reproduced, stored in a retrieval system, published or
transmitted, in any form or by any means, without the prior written permission of Shell International BV.

8/14/2019 shell_energy_scenarios_2050.pdf
http://slidepdf.com/reader/full/shellenergyscenarios2050pdf 5/52
Introduction?
Contents
4Foreword
6
4 40Scenario comparisons
3 24Energy scenario
Blueprints
2 12Energy scenario
Scramble
An era of revolutionary transitions1 8
3
8/14/2019 shell_energy_scenarios_2050.pdf
http://slidepdf.com/reader/full/shellenergyscenarios2050pdf 6/52
Never before has humanity faced such a challenging outlook for
energy and the planet. This can be summed up in five words:
“more energy, less carbon dioxide”.
To help think about the future of energy, we have developed two scenarios that
describe alternative ways it may develop. In the first scenario – called Scramble –
policymakers pay little attention to more efficient energy use until supplies are tight.
Likewise, greenhouse gas emissions are not seriously addressed until there are major
climate shocks. In the second scenario – Blueprints – growing local actions begin to
address the challenges of economic development, energy security and environmental
pollution. A price is applied to a critical mass of emissions giving a huge stimulus to
the development of clean energy technologies, such as carbon dioxide capture and
storage, and energy efficiency measures. The result is far lower carbon dioxide emissions.
We are determined to provide energy in responsible ways and serve our customers
and investors as effectively as we can. Both these scenarios help us do that by testing
our strategy against a range of possible developments over the long-term. However,
in our view, the Blueprints’ outcomes offer the best hope for a sustainable future,
whether or not they arise exactly in the way we describe. I am convinced they arepossible with the right combination of policy, technology and commitment from gov-
ernments, industry and society globally. But achieving them will not be easy, and time
is short. We urgently need clear thinking, huge investment, and effective leadership.
Whatever your role in this, I hope these scenarios will help you understand better the
choices you face.
Jeroen van der Veer.
Chief Executive
Royal Dutch Shell plc
Foreword
4
8/14/2019 shell_energy_scenarios_2050.pdf
http://slidepdf.com/reader/full/shellenergyscenarios2050pdf 7/52
S E C U
R I T Y
CARBO
ENERG
RESOUR T E C H N OL O GY

8/14/2019 shell_energy_scenarios_2050.pdf
http://slidepdf.com/reader/full/shellenergyscenarios2050pdf 8/52
How can I prepare for, or
even shape, the dramatic
developments in the globalenergy system that will
emerge in the coming years?
This question should be on the mind of
every responsible leader in government,
business and civil society. It should be
a concern of every citizen.
The global energy system sits at the
nexus of some of the deepest dilemmas
of our times: the development dilemma
– prosperity versus poverty; the trust
dilemma – globalisation versus security;
and the industrialisation dilemma –
growth versus the environment. Therehave always been tensions in the
global energy system, but it is evident
today that the strains are becoming
more acute.
In the 1990s Shell scenarios
introduced us to TINA – There Is No
A lternative. The entrenched forces of
Introduction
market liberalisation, globalisation,
and technology had created a global
economic engine that was alreadybeginning to engage vast populations
in Asia. Shell scenarios in the 1990s
helped people examine and explore
different faces of TINA. Then, in 2005,
we published scenarios that explored
the geopolitical crises of security
and trust that accompany TINA, as
foreshadowed in the events of 9/11
and the Enron scandal. Now, as
noted in our recent Signposts booklet,
significant fault lines are developing in
the mindsets and behaviour of major
energy producing and consuming
nations. These intensify the stresses
that population growth and economicdevelopment are placing on energy
supply, energy demand and the
environment. All in all, we are entering
turbulent times for the energy system.
So how might the tensions and
contradictions in the system work out?
Well, now is the time to introduce
?
6

8/14/2019 shell_energy_scenarios_2050.pdf
http://slidepdf.com/reader/full/shellenergyscenarios2050pdf 9/52
TINA’s natural offspring, TANIA – There
A re No Ideal A nswers.
There is a great deal of inertia in
the modern energy system, given
its vast complexity and scale. The
often lengthy timescales required for
planning and constructing new energy
infrastructure mean that strains within
the system cannot be resolved easily
or quickly, if at all. It will be several
years before major changes become
apparent. But below the surface,
the pieces are already shifting. The
question is, how to recognise and
grapple with these changes.
Scenarios are a tool to help identifysuch shifts, and consider the plausible
interactions between different
perspectives and possibilities. They
help people to prepare for, shape,
and even thrive in the reality that
eventually unfolds. This text describes
two alternative scenarios, Scramble
and Blueprints, for the development
There A reNo
Ideal A nswers
of the energy system over the next
fifty years.
These are both challenging outlooks.
Neither are ideal worlds, yet both
are feasible. They describe an era
of transformation. Everyone knows
that the energy system a century from
now will be very different from that
of today. But how will the transitions
emerge over the next few decades?
These scenarios bring out the impact
of critical differences in the pace and
shape of political, regulatory and
technological change.
I trust you will find them stimulating
and instructive. But more thananything, I hope they will help
you prepare for, and shape,
your responsible participation in a
sustainable energy future.
Jeremy B. Bentham
Global Business Environment
Shell International B.V.
7

8/14/2019 shell_energy_scenarios_2050.pdf
http://slidepdf.com/reader/full/shellenergyscenarios2050pdf 10/52
Developing nations, including population giants China and India, are enteringtheir most energy-intensive phase of economic growth as they industrialise, build
infrastructure, and increase their use of transportation. Demand pressures will
stimulate alternative supply and more efficiency in energy use — but these alone
may not be enough to offset growing demand tensions completely. Disappointing
the aspirations of millions by adopting policies that may slow economic growth
is not an answer either — or not one that is politically feasible.
The world can no longer
avoid three hard truths about
energy supply and demand.
An era of
revolutionarytransitions
1
1: Step-change in energy use
By 2015, growth in the production of easily accessible oil and gas will not match
the projected rate of demand growth. While abundant coal exists in many parts
of the world, transportation difficulties and environmental degradation ultimately
pose limits to its growth. Meanwhile, alternative energy sources such as biofuels
may become a much more significant part of the energy mix — but there is no
“silver bullet” that will completely resolve supply-demand tensions.
2: Supply will struggle to keep pace
Even if it were possible for fossil fuels to maintain their current share of the
energy mix and respond to increased demand, CO2 emissions would then be
on a pathway that could severely threaten human well-being. Even with the
moderation of fossil fuel use and effective CO2 management, the path forward is
still highly challenging. Remaining within desirable levels of CO2 concentration
in the atmosphere will become increasingly difficult.
3: Environmental stresses are increasing
8

8/14/2019 shell_energy_scenarios_2050.pdf
http://slidepdf.com/reader/full/shellenergyscenarios2050pdf 11/52
World population1
Climbing the energy ladder
0
100
200
300
400
0 10 20 30 40
GDP per capita (PPP, '000 2000 USD)
USA
Europe EU 15
Japan
South Korea
China
India
GJ per capita (primary energy)
World population has more than doubled since 1950 and is set
to increase by 40% by 2050. History has shown that as people
become richer they use more energy. Population and GDP will grow
strongly in non-OECD countries and China and India are just starting
their journey on the energy ladder.
Data shown 1970-2005
1950
1975
2000
2025
2050
Y e ar
1 billion people
OECD
Non OECD
Note 1: All data sources for charts and a glossary of abbreviations can be found on pages 44 and 45
1950
1975
2000
2025
2050
1 billion people
OECD
Non OECD
USA
Europe EU 15
Japan
South Korea
China
India
400
300
200
100
0
403020100
gigajoule (GJ) per capita (primary energy)
GDP per capita (PPP, 000 2000 USD)
‘
9

8/14/2019 shell_energy_scenarios_2050.pdf
http://slidepdf.com/reader/full/shellenergyscenarios2050pdf 12/52
When all three of the most powerful drivers of our current energy world —
demand, supply, and effects on the environment — are set to undergo significant
change, we are facing an era of revolutionary transitions and considerable
turbulence. And while prices and technology will drive some of these transitions,
political and social choices will be critical. Those choices also depend on how
alert we are to the transitions as they happen, especially because for a decade
or so we may be distracted by what appears to be healthy development. But
underneath this “business-as-usual” world, the transitions are already beginning:
governments and companies are positioning for longer-term alternatives;regulatory frameworks are being debated; as there will be no silver bullets,
new technology combinations are under development such as intermittent
renewable sources being integrated into existing power supply systems; and new
infrastructures, such as carbon dioxide capture and storage (CCS), are required
and older inefficient ones need to be decommissioned.
People are beginning to realise that energy use can both nourish and threaten
what they value most — their health, their community and their environment, the
future of their children, and the planet itself. These deeply personal hopes and
fears can intensify and interact in ways that have different collective outcomes,
and usher in the new energy era in very different ways.
Given that profound change is inevitable, how will it happen? Will nationalgovernments simply Scramble to secure their own energy supplies? Or will
new Blueprints emerge from coalitions between various levels of societies and
government, ranging from the local to the international, that begin to add up to
a new energy framework?
Two possible worlds
Preparing for the future
10

8/14/2019 shell_energy_scenarios_2050.pdf
http://slidepdf.com/reader/full/shellenergyscenarios2050pdf 13/52
SCRAMBLE
B L U E P R I N
T S

8/14/2019 shell_energy_scenarios_2050.pdf
http://slidepdf.com/reader/full/shellenergyscenarios2050pdf 14/52
8/14/2019 shell_energy_scenarios_2050.pdf
http://slidepdf.com/reader/full/shellenergyscenarios2050pdf 15/52
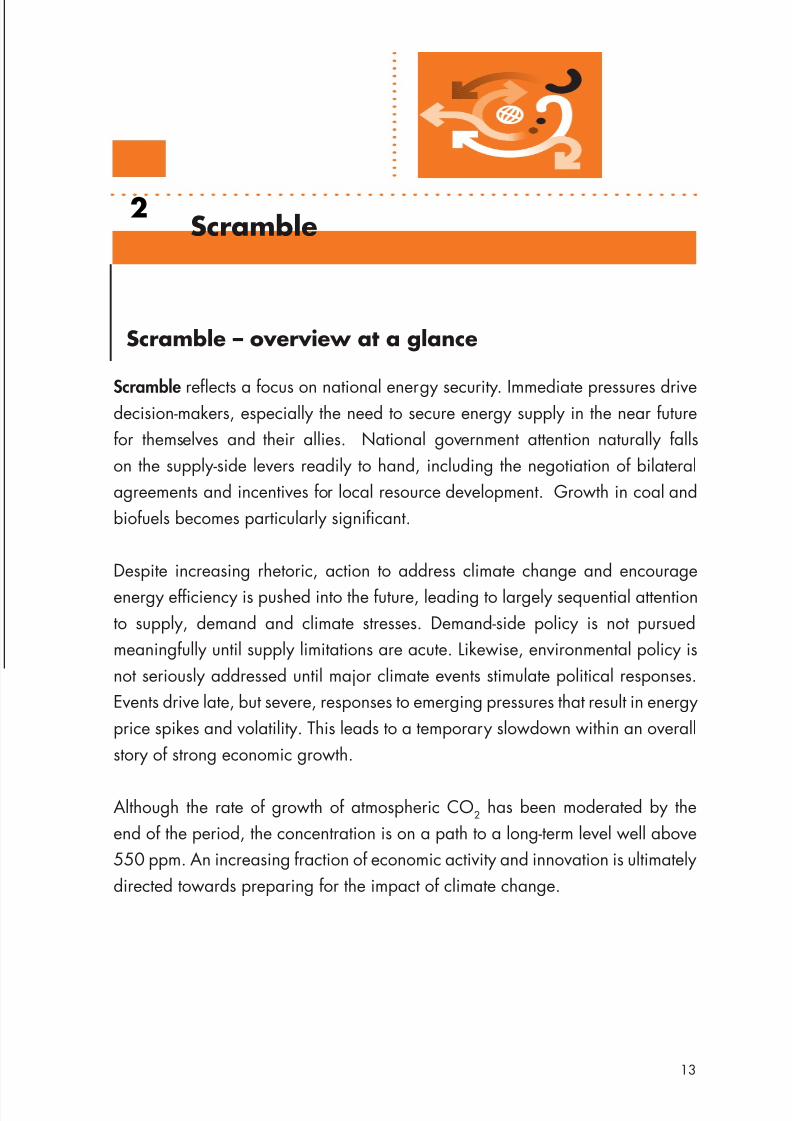
Scramble reflects a focus on national energy security. Immediate pressures drivedecision-makers, especially the need to secure energy supply in the near future
for themselves and their allies. National government attention naturally falls
on the supply-side levers readily to hand, including the negotiation of bilateral
agreements and incentives for local resource development. Growth in coal and
biofuels becomes particularly significant.
Despite increasing rhetoric, action to address climate change and encourage
energy efficiency is pushed into the future, leading to largely sequential attention
to supply, demand and climate stresses. Demand-side policy is not pursued
meaningfully until supply limitations are acute. Likewise, environmental policy is
not seriously addressed until major climate events stimulate political responses.
Events drive late, but severe, responses to emerging pressures that result in energy
price spikes and volatility. This leads to a temporary slowdown within an overall
story of strong economic growth.
Although the rate of growth of atmospheric CO2 has been moderated by the
end of the period, the concentration is on a path to a long-term level well above
550 ppm. An increasing fraction of economic activity and innovation is ultimately
directed towards preparing for the impact of climate change.
Scramble2
Scramble – overview at a glance
13

8/14/2019 shell_energy_scenarios_2050.pdf
http://slidepdf.com/reader/full/shellenergyscenarios2050pdf 16/52
National governments, the principal actors in Scramble, focus their energypolicies on supply levers because curbing the growth of energy demand – and
hence economic growth – is simply too unpopular for politicians to undertake.
A lack of international cooperation means that individual countries are unwilling
to act unilaterally in a way that will damage their own economic growth. The
result is a relatively uncoordinated range of national mandates and incentives
for developing indigenous energy supplies where available, including coal,
heavy oils, biofuels, and other renewables, which leads to a patchwork of local
standards and technologies.
At the international level, Scramble is a world of bilateral government deals
between energy producers and energy consumers, with national governments
competing with each other for favourable terms of supply or for access by
their energy companies. There is a strong element of rivalry between consumer
governments, but they align with each other where their interests coincide. In this
world, national energy companies play key intermediary roles, but themselvesbecome increasingly mired in political machinations. Globalisation exacerbates
the tensions within and between nations, and distracts policymakers from the
need to take action and build international coalitions to face the energy and
climate change challenges.
Although business cycle variations continue, energy prices are generally strong.
This is not only because of the intrinsic pressures on supply but also because
OPEC has learned from the price increases since 2004 that the world can absorb
2.1 Fear and security
The unfolding story
14

8/14/2019 shell_energy_scenarios_2050.pdf
http://slidepdf.com/reader/full/shellenergyscenarios2050pdf 17/52
higher energy prices relatively easily. In the economic interests of its members,
therefore, OPEC manages oil supply to minimise any incipient price weakness.
With strong prices and lagging supply, “favourable terms” for importing nations
increasingly means just some assurance of uninterrupted supply.
In Scramble, major resource holders are increasingly the rule makers rather than
the rule takers. They use their growing prominence in the world to influence
international policies, particularly when it comes to matters they insist are internal
such as human rights and democratic governance. Nations who have hammered
out “favourable” deals with oil-producing nations do not want to rock the energy
boat they have just managed to board, resulting in a world in which internationalrelations are mainly a race to ensure continuing prosperity, not the building of a
more sustainable international community.
There are enormous disparities in the economic and energy performance of
different countries. Developing nations scramble to procure the energy necessary
to climb the economic ladder, while wealthy nations struggle to adapt their energy
consumption patterns to maintain their existing lifestyles. Yet, the scramble for
energy at the national level is constantly hampered by the unavoidable reality
that countries are interdependent. Complex economic and political ties as well as
shared transmission structure means that ensuring energy security for one nation
requires some cooperation with others. The problems that inevitably arise are
dealt with slowly and inefficiently because of the lack of relevant international
frameworks and the weakness of multilateral institutions.
With growing stresses in the energy system, news media regularly start to reportenergy-related crises in one part of the world or another. Ruling regimes under
stress in societies that are changing fast easily lose legitimacy in the eyes of
their people, and there is dramatic political change in several countries. In
a few cases, this is even sparked by misjudged attempts to moderate energy
demand through the knee-jerk removal of subsidies. Nevertheless, in spite of the
turbulence, the majority of people experience strong material progress during
these early years. Overall global economic development continues unabated for
the first quarter of the century — in large part because of coal.
15

8/14/2019 shell_energy_scenarios_2050.pdf
http://slidepdf.com/reader/full/shellenergyscenarios2050pdf 18/52
2.2 Flight into coal
In the face of growing energy concerns, political and market forces favour the
development of coal as a widely available, low-cost energy option. Partly in
response to public pressures for “energy independence,” and partly because
coal provides a local source of employment, government policies in several of
the largest economies encourage this indigenous resource. Between 2000 and
2025, the global coal industry doubles in size, and by 2050 it is two and a half
times at large.
But coal has its own problems, which environmental pressure groups do nothesitate to point out. In the U.S. and other high-income countries, the building of
each new coal plant creates a battleground of protest and resistance. In China,
local environmental degradation provokes pockets of unrest. And the Chinese
railway infrastructure struggles to transport large quantities of coal across the
country – necessitating significant and costly improvements to the country’s
railway infrastructure, as well as coal imports from Australia, Indonesia and
elsewhere. Perceived changes in world climate are attributed to the growing
coal industry in China and the U.S. Despite widespread protests against coal,
governments – fearful of the potential damage to economic growth – are slow
to establish meaningful greenhouse gas management schemes through carbon
taxation, carbon trading and efficiency mandates.
In an attempt to moderate the demand for coal for power generation, several
countries conclude that nuclear energy must also grow significantly. In contrast to
coal, however, nuclear is one of the more difficult energy sources to expand quicklyon a global scale. Building capacity for uranium mining and nuclear power station
construction takes time. Add to that the difficulty of disposing of nuclear waste.
Even in those countries where nuclear facilities are privately owned and managed,
significant government support is necessary before companies will take the enormous,
long-term financial risk of building new plants. In addition, the relative reluctance to
share nuclear technology with non-friendly states, for fear of contributing to nuclear
weapons proliferation, means that the contribution of nuclear power to the energy
mix in Scramble is much less than its potential might have promised.
16

8/14/2019 shell_energy_scenarios_2050.pdf
http://slidepdf.com/reader/full/shellenergyscenarios2050pdf 19/52
Final energy consumption by region
First coal, then biofuels followed by renewable energy, are
sequential supply responses to the increasing energy demand.
But no single or easy solution to the energy challenge exists.
Government driven efficiency measures are introduced when
stresses become too high for the market to cope with.
Primary energy by source
Biomass includes traditional renewables such as wood, dung, etc.
Sub-Saharan Africa
Middle East & N. Africa
Latin America
Asia & Oceania - Developing
Asia & Oceania - Developed
North America
Europe
Other Renewables
Biomass
Nuclear
Coal
Gas
Oil
600
400
200
0
205020402030202020102000
205020402030202020102000
1000
800
600
400
200
0
exajoule (EJ) per year
EJ per year
17

8/14/2019 shell_energy_scenarios_2050.pdf
http://slidepdf.com/reader/full/shellenergyscenarios2050pdf 20/52
2.3 The next green revolution
Large agricultural lobbies are already powerful in developed nations, anda huge push for biofuels develops early in this scenario. This helps meet the
rapid growth in demand for liquid transport fuels, but also leads to unintended
consequences. First-generation biofuels compete with food production, driving
up world market prices, especially in those countries that use maize as a staple.
And regions with insufficient production potential, such as the EU, import the
shortfall and so indirectly encourage poorer nations to destroy large sections of
rainforests and habitats in order to grow palm oil and sugar cane. The result of
these land use changes is that significant quantities of CO2 stored in the soils are
also released.
The reaction to these unintended consequences plays its part in helping to
establish second-generation biofuels by 2020 – those that use the woody parts
of plants, including waste products such as stalks and leaves from plants grown
for food production. Certification systems also emerge to promote sustainability
of both first- and second-generation biofuels. A key advantage of second-generation biofuels is that energy yields are a lot higher, particularly outside the
tropical regions. Most OECD countries, being in temperate regions, encourage
and eagerly embrace economic routes to second-generation biofuels.
18

8/14/2019 shell_energy_scenarios_2050.pdf
http://slidepdf.com/reader/full/shellenergyscenarios2050pdf 21/52
0
50
100
150
200
2000 2025 2050
EJ per year
Electricity
Biofuels
Gaseous hydrocarbon fuels
Liquid fuels fossil-derived
Final energy consumption for transport
Biomass represents around 15% of primary energy by 2050.
Biofuels become a significant part of this, in particular helping
to diversify the supply of transport fuel. But with accelerating
demand, fossil fuels remain an important part of the energy mix.
Final energy consumption of biomass
Biofuels - 2nd generation
Biofuels - 1st generation
Electricity
Traditional
2020
100
50
020102000 2030 2040 2050
EJ per year
EJ per year
Electricity
Biofuels
Gaseous hydrocarbon fuels
Liquid fuel fossil-derived
200
150
100
50
0
2000 2025 2050
Traditional biomass includes wood, dung, etc.
19
8/14/2019 shell_energy_scenarios_2050.pdf
http://slidepdf.com/reader/full/shellenergyscenarios2050pdf 22/52
2.4 Solutions are rarely without drawbacks
How unconventional oil from oil sands, shale, and coal is developed provides a
typical Scramble example of solutions being introduced with immediate benefits
to energy security but some later negative consequences. Throughout the 2010s,
investors pour more and more capital into unconventional oil projects that make
an important contribution to addressing supply pressures. Nevertheless, these
attract increasing opposition from powerful water and climate lobbies that
oppose the environmental footprint of additional developments. This ultimately
provokes a political backlash that challenges even the best-managed projects.
As supply-side actions eventually prove insufficient or unpopular in addressing
growing demand pressures, governments finally take steps to moderate energy
demand. But because pressures have already built up to a critical level, their
actions are often ill-considered, politically-driven knee-jerk responses to local
pressures, with unintended consequences. For example, the sudden imposition of
strict energy efficiency standards for new construction delays new developments
while builders and civil servants adapt to the legislation. In some instances this
actually slows the trend in overall efficiency improvements.
In Scramble, a typical three-step pattern begins to emerge: first, nations deal with
signs of tightening supply by a flight into coal and heavier hydrocarbons and
biofuels; then, when the growth in coal, oil and gas can no longer be maintained, an
overall supply crisis occurs; and finally, governments react with draconian measures
— such as steep and sudden domestic price rises or severe restrictions on personal
mobility with accompanying disruptions in value chains and significant economicdislocations. By 2020, the repetition of this volatile three-step pattern in many areas
of the energy economy results in a temporary global economic slowdown.
20
8/14/2019 shell_energy_scenarios_2050.pdf
http://slidepdf.com/reader/full/shellenergyscenarios2050pdf 23/52
2.5 The bumpy road to climate change
The focus on maintaining economic growth, especially in emerging economies,
leaves the climate change agenda largely disregarded. Despite increasing protests
by campaigners, alarm fatigue afflicts the general public. International discussion
on climate change becomes bogged down in an ideological “dialogue of the
deaf” between the conflicting positions of rich, industrialised countries versus
poorer, developing nations – a paralysis that allows emissions of atmospheric CO2
to grow relentlessly.
The emerging economic pressures of energy supply and demand tensions makeit even more difficult for politicians to act until they are forced to, despite their
ongoing rhetoric of concern. Addressing climate change is perceived as an
additional economic pressure and, given the type of response required, nobody
is prepared to risk being the first to act.
Meanwhile, political pressures become intense in those developing countries
where rising aspirations are suddenly disappointed. International relationships
come under strain as well. Russia’s internal use of its oil stifles expected growth
in Eastern Europe and the energy have-nots, such as low-income African nations,
struggle for access.
Eventually, this lack of action creates fertile conditions for politically opportunistic
blame for extreme weather events and supply crunches — and triggers knee-jerk,
politically-driven responses. These are not only late, but often too small to make a
difference on the demand side. In some cases they are disruptively over-reactiveas when a number of nations enact moratoria on the development of certain
high-carbon energy sources.
21

8/14/2019 shell_energy_scenarios_2050.pdf
http://slidepdf.com/reader/full/shellenergyscenarios2050pdf 24/52
2.6 Necessity – the mother of invention
Although change must and does occur, the turnaround takes a decade becauselarge-scale transformations of the energy system are required. High domestic
prices and exceptionally demanding standards imposed by governments
provoke significant advances in energy efficiency. Eventually, locally developed
alternative supplies -- biofuels, wind, and thermal solar -- also contribute on a
much greater scale than before. By 2030, healthy economic growth is restored,
with particular vibrancy in the new energy sector that has received a massive
stimulus to innovation through this difficult period.
The declining share of hydrocarbon fuels in the overall energy mix, the growing
contribution from alternative energy sources, and greater energy efficiency
all moderate the rate of growth of CO2in the atmosphere. But the subsequent
restoration of economic growth means that vigorous energy consumption resumes
with its accompanying rebound in CO2 emissions – and concentrations are already
high. A consensus develops around the need for a new international approach
to energy security and climate change mitigation – but the world is twenty yearsbehind where it would have been had it set up such a system by 2015. Economic
growth continues to deliver increasing prosperity to many, but market responses
to greenhouse gas challenges have been delayed by the absence of regulatory
certainty or international agreements. An increasing fraction of economic activity
and innovation is ultimately directed towards preparing for the impact of climate
change. Having avoided some hard choices early on, nations now recognise
they are likely to face expensive consequences beyond 2050.
22
8/14/2019 shell_energy_scenarios_2050.pdf
http://slidepdf.com/reader/full/shellenergyscenarios2050pdf 25/52
0
5
10
15
0 1 2 3 4 5 6 7 8 9
Population (billion)
tonne CO2 per capita per year
RussiaNorth America
Asia & Oceania - DevelopedChinaEuropeMiddle East & N Africa
IndiaLatin America
Asia & Oceania - Developing
Sub-Saharan Africa
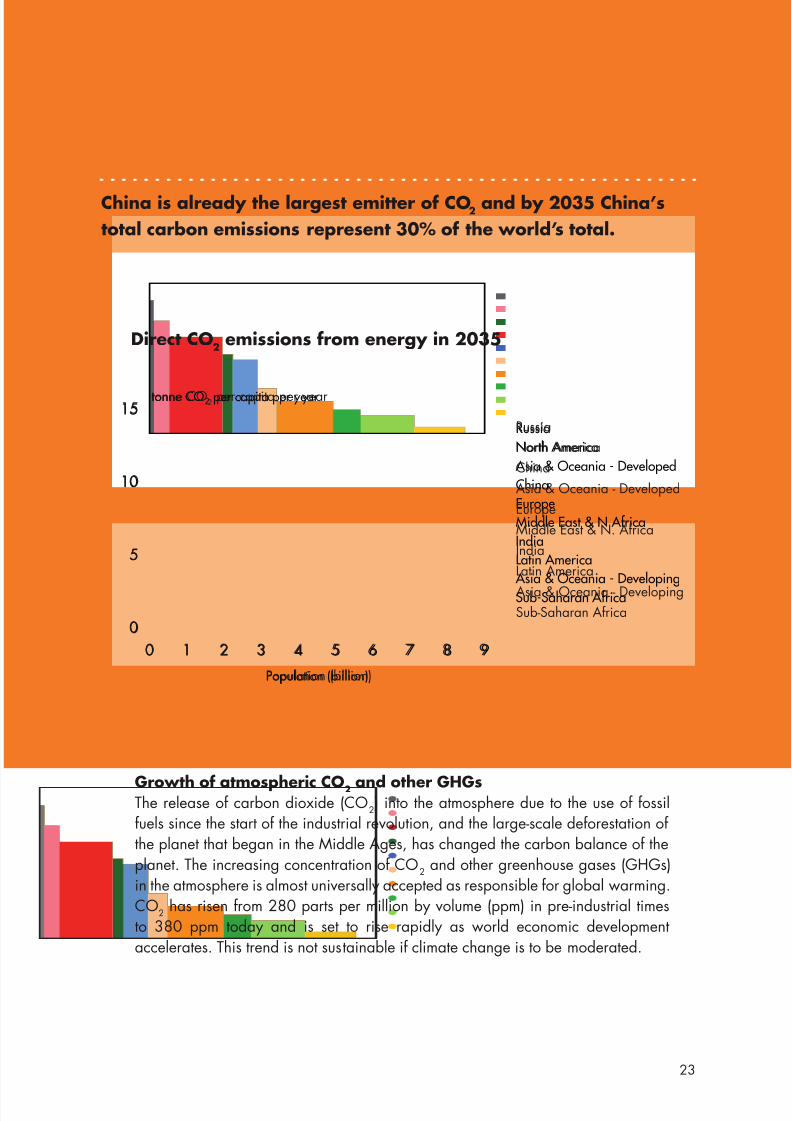
Direct CO2 emissions from energy in 2035
China is already the largest emitter of CO2 and by 2035 China’s
total carbon emissions represent 30% of the world’s total.
Growth of atmospheric CO2 and other GHGsThe release of carbon dioxide (CO
2) into the atmosphere due to the use of fossil
fuels since the start of the industrial revolution, and the large-scale deforestation ofthe planet that began in the Middle Ages, has changed the carbon balance of the
planet. The increasing concentration of CO2 and other greenhouse gases (GHGs)
in the atmosphere is almost universally accepted as responsible for global warming.CO
2 has risen from 280 parts per million by volume (ppm) in pre-industrial times
to 380 ppm today and is set to rise rapidly as world economic development
accelerates. This trend is not sustainable if climate change is to be moderated.
Russia
North America
China
Asia & Oceania - Developed
Europe
Middle East & N. Africa
India
Latin America
Asia & Oceania - DevelopingSub-Saharan Africa
tonne CO2 per capita per year
Population (billion)
0 1 2 3 4 5 6 7 8 9
15
10
5
0
23

8/14/2019 shell_energy_scenarios_2050.pdf
http://slidepdf.com/reader/full/shellenergyscenarios2050pdf 26/52

8/14/2019 shell_energy_scenarios_2050.pdf
http://slidepdf.com/reader/full/shellenergyscenarios2050pdf 27/52
Blueprints3
Blueprints – overview at a glance
Blueprints describes the dynamics behind new coalitions of interests. These donot necessarily reflect uniform objectives, but build on a combination of supply
concerns, environmental interests, and associated entrepreneurial opportunities.
It is a world where broader fears about life style and economic prospects forge
new alliances that promote action in both developed and developing nations.
This leads to the emergence of a critical mass of parallel responses to supply,
demand, and climate stresses, and hence the relative promptness of some of
those responses.
This is not driven by global altruism. Initiatives first take root locally as individual
cities or regions take the lead. These become progressively linked as national
governments are forced to harmonise resulting patchworks of measures and take
advantage of the opportunities afforded by these emerging political initiatives.
Indeed, even the prospect of a patchwork of different policies drives businesses
to lobby for regulatory clarity.
As a result, effective market-driven demand-side efficiency measures emerge
more quickly, and market-driven CO2 management practices spread. Carbon
trading markets become more efficient, and CO2 prices strengthen early. Energy
efficiency improvements and the emergence of mass-market electric vehicles are
accelerated. The rate of growth of atmospheric CO2 is constrained leading to a
more sustainable environmental pathway.
25
8/14/2019 shell_energy_scenarios_2050.pdf
http://slidepdf.com/reader/full/shellenergyscenarios2050pdf 28/52
3.1 Starting at the grassroots
While international bodies argue over what environmental policies should be andwhich policies are feasible, and many national governments worry about energy
security, new coalitions emerge to take action. Some bring together companies
from different industries with a common energy interest. Others involve coalitions
of cities or regions, which begin to take their destinies into their own hands and
create their own blueprints for their energy futures. Individuals effectively begin
to delegate responsibility for the complexities of the energy system to a broader
range of institutions besides national governments. Cash, votes, and legitimacy
reward the successful.
It is a slow process at first, two steps forward and one step back. There is almost
as much political opportunism as rational focus in early developments. Many
groups try to circumvent, undermine or exploit the new regulations and incentives
for alternative energy paths. In places, uncertain regulatory outlooks discourage
developments. But as successful ventures emerge, halting progress develops into
a larger and larger take-up of cleaner energy such as wind and solar.
As more consumers and investors realise that change is not necessarily painful but
can also be attractive, the fear of change is moderated and ever-more substantial
actions become politically possible. These actions, including taxes and incentives
in relation to energy and CO2 emissions, are taken early on. The result is that
although the world of Blueprints has its share of profound transitions and political
turbulence, global economic activity remains vigorous and shifts significantly
towards a less energy-intensive path.
The unfolding story
26

8/14/2019 shell_energy_scenarios_2050.pdf
http://slidepdf.com/reader/full/shellenergyscenarios2050pdf 29/52
In the early part of the 21st century, progressive cities across the globe share
good practices in efficient infrastructure development, congestion management
and integrated heat and power supply. A number of cities invest in green energy
as sources for their own needs and energy efficiency. At first, perceptions of
local crisis help to drive these changes, such as protests about falling air and
water quality. In an increasingly transparent world, high-profile local actors
soon influence the national stage. The success of individual initiatives boosts
the political credentials of mayors and regional authorities, creating incentives
for national and international leaders to follow suit. National and local efforts
begin to align with and amplify each other, and this progressively changes thecharacter of international debate.
Perceptions begin to shift about the dilemma that continued economic growth
contributes to climate change. Alongside the quest for economic betterment, air
quality and local environmental concerns – rather than climate change or green
entrepreneurship – initially impel action in countries such as China, India and
Indonesia. Gradually, however, people make the connection between irregular
local climate behaviour and the broader implications of climate change, including
the threats to water supplies and coastal regions. In addition, successful regions
in the developing world stimulate their local economy by attracting investments
in clean facilities made possible by the clean development provisions of the
international treaties that replace the Kyoto Protocol which expires in 2012.
These allow industrialised countries to invest in emission-reduction projects in
developing countries as an alternative to more costly projects at home.
The key enabler of these energy system blueprints is the introduction of a CO2
pricing mechanism using a carbon emissions trading scheme that begins in the
EU and is progressively adopted by other countries, including the U.S. and,
later, China. This trading regime gives a boost to new industries emerging
around clean alternative and renewable fuels, and carbon capture and storage.
In addition, carbon credits boost income – particularly for those investing in
renewable energy – and reduce investment uncertainties.
27

8/14/2019 shell_energy_scenarios_2050.pdf
http://slidepdf.com/reader/full/shellenergyscenarios2050pdf 30/52
3.2 Paths to alignment
This critical mass of participation in international frameworks does not stem
from an outbreak of global altruism. Instead, the new initiatives at the regional
and national levels create incentives for broader change, partly in response to
pressure from multinationals. Companies argue strongly for clear, harmonised
international policies as a way of avoiding the inefficiencies and uncertainties
that result from a patchwork of local and national standards and regulations.
The U.S. responds to both public and industry pressure by taking significant
steps to foster greater fuel efficiency through three new initiatives: well-to-wheelscarbon assessments of fuels sold; a gradual rise in the U.S. Corporate Average
Fuel Economy (CAFE) standards – which lay down minimum fuel economy
standards for cars -- to reach European levels of 2007 by 2020; and taxes on
the sale of less fuel-efficient vehicles to encourage the purchase of more fuel-
efficient cars. Europe, meanwhile, imposes stricter CO2 emission allowances
rather than adding to the already significant fuel taxes, and sets aggressive
emission reduction targets.
The Chinese and Indian governments attempt to balance the intense political
pressures – both domestic and international – to both sustain economic growth
and respond to concerns about climate change and energy efficiency. In return
for their participation in international frameworks, they secure agreements that
will facilitate technology transfer and investment in energy-efficient plants. They
also receive assurances that a substantial proportion of the future revenues raised
through international auctioning of emission permits will be channelled to nationson a per capita basis. Behind the scenes, all parties anticipate that such agreements
will ultimately benefit all, through the increasing openness of China and India to
international markets and investment.
These developments bring increasing alignment between the U.S., Chinese,
Indian, Japanese, and European approaches to CO2 management. From 2012,
a critical mass of nations participates in meaningful emissions-trading schemes,
stimulating innovation and investment in new energy technologies and paving
the way to CO2 capture and underground storage after 2020.
28

8/14/2019 shell_energy_scenarios_2050.pdf
http://slidepdf.com/reader/full/shellenergyscenarios2050pdf 31/52
USA China
Japan Russia
India Europe EU 15
0
100
200
300
400
0 40 80 120
GDP per capita (PPP, '000 2000 USD)
GJ per capita (primary energy)
Energy ladders to 2050
Developing economies climb the energy ladder but overall the
journeys of both the developed and developing economies follow
less energy intensive paths.
400
300
200
100
0
0 40 80 120
GDP per capita (PPP, ‘000 2000 USD)
India
South Korea
Europe EU 15
China
Japan
USA
GJ per capita (primary energy)
29

8/14/2019 shell_energy_scenarios_2050.pdf
http://slidepdf.com/reader/full/shellenergyscenarios2050pdf 32/52
3.3 Developments benefit the energy poor
In Blueprints, the disorderly but early development of innovative solutions andadoption of proven practices from the grassroots benefit low-income nations as
well. Initially, this stems from the dynamics of the oil market: OPEC raises oil
production to maintain lower prices and defer the development of more costly
substitutes. Benefits also begin to emerge from accelerated growth in distributed
power generation from wind and solar energy. New wind turbines and more
cost-effective solar panels are easily exported to rural areas, and in a relatively
brief time, many African villages have a wind- or solar-powered energy supply for
drawing water from deeper, cleaner wells — and for later development needs.
India, too, invests heavily in wind, while China pioneers new developments in
solar energy — and these technological developments in both wind and solar
are exported back to the west, accelerating the uptake of solar in particular.
Government mandates for vehicles with significantly reduced and zero emissions,
fiscal incentives to support the build-up of mass production, and ever-more wind
and solar power all stimulate a surge in electric transport – powered by battery,fuel-cell or hybrid technologies. This growth in the use of electric vehicles allows
most nations to enter the plateau of oil production without the shocks that they
would otherwise have experienced. In Blueprints, the more efficient end-use of
electricity and the resulting slower growth in primary energy demand mean that
the former energy poor enjoy an additional boost in their standard of living
made possible by the resulting affordable energy prices.
30

8/14/2019 shell_energy_scenarios_2050.pdf
http://slidepdf.com/reader/full/shellenergyscenarios2050pdf 33/52
High overall efficiency of electric cars reduces demand in the
transport sector and changes the fuel mix.
0
50
100
150
200
250
300
350
2000 2025 2050
Electric transport
Liquid fuels
Passenger distance travelled (world), index 2000 = 100
Growth of electricity in transport
Electric transport
Liquid fuels
350
300
250
200
150
100
50
0
205020252000
Passenger distance travelled (world), index 2000 = 100
31
8/14/2019 shell_energy_scenarios_2050.pdf
http://slidepdf.com/reader/full/shellenergyscenarios2050pdf 34/52
3.4 Both disaggregation and integration
By 2050, one of the key revolutionary transitions observable in Blueprints is that
economic growth no longer mainly relies on an increase in the use of fossil fuels.
It is increasingly a world of electrons rather than molecules. Electric vehicles
are becoming the norm in the transport sector because of their attractiveness to
consumers and cost-effectiveness once governments have incentivised the build-
up to mass production. Power generation from renewable energy sources is
growing rapidly, while utilities that still rely on coal and gas are required to
implement strict carbon abatement technologies. In the developed world, almost
90% of all coal-fired and gas-fired power stations in the OECD and 50% in thenon-OECD world have been equipped with CCS technologies by 2050. This
reduces overall CO2 emissions by 15 to 20% compared to what they would
have been without CCS. New financial, insurance, and trading markets are
already emerging that help finance the major investments necessary to build this
new infrastructure. Europe’s lack of indigenous fossil fuels does not place it at a
disadvantage, thanks to the emergence of these new renewable technologies.
It does well economically in spite of its shrinking population and the fact that
capital stock was replaced earlier to meet tightening efficiency requirements.
In Blueprints, a second, more profound transition occurs at the political level,
where there is increased synergy between national policies and those undertaken
at the sub-national and international levels. While details may differ from nation
to nation, international organisations – concerned with the environment, global
economic health and energy – increasingly agree on what works and what
does not. This makes “big-picture” action more possible than ever. Unlikelypartnerships begin to form across political divides. Cities across the world
continue to share experience and create broader partnerships. The C-40 group
of leading cities, which continue to grow in number, identifies best practices in
urban development and eventually rural areas begin to join these coalitions – in
part to avoid becoming the dumping grounds for old technologies.
32
8/14/2019 shell_energy_scenarios_2050.pdf
http://slidepdf.com/reader/full/shellenergyscenarios2050pdf 35/52
0
50
100
150
200
2000 2010 2020 2030 2040 2050
EJ per year
Other Renewables
Wind
Solar
Biomass + Waste
Hydroelectricity
Nuclear
Coal
Gas
Oil
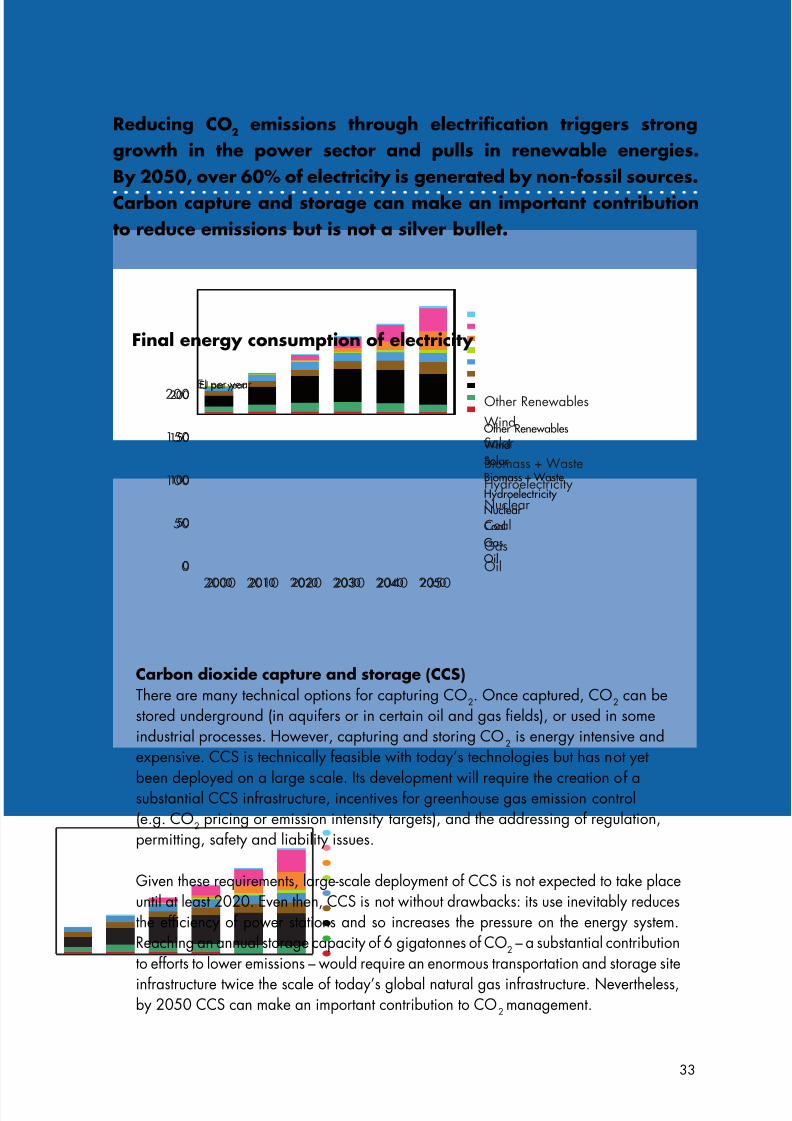
Final energy consumption of electricity
Carbon dioxide capture and storage (CCS)There are many technical options for capturing CO
2. Once captured, CO
2 can be
stored underground (in aquifers or in certain oil and gas fields), or used in someindustrial processes. However, capturing and storing CO
2 is energy intensive and
expensive. CCS is technically feasible with today’s technologies but has not yet
been deployed on a large scale. Its development will require the creation of asubstantial CCS infrastructure, incentives for greenhouse gas emission control(e.g. CO
2 pricing or emission intensity targets), and the addressing of regulation,
permitting, safety and liability issues.
Given these requirements, large-scale deployment of CCS is not expected to take placeuntil at least 2020. Even then, CCS is not without drawbacks: its use inevitably reducesthe efficiency of power stations and so increases the pressure on the energy system.Reaching an annual storage capacity of 6 gigatonnes of CO
2 – a substantial contribution
to efforts to lower emissions – would require an enormous transportation and storage site
infrastructure twice the scale of today’s global natural gas infrastructure. Nevertheless,by 2050 CCS can make an important contribution to CO
2management.
Reducing CO2 emissions through electrification triggers strong
growth in the power sector and pulls in renewable energies.
By 2050, over 60% of electricity is generated by non-fossil sources.
Carbon capture and storage can make an important contribution
to reduce emissions but is not a silver bullet.
EJ per year
Other Renewables
Wind
Solar
Biomass + Waste
Hydroelectricity
Nuclear
Coal
Gas
Oil
200
150
100
50
0
2000 2010 2020 2030 2040 2050
33

8/14/2019 shell_energy_scenarios_2050.pdf
http://slidepdf.com/reader/full/shellenergyscenarios2050pdf 36/52
Closer cross-border cooperation increases the speed of innovation. Because of
increased synergy between local, national and international regulations, new
technologies become competitive more quickly and are rolled out over the globe
more easily.
A significant role is played by a kind of strategic self-interest that results in, for
example, Russia and the Middle East developing sources of alternative energy for
their own use and reserving their conventional fuels for more profitable export.
Other nations continue to develop coal, but adopt clean coal technologies and CCS.
Increasingly, coal-exporting nations, especially in the OECD, require CO2 permits
on exports, and this extends further the reach of the frameworks for managinggreenhouse gas emissions. These developments help reduce CO
2 emissions to a
level leading towards a more sustainable atmospheric concentration.
Multinational R&D expenditures, higher transparency and more reliability in
energy statistics, effective carbon pricing, and predictable regulation – fostered
by new industry-government cooperation – reduce investment uncertainty. This
in turn encourages entrepreneurs and investors to invest yet more in R&D and to
bring innovations more quickly to market.
This is a world of steady economic development and global economic integration.
Yet the grassroots pressures and growing transparency that characteriseBlueprints
also put relentless pressure on governments to become more accountable in both
democratic and authoritarian countries. In some cases this facilitates orderly
transitions. However, the accelerated pace of technological and regulatory
change in this scenario adds additional stresses, and the more rigid societiesand political regimes struggle to adapt. Tensions between urban and rural
communities increase and there is dramatic political change in several countries,
particularly where governance is poor. Unless they have acted and invested
wisely, this affects even the wealthier energy-exporting nations when exports
and revenues eventually begin to decline. This is a world of increasing global
alignment coupled with ongoing, widely distributed, political turbulence. But this
is turbulence that has progressively less impact on the functioning of the global
energy system.
34

8/14/2019 shell_energy_scenarios_2050.pdf
http://slidepdf.com/reader/full/shellenergyscenarios2050pdf 37/52
0
200
400
600
2000 2025 2050
Non-energy Use
Residential
Transport
Services
Agriculture & Other Industry
Heavy industry
EJ per year
Final energy consumption by sector
0
200
400
600
800
1000
2000 2010 2020 2030 2040 2050
EJ per year
Other Renewables
Biomass
Nuclear
Coal
Gas
Oil
Primary energy by source
Meaningful CO2 pricing stimulates energy efficiency and
electrification of the energy system, reducing the demand on
conventional hydrocarbon resources.
Biomass includes traditional renewables such as wood, dung, etc.
EJ per year
Non-energy Use
Residential
Transport
Services
Agriculture & Other Industry
Heavy industry
600
400
200
0
2000 2025 2050
1000
800
600
400
200
0
EJ per year
Other Renewables
Biomass
Nuclear
Coal
Gas
Oil
2000 2010 2020 2030 2040 2050
35

8/14/2019 shell_energy_scenarios_2050.pdf
http://slidepdf.com/reader/full/shellenergyscenarios2050pdf 38/52
3.5 Blueprints for climate change responses
Agreements on how to address climate concerns are not the result of a miraculouschange in the behaviour of political leaders. They reflect the way that grassroots
values are now imprinting themselves on political agendas through the media
and international pressure groups. They also stem from pressure exerted by
industry eager for regulatory clarity and consistency. Such pressure results in
breakthroughs in an international architecture for managing energy security
concerns in parallel with options for climate change mitigation and adaptation.
After the Kyoto Protocol expires in 2012, a meaningful international carbon-
trading framework with robust verification and accreditation emerges from the
patchwork of regional and city-city schemes. Consistent U.S. policy support for
technology investment and deployment pays dividends in providing tangible
breakthroughs for effective change. More reliable energy statistics and better
informed market analysis allow carbon-trading futures markets to reflect clearer
long-term price signals. Because of these frameworks, markets can anticipate
tightness in CO2 emission allocations and plan for them.
By 2055, the U.S. and the EU are using an average of 33% less energy per capita
than today. Chinese energy use has also peaked. India is still climbing its energy
ladder, but as a relative latecomer, it has to be resourceful in following a lower
energy-intensive development path. The political and bureaucratic effort to harmonise
and align energy policies is difficult and requires a great deal of up-front investment —
but in Blueprints, in a critical mass of countries, people support national leaders
who promise not only energy security but also a sustainable future. Initial pain has
reduced uncertainty and prepared the way for long-term gain.
36

8/14/2019 shell_energy_scenarios_2050.pdf
http://slidepdf.com/reader/full/shellenergyscenarios2050pdf 39/52
0
10
20
30
40
50
2000 2010 2020 2030 2040 2050
Sub-Saharan Africa
Middle East & N Africa
Latin America
Asia & Oceania - Developi
Asia & Oceania - Develope
North America
Europe
Gt CO2 per year
Direct CO2 emissions from energy
Concerted global efforts reduce CO2 emissions but do not prevent
economic growth. Nevertheless, stabilising GHG levels in the
atmosphere at or below 450 ppm of CO2-equivalent - a level
scientific evidence suggests is necessary to significantly reducethe risks of climate change - remains a significant challenge.
Reducing the growth of atmospheric GHGsToday, more attention is being paid to all GHGs, not just CO
2. Methane, for instance, is
another important GHG and its levels are rising. Limiting the increase of total GHG levelsin the atmosphere is expected to reduce the probability of dangerous climate change.Reversing the growth of emissions requires meaningful carbon pricing to shape choicesand encourage greater efficiency in energy use, and effective policies to acceleratethe demonstration and deployment of low-emission technologies. Energy-related CO
2
emissions today account for around two-thirds of all GHG emissions from humanactivity, so transforming our use of energy is a major priority. This will require early andwidespread implementation of CCS, large-scale development of renewable electricity,second-generation biofuels and rapid penetration of electric vehicles after 2020.Limiting GHG concentrations to 450 ppm CO
2-equivalent is expected to limit temperature
rises to no more than 2°C above pre-industrial levels. This would be extremely challengingto achieve, requiring an explosive pace of industrial transformation going beyond eventhe aggressive developments outlined in the Blueprints scenario. It would require globalGHG emissions to peak before 2015, a zero-emission power sector by 2050 and a
near zero-emission transport sector in the same time period, complete electrification of
the residential sector, with remaining energy-related emissions limited to niche areas oftransport and industrial production (of cement and metals for example).
Sub-Saharan Africa
Middle East & N. Africa
Latin America
Asia & Oceania - Developing
Asia & Oceania - Developed
North America
Europe
50
40
30
20
10
0
2000 2010 2020 2030 2040 2050
Gt CO2 per year
37
8/14/2019 shell_energy_scenarios_2050.pdf
http://slidepdf.com/reader/full/shellenergyscenarios2050pdf 40/52
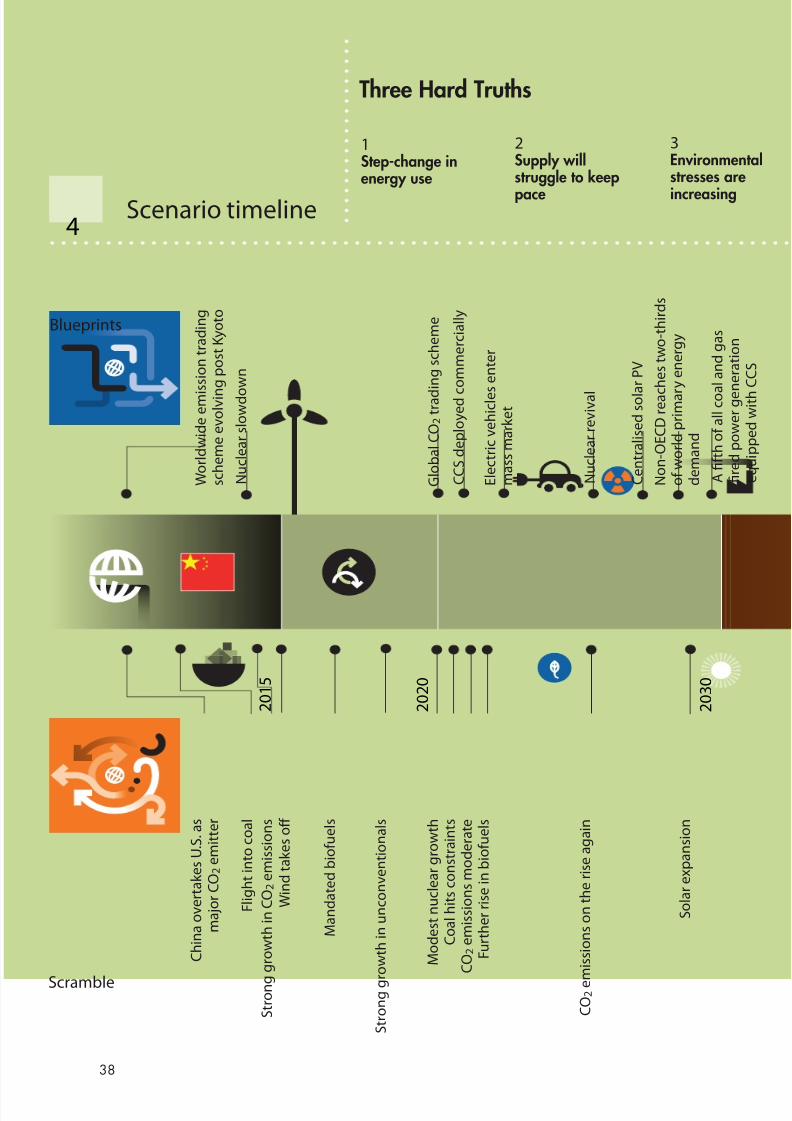
1
Step-change inenergy use
2 Supply willstruggle to keep
pace
3 Environmentalstresses are
increasing
W o r l d w i d e e m i s s i o n t r a d i n g
s c h e m e e v o l v i n
g p o s t K y o t o
E l e c t r i c v e h i c l e s
e n t e r
m a s s m a r k e t
N o n - O E C D r e a c
h e s t w o - t h i r d s
o f w o r l d p r i m a r
y e n e r g y
d e m a n d
C h i n a o v e r t a k e s U . S . a s
m a j o r C O 2 e m i t t e r
F l i g h t i n t o c o a l
S t r o n g
g r o w t h i n C O 2 e m i s s i o n s
M o d e s t n u c l e a r g r o w t h
C o a l h i t s c o n s t r a i n t s
C O 2 e m i s s i o n s m o d e r a t e
F u r t h e r r i s e i n b i o f u e l s
C O 2 e m i s s i o n s o n t h e r i s e a g a i n
S o l a r e x p a n s i o n
N u c l e a r s l o w d o
w n
G l o b a l C O 2 t r a d
i n g s c h e m e
C C S d e p l o y e d c
o m m e r c i a l l y
N u c l e a r r e v i v a l
C e n t r a l i s e d s o l a
r P V
W i n d t a k e s o ff
M a n d a t e d b i o f u e l s
Three Hard Truths
Scramble
Blueprints
2 0 1 5
2 0 3 0
2 0 2 0
A fi f t h o f a l l c o a l a n d g a s
fi r e d p o w e r g e n e r a t i o n
e q u i p p e d w i t h
C C S
S t r o n g g r o w t h i n u n c o n v e n t i o n a l s
Scenario timeline4
38
8/14/2019 shell_energy_scenarios_2050.pdf
http://slidepdf.com/reader/full/shellenergyscenarios2050pdf 41/52
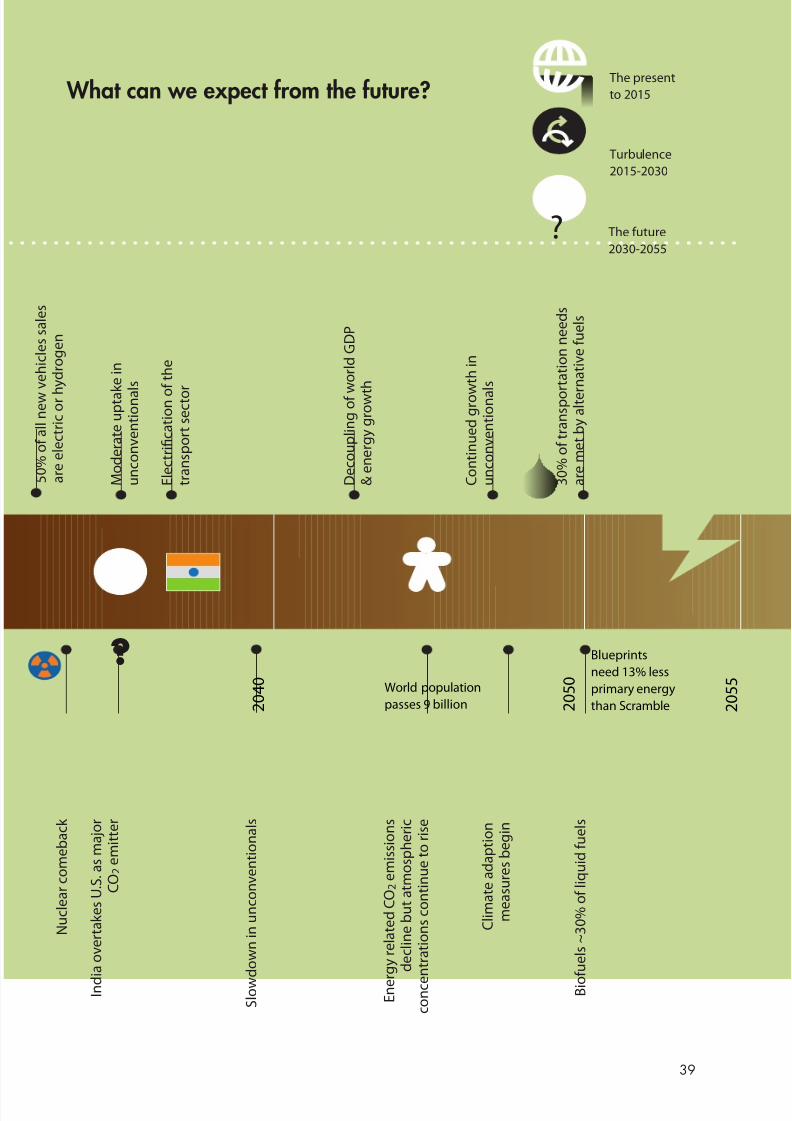
M o d e r a t e u p t a k e i n
u n c o n v e n t i o n a l s
E l e c t r i fi c a t i o n o
f t h e
t r a n s p o r t s e c t o r
D e c o u p l i n g o f w
o r l d G D P
& e n e r g y g r o w t h
C o n t i n u e d g r o w
t h i n
u n c o n v e n t i o n a l s
3 0 % o f t r a n s p o r t a t i o n n e e d s
a r e m e t b y a l t e r
n a t i v e f u e l s
N u c l e a r c o m e b a c k
I n d
i a o v e r t a k e s U . S . a s m a j o r
C O 2 e m i t t e r
B i o
f u e l s ~ 3 0 % o f l i q u i d f u e l s
E n e r g y r e l a t e d C O 2 e m i s s i o n s
d e c l i n e b u t a t m o s p h e r i c
c o n c e
n t r a t i o n s c o n t i n u e t o r i s e
C l i m a t e a d a p t i o n
m e a s u r e s b e g i n
What can we expect from the future? The present
to 2015
Turbulence
2015-2030
The future
2030-2055
?
?
2 0 5 5
2 0 5 0
2 0 4 0
Blueprints
need 13% less
primary energy
than Scramble
5 0 % o
f a l l n e w
v e h i c l e s s a l e s
a r e e l e c t r i c o r h
y d r o g e n
S l o w
d o w n i n u n c o n v e n t i o n a l s
World population
passes 9 billion
39

8/14/2019 shell_energy_scenarios_2050.pdf
http://slidepdf.com/reader/full/shellenergyscenarios2050pdf 42/52
Technology
Demand
Resources
Environment
What are the energy-relateddifferences between the
two scenarios?
Scenariocomparisons
4
40

8/14/2019 shell_energy_scenarios_2050.pdf
http://slidepdf.com/reader/full/shellenergyscenarios2050pdf 43/52
Drivers BlueprintsScramble
Choice
Prices
Efficiency technology
Efficiency behaviour
• Mandates
• Externalities not included
• Mandates
• Necessity
• Market driven but incentivised
• Externalities included
• Economic incentives & standards
• Designed in
Oil & gas
Coal
Nuclear
Electric renewables
Biomass
• Constrained growth
• Flight into coal
• Modest uptake
• Sequential - wind, solar
• Strong growth
• Long plateau
• Coal not wanted unless “clean”
• Continued growth
• Incentivise early stage technologies
• Complements alternative fuel mix
Innovation
Implementation
Mobility
Power
IT
• Strongly guarded
• National “docking points”
• Hybrids & downsizing
• Efficiency
• Supply optimisation
• Extensively shared
• International “tipping points”
• Hybrids & electrification
• Carbon capture & storage
• Demand load management systems
Land use
Pollution
Climate / Biodiversity
Water
• Energy vs. food principle
• Important locally
• Background global concern
• Energy production & climate
change impact
• Sustainability principle
• Important
• Prominent local & global concern
• Factored into development
frameworks
41

8/14/2019 shell_energy_scenarios_2050.pdf
http://slidepdf.com/reader/full/shellenergyscenarios2050pdf 44/52
Shell energy scenarios: concludingremarks!
The Scramble and Blueprints outlooks
are both rooted in detailed analyses
of energy supply, demand, andtechnology fundamentals. Of course,
it is impossible to condense the full
richness of scenarios into a brief
overview, but we trust this booklet
has given you a good flavour of the
main insights of Shell’s latest energy
scenarios, along with the choices to be
faced and their key implications.
Neither of the scenarios is comfortable,
which is to be expected given the
hard truths we are facing. While
both portray successful economic
development and the globalisation
that accompanies this, both also havebranching points that could potentially
lead towards escalating geopolitical
chaos. They create different legacies
for future generations, with both good
and disturbing features. Together,
however, they sketch the landscape of
possibilities, constraints, opportunities
and choices for this era of revolutionary
transitions in the global energy
system.
Some readers may find one scenario
preferable to the other, or one more
plausible than the other. This should not
be surprising as readers will approach
these outlooks with their own unique
experience and interests. In truth, we
have found all possible combinations
of reactions to the two storylines as
we have developed and discussed the
scenario material with specialists and
groups from different backgrounds
across the globe. This has confirmed
to us that both are realistic and both
are challenging.
To get the most out of the storylines,
we recommend reviewing them with
a number of specific questions in
mind such as: “what are the potential
milestones or events that could
particularly affect us?”; “what are
42

8/14/2019 shell_energy_scenarios_2050.pdf
http://slidepdf.com/reader/full/shellenergyscenarios2050pdf 45/52
the most significant factors that will
influence our environment and how
could these play out?”; and “whatshould we do in the next five years
to help prepare for, or shape, the
turbulent times ahead?”
We are pleased to share our thinking
with you. Together, we all face the
future of TANIA over the next fifty years.
Though there are no ideal answers
to the coming challenges we will,
however, be required to address many
difficult questions. The more clearly
we can see the complex dynamics
of tomorrow’s world, the better we
might navigate through the inevitable
turbulence. We hope these scenarioswill make a modest contribution to
helping us all do so.
Jeremy B. Bentham
Shell International B.V.
If historians now see
the turn of the 19 th
century as the dawn
of the industr ia l
revolution, I hope
they will see the turnof the 21st century
as the dawn of the
energy revolution.
“
“
Rob Routs
Executive DirectorDownstream Royal Dutch Shell plc
Apeldoorn, June 2007
There A reNo
Ideal A nswers
43

8/14/2019 shell_energy_scenarios_2050.pdf
http://slidepdf.com/reader/full/shellenergyscenarios2050pdf 46/52
Abbreviations
boe = barrel of oil equivalent
CCS = carbon dioxide capture and storageCO
2 = carbon dioxide
Gt = gigatonne
kWh = kilowatt hour
mbd = million barrels per day
mt = metric tonne
ppm = parts per million by volume
International System (SI) of units
MJ = megajoule = 106 joule
GJ = gigajoule = 109 joule
EJ = exajoule = 1018 joule
Conversion between units
1 boe = 5.63 GJ*
1 mbd = 2.05 EJ/year1 million cubic metre gas = 34 700 GJ*
1 tonne coal = 25 GJ*
1 kWh = 3.6 MJ
* This is a typical average but the energy content of a particular carrier may vary.
Glossary
44
8/14/2019 shell_energy_scenarios_2050.pdf
http://slidepdf.com/reader/full/shellenergyscenarios2050pdf 47/52
Data sources
The principal data sources used in the development of Shell’s scenario
analyses and charts in this booklet are:
World Bank WDI•
Oxford Economics•
UN Population Division•
Energy Balances of OECD Countries © OECD/IEA 2006•
Energy Balances of Non-OECD Countries © OECD/IEA 2006•
Glossary
45

8/14/2019 shell_energy_scenarios_2050.pdf
http://slidepdf.com/reader/full/shellenergyscenarios2050pdf 48/52
Summary quantification
2000 2010 2020 2030 2040 2050
EJ per year
Oil 147 176 186 179 160 141Gas 88 110 133 134 124 108
Coal 97 144 199 210 246 263
Nuclear 28 31 34 36 38 43
Biomass 44 48 59 92 106 131
Solar 0 0 2 26 62 94
Wind 0 2 9 18 27 36
Other Renewables 13 19 28 38 51 65
Total primary energy 417 531 650 734 815 880
2000 2010 2020 2030 2040 2050
EJ per year
Oil 147 177 191 192 187 157
Gas 88 109 139 143 135 122Coal 97 137 172 186 202 208
Nuclear 28 30 30 34 41 50
Biomass 44 50 52 59 54 57
Solar 0 1 7 22 42 74
Wind 0 1 9 17 28 39
Other Renewables 13 18 29 40 50 62
Total primary energy 417 524 628 692 738 769
Scramble
Blueprints
46

8/14/2019 shell_energy_scenarios_2050.pdf
http://slidepdf.com/reader/full/shellenergyscenarios2050pdf 49/52
Notes

8/14/2019 shell_energy_scenarios_2050.pdf
http://slidepdf.com/reader/full/shellenergyscenarios2050pdf 50/52
Disclaimer statement
This document contains forward-looking state-
ments concerning the financial condition, results
of operations and businesses of Royal Dutch Shell.
All statements other than statements of historical
fact are, or may be deemed to be, forward-look-
ing statements. Forward-looking statements are
statements of future expectations that are based
on management’s current expectations and as-
sumptions and involve known and unknown risks
and uncertainties that could cause actual results,
performance or events to differ materially from
those expressed or implied in these statements.
Forward-looking statements include, among other
things, statements concerning the potential expo-
sure of Royal Dutch Shell to market risks and state-
ments expressing management’s expectations,
beliefs, estimates, forecasts, projections and as-
sumptions. These forward-looking statements are
identified by their use of terms and phrases such
as ‘‘anticipate’’, ‘‘believe’’, ‘‘could’’, ‘‘estimate’’,
‘‘expect’’, ‘‘intend’’, ‘‘may’’, ‘‘plan’’, ‘‘objectives’’,
‘‘outlook’’, ‘‘probably’’, ‘‘project’’, ‘‘will’’, ‘‘seek’’,
‘‘target’’, ‘‘risks’’, ‘‘goals’’, ‘‘should’’ and similar
terms and phrases. There are a number of fac-
tors that could affect the future operations of Royal
Dutch Shell and could cause those results to differ
materially from those expressed in the forward-
looking statements included in this document,
including (without limitation): (a) price fluctua-
tions in crude oil and natural gas; (b) changes
in demand for the Group’s products; (c) currency
fluctuations; (d) drilling and production results; (e)
reserve estimates; (f) loss of market and industry
competition; (g) environmental and physical risks;
(h) risks associated with the identification of suit-
able potential acquisition properties and targets,
and successful negotiation and completion of
such transactions; (i) the risk of doing business in
developing countries and countries subject to in-
ternational sanctions; (j) legislative, fiscal and reg-
ulatory developments including potential litigation
and regulatory effects arising from recategorisa-
tion of reserves; (k) economic and financial mar-
ket conditions in various countries and regions; (l)
political risks, including the risks of expropriation
and renegotiation of the terms of contracts with
governmental entities, delays or advancements in
the approval of projects and delays in the reim-
bursement for shared costs; and (m) changes in
trading conditions. All forward-looking statements
contained in this document are expressly quali-
fied in their entirety by the cautionary statements
contained or referred to in this section. Readers
should not place undue reliance on forward-look-
ing statements. Additional factors that may af-
fect future results are contained in Royal Dutch
Shell’s 20-F for the year ended December 31,
2007 (available at www.shell.com/investor and
www.sec.gov). These factors also should be con-
sidered by the reader. Each forward-looking
statement speaks only as of the date of this report,
March 18, 2008. Neither Royal Dutch Shell nor
any of its subsidiaries undertake any obligation
to publicly update or revise any forward-looking
statement as a result of new information, future
events or other information. In light of these risks,
results could differ materially from those stated,
implied or inferred from the forward-looking state-
ments contained in this document.
48

8/14/2019 shell_energy_scenarios_2050.pdf
http://slidepdf.com/reader/full/shellenergyscenarios2050pdf 51/52
Shell International BV
Carel van Bylandtlaan 16
2596 HR The Hague
P.O. Box 162
2501 AN The Hague
The Netherlands
VMS The Hague H8259, 2009. 4th edition.

8/14/2019 shell_energy_scenarios_2050.pdf
http://slidepdf.com/reader/full/shellenergyscenarios2050pdf 52/52