Shelf Real Estate: Package Spacing in a Retail...
8
ABSTRACT This eye tracking study is designed to look for optimal package spacing in a retail environment qualified by the fastest search time. Experiments were conducted at the 2011 Pack Expo Las Vegas show (a national packaging industry conference) to record the duration of search time relative to each “shopper.” The proportions of each package’s front elevation controlled the spacing of the objects on the shelves. Kellogg’s brand Pop Tarts breakfast items were used in the study to determine search time in relation to package spacing. To what extent can retailers control and persuade the consumer in the marketplace? Package spacing and search time are studied through this lens. Keywords: eye tracking, packaging science, design, retail environment, shelf spacing, CUshop, Pack Expo Las Vegas INTRODUCTION Package Spacing can be defined as a measurement in inches of the distance recorded between one package and the next. In most instances retail environments such as grocery stores, marketplaces, and gas convenience stations, limit package spacing from nothing (0 inches) to slight gaps (0.25- 1.00 inches). These slight gaps are usually created due to poor planning, low stock, or on site surprises [11]. Curhan describes this type of retail analysis as space elasticity [7]. Research has been gathered with respect to area of shelf space and visible sides, but few studies, if any, have been conducted on free (or white) space among packages. Shelf Real Estate is a broader term that describes the value and attention paid towards spacing in the mentioned retail environments. Packaging scientists and store managers plan the spacing of objects due to several factors: · Size of package · Quantity of packages · Shelf-life of products · Store calendar · Product demand · Promotional strategies · Stocking challenges [6] In today’s marketplaces, the most respected factor would be product demand due to its close relation to immediate sales and customer satisfaction. While this demand is important, it is necessary to qualify that across products, periods, and stores; there is no uniform relationship to shelf space and unit sales [7]. BACKGROUND This study was implemented towards a desire to better understand reaction times in relation to spacing. It is the retailer’s device to design the appropriate strategy for the display of their products in relation to the human scale. Spacing is a key factor recognized by the fields of urbanism, architecture, real estate, and art. All of these fields involve engaging a human response from their creators. Grocery stores have a spacing strategy better connected with marketing [2]. The size of the package is the only factor in which these store planners are concerned. With the size of the package documented, retailers compensate empty shelf space with a comparable shipment of the correct quantity. Much research has been investigated on the trends between private and public labels [3]. Consumers agree that high quality is valued strongly over lower prices [12]. Consumers are more interested in the quality that their brand illustrates. We know the buyer is aware of their surroundings where: “consumers experience all aspects of a product simultaneously (colour, branding, texture etc.) and isolation of a single property from its overall context may adversely affect consumer perceptions”—this is where a scientific marketing strategy could be applied post-experiment [1]. Possibly, the consumer can respect a package more if there exists enough room around the object—a requirement for reflection. Much like the work in an art gallery or the street facades of buildings stretching a busy city street. An iconic gateway catches your eye—that is if there is enough free space around it to for observation in the first place. Through an understanding of spacing in revered moments held in art galleries, most enthusiasts would agree, artwork needs to be displayed properly with large backdrops and blank surroundings. Some paintings would look impossibly too busy even if a frame were to be added for completion. Empty space in reference to art is extremely valuable [5]. Shelf Real Estate: Package Spacing in a Retail Environment Daniel Hutcherson Clemson University Clemson, SC, USA [email protected] Rachel Randall Clemson University Clemson, SC, USA [email protected] Andrew Ouzts Clemson University Clemson, SC, USA [email protected]
Transcript of Shelf Real Estate: Package Spacing in a Retail...

ABSTRACT
This eye tracking study is designed to look for optimal package spacing in a retail environment qualified by the fastest search time. Experiments were conducted at the 2011 Pack Expo Las Vegas show (a national packaging industry conference) to record the duration of search time relative to each “shopper.” The proportions of each package’s front elevation controlled the spacing of the objects on the shelves. Kellogg’s brand Pop Tarts breakfast items were used in the study to determine search time in relation to package spacing.
To what extent can retailers control and persuade the consumer in the marketplace? Package spacing and search time are studied through this lens.
Keywords: eye tracking, packaging science, design, retail environment, shelf spacing, CUshop, Pack Expo Las Vegas
INTRODUCTION
Package Spacing can be defined as a measurement in inches of the distance recorded between one package and the next. In most instances retail environments such as grocery stores, marketplaces, and gas convenience stations, limit package spacing from nothing (0 inches) to slight gaps (0.25-1.00 inches). These slight gaps are usually created due to poor planning, low stock, or on site surprises [11]. Curhan describes this type of retail analysis as space elasticity [7]. Research has been gathered with respect to area of shelf space and visible sides, but few studies, if any, have been conducted on free (or white) space among packages.
Shelf Real Estate is a broader term that describes the value and attention paid towards spacing in the mentioned retail environments. Packaging scientists and store managers plan the spacing of objects due to several factors:
· Size of package· Quantity of packages· Shelf-life of products· Store calendar· Product demand· Promotional strategies· Stocking challenges [6]
In today’s marketplaces, the most respected factor would be product demand due to its close relation to immediate sales and customer satisfaction. While this demand is important, it is necessary to qualify that across products, periods, and stores; there is no uniform relationship to shelf space and unit sales [7].
BACKGROUND
This study was implemented towards a desire to better understand reaction times in relation to spacing. It is the retailer’s device to design the appropriate strategy for the display of their products in relation to the human scale.
Spacing is a key factor recognized by the fields of urbanism, architecture, real estate, and art. All of these fields involve engaging a human response from their creators. Grocery stores have a spacing strategy better connected with marketing [2]. The size of the package is the only factor in which these store planners are concerned. With the size of the package documented, retailers compensate empty shelf space with a comparable shipment of the correct quantity.
Much research has been investigated on the trends between private and public labels [3]. Consumers agree that high quality is valued strongly over lower prices [12]. Consumers are more interested in the quality that their brand illustrates. We know the buyer is aware of their surroundings where: “consumers experience all aspects of a product simultaneously (colour, branding, texture etc.) and isolation of a single property from its overall context may adversely affect consumer perceptions”—this is where a scientific marketing strategy could be applied post-experiment [1]. Possibly, the consumer can respect a package more if there exists enough room around the object—a requirement for reflection. Much like the work in an art gallery or the street facades of buildings stretching a busy city street. An iconic gateway catches your eye—that is if there is enough free space around it to for observation in the first place.
Through an understanding of spacing in revered moments held in art galleries, most enthusiasts would agree, artwork needs to be displayed properly with large backdrops and blank surroundings. Some paintings would look impossibly too busy even if a frame were to be added for completion. Empty space in reference to art is extremely valuable [5].
Shelf Real Estate: Package Spacing in a Retail EnvironmentDaniel HutchersonClemson UniversityClemson, SC, USA
Rachel RandallClemson UniversityClemson, SC, USA
Andrew OuztsClemson University Clemson, SC, USA
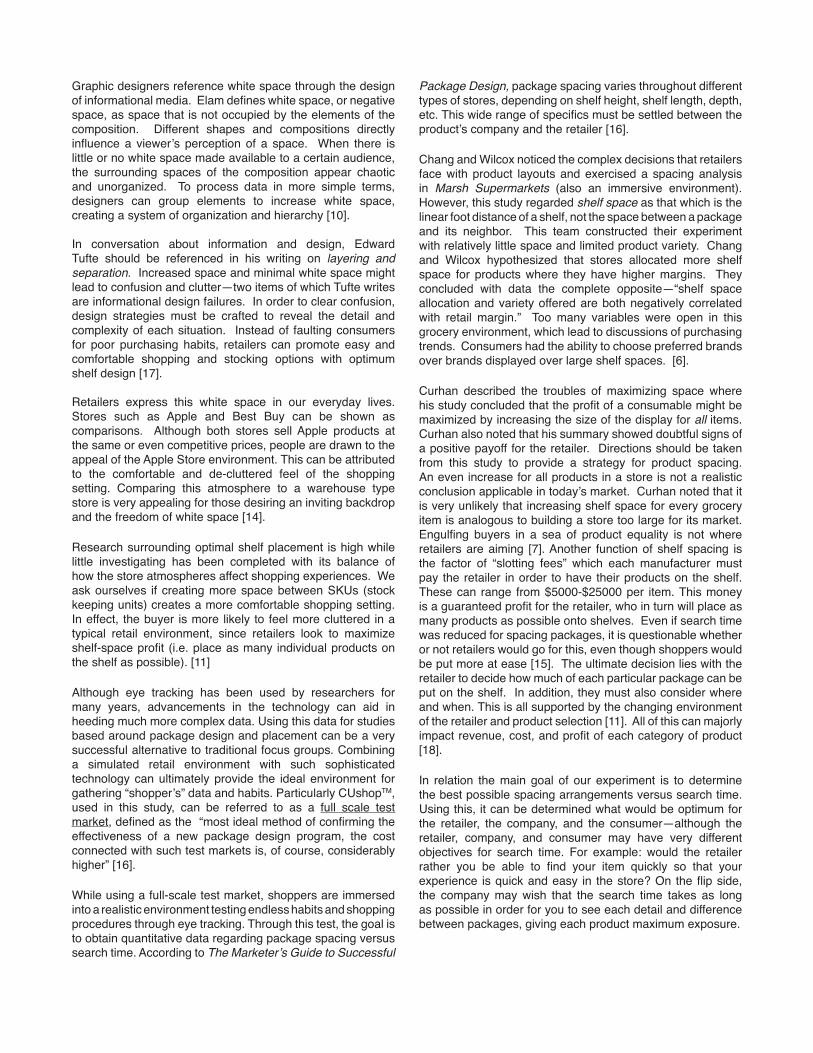
Graphic designers reference white space through the design of informational media. Elam defines white space, or negative space, as space that is not occupied by the elements of the composition. Different shapes and compositions directly influence a viewer’s perception of a space. When there is little or no white space made available to a certain audience, the surrounding spaces of the composition appear chaotic and unorganized. To process data in more simple terms, designers can group elements to increase white space, creating a system of organization and hierarchy [10].
In conversation about information and design, Edward Tufte should be referenced in his writing on layering and separation. Increased space and minimal white space might lead to confusion and clutter—two items of which Tufte writes are informational design failures. In order to clear confusion, design strategies must be crafted to reveal the detail and complexity of each situation. Instead of faulting consumers for poor purchasing habits, retailers can promote easy and comfortable shopping and stocking options with optimum shelf design [17].
Retailers express this white space in our everyday lives. Stores such as Apple and Best Buy can be shown as comparisons. Although both stores sell Apple products at the same or even competitive prices, people are drawn to the appeal of the Apple Store environment. This can be attributed to the comfortable and de-cluttered feel of the shopping setting. Comparing this atmosphere to a warehouse type store is very appealing for those desiring an inviting backdrop and the freedom of white space [14].
Research surrounding optimal shelf placement is high while little investigating has been completed with its balance of how the store atmospheres affect shopping experiences. We ask ourselves if creating more space between SKUs (stock keeping units) creates a more comfortable shopping setting. In effect, the buyer is more likely to feel more cluttered in a typical retail environment, since retailers look to maximize shelf-space profit (i.e. place as many individual products on the shelf as possible). [11]
Although eye tracking has been used by researchers for many years, advancements in the technology can aid in heeding much more complex data. Using this data for studies based around package design and placement can be a very successful alternative to traditional focus groups. Combining a simulated retail environment with such sophisticated technology can ultimately provide the ideal environment for gathering “shopper’s” data and habits. Particularly CUshopTM, used in this study, can be referred to as a full scale test market, defined as the “most ideal method of confirming the effectiveness of a new package design program, the cost connected with such test markets is, of course, considerably higher” [16].
While using a full-scale test market, shoppers are immersed into a realistic environment testing endless habits and shopping procedures through eye tracking. Through this test, the goal is to obtain quantitative data regarding package spacing versus search time. According to The Marketer’s Guide to Successful
Package Design, package spacing varies throughout different types of stores, depending on shelf height, shelf length, depth, etc. This wide range of specifics must be settled between the product’s company and the retailer [16].
Chang and Wilcox noticed the complex decisions that retailers face with product layouts and exercised a spacing analysis in Marsh Supermarkets (also an immersive environment). However, this study regarded shelf space as that which is the linear foot distance of a shelf, not the space between a package and its neighbor. This team constructed their experiment with relatively little space and limited product variety. Chang and Wilcox hypothesized that stores allocated more shelf space for products where they have higher margins. They concluded with data the complete opposite—“shelf space allocation and variety offered are both negatively correlated with retail margin.” Too many variables were open in this grocery environment, which lead to discussions of purchasing trends. Consumers had the ability to choose preferred brands over brands displayed over large shelf spaces. [6].
Curhan described the troubles of maximizing space where his study concluded that the profit of a consumable might be maximized by increasing the size of the display for all items. Curhan also noted that his summary showed doubtful signs of a positive payoff for the retailer. Directions should be taken from this study to provide a strategy for product spacing. An even increase for all products in a store is not a realistic conclusion applicable in today’s market. Curhan noted that it is very unlikely that increasing shelf space for every grocery item is analogous to building a store too large for its market. Engulfing buyers in a sea of product equality is not where retailers are aiming [7]. Another function of shelf spacing is the factor of “slotting fees” which each manufacturer must pay the retailer in order to have their products on the shelf. These can range from $5000-$25000 per item. This money is a guaranteed profit for the retailer, who in turn will place as many products as possible onto shelves. Even if search time was reduced for spacing packages, it is questionable whether or not retailers would go for this, even though shoppers would be put more at ease [15]. The ultimate decision lies with the retailer to decide how much of each particular package can be put on the shelf. In addition, they must also consider where and when. This is all supported by the changing environment of the retailer and product selection [11]. All of this can majorly impact revenue, cost, and profit of each category of product [18].
In relation the main goal of our experiment is to determine the best possible spacing arrangements versus search time. Using this, it can be determined what would be optimum for the retailer, the company, and the consumer—although the retailer, company, and consumer may have very different objectives for search time. For example: would the retailer rather you be able to find your item quickly so that your experience is quick and easy in the store? On the flip side, the company may wish that the search time takes as long as possible in order for you to see each detail and difference between packages, giving each product maximum exposure.

HYPOTHESES
The following hypotheses were developed before experiments were held in the Las Vegas CUshopTM location. All participants “know” what they are searching for and most are familiar with the brand. Their only question on finding the object is it’s particular shelf placement.
· Minimum spacing is regarded as nothing, 0 inches.· Moderate spacing is defined as a third of the
package’s width (1/3 Pop Tarts = 1.17 inches).· Maximum spacing is defined as the width of the
package being studied (Pop Tarts = 3.5 inches).
H1: Shoppers will find their desired package quicker when there is maximum spacing between each package.
H2: Shoppers will give up when looking for packages at minimum spacing.
METHOD
Context:This experiment will be completed in CUshopTM, a realistic shopping environment. Within this immersive setting, shoppers will look at packages in an environment most similar to a real store.
Figure 1: Site, Las Vegas Convention Center
In order to take advantage of a large audience, a team of 10 students will ship the shelving units of CUshopTM from the consumer eye-tracking lab in Clemson, SC to a national packaging industry show in Las Vegas, NV. This show occurred over a three-day period and was useful in exploiting research and promotion of the eye-tracking lab.
Figure 2: CUshopTM Vegas Floor Plan
The Las Vegas Convention Center hosted the national version of Pack Expo. PMMI, a packaging industry not-for-profit, funded the temporary relocation of CUshopTM enabling all of the software and eye-tracking equipment to become available.
Tobii eye-tracking researchers donated the use of 100 extra IR markers and a second pair of glasses for the experiment.
Participants:Participants of this study were registered attendees at Pack Expo 2011 Las Vegas. PMMI and Clemson University provided signage and printed ads to display the presence of the experimental booth to potential subjects. No incentive was offered other than a results print out (1 sheet page) that contained illustrations of personal scan paths, heat maps, one bar graph, and definitions of eye-tracking terms. The flyer was for promotional and educational purposes.
Stimuli: The stimuli used for this study were 39 boxes of Pop Tarts. A mixed assortment of flavors were included: Cookies & Cream, Raspberry, Frosted Strawberry, Cherry, Unfrosted Blueberry, Chocolate Fudge, Brown Sugar Cinnamon, and S’mores.
Figures 3-5: Pop Tart Flavors
Pop Tarts were chosen as the desired package stimulus for this spacing experiment due to their neutrality, status as a common commodity, color, variation of flavors, package structures, and similarity of graphics. This product was presented as a consistent brand well known to an international audience of consumers.
These packages were placed on the upper two shelves in a 4’ wide arrangement, most similar to how they would be placed in a real retail environment. Placing these packages on the middle and top shelves eliminates the variability of shelf placement. The bottom shelf was not used due to its unnatural position in relation to the human scale. By only positioning items to these eye-level shelves, the experiment is strictly designed to focus on package spacing. All prices will be constant (at $2.49) to decrease variability.
Once inside the CUshopTM laboratory setting, “shoppers” could find the Pop Tarts on the end of the second aisle next to a section of breakfast cereals. Oatmeal and grits were the consumables located on the fourth and lower shelf, directly below the Pop Tarts.

Figure 7: Stimuli Placed in Retail Environment.
Materials and Apparatus:Using the Tobii Technology eye-tracking glasses and software; data will be collected through video and audio, displaying the shopper’s experience through heat maps and gaze plots generated by the software. The Tobii eyeglasses can track where the user is looking with a degree of accuracy of half a degree. Areas of Interest (AOI’s) are marked in the software to code the locations of each fixation.
AOI-1
TARGET
AOI-2
AOI-3
Figure 8: Tobii Eye Tracking Glasses and AOI Distribution
Experimental Design:The Pop Tart packages will be used to fill three, 4 ft. wide retail shelves. As the space between each package is expanded, the previous adjacencies will remain. If needed, some neighboring products may be eliminated from the shelves due to space limitations. These space limitations were observed not only due to space restrictions but also to real life marketing decisions. Most markets would not have the ability to sacrifice other brands (in our case the neighboring cereal section) in order to please one brand. Similar conclusions were learned from with Curhan’s dull spirited suggestions on maximizing space [7].
By using proportions of the box as our spacing rule, this would prove applicable to future studies with various sized packages. Dealing with proportions provides a more systematic process than using an arbitrary inch measurement. These inch measurements would not be applicable to future packages testing the same process. Proportional measurements are more accessible.
Figures 9-11: Minimum, Moderate, and Maximum Spacing.
This study will be a search task where the participant is asked to find a particular flavor of Pop-Tart brand. (e.g., S’mores flavor)
To randomize the events of various spacing we will systematically observe a new spacing arrangement each day at the three-day conference. Spacing will change once at the beginning of each day, remaining constant throughout the
chips
chips
chips
chips
soda
soda
soda
soda
snack food
snack food
snack food
snack food
cookies
cookies
cookies
cookies
cookies
cookies
cookies
cookies
pasta
pasta
pasta
pasta
olive oil
olive oil
olive oil
olive oil
coffee
coffee
coffee
coffee
detergent
detergent
detergent
detergent
grilling aprons
paper plates
plastic cups
paper towels
grilling untencilspop tarts
pop tarts
pop tarts
oatmeal/grits
cereal
cereal
cereal
cereal
27'-1"
19'-10"
3 41 2
BA
enter-exit
tobiisurvey
1A
3B
2
4
ENDCAP AISLE
ENDCAP AISLE
AISLE
AISLE
ente
r-ex
it
Figure 6: CUshopTM Vegas Axonometric View showing Product Placements
duration of the seven-hour period.
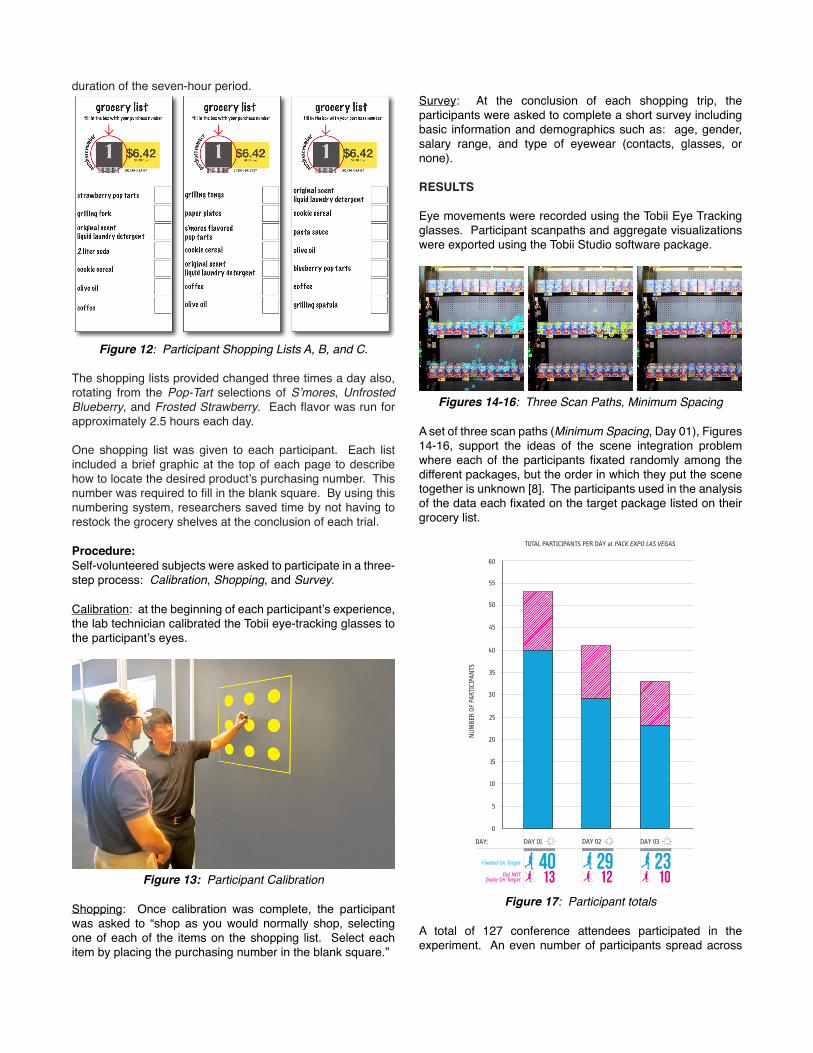
Figure 12: Participant Shopping Lists A, B, and C.
The shopping lists provided changed three times a day also, rotating from the Pop-Tart selections of S’mores, Unfrosted Blueberry, and Frosted Strawberry. Each flavor was run for approximately 2.5 hours each day.
One shopping list was given to each participant. Each list included a brief graphic at the top of each page to describe how to locate the desired product’s purchasing number. This number was required to fill in the blank square. By using this numbering system, researchers saved time by not having to restock the grocery shelves at the conclusion of each trial.
Procedure:Self-volunteered subjects were asked to participate in a three-step process: Calibration, Shopping, and Survey. Calibration: at the beginning of each participant’s experience, the lab technician calibrated the Tobii eye-tracking glasses to the participant’s eyes.
Figure 13: Participant Calibration
Shopping: Once calibration was complete, the participant was asked to “shop as you would normally shop, selecting one of each of the items on the shopping list. Select each item by placing the purchasing number in the blank square.”
Survey: At the conclusion of each shopping trip, the participants were asked to complete a short survey including basic information and demographics such as: age, gender, salary range, and type of eyewear (contacts, glasses, or none).
RESULTS
Eye movements were recorded using the Tobii Eye Tracking glasses. Participant scanpaths and aggregate visualizations were exported using the Tobii Studio software package.
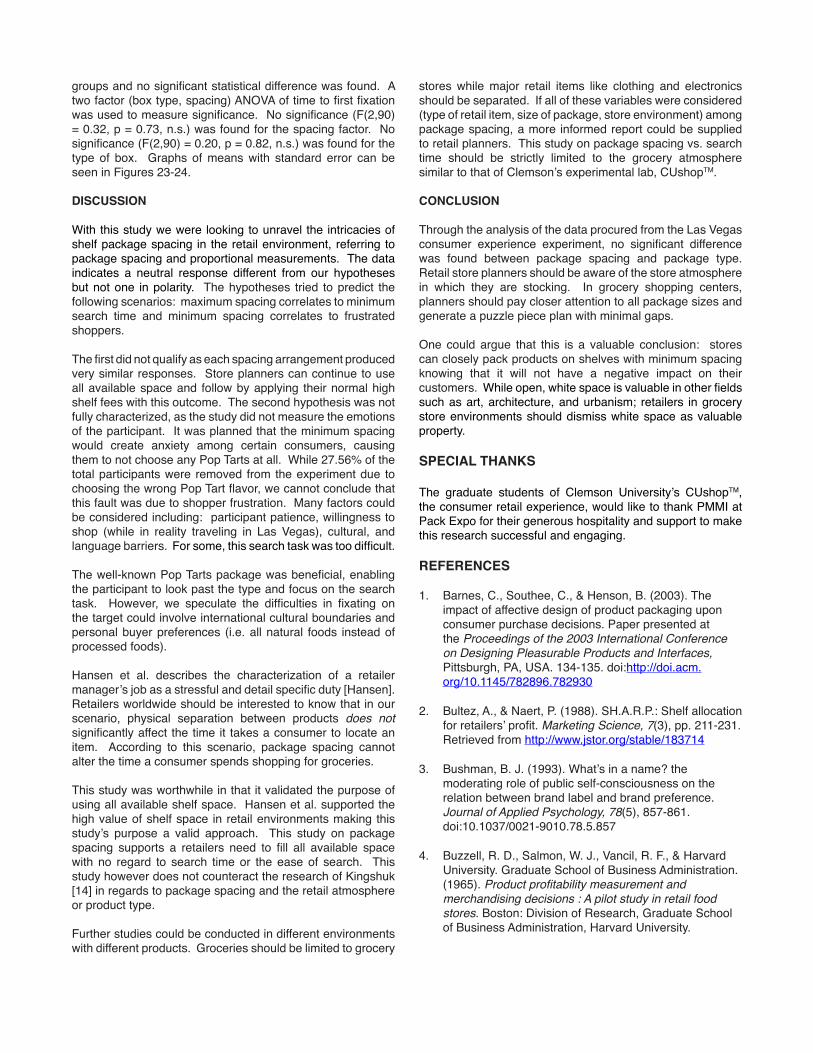
Figures 14-16: Three Scan Paths, Minimum Spacing
A set of three scan paths (Minimum Spacing, Day 01), Figures 14-16, support the ideas of the scene integration problem where each of the participants fixated randomly among the different packages, but the order in which they put the scene together is unknown [8]. The participants used in the analysis of the data each fixated on the target package listed on their grocery list.
DAY 01 DAY 02 DAY 03
0
DAY:
5
10
15
20
25
30
35
40
45
50
55
60
4013
2912
2310
TOTAL PARTICIPANTS PER DAY at PACK EXPO LAS VEGAS
Fixated On Target
Did NOTfixate On Target
NU
MB
ER O
F PA
RTIC
IPA
NTS
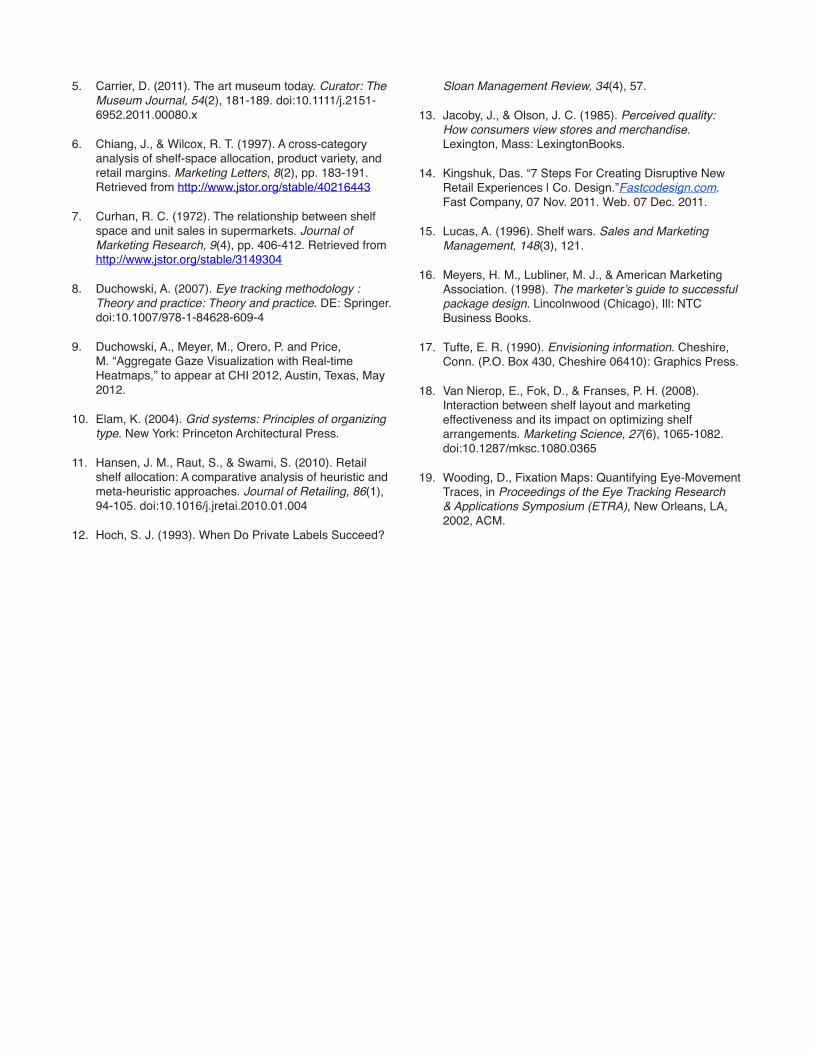
Figure 17: Participant totals
A total of 127 conference attendees participated in the experiment. An even number of participants spread across

the three-day event was strived to achieve however, maintaining an even number of participants proved difficult due to unexpected crowd flux and public interest. Day 01 gathered 53 subjects, Day 02 gathered 41 subjects, and Day 03 gathered 33 subjects. Percentages of 25% for Day 01, 29% for Day 02, and 30% for Day 03 were removed from the study because they never fixated on the target package (a total of 27.56% of participant data).
43 COUNTS
44 COUNTS
48 COUNTS
Figures 18-20: 3 heat maps
Aggregate visualizations were rendered for each of the days. Figures 18-20 highlight the group’s fixations in minimum spacing, moderate spacing, and maximum spacing respectively. The target package resides within the deep red shade, the highest topographic surface.
Figure 21-22: 3D prototypes
Parallel, horizontal lines can be seen and experienced with the heat maps. Chromatic visualizations are reimaged to black line drawings where increases in fixation densities can be viewed. Once color is void of the image and three dimensional heat maps are rendered in monochromatic prototypes, users can tactilely experience the visualizations of a large group (Figures 21-22). Duchowski et al. have studied different ways viewing heat maps through data visualization studies [9]. The single hues of the white 3D prototyped maps (Figures 21-22) combine the single hue research of Duchowski et al. [9] and the 3D space transformation studied by Wooding [19]. These heat maps encourage the history of the product placement but do not illustrate differences between package spacing. All can be understood and experienced through 2D visualizations, line density drawings, and 3D tangible prototypes.
DAY 01 DAY 02 DAY 03
0
1.0
2.0
3.0
4.0
5.0
6.0
MEAN TIME TO FIRST FIXATION ON TARGET
TIM
E [s
econ
ds]
DAY:
Figure 23: Time to First Fixation, Days 1-3
0
1.0
2.0
3.0
4.0
5.0
6.0
TIM
E [s
econ
ds]
MEAN TIME TO FIRST FIXATION ON TARGET
BOX 01 BOX 02 BOX 03BOX:
Figure 24: Time to First Fixation, Packages 1-3
The statistical difference was measured between the two
groups and no significant statistical difference was found. A two factor (box type, spacing) ANOVA of time to first fixation was used to measure significance. No significance (F(2,90) = 0.32, p = 0.73, n.s.) was found for the spacing factor. No significance (F(2,90) = 0.20, p = 0.82, n.s.) was found for the type of box. Graphs of means with standard error can be seen in Figures 23-24.
DISCUSSION
With this study we were looking to unravel the intricacies of shelf package spacing in the retail environment, referring to package spacing and proportional measurements. The data indicates a neutral response different from our hypotheses but not one in polarity. The hypotheses tried to predict the following scenarios: maximum spacing correlates to minimum search time and minimum spacing correlates to frustrated shoppers.
The first did not qualify as each spacing arrangement produced very similar responses. Store planners can continue to use all available space and follow by applying their normal high shelf fees with this outcome. The second hypothesis was not fully characterized, as the study did not measure the emotions of the participant. It was planned that the minimum spacing would create anxiety among certain consumers, causing them to not choose any Pop Tarts at all. While 27.56% of the total participants were removed from the experiment due to choosing the wrong Pop Tart flavor, we cannot conclude that this fault was due to shopper frustration. Many factors could be considered including: participant patience, willingness to shop (while in reality traveling in Las Vegas), cultural, and language barriers. For some, this search task was too difficult.
The well-known Pop Tarts package was beneficial, enabling the participant to look past the type and focus on the search task. However, we speculate the difficulties in fixating on the target could involve international cultural boundaries and personal buyer preferences (i.e. all natural foods instead of processed foods).
Hansen et al. describes the characterization of a retailer manager’s job as a stressful and detail specific duty [Hansen]. Retailers worldwide should be interested to know that in our scenario, physical separation between products does not significantly affect the time it takes a consumer to locate an item. According to this scenario, package spacing cannot alter the time a consumer spends shopping for groceries.
This study was worthwhile in that it validated the purpose of using all available shelf space. Hansen et al. supported the high value of shelf space in retail environments making this study’s purpose a valid approach. This study on package spacing supports a retailers need to fill all available space with no regard to search time or the ease of search. This study however does not counteract the research of Kingshuk [14] in regards to package spacing and the retail atmosphere or product type.
Further studies could be conducted in different environments with different products. Groceries should be limited to grocery
stores while major retail items like clothing and electronics should be separated. If all of these variables were considered (type of retail item, size of package, store environment) among package spacing, a more informed report could be supplied to retail planners. This study on package spacing vs. search time should be strictly limited to the grocery atmosphere similar to that of Clemson’s experimental lab, CUshopTM.
CONCLUSION
Through the analysis of the data procured from the Las Vegas consumer experience experiment, no significant difference was found between package spacing and package type. Retail store planners should be aware of the store atmosphere in which they are stocking. In grocery shopping centers, planners should pay closer attention to all package sizes and generate a puzzle piece plan with minimal gaps.
One could argue that this is a valuable conclusion: stores can closely pack products on shelves with minimum spacing knowing that it will not have a negative impact on their customers. While open, white space is valuable in other fields such as art, architecture, and urbanism; retailers in grocery store environments should dismiss white space as valuable property.
SPECIAL THANKS
The graduate students of Clemson University’s CUshopTM, the consumer retail experience, would like to thank PMMI at Pack Expo for their generous hospitality and support to make this research successful and engaging.
REFERENCES
1. Barnes, C., Southee, C., & Henson, B. (2003). The impact of affective design of product packaging upon consumer purchase decisions. Paper presented at the Proceedings of the 2003 International Conference on Designing Pleasurable Products and Interfaces, Pittsburgh, PA, USA. 134-135. doi:http://doi.acm.org/10.1145/782896.782930
2. Bultez, A., & Naert, P. (1988). SH.A.R.P.: Shelf allocation for retailers’ profit. Marketing Science, 7(3), pp. 211-231. Retrieved from http://www.jstor.org/stable/183714
3. Bushman, B. J. (1993). What’s in a name? the moderating role of public self-consciousness on the relation between brand label and brand preference. Journal of Applied Psychology, 78(5), 857-861. doi:10.1037/0021-9010.78.5.857
4. Buzzell, R. D., Salmon, W. J., Vancil, R. F., & Harvard University. Graduate School of Business Administration. (1965). Product profitability measurement and merchandising decisions : A pilot study in retail food stores. Boston: Division of Research, Graduate School of Business Administration, Harvard University.
5. Carrier, D. (2011). The art museum today. Curator: The Museum Journal, 54(2), 181-189. doi:10.1111/j.2151-6952.2011.00080.x
6. Chiang, J., & Wilcox, R. T. (1997). A cross-category analysis of shelf-space allocation, product variety, and retail margins. Marketing Letters, 8(2), pp. 183-191. Retrieved from http://www.jstor.org/stable/40216443
7. Curhan, R. C. (1972). The relationship between shelf space and unit sales in supermarkets. Journal of Marketing Research, 9(4), pp. 406-412. Retrieved from http://www.jstor.org/stable/3149304
8. Duchowski, A. (2007). Eye tracking methodology : Theory and practice: Theory and practice. DE: Springer. doi:10.1007/978-1-84628-609-4
9. Duchowski, A., Meyer, M., Orero, P. and Price, M. “Aggregate Gaze Visualization with Real-time Heatmaps,” to appear at CHI 2012, Austin, Texas, May 2012.
10. Elam, K. (2004). Grid systems: Principles of organizing type. New York: Princeton Architectural Press.
11. Hansen, J. M., Raut, S., & Swami, S. (2010). Retail shelf allocation: A comparative analysis of heuristic and meta-heuristic approaches. Journal of Retailing, 86(1), 94-105. doi:10.1016/j.jretai.2010.01.004
12. Hoch, S. J. (1993). When Do Private Labels Succeed?
Sloan Management Review, 34(4), 57.
13. Jacoby, J., & Olson, J. C. (1985). Perceived quality: How consumers view stores and merchandise. Lexington, Mass: LexingtonBooks.
14. Kingshuk, Das. “7 Steps For Creating Disruptive New Retail Experiences | Co. Design.”Fastcodesign.com. Fast Company, 07 Nov. 2011. Web. 07 Dec. 2011.
15. Lucas, A. (1996). Shelf wars. Sales and Marketing Management, 148(3), 121.
16. Meyers, H. M., Lubliner, M. J., & American Marketing Association. (1998). The marketer’s guide to successful package design. Lincolnwood (Chicago), Ill: NTC Business Books.
17. Tufte, E. R. (1990). Envisioning information. Cheshire, Conn. (P.O. Box 430, Cheshire 06410): Graphics Press.
18. Van Nierop, E., Fok, D., & Franses, P. H. (2008). Interaction between shelf layout and marketing effectiveness and its impact on optimizing shelf arrangements. Marketing Science, 27(6), 1065-1082. doi:10.1287/mksc.1080.0365
19. Wooding, D., Fixation Maps: Quantifying Eye-Movement Traces, in Proceedings of the Eye Tracking Research & Applications Symposium (ETRA), New Orleans, LA, 2002, ACM.