SHELBY COUNTY BOARD OF EDUCATION - TN … County BOE 6-30-1… · Management's Discussion and...
158
SHELBY COUNTY BOARD OF EDUCATION (A Component Unit of Shelby County, Tennessee) COMPREHENSIVE ANNUAL FINANCIAL REPORT For the Fiscal Year Ended June 30, 2013
Transcript of SHELBY COUNTY BOARD OF EDUCATION - TN … County BOE 6-30-1… · Management's Discussion and...

SHELBY COUNTY BOARD OF EDUCATION (A Component Unit of Shelby County, Tennessee)
COMPREHENSIVE ANNUAL FINANCIAL REPORT
For the Fiscal Year Ended June 30, 2013


SHELBY COUNTY BOARD OF EDUCATION
COMPREHENSIVE ANNUAL FINANCIAL REPORT
For the Fiscal Year Ended
June 30, 2013
Prepared by:
Shelby County Board Of Education
Department of Finance


SHELBY COUNTY BOARD OF EDUCATION
(A Component Unit of Shelby County, Tennessee)
June 30, 2013
TABLE OF CONTENTS
PAGE(S)
INTRODUCTORY SECTION
Letter of Transmittal .............................................................................................................. i
Board of Shelby County ....................................................................................................... viii
Shelby County Board of Education Organizational Chart .................................................... ix
FINANCIAL SECTION
Independent Auditors' Report .................................................................................................3
Management's Discussion and Analysis.................................................................................6
BASIC FINANCIAL STATEMENTS
Statement of Net Position .....................................................................................................23
Statement of Activities ..........................................................................................................24
Balance Sheet - Governmental Funds ...................................................................................25
Reconciliation of Balance Sheet - Governmental Funds to
the Statement of Net Position ...........................................................................................26
Statement of Revenues, Expenditures, and Changes in
Fund Balances - Governmental Funds .............................................................................27
Reconciliation of Statement of Revenues, Expenditures,
and Changes in Fund Balances - Governmental Funds ....................................................28
Schedule of Revenues, Expenditures, and Changes in Fund Balances -
Budget and Actual (Budgetary Basis) - General Fund .....................................................29
Statement of Net Position - Proprietary Fund .......................................................................30
Statement of Revenues, Expenditures, and Changes in
Net Position - Proprietary Fund .......................................................................................31
Statement of Cash Flows - Proprietary Fund ........................................................................32
Statement of Fiduciary Net Position .....................................................................................33
Notes to the Financial Statements .........................................................................................34
REQUIRED SUPPLEMENTARY INFORMATION
Schedule of Funding Progress – Defined Benefit Plan .........................................................63
Schedule of Funding Progress – Other Post Employment Benefits Plan..............................63
SUPPLEMENTAL INFORMATION
Schedule of Revenues and Expenditures - By Type (Budgetary Basis) -
Federal Projects Funds .....................................................................................................66
Combining Fiduciary Funds - Statement of Changes in Net Position and Liabilities ...............68

Schedule of Construction In Progress ........................................................................................69
STATISTICAL SECTION (UNAUDITED)
Overview ....................................................................................................................................73
Financial Trends Net Position by Component ........................................................................................... 76 - 77
Revenue Capacity
Assessed Value and Estimated Actual Value of Taxable Property ................................ 80 - 81
Property Tax Rates and Levies ....................................................................................... 82 - 83
Principal Property Tax Payers – Current Year and Nine Years Ago ............................. 84 - 85
Demographic and Economic Information Demographic and Economic Statistics ...............................................................................89
Principal Employers – Current Year and Nine Years Ago ............................................ 90 - 91
Operating Information Summary of Buildings and Sites .................................................................................. 94 - 117
Weighted Full-time Average Daily Attendance ................................................................118
Staff by Type .....................................................................................................................119
Schedule of Surety Bonds .................................................................................................120
Graduation Information .....................................................................................................121
School Lunch Program ............................................................................................... 122 - 123
Pupil Transportation ................................................................................................... 124 - 125
STATUTORY REPORTING SECTION
Schedule of Expenditures of Federal and State Awards ............................................... 128 - 129
Notes to the Schedule of Expenditures of Federal and State Awards ........................... 130 - 131
Independent Auditors’ Report on Internal Control Over Financial Reporting
and on Compliance and Other Matters Based on an Audit of the
Financial Statements Performed in Accordance With
Government Auditing Standards ................................................................................ 132 - 133
Independent Auditors' Report on Compliance For Each Major Program
and on Internal Control Over Compliance Required by OMB Circular A-133 ......... 134 - 136
Schedule of Findings and Questioned Costs ................................................................. 138 - 139

Introductory Section

This page intentionally left blank

i
Shelby County Schools offers educational and employment opportunities without regard to race, color, religion, sex, creed, age, disability, national origin, or genetic information.
160 S. Hollywood Street • Memphis, TN 38112 • (901) 416-5300 •
www.SCBOEk12.org
November 20, 2013
Superintendent and School Board
Shelby County Board of Education
Shelby County, Tennessee
State law requires that every general purpose local government publish, within six months of the
close of each fiscal year, a complete set of audited financial statements. This report is published
to fulfill that requirement for the fiscal year ended June 30, 2013.
Management assumes full responsibility for the completeness and reliability of the information
contained in this report, based upon a comprehensive framework of internal control that it has
established for this purpose. Because the cost of internal control should not exceed anticipated
benefits, the objective is to provide reasonable, rather than absolute, assurance that the financial
statements are free of any material misstatements.
Watkins Uiberall, PLLC and Banks, Finley, White & Co., Certified Public Accountants, have
issued an unmodified (“clean”) opinion on the Shelby County Board of Education’s financial
statement for the year ended June 30, 2013. The independent auditor’s report is located at the
front of the financial section of this report.
Management’s discussion and analysis (MD&A) immediately follows the independent’s
auditor’s report and provides a narrative introduction, overview, and analysis of the basic
financial statements. MD&A complements this letter of transmittal and should be read in
conjunction with it.
PROFILE OF THE SHELBY COUNTY BOARD OF EDUCATION
The Shelby County Board of Education is the fourth largest school system in Tennessee. The
Shelby County Schools (SCBOE) District includes all the public schools in the county –
including those inside and outside the corporate limits of the city of Memphis, and the schools
located within the six (6) incorporated towns of Arlington, Bartlett, Collierville, Germantown,
Lakeland, and Millington. The enrollment for the 2012-13 school year was 45,912 students in
grades K-12 and charter schools. With the merger with the former Memphis City Schools, the
SCBOE enrollment is projected to be 148,275 in FY 2013-14. The student demographics as of

ii
Shelby County Schools offers educational and employment opportunities without regard to race, color, religion, sex, creed, age, disability, national origin, or genetic information.
the 2012-13 school year were: 50.5 percent Caucasian, 38.1 percent African-American, 2.7
percent Asian / Pacific Islander, 2.7 percent Hispanic and 6 percent other. The District had a
composite ACT score of 20.7 compared to the State’s average of 19.1. The Shelby County
Board of Education’s 2013 graduation rate was 88 percent compared to the State’s rate of 86.3.
The Shelby County Board of Education is a component unit of Shelby County Government,
which is defined as the oversight entity by GASB Codification Section 2100. Reporting for the
SCBOE follows the criteria established by the Governmental Accounting Standards Board
(GASB). During FY 2013 the District was governed by the 23 member Shelby County Board of
Education. The Board members elected a member to serve as President and a member to serve
as Vice President of the Board for a one-year term.
PROFILE OF SHELBY COUNTY
Shelby County is located on the southwest corner of Tennessee, at the east bank of the
Mississippi River. Shelby is the State’s largest county with the City of Memphis as the county
seat. The corporate limits contain 783 square miles and include seven incorporated
municipalities: Arlington, Bartlett, Collierville, Germantown, Lakeland, Memphis and
Millington. The County’s 2010 population was 935,088 with the 2012 population estimated at
940,764, according to the U.S. Census Bureau. The County is empowered to levy, without limit,
a property tax on both real and personal property located within its boundaries.
Shelby County was incorporated in 1819. It currently operates under the Mayor-Commission
style of government with the Mayor as chief executive officer. The Mayor oversees the
operations of the County’s six divisions. The thirteen members of the Shelby County Board of
Commissioners - as the legislative branch of government - reviews and approves county
programs and budgets. The Mayor and each Commissioner serve four-year terms. The Assessor,
Circuit Court Clerk, County Clerk, Criminal Court Clerk, General Sessions Court Clerk, Juvenile
Court Clerk, Probate Court Clerk and Sheriff are also elected to four-year terms.
The major areas of employment in the Memphis Metropolitan Statistical Area (with the major
component being Shelby County) are the Trade, Transportation and Utilities sector, Educational
and Health Services sector, and the Government sector, according to the Tennessee Department
of Labor and Workforce Development. The County – as part of the Memphis MSA - is a major
wholesale and retail center for west Tennessee, northern Mississippi and eastern Arkansas.
According to the United States Department of Labor, the unemployment rate for Shelby County
as of August 2013 was 9.7 percent, an increase from the August 2012 rate of 9.0%, as compared
to the state’s rate of 8.5 percent and the national rate of 7.3 percent.
Based on the most recent (September, 2013) report prepared by the Eighth Federal Reserve
District on economic conditions in the Memphis area at the close of July, 2013, the annual
growth of employment, building permits and housing prices was .9 percent, 23.6 percent, and 3.5
percent in the Memphis Statistical Area (MSA) and 1.6 percent, 25.4 percent and 11.6 percent in
the nation, respectively. At the same time, the annual growth of personal income was 1.6 percent
in Tennessee and 2.0 percent in the nation. After remaining above 1.25 percent during most of

iii
Shelby County Schools offers educational and employment opportunities without regard to race, color, religion, sex, creed, age, disability, national origin, or genetic information.
2011 and 2012, employment growth in the Memphis zone has slowed to less than 1 percent
during the first two quarters of 2013. Net job losses in the trade, transportation and utilities sector
- as well as the government sector- have been the key drivers of this trend. Slow employment
growth has resulted in a noticeable increase in local unemployment rates; the unemployment rate
in Memphis (9.4 percent) was higher than the nation’s (7.6 percent). Based on the above, the
Memphis MSA has generally under-performed the nation.
With the exception of the third quarter of 2010, Memphis’ recession-related decline in
employment – centered at approximately January 2009 – was similar to the nation’s decline. The
state of Tennessee lost about 220,000 jobs in the economic downturn; Memphis lost 60,000. The
state recouped one-fourth of its jobs, with Memphis recovering about one-sixth.
Measured against a year earlier (July 2012), total nonfarm employment only rose by .9 percent in
the Memphis zone. However, this increase is notable considering that employment declined in
sectors with high percentages of labor. For example, the Trade, Transportation and Utilities
(TTU) sector - which accounts for more than 27 percent of all jobs in Memphis – had a decline
and the Government sector – which accounts for more than 14% of all jobs- also experienced a
decline. The other sectors with the largest numbers of jobs in Memphis have seen stronger
employment gains, helping to offset the modest declines in TTU and Government employment.
For example, in comparison to a year earlier, payrolls have expanded by 3.5 percent in Education
and Health, by 2.5 percent in Professional and Business Services, by 1.9 percent in
Manufacturing and by 4.5 percent in Natural Resources, Mining and Construction. Overall, the
employment picture has improved slightly since June 2012.
For several quarters before the national recession, which started in 2007, personal income growth
in Tennessee was roughly the same as the nation. Between the first quarter of 2012 and the first
quarter of 2013, personal income grew 1.6 percent in Tennessee, compared with 2 percent in the
nation.
Relative to the same period last year, housing activity in the Memphis Zone has been strong. The
number of building permits issued in the Memphis Zone during the first six months of 2013 was
23.6 percent higher than the number issued during the same period in 2012. In comparison,
national housing activity grew by 25.4 percent.¹
On the manufacturing side, a majority of national industrial manufacturers forecast revenue
growth for 2013, and the overall sentiment is one of optimism towards the U.S. and global
economies. According to a recent report by Price Waterhouse Coopers, a majority of
manufacturers report that from October 2012 to October 2013, margins remained flat, inventories
fell and concerns grew about legislative/regulatory pressures as a barrier to growth. In addition,
Price Waterhouse Cooper’s “Q3 2013 Manufacturing Barometer” report cited that for those
manufacturers selling abroad, the expected contribution to total revenue from international sales
over the next 12 months was slightly off from 38 percent last year to 32 percent this year. The
¹Current Economic Conditions in the Eighth Federal Reserve District Memphis Zone, Third Quarter 2013

iv
Shelby County Schools offers educational and employment opportunities without regard to race, color, religion, sex, creed, age, disability, national origin, or genetic information.
projected average growth rate for overall revenues dropped slightly from a 4.6 percent estimate
for 2013 to a 4.2 percent estimate for 2014.
Manufacturing industry health is critical to the Memphis area because it represents 45,400
employees or 7.5 percent of the workforce, according to August 2013 data from the Tennessee
Department of Labor and Workforce Development in its “Labor Market Report.”
EDUCATIONAL PROGRAMS
The Shelby County Board of Education has made an extensive commitment to quality
instruction. SCBOE proudly celebrates the numerous achievements of excellence by students
and staff in academics, athletics, and service on local, state, and national levels. Money
Magazine has recognized the Shelby County Board of Education as one of the “Top 100 School
Systems” in the United States. For nine consecutive years, SCBOE has been honored by School
Match, Inc. with the “What Parents Want Award.” The SCBOE Board, a past recipient of the
TSBA Board of the Year, has received the Board of Distinction for the last ten years.
Highlights:
In July 2010, SCBOE was awarded Race to the Top funds to be used over four years in
strategic areas of systemic reform, with emphasis on professional development and
leadership. Driven by the District’s commitment to academic excellence and quality
education for all, the system has implemented several reforms including Professional
Learning Communities (PLC), online professional development training, Learning
Coaches to mentor new teachers, the Aspiring Administrator Academy, and strengthening
partnerships with local universities and colleges to assist in the growth of new and
aspiring administrators.
Another major initiative that supports the district focus on personnel is the opening of
two Family Care Centers through a partnership with Methodist LeBonheur Healthcare.
These facilities are readily available for SCBOE employees and immediate family
members who need urgent, non-emergency medical attention during the workday. The
clinic also provides vaccinations, preventive treatments, health screenings, and pharmacy
services, all at no cost to the employee. .
Community partnerships are valuable resources for the Shelby County Board of
Education. SCBOE is enriched with a number of cooperatives. The SCBOE Fine Arts
Academy for middle and high school students is supported through a collaboration with
the Memphis Symphony Orchestra, the Metal Museum, Memphis College of Arts,
University of Memphis, and Christian Brothers University.

v
Shelby County Schools offers educational and employment opportunities without regard to race, color, religion, sex, creed, age, disability, national origin, or genetic information.
The Shelby Scholars Summer Institute, a part of an ongoing SCBOE STEM (science,
technology, engineering and math) initiative, partners with an array of educational and
STEM-based institutions including the University of Memphis FedEx Institute of
Technology, Center for Earthquake Research and Information (CERI), Ground Water
Research, Millington Naval Base, Memphis Academy of Science and Engineering, IBM,
and the Navy League.
SCBOE will break ground on two new middle schools (New Elmore Park and New
Collierville Middle).
One of 10 of Tennessee’s 136 school systems to earn all “A’s” in Academic Achievement
on the 2010 TN Report Card.
One high school on Newsweek’s “America’s Best High School” list and two on
Washington Post’s “High School Challenge Award” list.
As reflected in the Shelby County Board of Education’s 2008-2013 Strategic Plan and with the
correlation of the January 2011 Transition plan by the Transition Planning Commission, five
general goals, each with a specific focus and one or more objectives and action steps, were
identified as integral parts of the Shelby County Schools District plan to improve student
achievement, communication, facilities, staff development, and advocacy through legislation.
The goals established by the Shelby County Board of Education were as follows (some of the
due dates have expired):
Goal 1: Student Achievement — Provide a curriculum with rigor, relevance, and relationships
that leads to greater preparation for careers, higher education, and responsible citizenship.
Improve student achievement by increasing the number of core courses taught by highly
qualified teachers to 100% by June 30, 2012. Comply with No Child Left Behind (NCLB)
requirements that will enable teachers to provide a curriculum with rigor and relevance. To
ensure that 96.7% of core classes are taught by Highly Qualified Teachers. Improve core subject
test results in reading/language arts and math so that 100% of students will score Proficient or
Advanced by 2014. Increase proficiency in Science and Social Studies by 2% each year. By
2013, provide a curriculum framework that promotes rigor, relevance, and relationship through
Academic, Technical, International, Financial, and Physical and Emotional Literacy. Increase
value added gains by 1% each year.
Goal 2: Communication — To establish and maintain communication among all Shelby County
Board of Education staff, students, community leaders and stakeholders. Continue the following
key communication points: monthly superintendent meetings with the Shelby County Education
Association (SCEA) and the Tennessee Education Association (TEA); Superintendent’s PTA
Roundtable; and Student/Parent Handbook. Identify, seek, and support strategies to increase the
SCBOE per pupil expenditure to the state average or higher by June 30, 2012.

vi
Shelby County Schools offers educational and employment opportunities without regard to race, color, religion, sex, creed, age, disability, national origin, or genetic information.
Goal 4: Staff Development — To recruit and retain high quality employees through competitive
salaries and benefits packages while providing a comprehensive support system. Maintain
continuous staff development with Professional Learning Communities; Teacher Leadership
opportunities (PLTSs, PIT Crew, Learning Coaches, Formative Assessment Trainers, D-VALT).
Comply with NCLB requirements that will enable teachers to provide a curriculum with rigor
and relevance. Ensure that 96.7% of core classes are taught by Highly Qualified Teachers.
Goal 5: Advocacy through legislation — To develop and implement a legislative agenda to
reflect the needs of the school and community while preparing students for the future. Continue
to support active SCEA participation, robust PTA membership, monthly open board meetings,
and consolidated planning committee meetings. Improve student performance by decreasing
student behavioral referrals and student suspensions by 1% or more each school year by 2014.
FINANCIAL INFORMATION
The SCBOE ended the FY with total net position of $187.5 million, a decrease of approximately
$53 million from FY 2012.
Fund Accounting
SCBOE reports its financial activities through the use of fund accounting. This is a system
wherein transactions are reported in self-balancing sets of accounts to reflect the results of
activities. (See note 1 of the Notes to the Basic Financial Statements for a summary of significant
accounting policies and a description of fund types).
LONG-TERM FINANCIAL PLANNING
The financial position of the Shelby County Board of Education remains stable as a result of the
District’s conservative budgeting methodology and its ability to maintain disciplined spending
practices. To ensure the District’s spending remains sound, SCBOE has implemented and
continues to explore new opportunities for cost savings, cost avoidance and revenue generation.
The District has not developed a long-term financial plan because it was, by law, scheduled to
merge with Memphis City Schools effective with the FY 2013-14 school year. In conjunction
with the merger, the Shelby County Board of Education worked with the former Memphis City
Schools, and the Transition Steering Committee of the Transition Planning Commission to
explore functional and financial consolidation opportunities that will lead to a long-term
financial plan for the Unified SCBOE.

vii
Shelby County Schools offers educational and employment opportunities without regard to race, color, religion, sex, creed, age, disability, national origin, or genetic information.
Acknowledgments: The preparation of this report was accomplished through the commitment,
dedication, and tireless effort of the entire Department of Finance. We would also like to extend
our thanks to other SCBOE and non-SCBOE personnel who assisted in the preparation of this
report.
Respectfully submitted,
Dorsey E. Hopson, II Esq. Alicia J. Lindsey, CPA Teresa K. Winter, CPA
Superintendent of Schools Interim Chief Financial Officer Director, Accounting &
Reporting

This page intentionally left blank

viii
SHELBY COUNTY BOARD OF EDUCATION
COMMISSIONER DISTRICT TERM EXPIRATION
William “Billy” Orgel, Chairman District 7 (Elected) 8/31/2014
Teresa D. Jones, Vice-Chairman District 2 (Elected) 8/31/2016
Christopher Caldwell District 1 (Elected) 8/31/2014
Dr. Snowden Carruthers District 1 (Elected) 8/31/2013
Ernest L. Chism District 7 (Elected) 8/31/2013
Joseph A. Clayton District 4 (Elected) 8/31/2013
Stephanie Gatewood District 1 (Elected) 8/31/2013
Diane L. George District 6 (Elected) 8/31/2013
Mary Anne Gibson District 5 (Appointed) 8/31/2013
Tomeka R. Hart District 7 (Elected) 8/31/2013
Martavius D. Jones District 4 (Elected) 8/31/2013
Sara L. Lewis District 6 (Elected) 8/31/2013
Dr. Oscar Love District 3 (Appointed) 8/31/2013
Betty J. Mallott District 2 (Elected) 8/31/2013
David A. Pickler District 5 (Elected) 8/31/2014
Reginald Porter, Jr. District 6 (Elected) 8/31/2016
David Reaves District 3 (Elected) 8/31/2014
Patrice Jordan Robinson District 3 (Elected) 8/31/2013
Dr. Jeff S. Warren District 5 (Elected) 8/31/2013
Dr. Kenneth T. Whalum, Jr. At-Large Position 2 (Elected) 8/31/2013
Dr. Freda Williams At-Large Position 1 (Elected) 8/31/2013
Mike Wissman District 2 (Elected) 8/31/2013
Kevin Woods District 4 (Elected) 8/31/2016

ix
SHELBY COUNTY BOARD OF EDUCATION
ORGANIZATIONAL CHART
June 30, 2013
Board of Commissioners
Superintendent
Dorsey E. Hopson, II, Esq.
General Counsel Valerie Speakman
Chief Financial Officer
Anita Hays
Assistant Superintendent of Teaching and Learning
Laura Link
Assistant Superintendent, Accountability and Transition
Dr. Timothy Setterlund
Chief of Operations
Mike Simpson
Assistant Superintendent of Human Resources
Lois Williams
Assistant Superintendent of Student Services
Herchel Burton
Executive Director of Curriculum and Instruction
Michael Lowe
Executive Director of Exceptional Children
Martha Redding
Chief of Staff
David Stephens

Financial Section

- 3 -

- 4 -

- 5 -

- 6 -
SHELBY COUNTY BOARD OF EDUCATION
(A Component Unit of Shelby County, Tennessee)
Management's Discussion and Analysis
For the Year Ended June 30, 2013
INTRODUCTION
The discussion and analysis of the Shelby County Board of Education’s (“Shelby County Board
of Education” or “SCBOE”) financial performance provides an overview of SCBOE’s financial
activities for the fiscal year ended June 30, 2013. The intent of this management discussion and
analysis is to look at SCBOE’s financial performance as a whole; readers should also review the
transmittal letter, financial statements and notes to the financial statements to enhance their
understanding of SCBOE’s financial performance.
The Management’s Discussion and Analysis (MD&A) is an element of the reporting model
adopted by the Governmental Accounting Standards Board (GASB) in their Statement No. 34,
Basic Financial Statements—and Management’s Discussion and Analysis—for State and Local
Governments, issued June 1999. Certain comparative information between the current year and
the prior year is required to be presented in the MD&A.
FINANCIAL HIGHLIGHTS
Key financial highlights for the fiscal year ended June 30, 2013 are as follows:
Total net position decreased from $240.5 million in 2012 to $187.5 million in 2013,
primarily due to the recording of the long-term liability for OPEB future payments. This
long-term liability increased from $209.4 million in 2012 to $237.6 million in 2013.
Total revenue decreased from $439.8 million in 2012 to $408.4 million in 2013, a
decrease of $31.4 million. Several things contributed to this, including the decrease in
Local option and State sales tax $5.4 million, Other state revenue $1.3 million, Title I
funding $1.6 million and School Reimbursement $2 million.
Total expenditures decreased from $478.5 million in 2012 to $454.9 million in 2013, a
decrease of $23.6 million primarily due to lower instructional costs and student activities.
Ending governmental fund balances of SCBOE decreased from $40.1 million in 2012 to
$22.9 million in 2013, a decrease of $17.2 million primarily due to the use of the reserve
to balance the General Fund Budget.

- 7 -
OVERVIEW OF FINANCIAL STATEMENTS
This discussion and analysis is intended to serve as an introduction to SCBOE’s basic financial
statements. The basic financial statements comprise three components: 1) government-wide
financial statements, 2) fund financial statements, and 3) notes to the financial statements. This
report also contains other supplementary information in addition to the basic financial
statements. The following graphic summarizes the components of the report:
Government-wide financial statements
The government-wide financial statements are designed to provide readers with a broad
overview of SCBOE’s finances in a manner similar to a private-sector business.
The Statement of Net Position provides information on the assets, deferred outflows of
resources, liabilities and deferred inflows of resources of the whole school district. Net position
is the difference between the District’s total assets and deferred outflows of resources and total
liabilities and deferred inflows of resources, using the accrual basis of accounting used by most
private sector companies. Over time, increases or decreases in net position may serve as a useful
indicator of whether the financial position of the system is improving or diminishing,
respectively.
The Statement of Activities presents information showing how net position changed during the
fiscal year. All changes in the net position are reported as soon as the underlying event giving
rise to the change occurs, regardless of the timing of the related cash flows. Thus, revenues and
expenses are reported in the statement for some items that will result in cash flows in future
fiscal periods (e.g., uncollected taxes and earned but not used vacation leave).
Fund financial statements
A fund is a grouping of related accounts. Funds are used to maintain control over resources that
have been segregated for specific activities or objectives. Shelby County Board of Education,
like other state and local governments, uses fund accounting to ensure and demonstrate
compliance with finance-related legal requirements. The school district uses many funds to
account for a multitude of financial transactions. All of the funds of Shelby County Board of
Education can be divided into three categories: governmental funds, proprietary funds, and
fiduciary funds. These fund financial statements focus on the school district’s most significant
funds.
Management’s
Discussion
And
Analysis
Government-Wide
Financial Statements
Fund Financial
Statements
Notes to the Basic
Financial Statements
Other
Required
Supplementary
Information

- 8 -
Governmental funds
Most of the school district’s activities are reported in governmental fund financial statements.
These statements focus on how monies flow into and out of those funds and the balances left at
year-end that are available for spending in the future periods. These funds are reported using an
accounting method called modified accrual accounting, which measures cash and all other
financial assets that can readily be converted to cash. The governmental fund statements provide
a detailed short-term view of the school district’s general government operations and the basic
services it provides. Governmental fund information helps one determine whether there are more
or less financial resources that can be spent in the near future to finance educational programs.
Because the focus of governmental funds is narrower than that of the government-wide financial
statements, it is useful to compare the information presented for governmental funds with similar
information presented for governmental activities in the government-wide financial statements.
By doing so, readers may better understand the long-term impact of the government’s near-term
decisions. Both the governmental funds balance sheet and the governmental funds statement of
revenues, expenditures, and changes in fund balances provide a reconciliation to facilitate this
comparison between governmental funds and governmental activities.
Shelby County Board of Education maintains four governmental funds. Information is presented
separately in the governmental fund balance sheet and the governmental fund statement of
revenues, expenditures, and changes in fund balances for the General Fund, Capital Projects
Fund and Categorically Aided Fund. The Federal Projects Fund is comprised of two categories –
federal and non-federal. Shelby County Schools adopts an annual appropriated budget for all its
funds. Budgetary comparison statements have been provided to demonstrate compliance with
budget.
Proprietary Funds. Shelby County Board of Education maintains one type of proprietary fund,
the Internal Service Fund. Internal Service Funds are an accounting device used to accumulate
and allocate costs internally for its health self-insurance and unemployment benefits. Because
these services predominately benefit governmental rather than business-type functions, they have
been included within governmental activities in the government-wide financial statements.
Fiduciary Funds. Fiduciary funds (or Trust and Agency Funds) are used to account for
resources held for the benefit of parties outside the government. Fiduciary funds are not
reflected in the government-wide financial statements because the resources of those funds are
not available to support the school district’s own programs. Shelby County Board of Education
holds the Student Activity funds in a fiduciary capacity.
Notes to the financial statements
The notes provide additional information that is essential to a full understanding of the data
provided in the government-wide and fund financial statements.

- 9 -
Supplemental Information. In addition to the basic financial statements and accompanying
notes, this report also presents certain required supplementary information regarding funding
progress for retirement and other post-retirement benefits.
Government-wide financial analysis (amounts expressed in millions of dollars)
The Statement of Net Position for 2013 has been summarized and compared with net position for
2012. As noted earlier, net position may serve over time as a useful indicator of a government’s
financial position. The school district’s assets, as a whole, exceeded liabilities at June 30, 2013
and 2012 by $187.5M and $240.5M, respectively.
2013 2012 Difference % Change
Assets:
Current and other assets $ 57.2 $ 80.6 $ (23.4) (29.0)%
Capital assets 395.8 402.0 (6.2) (1.5)%
Total Assets 453.0 482.6 (29.6) (6.1)%
Liabilities:
Long-term liabilities 237.6 209.4 28.2 13.5%
Other liabilities 27.9 32.7 (4.8) (14.7)%
Total Liabilities 265.5 242.1 23.4 9.7%
Net Position:
Net investments in capital assets 395.8 402.0 (6.2) (1.5)%
Restricted 17.3 25.5 (8.2) (32.2)%
Unrestricted (225.6) (187.0) (38.6) 20.6%
Total Net Position $ 187.5 $ 240.5 $ (53.0) (22.0)%
Capital assets (e.g., land, buildings, machinery, equipment and construction in progress) are the
largest portion (87.37%) of the total assets. These assets are not available for future spending.
The value of the on-going construction of new schools or renovation of existing facilities
accounts for 2.03% of the capital assets. Total debt (including post-employment benefits and
compensating absences) owed by the school district is 89.49% of total liabilities with 100% of
the debt due after one year.
See next page

- 10 -
Governmental Activities. Governmental activities during fiscal year 2013, coupled with a prior
period adjustment of the beginning balance, decreased the school district’s net position by
$52,974,577 or 22.03% of total net position as compared to a decrease of $38,675,532 or 13.85%
during fiscal year 2012. The primary factor for the decrease can be attributed to the accounting
requirements of the Governmental Accounting Standards Board (GASB) No. 45 requiring the
recognition of actual and long-term expenditures for post-employment benefits.
Changes in Net Position From Operating Results (amounts expressed in millions of dollars)
2013 2012 Difference % Change
Governmental Activities
Program Revenues:
Operating grants and
contributions
$ 220.1
$ 199.2
$ 20.9
10.5%
Charges for services 29.7 65.6 (35.9) (54.7)%
General Revenues:
Shelby County taxes 120.4 113.3 7.1 6.3%
Local option and state taxes 36.2 42.4 (6.2) (14.6)%
Other 2.0 19.3 (17.3) (89.6)%
Total Revenues 408.4 439.8 (31.4) (7.1)%
Expenses:
Instruction 278.7 285.4 (6.7) (2.3)%
Support services 58.6 66.5 (7.9) (11.9)%
Administration 49.5 44.1 5.4 12.2%
Plant Operations & maintenance 29.5 29.5 - - %
Transportation 17.4 18.5 (1.1) (5.9)%
Food services 20.4 19.8 0.6 3.0%
Student activities 0.8 14.7 (13.9) (94.6)%
Total Expenses 454.9 478.5 (23.6) (4.9)%
Increase (Decrease) in Net Position (46.5) (38.7) (7.8) 20.2%
Net Position - Beginning of Year 240.5 279.2 (38.7) (13.9)%
Prior period adjustment (6.5) - (6.5) - %
Net Position - Beginning of Year, restated $ 234.0 $ 279.2 $ (45.2) (16.2)%
Net Position - End of Year $ 187.5 $ 240.5 $ (53.0) (22.0)%
Revenues
Total revenue decreased $31.4 million, or 7.1%, in 2013. $13.6 million is due to moving Student
Activity Fund to Fiduciary Fund - Agency.

- 11 -
Expenses
Total expenditures decreased from $478.5 million in 2012 to $454.9 million in 2013, a decrease
of $23.6 million due to lower instructional costs and student activities.
Governmental Activities (amounts expressed in millions of dollars)
Total Cost of Services Net Cost of Services
2013
2012
Percentage Change
2013
2012
Percentage Change
Instructional programs $ 278.7 $ 285.4 (2.3)% $ 56.1 $ 55.5 1.1%
Support services 58.6 66.5 (11.9)% 55.4 63.9 (13.3)% General administration 49.5 44.1 12.2% 49.0 43.7 12.1%
Operations and maintenance
of plant
29.5
29.5
- %
26.5
29.1
(8.9)% Student transportation 17.4 18.5 (5.9)% 16.5 17.8 (7.3)%
Food Services 20.4 19.8 3.0% 1.3 3.1 (58.1)%
Student activities 0.8 14.7 (94.6)% 0.3 0.6 0.0%
Total Expenses $ 454.9 $ 478.5 (4.9)% $ 205.1 $ 213.7 (4.0)%
The net costs of governmental activities shown above presents the total and net cost of seven
major Shelby County Board of Education activities: instruction, support services, general
administration, plant operations and maintenance, transportation, food services, and student
activities.
Net cost of services is the total cost less fees generated by the activities and intergovernmental
revenue provided for specific programs. The net cost shows the financial burden on the County’s
taxpayers by each activity. The total cost of governmental services in 2013 was $454.9 million.
Federal and State grants, subsidized programs, and contributions financed $249.8 million of the
cost. The district and state taxpayers financed the remainder of Shelby County Board of
Education’s cost, which was $205.1 million for 2013.
The statement of activities reflects the cost of program services and the charges for those
services in addition to grants and contributions offset by those services. The following chart of
governmental activities shows the total cost of services with the revenues directly supporting the
services.
See next page

- 12 -
Instructional expenses include activities directly linked to the teaching of pupils and the
interaction between the teacher and pupil. The components include regular, exceptional
children, alternative, vocational and adult instruction.
Support services includes the activities assisting students in technical services (such as
library, guidance, health, and alternative choices) and providing a safe school
environment.
General administration includes the Board of Education and Office of the Superintendent.
Activities are centered on establishing and administering policy for operating the LEA.
Other general services include commission fees assessed by the County Trustee for tax
collection; external audit and legal services; and administrative supervision of the District
and communications.
$0 $100 $200 $300
Food service
Student activities
Operation and maintenance of plant
Student transportation
General administration
Support services
Instructional programs
Amount (millions)
Program Revenues and Expenses - Governmental Activities
Expenses Revenues

- 13 -
Student transportation includes activities involved with the conveyance of students for
regular, vocational and special educational instruction to and from school, as well as
school activities, as provided by state and federal law.
Operation and maintenance of plant services supports keeping of the school grounds,
buildings, and equipment in an effective working condition and state of repair.
Food service includes the preparation, delivery, and servicing of lunches, snacks and
other incidental meals to students and school staff in connection with school activities.
A major portion of the general revenues is not included above because the revenues are not
directly identified as supporting a unique or specific activity. Instead, these revenues are general
in their support for all activities. General revenues are primarily comprised of local tax revenues
provided to support education as a whole. In contrast, State Basic Education Program and
federal programs are directly supportive of specific activities. The dependence upon general tax
revenues from the community for all governmental activities is clear. General tax revenues
support 29.01% of the governmental activities. A breakdown of revenues by source is presented
below.
Food service4.67% Operation and
maintenance of plant0.75%
Student transportation0.22%
General administration
0.13%
Support services0.79%
Instructional programs54.61%
Shelby County29.48%
Local option and state sales taxes
8.87%
Other local sources0.48%
Revenues by Program - Governmental Activities

- 14 -
Financial Analysis of Shelby County Board of Education Funds
The combined fund balance of all governmental funds was $22.9 million. Approximately
19.02% of the total fund balance is unassigned. The remainder of the fund balance is either
nonspendable or restricted for future specific spending. As noted earlier, Shelby County Board of
Education uses fund accounting to ensure and demonstrate compliance with finance-related legal
requirements.
Governmental Funds. The focus of Shelby County Board of Education’s governmental funds is
to provide information on near-term inflows, outflows, and balances of spendable resources.
Such information is useful in assessing the school district’s financing requirements. In
particular, unassigned fund balance may serve as a useful measure of a government’s net
resources available for spending at the end of the fiscal year.
There was a $10.8 million decrease in fund balance for all funds that included a $10.4 million
reduction in the general fund. The decrease in the general fund was primarily due to revenues
being less than budget by $9.3 million and expenses being less than budget by $4.8 million.
Additionally, there was a $6.5 million reduction in governmental fund balance due to transfer of
the Student Activities Fund to Fiduciary Fund, see Note 4 – Prior Period Adjustment.
$0
$5,000
$10,000
$15,000
$20,000
$25,000
Tho
usa
nd
s
Governmental Fund BalancesJune 30, 2012 and 2013 (in thousands)
2012 2013

- 15 -
Major Funds
General Fund
The General Fund is the general purpose and chief operating fund of the school district used to
account for the ordinary operations and financial resources not accounted for in any other fund.
Taxes, state equalization funding, and other general revenues finance the operations.
As a measure of liquidity, the General Fund unassigned fund balance was approximately $37.5
million or 1.2% of total fund expenditures, while total fund balance represents 5.2% of that
same amount. This amount is available for future appropriation. The total fund balance
increased by $22.7 million due to lower than anticipated revenues of $9.4 million and
expenditure savings of $4.8 million. Expenditures savings were realized in benefits due to the
District implementing a 63% effective cost share for health insurance. Additionally, the District
Implemented Spouse Out. This means if a District employee’s spouse has health insurance
coverage through their employer, the spouse is not eligible for health insurance through the
District. General Fund revenues decreased by $16.1 million and expenditures decreased by $25.1
million from the previous year (GAAP basis).
School Cafeteria Fund
The School Cafeteria Fund is used to designate cafeteria transactions of preparing and serving
regular and incidental meals, breakfast, lunches and snacks in connection with non-instructional
services. Revenue is provided primarily from governmental agencies, which is restricted for the
cafeterias.
Capital Projects Fund
The Capital Projects Fund accounts for transactions related to resources obtained and used for
the acquisition, construction or improvement of capital facilities. The available fund balance
was decreased by $22.1 4,746 or 8.3% of total fund expenditures. The fund balance of the
Capital Projects Fund is restricted for specific projects approved by funding bodies and may not
be used for other purposes.
SCBOE uses capital projects funds to account for school construction and improvement projects,
which are financed primarily through Shelby County bond issues. On October 6, 2010, SCBOE
entered into an agreement with Shelby County Government through the Tennessee State School
Bond Authority Act to apply for QSCB II funds. SCBOE was awarded $17.6 million in funding
for five construction projects: Elementary and Middle School Gym HVAC, Collierville Middle
Replacement, Highland Oaks Elementary Roof, and Southwind Elementary Roof. For the year
ending June 30, 2013, these five projects were completed and final payments were received. The
final cost of these projects awarded under QSCB II funds was $17.2 million.

- 16 -
In fiscal year 2013, Shelby County Government provided the District an allocation of $13.9
million for the upgrade of the ERP system.
Federal Projects Fund
The Federal Projects accounts for restricted funds received from various agencies, state and
federal governments that are to be spent for specific purposes, based on contractual agreements
or grant applications.
$0
$5,000
$10,000
$15,000
$20,000
$25,000
2009 2010 2011 2012 2013
Tho
usa
nd
sCapital Projects Fund Revenues and Expenditures
Last Five Years (in thousands)
Revenu es Expenditures
$0
$5,000
$10,000
$15,000
$20,000
$25,000
$30,000
$35,000
2009 2010 2011 2012 2013
Tho
usa
nd
s
Federal Projects FundRevenues and Expenditures
Last Five Years (in thousands)
Revenu es Expenditures

- 17 -
Non-major Fund
Miscellaneous Governmental Funds
The Miscellaneous Governmental Funds are received from various agencies, state and federal
governments that are to be spent for specified purposes based upon contractual agreements or
grant applications. Thus, the funds are restricted and the Miscellaneous Governmental Fund is
used to keep these funds segregated from other funds.
Proprietary Fund
Internal Service Fund
The school district’s internal service fund accounts for the District’s health self-insurance
benefits. It provides the same type of information found in the government-wide financial
statements (full accrual accounting based on economic substance of transactions), but in more
detail.
See next page

- 18 -
Capital Assets
Shelby County Board of Education’s investment in capital assets for its governmental activities
as of June 30, 2013, shown in the table below, amounts to $395.8 million (net of accumulated
depreciation). This investment in capital assets includes land, buildings, improvements, and
equipment and furniture. Overall, capital assets decreased $6.1 million for fiscal year 2013.
Capital Assets, net of depreciation (amounts expressed in millions of dollars)
2013
2012
Percentage
Change
Land $ 23.3 $ 23.3 - %
Construction in progress 8.0 23.2 (65.5)%
Equipment and furniture 13.0 15.2 (14.5)%
Buildings and improvements 351.5 340.2 3.3%
Total $ 395.8 $ 401.9 (1.5)%
Long-term Debt
SCBOE has no long-term debt as the Board is fiscally dependent on Shelby County Government
for the issuance of debt for its capital projects.
General Fund Budgetary Highlights
The general fund budget was not amended during the year. Total revenues were $9.4 million
less than anticipated. Key factors contributing to that variance were as follows:
Local option and State sales taxes were $5.4 million less than anticipated
Interest income and other sources were $2.8 million less than budget
Budgets for current property taxes are based on an estimated value of each tax penny, which will
vary from actual collections.
General Fund Expenditures Budget
Actual general fund expenditures were $4.8 million lower than budgeted. The majority of the
variance can be attributed to leaner expenditures in the support services area. Sparing use of end
of year funds was made for capital outlay at the end of 2013. Shelby County Schools had
anticipated using $6.5 million of the reserve to balance the 2013 budget; however $11.8 million
was actually used, reducing total fund balance as of June 30, 2013 to $18.2 million from $28.7 as
of June 30, 2012.

- 19 -
Additionally, the District paid out $209,810 for severance and unused vacation pay - which was
directly related to the merger and the 26% reduction to Central Office staff.
General Fund Balance
The general fund balance decreased 36.3% to $18.2 million in 2013. The fund balance equals
14.4 days of expenses. It also represents 5.07% of budgeted expenses. The State BEP requires a
reserve equal to 3% of the 2014 budgeted expenses, and $11.1 million has been reserved
accordingly at June 30, 2013.
Economic Factors and Next Year’s Budget
On December 20, 2010, the Memphis City Board of Commissioners voted to surrender Memphis
City Schools’ Charter. Tennessee Code Annotated requires that a referendum be held. Memphis
voters ratified the Board’s decision to transfer the administration of Memphis City Schools to
Shelby County Schools on March 8, 2011. Shelby County Schools filed a complaint for
declaratory judgment on February 11, 2011, and United States District Judge Samuel “Hardy”
Mays ruled on August 8, 2011, that Memphis City Schools would cease to exist at the conclusion
of the 2012-13 school year.
In order to remain in compliance with the Norris-Todd law (Tennessee Senate bill 25), a 21
member transition team was appointed by the Memphis City Schools Board of Commissioners,
the Shelby County School Board, the Mayor of Shelby County, the Governor of Tennessee and
the Speaker of the Tennessee House. The Transition Planning Commission worked with its
consultant, The Boston Consulting Group, and developed assumptions and forecasts for the
merged District. Many of these assumptions were used in developing the budget for the merged
District – effective Fiscal Year 2013-14.
The State of Tennessee included a 1.5% COLA for certificated staff in its budget appropriation.
The District sought a waiver from the State requirement of providing a COLA to certificated
staff and harmonized the salaries of legacy Shelby County School teachers and legacy Memphis
City Schools Principals and Assistant Principals.
The Shelby County Board of Commissioners voted to approve the Shelby County Schools’
budget provided that the revenues from all County sources shall not exceed $381,288,000.
Education’s share of the property tax levy is expected to remain at $2.14 of the $4.38 per $100 of
assessed property value. Shelby County Schools’ combined 40th day end-of-month enrollment is
expected to decrease from 149,819 to 149,653 day students.
The Shelby County Board of Education adopted the Fiscal Year 2013-14 General Fund budget in
the amount of $1,188,648,338 including transfers to charter schools. The Fiscal Year 2013-14
budget is a reduction of approximately $75 million from the combined Memphis City Schools
and Shelby County Schools Fiscal Year 2012-13 budgets. Ten new charter schools will open,
bringing the total number of charter schools to thirty-nine, with an aggregate budget of $67.4
million. Student enrollment is the primary driver of instruction and school expenditure budgets.

- 20 -
Enrollment is expected to decrease by 1,544 students. The District continues to face a
challenging revenue environment while the cost of doing business continues to rise. The Shelby
County Board of Education approved the planned use of $12.6 million in unassigned fund
balance to balance the general fund operating budget. The Basic Education Program reserve
requires the District to set aside three percent of next year’s General Fund Expenditure Budget of
$1,188,648,338, which equates to $35,659,450. Readers of the financial statements will see the
reserve allocated between the two districts based upon the WFTEADA. Memphis City Schools
has reserved $24,587,191 and Shelby County Schools has reserved $11,072,259.
Shelby County Schools continues to maximize all of the financial resources available in order to
provide a quality education for all students in Shelby County.
Requests for information
This financial report is designed to provide a general overview of the school district’s finances
for all those with an interest in Shelby County Schools’ finances. Questions concerning any of
the information provided in this report or request for additional financial information may be
addressed to:
Shelby County Board of Education
Chief Financial Officer
Room 226
160 South Hollywood Street
Memphis, Tennessee 38112

Basic Financial Statements

The notes to the financial statements are an integral part of this statement.
- 23 -
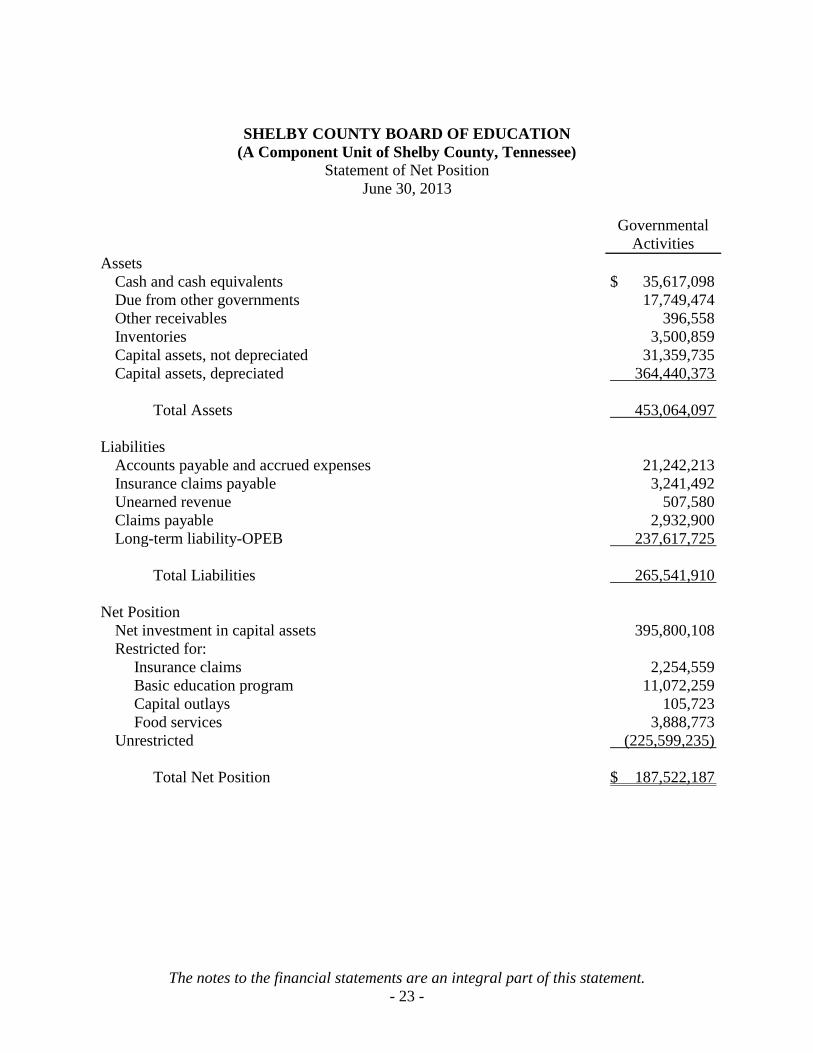
SHELBY COUNTY BOARD OF EDUCATION
(A Component Unit of Shelby County, Tennessee)
Statement of Net Position
June 30, 2013
Governmental
Activities
Assets
Cash and cash equivalents $ 35,617,098
Due from other governments 17,749,474
Other receivables 396,558
Inventories 3,500,859
Capital assets, not depreciated 31,359,735
Capital assets, depreciated 364,440,373
Total Assets 453,064,097
Liabilities
Accounts payable and accrued expenses 21,242,213
Insurance claims payable 3,241,492
Unearned revenue 507,580
Claims payable 2,932,900
Long-term liability-OPEB 237,617,725
Total Liabilities 265,541,910
Net Position
Net investment in capital assets 395,800,108
Restricted for:
Insurance claims 2,254,559
Basic education program 11,072,259
Capital outlays 105,723
Food services 3,888,773
Unrestricted (225,599,235)
Total Net Position $ 187,522,187

The notes to the financial statements are an integral part of this statement.
- 24 -
SHELBY COUNTY BOARD OF EDUCATION
(A Component Unit of Shelby County, Tennessee)
Statement of Activities
For the Year Ended June 30, 2013
Program Revenues
Net (Expense)
Revenue and
Changes in
Net Assets
Functions/Programs
Expenses
Charges for
Services
Operating Grants &
Contributions
Governmental
Activities
Governmental Activities:
Instructional programs $ 278,662,284 $ 11,286,642 $ 211,372,876 $ (56,002,766)
Support services 58,631,337 3,235,977 - (55,395,360)
General Administration 49,521,741 539,329 - (48,982,412)
Operation and maintenance of plant 29,540,909 3,066,439 - (26,474,470)
Student transportation 17,406,176 898,882 - (16,507,294)
Food service 20,414,717 10,349,814 8,728,662 (1,336,241)
Student activities 793,703 359,553 - (434,150)
Total Governmental Activities $ 454,970,867 $ 29,736,636 $ 220,101,538 (205,132,693)
General Revenues:
Shelby County 120,421,197
Local option and state sales taxes 36,228,227
Other local sources 1,977,774
Total General Revenues 158,627,198
Increase (Decrease) in Net Position (46,505,495)
Net Position - Beginning of Year 240,496,764
Prior period adjustment (6,469,082)
Net Position - Beginning of Year, restated 234,027,682
Net Position - End of Year $ 187,522,187

The notes to the financial statements are an integral part of this statement.
- 25 -
SHELBY COUNTY BOARD OF EDUCATION (A Component Unit of Shelby County, Tennessee)
Balance Sheet - Governmental Funds
June 30, 2013
General Fund
Capital Projects
Fund
Federal Projects
Fund Cafeteria Funds
Miscellaneous
Governmental Funds
Total
Governmental
Funds
ASSETS:
Cash and cash equivalents $ 13,556,404 $ 798,088 $ - $ 10,638,630 $ 462,139 $ 25,455,261
Receivables:
Due from Shelby County 12,079,795 2,897,759 - - - 14,977,554
State - - 2,194,736 - 583,605 2,778,341
Proprietary fund 4,542,633 - - - - 4,542,633
Other 283,430 - - 26,658 80,645 390,733
Due from other funds 11,660,959 - 142,104 123 - 11,803,186
Inventories 2,811,900 - - 688,959 - 3,500,859
Total Assets $ 44,935,121 $ 3,695,847 $ 2,336,840 $ 11,354,370 $ 1,126,389 $ 63,448,567
LIABILITIES:
Accounts payable 1,389,384 965,124 174,810 43,391 26,622 2,599,331
Accrued payroll expenses 18,020,405 - 376,588 16,070 107,262 18,520,325
Due to other funds 144,882 2,625,000 1,782,238 6,292,524 958,542 11,803,186
Unearned revenue 45,760 - 3,204 424,653 33,963 507,580
Total Liabilities 19,600,431 3,590,124 2,336,840 6,776,638 1,126,389 33,430,422
DEFERRED INFLO WS O F
RESO URCES:
Unavailable revenue 7,090,603 - - - - 7,090,603
Total Deferred Inflows of Resources 7,090,603 - - - - 7,090,603
FUND BALANCES:
Nonspendable:
Inventories 2,811,900 - - 688,959 - 3,500,859
Restricted for:
Basic education program 11,072,259 - - - - 11,072,259
Capital outlays - 105,723 - - - 105,723
Food services - - - 3,888,773 - 3,888,773
Unassigned 4,359,928 - - - - 4,359,928
Total Fund Balances 18,244,087 105,723 - 4,577,732 - 22,927,542
Total Liabilities, Deferred Inflows
of Resources, and Fund Balances $ 44,935,121 $ 3,695,847 $ 2,336,840 $ 11,354,370 $ 1,126,389 $ 63,448,567
Special Revenue Funds

The notes to the financial statements are an integral part of this statement.
- 26 -
SHELBY COUNTY BOARD OF EDUCATION
(A Component Unit of Shelby County, Tennessee)
Reconciliation of Balance Sheet - Governmental Funds
to the Statement of Net Position
June 30, 2013
Amounts reported for governmental activities in the statement of net position are different
because:
Amount
Total Fund Balance - Total Governmental Funds $ 22,927,542
Capital assets used in governmental activities are not financial resources and,
therefore, are not reported in the funds.
395,800,108
Other long-term assets are not available to pay for current-period
expenditures and therefore are not reported in the funds.
7,090,603
Internal service funds are used by management to charge the costs of health
and life insurance benefits to the individual funds. The assets and
liabilities of the internal service fund are included in governmental
activities in the statement of net assets.
2,254,559
Long-term liability for OPEB future payments, not included in governmental
funds
(237,617,725)
Long-term liability for legal claims contingencies, not included in
governmental funds
(2,932,900)
Total Net Position - Governmental Activities
$ 187,522,187

The notes to the financial statements are an integral part of this statement.
- 27 -
SHELBY COUNTY BOARD OF EDUCATION
(A Component Unit of Shelby County, Tennessee)
Statement of Revenues, Expenditures, and Changes in Fund Balances - Governmental Funds
For the Year Ended June 30, 2013
General
Fund
Capital
Projects
Fund
Federal
Projects
Fund
Cafeteria
Fund
Miscellaneous
Governmental
Funds
Governmental
Total
Funds
Revenues:
Shelby County $ 113,591,004 $ 7,891,104 $ - $ - $ - $ 121,482,108
State of Tennessee 187,977,990 - - 165,468 842,223 188,985,681
Federal government - - 21,953,212 8,563,194 599,447 31,115,853
Local option and state sales taxes 36,228,227 - - - - 36,228,227
Charges for current services 2,667,610 - - - - 2,667,610
Other local sources 1,865,928 - - 9,091,379 100,809 11,058,116
Total Revenues 342,330,759 7,891,104 21,953,212 17,820,041 1,542,479 391,537,595
Expenditures:
Regular education program 187,756,031 - 4,194,716 - 363,613 192,314,360
Special education program 33,349,704 - 6,479,550 - - 39,829,254
Vocational education program 6,514,155 - 366,653 - - 6,880,808
Alternative education program 2,412,530 - - - - 2,412,530
Early Childhood Development - - 1,156,041 - - 1,156,041
Support services 43,728,241 - 7,328,056 3,000 428,717 51,488,014
General administration 9,907,762 - - - - 9,907,762
School administration 26,061,269 - - - 10,742 26,072,011
Business administration 5,471,541 - - - - 5,471,541
Operation and maintenance of plant 25,854,305 - - - 669,038 26,523,343
Student transportation 12,016,393 - 1,582,928 - - 13,599,321
Food services - - (219) 17,622,164 46,890 17,668,835
Capital outlays 542,660 8,495,850 - - - 9,038,510
Student activities - - - - - -
Total Expenditures 353,614,591 8,495,850 21,107,725 17,625,164 1,519,000 402,362,330
Excess (Deficiency) of Revenues
over Expenditures (11,283,832) (604,746) 845,487 194,877 23,479 (10,824,735)
Other Financing Sources (Uses):
Transfers in 868,966 - - - - 868,966
Transfers out - - 845,487 - 23,479 868,966
Total Other Financing Sources (Uses) 868,966 - (845,487) - (23,479) -
Net Change in Fund Balances (10,414,866) (604,746) - 194,877 - (10,824,735)
28,658,953 710,469 - 4,262,654 - 33,632,076
Change in reserve for inventories - - - 120,201 - 120,201
Fund Balances, End of Year $ 18,244,087 $ 105,723 $ - $ 4,577,732 $ - $ 22,927,542
Fund Balances, Beginning of Year
Special Revenue Funds

The notes to the financial statements are an integral part of this statement.
- 28 -
BOARD OF EDUCATION OF
SHELBY COUNTY, TENNESSEE
(A Component Unit of Shelby County, Tennessee)
Reconciliation of the Statement of Revenues, Expenditures, and Changes in Fund Balances -
Governmental Funds to the Statement of Activities
For the Year Ended June 30, 2013
Amounts reported for governmental activities in the Statement of Activities are different
because:
Amount
Net Change in Fund Balances - Total Governmental Funds $ (10,824,735)
Governmental funds report capital outlays as expenditures. However, in
the statement of activities, the cost of those assets is allocated over
their estimated useful lives and reported as depreciation expense.
This is the amount by which capital outlays exceed depreciation in
the current period.
(6,403,701)
The net effect of the disposal of certain capital assets including sales and
retirements is to decrease net assets.
239,964
Under the modified basis of accounting used in the governmental funds,
expenditures for inventory are recorded when purchased (the
purchases method), but in the statement of activities, inventory is
expensed only when consumed (consumption method).
120,201
Recognition of unavailable revenue by Shelby County increases the
Board's receivable from Shelby County. This amount is the net
change during the period.
(1,060,911)
Increase in long-term liability for OPEB future payments, not included in
governmental funds
(28,173,022)
Decrease in long-term liability for legal claims contingencies, not
included in governmental funds
1,318,500
Internal service funds are used by management to charge the cost of health
and life insurance benefits to the individual funds. The net revenue
of the activities of the internal service fund is reported with
governmental activities.
(1,721,791)
Change in Net Position of Governmental Activities
$ (46,505,495)

The notes to the financial statements are an integral part of this statement.
- 29 -
BOARD OF EDUCATION OF
SHELBY COUNTY, TENNESSEE
(A Component Unit of Shelby County, Tennessee)
Schedule of Revenues, Expenditures, and Changes in Fund Balances -
Budget and Actual (Budgetary Basis) - General Fund
For the Year Ended June 30, 2013
Budgeted Amounts
Original
Final
Actual
Variance with
Final Budget-
Positive
(Negative)
Revenues:
Shelby County $ 114,762,920 $ 114,762,920 $ 113,591,004 $ (1,171,916)
State of Tennessee 188,757,588 188,757,588 187,977,990 (779,598)
Federal Government 750,383 750,383 - (750,383)
Local option and State sales taxes 41,667,690 41,667,690 36,228,227 (5,439,463)
Charges for current services 1,960,000 1,960,000 2,667,610 707,610
Other local sources 3,813,294 3,813,294 1,865,928 (1,947,366)
Total Revenues 351,711,875 351,711,875 342,330,759 (9,381,116)
Expenditures:
Regular education program 181,575,900 181,575,900 188,007,628 (6,431,728)
Special education program 34,757,728 34,757,728 33,356,715 1,401,013
Vocational education program 6,902,682 6,902,682 6,514,155 388,527
Alternative education program 2,467,385 2,467,385 2,412,530 54,855
Support services 48,574,659 48,574,659 43,582,467 4,992,192
General administration 11,604,410 11,604,410 10,907,542 696,868
School administration 26,150,857 26,150,857 26,054,956 95,901
Business administration 5,167,211 5,167,211 5,544,025 (376,814)
Operation and maintenance of plant 27,921,667 27,921,667 25,865,915 2,055,752
Student transportation 12,743,615 12,743,615 12,056,458 687,157
Capital outlays 1,923,351 1,923,351 684,722 1,238,629
Total Expenditures 359,789,465 359,789,465 354,987,113 4,802,352
Excess (Deficiency) of Revenues
Over Expenditures
(8,077,590)
(8,077,590)
(12,656,354)
(4,578,764)
Other Financing Sources (Uses):
Transfers in 1,579,363 1,579,363 868,966 (710,397)
Transfers out - - - -
Total Other Financing Sources (Uses) 1,579,363 1,579,363 868,966 (710,397)
Net Change in Fund Balances $ (6,498,227) $ (6,498,227) (11,787,388) $ (5,289,161)
Fund Balance-GAAP Basis-Beginning of Year 28,658,953
Change in Encumbrances 1,372,522
Fund Balance-GAAP Basis-End of Year $ 18,244,087

The notes to the financial statements are an integral part of this statement.
- 30 -
BOARD OF EDUCATION OF
SHELBY COUNTY, TENNESSEE
(A Component Unit of Shelby County, Tennessee)
Statement of Net Position - Proprietary Fund
June 30, 2013
Governmental
Activities -
Internal Service
Fund
Assets
Cash and cash equivalents $ 10,161,837
Accounts receivable 5,823
Due from other funds 824
Total Assets 10,168,484
Liabilities
Accounts payable 129,800
Insurance claims payable 3,241,492
Due to governmental funds 4,542,633
Total Liabilities 7,913,925
Net Position
Restricted for insurance claims $ 2,254,559

The notes to the financial statements are an integral part of this statement.
- 31 -
BOARD OF EDUCATION OF
SHELBY COUNTY, TENNESSEE
(A Component Unit of Shelby County, Tennessee)
Statement of Revenues, Expenditures, and Changes in Net Position - Proprietary Fund
For the Year Ended June 30, 2013
Governmental
Activities -
Internal Service
Fund
Operating Revenues:
Premium received $ 43,890,362
Operating Expenses:
Claims incurred 35,935,319
Insurance premiums 1,489,499
Administrative expenses 8,198,372
Total Operating Expenses 45,623,190
Operating Income (Loss) (1,732,828)
Nonoperating Revenue:
Interest Income 4,897
Other Income 6,140
Total Nonoperating Revenue 11,037
Change in Net Position (1,721,791)
Net Position - Beginning of Year 3,976,350
Net Position - End of Year $ 2,254,559

The notes to the financial statements are an integral part of this statement.
- 32 -
BOARD OF EDUCATION OF
SHELBY COUNTY, TENNESSEE
(A Component Unit of Shelby County, Tennessee)
Statement of Cash Flows - Proprietary Fund
For the Year Ended June 30, 2013
Governmental
Activities -
Internal Service
Fund
Cash Flows From Operating Activities:
Premiums received $ 44,045,620
Claims paid (36,308,723)
Payments to vendors (9,763,766)
Other receipts 6,140
Net Cash Provided (Used) by Operating Activities (2,020,729)
Cash Flows From Investing Activities:
Interest income 4,897
Net Cash Provided (Used) In Investing Activities 4,897
Cash Flows From Financing Activities:
Advances from governmental funds 4,542,633
Net Cash Provided (Used) In Financing Activities 4,542,633
Net Increase in Cash and Cash Equivalents 2,526,801
Cash and Cash Equivalents, Beginning of Year 7,635,036
Cash and Cash Equivalents, End of Year $ 10,161,837
Reconciliation of Operating Income to Net Cash Provided by
Operating Activities:
Operating Income (Loss) $ (1,732,828)
Other Income 6,140
Adjustments to Reconcile Operating Income to Net Cash
Provided by Operating Activities:
Changes in Operating Assets and Liabilities:
Decrease in accounts receivable 155,257
Increase in due from other funds (824)
Decrease in accounts payable (75,894)
Decrease in insurance claims payable (372,580)
Total Cash Provided (Used) by Operating Activities $ (2,020,729)

The notes to the financial statements are an integral part of this statement.
- 33 -
BOARD OF EDUCATION OF
SHELBY COUNTY, TENNESSEE
(A Component Unit of Shelby County, Tennessee)
Statement of Fiduciary Net Position
June 30, 2013
Agency Fund
Assets
Cash and cash equivalents $ 4,897,732
Investments 55,090
Inventories 123,291
Total Assets 5,076,113
Liabilities
Due to students 5,076,113
Total Liabilities 5,076,113
Net Position $ -

- 34 -
BOARD OF EDUCATION OF
SHELBY COUNTY, TENNESSEE
(A Component Unit of Shelby County, Tennessee)
Notes to the Financial Statements
For the Year Ended June 30, 2013
NOTE 1 - SUMMARY OF SIGNIFICANT ACCOUNTING POLICIES:
Determination of the Reporting Entity
The Shelby County Board of Education (the “Board”) is a component unit of Shelby County,
Tennessee. Accordingly, the accounts and transactions reported in the accompanying financial
statements are included in the Shelby County, Tennessee Comprehensive Annual Financial
Report as a discretely presented governmental component unit.
Government-wide financial statements
The government-wide financial statements (i.e., the statement of net assets and the statement of
activities) report information about the Board as a whole. These statements include the financial
activities of the Board.
The statement of activities demonstrates the degree to which the direct expenses of a given
function or segment are offset by program revenues. Direct expenses are those that are clearly
identifiable with a specific function or segment. Program revenues include grants and
contributions that are restricted to meeting the operational or capital requirements of a particular
function or segment. Taxes and other items not properly included among program revenues are
reported instead as general revenues.
As a general rule, the effect of interfund activity has been eliminated from the government-wide
financial statements. The result of these eliminations is a more accurate reporting of the Board’s
overall revenues and expenses from its activities.
Fund financial statements
Fund financial statements are designed to present financial information of the Board at a more
detailed level (and to demonstrate legal compliance). The focus of fund financial statements is on
major funds. The Board’s major individual governmental funds are the general fund and capital
projects fund and are reported as separate columns in the governmental funds financial
statements. Non-major funds are aggregated and presented in a single column in the
governmental fund financial statements. The Board’s proprietary fund is the internal service fund
which is reported in the proprietary fund financial statements.

- 35 -
Governmental Funds
General Fund: The general fund, as the primary operating fund, is used to account for all
financial resources except those required to be accounted for in another fund.
Capital Projects Fund: Transactions related to resources obtained and used for the acquisition,
construction or improvement of capital facilities are accounted for in the capital projects fund.
The primary funding source is bond proceeds from Shelby County.
Federal Projects Fund: The federal project fund relates to resources obtained and used under
certain federal and state programs and to other sources upon which legal restrictions are
imposed.
Special Revenue Funds: School cafeteria represents the aggregate of individual school funds,
which are accounted for in each school. The school cafeteria funds are used for operating child
nutrition programs only.
Proprietary Funds
Internal Service Fund: This fund is comprised of the Board’s self-insured health and life
insurance fund. The fund accounts for employee and retiree group health and life insurance. The
primary funding source is contributions from employees, retirees and the Board.
Proprietary funds distinguish operating revenues and expenses from nonoperating items.
Operating revenues and expenses generally result from providing services in connection with a
proprietary fund's principal ongoing operations. All revenues and expenses not meeting this
definition are reported as nonoperating revenues and expenses.
Fiduciary Funds (Not included in government-wide statements)
Agency Fund - Student Activity Fund: Transactions related to resources held in a fiduciary
capacity as agent for the general school population, or in some cases, for a specific segment of
the school population, are recorded in the Student Activity Fund. Agency funds are purely
custodial and thus do not involve measurement of results of operations.
Major and Non-major Funds
The General Fund, Capital Projects Fund, Cafeteria Fund and the Federal Projects Fund are
classified as major funds. The Miscellaneous Fund is the only non-major fund.

- 36 -
Measurement Focus
Measurement focus is a term used to describe which transactions are recorded within the various
financial statements.
The government wide financial statements are reported using the economic resources
measurement focus as defined in item b. below.
In the fund financial statements, the “current financial resources” measurement focus or the
“economic resources” measurement focus is used as appropriate:
a. All governmental funds utilize a “current financial resources” measurement focus. Only
current financial assets and liabilities are generally included on their balance sheets.
Their operating statements present sources and uses of available spendable financial
resources at the end of the period.
b. The proprietary fund utilizes an “economic resources” measurement focus. The
accounting objectives of this measurement focus are the determination of operating
income, changes is net assets (or cost recovery), financial position, and cash flows. All
assets and liabilities (whether current or noncurrent) associated with their activities are
reported. Proprietary fund equity is classifies as net assets.
Budgeting and Budgetary Control
General and federal projects fund’s revenue and expenditures are controlled by a formal
integrated budgetary accounting system in accordance with various legal requirements that
govern the operations of the Board. The budgetary basis of accounting differs from generally
accepted accounting principles because encumbrances have been recorded as expenditures. The
original budget and all subsequent amendments to the budget are approved by the Shelby County
Board of Commissioners. The capital project fund, internal service fund, school cafeteria funds
and the school student activity funds are not legally required to adopt an annual budget.
Basis of Accounting
The financial statements of the Board have been prepared in accordance with generally accepted
accounting principles (GAAP) followed in the United States of America. In the United States,
the Governmental Accounting Standards Board (GASB) is the established and recognized
standard setting body for governmental accounting and financial reporting. The GASB
periodically issues new or revised standards that are implemented by the Board.

- 37 -
The government-wide financial statements are presented using the accrual basis of accounting.
Under the accrual basis of accounting, revenues are recognized when earned and expenses are
recorded when the liability is incurred or economic asset used. Revenues, expenses, gains,
losses, assets, and liabilities resulting from exchange-like transactions are recognized when the
exchange takes place.
The fund financial statements, the General, Federal, Special Revenue, and Capital Projects
Funds, are prepared on the modified accrual basis of accounting. Under this basis of accounting,
revenues are recognized in the accounting period in which they become susceptible to accrual,
which is defined as being both measurable and available to finance expenditures of the fiscal
period. Expenditures are recognized on the modified accrual basis which is defined as when
measurable and when the related liability is incurred. When both restricted and unrestricted
resources are available for use, it is the Board’s policy to use restricted resources first, then
unrestricted resources as they are needed. Revenue susceptible to accrual under the modified
accrual basis is principally:
a. Property taxes collected by Shelby County but not yet remitted to the Board.
b. Grants and subsidies from other governments, to the extent measurable and available.
c. Interest earned on investments as of year-end.
The Proprietary Fund utilizes the accrual basis of accounting. Under the accrual basis of
accounting, revenue is recorded as earned and expenses are recorded when the liability is
incurred or economic asset used. Operating revenues and expenses generally result from
providing services in connection with a proprietary fund’s principal ongoing operations. All
other revenue is considered nonoperating revenue.
Receivables
Receivables consist primarily of grant funds receivable from the federal government and the
State of Tennessee, property taxes receivables from Shelby County and funds due from Shelby
County for capital projects.
Outstanding balances between funds are reported as “due to/from other funds.” The transfer
between funds is used to ensure current operations and programs are not interrupted.
Inventories
General Fund inventories consist of textbooks, maintenance and school supplies. Food Service
Fund inventories consist of food and cafeteria supplies. Inventories are considered expenditures
when issued from the central warehouse to the schools (Consumption Method) except food
items, which are expensed when used. Inventories are reported in the balance sheet at average
cost and are offset by a Fund Balance reserve of a like amount. Inventories in the Agency Fund
are stated at cost determined by the first-in, first-out method.
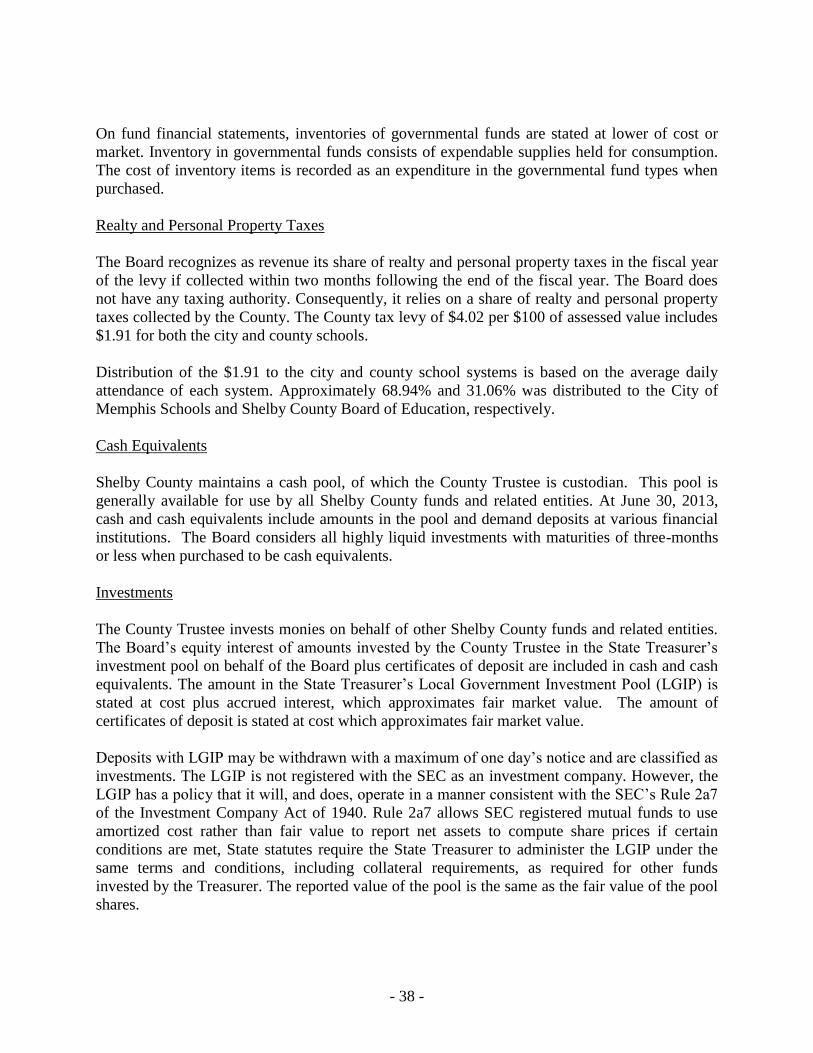
- 38 -
On fund financial statements, inventories of governmental funds are stated at lower of cost or
market. Inventory in governmental funds consists of expendable supplies held for consumption.
The cost of inventory items is recorded as an expenditure in the governmental fund types when
purchased.
Realty and Personal Property Taxes
The Board recognizes as revenue its share of realty and personal property taxes in the fiscal year
of the levy if collected within two months following the end of the fiscal year. The Board does
not have any taxing authority. Consequently, it relies on a share of realty and personal property
taxes collected by the County. The County tax levy of $4.02 per $100 of assessed value includes
$1.91 for both the city and county schools.
Distribution of the $1.91 to the city and county school systems is based on the average daily
attendance of each system. Approximately 68.94% and 31.06% was distributed to the City of
Memphis Schools and Shelby County Board of Education, respectively.
Cash Equivalents
Shelby County maintains a cash pool, of which the County Trustee is custodian. This pool is
generally available for use by all Shelby County funds and related entities. At June 30, 2013,
cash and cash equivalents include amounts in the pool and demand deposits at various financial
institutions. The Board considers all highly liquid investments with maturities of three-months
or less when purchased to be cash equivalents.
Investments
The County Trustee invests monies on behalf of other Shelby County funds and related entities.
The Board’s equity interest of amounts invested by the County Trustee in the State Treasurer’s
investment pool on behalf of the Board plus certificates of deposit are included in cash and cash
equivalents. The amount in the State Treasurer’s Local Government Investment Pool (LGIP) is
stated at cost plus accrued interest, which approximates fair market value. The amount of
certificates of deposit is stated at cost which approximates fair market value.
Deposits with LGIP may be withdrawn with a maximum of one day’s notice and are classified as
investments. The LGIP is not registered with the SEC as an investment company. However, the
LGIP has a policy that it will, and does, operate in a manner consistent with the SEC’s Rule 2a7
of the Investment Company Act of 1940. Rule 2a7 allows SEC registered mutual funds to use
amortized cost rather than fair value to report net assets to compute share prices if certain
conditions are met, State statutes require the State Treasurer to administer the LGIP under the
same terms and conditions, including collateral requirements, as required for other funds
invested by the Treasurer. The reported value of the pool is the same as the fair value of the pool
shares.

-39-
State statutes authorize the County Trustee to invest in obligations of the U.S. Treasury,
obligations guaranteed as to principal and interest by the United States or any of its agencies,
certificates of deposit at Tennessee state chartered banks and savings and loans associations and
federal chartered banks and savings and loan associations, repurchase agreements utilizing
obligations of the United States or its agencies as the underlying securities, and the LGIP. State
statutes also require that securities underlying repurchase agreements must have a market value
at least equal to the amount of funds invested in the repurchase transactions.
Capital Assets
Capital assets, which include land, land improvements, buildings and improvements, furniture
and equipment and construction in progress, are reported in the government wide financial
statements. Capital assets are defined by Board policy as assets with an initial, individual cost of
$5,000 or more with a useful life of more than one year.
Improvements are capitalized; the costs of normal maintenance and repairs that do not add to the
value of the asset or materially extend an asset’s life are not capitalized. All reported capital
assets except land and construction in progress are depreciated. Depreciation is computed over
the remaining useful lives of the related capital assets using the straight line method of
depreciation. Estimated useful lives are as follows:
Building and Building improvements 25 to 50 years
Furniture and equipment 5 to 20 years
Unearned Revenue
Unearned revenue arises when assets are recognized before revenue recognition criteria have
been satisfied.
Deferred Outflows/Inflows of Resources
In addition to liabilities, the statement of financial position will sometimes report a section for
deferred inflow of resources. This separate financial statement element, deferred inflows of
resources, represents an acquisition of net position that applies to a future period(s) and so will
not be recognized as an inflow of resources (revenue) until that time. Accordingly, the item
unavailable revenue is reported only in the governmental fund balance sheet. The Board reports
unavailable revenue from property taxes. This amount is deferred and recognized as an inflow of
resources in the period that the amount becomes available.

-40-
Equity Classifications
In the government-wide financial statements, equity is classified as net position and displayed in
three components:
a. Net investment in capital assets – Consists of capital assets including restricted capital
assets, net of accumulated depreciation and reduced by the outstanding balances of any
borrowings that are attributable to the acquisition, construction, or improvement of those
assets.
b. Restricted net assets – Consists of net assets with constraints placed on the use either by
(1) external groups such as creditors, grantors, contributors, or laws or regulations of
other governments; or (2) law through constitutional provisions or enabling legislation.
c. Unrestricted net assets – All other net assets that do not meet the definition of “restricted”
or “invested in net investment in capital assets, net of related debt.”
Governmental fund balances are reported, in accordance with Governmental Accounting
Standards Board (GASB) Statement No. 54, Fund Balance Reporting and Governmental Fund
Type Definitions, as either Nonspendable, Restricted, Committed, and/or Unassigned.
The Shelby County Board of Education reports fund balance in its governmental funds in the
classifications prescribed by GASB Statement 54. By doing so, the Board reflects the amount to
which they are “bound to honor constraints on the specific purposes for which amounts in the
fund can be spent.” Of the five categories allowed by GASB Statement 54, the District reports
only three of these components in the 2013 fiscal year: Nonspendable, Restricted and
Unassigned.
The Nonspendable Fund Balance reflects the amounts that can only be spent for inventories. The
Restricted Fund Balance category reflects the resources that are subject to legal restrictions, such
as BEP (Basic Education Program), capital outlay and the nutrition program. The District
reports the residual net resources left after what is categorized in the other two components as
Unassigned Fund Balance. This category is only reported in the General Fund.
Minimum Fund Balance Policy
In order to maintain and protect the long-term financial capacity of Shelby County Board of
Education, total fund balance restricted for education in the General Fund is maintained at a level
not less than required by Tennessee Code Annotated (TCA) 49-3-352.

-41-
Order of Expenditure of Funds
In accordance with Governmental Accounting Standards Board (GASB) Statement No. 54, when
multiple categories of fund balances are available, such as restricted and unrestricted resources in
the General Fund, Capital Projects Fund, and Special Revenue Funds, the district will start
spending from the most restricted category and spend those funds first before moving down to
the next category with available funds. GASB Statement No. 54 required Shelby County Board
of Education to adopt a spending prioritization policy. The policy enacted by the Board requires
that funds be spent in the following order: Restricted, Committed, Assigned, and Unassigned.
Other Post Employment Benefits
Effective July 1, 2007, the Board implemented GASB Statement 45, Accounting and Financial
Reporting by Employers for Post Employment Benefits Other Than Pensions. Prior to
implementation of GASB Statement 45, the Board accounted for other post employment benefits
(OPEB) under a pay as you go financing basis. With the adoption of GASB Statement 45, the
Board measures and recognizes the cost of OPEB during the periods when employees render the
services, and provides relevant information about OPEB obligations and the extent to which
progress is being made in funding those obligations.
NOTE 2 - CASH AND CASH EQUIVALENTS:
Cash and cash equivalents at June 30, 2013 consisted of the following:
Investments in State's local government investment pool (LGIP) $ 31,174,195
Deposit accounts 4,442,903
$ 35,617,098
Custodial Credit Risk - Bank deposits, in compliance with State statutes, are covered by federal
depository insurance (FDIC) or are collateralized by a multiple financial institutional collateral
pool administered by the State of Tennessee. When the Board has deposits with financial
institutions that do not participate in the State collateral pool; a separate collateral equal to at
least 105% of the uninsured deposit is collateralized and held in the Board's name by a third
party. The responsibility for conducting the State's local government investment (LGIP) program
resides with the State Treasurer pursuant to Tennessee Code Annotated, Section 9-4-602, an is
exercised in accordance with this investment policy and resolutions of the State Funding Board.
The LGIP is reported at the net asset value per share (NAV) by virtue of the amortized cost
method. This method will be continued as long as the State Board believes that it fairly reflects
market based NAV (in accordance with SE Rule 21-7). These provisions covered all Board
deposits at year-end.

-42-
Deposits and investments are classified into three categories of credit risk based upon the
following:
Category Description
1 Insured or registered, ore securities held by the Board or its agent in the Board's
name.
2. Uninsured or unregistered, with securities held by the counterparty's trust
department or agent in the Board's name.
3. Uninsured and unregistered, with securities held by the counterparty, or by its
trust department or agent, but not in the Board's name.
At June 30, 2013, the bank balance of the Board's sweep account was $-0-. Sweep accounts are
considered category 1 and LGIP investments are not required to be classified.
NOTE 3 – GENERAL LONG-TERM OBLIGATIONS:
Shelby County Board of Education has no long-term debt as the Board of Education is fiscally
dependent on Shelby County Government for the issuance of debt for its capital projects.
Changes in long-term liabilities during the year were:
Balance Due
June 30, 2012
Additions
Reductions
Balance Due
June 30, 2013
Due Within
One Year
Governmental Activities:
Claims payable $ 4,251,400 $ 845,000 $ (2,163,500) $ 2,932,900 $ -
Other Postemployment
benefit obligations
209,444,702
40,504,906
(12,331,883)
237,617,725
-
Total $ 213,696,102 $ 41,349,906 $ (14,495,383) $ 240,550,625 $ -
NOTE 4 – ACCRUED LIABILITIES:
Accrued payroll as of year-end for SCBOE's individual funds disaggregated are as follows:
General
Fund
Federal
Fund
Cafeteria
Fund
Miscellaneous
Governmental
Fund
Total
Governmental
Accrued Payroll $ 17,569,084 $ 368,200 $ 11,253 $ 103,691 $ 18,052,228
Accrued Vacation 451,321 8,388 4,817 3,571 468,097
Total $ 18,020,405 $ 376,588 $ 16,070 $ 107,262 $ 18,520,325

-43-
NOTE 5 - DEFINED BENEFIT PLAN:
Plan description - teachers
The Shelby County Board of Education contributes to the State Employees, Teachers, and
Higher Education Employees Pension Plan (SETHEEPP), a cost-sharing multiple employer
defined benefit pension plan administered by the Tennessee Consolidated Retirement System
(TCRS). TCRS provides retirement benefits as well as death and disability benefits to plan
members and their beneficiaries. Benefits are determined by a formula using the member’s high
five-year average salary and years of service. Members become eligible to retire at the age of 60
with five years of service or at any age with 30 years of service. A reduced retirement benefit is
available to vested members who are at least 55 years of age or have 25 years of service.
Disability benefits are available to active members with five years of service who become
disabled and cannot engage in gainful employment. There is no service requirement for disability
that is the result of an accident or injury occurring while the member was in the performance of
duty. Members joining the plan on or after July 1, 1979 are vested after five years of service.
Members joining prior to July 1, 1979 are vested after four years of service. Benefit provisions
are established in state statute found in Title 8, Chapters 34-37 of the Tennessee Code Annotated
(TCA). State statutes are amended by the Tennessee General Assembly. Cost of living
adjustments (COLA) are provided to retirees each July based on the percentage change in the
Consumer Price Index (CPI) during the previous calendar year. No COLA is granted if the CPI
increases less than one-half percent. The annual COLA is capped at three percent.
The TCRS issues a publicly available financial report that includes financial statements and
required supplementary information for the SETHEEPP. That report may be obtained by writing
to the Tennessee Treasury Department, Consolidated Retirement System, 10th Floor Andrew
Jackson Building, Nashville, TN 37243-0230 or can be accessed at
www.tn.gov/treasury/tcrs/Schools.
Funding policy - teachers
Most teachers are required by state statute to contribute 5.0% of salary to the plan. The employer
contribution rate for the Shelby County Board of Education is established at an actuarially
determined rate. The employer rate for the fiscal year ending June 30, 2013 was 8.88% of annual
covered payroll.
The employer contribution requirement for Shelby County Board of Education is established and
may be amended by the TCRS Board of Trustees. The employer’s contribution to TCRS for the
years ending June 30, 2013, 2012, and 2011 were $18,425,304, $18,696,266, and $18,256,591,
respectively, equal to the required contributions for each year.

-44-
Plan description - non teachers
Employees of Shelby County Board of Education are members of the Political Subdivision
Pension Plan (PSPP), an agent multiple-employer defined benefit pension plan administered by
the Tennessee Consolidated Retirement System (TCRS). TCRS provides retirement benefits as
well as death and disability benefits. Benefits are determined by a formula using the member’s
high five-year average salary and years of service. Members become eligible to retire at the age
of 60 with five years of service or at any age with 30 years of service. A reduced retirement
benefit is available to vested members at the age of 55. Disability benefits are available to active
members with five years of service who become disabled and cannot engage in gainful
employment. There is no service requirement for disability that is the result of an accident or
injury occurring while the member was in the performance of duty. Members joining the system
after July 1, 1979 become vested after five years of service and members joining prior to July 1,
1979 were vested after four years of service. Benefit provisions are established in state statute
found in Title 8, Chapter 34-37 of the Tennessee Code Annotated (TCA). State statutes are
amended by the Tennessee General Assembly. Political subdivisions such as Shelby County
Board of Education participate in the TCRS as individual entities and are liable for all costs
associated with the operation and administration of their plan. Benefit improvements are not
applicable to a political subdivision unless approved by the chief governing body.
The TCRS issues a publicly available financial report that includes financial statements and
required supplementary information for the PSPP. That report may be obtained by writing to
Tennessee Treasury Department, Consolidated Retirement System, 10th Floor Andrew Jackson
Building, Nashville, TN 37243-0230 or can be accessed at http://www.tn.gov/treasury/tcrs/PS/.
Funding policy
Shelby County Board of Education requires employees to contribute 5.0% of earnable
compensation.
Shelby County Board of Education is required to contribute at an actuarially determined rate; the
rate for the fiscal year ending June 30, 2013 was 7.83% of annual covered payroll. The
contribution requirement of plan members is set by state statute. The contribution requirement
for Shelby County Board of Education is established and may be amended by the TCRS Board
of Trustees.

-45-
Annual pension cost
For the year ending June 30, 2013, Shelby County Board of Education’s annual pension cost of
$4,113,626 to TCRS was equal to Shelby County Board of Education’s required and actual
contributions. The required contribution was determined as part of the July 1, 2011 actuarial
valuation using the frozen entry age actuarial cost method. Significant actuarial assumptions
used in the valuation include (a) rate of return on investment of present and future assets of 7.5
percent a year compounded annually, (b) projected 3.0 percent annual rate of inflation, (c)
projected salary increases of 4.75 percent (graded) annual rate (no explicit assumption is made
regarding the portion attributable to the effects of inflation on salaries), (d) projected 3.5 percent
annual increase in the Social Security wage base, and (e) projected post retirement increases of
2.5 percent annually. The actuarial value of assets was determined using techniques that smooth
the effect of short-term volatility in the market value of total investments over a ten-year period.
Shelby County Board of Education’s unfunded actuarial accrued liability is being amortized as a
level dollar amount on a closed basis. The remaining amortization period at July 1, 2011 was 2
years. An actuarial valuation was performed as of July 1, 2011, which established contribution
rates effective July 1, 2012.
Trend information
Fiscal Year Ending
Annual Pension
Cost (APC)
Percentage of
APC Contributed
Net Pension
Obligation
June 30, 2013 $ 4,113,626 100% $ -
June 30, 2012 $ 4,634,670 100% $ -
June 30, 2011 $ 4,419,473 100% $ -
Funded Status and Funding Progress
As of July 1, 2011, the most recent actuarial valuation date, the plan was 97.44% funded. The
actuarial accrued liability for benefits was $139.44 million, and the actuarial value of assets was
$135.87 million, resulting in an unfunded actuarial accrued liability (UAAL) of $3.57 million.
The covered payroll (annual payroll of active employees covered by the plan) was $49.54
million, and the ratio of the UAAL to the covered payroll was 7.20%.
The schedules of funding progress, presented as required supplementary information (RSI)
following the notes to the financial statements, present multi-year trend information about
whether the actuarial values of plan assets are increasing or decreasing over time relative to the
AAL's for benefits.
The annual required contribution (ARC) was calculated using the aggregate actuarial cost
method. Since the aggregate actuarial cost method does not identify or separately amortize
unfunded actuarial liabilities, information about funded status and funding progress has been
prepared using the entry age actuarial cost method for that purpose, and this information is
intended to serve as a surrogate for the funded status and funding progress of the plan.

-46-
NOTE 6 - RECONCILIATION OF GOVERNMENT-WIDE AND FUND FINANCIAL
STATEMENTS:
The governmental fund statement of revenues, expenditures, and changes in fund balances
includes reconciliation between net change in fund balances - total governmental funds and
change in net position of governmental activities as reported in the government-wide statement
of activities. One element of that reconciliation explains that “Governmental funds report capital
outlays as expenditures.” However, in the statement of activities, the cost of those assets is
allocated over their estimated useful lives and reported as “depreciation expense.” The details of
this $(6,403,701) difference are as follows:
Capital outlay $ 7,516,246
Depreciation expense (13,919,947)
Net adjustment to increase net changes in fund balances -
total governmental funds to arrive at changes in net
position of governmental funds
$ (6,403,701)
Another element of that reconciliation explains that "Recognition of Unavailable Revenue by
Shelby County decreases the Receivable from Shelby County." The details of this $(1,060,911)
are as follows:
Change in Unavailable Property taxes $ (1,060,911)
See next page

-47-
NOTE 7 - CAPITAL ASSETS:
A summary of changes in capital assets is as follows:
Capital Assets, Not Depreciated Capital Assets, Depreciated
Land
Construction
in
Progress
Equipment
and
Furniture
Buildings
Total
General Activities:
Balance, July 1, 2012 $ 23,325,374 $ 23,212,757 $ 38,736,042 $ 482,850,797 $ 568,124,970
Increases/Transfers - 8,881,481 204,795 22,489,847 31,576,123
Decreases/Transfers - (24,059,877) (94,959) (55,887) (24,210,723)
Balance, June 30, 2013 23,325,374 8,034,361 38,845,878 505,284,757 575,490,370
Accumulated Depreciation:
Balance, July 1, 2012 - - 23,507,736 142,653,389 166,161,125
Increases - - 2,730,674 11,189,273 13,919,947
Decreases - - (355,598) (35,212) (390,810)
Balance, June 30, 2013 - - 25,882,812 153,807,450 179,690,262
Total Capital Assets, Net $ 23,325,374 $ 8,034,361 $ 12,963,066 $ 351,477,307 $ 395,800,108
Depreciation expense was charged to governmental functions as follows:
Instructional programs $ 11,504,737
Student transportation 2,101,239
Food services 212,162 Operation and maintenance of plant 101,809
$ 13,919,947
NOTE 8 - COMMITMENTS AND CONTINGENCIES:
The Board is involved in certain litigation proceedings which arose out of the normal course of
operations. Management of the Board intends to vigorously defend each claim and believes no
material losses will be incurred on such claims. The Board has recognized accrued liabilities for
certain other claims and judgments of $2,932,900. The liabilities are based on property damage
and personal injury lawsuits arising in the course of operations. The Board believes this is a
reasonable measure of the ultimate settlement of these matters.

-48-
At June 30, 2013, the Board had $-0- in construction contracts outstanding.
NOTE 9 - INTERFUND RECEIVABLES, PAYABLES AND TRANSFERS:
Interfund receivables and payables consist of the following:
Receivable Fund Payable Fund Amount
General Fund School Cafeteria Fund $ 6,292,524
General Fund Federal Projects Fund 1,782,238
General Fund Miscellaneous 958,542
Federal Project Funds General Fund 144,882
General Fund Capital Projects Fund 2,625,000
$ 11,803,186
The interfund amounts payable to the General Fund represents amounts advanced to the payable
funds to cover short-term cash flow requirements.
Transfers during the year were as follows:
Transfers Out: Transfers In: Amount:
Federal Funds General Fund $ 845,487
Other Governmental Funds General Fund 23,479
Total Transfers $ 868,966
Transfers are used to offset cash advances from General Fund during outstanding billing period
for Federal Funds.
See next page

-49-
NOTE 10 - RISK MANAGEMENT:
Shelby County Board of Education maintains a self-insured health insurance fund for its active
and retired employees and their dependents, funded by both the Board and its employees. The
fund maintains a stop-loss insurance policy which limits the Board’s liability for any specific
medical claim. Incurred but not reported (IBNR) claims liabilities of the fund are actuarially
determined based on prior paid claims history. The IBNR claims liability at June 30, 2013
totaled $3,241,492. Changes in the balances of claims liabilities for the year ended June 30,
2013 and 2012 are as follows:
2013 2012
Unpaid claims, beginning of year $ 3,614,072 $ 2,862,316
Incurred claims (including IBNR) 35,105,015 38,654,093
Claims payments (35,477,595) (37,882,337)
Unpaid claims, end of year $ 3,241,492 $ 3,614,072
The Board maintains commercial insurance to cover significant losses for all major programs
related to property and liability. For insured programs, there have been no significant reductions
in insurance coverage during the year. Settlement amounts have not exceeded insurance
coverage for the current or three years prior.
NOTE 11 – CHARTER SCHOOLS:
In 2002, the State of Tennessee passed the Tennessee Public Charter Schools Act. The Act
permits the Board of Education to authorize public charter schools with the primary purpose to
improve learning for all students and close the achievement gap between high and low
performing students. An agreement is entered between the sponsor of the charter school and the
Board. The charter is approved for an initial period of ten years, but can be revoked by the
Board or the State if the school violates certain requirements of the Act. Each school must be
operated by a not-for-profit organization with exemption from Federal taxation under 501(c)3 of
the Internal Revenue Code and is responsible for establishing their own governing body separate
from that of the Board. The charter schools are supported by the Board as a pass-through from
various funding sources. In 2010, the State of Tennessee amended the Charter Schools Act
requiring the State to distribute the BEP for capital outlay directly to the charter schools. For the
year ended June 30, 2013, total funds remitted or payable to the charter school totaled $58,777.
Upon dissolution, any unencumbered public funds, property and improvements, furnishings, and
equipment purchased with public funds shall revert to full ownership of the Board. All debts are
the responsibility of the charter school.

-50-
NOTE 12 - POST EMPLOYMENT BENEFITS OTHER THAN PENSIONS:
A. PLAN DESCRIPTION
Shelby County Board of Education (the School Board) administers the Shelby County Board of
Education’s Retiree Medical and Prescription Drug Plan (the Plan) as a single-employer defined
benefit Other Post Employment Benefit plan (OPEB). The Plan provides for continuation of
medical and life insurance benefits for certain retirees and their spouses and can be amended by
action of the School Board subject to applicable collective bargaining and employment
agreements. The Plan does not issue a standalone financial report since there are no assets
legally segregated for the sole purpose of paying benefits under the Plan.
B. FUNDING POLICY
The obligations of the plan members, employers and other entities are established by action of
the School Board pursuant to employment agreements. The required contribution rates of the
employer and the members vary depending on the retiree’s length of service and whether single
or family coverage is elected. The School Board currently contributes enough money to the plan
to satisfy current obligations on a pay-as-you-go basis. Shelby County Board of Education funds
on a cash basis as benefits are paid. The costs of administering the plan are paid by the School
Board. No assets have been segregated and restricted to provide postretirement benefits.
C. ACCOUNTING POLICY
The accrual basis of accounting is used. The fair market value of assets, if any, is determined by
the market value of assets, if any, paid by a willing buyer to a willing seller.
D. ANNUAL OPEB COST AND NET OPEB OBLIGATION
The Shelby County Board of Education annual other post-employment benefit (OPEB) cost
(expense) is calculated based on the annual required contribution of the employer (ARC).
Shelby County Board of Education has engaged an actuary to calculate the ARC and related
information per the provisions of GASB 45 for employers in plans with more than one hundred
total plan members. The ARC represents a level of funding that, if paid on an ongoing basis is
projected to cover normal cost each year and to amortize any unfunded actuarial accrued
liabilities (UAAL) (or funding excess) over a period not to exceed thirty years. The following
table shows the components of Shelby County Board of Education’s annual OPEB cost, the
amount actually contributed to the plan, and the School District’s net OPEB obligation of the
Retiree Health and Life Plan at June, 30, 2013, and the preceding year:

- 51 -
E. FUNDED STATUS AND FUNDING PROGRESS
As of June 30, 2013, the actuarial accrued liability for benefits was $342,401,361 of which
$338,573,222 was unfunded. The covered payroll (annual payroll of active employees covered
by the plan) was $266,155,425, and the ratio of the unfunded actuarial accrued liability to the
covered payroll was 127%. The actuarial value of assets are $3,828,139.
The projection of future benefit payments for an ongoing plan involves estimates of the value of
reported amounts and assumptions about the probability of occurrence of events far into the
future.
Examples include assumptions about future employment, mortality, and the healthcare cost
trend. Amounts determined regarding the funded status of the plan and the annual required
contributions of the employer are subject to continual revision as actual results are compared
with past expectations and new estimates are made about the future. The schedule of funding
progress, presented as required supplementary information, presents multiyear trend information
about whether the actuarial value of plan assets is increasing or decreasing over time relative to
the actuarial accrued liabilities for benefits.
POST EMPLOYMENT BENFITS OTHER THAN PENSIONS (OPEB)
Annual OPEB Cost 2013 2012 2011
Normal Cost at beginning of the year 12,691,075$ 16,935,545$ 17,257,411$
Amortization of UAAL 18,200,385 20,558,783 20,692,731
Interest 1,235,658 649,574 707,580
ARC 32,127,118 38,143,902 38,657,722
Interest on net OPEB Obligation 8,377,788 9,031,390 7,529,176
Adjustment to ARC (12,331,883) (11,190,570) (9,329,214)
OPEB Expense 28,173,023 35,984,722 36,857,684
NET OPEB contributions(actuarial assumption) (8,450,651) (7,167,827) (6,813,402)
Increase in Net OPEB Obligation 19,722,372 28,816,895 30,044,282
Net OPEB Obligation, beginning of year 209,444,702 180,627,807 150,583,525
Net OPEB Obligation, end of year 229,167,074$ 209,444,702$ 180,627,807$
Percentage of expense contributed 30.0% 19.9% 18.5%
Unfunded actuarial accrued liability $338,573,222 $331,840,841 $334,515,237
Covered Payroll $266,155,425 $237,564,653 $251,851,782
Ratio 127.21% 139.68% 132.82%
Fiscal Year Ending June 30

-52-
F. METHODS AND ASSUMPTIONS
Projections of benefits for financial reporting purposes are based on the substantive plan (the
plan as understood by the employer and plan members) and include the types of benefits
provided at the time of each valuation and the historical pattern of sharing of benefit costs
between the employer and plan members to the point. The methods and assumptions used
include techniques that are designed to reduce the effects of short-term volatility in actuarial
accrued liabilities and the actuarial value of assets, consistent with the long-term perspective of
the calculations. The following assumptions were made:
i. Measurement Date
July 1, 2013
ii. Investment Return (Discount Rate) as of June 30, 2013, 4.0% per year compounded annually.
This is the rate used to discount future benefit liabilities into today’s dollars.
iii. Mortality Table
The RP Mortality Tables for Males and Females projected to 2015, combined healthy, no collar
were used.
Mortality Assumption
Annual Death Rate Per 1,000 Participants
Age Male Female
20 0.259 0.150
25 0.323 0.168
30 0.412 0.227
35 0.717 0.402
40 0.957 0.563
45 1.239 0.882
50 1.628 1.296
55 2.718 2.409
60 5.297 4.689
65 10.309 9.003
iv. Withdrawal from Service
Withdrawal from Service follows select rates of 15% in the first year of service and 12% in the
second, TCRS teacher’s ultimate male and female withdrawal rates assumptions.

-53-
Age Males Females
16 10.0% 0.0%
17 10.0% 0.0%
18 10.0% 0.0%
19 9.7% 0.0%
20 9.7% 10.5%
21 9.5% 10.5%
22 9.3% 10.5%
23 9.1% 10.5%
24 8.8% 10.5%
25 8.4% 9.9%
26 8.0% 9.9%
27 7.6% 9.9%
28 7.1% 9.9%
29 6.7% 9.9%
30 6.2% 7.7%
31 5.7% 7.7%
32 5.3% 7.7%
33 4.8% 7.7%
34 4.4% 7.7%
35 3.9% 5.1%
36 3.5% 5.1%
37 3.1% 5.1%
38 2.8% 5.1%
39 2.5% 5.1%
40 2.2% 2.7%
41 1.9% 2.7%
42 1.7% 2.7%
43 1.6% 2.7%
44 1.4% 2.7%
45 1.4% 1.3%
46 1.3% 1.3%
47 1.4% 1.3%
48 1.5% 1.3%
49 1.6% 1.3%
50 1.8% 1.5%
51 2.0% 1.5%
52 2.3% 1.5%
53 2.6% 1.5%
54 3.0% 1.5%
55 3.4% 3.7%
56 3.9% 3.7%
57 4.4% 3.7%
58 5.0% 3.7%
59 5.0% 3.7%
60 5.0% 5.0%
61 5.0% 5.0%
62 5.0% 5.0%
63 5.0% 5.0%
64 5.0% 5.0%
65+ 0.0% 0.0%
7/1/2012

-54-
v. Opt-out Rates
Ninety five percent (95%) of future retirees are assumed to elect medical coverage. Ninety seven
percent (97%) of future retirees are assumed to elect life insurance coverage.
vi. Medicare
Medicare is expected to continue to cover the same portion of costs as it currently does. Retirees
may participate in the Basic Plan PPO for pre-Medicare and Medicare eligible medical coverage.
Shelby County Board of Education receives a monthly subsidy (Medigap) from the State for all
certificated Medicare eligible retirees based on service as follows:
Years of Service Monthly Subsidy
30 or more $50.00
At least 20, less than 30 $37.50
At least 15,Iess than 20 $25.00
Less than 15 $0.00
vii. Marriage Rates
Twenty-five percent (25%) of the retirees are assumed to cover a spouse under the medical plan.
Females are assumed to be three years younger than males.
See next page

-55-
viii. Health Care Trend Factors and Inflation Assumptions
The health care trend assumes an inflation rate of 3.0%. The trend rate of incurred claims
represents the rate of increase in employer claim payments. Health care costs are assumed to
increase in accordance with the following schedule:
Years
Beginning
7/1
Medical Annual
Rates of Increase
Dental Annual
Rates of Increase
2012 7.60% 5.70%
2013 7.40% 5.60%
2014 7.30% 5.50%
2015 7.20% 5.40%
2016 7.00% 5.30%
2017 6.90% 5.20%
2018 6.80% 5.10%
2019 6.60% 5.00%
2020 6.40% 5.00%
2021 6.20% 4.90%
2022 6.00% 4.90%
2023 5.80% 4.80%
2024 5.60% 4.80%
2025 5.40% 4.70%
2026 5.20% 4.70%
2027 5.00% 4.60%
2028 4.80% 4.60%
2029+ 4.50% 4.50%
ix. Salary Scale
Salaries are assumed to increase 3.5% per year.

-56-
x. Retirement Rates
TCRS teachers’ retirement rates assumption. Upon reaching age 60 and 15 years of service, the
retirement rate is assumed to increase by 8.0% in that year. Upon 30 years of service before age
60, the retirement rate is assumed to increase by 12.5% in that year. Employees are assumed to
retire In accordance with the following schedule:
Less than 30 30 or more
Age Years of Service Years of Service
50 1.6% 6.5%
51 1.8% 7.0%
52 1.8% 7.0%
53 2.1% 8.5%
54 2.3% 9.0%
55 2.5% 10.0%
56 3.0% 12.0%
57 3.4% 13.5%
58 3.5% 14.0%
59 3.6% 14.5%
60 15.0% 15.0%
61 20.0% 20.0%
62 26.0% 26.0%
63 19.5% 19.5%
64 24.0% 24.0%
65 37.5% 37.5%
66 30.5% 30.5%
67 28.5% 28.5%
68 28.5% 28.5%
69 28.5% 28.5%
70+ 100.0% 100.0%
7/1/2012

-57-
xi. Change in Assumptions
The following actuarial assumptions have been changed since the prior year to better reflect the
expected experience of the covered population.
Demographic assumptions such as withdrawal, retirement, retiree participation and
spouse participation
Health care trend rates
Medicare supplement premium rates
Discount rate
Additionally, the accrual liability shown on page 4 at June 30, 2013 reflects the expected
per capita costs and retiree contributions for the new plan effective September 1,
2013.
The basis of the change in many of the actuarial assumptions was due to the merger of Memphis
City Schools and Shelby County Board of Education.
xii. Change in Plan Provisions
Effective January 1, 2013, the Post-65 plan was changed to a Medicare Supplement for Medicare
Eligible Retirees.
xiii. Method Used to Determine Actuarial Value of Assets
Fair Market Value.
xiv. Amortization Method
The unfunded actuarial liability is amortized as level percent of pay.
xv. Amortization Period
In developing the annual required contribution, 30 years closed amortization period from July 1,
2007.

-58-
xvi. Period Open or Closed
Shelby County Board of Education’s annual required contribution was developed using period
closed. With a closed amortization period, the amortization period is counted from one date and
declines to zero (in 30 years). With an open amortization period, the amortization period is
recalculated each time a new valuation is performed. There is a belief that an open amortization
period is appropriate for amortization of unfunded liabilities arising from actuarial gains or
losses, but that a closed amortization period is appropriate for amortization of liabilities relating
to past underfunding of OPEB obligations because it would take Shelby County Board of
Education substantially longer to amortize its liabilities using an open amortization period rather
than closed.
xvii. Actuarial Cost Method
The valuation was developed using the projected unit cost actuarial cost method.
xviii. Actuarial Gains and Losses
The Plan experienced actuarial gains of $37 million as of the valuation date of July 1, 2013. The
major components of this gain can be described as follows:
1) A 15.8% gain due to updated census;
2) A 8.0% gain due to updated claims and retiree premium experience;
3) A 4.7% gain due to the change in trend assumptions and the change in the salary increase
assumption
from 4.0% to 3.5%;
4) A 6.9% loss due to the change in the retirement assumptions and eligibility.
5) A 6.0% loss due to the change in turnover assumptions.
6) A 10.4% gain due to the change in participation and spousal election assumptions.
7) A 0.4% loss due to the excise tax and ACA fees.
8) A 19.4% loss due to the change in discount rate from 5.0% to 4.0%.
Please see Note 15 - Subsequent Events for additional information regarding the district’s OPEB
obligation.

-59-
NOTE 13 – FUND BALANCES BY PURPOSE:
Following is more detailed information on the governmental fund balances:
General
Fund
Capital
Projects Fund
Special
Revenue Fund
Total
Governmental
Funds
Fund Balances:
Nonspendable:
Inventories $ 2,811,900 $ - $ - $ 2,811,900
Food Services Inventory - - 688,959 688,959
Restricted for:
Capital Projects - 105,723 - 105,723
BEP 11,072,259 - - 11,072,259
Food Services - - 3,888,773 3,888,773
Unassigned:
General purpose 4,359,929 - - 4,359,929
Total Fund Balances $ 18,244,088 $ 105,723 $ 4,577,732 $ 22,927,543
NOTE 14 – PRIOR PERIOD ADJUSTMENT:
During 2013, due to the merger of Memphis City Schools and Shelby County Schools - effective
July 1, 2013 - a review of SCBOE's funds and the impact on financial statements was performed
by management. In an effort to report funds consistently in both Districts' financial statements,
the Student Activity Fund was moved from Other Governmental Funds to the Fiduciary Fund -
Agency. The total restatement is $6,469,082. Therefore, the beginning net position on the
Changes in Net Position From Operating Results as of June 30, 2012, has been restated to reflect
the decrease of the $6.5 million. The Statement of Activities has also been adjusted to reflect the
same adjustment.
NOTE 15 - SUBSEQUENT EVENTS:
The merger with Memphis City Schools was effective at the beginning of the 2013-14 school
year. A combined budget was prepared for the 2013-2014 fiscal year and approved by the
Shelby County Board of Education and the Shelby County Board of Commissioners. The assets
and obligations of Memphis City Schools were transferred to the Shelby County Board of
Education.

-60-
As of June 30, 2013, Shelby County Board of Education did not employ any former Memphis
City Schools employees, nor did its medical plan cover former employees of or retirees from
Memphis City Schools. No postretirement medical obligation associated with these employees
and retirees is included in the Shelby County Board of Education obligation as of June 30, 2013.
Subsequent to June 30, 2013, some former employees of and retirees from Memphis City County
Schools were employed by Shelby County Board of Education or covered as retirees under the
medical plan of Shelby County Board of Education. The obligation associated with the
provision of postretirement medical benefits for these employees and retirees will be recorded by
Shelby County Board of Education for the year ended June 30, 2014. The amount of this
obligation, based on the plan provisions in effect July 1, 2013 and the employee population as of
July 1, 2013, is estimated as follows:
POST EMPLOYMENT BENFITS OTHER THAN PENSIONS (OPEB)
Annual OPEB Cost June 30, 2013
Normal Cost at beginning of the year 43,182,524$
Amortization of UAL 45,862,717
Interest 3,561,810
ARC 92,607,051
Interest on net OPEB Obligation 17,146,599
Adjustment to ARC (18,241,063)
OPEB Expense 91,512,587
NET OPEB contributions made during the fiscal year (37,739,711)
Increase in Net OPEB Obligation 53,772,876
Net OPEB Obligation, beginning of year 428,664,974
Net OPEB Obligation, end of year 482,437,850$
Percentage of expense contributed 41.2%
Unfunded actuarial accrued liability $1,130,585,514
Covered Payroll $615,953,221
Ratio 183.55%
Subsequent to fiscal year 2013, a physical inventory of assets was conducted by an independent
asset auditing company. The asset audit summary reported 18.26% missing, 80.33% found, and
1.41 % as not verified. In addition, the audit identified 10,281 items that were not recorded in
assets by the SCBOE. As a result, the SCBOE is currently undergoing an internal audit of assets
to confirm the audit results. Based on management’s estimates, capital assets would decrease by
an estimated $1.8 million (net of accumulated depreciation) due to missing items and increase by
$0.9 million (net of accumulated depreciation) for items identified as additions.

Required Supplementary Information


- 63 -
SHELBY COUNTY BOARD OF EDUCATION
(A Component Unit of Shelby County, Tennessee)
Schedule of Funding Progress
Shelby County Board of Education Defined Benefit Plan
(dollar amounts in thousands)
For the Year Ended June 30, 2013
Actual
Valuation
Date
Actuarial
Value of
Plan Assets
(a)
Actuarial
Accrued
Liability
(AAL) - Entry
Age
(b)
Unfunded
AAL
(UAAL)
(b) - (a)
Funded
Ratio
(a/b)
Covered
Payroll
(c)
UAAL as a
Percentage
of Covered
Payroll
((b-a)/c)
June 30, 2011 $ 135,868 $ 139,437 $ 3,569 97.44% $ 49,536 7.20%
June 30, 2009 $ 110,442 $ 115,444 $ 5,001 95.67% $ 47,330 10.57%
June 30, 2007 $ 103,860 $ 110,101 $ 6,241 94.33% $ 38,818 16.08%
The Governmental Accounting Standards Board (GASB) requires the plan to prepare the
Schedule of Funding Progress using the entry age actuarial cost method. The two most recent
valuations are presented herein.
Schedule of Funding Progress
Other Post Employment Benefits Plan (OPEB)
For the Year Ended June 30, 2013
Actual
Valuation
Date
Actuarial
Value of
Assets
(a)
Actuarial
Accrued
Liability
(AAL)
Projected
Unit Credit
(b)
Unfunded
AAL
(UAAL)
(b - a)
Funded
Ratio
(a / b)
Covered
Payroll
(c)
UAAL as a
Percentage
of Covered
Payroll
((b - a) / c)
June 30, 2013 $ 3,828,139 $ 342,401,361 $ 338,573,222 1.27% $ 266,155,452 127.270%
June 30, 2012 $ 3,000,000 $ 334,840,841 $ 331,840,841 0.89% $ 237,564,653 139.680%
June 30, 2011 $ 3,000,000 $ 337,515,237 $ 334,515,237 0.88% $ 251,851,782 132.82%
The Board began recognition of OPEB on July 1, 2007. Effective January 1, 2011, post 65
retirees formerly covered under the self-insured plan were converted to coverage under the
insured Medicare Supplement plan which significantly reduced claim costs. Additional
reductions are anticipated each year due to census changes, changes in retiree contributions, and
any retirements or terminations that did not occur as expected in the prior valuation.

This page intentionally left blank

Supplemental Information

- 66 -
SHELBY COUNTY BOARD OF EDUCATION
(A Component Unit of Shelby County, Tennessee)
Schedule of Revenues and Expenditures - By Type (Budgetary Basis) -
Federal Projects Funds
For the Year Ended June 30, 2013
Carl IDEA IDEA
Title I Perkins Part B Preschool Title II
Revenues $ 6,366,260 $ 499,514 $ 9,341,025 $ 237,384 $ 952,985
Expenditures
Regular education program 2,349,716 - - - 621,655
Special education program 2,500 - 6,247,707 229,343 -
Early Childhood Development - - - - -
Vocational education program - 366,653 - - -
Support services 3,747,712 119,930 1,084,512 - 287,334
Student transportation - - 1,579,320 - -
Food services - - - - -
Total Expenditures $ 6,099,928 $ 486,583 $ 8,911,539 $ 229,343 $ 908,989
Excess of Revenues Over Expenditures $ 266,332 $ 12,931 $ 429,486 $ 8,041 $ 43,996

- 67 -
Total
$ 1,156,038 $ 1,942,521 $ 862,885 $ 594,600 $ 21,953,212
- - 862,885 360,459 4,194,715
- - - - 6,479,550
1,156,038 - - - 1,156,038
- - - - 366,653
- 1,852,843 - 235,729 7,328,060
- - - 3,608 1,582,928
- - - (219) (219)
$ 1,156,038 $ 1,852,843 $ 862,885 $ 599,577 $ 21,107,725
$ - $ 89,678 $ - $ (4,977) $ 845,487
Early Childhood
Education Pilot Project
Revenue
Implementation Fund
Other Non‑Major
ProgramsRace to the Top
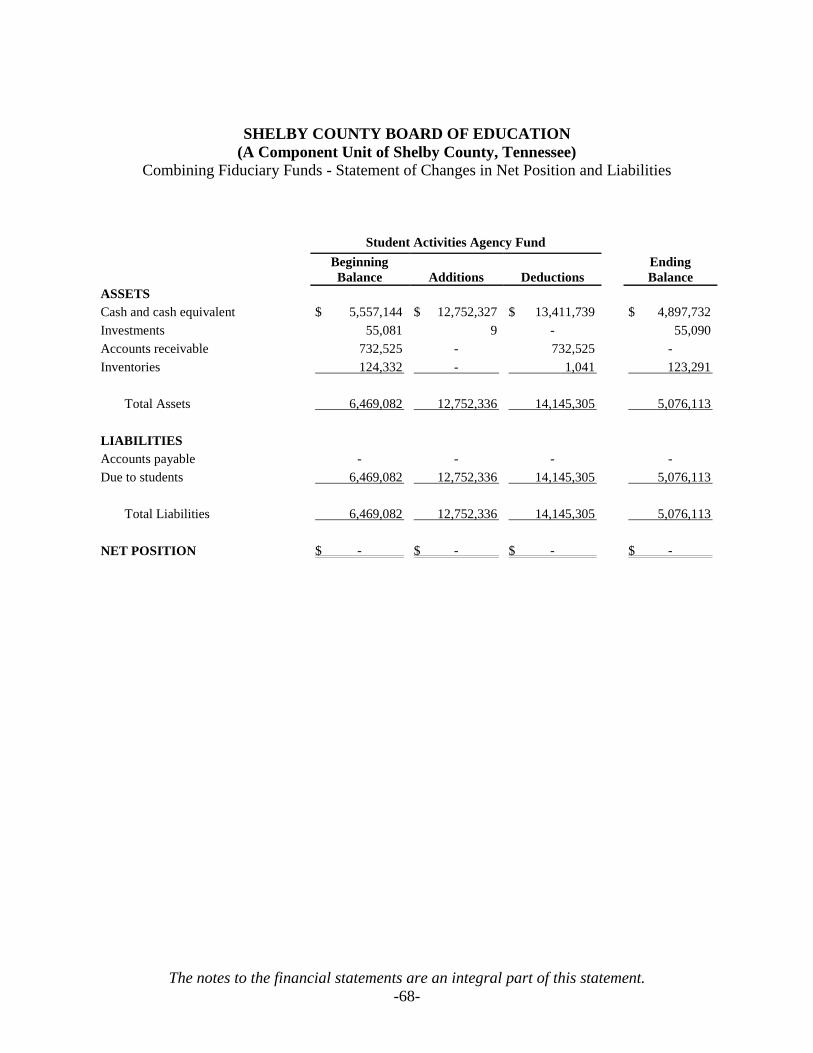
The notes to the financial statements are an integral part of this statement.
-68-
SHELBY COUNTY BOARD OF EDUCATION
(A Component Unit of Shelby County, Tennessee)
Combining Fiduciary Funds - Statement of Changes in Net Position and Liabilities
Student Activities Agency Fund
Beginning
Balance
Additions
Deductions Ending
Balance
ASSETS
Cash and cash equivalent $ 5,557,144 $ 12,752,327 $ 13,411,739 $ 4,897,732
Investments 55,081 9 - 55,090
Accounts receivable 732,525 - 732,525 -
Inventories 124,332 - 1,041 123,291
Total Assets 6,469,082 12,752,336 14,145,305 5,076,113
LIABILITIES
Accounts payable - - - -
Due to students 6,469,082 12,752,336 14,145,305 5,076,113
Total Liabilities 6,469,082 12,752,336 14,145,305 5,076,113
NET POSITION $ - $ - $ - $ -

The notes to the financial statements are an integral part of this statement.
-69-
SHELBY COUNTY BOARD OF EDUCATION
(A Component Unit of Shelby County, Tennessee)
Schedule of Construction In Progress
Construction
Program
Expenditures
For the Year Ended
June 30, 2013
Cumulative
Construction In
Progress
June 30, 2013
Gray's Creek New Central Office $ 140,927 $ -
Collierville Middle Replacement (410,257) -
ERP 7,304,066 7,304,066
Bus Barn Sewer Extebsuib 84,715 89,465
Millington High Master Plan II, III, IV 192,000 640,830
Total $ 7,311,451 $ 8,034,361

This page intentionally left blank

Statistical Section (unaudited)


- 73 -
STATISTICAL AND OTHER INFORMATION (UNAUDITED) OVERVIEW SHELBY COUNTY Year Ended June 30, 2013 BOARD OF EDUCATION
This part of the Shelby County Board of Education Comprehensive Annual Financial Report
presents detailed information as a context for understanding what the information in the financial statements, note disclosures, and required supplementary information says about
the School District’s overall financial health.
Contents
Financial Trends These schedules contain trend information to help the reader understand how the School District’s financial performance and well-being have changed over time.
Revenue Capacity
These schedules contain information to help the reader assess the factors affecting the School District’s ability to generate revenues through property taxes levied by other governmental agencies.
Debt Capacity
These schedules present information to help the reader assess the affordability of the School District’s current levels of outstanding debt and the School District’s ability to issue additional debt in the future.
The School District does not have taxing authority and does not have a legal debt margin.
Accordingly, schedules regarding legal debt margin and overlapping debt are not
applicable. In addition, the School District does not have any pledged revenue. Demographic and Economic Information
These schedules offer demographic and economic indicators to help the reader understand the environment within which the School District’s financial activities take place and to help make comparisons over time and with other governments.
Operating Information
These schedules contain information about the School District’s operations and resources to help the reader understand how the School District’s financial information relates to the services the School District provides and the activities it performs.
Sources
Unless otherwise noted, the information in these schedules is derived from the annual
financial reports for the relevant year.

This page intentionally left blank

Financial Trends

- 76 -
STATISTICAL AND OTHER INFORMATION (UNAUDITED)
FINANCIAL TRENDS
Net Position by Component
As of June 30
Net Position 2013 2012 2011 2010
Invested in investment in capital assets,
net related debt 395,800,108$ 401,963,845$ 391,964,327$ 375,685,630$
Restricted for:
Capital projects 105,723 710,469 2,987,803 -
Insurance Clains 2,254,559 3,976,350 9,886,051 12,296,837
Student activities - 6,344,750 5,954,246 5,505,780
Food service 3,888,773 3,710,791 3,117,887 -
Education 11,072,259 10,793,684 11,018,457 -
Unrestricted (225,599,235) (187,003,125) (145,756,475) (72,619,489)
187,522,187$ 240,496,764$ 279,172,296$ 320,868,758$

- 77 -
SHELBY COUNTY
BOARD OF EDUCATION
2009 2008 2007 2006 2005 2004
376,442,501$ 364,559,286$ 348,090,522$ 310,633,617$ 301,560,738$ 304,551,290
- - - - - -
15,050,314 12,495,771 11,448,076 7,891,438 4,152,875 3,846,978
5,109,906 5,244,728 4,366,513 4,576,055 4,127,287 4,224,710
- - - - - -
- - - - - -
(36,674,608) 51,601,141 96,191,834 92,059,649 57,749,829 80,005,324
359,928,113$ 433,900,926$ 460,096,945$ 415,160,759$ 367,590,729$ 392,628,302$

This page intentionally left blank

Revenue Capacity

- 80 -
STATISTICAL AND OTHER INFORMATION (UNAUDITED)
REVENUE CAPACITY
Assessed Value and Estimated Actual Value of Taxable Property
Last ten fiscal years ending June 30
Utilities and Carriers (55%)
Real Property Personal Property (Real and Personal)
Farm and Commercial and Commercial and
Residential (25%) Industrial (40%) (2) Industrial (30%) (1) Privately Owned
Fiscal
Year
Tax
Year Assessed Value Assessed Value Assessed Value
2004 2003 7,972,813,784 4,958,614,785 1,301,588,530
2005 2004 8,212,018,085 4,830,896,025 1,232,343,955
2006 2005 9,425,210,140 5,471,742,335 1,289,881,700
2007 2006 9,695,032,075 5,441,266,015 1,326,178,545
2008 2007 10,018,623,775 5,439,860,370 1,286,578,685
2009 2008 10,259,997,845 5,530,133,410 1,402,492,320
2010 2009 10,954,449,590 6,285,548,950 1,468,617,700
2011 2010 10,794,438,245 6,116,755,995 1,388,887,495
2012 2011 10,721,303,794 5,828,574,575 1,380,179,795
2013 2012 10,649,905,970 5,660,543,555 1,438,945,120
Percentage of Total
2004 52.75% 32.81% 8.61%
2005 54.08% 31.81% 8.12%
2006 54.73% 31.78% 7.49%
2007 55.39% 31.09% 7.58%
2008 56.54% 30.70% 7.26%
2009 56.72% 30.57% 7.75%
2010 55.73% 31.98% 7.47%
2011 55.89% 31.67% 7.19%
2012 56.43% 30.68% 7.26%
2013 56.50% 30.03% 7.63%
(1) Includes intangible personal property which is assessed at 40%
(2) Includes multiple real estate assessed at 0-40% as well as greenbelt commercial at 25%,
greenbelt industrial at 25% and greenbelt multiple real estate at 0-40%

- 81 -
SHELBY COUNTY
BOARD OF EDUCATION
Utilities and Carriers (55%)
(Real and Personal)
Privately Owned Total
Assessed Value Assessed Value
Estimated Actual
Value
Assessed Value
as a % of Actual
Value
Total
Direct
Tax Rate
880,949,964 15,113,967,063 50,379,365,307 30.00% 4.04
910,598,020 15,185,856,085 50,841,730,464 29.87% 4.04
1,033,424,138 17,220,258,313 57,726,276,478 29.83% 4.04
1,040,281,497 17,502,758,132 58,862,669,304 29.73% 4.04
975,529,145 17,720,591,975 59,900,899,755 29.58% 4.04
896,680,554 18,089,304,129 61,383,315,080 29.47% 4.04
948,762,385 19,657,378,625 66,374,654,928 29.62% 4.02
1,012,006,455 19,312,088,190 65,216,500,736 29.61% 4.02
1,069,425,931 18,999,484,095 64,287,973,983 29.55% 4.02
1,098,465,902 18,847,860,547 63,834,911,731 29.53% 4.02
5.83% 100.00% 100.00%
5.99% 100.00% 100.00%
6.00% 100.00% 100.00%
5.94% 100.00% 100.00%
5.50% 100.00% 100.00%
4.96% 100.00% 100.00%
4.82% 100.00% 100.00%
5.25% 100.00% 100.00%
5.63% 100.00% 100.00%
5.84% 100.00% 100.00%

- 82 -
STATISTICAL AND OTHER INFORMATION (UNAUDITED)
REVENUE CAPACITY
Property Tax Rates and Levies
Last ten fiscal years ending June 30
Tax Rates per $100 Assessed Value Tax Levies
Fiscal Year Tax Year County City Total
County
Allocation to
Schools
Shelby County
Schools Percent
of County
Allocation
2004 2003 4.04 3.23 7.27 2.03 70.69%
2005 2004 4.04 3.23 7.27 2.03 72.10%
2006 2005 4.04 3.43 7.47 2.03 71.51%
2007 2006 4.04 3.43 7.47 2.02 70.82%
2008 2007 4.04 3.43 7.47 2.02 69.57%
2009 2008 4.04 3.25 7.29 2.02 69.22%
2010 2009 4.02 3.20 7.22 1.98 68.67%
2011 2010 4.02 3.20 3.20 1.90 69.06%
2012 2011 4.02 3.19 3.19 1.91 69.24%
2013 2012 4.02 3.11 3.11 1.91 31.06%
Taxes are assessed as of January 1 and are due on October 1 for the County
for Shelby County.
NOTE: Shelby County Schools does not have taxing authority and is not responsible
for the collection of or the monitoring of the collection of taxes.
Source: Shelby County Government Finance Department
- 83 -
SHELBY COUNTY
BOARD OF EDUCATION
Tax Levies
City County Total
325,695,529 596,378,594 922,074,123
324,340,510 606,615,294 930,955,804
380,947,344 681,245,173 1,062,192,517
384,877,389 704,279,575 1,089,156,964
392,477,211 717,010,251 1,109,487,462
375,803,751 730,042,595 1,105,846,346
389,347,038 768,641,959 1,157,988,997
380,172,801 756,936,983 1,137,109,784
376,723,118 754,262,345 1,130,985,463
369,997,811 759,276,758 1,129,274,569

- 84 -
STATISTICAL AND OTHER INFORMATION (UNAUDITED)
REVENUE CAPACITY
Principal Property Tax Payers
Current Year and Nine Years Ago
2013
Name of Taxpayer
Taxable Assessed
Value
Percentage of
Total Taxable
Assessed
Value
Federal Express 578,276,395$ 3.07%
Bell South Telecommunications 119,381,575 0.63%
AT & T Mobility LLC 65,781,432 0.35%
Belz Investco Group 64,339,215 0.34%
AMISUB (St. Francis Hospital) 63,542,400 0.34%
G& I VII Retail Carriage LLC 59,700,080 0.32%
Wolfchase Galleria, LTD 58,317,110 0.31%
Kroger Companies 57,541,060 0.31%
Boyle Investment Co 52,874,110 0.28%
Lightman Michael A 52,372,315 0.28%
Total Assessed Valuation of Top 10 Taxpayers 1,172,125,692 6.22%
Balance of Assessed Valuation 17,675,734,855 93.78%
18,847,860,547$ 100.00%
Source: Shelby County Government Finance Department

- 85 -
SHELBY COUNTY
BOARD OF EDUCATION
2004
Name of Taxpayer
Taxable Assessed
Value
Percentage of
Total Taxable
Assessed Value
Federal Express 366,735,073$ 2.43%
Bell South Telecommunications 182,464,170 1.21%
Belz Enterprises 83,166,650 0.55%
Wolfchase Galleria, LTD 53,899,240 0.36%
Union Planters 35,762,770 0.24%
AMISUB (St. Francis Hospital) Inc. 32,889,680 0.22%
Northwest Airlines, Inc. 32,099,591 0.21%
Mid-American Apartments LP 30,535,785 0.20%
First Tennessee Bank 28,294,175 0.19%
Premcor Refinancing Company 24,646,770 0.16%
870,493,904 5.76%
14,243,473,159 94.24%
15,113,967,063$ 100.00%

This page intentionally left blank

Demographic and Economic Information


- 89 -
STATISTICAL AND OTHER INFORMATION (UNAUDITED)
DEMOGRAPHIC AND ECONOMIC INFORMATION
Demographic and Economic Statistics SHELBY COUNTY
Last ten fiscal years ending June 30 BOARD OF EDUCATION
Fiscal
Year Population
Personal income
(in thousands)
Per Capita
Personal
Income
Unemployment
Rate
2003 906,733 31,504,263 34,745 6.0%
2004 906,643 33,095,510 36,383 6.1%
2005 913,201 34,129,205 37,373 6.2%
2006 920,106 36,103,204 39,238 5.7%
2007 921,119 37,635,149 40,858 5.3%
2008 920,685 37,507,530 40,739 7.0%
2009 922,541 35,742,501 38,744 10.1%
2010 928,930 36,813,844 39,630 10.0%
2011 935,088 38,116,646 40,763 9.9%
2012 940,764 N/A N/A 9.1%
Source: Shelby County Government Financial Department

- 90 -
STATISTICAL AND OTHER INFORMATION (UNAUDITED)
DEMOGRAPHIC AND ECONOMIC INFORMATION
Principal Employers
Current Year and Nine Years Ago
2013
Name of Employer
Employees
Percentage of
Total City
Employment
Federal Express Corporation 31,000 3.93%
Shelby County Schools (a) 15,969 2.02%
United States Government 13,900 1.76%
Methodist Le Bonheur Healthcare 9,250 1.17%
Tennessee State Government 8,600 1.09%
Baptist Memorial Health Care Corp. 7,286 0.92%
Memphis City Government 7,152 0.91%
Wal-Mart Stores, Inc. 6,000 0.76%
Shelby County Government 5,704 0.72%
Naval Support Activity Mid-South 4,076 0.52%
Total 108,937 13.81%
(a) In 2013 City and County Schools merged into what is now Shelby County Schools
Source: Shelby County Government Finance Department

- 91 -
SHELBY COUNTY
BOARD OF EDUCATION
2004
Name of Employer Employees
Percentage of
Total City
Employment
Federal Express Corporation 30,000 3.90%
Memphis City Schools 15,240 1.98%
United States Government 14,800 1.92%
Methodist Healthcare 7,258 0.94%
Shelby County Government 6,976 0.91%
Baptist Memorial Health Care Corp. 6,792 0.88%
Memphis City Government 6,698 0.87%
Tennessee State Government 5,200 0.68%
Wal-Mart Stores, Inc. 5,030 0.65%
Shelby County Schools 5,000 0.65%
Total 102,994 13.38%

This page intentionally left blank

Operating Information

- 94 -
STATISTICAL AND OTHER INFORMATION (UNAUDITED)
OPERATING INFORMATION
Summary of Buildings and Sites
Last ten fiscal years ending June 30
School/Building 2013 2012 2011 2010
Alturia ES (1976)
Square Feet 88,321 88,321 88,321 88,321
Classrooms 55 55 55 55
Design Capacity 1,100 1,100 1,100 1,100
Enrollment 787 750 759 753
Appling MS (1995)
Square Feet 96,000 96,000 96,000 96,000
Classrooms 50 50 50 50
Design Capacity 1,250 1,250 1,250 1,250
Enrollment 652 706 744 745
Arlington ES (1972)
Square Feet 87,949 87,949 87,949 87,949
Classrooms 58 58 58 58
Design Capacity 1,160 1,160 1,160 1,160
Enrollment 920 935 920 890
Arlington HS (2004)
Square Feet 327,069 327,069 327,069 327,069
Classrooms 116 116 116 116
Design Capacity 2,320 2,320 2,320 2,320
Enrollment 2,314 2,356 2,408 2,200
Arlington MS (2000)
Square Feet 91,097 91,097 91,097 91,097
Classrooms 56 56 56 56
Design Capacity 1,400 1,400 1,400 1,400
Enrollment 1,201 1,139 1,115 1,098

- 95 -
SHELBY COUNTY
BOARD OF EDUCATION
2009 2008 2007 2006 2005 2004
88,321 88,321 88,321 88,321 88,321 88,321
55 55 55 55 55 55
1,100 1,100 1,100 1,100 1,100 1,100
772 812 795 800 712 750
96,000 96,000 96,000 96,000 96,000 96,000
50 50 50 50 50 50
1,250 1,250 1,250 1,250 1,250 1,250
706 885 856 879 892 855
87,949 87,949 87,949 87,949 87,949 87,949
58 58 58 58 58 58
1,160 1,160 1,160 1,160 1,160 1,160
1,200 1,133 946 771 621 458
327,069 327,069 327,069 327,069 327,069
116 116 116 116 116
2,320 2,320 2,320 2,320 2,320
2,016 1,880 1,346 795 383
91,097 91,097 91,097 91,097 91,097 91,097
56 56 56 56 56 56
1,400 1,400 1,400 1,400 1,400 1,400
1,094 1,359 1,278 1,134 958 835
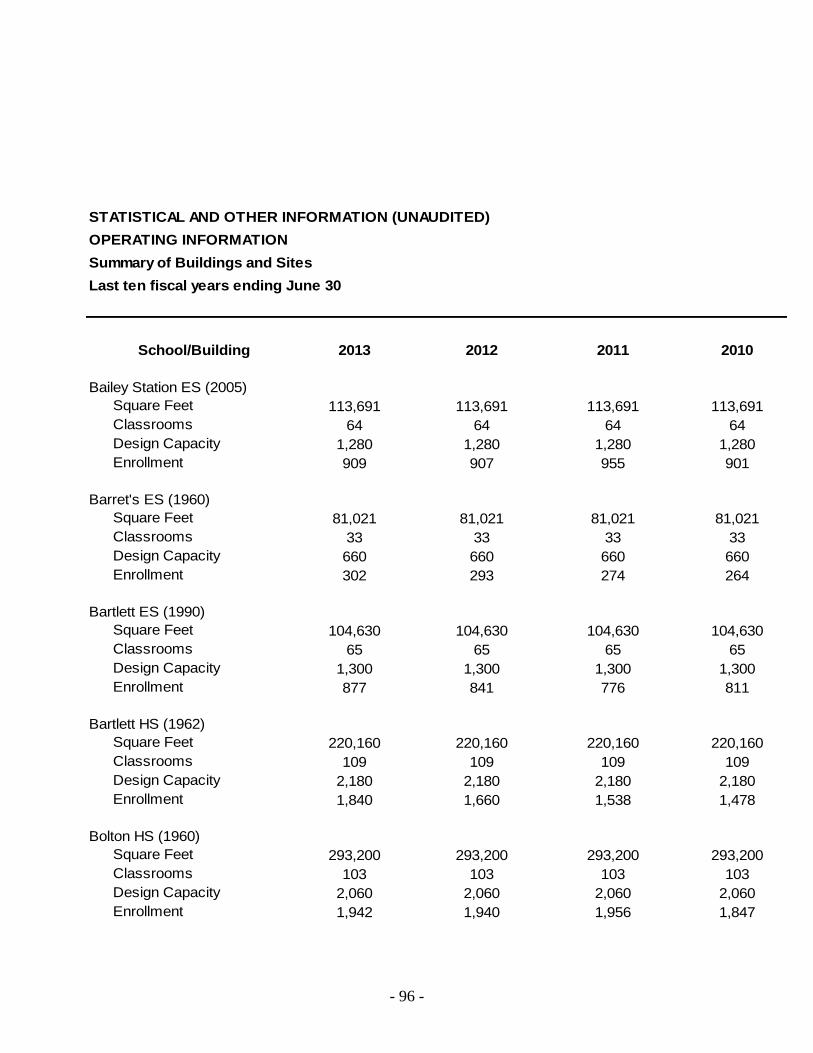
- 96 -
STATISTICAL AND OTHER INFORMATION (UNAUDITED)
OPERATING INFORMATION
Summary of Buildings and Sites
Last ten fiscal years ending June 30
School/Building 2013 2012 2011 2010
Bailey Station ES (2005)
Square Feet 113,691 113,691 113,691 113,691
Classrooms 64 64 64 64
Design Capacity 1,280 1,280 1,280 1,280
Enrollment 909 907 955 901
Barret's ES (1960)
Square Feet 81,021 81,021 81,021 81,021
Classrooms 33 33 33 33
Design Capacity 660 660 660 660
Enrollment 302 293 274 264
Bartlett ES (1990)
Square Feet 104,630 104,630 104,630 104,630
Classrooms 65 65 65 65
Design Capacity 1,300 1,300 1,300 1,300
Enrollment 877 841 776 811
Bartlett HS (1962)
Square Feet 220,160 220,160 220,160 220,160
Classrooms 109 109 109 109
Design Capacity 2,180 2,180 2,180 2,180
Enrollment 1,840 1,660 1,538 1,478
Bolton HS (1960)
Square Feet 293,200 293,200 293,200 293,200
Classrooms 103 103 103 103
Design Capacity 2,060 2,060 2,060 2,060
Enrollment 1,942 1,940 1,956 1,847

- 97 -
SHELBY COUNTY
BOARD OF EDUCATION
2009 2008 2007 2006 2005 2004
113,691 113,691 113,691 113,691
64 64 64 64
1,280 1,280 1,280 1,280
860 871 835 653
81,021 81,021 81,021 81,021 81,021 81,021
33 33 33 33 33 33
660 660 660 660 660 660
266 269 287 301 333 327
104,630 104,630 104,630 104,630 104,630 104,630
65 65 65 65 65 65
1,300 1,300 1,300 1,300 1,300 1,300
889 908 976 973 1,023 1,059
220,160 220,160 220,160 220,160 220,160 220,160
109 109 109 109 109 109
2,180 2,180 2,180 2,180 2,180 2,180
1,434 1,560 1,565 1,750 1,888 1,904
293,200 293,200 293,200 293,200 293,200 293,200
103 103 103 103 103 103
2,060 2,060 2,060 2,060 2,060 2,060
1,877 1,975 2,129 2,267 2,371 2,359

- 98 -
STATISTICAL AND OTHER INFORMATION (UNAUDITED)
OPERATING INFORMATION
Summary of Buildings and Sites
Last ten fiscal years ending June 30
School/Building 2013 2012 2011 2010
Bon Lin ES (2005)
Square Feet 110,658 110,658 110,658 110,658
Classrooms 63 63 63 63
Design Capacity 1,260 1,260 1,260 1,260
Enrollment 830 808 874 833
Bon Lin MS (2008)
Square Feet 111,442 111,442 111,442 111,442
Classrooms 52 52 52 52
Design Capacity 1,300 1,300 1,300 1,300
Enrollment 613 654 673 669
Central Office East (1965)
Square Feet 13,642 13,642 13,642 13,642
Classrooms N/A N/A N/A N/A
Design Capacity Not Available Not Available Not Available Not Available
Enrollment Administration Administration Administration Administration
Central Office Grays Creek (2012)
Square Feet 225,586 225,586
Classrooms N/A N/A
Design Capacity Not Available Not Available
Enrollment Administration Administration
Central Office West (1968)
Square Feet 27,364 27,364 27,364 27,364
Classrooms N/A N/A N/A N/A
Design Capacity Not Available Not Available Not Available Not Available
Enrollment Administration Administration Administration Administration
Chimneyrock ES Annexed by the City of Memphis in 2011.
Square Feet 49,538
Classrooms 28
Design Capacity 640
Enrollment 1,001

- 99 -
SHELBY COUNTY
BOARD OF EDUCATION
2009 2008 2007 2006 2005 2004
110,658 110,658 110,658 110,658
63 63 63 63
1,260 1,260 1,260 1,260
766 762 741 694
111,442
52
1,300
549
13,642 13,642 13,642 13,642 13,642 13,642
N/A N/A N/A N/A N/A N/A
Not Available Not Available Not Available Not Available Not Available Not Available
Administration Administration Administration Administration Administration Administration
27,364 27,364 27,364 27,364 27,364 27,364
N/A N/A N/A N/A N/A N/A
Not Available Not Available Not Available Not Available Not Available Not Available
Administration Administration Administration Administration Administration Administration
49,538 49,538 49,538 49,538 49,538 49,538
28 28 28 28 28 28
640 640 640 640 640 640
1,020 1,036 1,115 933 900 898

- 100 -
STATISTICAL AND OTHER INFORMATION (UNAUDITED)
OPERATING INFORMATION
Summary of Buildings and Sites
Last ten fiscal years ending June 30
School/Building 2013 2012 2011 2010
Collierville ES (1968)
Square Feet 114,081 114,081 114,081 114,081
Classrooms 66 66 66 66
Design Capacity 1,320 1,320 1,320 1,320
Enrollment 754 762 775 756
Collierville HS (1975)
Square Feet 281,172 281,172 281,172 281,172
Classrooms 107 107 107 107
Design Capacity 2,140 2,140 2,140 2,140
Enrollment 1,973 1,939 1,884 1,953
Collierville MS (2011) New building constructed in 2011.
Square Feet 114,865 114,865 114,865 114,865
Classrooms 54 54 54 54
Design Capacity 1,350 1,350 1,350 1,350
Enrollment 890 878 901 915
Cordova HS Annexed by the City of Memphis in 2005.
Square Feet
Classrooms
Design Capacity
Enrollment
Crosswind ES (1993)
Square Feet 90,629 90,629 90,629 90,629
Classrooms 52 52 52 52
Design Capacity 1,040 1,040 1,040 1,040
Enrollment 711 733 770 770
Dexter ES (2002)
Square Feet 119,082 119,082 119,082 119,082
Classrooms 65 65 65 65
Design Capacity 1,300 1,300 1,300 1,300
Enrollment 568 552 594 936

- 101 -
SHELBY COUNTY
BOARD OF EDUCATION
2009 2008 2007 2006 2005 2004
114,081 114,081 114,081 114,081 114,081 114,081
66 66 66 66 66 66
1,320 1,320 1,320 1,320 1,320 1,320
799 783 800 838 807 851
281,172 281,172 281,172 281,172 281,172 281,172
107 107 107 107 107 107
2,140 2,140 2,140 2,140 2,140 2,140
1,989 2,045 2,246 2,185 2,165 2,150
114,865 114,865 114,865 114,865 114,865 114,865
54 54 54 54 54 54
1,350 1,350 1,350 1,350 1,350 1,350
891 925 927 951 960 977
278,000
112
1,800
2,155
90,629 90,629 90,629 90,629 90,629 90,629
52 52 52 52 52 52
1,040 1,040 1,040 1,040 1,040 1,040
764 760 741 746 1,032 1,017
119,082 119,082 119,082 119,082 119,082 119,082
65 65 65 65 65 65
1,300 1,300 1,300 1,300 1,300 1,300
960 962 975 879 846 806
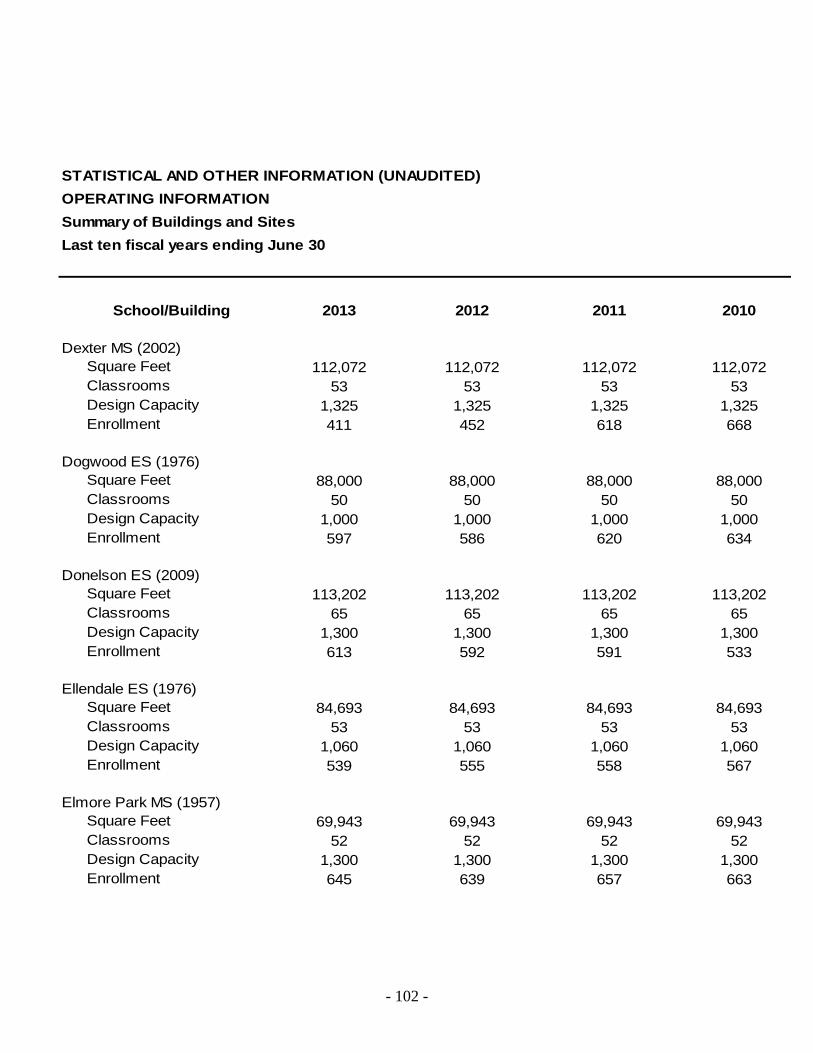
- 102 -
STATISTICAL AND OTHER INFORMATION (UNAUDITED)
OPERATING INFORMATION
Summary of Buildings and Sites
Last ten fiscal years ending June 30
School/Building 2013 2012 2011 2010
Dexter MS (2002)
Square Feet 112,072 112,072 112,072 112,072
Classrooms 53 53 53 53
Design Capacity 1,325 1,325 1,325 1,325
Enrollment 411 452 618 668
Dogwood ES (1976)
Square Feet 88,000 88,000 88,000 88,000
Classrooms 50 50 50 50
Design Capacity 1,000 1,000 1,000 1,000
Enrollment 597 586 620 634
Donelson ES (2009)
Square Feet 113,202 113,202 113,202 113,202
Classrooms 65 65 65 65
Design Capacity 1,300 1,300 1,300 1,300
Enrollment 613 592 591 533
Ellendale ES (1976)
Square Feet 84,693 84,693 84,693 84,693
Classrooms 53 53 53 53
Design Capacity 1,060 1,060 1,060 1,060
Enrollment 539 555 558 567
Elmore Park MS (1957)
Square Feet 69,943 69,943 69,943 69,943
Classrooms 52 52 52 52
Design Capacity 1,300 1,300 1,300 1,300
Enrollment 645 639 657 663

- 103 -
SHELBY COUNTY
BOARD OF EDUCATION
2009 2008 2007 2006 2005 2004
112,072 112,072 112,072 112,072 112,072 112,072
53 53 53 53 53 53
1,325 1,325 1,325 1,325 1,325 1,325
698 681 645 623 598 569
88,000 88,000 88,000 88,000 88,000 88,000
50 50 50 50 50 50
1,000 1,000 1,000 1,000 1,000 1,000
654 709 710 740 729 746
84,693 84,693 84,693 84,693 84,693 84,693
53 53 53 53 53 53
1,060 1,060 1,060 1,060 1,060 1,060
564 580 634 642 765 765
69,943 69,943 69,943 69,943 69,943 69,943
52 52 52 52 52 52
1,300 1,300 1,300 1,300 1,300 1,300
661 640 689 722 750 834

- 104 -
STATISTICAL AND OTHER INFORMATION (UNAUDITED)
OPERATING INFORMATION
Summary of Buildings and Sites
Last ten fiscal years ending June 30
School/Building 2013 2012 2011 2010
Farmington ES (1973)
Square Feet 73,908 73,908 73,908 73,908
Classrooms 48 48 48 48
Design Capacity 960 960 960 960
Enrollment 752 740 736 708
Germantown ES (1975)
Square Feet 84,584 84,584 84,584 84,584
Classrooms 42 42 42 42
Design Capacity 840 840 840 840
Enrollment 759 749 791 709
Germantown HS (1964)
Square Feet 231,717 231,717 231,717 231,717
Classrooms 101 101 101 101
Design Capacity 2,020 2,020 2,020 2,020
Enrollment 2,029 2,046 2,000 1,731
Germantown MS (1979)
Square Feet 81,834 81,834 81,834 81,834
Classrooms 44 44 44 44
Design Capacity 1,100 1,100 1,100 1,100
Enrollment 672 708 697 621
E. A. Harold ES (1961)
Square Feet 50,200 50,200 50,200 50,200
Classrooms 22 22 22 22
Design Capacity 440 440 440 440
Enrollment 399 391 392 419

- 105 -
SHELBY COUNTY
BOARD OF EDUCATION
2009 2008 2007 2006 2005 2004
73,908 73,908 73,908 73,908 73,908 73,908
48 48 48 48 48 48
960 960 960 960 960 960
672 676 694 678 885 869
84,584 84,584 84,584 84,584 84,584 84,584
42 42 42 42 42 42
840 840 840 840 840 840
740 755 729 634 652 642
231,717 231,717 231,717 231,717 231,717 231,717
101 101 101 101 101 101
2,020 2,020 2,020 2,020 2,020 2,020
1,687 1,664 1,911 2,061 2,148 2,189
81,834 81,834 81,834 81,834 81,834 81,834
44 44 44 44 44 44
1,100 1,100 1,100 1,100 1,100 1,100
776 779 773 598 571 536
50,200 50,200 50,200 50,200 50,200 50,200
22 22 22 22 22 22
440 440 440 440 440 440
432 399 426 416 381 356

- 106 -
STATISTICAL AND OTHER INFORMATION (UNAUDITED)
OPERATING INFORMATION
Summary of Buildings and Sites
Last ten fiscal years ending June 30
School/Building 2013 2012 2011 2010
Highland Oaks ES (1993)
Square Feet 107,971 107,971 107,971 107,971
Classrooms 66 66 66 66
Design Capacity 1,320 1,320 1,320 1,320
Enrollment 984 960 1,046 1,034
Highland Oaks MS (2009)
Square Feet 118,130 118,130 118,130 118,130
Classrooms 57 57 57 57
Design Capacity 1,425 1,425 1,425 1,425
Enrollment 895 947 952 953
Houston MS (1992)
Square Feet 92,750 92,750 92,750 92,750
Classrooms 50 50 50 50
Design Capacity 1,250 1,250 1,250 1,250
Enrollment 859 890 858 848
Houston HS (1989)
Square Feet 263,689 263,689 263,689 263,689
Classrooms 111 111 111 111
Design Capacity 2,220 2,220 2,220 2,220
Enrollment 1,787 1,678 1,681 1,761
E.E. Jeeter ES (1949)
Square Feet 70,058 70,058 70,058 70,058
Classrooms 28 28 28 28
Design Capacity 560 560 560 560
Enrollment 180 175 188 212

- 107 -
SHELBY COUNTY
BOARD OF EDUCATION
2009 2008 2007 2006 2005 2004
107,971 107,971 107,971 107,971 107,971 107,971
66 66 66 66 66 66
1,320 1,320 1,320 1,320 1,320 1,320
855 875 860 1,307 1,184 1,069
92,750 92,750 92,750 92,750 92,750 92,750
50 50 50 50 50 50
1,250 1,250 1,250 1,250 1,250 1,250
803 789 858 927 934 961
263,689 263,689 263,689 263,689 263,689 263,689
111 111 111 111 111 111
2,220 2,220 2,220 2,220 2,220 2,220
1,953 2,146 2,428 2,340 2,161 1,869
70,058 70,058 70,058 70,058 70,058 70,058
28 28 28 28 28 28
560 560 560 560 560 560
213 226 238 230 223 246

- 108 -
STATISTICAL AND OTHER INFORMATION (UNAUDITED)
OPERATING INFORMATION
Summary of Buildings and Sites
Last ten fiscal years ending June 30
School/Building 2013 2012 2011 2010
Kate Bond Annexed by the City of Memphis in 2005.
Square Feet
Classrooms
Design Capacity
Enrollment
Lakeland ES (2001)
Square Feet 115,780 115,780 115,780 115,780
Classrooms 65 65 65 65
Design Capacity 1,300 1,300 1,300 1,300
Enrollment 805 832 845 864
Lowrance ES (1995) School name changed from Southwind MS to Lowrance ES in 2010.
Square Feet 112,374 112,374 112,374 112,374
Classrooms 65 65 65 65
Design Capacity 1,300 1,300 1,300 1,300
Enrollment 897 896 896 895
Lucy ES (1921)
Square Feet 102,446 102,446 102,446 102,446
Classrooms 48 48 48 48
Design Capacity 960 960 960 960
Enrollment 687 630 558 554
Macon Hall ES (1997)
Square Feet 93,481 93,481 93,481 93,481
Classrooms 66 66 66 66
Design Capacity 1,320 1,320 1,320 1,320
Enrollment 1,151 1,148 1,188 1,110

- 109 -
SHELBY COUNTY
BOARD OF EDUCATION
2009 2008 2007 2006 2005 2004
88,867
40
1,140
1,016
115,780 115,780 115,780 115,780 115,780 115,780
65 65 65 65 65 65
1,300 1,300 1,300 1,300 1,300 1,300
1,051 1,005 994 926 1,002 908
102,446 102,446 102,446 102,446 102,446 102,446
48 48 48 48 48 48
960 960 960 960 960 960
570 580 586 631 507 511
93,481 93,481 93,481 93,481 93,481 93,481
66 66 66 66 66 66
1,320 1,320 1,320 1,320 1,320 1,320
1,065 1,051 1,018 1,146 1,047 925
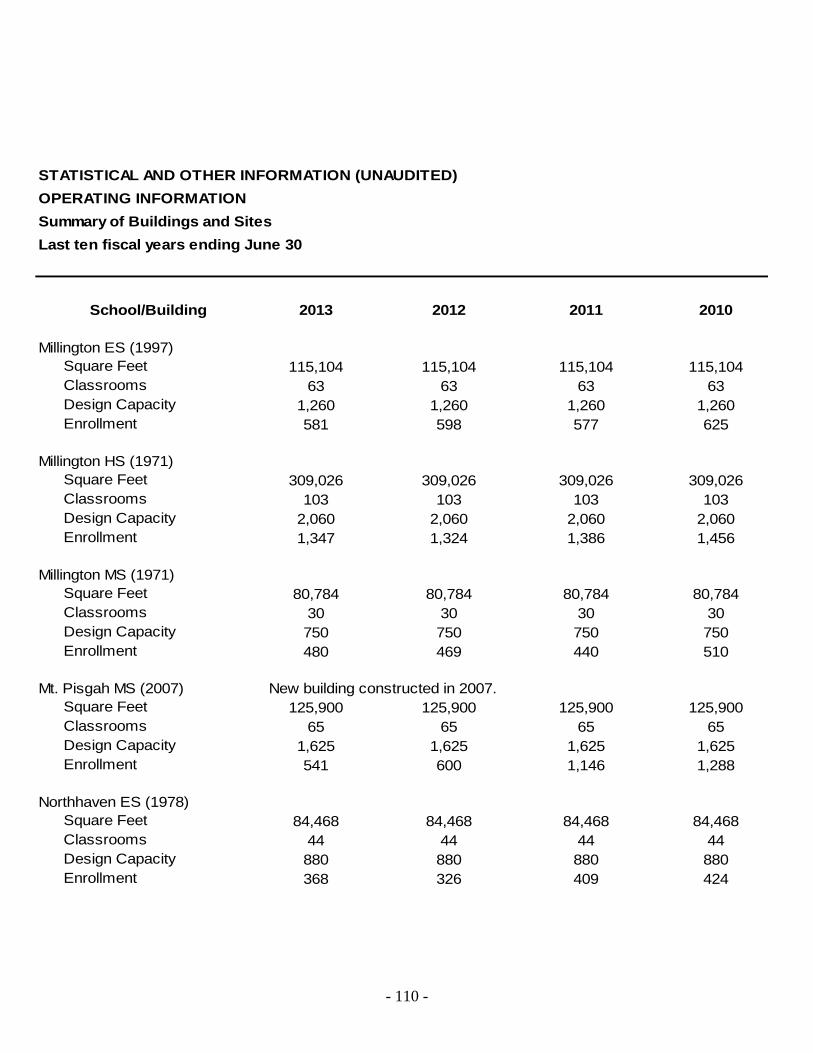
- 110 -
STATISTICAL AND OTHER INFORMATION (UNAUDITED)
OPERATING INFORMATION
Summary of Buildings and Sites
Last ten fiscal years ending June 30
School/Building 2013 2012 2011 2010
Millington ES (1997)
Square Feet 115,104 115,104 115,104 115,104
Classrooms 63 63 63 63
Design Capacity 1,260 1,260 1,260 1,260
Enrollment 581 598 577 625
Millington HS (1971)
Square Feet 309,026 309,026 309,026 309,026
Classrooms 103 103 103 103
Design Capacity 2,060 2,060 2,060 2,060
Enrollment 1,347 1,324 1,386 1,456
Millington MS (1971)
Square Feet 80,784 80,784 80,784 80,784
Classrooms 30 30 30 30
Design Capacity 750 750 750 750
Enrollment 480 469 440 510
Mt. Pisgah MS (2007) New building constructed in 2007.
Square Feet 125,900 125,900 125,900 125,900
Classrooms 65 65 65 65
Design Capacity 1,625 1,625 1,625 1,625
Enrollment 541 600 1,146 1,288
Northhaven ES (1978)
Square Feet 84,468 84,468 84,468 84,468
Classrooms 44 44 44 44
Design Capacity 880 880 880 880
Enrollment 368 326 409 424

- 111 -
SHELBY COUNTY
BOARD OF EDUCATION
2009 2008 2007 2006 2005 2004
115,104 115,104 115,104 115,104 115,104 115,104
63 63 63 63 63 63
1,260 1,260 1,260 1,260 1,260 1,260
617 638 679 782 769 851
309,026 309,026 309,026 309,026 309,026 309,026
103 103 103 103 103 103
2,060 2,060 2,060 2,060 2,060 2,060
1,522 1,625 1,580 1,688 1,560 1,564
80,784 80,784 80,784 80,784 80,784 80,784
30 30 30 30 30 30
750 750 750 750 750 750
505 556 566 635 607 644
125,900 125,900 125,900 125,900 125,900 125,900
65 65 65 65 65 65
1,625 1,625 1,625 1,625 1,625 1,625
1,232 1,242 1,262 1,250 1,125 1,039
84,468 84,468 84,468 84,468 84,468 84,468
44 44 44 44 44 44
880 880 880 880 880 880
450 455 495 550 586 654

- 112 -
STATISTICAL AND OTHER INFORMATION (UNAUDITED)
OPERATING INFORMATION
Summary of Buildings and Sites
Last ten fiscal years ending June 30
School/Building 2013 2012 2011 2010
Oak ES (1986)
Square Feet 106,420 106,420 106,420 106,420
Classrooms 69 69 69 69
Design Capacity 1,380 1,380 1,380 1,380
Enrollment 608 587 598 592
Rivercrest ES (1998)
Square Feet 109,536 109,536 109,536 109,536
Classrooms 64 64 64 64
Design Capacity 1,280 1,280 1,280 1,280
Enrollment 654 695 912 978
Riverdale ES (1968)
Square Feet 88,199 88,199 88,199 88,199
Classrooms 45 45 45 45
Design Capacity 900 900 900 900
Enrollment 1,185 1,174 1,147 1,085
Schilling Farms MS (1999)
Square Feet 97,250 97,250 97,250 97,250
Classrooms 48 48 48 48
Design Capacity 1,200 1,200 1,200 1,200
Enrollment 1,004 1,044 1,077 1,034
Shadowlawn MS (1967)
Square Feet 108,936 108,936 108,936 108,936
Classrooms 57 57 57 57
Design Capacity 1,425 1,425 1,425 1,425
Enrollment 855 904 909 880

- 113 -
SHELBY COUNTY
BOARD OF EDUCATION
2009 2008 2007 2006 2005 2004
106,420 106,420 106,420 106,420 106,420 106,420
69 69 69 69 69 69
1,380 1,380 1,380 1,380 1,380 1,380
642 687 677 721 981 947
109,536 109,536 109,536 109,536 109,536 109,536
64 64 64 64 64 64
1,280 1,280 1,280 1,280 1,280 1,280
1,025 1,035 965 941 1,102 1,011
88,199 88,199 88,199 88,199 88,199 88,199
45 45 45 45 45 45
900 900 900 900 900 900
1,076 1,034 1,039 1,009 1,009 996
97,250 97,250 97,250 97,250 97,250 97,250
48 48 48 48 48 48
1,200 1,200 1,200 1,200 1,200 1,200
991 950 972 938 934 976
108,936 108,936 108,936 108,936 108,936 108,936
57 57 57 57 57 57
1,425 1,425 1,425 1,425 1,425 1,425
861 970 962 1,073 1,118 1,328

- 114 -
STATISTICAL AND OTHER INFORMATION (UNAUDITED)
OPERATING INFORMATION
Summary of Buildings and Sites
Last ten fiscal years ending June 30
School/Building 2013 2012 2011 2010
Southwind ES (1990)
Square Feet 108,303 108,303 108,303 108,303
Classrooms 68 68 68 68
Design Capacity 1,360 1,360 1,360 1,360
Enrollment 861 842 842 819
Southwind MS School name changed to Lowrance ES in 2010.
Square Feet
Classrooms
Design Capacity
Enrollment
Southwind HS (2007)
Square Feet 326,926 326,926 326,926 326,926
Classrooms 116 116 116 116
Design Capacity 2,320 2,320 2,320 2,320
Enrollment 1,698 1,690 1,931 1,884
Sycamore ES (2000)
Square Feet 127,627 127,627 127,627 127,627
Classrooms 64 64 64 64
Design Capacity 1,280 1,280 1,280 1,280
Enrollment 823 794 791 834
Tara Oaks ES (1995)
Square Feet 109,405 109,405 109,405 109,405
Classrooms 69 69 69 69
Design Capacity 1,380 1,380 1,380 1,380
Enrollment 682 729 745 780

- 115 -
SHELBY COUNTY
BOARD OF EDUCATION
2009 2008 2007 2006 2005 2004
108,303 108,303 108,303 108,303 108,303 108,303
68 68 68 68 68 68
1,360 1,360 1,360 1,360 1,360 1,360
1,127 1,126 1,055 1,161 1,136 1,117
112,374 112,374 112,374 112,374 112,374 112,374
65 65 65 65 65 65
1,300 1,300 1,300 1,300 1,300 1,300
1,082 1,197 1,139 1,239 1,102 1,028
326,926 326,926
116 116
2,320 2,320
1,473 1,038
127,627 127,627 127,627 127,627 127,627 127,627
64 64 64 64 64 64
1,280 1,280 1,280 1,280 1,280 1,280
788 704 691 630 784 674
109,405 109,405 109,405 109,405 109,405 109,405
69 69 69 69 69 69
1,380 1,380 1,380 1,380 1,380 1,380
770 834 893 935 973 1,002

- 116 -
STATISTICAL AND OTHER INFORMATION (UNAUDITED)
OPERATING INFORMATION
Summary of Buildings and Sites
Last ten fiscal years ending June 30
School/Building 2013 2012 2011 2010
Woodstock MS (1956)
Square Feet 84,850 84,850 84,850 84,850
Classrooms 43 43 43 43
Design Capacity 1,075 1,075 1,075 1,075
Enrollment 468 485 516 520
Total SCS Buildings
Square Feet 6,761,225 6,761,225 6,535,639 6,585,177
Classrooms 3,202 3,202 3,202 3,230
Design Capacity 67,595 67,595 67,595 68,235
Enrollment 45,899 45,728 47,214 48,013
SCS schools on non-SCS property (enrollment)
Alternative MS
Alternative HS
Highland Oaks Primary Students transferred to Highland Oaks ES in 2010.
Total non-SCS property (enrollment) - - - -
Charter Schools (enrollment)
New Consortium
of Law and Business 13 13
Total Charter School
Enrollments 13 13 - -
District Total Enrollment 45,912 45,741 47,214 48,013
Sources: Enrollment - District School Choice and Student Accounting Office
Other Data - District Facilities Office

- 117 -
SHELBY COUNTY
BOARD OF EDUCATION
2009 2008 2007 2006 2005 2004
84,850 84,850 84,850 84,850 84,850 84,850
43 43 43 43 43 43
1,075 1,075 1,075 1,075 1,075 1,075
553 562 637 692 695 759
6,353,845 6,242,403 5,915,477 5,915,477 5,691,128 5,730,926
3,108 3,056 2,940 2,940 2,813 2,849
65,510 64,210 61,890 61,890 59,350 59,970
46,960 47,133 46,363 46,414 44,909 47,002
10
48
397 380 397
397 380 397 - 58 -
- - - - - -
47,357 47,513 46,760 46,414 44,967 47,002

- 118 -
STATISTICAL AND OTHER INFORMATION (UNAUDITED)
OPERATING INFORMATION
Weighted Full-time Average Daily Attendance SHELBY COUNTY
Last ten fiscal years ending June 30 BOARD OF EDUCATION
Shelby County Schools Memphis City Schools
Fiscal
Year
Weighted Full-
time Equivalent
Average Daily
Attendance
Percent
of Total
Weighted Full-
time Average
Daily
Attendance
Percent
of Total
2004 56,039 29.31% 135,183 70.69%
2005 53,435 27.91% 138,043 72.09%
2006 54,943 28.49% 137,932 71.51%
2007 55,745 29.18% 135,268 70.82%
2008 56,799 30.43% 129,872 69.57%
2009 56,503 30.78% 127,073 69.22%
2010 56,905 31.34% 124,691 68.66%
2011 56,162 30.94% 125,369 69.06%
2012 54,823 30.76% 123,400 69.24%
2013 54,887 31.06% 121,806 68.94%
Source: Letter of notification, State of Tennessee
NOTE: Local funding is based on Weighted Full-time Equivalent Average Daily Attendance.
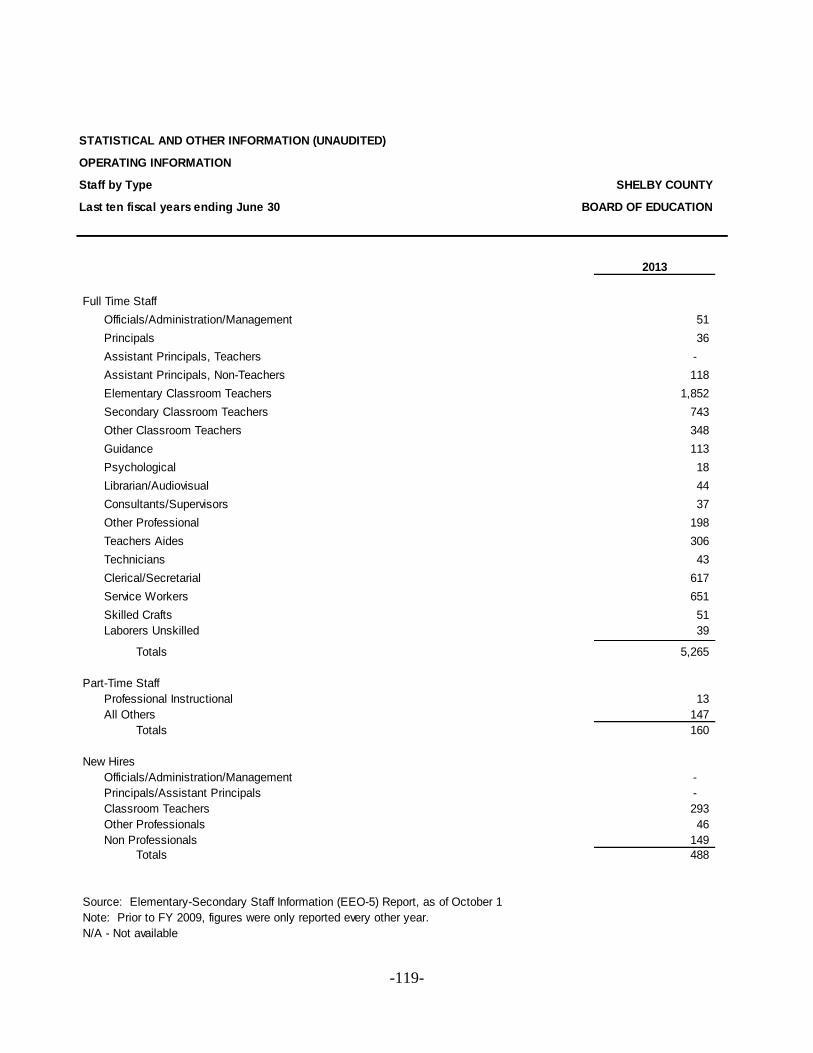
-119-
STATISTICAL AND OTHER INFORMATION (UNAUDITED)
OPERATING INFORMATION
Staff by Type SHELBY COUNTY
Last ten fiscal years ending June 30 BOARD OF EDUCATION
2013
Full Time Staff
Officials/Administration/Management 51
Principals 36
Assistant Principals, Teachers -
Assistant Principals, Non-Teachers 118
Elementary Classroom Teachers 1,852
Secondary Classroom Teachers 743
Other Classroom Teachers 348
Guidance 113
Psychological 18
Librarian/Audiovisual 44
Consultants/Supervisors 37
Other Professional 198
Teachers Aides 306
Technicians 43
Clerical/Secretarial 617
Service Workers 651
Skilled Crafts 51
Laborers Unskilled 39
Totals 5,265
Part-Time Staff
Professional Instructional 13
All Others 147
Totals 160
New Hires
Officials/Administration/Management -
Principals/Assistant Principals -
Classroom Teachers 293
Other Professionals 46
Non Professionals 149
Totals 488
Source: Elementary-Secondary Staff Information (EEO-5) Report, as of October 1
Note: Prior to FY 2009, figures were only reported every other year.
N/A - Not available

-120-
STATISTICAL AND OTHER INFORMATION (UNAUDITED)
OPERATING INFORMATION
Schedule of Surety Bonds SHELBY COUNTY
June 30, 2013 BOARD OF EDUCATION
Amount of
Position Covered Bond
Chief Financial Officer 25,000$
Director of Finance 25,000$
Budget Anaylst 25,000$

-121-
STATISTICAL AND OTHER INFORMATION (UNAUDITED)
OPERATING INFORMATION
Graduation Information SHELBY COUNTY
Last ten fiscal years ending June 30 BOARD OF EDUCATION
Fiscal
Year
Regular
Diploma
Honors
Diploma
Special
Education
Certificate Total
2008 2,905 274 130 3,309
2009 2,589 323 88 3,000
2010 2,396 495 51 2,942
2011 2,639 533 34 3,206
2012 2,980 530 95 3,605
2013 2,548 594 53 3,195
Source: Tennessee Department of Education - Number of High School Graduates from Public Schools
NOTE: 2013 state approved graduation rates not available

-122-
STATISTICAL AND OTHER INFORMATION (UNAUDITED)
OPERATING INFORMATION
School Lunch Program
Last ten fiscal years ending June 30
2013 2012 2011
Charge per lunch to students:
Paid Elementary $2.25 $2.00 $2.00
Paid Secondary $2.25 $2.00 $2.00
Paid High School $2.25 $2.00 $2.00
Reduced $0.40 $0.40 $0.40
Charge per lunch to adults $3.25 $3.00 $3.00
Number of days served 178 177 176
Number of free lunches served 1,878,650 1,849,565 1,918,868
Percent of total lunches served 52.62% 46.28% 45.02%
Average number of free lunches served daily 10,554 10,450 10,903
Number of paid lunches served at reduced price 266,969 10,450 10,903
Percent of total lunches served 7.48% 0.26% 0.26%
Number of paid lunches served at regular price 1,424,529 1,858,175 2,066,310
Percent of total lunches served 39.90% 46.49% 48.48%
Average number of paid lunches served daily:
At reduced price 1500 59 62
At regular price 8003 10,498 11,740
Total number of lunches served 3,570,148 3,996,777 4,262,168
Average number of lunches served daily 20,057 22,581 24,217
Total number of students 43,454 43,578 45,146

-123-
SHELBY COUNTY
BOARD OF EDUCATION
2010 2009 2008 2007
$1.75 $1.75 $1.75 $1.50
$2.00 $2.00 $2.00 $1.75
$2.00 $2.00 $2.00 $1.75
$0.40 $0.40 $0.40 $0.40
$3.00 $3.00 $3.00 $2.50
175 180 180 179
1,765,495 1,581,974 1,461,637 1,305,209
40.34% 35.56% 32.40% 29.22%
10,089 8,789 8,120 7,292
10,089 8,789 8,120 7,292
0.23% 0.20% 0.18% 0.16%
2,299,477 2,526,128 2,724,235 2,868,644
52.54% 56.78% 60.39% 64.23%
58 49 45 41
13,140 14,034 15,135 16,026
4,376,275 4,448,631 4,510,970 4,466,504
25,007 24,715 25,061 24,953
46,067 45,017 45,270 44,333

-124-
STATISTICAL AND OTHER INFORMATION (UNAUDITED)
OPERATING INFORMATION
Pupil Transportation
Last ten fiscal years ending June 30
2013 2012 2011 2010
School Buses
Type I 312 311 316 309
Type II - -
Total 312 311 316 309
Daily one-way miles traveled for all buses
From residence to first pick-up 1,857 2,010 1,879 1,960
From first pick-up to last school served 12,416 8,470 8,691 8,719
Total 14,273 10,480 10,570 10,679
Pupils Transported
Enrolled
Regular 23,331 23,153 22,777 26,236
Special Education 667 440 370 337
ADT 1 1/2 miles +
Regular 23,331 22,496 22,188 23,833
Special Education 667 396 343 307
Number of drivers
Male 79 79 74 70
Female 170 169 172 175
Injuries
Treated and released 3 2 3 -
Confined overnight - - - -
Fatalities
On board - - - -
Off board - - - -
Type Accident
Property damage 55 48 52 66
Personal injury 7 8 2 7
Source: Annual Pupil Transportation Report

-125-
SHELBY COUNTY
BOARD OF EDUCATION
2009 2008 2007 2006 2005 2004
298 294 294 291 310 294
- -
298 294 294 291 310 294
1,906 1,896 1,887 1,846 1,806 1,818
8,602 8,697 8,336 8,427 8,018 7,773
10,508 10,593 10,223 10,273 9,824 9,591
24,174 24,407 24,164 24,276 22,916 23,897
352 394 450 574 512 482
23,673 23,897 24,164 24,276 22,336 23,171
345 381 450 574 415 394
78 96 91 93 95 103
167 178 175 26 178 163
19 5 82 25 2 21
- - - - - -
- - - - - -
- - - - - -
59 63 57 59 63 47
11 6 6 14 3 12

This page intentionally left blank

Statutory Reporting Section

- 128 -
SHELBY COUNTY BOARD OF EDUCATION
(A Component Unit of Shelby County, Tennessee)
Schedule of Expenditures of Federal and State Awards
For the Year Ended June 30, 2013
Catalog of Federal
Domestic
Assistance
Number Program Name Grantor
10.553 School Breakfast Program U.S. Department of Agriculture
10.555 National School Lunch Program - Non-Cash Assistance U.S. Department of Agriculture
10.555 National School Lunch Program - Cash Assistance U.S. Department of Agriculture
10.582 Fresh Fruits & Vegetables U.S. Department of Agriculture
84.184L Safe Schools/Healthy Students Grants U.S. Department of Education
Total Direct Programs
84.010A Title I Grants to Local Educational Agencies U.S. Department of Education
Total Title I, Part A Cluster
84.027 Special Education - Grants to States U.S. Department of Education
84.173 Special Education - Preschool Grants U.S. Department of Education
Total Special Education Cluster
84.048A Carl D. Perkins Vocation and Ed. Act U.S. Department of Education
84.048A Carl Perkins Reserve 2012 U.S. Department of Education
84.367A Improving Teacher Quality U.S. Department of Education
84.351C Professional Development for Art Education U.S. Department of Education
84.196A Title X, Part C, McKinney?Vento Homeless Discretionary U.S. Department of Education
84.298A Innovative Programs?Title V- A U.S. Department of Education
84.364A English Language Acquisition U.S. Department of Education
84.364A English Language Acquisition U.S. Department of Education
84.374A Teacher Incentive Fund U.S. Department of Education
84.395 Tennessee First to the Top (ARRA) U.S. Department of Education
84.287C 21st Century Community Learning Centers Program U.S. Department of Education
84.41 Education Jobs U.S. Department of Education
Subtotal
Total Pass-Thru Programs
Total U.S. Department of Education
93.558 Early Childhood Education Pilot Project U.S. Department of Health & Human Services
Total U.S. Department of Health & Human Services
Total Federal Expenditures
N/A Coordinated School Health Tennessee Department of Education
N/A Family Resource Center Tennessee Department of Education
N/A Tennessee Arts Commission ? Student Ticket Subsidy Tennessee Arts Commission
N/A Pollution Control Shelby County Government
N/A Business Partnership
Total Other Grants
U.S. Department of Agriculture Pass-Thru Programs:
Total Child Nutrition Cluster/ U.S. Department of Agriculture
U.S. Department of Education Direct Programs:
U.S. Department of Education Pass-Thru Programs:
Title I, Part A Cluster:
Special Education Cluster:
Child Nutrition Cluster:
U.S. Department of Health & Human Services Pass-Thru Program:
Other Grants - State Only:

- 129 -
Pass-Through Entity
Receivable (Unearned
Revenue)
June 30, 2012 Receipts Expenditures
Receivable
(Unearned
Revenue)
June 30, 2013
Tennessee Department of Education $ - $ 1,949,052 $ 1,949,052 $ -
Tennessee Department of Education 124,574 768,723 685,263 -
Tennessee Department of Education - 6,614,142 6,614,142 41,114
Tennessee Department of Education (27,939) 18,951 46,890 -
96,635 9,350,868 9,295,347 41,114
5,650 5,650 -
5,650 5,650 - -
Tennessee Department of Education 387,676 6,395,739 6,366,260 358,197
387,676 6,395,739 6,366,260 358,197
Tennessee Department of Education 953,532 9,307,435 9,341,024 987,121
Tennessee Department of Education 7,086 131,175 237,383 113294
960,618 9,438,610 9,578,407 1,100,415
Tennessee Department of Education 19,028 454,501 499,515 64,042
Tennessee Department of Education 81,794 81,794 - -
Tennessee Department of Education 74,906 988,041 952,984 39,849
Tennessee Department of Education 14,435 182,276 206,440 38,599
Tennessee Department of Education 21,432 57,643 61,897 25,686
Tennessee Department of Education (1,225) (1,225) - -
Tennessee Department of Education 27,016 210,922 197,895 13,989
Tennessee Department of Education 7,282 8,533 1,591 340
Tennessee Department of Education 193,986 1,188,275 1,001,723 7,434
Tennessee Department of Education 199,242 1,560,181 1,942,521 581,582
Tennessee Department of Education 115,815 296,641 346,118 165,292
Tennessee Department of Education 1,110,387 1,304,766 194,379 -
1,864,098 6,332,348 5,405,063 936,813
3,212,392 22,166,697 21,349,730 2,395,425
3,218,042 22,172,347 21,349,730 2,395,425
Shelby County, TN 194,631 1,044,881 1,156,039 305,789
194,631 1,044,881 1,156,039 305,789
$ 3,509,308 $ 32,568,096 $ 31,801,116 $ 2,742,328
Tennessee Department of Education $ 19,950 $ 143,317 $ 173,000 $ 49,633
Tennessee Department of Education 21,102 26,938 14,036 8,200
Tennessee Department of Education (62) 11,918 10,742 (1,238)
Shelby County Government 231,581 231,581 - -
(29,749) - 2,565 (27,184)
$ 242,822 $ 413,754 $ 200,343 $ 29,411

-130-
SHELBY COUNTY BOARD OF EDUCATION
(A Component Unit of Shelby County, Tennessee)
Notes to the Schedule of Expenditures of Federal and State Awards
For the Year Ended June 30, 2013
BASIS OF PRESENTATION
The accompanying Schedule of Expenditures of Federal and State Awards (the schedule) has
been generally prepared on the accrual basis of accounting. The purpose of the schedule is to
present a summary of those activities represented by Shelby County Board of Education for the
year ended June 30, 2013, which have been financed by the U.S. Government (federal awards).
For the purpose of the schedule, federal awards include all of federal assistance and procurement
relationships entered into directly and indirectly with the Shelby County Board of Education. It
is not intended to and does not present either the financial position or the changes in net assets of
Shelby County Board of Education. Therefore, some amounts presented in this schedule may
differ from amounts presented in or used in the preparation of the financial statements.
Individual awards within each category of federal awards are identified by CFDA number and
program name if the award is individually significant to the category of award. All other awards
are presented in total by funding agency.
REVENUE AND EXPENDITURE RECOGNITION
Revenue is recognized when earned by the organization using the accrual method of accounting.
Expenditures for direct costs are recognized as incurred using the accrual method of accounting
and the cost accounting principles contained in the U.S. Office of Management and Budget
(OMB) Circular A-87, Cost Principles for State, Local and Indian Tribal Governments. Under
those cost principles, certain types of expenditures are not allowable or are limited as to
reimbursement.
FOOD DONATION
Non-monetary assistance is reported in the schedule at the fair market value of the commodities
received and disbursed. At June 30, 2013, the Shelby County Board of Education had food
commodities totaling $41,114 in inventory.

- 131 -
FEDERAL EXPENDITURES RECONCILIATION
The following schedule reconciles federal expenditures per Schedule of Federal Awards to
Federal government revenue per Statement of Revenues, Expenditures and Changes in Fund
Balances - Governmental Funds:
Federal expenditures per Schedule of Federal Awards $ 31,801,116
Less commodities - non-cash expenditures (685,263)
Federal revenue per Statement of Revenues, Expenditures
and Changes in Fund Balances - Governmental Funds
$ 31,115,853

- 132 -

- 133 -

- 134 -

- 135 -


SHELBY COUNTY BOARD OF EDUCATION
SCHEDULE OF FINDINGS AND QUESTIONED COSTS

- 138 -
SHELBY COUNTY BOARD OF EDUCATION
(A Component Unit of Shelby County, Tennessee)
Schedule of Findings and Questioned Cost
For the Year Ended June 30, 2013
Section I: Summary of Auditor's Results
Financial Statements:
1. Type of auditor's report issued on the financial statements. Unmodified
2. Material noncompliance relating to the financial statements. No
3. Internal control over financial reporting:
a. Material weaknesses identified? No
b. Significant deficiencies identified that are not considered
to be material weaknesses? None noted
Federal Awards:
4. Type of auditor's report issued on compliance for major federal programs Unqualified
5. Internal control over major programs:
a. Material weaknesses identified? No
b. Significant deficiencies identified that are not considered
to be material weaknesses? None noted
6. Any audit findings reported as required by Section __.510(a) of Circular A-133? No
7. Federal programs identified as major programs:
a. CFDA #84.374 Teacher Incentive Fund
b. CFDA #84.010 Title I Grants to Local Educational Agencies
c. CFDA #84.395 SFSF Tennessee First to the Top (ARRA)
8. The dollar threshold used to distinguish between type A and type B programs: $953,818
9. Auditee qualified as a low-risk auditee? Yes

- 139 -
10. Prior fiscal year audit findings and questioned costs relative to federal awards
which would require auditee to prepare a summary schedule of prior audit
findings as discussed in Section____.315(b) of OMB Circular A-133? No
Section II: Findings - Financial Statement Audit
A. No Findings
Section III: Findings and Questioned Costs - Major Federal Awards Programs
A. No Findings or Questioned Costs.

- 140 -