
Sheffield Economic Research Paper Series SERP Number: …/file/SERPS... · Sheffield Economic...
35
1 Sheffield Economic Research Paper Series SERP Number: 2010009 ISSN 1749-8368 Syed Abdul Hamid, Jennifer Roberts and Paul Mosley Evaluating the Health Effects of Micro Health Insurance Placement: Evidence from Bangladesh April 2010 Department of Economics University of Sheffield 9 Mappin Street Sheffield S1 4DT United Kingdom www.shef.ac.uk/economics
Transcript of Sheffield Economic Research Paper Series SERP Number: …/file/SERPS... · Sheffield Economic...

1
Sheffield Economic Research Paper Series
SERP Number: 2010009
ISSN 1749-8368
Syed Abdul Hamid, Jennifer Roberts and Paul Mosley
Evaluating the Health Effects of Micro Health Insurance Placement: Evidence from Bangladesh
April 2010
Department of Economics University of Sheffield 9 Mappin Street Sheffield S1 4DT United Kingdom www.shef.ac.uk/economics

2
Abstract:
We examine the impact of micro health insurance placement on health awareness, healthcare
utilization and health status of microcredit members in rural Bangladesh, using data from 329
households in the operating areas of Grameen Bank. The results are based on econometric analysis
conditioned on placement of the scheme, and show that placement has a positive association with
all of the outcomes. The results are statistically significant for health awareness and healthcare
utilization, but not for heath status. Our study makes an important contribution to the literature as it
provides evidence on the impact of MHI on a broad set of health outcomes.
Key words: Microcredit, Micro Health Insurance, Grameen Bank, Bangladesh JEL: O12 Acknowledgments: We are very grateful to Nobel Laureate Professor Muhammad Yunus for giving us permission to conduct our survey on Grameen Bank, and to Shaikh Abdud Daiyan, the former Managing Director of Grameen Kalyan, for his whole hearted support for our survey. Thanks also to Allison Jago for clerical assistance. We offer our special thanks to the rural women who spent time answering the questions patiently and eagerly.

3
Title: Evaluating the Health Effects of Micro Health Insurance Placement: Evidence from
Bangladesh
Name of authors: (1) Syed Abdul Hamid1, (2) Jennifer Roberts2 and (3) Paul Mosley2.
1= Institute of Health Economics, University of Dhaka, Bangladesh
2 = Department of Economics, University of Sheffield, UK
Corresponding author
Name: Jennifer Roberts
Address: Department of Economics, University of Sheffield, 9 Mappin St, Sheffield S1 4DT
Phone: +44 114 222 3403 Fax: +44 114 222 3458
Email: [email protected]
Conflict of interest: None

4
EVALUATING THE HEALTH EFFECTS OF MICRO HEALTH INSURANCE PLACEMENT:
EVIDENCE FROM BANGLADESH
1. INTRODUCTION
Microcredit provides collateral free small loans, especially to women, to enable them to develop
household based micro enterprises. A key aim is to break the vicious circle of poverty where low
income leads to low saving, therefore low investment, thus low income. The importance of
microinsurance emanates from the limitations of conventional loan-based microcredit programs in
protecting the poor from all sorts of vulnerabilities. Although microcredit has been shown to
generate various beneficial outcomes, there is also evidence that not all sectors of the poor can
benefit. One such group are those who experience severe health shocks, which reduce work
capacity and investment and require a redirection of resources to the consumption of healthcare.
Due to increased evidence that microcredit does not help the poorest poor, welfarists stress the
value of adding auxiliary services to improve the effectiveness of the programs (e.g. Bhatt, 2001;
Woller et al., 1999; Woller and Woodworth, 2001). Insurance can protect vulnerable people from
risks and shocks when existing coping strategies fail. However, traditional health insurance markets
are almost entirely absent in the rural areas of Bangladesh. There is no social health insurance
scheme even in the formal sector, and in addition the government has not been able to meet the
health care needs of the rural poor.
Grameen Bank1 (GB) has played a major role in developing microcredit in Bangladesh. The
organization emerged from an action research project by Professor Muhammad Yunus in 1976
examining the possibility of providing banking services for the rural poor. GB as a microfinance
institution (MFI) provides a number of services including loans and savings schemes. It added a
micro health insurance (MHI) scheme in the late 1990s, in order to protect its clients from health

5
risks with the aim of preventing their economic downfall. Following GB, some other MFIs
introduced MHI schemes with similar aims. These schemes may increase the health status of the
participating households via increased health awareness and utilization of modern healthcare.
Improved health status may lead to higher productivity, higher labour supply, fewer workdays lost,
and reduced healthcare expenditure. In addition, if households are insured against health risk, they
may invest in high return riskier assets because they do not need to retain cash or to hold highly
liquid assets for precautionary purposes. Kochar (2004) finds, from a study in rural Pakistan, that
overall savings of households rise in the expectation of future illness of adult males, but investments
in productive assets decline. The empirical verification of this issue is important for policy
decisions concerning the expansion and replication of MHI schemes.
However, to date there has been very little research on the added effects of MHI. Mosley (2003)
examined the added effects of the MHI scheme of BRAC2 on outcomes such as assets, household
expenditure, current saving, educational expenditure, and education level. However, the study did
not explore the impact on health outcomes. The evidence was not conclusive because the study was
conducted at a very early stage of program development using a small sample. Other MHI studies
have concentrated mainly on health outcomes: healthcare utilization and the equality of access to
healthcare in the Philippines (Dror et al., 2005, 2006); healthcare use and out of pocket expenditure
in Senegal (Jutting, 2004); the utilization of healthcare and financial protection from health shocks
in Tanzania (Msuya et al., 2007); and cost recovery in Rwanda (Schneider and Hanson, 2007).
However, there is no existing evidence regarding the impact of MHI on health outcomes in
Bangladesh. This is a serious omission given the size of the microcredit sector in Bangladesh;
according to the Palli Karma Sahayak Foundation (http://www.pksf-bd.org) in December 2005,
there were about 700 MFIs and 33.17 million microcredit members in Bangladesh.
6
In this paper, we have explored the added effects of MHI on a broad set of health outcomes: health
awareness, utilization of modern healthcare and perceived health status. We use data collected from
a primary survey of 329 households in three areas where GB operates microcredit programs. The
areas are distinguished according to their experience of MHI: areas with at least five years
experience of MHI, those with two years or less experience, and those where MHI is not available.
Our evidence is based on econometric analysis of the impact of placement of MHI. We find a
positive association between MHI and all of our health outcomes; the results are statistically
significant for the determination of health awareness and seeking formal care, but not for heath
status.
This paper is organized as follows. Section 2 presents a brief description of health, microcredit and
MHI programs in Bangladesh; Section 3 describes the methodology; Section 4 gives the findings;
Section 5 provides a discussion on the findings and Section 6 provides the conclusion.
2. BACKGROUND
The constitutional commitment of the government of Bangladesh is to provide basic medical care to
all its citizens. The government has been investing substantially since independence to develop the
health infrastructure as well as strengthen health and family planning services with special attention
to the rural population. Providing Primary Health Care (PHC) to attain ‘Health for All’ is the major
thrust of the health program. There is a three tier mechanism for providing health care in rural areas:
(i) domiciliary services provided by a Health Assistant and Family Welfare Assistant at the
household level; (ii) Health and Family Welfare Centres at the union level3, and (iii) upazila Health
Complexes (UHCs) at the sub-district level. UHCs provide both outpatient and inpatient services
including maternal and child health and family planning; they are the main centre for implementing
the Essential Services Package (ESP) which was designed to attain Health for All. In addition to
public provision of healthcare, there is a large private sector in Bangladesh, that includes both not-

7
for-profit and for-profit organizations; the former is relatively small and run by NGOs, MFIs and
charitable institutions.
Despite this infrastructure for healthcare delivery, the government has largely failed to meet the
health care needs of the rural population and this is due mainly to supply side constraints. Firstly,
problems in retaining doctors in UHCs due to poor working conditions; secondly, a lack of proper
input and skill mix due to under-resourcing and recruitment problems; thirdly unfriendly and
unapproachable behaviour of the health care providers which discourages contact from the local
population; and finally the charging of unofficial fees. Thus, although there is under utilization in
many UHCs, the majority of patients seek healthcare from private providers, especially from
informal providers who often have no formal medical qualifications (BBS, 2006).
Microinsurance refers to “the protection of low-income people against specific perils in exchange
for regular premium payments proportionate to the likelihood and cost of the risk involved”
(Churchill 2006:12). In order to expand into areas of social protection not covered in conventional
loan-based microfinance, GB set up an MHI scheme for the poor to insure against some health
risks4.
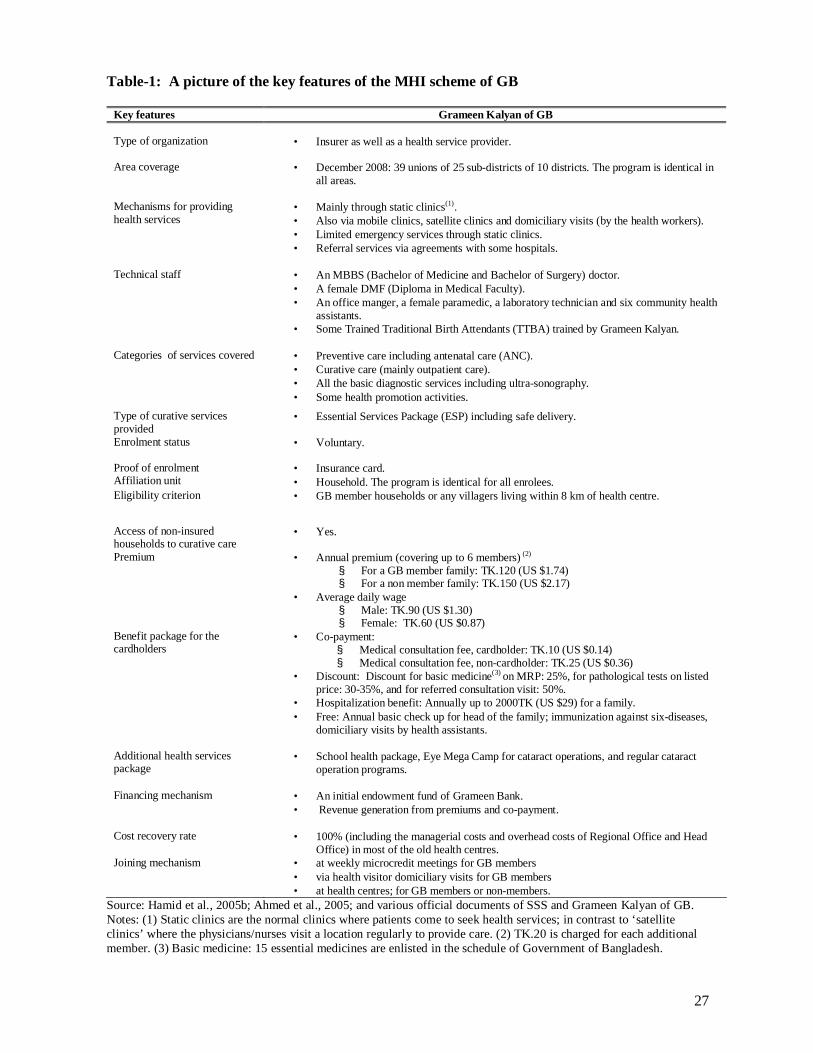
The key features of the GB MHI scheme are shown in Table 1. GB sells annually renewable prepaid
insurance cards to its clients and offers primary health care directly from health centres that it
operates. The service package comprises mainly curative care and maternity and child health care.
Non-cardholders can also seek healthcare from these health centres, but they are charged higher
prices than cardholders. The annual premium is low; coverage for a family of up to six costs
approximately 1.3 times the average daily male wage for GB microcredit members and 1.7 times
for non-members. The main benefits include reduced medical consultation fees (40% of the fee to
non-cardholders), discounts on drugs and tests, hospitalization benefits and free annual health
8
checks and immunization. There are three main ways that someone can join the scheme: GB
members can join at weekly microcredit meetings where health workers explain the benefits of
joining the MHI scheme; GB members can also enrol during the domiciliary visits provided by the
health visitors; GB members and non-members may also buy insurance cards directly from the
health centres. GB members can have the costs deducted directly from their GB savings accounts.
[Table 1]
3. DATA AND METHODOLOGY
(a) Data
We collected primary data from a household survey in GB areas in 2006. At this time the MHI
scheme was being operated in 32 GB branches; 14 of these had MHI for at least five years; and the
remaining 18 for less than five years (two for two years or less). GB microcredit and MHI programs
are identical across these branches. In order to construct a meaningful study design, we stratified
branches into three distinct types: (i) GB1 - branches with at least five years experience of MHI; (ii)
GB2 - branches with one or two years experience; (iii) GB3 - branches without MHI.
The sample selection was multistage. One GB branch was selected randomly from each of GB1 and
GB2; these are Madhabpur and Pakutia respectively. Madhabpur is located at Singair upazila (sub-
district) of Manikgonj district; it has had a microcredit scheme since 1983 and MHI was added in
1996. Pakutai is at Nagarpor upazila of Tangail district it has had a microcredit scheme since 1986
and MHI was added in 2004. One GB branch (Joy Mantap) was purposively selected from GB3; it
was chosen from the same upazila (Singair) as Madhabpur, in order to make a meaningful
comparison group. There are 8 GB branches in Singair and a MHI scheme has been operating in its
three unions (Madhabpur, Shaharil and Jamsaha) since 1996. Among the remaining five unions
where GB has not yet placed its MHI scheme, Joy Mantap has had a microcredit scheme since

9
1983; it is adjacent to Madhabpur and they are connected by a main road. GB planned to introduce
its MHI scheme into Joy Mantap in the near future5, which may reduce program placement bias in
this design.
Around 96 percent of GB members are female, so we selected only female members for our study.
A list of all the villages holding at least one female centre of GB was prepared for each selected
area. In the second stage, two villages from each area were selected randomly; a total of six
villages. In the third stage, two female microcredit centres were selected randomly from each
village where more than two microcredit centres existed. Each credit centre consists of 40-50
microcredit members and they usually live in a particular area of the village. A list of current GB
microcredit member households was made in each selected GB loan centre, using information
obtained from respective branch offices of GB. We attempted to interview all the eligible member
households in the selected microcredit centres of each sampled village, in order to minimise sample
selection bias.
We used a set of questionnaires to collect both household level and village level information. The
survey instruments were finalized after incorporating comments from a number of experts who
were sent a preliminary draft, as well as feedback from two rounds of piloting. We employed six
experienced female surveyors, comprising four field investigators, one field supervisor and one
quality controller. They were given five days of training on the purpose of the study and on the
survey instruments.
The main respondents were the female microcredit members, but some questions about household
finances (income, expenditure, assets etc.) were asked to household heads and these are
predominantly male. The village level information was collected from the offices of the Union

10
Councils and key informants. The data was entered in SPSS v10 and converted to Stata v9 for
analysis. One researcher entered the data and a second researcher checked the data entry.
(b) Method
One of the major challenges in estimating the impact of a program like MHI using non-
experimental data is to deal with endogeneity – heterogeneity in unobservable individual
characteristics of the participants and non-participants, which influences both the decision to
participate in the scheme and the outcome. Random assignment of individuals into a treatment
group and a control group is one solution but this is not possible here; hence it is necessary to
choose an empirical model, which can control for endogeneity.
Following the empirical literature on health insurance and microcredit (e.g. Pitt and Khandker,
1998; Waters, 1999; Jutting, 2004) we firstly consider a structural equation:
ijijyijij AXy εδβ ++= (1)
ijy is the outcome of interest (health awareness, utilization of formal healthcare or health status) of
household i in village )6. ijX is a vector of observed individual, household and village
characteristics (for example education, age, duration of membership in MHI). ijA is a binary
variable where ijA =1 if household i of village j participates in MHI and ijA = 0, otherwise; and
ijε is the stochastic error term. The estimate of δ will give the unbiased effect of MHI on the
outcome y only if ijA is an exogenous variable.
We then consider a reduced form (participation) equation:
ijijAijij ZXA µφβ ++= (2)
ijX is as defined in equation (1); ijZ is a distinct set of household or village characteristics that
affect only participation in the scheme ( ijA ), but not the outcome )( ijy conditional on ijA ; and ijµ

11
is the stochastic error term. Endogeneity arises when A and ε (or ε and µ ) are correlated,
resulting in biased estimates of δ .
While conditioning on participation is the commonly used method for analysing the causal effect of
health insurance as evidenced in the literature, this method is not appropriate for our research for a
number of the reasons. First, MHI may produce a lot of spillover or open access effects. This is
because the MHI scheme offered by GB is different from a traditional three-party (the insurer, the
insured and health service providers) health insurance system. GB MHI provides healthcare directly
to their clients through establishing health centres instead of simply paying coverage. In addition,
GB MHI offers health promotion and health education to all the microcredit members living in the
catchment area of the health centre regardless of their participation in MHI. Moreover, the
uninsured can seek healthcare from the health centres by paying the standard fees. If these spillover
effects are not taken into account, the impact of MHI will be severely underestimated. Second, there
is a very high enrolment rate in MHI at GB1 (96%), so there are very few observations in the non-
participant group, hence the estimation of equation (1) may not give reliable findings.
Thus, in what follows we focus on outcomes conditioned on placement of the program, rather than
participation in the program. Available empirical literature on this method falls mainly into two
groups; one has compared program and comparison groups where the program was in the pipeline
(Chase, 2002; Galasso and Ravallion, 2004), the other has compared program and comparison
groups where the program has not been placed at the time of survey (Amin et al., 1996; Hadi,
2002). The model can be written as follows
ijijijij PXy ελβ ++= (3)
y and X are as defined previously; P represents program status where 1=P if the household is
drawn from a program area where MHI has been operating for at least five years (GB1); and 0=P

12
if the household is drawn from the comparison area where MHI was not placed at the time of survey
(GB3). The estimate of λ measures the average treatment effect of MHI. Measuring average
treatment effect rather than average effect of treatment on the treated is sensible because non-
participants may also obtain benefits from MHI due to spillover effects.
The major concern with this method is to control for program placement bias (the particular features
that attract an organization to place the program in an area) and geographical heterogeneity, which
may affect the outcomes. Social programs like MHI are rarely placed randomly; rather placement
depends on both demand and supply side factors. The best way to ameliorate the effects of program
placement bias is to select a suitable comparison area.
We took the following measures to select a suitable comparison area. First, selecting the program
area (GB1) and control area (GB3) from the same small geographical area to reduce geographical
heterogeneity; second, choosing the control area where there is potential for placing the program in
the near future to reduce the supply side bias of program placement; and third, conducting a survey
to see whether eligible households in the control area would be willing to be insured if MHI were
placed in their area, to control for demand side bias. Note that the willingness to enrol in MHI in
GB3 was 98%, which is very similar to actual enrolment in GB1 (96%). In addition, we used a
similar method to select the households from the program area and control area. It is also worth
stressing that we conducted the survey on women microcredit members and these are a relatively
homogeneous group of people, in both the program area and the control area.
(c) Dependent Variables
Our analysis considers three types of health outcome measures: health awareness, health status and
heath care utilization, which can be considered to be related in a causal chain. We explore the
relationships between our outcome measures in the results section. The cross section data used here

13
does not enable us to draw causal inferences but studying the outcomes independently is also a
valuable contribution to the literature on the effects of MHI in Bangladesh.
(i) Health awareness
Health awareness is measured in relation to three important aspects of health: diarrhoea, vitamin A
deficiency and maternal health during pregnancy. These health problems cause a huge disease
burden in Bangladesh7 and have been the focus of the ESP, which is targeted at ensuring health care
for vulnerable groups. The problems arising from these three conditions can be reduced by
increasing awareness about danger signs and treatments. This information is disseminated by the
Ministry of Health and Family Welfare via posters, radio and television. In addition, the GB MHI
scheme promotes this information in its health education activities.
Respondents were asked to state the: (i) main treatments for diarrhoea; (ii) major natural food
sources of vitamin A; (iii) major health danger signs during pregnancy. A list of all correct answers
was provided to the interviewer but not shown to the respondent (see Table-A1 in the Appendix);
the list also included an ‘other’ option to code incorrect responses. Respondents could therefore
give multiple correct answers, multiple incorrect answers or state that they ‘do not know’. These
responses were used to construct four separate indices of health awareness, giving a weight of one
to each correct answer and zero to an incorrect answer or ‘do not know’. A pooled index was
constructed incorporating all three health issues with equal weight8. The indices are given below:
d
ii n
dAD = , (4)
v
ii n
vAVA = (5)
anc
ii n
ancAANC = (6)

14
++=
anc
i
v
i
d
ii n
ancnv
ndPI
31 (7)
where iAD , iAVA and iAANC are indices of awareness of diarrhoea, vitamin A and ante-natal care
respectively and iPI is the pooled (general) health awareness index for household i . dn represents
the total number of major methods of treatment for diarrhoeal disease and id represents the number
correctly stated by respondent i . Similarly, vn represents the total number of major sources of
vitamin A and iv the number of correct responses given; ancn is the total number of major danger
signs arising during pregnancy and ianc the number of correct responses.
Most of the previous literature on awareness about diarrhoeal diseases (Konde, 1992; McLennan,
1998), vitamin A deficiency (Genebo and Gelaw, 2000) and maternal health (Smith et al., 2004;
Xue et al., 2007) has relied on closed questions. We have used open questions to provide the
respondents with sufficient scope to articulate their knowledge.
(ii) Utilization of formal (modern) healthcare
The survey asked about any conditions suffered by any household members during the previous
month. For all individuals experiencing acute or chronic illnesses9 we asked whether they received
treatment for their condition in the past month, and what type of healthcare they received10.
Healthcare was classified as: (i) informal - including self-treatment and care provided by
practitioners with no formal medical training (e.g. drug store salesmen and traditional healers); (ii)
public provision11; (iii) provided by MHI; and (iv) private (formal) provision12. Categories (ii) to
(iv) are classified as formal (or modern) healthcare.
(iii) Health status

15
We use two measures of health status, self-assessed (general) health (SAH) and an index of physical
functioning. For the former the microentrepreneur is asked how good their current health is
compared to people of their own age, with responses on a five point scale: excellent, good, fair,
poor and very poor. This is a standard question used in many national surveys, such as the European
Community Household Panel and the US Panel Study of Income Dynamics. It is subjective and
therefore may be prone to reporting bias. Most of the evidence on the validity of self-assessed
health comes from the developed world and here a number of studies have shown it to be strongly
correlated with more objective measures, such as mortality and the onset of a number of serious
health conditions, even after controlling for socio-economic factors, physician health assessments
and the presence of specific health conditions (see for example Idler and Benyamini, 1997; Hurd
and McGarry, 1995).
As an alternative, and arguably more objective, measure we have also used a set of physical
functioning indicators usually termed activities of daily living (ADL). These indicators are ability
to: carry a heavy load for 20 metres, sweep the floor or yard, walk for five kilometres, take water
from a tube-well or a pond, bend, kneel, or stoop. This follows Gertler and Gruber (2002) and
Gertler et al. (2009) who used this type of measure in the Indonesian context. For each function
respondents can choose one of three responses: can do it easily (score 3), can do it with difficulty
(score 2), unable to do it (score 1). An index is constructed, where the magnitude is one if the
respondent is able to perform all the ADL easily, and zero if she is unable to perform any ADL.
MinScoreMaxScoreMinScoreScoreADL−
−= (8)
4. FINDINGS
(a) Descriptive Statistics
Sample characteristics are summarized in Table 2. A total of 329 households were surveyed; 136
were from GB1, 85 from GB2 and 108 from GB3. The overall response rate was 73 percent, with

16
little variation across the three areas; and little variation in response rates between the insured and
the uninsured13. The participation in MHI among the households interviewed in the survey was 82
percent (96 percent at GB1 and 59 percent at GB2).
There is no significant difference in socio-demographic features, apart from duration of
membership in microcredit, average household income and sources of income, between the program
area (GB1) and the control area (GB3). There is a significant difference in most of these features
(duration of membership in microcredit program, male and female education, and age and sex
structure) between GB1 and GB2. As per the design of the study there is a significant difference in
duration of membership in MHI between these two areas. At GB1, about 64 percent of the insured
had at least five years experience of MHI (the average experience is about six years) and at GB2, 96
percent had only one years experience.
Almost all the microentrepreneurs were aged between 17 and 64 years irrespective of the sample
areas. Most of them were of reproductive age (15-49 years). More than 90 percent of the
microentrepreneurs were married in all the sampled areas; the majority had no formal education; the
formal education rate was higher in GB2 compared to other areas. The majority of the
microentrepreneurs in GB2 and GB3 had household based self-employment14; and this was around
44 percent for the microentrepreneurs in GB1. A good number (28%) of microentrepreneurs in this
area had small businesses. Some microentrepreneurs (18%, 22%, and 17% for GB1, GB2, and GB3
respectively) were not directly involved in any economic activity; rather, they gave the money
borrowed from MFIs to someone else, either in or outside the household. Microentrepreneurs were
themselves the household head in some cases (15%, 14%, and 10% at the GB1, GB2, GB3
respectively), but the vast majority of households were male headed. Like microentrepreneurs, the
majority of the household heads had no formal education. Small business, farming and day labor
were the major occupations of household heads in all the areas.

17
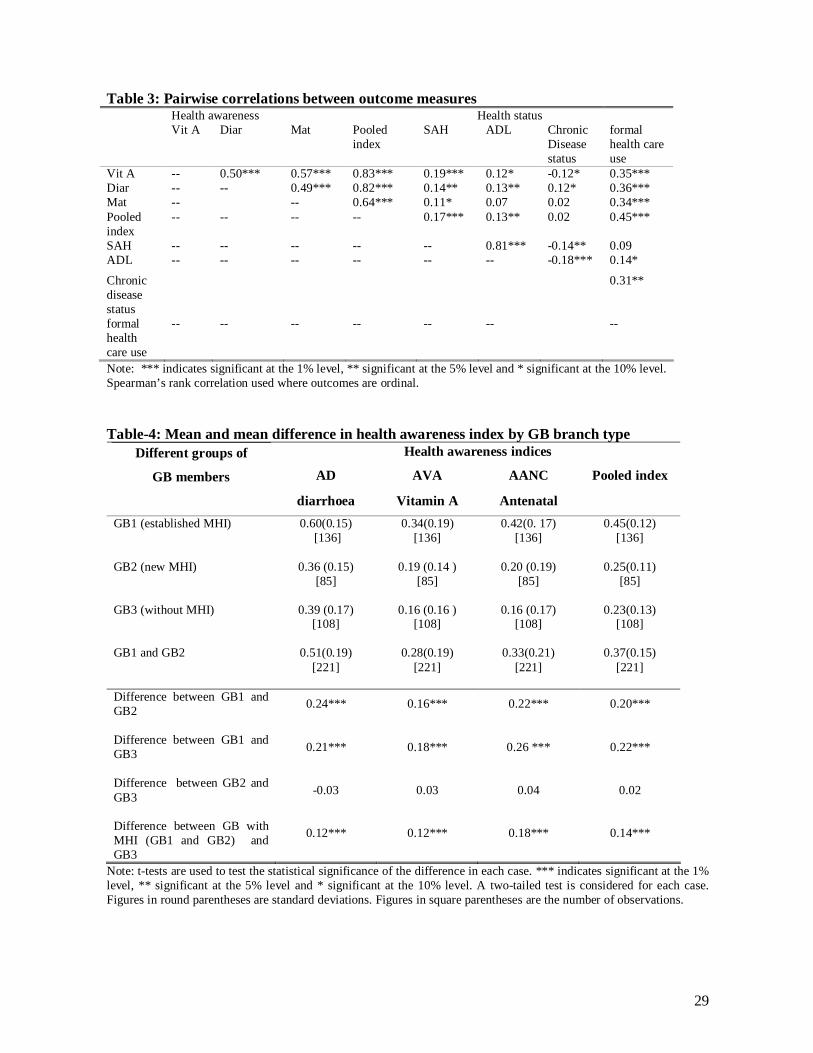
Table 3 reports correlations between the different outcome measures. There are significant
correlations between almost all of the measures; in particular the pooled health awareness index is
strongly correlated with SAH, ADL and formal health care use, and formal health care use is
strongly correlated with health awareness. Chronic disease status is also included here since it is
used as a control variable in our multivariate analysis; it is closely correlated with self-reported
health and ADL.
(i) Health awareness
The mean difference between (i) GB1 (established MHI) and GB2 (new MHI), (ii) GB1 and GB3
(without MHI), and (iii) GB with MHI (both GB1 and GB2) and GB3 is positive and highly
significant for all health awareness indices and the pooled index (see Table 4). Diarrhoea awareness
(AD) is substantially higher than the other indices.
[Table 4]
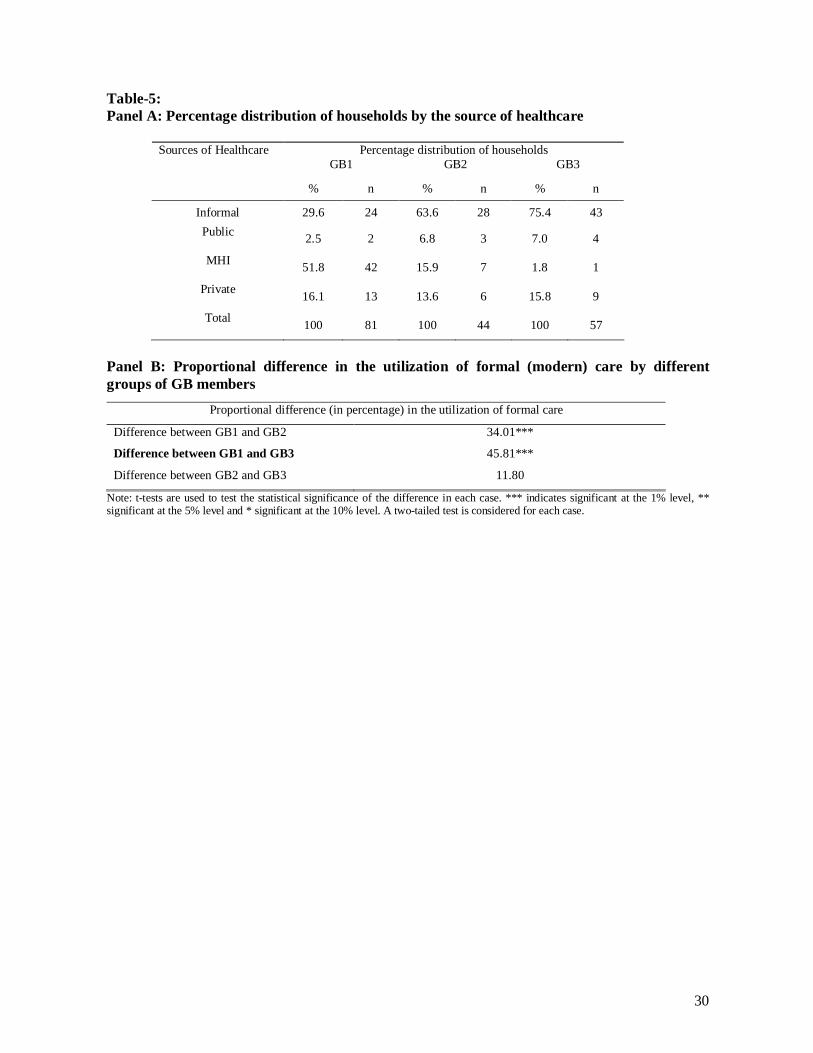
(ii) Utilization of formal (modern) healthcare
About 59 percent of the households (193 out of 329) had at least one acute or chronic diseased person
during the month prior to the survey. A total of 286 individuals had been sick in 193 households (85 in
GB1, 48 in GB2 and 60 in GB3). We focus on the last episode of disease in each household. Most
(94%) of the sick individuals received treatment. A substantial proportion of the insured did not seek
healthcare from MHI in either GB1 or GB2. The majority of the households (52%) did, however, seek
treatment from MHI in GB1 while the majority of the households in GB2 and GB3 sought healthcare
from informal providers (see Table 5; Panel A)15. The proportional difference in the use of formal care
between GB1 and GB2 and between GB1 and GB3 is positively significant at the one percent level (see
Table 5; Panel B).
[Table 5]

18
(iii) Health status
The largest share of respondents reported their health status as good in each area (see Table 6; Panel
A). The program area (GB1) had better health status compared to the comparison area (GB3). At
GB1 about 84 percent of the respondents reported their health status as excellent, good or fair. The
corresponding figures for GB2 and GB3 were 73 percent and 68 percent respectively.
[Table-6]
There is a positive proportional difference between GB1 and GB3 in the good and fair categories of
SAH and a negative difference in the poor category (see Table 6; Panel B)16. However, the
difference is not significant for any category of SAH. For the ADL index, mean health status is high
for all sub-sets of the data (see Table 6; panel B). The difference between GB1 and GB2, as well as
between GB1 and GB3, is positive and significant at the five percent level.
(b) Multivariate Analysis
The regression results are presented in Table 7. The estimation technique is chosen depending on
the form of the dependent variable: (i) OLS for the continuous pooled health awareness index (PI),
since the histogram of the data is approximately normal17. We concentrate only on the pooled index
because the descriptive statistics reveal similar results for all of the separate components; (ii) a
probit model for the dichotomous variable utilization of formal healthcare; (iii) an ordered probit for
SAH of the microentrepreneur, where very poor = 0, poor =1, fair =2, good =3 and excellent = 418.
(iv) a Tobit model for the ADL index (as recommended by Austin et al., 2000 and Austin, 2002)19.
The Tobit model is censored at full health because the distribution of the index is highly skewed to
the left i.e. a substantial number of respondents have a score of one indicating a ceiling effect. For
ease of interpretation all of the outcome variables are increasing in health (or health awareness);
also all of the models are estimated conditioned on the placement of the program. The coefficient
estimates for all models are reported in Table 7 and the marginal effects for the probit and ordered
probit models are shown in the Appendix, Table A2.

19
The key explanatory variable of interest is MHI placement (1 = yes, 0 = no), and we expect a
positive relationship with all of our outcome variables. The control variables included in these
models are as follows. Age and squared age (in years) and marital status (1 = married, 0 =
otherwise) of the microentrepeneur are included in models (i), (iii) and (iv). The direction of the
relationship between health awareness and age is unclear a priori; experience may increase
awareness but memory problems may decrease it. Marital status is likely to have a positive
association with health awareness, especially in relation to maternal health, and there is also
empirical evidence that health status is positively related to marriage, although most of this comes
from developed countries. Model (ii) includes age (and squared age) and sex (1 = male, 0 = female)
of the diseased person; for age the relationship with the outcome (utilization of formal health care)
is not known a priori, but for sex we expect a negative relationship since the insurance cardholders
are largely female and many are of childbearing age so are likely to seek formal care during
pregnancy and for their children. All of the models, apart from (ii), include education level of
microentrepreneur (completed years) and this is expected to be positively related to health
awareness, but the direction of the effect on SAH and ADL is not clear. Model (ii) includes
education of the household head because the head usually decides where to seek healthcare; we
expect this to be positively related to utilization of formal care. Model (ii) includes a dummy for
whether the diseased person is chronically ill (1= chronically ill, 0 = otherwise) and we expect this to
be positively related to the utilization of formal care; models (iii) and (iv) have a similar dummy for
chronic disease status of the microentrepeneur and this is expected to be negative related to health
status. All models include duration of membership in microcredit this is expected to be positively
related to health awareness because the programs provide information on basic health promotion.
We also expect it to be positively related to seeking formal health care, but there is no clear a priori
relationship with health status. All models also include the literacy rate of the village (as a
percentage) and it seems reasonable to expect that this is positively related to health awareness and
utilization of formal care. Models (ii) to (iv) include per capita household income, which is

20
expected to contribute positively to all outcomes. Since TV and radio are used to convey
government health messages, ownership is expected to be positively related to health awareness.
Thus, model (i) includes ownership of TV and radio (1 = yes, 0 = no).
Looking across the columns in Table 7, education of microentrepreneur and ownership of TV and
radio contribute positively to increase health awareness; sex of the diseased person, length of
membership in microcredit program and per capita income have strong relevant influence on
seeking healthcare from formal provider; and chronic disease status of microentrepreneur
consistently influences the health status of both of the measures. In all cases the coefficient on MHI
placement status is positive and it is statistically significant in determining health awareness and
seeking healthcare from formal source. Turning to the marginal effects in Table A2, these appear
sensible with MHI having a large effect on utilization of formal health care.
In terms of the diagnostic statistics, the models appear to be well specified; each of them is jointly
significant at the one percent level according to the F-, Wald or LR tests and there is no evidence of
misspecification according to the RESET tests. The estimates of the threshold parameters are
sensible. The explanatory power of the models is respectable for this type of cross section analysis
with primary data. In addition to explore the effects of possible collinearities between the
explanatory variables, each variable was excluded in turn and this made little difference to the
existing coefficient estimates.
5. DISCUSSION
Our findings suggest that MHI placement contributes to increasing awareness of important health
problems and to the probability of seeking formal care. However, the contribution of MHI to
improvement in health status is yet to be evidenced. A number of factors may contribute to this
result. First, there may be some reporting bias regarding the health status of the microentrepreneurs.

21
The majority report themselves to be in good health and it is possible that respondents, regardless of
whether living in program area or comparison area, may have the idea that if they do not claim
themselves to be healthy they may not obtain microcredit in the future. Second, MHI schemes
provide basic primary healthcare, which may take a relatively long time to generate a significant
impact on health status. GB does not provide secondary or tertiary healthcare from its health centres
and although it maintains a referral mechanism for the higher levels of healthcare, this does not
function effectively as we observed during the survey20.
Third, many insured households do not seek treatment from the MHI health centres, instead they
mainly seek healthcare from informal providers. There are a number of potential reasons for this
(both demand side and supply side), and evidence for these was gathered during qualitative
interviews with respondents during the fieldwork. There are the relatively high costs of seeking
healthcare from MHI compared to available alternatives (especially, informal providers); the main
sources of these costs are consultation fees and drugs. MHI schemes charge consultation fees (co-
payments) to deter over utilization of health care by the insured (moral hazard), and these payments,
although relatively small, are a strong deterrent to these very poor households, who then prefer to
use informal health care providers who may offer credit terms, even if the total cost of health care is
then higher. In addition, there are usually a number of alternative providers close to the home,
compared to one busy MHI health centre. Further, as observed during our interview work, there is a
substantial lack of understanding around risk-sharing and the role of insurance among the insured; a
finding also reported by Desmet et al., (1999) in their study of insurance in Bangladesh.
Fourth, there may have some program placement bias, i.e., MHI may have been placed in the areas
where people had poorest health. Although some measures were undertaken this study could not
fully control for program placement bias using cross section data. The GB MHI scheme has been
gradually placed where government provision was not functioning well. If MHI was placed earlier

22
in the areas with the worst health we would expect this to bias our results against finding an effect
of MHI placement. Finally, improvement of health status is a dynamic effect of MHI, thus a single
cross section may not be adequate to capture the full impact of MHI.
Our study uses primary data collected expressly for the purpose of assessing the impact of MHI,
and we apply appropriate methods of analysis, however there are still some limitations; these
largely arise from time and resource constraints21. First, the study is limited to a single cross
section, and further work should focus on collecting longitudinal data in order to control for
unobserved heterogeneity and reduce endogeneity bias, and also because it is more appropriate for
the analysis of dynamic outcomes. Second, our sample is not completely representative of the
insured population. Although the GB MHI scheme is open to everyone, irrespective of GB
microcredit status, the scheme does centre on microcredit members so we have focused on them22.
While GB microcredit does try to include the poorest of the poor, it (like many similar schemes)
may miss them. Finally, we only measure the health status of microentrepreneur, and not the health
status of all the members in the households.
6. CONCLUSIONS
This study has outlined the mechanisms by which adding MHI to microcredit schemes can
contribute to improving health awareness, health seeking behaviour and health status. We have
investigated this in the context of GB, the largest microcredit organization in Bangladesh. Where
MHI is available take-up rates are very high and there are large potential spill-over effects, so we
have focused on the effects of MHI placement. Our results show a positive association between
MHI placement and all of our health outcome measures. The results are statistically significant for
the determination of health awareness and seeking formal care, but not for health status. A number
of reasons have been suggested for our findings, which include problems in detecting long-term
effects with our cross section data as well as shortcomings of the MHI scheme in question,
including a lack of proper referral services and the adverse effects of protection against moral

23
hazard. Nevertheless, the study makes an important contribution to the literature as it provides
comprehensive evidence on the impact of MHI on a broad set of health outcomes.
Our findings are potentially important for the expansion or replication of MHI by MFIs in
Bangladesh. However, in practice most MFIs do not have the capacity (either managerial or
financial) to expand this provision. MHI has been mainly operated in the areas where government
healthcare facilities are not functioning well. Thus, one possible solution is for government to
contract out its poorly functioning health centres to the existing micro insurers. This could generate
a number of benefits including saving the rental or construction costs of new health centres,
enhancing the confidence of both clients and health personnel regarding the sustainability of the
program, and avoiding inefficient duplication of health service provision.
24
References Amin, R., Li, Y., & Ahmed, A. U. (1996). Women’s Credit Programs and Family Planning in Rural
Bangladesh. International Family Planning Perspectives, 22(4), 158-162.
Austin, P. C. (2002). A comparison of methods for analyzing health-related quality-of-life
measures. Value in Health, 5, 329-337.
Austin, P. C., Escobar, M. & Kopec, J. A. (2000). The use of the Tobit model for analyzing
measures of health status. Quality of Life Research, 9, 901-910.
BBS (2006). Preliminary Report on Household Income and Expenditure Survey-2005. Dhaka,
Planning Division, Ministry of Planning.
Boes, S. & Winkelmann, R. (2006). Ordered response models, AStA Advances in Statistical
Analysis, Springer, 90(1), 167-181.
Bhatt, N. & Tang, S.-Y. (2001). Delivering Microfinance in Developing Countries:
Controversies and Policy Perspectives. Policy Studies Journal, 29(2), 319-333.
Chase, R (2002). Supporting Communities in Transition: The Impact of the Armenian Social
Investment Fund. World Bank Economic Review, 16(2), 219-240.
Churchill, C. (eds) (2006). Protecting the Poor: A Microinsurance Compendium. Geneva: ILO.
Desmet, M., Chowdhury, A.Q. & Islam, Md.K. (1999). The Potential for Social Mobilization in
Bangladesh: the Organization and functioning of two health insurance schemes. Social
Science and Medicine, 48:925-938.
Dror, D.M., Koren, R. & Steinberg, D.M. (2006). The impact of Filipino micro health-insurance
units on income related equality of access to healthcare. Health policy, 77, 304-317.
Dror, D. M., Soriano, E. S., Lorenzo, M. E., Sarol, J. N., Azcuna, R. S. & Koren, R. (2005). Field
based evidence of enhanced healthcare utilization among persons insured by micro health
insurance units in Philippines. Health Policy, 73, 263-271.
Galasso, E & Ravallion,M. (2004). Social Protection in a Crisis: Argentina’s Plan Jefes y Jefas
World Bank Economic Review, 18(3), 367-399.

25
Gertler, P and Gruber, J. (2002). Insuring Consumption against Illness. American Economic
Review, 92(1), 51-70.
Gertler, P., Levine, D. I. and Moretti, E. (2009). Do Microfinance Programs Help Families Insure
Consumption against Illness. Health Economics, 18, 257-273.
Genebo, T and Gelaw, M., (2000). Knowledge and attitude of the community towards rich sources
of vitamin A and iron in relation to malnutrition, Ethiopian Journal of Health Development,
14(1), 23-29.
Hadi, A. (2002). Integrating prevention of acute respiratory infections with micro-credit
programme: experience of BRAC, Bangladesh. Public Health, 116 (4), 238-244.
Hamid, S.A., Bhuiyan, S.M. & Sultana, N. (2005). Delivery of Health Care through Micro
Health Insurance Scheme: An Assessment of the Health Programme of Grameen Kalyan,
Dhaka, Grameen Kalyan.
Hurd, M. & McGarry, K. (1995) Evaluation of the subjective probabilities of survival in the health
and retirement survey. Journal of Human Resources, 30:21-37.
Idler, E. & Benyamini, Y. (1997) Self-related health and mortality: a review of twenty-seven
community studies. Journal of Health and Social Behaviour 38:21-37.
Jutting, J. P. (2004). Do Community-based Health Insurance Schemes Improve Poor People’s
Access to Health Care? Evidence from Rural Senegal. World Development, 32 (2), 273-288
Konde, J. (1992). Knowledge, attitudes and practices and their policy implications in childhood
diarrhoeas in Uganda. Journal of Diarrhoeal Disease Research, 10(1), 25-30.
Kochar, A. (2004). Ill-health, savings and portfolio choices in developing economies. Journal of
Development Economics, 73, 257-285.
McLennan, J. D., (1998). Knowledge and Practices of Preventing Diarrhoea in Malnourished
Children, Journal of Diarrhoeal Disease Research, 16(4), 235-240.
Mosley, P. (2003). Micro-insurance: Scope, Design and Assessment of Wider Impacts. IDS
Bulletin, 34(4), 143-155.
26
Msuya, J.M., Jutting, J.P., Asfaw, A. (2007). Impact of Community Health Funds on the Access to
Health Care: Empirical Evidence from Rural Tanzania. International Journal of Public
Administration, 30, 813-833.
Pitt, M. M. & Khandker, S. R. (1998). The impact of group-based credit programs on poor
households in Bangladesh: Does the gender of participants matter? Journal of Political
Economy, 106, 958-996.
Schneider, P. & Hanson, K. (2007). The impact of micro health insurance on Rwandan health centre
costs. Health Policy and Planning, 22, 40-48.
Smith, K., Dmytraczenko, T., Mensah, B. & Sidibe, O. (2004). Knowledge, Attitude and Practices Related to
Maternal Health in Bla, Mali: Result of a Baseline Survey. Partners for Health Reform Plus: Maryland.
Waters, H. R. (1999). Measuring the impact of health insurance with a correction for selection bias
– A case study of Ecuador. Health Economics, 8, 473-483.
Woller, G.M, Dunford, C. & Woodworth W. (1999). Where to Microfinance. International
Journal of Economic Development, 1(1), 29-64.
Woller, G.M. & Woodworth, W. (2001). Microcredit as a Grass-Roots Policy for International
Development. Policy Studies Journal, 29(2), 267-282.
Xue, L., Jia, Y.J., Pang, S.L., Su, J.Q. (2007). A survey on knowledge of prenatal care of 300
pregnant women. Maternal and Child Health Care of China, 22(15):2115-2117.
27
Table-1: A picture of the key features of the MHI scheme of GB
Key features Grameen Kalyan of GB Type of organization
• Insurer as well as a health service provider.
Area coverage • December 2008: 39 unions of 25 sub-districts of 10 districts. The program is identical in all areas.
Mechanisms for providing health services
• Mainly through static clinics(1). • Also via mobile clinics, satellite clinics and domiciliary visits (by the health workers). • Limited emergency services through static clinics. • Referral services via agreements with some hospitals.
Technical staff • An MBBS (Bachelor of Medicine and Bachelor of Surgery) doctor.
• A female DMF (Diploma in Medical Faculty). • An office manger, a female paramedic, a laboratory technician and six community health
assistants. • Some Trained Traditional Birth Attendants (TTBA) trained by Grameen Kalyan.
Categories of services covered
• Preventive care including antenatal care (ANC). • Curative care (mainly outpatient care). • All the basic diagnostic services including ultra-sonography. • Some health promotion activities.
Type of curative services provided
• Essential Services Package (ESP) including safe delivery.
Enrolment status
• Voluntary.
Proof of enrolment Affiliation unit
• Insurance card. • Household. The program is identical for all enrolees.
Eligibility criterion
• GB member households or any villagers living within 8 km of health centre.
Access of non-insured households to curative care
• Yes.
Premium • Annual premium (covering up to 6 members) (2) § For a GB member family: TK.120 (US $1.74) § For a non member family: TK.150 (US $2.17)
• Average daily wage § Male: TK.90 (US $1.30) § Female: TK.60 (US $0.87)
Benefit package for the cardholders
• Co-payment: § Medical consultation fee, cardholder: TK.10 (US $0.14) § Medical consultation fee, non-cardholder: TK.25 (US $0.36)
• Discount: Discount for basic medicine(3) on MRP: 25%, for pathological tests on listed price: 30-35%, and for referred consultation visit: 50%.
• Hospitalization benefit: Annually up to 2000TK (US $29) for a family. • Free: Annual basic check up for head of the family; immunization against six-diseases,
domiciliary visits by health assistants.
Additional health services package
• School health package, Eye Mega Camp for cataract operations, and regular cataract operation programs.
Financing mechanism • An initial endowment fund of Grameen Bank.
• Revenue generation from premiums and co-payment.
Cost recovery rate • 100% (including the managerial costs and overhead costs of Regional Office and Head Office) in most of the old health centres.
Joining mechanism • at weekly microcredit meetings for GB members • via health visitor domiciliary visits for GB members • at health centres; for GB members or non-members.
Source: Hamid et al., 2005b; Ahmed et al., 2005; and various official documents of SSS and Grameen Kalyan of GB. Notes: (1) Static clinics are the normal clinics where patients come to seek health services; in contrast to ‘satellite clinics’ where the physicians/nurses visit a location regularly to provide care. (2) TK.20 is charged for each additional member. (3) Basic medicine: 15 essential medicines are enlisted in the schedule of Government of Bangladesh.

28
Table-2: Socio-demographic characteristics of the sampled population
Key features GB1 GB2 GB3 Difference between
GB1 and GB2
Difference between
GB1 and GB3
No. of households 136 85 108 Survey response rate (%) 75 68 73 .05 .05 Membership rate of households in GB microcredit program (%)
34
32
33
0.02 0.01
Average duration of membership in microcredit program (years)
9.62 (6.95)
6.42 (6.05)
6.84 (6.25)
3.19*** 2.77***
Membership rate of households in MHI program (%)
96 59 - 37.5*** -
Average length of membership in MHI program (years)
6.01 (2.96)
1.00 (0.20)
-
5.02*** -
Average education level (male) 2.97 (3.16)
4.21 (3.86)
2.97 (3.43)
-1.24*** 0.00
Average education level (female) 2.28 (2.73)
2.80 (3.33)
2.23 (2.95)
-0.51* 0.05
Average household size 4.84 (1.39)
4.90 (1.72)
4.62 (1.3)
-0.06 0.23
Female population (%) 49.09 55.16 48.50 -0.06** 0.01
Average age 25.37 (18.94)
27.45 (20.19)
26.74 (19.29)
-2.08* -1.38
Average male wage (USD)
1.3 (0.90)
1.4 (0.93)
1.2 (0.97)
-0.01 0.01
Average female wage (USD) 0.85 (0.81)
0.86 (0.76)
0.83 (0.80)
-0.01 0.02
Average household income in USD 1301 (728)
974 (489)
874 (414)
326*** 427***
Income sources(1) wages/salaries 0.18 0.25 0.26 -.07*** -.08*** agriculture 0.23 0.26 0.28 -.03*** -.05*** business 0.36 0.28 0.35 .08*** .01*** other 0.23 0.21 0.11 .02*** .12** No. of MFIs working in area 5 6 5 Note: 1. t-tests are used to test the statistical significance of the difference in each case. *** indicates significant at the 1% level, **5% level, * 10% level. Magnitudes in round parentheses are standard deviation. (1) Denotes proportion of total household income from each source.
29
Table 3: Pairwise correlations between outcome measures Health awareness Health status Vit A Diar Mat Pooled
index SAH ADL Chronic
Disease status
formal health care use
Vit A -- 0.50*** 0.57*** 0.83*** 0.19*** 0.12* -0.12* 0.35*** Diar -- -- 0.49*** 0.82*** 0.14** 0.13** 0.12* 0.36*** Mat -- -- 0.64*** 0.11* 0.07 0.02 0.34*** Pooled index
-- -- -- -- 0.17*** 0.13** 0.02 0.45***
SAH -- -- -- -- -- 0.81*** -0.14** 0.09 ADL -- -- -- -- -- -- -0.18*** 0.14* Chronic disease status
0.31**
formal health care use
-- -- -- -- -- -- --
Note: *** indicates significant at the 1% level, ** significant at the 5% level and * significant at the 10% level. Spearman’s rank correlation used where outcomes are ordinal. Table-4: Mean and mean difference in health awareness index by GB branch type
Health awareness indices Different groups of
GB members AD AVA AANC Pooled index
diarrhoea Vitamin A Antenatal GB1 (established MHI) 0.60(0.15)
[136]
0.34(0.19) [136]
0.42(0. 17) [136]
0.45(0.12) [136]
GB2 (new MHI) 0.36 (0.15)
[85]
0.19 (0.14 ) [85]
0.20 (0.19) [85]
0.25(0.11) [85]
GB3 (without MHI) 0.39 (0.17)
[108]
0.16 (0.16 ) [108]
0.16 (0.17) [108]
0.23(0.13) [108]
GB1 and GB2 0.51(0.19)
[221]
0.28(0.19) [221]
0.33(0.21) [221]
0.37(0.15) [221]
Difference between GB1 and GB2 0.24***
0.16***
0.22***
0.20***
Difference between GB1 and GB3 0.21***
0.18***
0.26 ***
0.22***
Difference between GB2 and GB3 -0.03
0.03
0.04
0.02
Difference between GB with MHI (GB1 and GB2) and GB3
0.12***
0.12***
0.18***
0.14***
Note: t-tests are used to test the statistical significance of the difference in each case. *** indicates significant at the 1% level, ** significant at the 5% level and * significant at the 10% level. A two-tailed test is considered for each case. Figures in round parentheses are standard deviations. Figures in square parentheses are the number of observations.
30
Table-5: Panel A: Percentage distribution of households by the source of healthcare
Percentage distribution of households Sources of Healthcare GB1 GB2 GB3
% n % n % n
Informal 29.6 24 63.6 28 75.4 43 Public
2.5 2 6.8 3 7.0 4
MHI 51.8 42 15.9 7 1.8 1
Private 16.1 13 13.6 6 15.8 9
Total 100 81 100 44 100 57
Panel B: Proportional difference in the utilization of formal (modern) care by different groups of GB members
Proportional difference (in percentage) in the utilization of formal care
Difference between GB1 and GB2 34.01***
Difference between GB1 and GB3 45.81***
Difference between GB2 and GB3 11.80
Note: t-tests are used to test the statistical significance of the difference in each case. *** indicates significant at the 1% level, ** significant at the 5% level and * significant at the 10% level. A two-tailed test is considered for each case.

31
Table-6 Panel A: Mean ADL score and percentage distribution of households by self-reported health status of the microentrepreneurs
Percentage distribution of households Self-reported health status GB1
(Established MHI) GB2
(new MHI) GB3
(no MHI) % n % n % n
Excellent 0.7 1 0 0 4.6 5
Good 57.4 78 38.8 33 45.4 49 Fair 25.7 35 34.1 29 17.6 19
Poor 16.2 22 25.9 22 28.7 31
Very poor 0 0 1.2 1 3.7 4
Total 100 136 100 85 100 108 Mean ADL score (st. dev)
0.88 (0.19) 0.81
(0.22) 0.82 (0.23)
Panel B: Difference in mean ADL index and proportional difference in self reported health status between different sub-sets of GB members
Self-reported health status Proportional difference (in percentage) Good Fair Poor
Difference in mean ADL
index
Between GB1 and GB2 19.27* -8.38 -10.88 0.07***
Between GB1 and GB3 8.09 8.15 -16.23 0.06**
Between GB2 & GB3 -11.18 16.53 -5.35 -0.01
Note: t-tests are used to test the statistical significance of the difference in each case. *** indicates significant at the 1% level, ** significant at the 5% level and * significant at the 10% level. A two-tailed test is considered for each case.

32
Table 7: Multivariate Analysis Results Explanatory variables (i)
OLS estimation of health awareness
(PI)
(ii) Probit
Utilization of formal
healthcare =1
(iii) Ordered probit self-rep. health (very poor = 0, poor =1, fair =2, good
=3, excellent = 4)
(iv) Tobit
ADL index
Age of microentrepreneur -0.007 (0.006) - 0.058
(0.050) 0.009
(0.016)
Squared age of microentrepreneur 0.0001 (0.0001) - -0.001*
(0.001) -0.0003 (0.0002)
Age of the diseased person - -0.023 (0.018)
- -
Squared age of the diseased person - 0.0003 (0.0002)
- -
Sex of the diseased person ( 1= male) - -0.569** (0.266)
- -
Marital status of microentrepreneur (1= married) 0.039 (0.035) - 0.074
(0.297) -0.014 (0.106)
Education of microentrepeneur or household head(1) 0.014*** (0.004)
0.076* (0.041)
0.012 (0.038)
-0.009 (0.011)
Chromic disease of the household member (1= yes)
- 0.533* (0.305)
- -
Chronic disease of microentrepreneur (1= yes) - - -0.351** (0.172)
-0.130** (0.057)
Duration of membership in microcredit program 0.002
(0.001)
0.040** (0.019)
-0.009 (0.013) -0.003
(0.004)
Ownership of TV and Radio (1= yes) 0.036** (0.018) - - -
Per capita household income (100 USD =1 unit) - 0.164**
(0.078)
.076 (.047)
0.030* (0.016)
Literacy rate (percentage) 0.007 (0.005)
0.069 (0.067)
0.014 (0.052)
-0.009 (0.015)
MHI placement (1= yes, 0= no) 0.222*** (0.022)
1.402*** (0.321)
0.203 (0.204)
0.057 (0.067)
Constant 0.041 (0.241)
-3.907 (2.625)
- 1.315** (0.670)
Cut point 1 - - -1.918
(2.116) -
Cut point 2 - - -0.383
(2.134) -
Cut point 3 - - 0.280
(2.133) -
Cut point 4 - - 2.455
(2.105) -
Sigma - - - 0.320
(0.023) No. of observations 244 138 244 244
F-statistics /Wald chi2 / LR chi2 31.58*** 43.66*** 32.95*** 40.48***
R2/ Pseudo R2 0.479 0.308 0.0456 -
Log pseudo likelihood/ Log likelihood - -66.196 -271.011 -112.476
RESET F(3, 232) = 0.82 Prob > F = 0.486
chi2(1) = 0.23 Prob > chi2 =0.628
chi2( 1) = 0.18 Prob > chi2 = 0.669
F( 1, 234) = 0.00 Prob > F = 0.968
Notes: *** Significant at 1% level, ** Significant at 5% level, * Significant at 10% level. Figures in the parentheses are Huber-White robust standard errors for ordered probit model and simple standard errors for tobit model. Coefficients reported for probit and ordered probit models; marginal effects are shown in Appendix Table A2. (1) Education of the household head is applicable only for model (ii).

33
APPENDIX
Table-A1: Questions used to collect data for health awareness
How can you treat diarrhoea? (Multiple responses are applicable)
What are the major natural food sources of vitamin A? (Multiple responses are applicable)
What are the major signs that arise at the time of pregnancy, which are very dangerous to the mother? (Multiple responses are applicable)
1. OR saline 2. Solution of salt and
sugar/gur 3. Water of green
coconut 4. Melted rice 5. Consult with
doctor 6. Do not know 7. Others (specify)
1. Carrot 2. Sweet potato 3. Sweet pumpkin 4. Ripe papaya 5. Ripe banana 6. Molasses 7. Amaranth leaves 8. Do not know 9. Other (specify)
1. Severe headache and blurry vision
2. Eclamsia 3. Unsmooth delivery/ Delayed
delivery 4. Excessive bleeding 5. High fever 6. Does not know 7. Others (specify)
Note: The respondents were not shown possible answers during the interview.
Table-A2: Marginal effects for the ordered probit and probit models in Table 8.
Ordered probit self reported health Explanatory variables Probit utilization of
formal healthcare =1
v poor =0
poor =1
fair =2
good =3
excellent = 4
Age of microentrepreneur (years) - -0.002 (0.002)
-0.015 (0.014)
-0.006 (0.005)
0.020 (0.017)
0.003 (0.003)
Squared age of microentrepreneur - 0.000 (0.000)
0.0003* (0.0002)
0.0001* (0.0001)
0.0004* (0.002)
0.000 (0.000)
Age of diseased person (years) -0.009 (0.007) -
- - - -
Squared age of diseased person 0.0001 (0.0001) -
- - - -
Sex of diseased person (1 = male) -0.224** (0.102) -
- - - -
Marital status of microentrepreneur (1= married)
- -0.002 (0.009)
0.075 (0.083)
-0.007 (0.026)
0.026 (0.106)
0.003 (0.012)
Education of microentrepreneur (in years)
0.030* (0.016) 0.000
(0.001) 0.096
(0.010) -0.001
(0.004) 0.004
(0.013) 0.001
(0.002) Chromic disease status of household member (1= yes)
0.208* (0.115) - - - - -
Chronic disease status of microentrepreneur (1= yes)
- 0.013 (0.009)
0.099* (0.052)
0.028** (0.012)
-0.126** (0.063)
-0.014* (0.008)
Duration of membership in microcredit program (in years)
0.016** (0.008)
0.000 (0.000)
0.002 (0.003)
0.001 (0.001)
0.023 (0.004)
0.000 (0.001)
Per capita household income (100 USD =1 unit)
0.065** (0.031)
-0.002 (0.002)
-0.020 (0.013)
-0.008 (0.005)
0.026 (0.017)
0.004 (0.003)
Literacy rate (percentage) 0.027 (0.027)
-0.000 (0.001)
-0.004 (0.014)
-0.001 (0.005)
0.026 (0.018)
-0.001 (0.002)
MHI placement (1= yes, 0= no) 0.515*** (0.098)
-0.006 (0.007)
-0.051 (0.056)
-0.020 (0.019)
0.071 (0.072)
0.009 (0.010)
34
Notes 1 Grameen means ‘rural’ or ‘village’ in the Bangla language.
2 One of the large MFIs in Bangladesh; its full name is Bangladesh Rural Advancement Committee.
3 There are 64 districts in Bangladesh, and 482 ‘upazilas’ (or sub-districts), which are the lowest level of
administrative government; each upazila is sub-divided into smaller local ‘unions’.
4 Some other organizations (BRAC, Society for Social Services, Sajida Foundation, Shakti, Dhaka Community
Hospital, Nari Uddug Kendra, Dushtha Shasthya Kendra, and Integrated Development Foundation) also offer a
prepaid health program in Bangladesh but the GB program is the largest.
5 GB did place its MHI scheme here later on, but it was subsequently withdrawn due to establishment of a hospital
by a local philanthropist.
6 The exact specification of the model depends on the nature of the outcome (continuous, binary, ordered).
7 For up-to-date statistics on the health profile on Bangladesh, see www.searo.who.int
8 Equal weights were chosen in the absence of information regarding the disease burden of each issue separately.
9 Diseases are broadly classified into acute and chronic based on the UMS Chronic Disease List,
www.ukzn.ac.za/ukznms/CDL%202006.pdf
10 Information was collected regarding the first contact with a health provider for those who sought treatment.
11 Public providers consist of the medical personnel of different government hospitals.
12 Private providers include the medical personnel of private and NGO hospitals and clinics, and private practice of
public providers.
13 We could not interview some households due either to absence of the key respondent or unwillingness to take part.
The survey was conducted during harvesting season hence people were away from home for long periods during the
day. One repeat visit was made to absent households. Respondents were not pressurized nor offered motivation to
take part in the interview.
14 Livestock rearing, poultry feeding, farming, tailoring, etc. fall in this category.
15 While MHI is not available in GB3, one of the households of GB3 sought healthcare from MHI at the special
request of the Branch Manager of the microcredit program.
16 As there are very few observations in the excellent and very poor categories, we have merged excellent with good
and very poor with poor.

35
17 In further analyses we also applied an ordered probit model by breaking down the index into 5 equal groups; the
results do not differ significantly from the OLS results reported here.
18 In a Wald test for the parallel odds assumption underlying this model, which compares the estimates to those from
a generalized ordered probit model (Boes and Winkelmann, 2006), the null hypothesis cannot be rejected
19 We also estimated the ADL model using interval regression with robust standard errors, and the results are very
similar to the tobit results reported here.
20 Officially there is a provision that an insured household will receive up to TK.2000 (about US $29) annually as
referral (hospitalization) benefits. This benefit was provided via external funding from the ILO. However the fund
has been exhausted so the benefit is not longer provided in practice.
21 There was no external research funding for this study.
22 In purely practical terms our data collection was facilitated by the cooperation of GB. It would have been much
more difficult for us to access people with no connection to GB, and given we had no funding for this work we
decided not to do this.