Sheep and Goat Investigations
26
ALASKA DEPARTMENT OF FISH & GAME 1960-61 'l'"'leee 'ieepod OF GAME VOLUME II, NO. 5 Sheep and Goat Investigations Work Plan E Juneau , Alaska
Transcript of Sheep and Goat Investigations
ALASKA DEPARTMENT OF FISH &GAME 1960-61 ';;,·ee-u-'ie~"'4dll 'l'"'leee 'ieepod
~IVISION OF GAME VOLUME II, NO. 5
Sheep and Goat Investigations Work Plan E
Juneau , Alaska
Alaska Department of Fish and Game Division of Game
1960-61 Pittman-Robertson Project Report Volume II, No. 5
Sheep and Goat Investigations Work Plan E
Juneau, Alaska

•• I,
Volume II, Number 5 1960-1961
I I ANNUAL REPORT OF PROGRESS, 1960-1961
FEDERAL AID IN WILDLIFE RESTORATION PROJECT W-6-R-2
I GAME INVESTIGATIONS OF ALASKA
I I STATE OF ALASKA
William A. Egan, Governor
I I
Alaska Department of Fish and Game
le Clarence L. Anderson, Commissioner
I Division of Game
I I
James W. Brooks, Director David R. Klein, P-R Coordinator
I Personnel participating in project:
I I Franklin F. Jones
Harry Merriam Arthur Sheets
e I (Requests to reproduce material contained within this report
should be directed to the Alaska Department of Fish and Game,
I Juneau, Alaska)
I

••
••
I
I I I I I I I le I I I I I I I
TABLE OF CONTENTS
Job No. Title Page No.
E-1 Sheep Distribution and Abundance Survey 1
E-2 Tanana Hills Sheep Distribution and Abundance • • . . . • . . . . . 3
E-3 Part I Goat Distribution and Population Status,
Southeast Alaska . . • . . . . • . . . 7
E-3 Part II Goat Distribution and Population Status,
Prince William Sound . . . . . . . . . . . 15
I
I Volume 2 Report No. E-1
I•• ANNUAL REPORT OF PROGRESS INVESTIGATIONS PROJECT
COMPLETION OF 1960-1961 SEGMENT
I State: Alaska
I Project No: W-6-R-2 Name: Alaska Wildlife Investigations
I Work Plan: E Sheep and Goat Investigations
I Job No: 1 Title: Sheep Distribution and Abundance Surv~§_
I PERIOD COVERED: July 15, 1960 to June 30, 1961
I OBJECTIVES:
le To determine the distribution and abundance of sheep with special attention to accessible and/or heavily hunted ranges. To determine sex and age compositions on key sites
I which will serve as indices to sheep welfare on broader geographic areas.
I FINDINGS:
The work load on other research projects precluded
I field work on this one; therefore, there was no progress during this period.
I RECOMMENDATIONS:
This is an important project and the personnel assign
I ments should be adjusted in such a manner as to provide time to cover this job.
I I
•• I

.1 Submitted by:
Franklin F. Jones Game Biologist February 20, 1962
Approved by: ••I David R. Klein I P-R Coordinator
I I
James W. Brooks, Director Division of Game I
I I
el I I I I I I
••I
- 2 I

I
Report No. E-2Volume 2
I I•• ANNUAL REPORT OF PROGRESS
INVESTIGATIONS PROJECT COMPLETION OF 1960-1961 SEGMENT
I State: Alaska
Name: Alaska Wildlife
I Project No: W-6-R-2 ----
=I:;.;n:...:vc..:e::..;s::..t=ic.::.gL::a.:...:t::.;l=..o=nc:::s=---~~···--·-----
_?heel2__ Managemen~t_______
I Work Plan: E
Investigations
Title: Tanana Hills Sheep D:!-s..:::_____Job No: 2
I tributiqn and Compo~j_tiol}_
I PERIOD COVERED: July 1, 1960 to June 30, 1961
le ABSTRACT:
A Piper PA-18 was utilized in an attempt to secure a total count and sex and age composition of the sheep inhabit
I ing the White Mountains. Seventy-one sheep were counted southeast of Beaver Creek on July 13 and 110 northwest of Beaver Creek on July 14. The total for the two days was 181
I animals including: 95 ewes and yearlings, 51 lambs, and 35
rams.
I OBJECTIVES:
I To determine the distribution and relative abundance of sheep in the Tanana Hills, and to classify these sheep
I according to groups and home range and to assess the status
of each.
TECHNIQUES:
I Flights were performed on July 13 and 14 in an attempt to obtain a total count and the sex and age composition of the group of sheep inhabiting the White Mountain section ofI
•• I - 3

.I
The Tanana Hills. A Piper PA-18 was used for this flying. ••IThe White Mountains were covered in a systematic manner in order to locate the individual groups. Sex and age composition was obtained from low, slow passes as close to the animals as terrain and turbulance would permit. I
Past experience has shown that from the air yearlings and young rams (including two year old animals) cannot with Icertainty be separated from the ewes; therefore, the composition is listed as: rams (three years and older), ewes and yearlings (including two year old rams) , and lambs of Ithe year.
FINDINGS: I On July 13, 1960, a total of 71 sheep was found and
tabulated in the mountains southeast of Beaver Creek. I Approximately 10 of these animals were located in the precipitous terrain between Beaver Creek and the head of Fos3il Mountain, Lime Peak, and the high ridge extending I from one to the other. The composition of these animals is presented in Table 1. el
On July 14, 1960, the mountains northwest of Beav0r Creek were flown. On this reconnaissance flight 110 sheep were located and composition secured. The largest con I centration of sheep was found on and adjacent to Mount Schwatka, and a smaller group on Mount Victoria. Of t'.1e 110 sheep, some 30 animals were located in the precipitous I areas east of Mount Schwatka. These data are also presented in Table 1. I
The distribution of the sheep counted is shown in Figure 1. I
I I
••I
- 4 I

••
••
I
I Table 1. Composition of sheep inhabiting the White Mountains
July, 1960.
I Ewes & Date Area Yearlings Lambs Rams Total
Southeast of
I I ' July 13 I 1960 Beaver Creek 35 19 17 71
Northwest of
I July 14, 1960 Beaver Creek 60 32 18 110
TOTALS 95 51 35 181
Lamb:Adult ratio 39:100
I RECOMMENDATIONS:
I These counts should be conducted annually to ascertain the current status of this group.
SUBMITTED BY: .APPROVED BY:
I I
- 5
Franklin F. Jones
I Game Biologist March 8, 1962
I I I I
I
David R. Klein P-R Coordinator
James W. Brooks, Director Division of Game

0
.I 147°00'
( "'-l, .~ "6
45'
0 0 0 0
0
ooo o 177~Mt. Sch atka \
0
( 0
1 I
\ )
0
............... __
' \ 0I
5062 o. :
Lim8 O f Peak
0
...., -{~~ 0 ;·, '--. J:\.i..').. Figure 1. Sheep counts
'-<.fl Cache in White Mountains.4 772• . 0 Mt.
65° Scale: l= approx. 250,00030' 1----:~~-=-_./==-~¥-~~~-...j..~~-4-~~.,...-I
/ o 5 Sheep
July 13, 1960. Counts made southeast of Beaver Creek. July 14, 1960. Counts made northwest of Beaver Creek.
0 0
s@3~Victorl~<
N
o Mt.0
••I I I I I I I
el I I I I I I
••I
- 6 I

----·--·------------------
•• I .
Volume 2 Report No. E-3
I Part I
I ANNUAL REPORT OF PROGRESS
INVESTIGATIONS PROJECT COMPLETION OF 1960-·1961 SEGMENT
I State: Alaska
I Project No: W-6-R-2 Name: Alaska Wildlife Investigations
I Work Plan: E Sheep and Goat Investigations
I Job No: 3- Part I Title: Goat Distribution and Population Status, Southeast Alaska
I PERIOD COVERED: July 1, 1960 to June 30, 1961
ABSTRACT: ~
I Five hundred forty-three goats were counted in aerial
composition counts which were flown between Walker Cove and Wilson Arm near Ketchikan, between the Stikine and Farragut
I Rivers near Petersburg, and over the west-central portion of Baranof Island. The observed kid-adult ratio for the combined areas was 37:100.
I The hunter harvest of mountain goats for in 1960 is estimated to be 115 animals.
I OBJECTIVES:
To determine the distribution, abundance,
I composition of mountain goat populations.
TECHNIQUES:
I
Southeast Alaska
and sex and age
Aerial composition counts were flown in small float planes of the Cessna 180 class or smaller. Clear, calm weather was essential for accurate observations. Counts were made in the early morning or evening (4:00 A.M. to 8:00 A.M. and 5:00 P.M•I
•• - 7 I

.I
to 8:00 P.M.) to take advantage of the goats' major activity ••Iperiods. Flights were made along the contour of the ridges, close enough to distinguish kids from adults with the unaided eye. A systematic, pre-arranged flight plan was followed to ensure accurate coverage. I
The writer was assisted in the investigations by Loren Croxton, Management Biologist, who executed the counts in the IKetchikan area.
Information on the hunter harvest of mountain goats was I obtained by personal ccntact with hunters and guides and incidental to a deer hunter survey. The hunter survey was conducted in all the major towns and villages of Southeast I Alaska through which S94 hunters were contacted and questioned relative to their hunting success. I FINDINGS:
Distribution: The general distribution of mountain s,oats I in Southeast Alaska is quite well known and includes all of the coastal range as well as portions of Baranof Island. Population densities, however, have not as yet been determined el for large areas. Each year ccunts are being expanded to include areas not previously covered. I
Goats are most abundant in the lower mountain ranges at elevations ranging from 2~0C to 3500 feet. Alpine meadows supplying excellent summer range are preserit within this zone I while above 3500 feet much bare rock and little vesetation is found. The largest numbers of soats normally occur in the ranges adjacent to salt water. Population densities de I crease as one goes inland along the major river systems.
IThe mountain goat population on Baranof IsJand is confined primarily to the western drainages between Necker Bay on the south and Mount Rosenberg on the north. The present population stems from a transplant made by the U. S. Bio I logical Survey in 1923 when 18 goats were taken from Tracy Arm on the mainland and released at Blue Lake near Sitka. IThe eastern drainages of Baranof Island are primarily barren, rugged slopes providing poor summer range in contrast to the lusher vegetation found in the western drainages.
••I
- 8 I
•• I
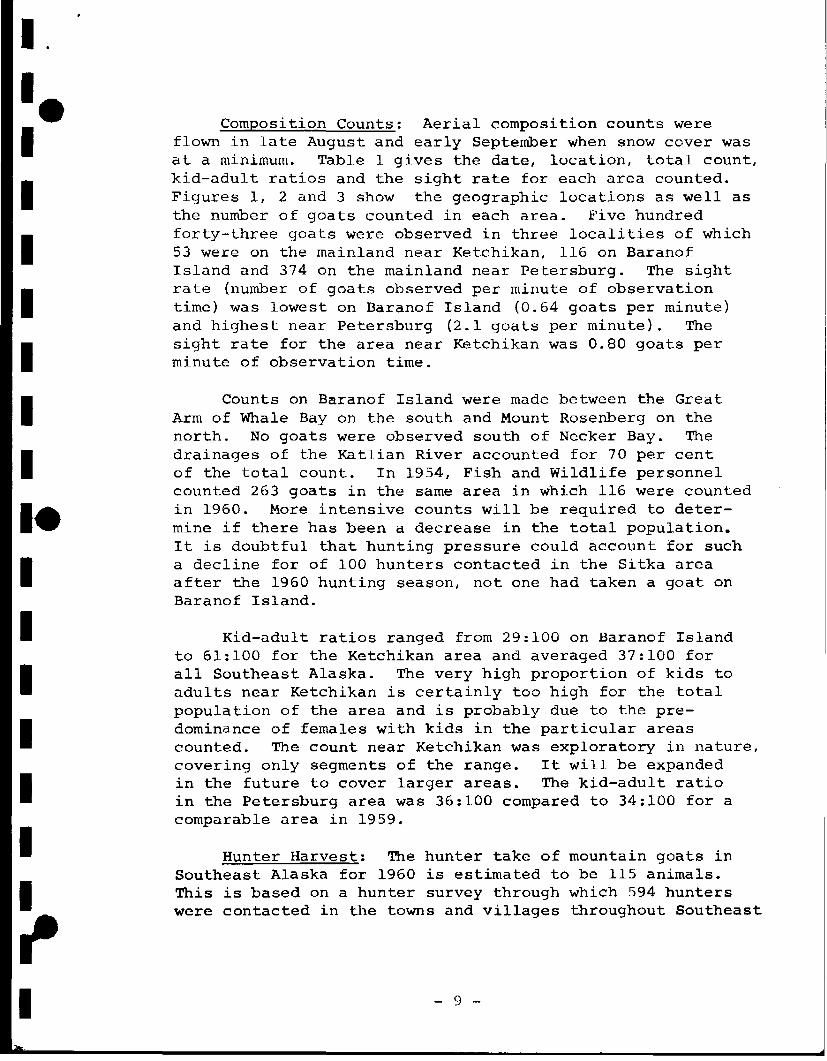
Composition Counts: Aerial composition counts were
I flown in late August and early September when snow cover was at a minimum. Table l gives the date, location, total count, kid-adult ratios and the sight rate for each area counted.
I Figures l, 2 and 3 show the geographic locations as well as the number of goats counted in each area. Five hundred forty-three goats were observed in three localities of which
I 53 were on the mainland near Ketchikan, 116 on Baranof Island and 374 on the mainland near Petersburg. The sight rate (number of goats observed per minute of observation
I time) was lowest on Baranof Island (0.64 goats per minute)
I and highest near Petersburg (2.1 goats per minute). The sight rate for the area near Ketchikan was 0.80 goats per minute of observation time.
I Counts on Baranof Island were made between the Great Arm of Whale Bay on the south and Mount Rosenberg on the north. No goats were observed south of Necker Bay. The
I drainages of the Katlian River accounted for 70 per cent
le of the total count. In 1954, Fish and Wildlife personnel counted 263 goats in the same area in which 116 were counted in 1960. More intensive counts will be required to deter
I mine if there has been a decrease in the total population. It is doubtful that hunting pressure could account for such a decline for of 100 hunters contacted in the Sitka area after the 1960 hunting season, not one had taken a goat on Baranof Island.
I I Kid-adult ratios ranged from 29:100 on Baranof Island
to 61:100 for the Ketchikan area and averaged 37:100 for all Southeast Alaska. The very high proportion of kids to
I adults near Ketchikan is certainly too high for the total population of the area and is probably due to the predominance of females with kids in the particular areas
I counted. The count near Ketchikan was exploratory in nature, covering only segments of the range. It will be expanded in the future to cover larger areas. The kid-adult ratio in the Petersburg area was 36:100 compared to 34:100 for a comparable area in 1959.
I I Hunter Harvest: The hunter take of mountain goats in
Southeast Alaska for 1960 is estimated to be 115 animals. This is based on a hunter survey through which 594 hunters were contacted in the towns and villages throughout Southeast
{' I - 9
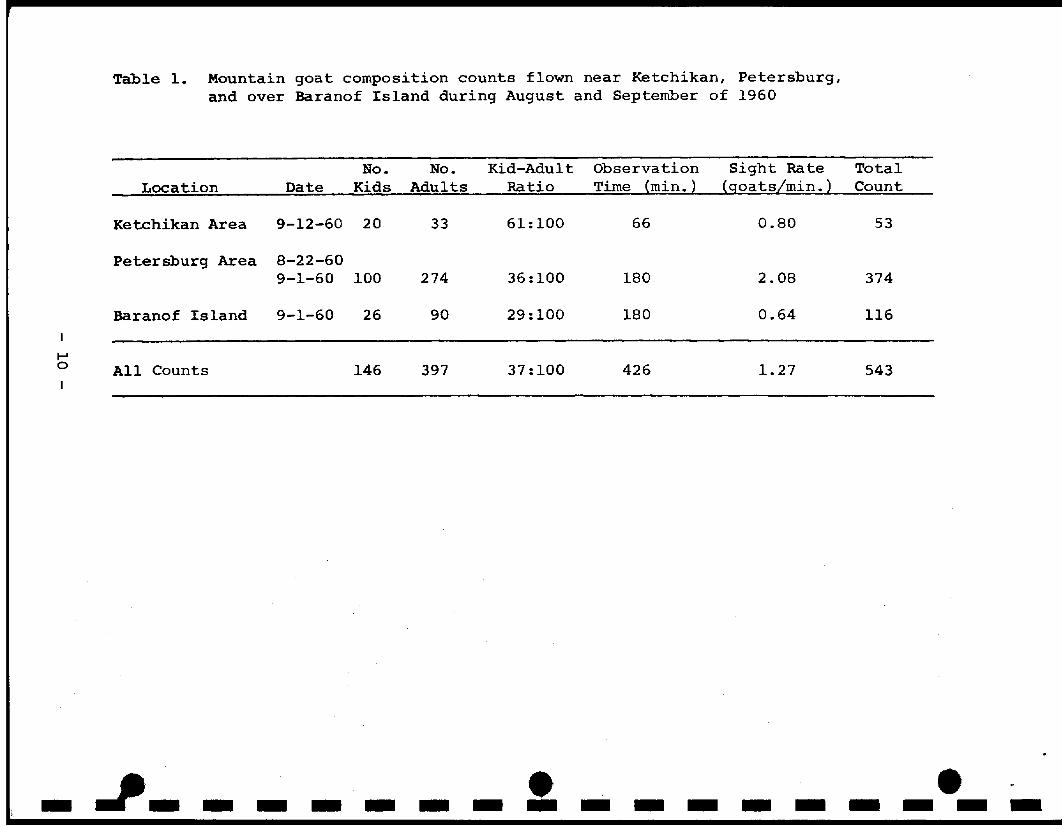
Table 1. Mountain goat composition counts flown near Ketchikan, Petersburg, and over Baranof Island during August and September of 1960
No. No. Kid-Adult Observation Sight Rate Total Location Date Kids Adults Ratio Time (min. ) (qoats/min. ) Count
Ketchikan Area 9-12-60 20 33 61:100 66 0.80 53
Petersburg Area 8-22-60 9-1-60 100 274 36:100 180 2.08 374
Baranof Island 9-1-60 26 90 29:100 180 0.64 116
I-' 0 All Counts 146 397 37:100 426 1.27 543
_,_ e- - - - - - - -• - - - - - - - -

------·-· -···--·
I .
I•• I I I I I I le I I I I I I I
••
0 z <X ..... en
0 0 UJ (!)
(!)
ct ..... ...J
> LU er
Figure 1. Geographic location of mountain goat composition counts flown near Ketchikan in 1960 showing the number of adults and kids counted in each area .
- 11 I
.I
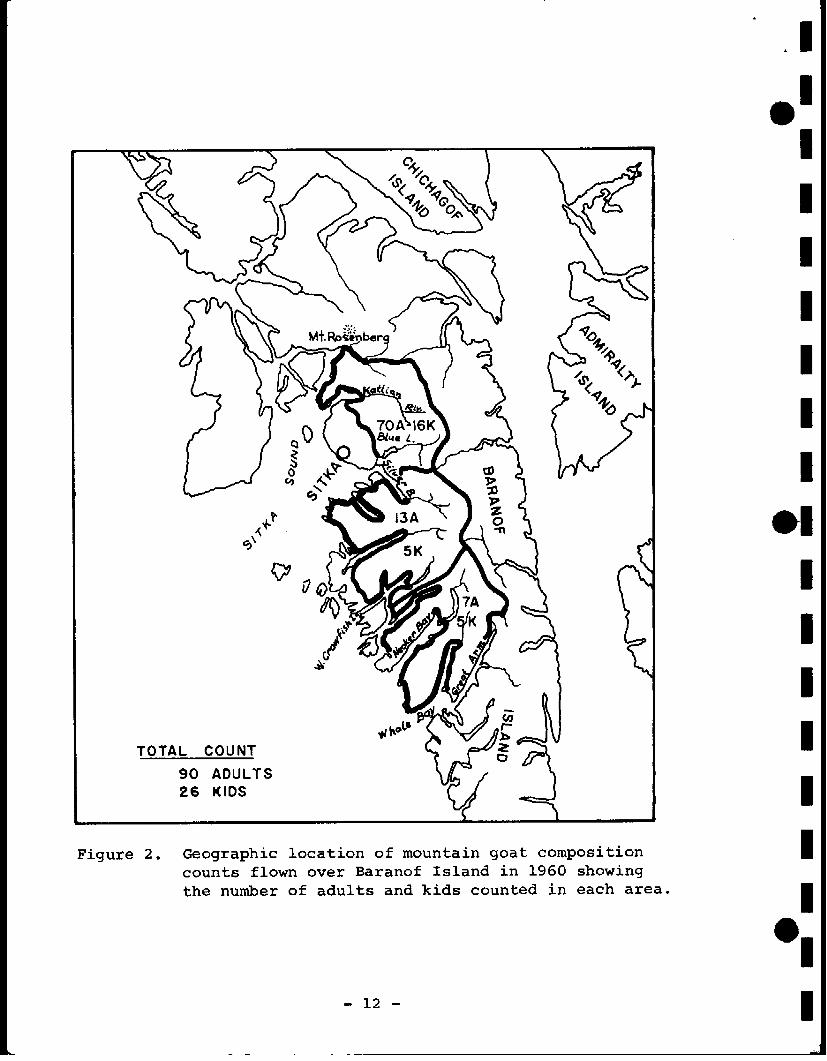
TOTAL COUNT
90 ADULTS 26 KIDS
Figure 2. Geographic location of mountain goat composition counts flown over Baranof Island in 1960 showing the number of adults and kids counted in each area.
- 12
••I I I I I I I
el I I I I I I
••I
I

I .
I•• I I I I I I le I I I I I I I
•• I
TOTAL COUNT
274 ADULTS
I 00 KIDS
~-,· --"" -
Figure 3. Geographic location of mountain goat composition counts flown near Petersburg in 1960 showing the number of adults and kids counted in each area .
- 13

.I
Alaska. The hunter kill appears to be predominantly males, ••Ithe ratio being approximately 70 per cent males to 30 per
cent females. The higher proportion of males in the kill is probably due to their larger size making them more desirable as a trophy. The present kill of mountain goats I has little impact on the population as a whole.
RECOMMENDATIONS: I Aerial composition counts should be continued and ex
panded to other areas for which population density values I are unknown.
More intensive aerial counts should be made on Baranof I Island to determine if the mountain goat population is declining. I
The collection of hunter harvest information should be continued to determine the total kill as well as sex and age composition of the kill. I
el SUBMITTED BY: APPROVED BY:
I IHarry Merriam David R. Klein
Game Biologist P-R Coordinator June 30, 1960 I
I James W. Brooks, Director IDivision of Game
I
••I
- 14 I
••
I. Volume 2 Report No. E-3
Part II
ANNUAL REPORT OF PROGRESS
I•• INVESTIGATIONS PROJECT COMPLETION OF 1960-1961 SEGMENT
I State: Alaska
I Project No: W-6-R-2 Name: Alaska Wildlife Inyestigations
I Work Plan: E Sheep and Goat Investigations
I Job No: 3-Part II Title: Goat Distribution
I and Population Status, Prince William Sound
I PERIOD COVERED: July 1, 1960 to June 30, 1961
ABSTRACT:
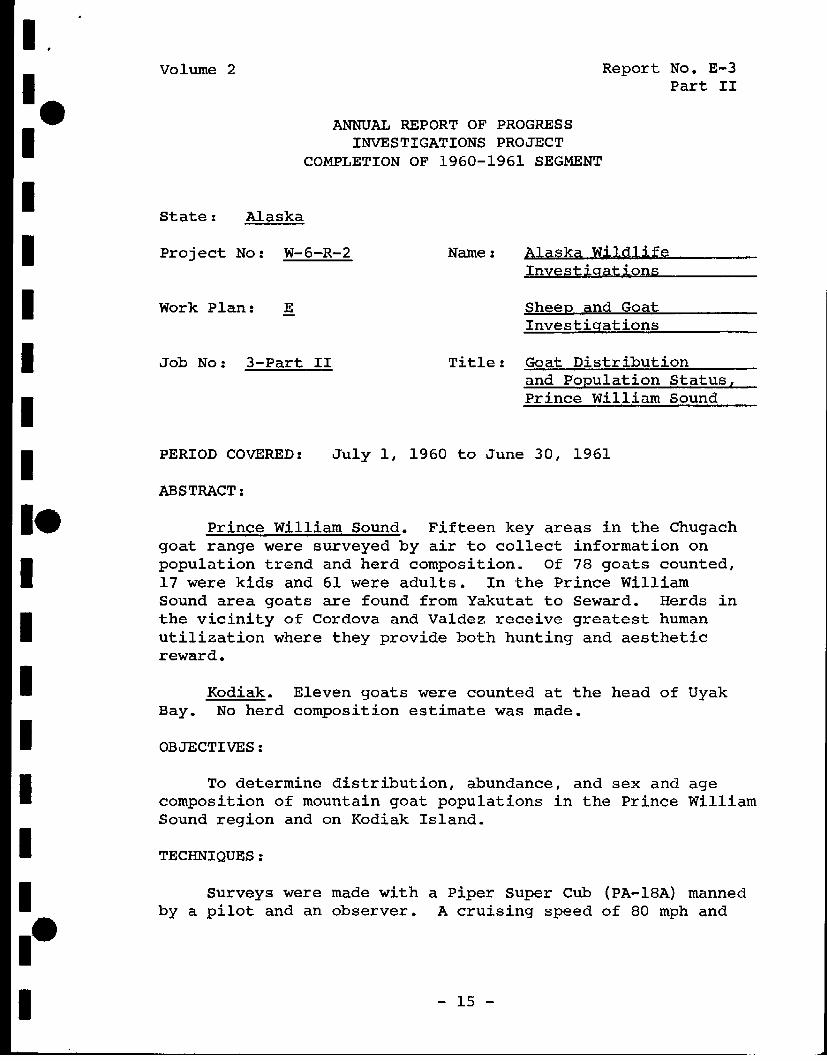
I le Prince William Sound. Fifteen key areas in the Chugach
goat range were surveyed by air to collect information on population trend and herd composition. Of 78 goats counted, 17 were kids and 61 were adults. In the Prince William Sound area goats are found from Yakutat to Seward. Herds in
I the vicinity of Cordova and Valdez receive greatest human utilization where they provide both hunting and aesthetic reward.
I Kodiak. Eleven goats were counted at the head of Uyak Bay. No herd composition estimate was made.
I OBJECTIVES :
I To determine distribution, abundance, and sex and age composition of mountain goat populations in the Prince William Sound region and on Kodiak Island.
I TECHNIQUES:
I Surveys were made with a Piper Super Cub (PA-18A} manned by a pilot and an observer. A cruising speed of 80 mph and
I - 15

--·---- ·-·--·····--------------
.I
an altitude of 500 feet above terrain were maintained until ••Igoats were sighted. At this time, air speed and altitude were altered as indicated by the situation until the observer determined numbers and age composition. I
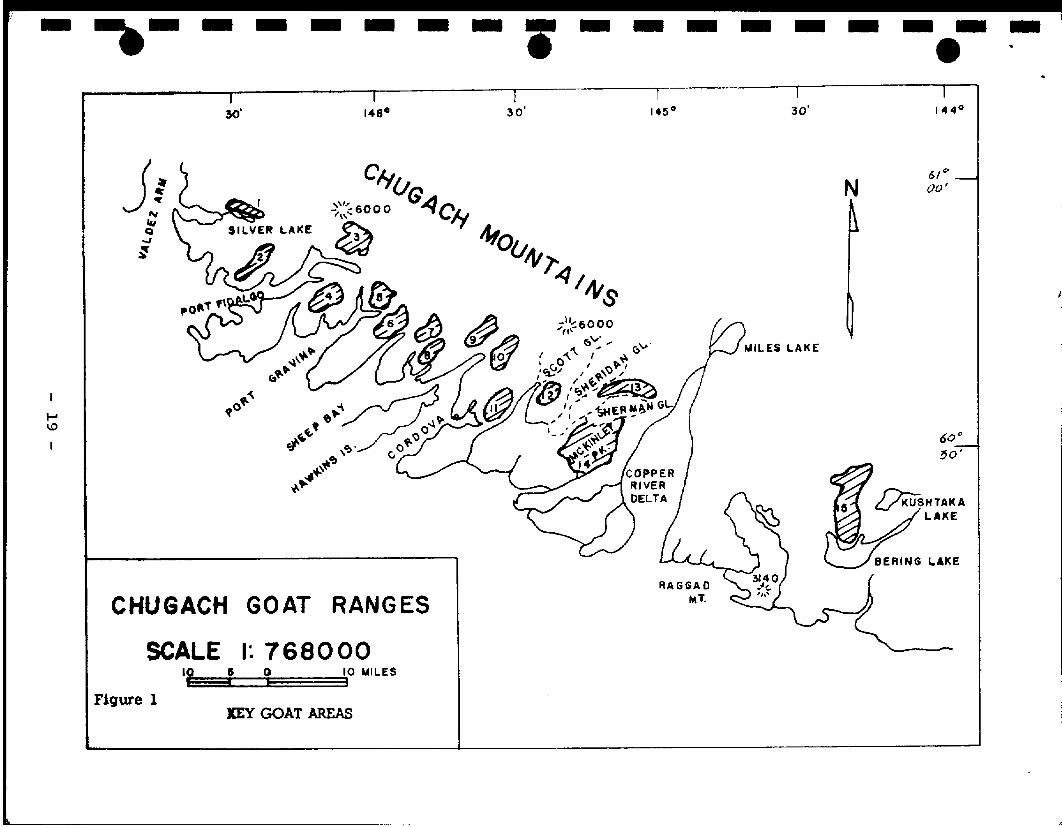
The goat population in Prince William Sound is too extensive to survey in its entirety. Consequently, 15 key areas were selected within the hunter-accessible goat ranges I from Bering River to Valdez Arm along the western slope of the Chugach Mountains (Figure 1) . The selection of these key areas was based on the verification of goat herd reports, I accessibility of the herds to hunters, herd size and relationship to other herds in the same range. It is believed that annual surveys conducted on these key areas will reflect con I ditions and trends of Prince William Sound area goat populations.
IIn order to take full advantage of weather and time of year, this survey was conducted in September and October, by which time the leaf drop had occurred on most plant species Iand kids were large enough to make their concealment by adults difficult. Timing of this late survey is critical, because if delayed until too late in the fall a persistent elsnowfall can make the goats difficult to spot. All surveys were made on clear, sunny days.
IFINDINGS:
The key areas of the harvestable mountain goat population Ibetween Bering River and Valdez Arm were surveyed f:rom September 17 to October 2, 1960, to obtain population trend and herd composition data on the goats of Prince William Sound. IThe results of this survey can be seen in Table 1.
Table 1. Aerial goat composition surveys on the Chugach goat I ranges of Prince William Sound for 1960.
No. % Kids to % Kids of No. Total Obs. Time Goats IKids Adults Total Adults Counted (Hours) Seen/Hr.
17 28 22 61 78 2.25 27 I Eleven goats were counted by Will Troyer of the U. s.
Fish and Wildlife Service at the head of Uyak Bay. No ••I
- 16 I

I .
I•• estimate of herd composition could be made. In view of the
introduction of 7 males and 11 females in 1952 and 1953 possible success of the transplant is indicated.
I I Effects of Hunting. Prior to 1936 Prince William Sound
mountain goats were harvested along the Copper River and
I Northwestern Railroad from Cordova to Mile 45 by members of the 300-man Copper River Railroad organization. This harvest
I was never considered to be large, and the goat population was apparently not greatly affected. The railroad was discontinued in 1936: as a consequence, the goat harvest on the
I mainland dropped sharply. Not until the railroad bed was converted to a highway in 1945 did the kill return to earlier proportions. This road provides access to the mainland goat herds as far as Mile 27.
I The principal hunting pressure between 1936 and 1945 resulted from the activities of boat hunters and was restricted to herds near the beach. This was a moderately heavy harvest in some cases. Port Wells herds were reportedly reduced by heavy military hunting during World War II.
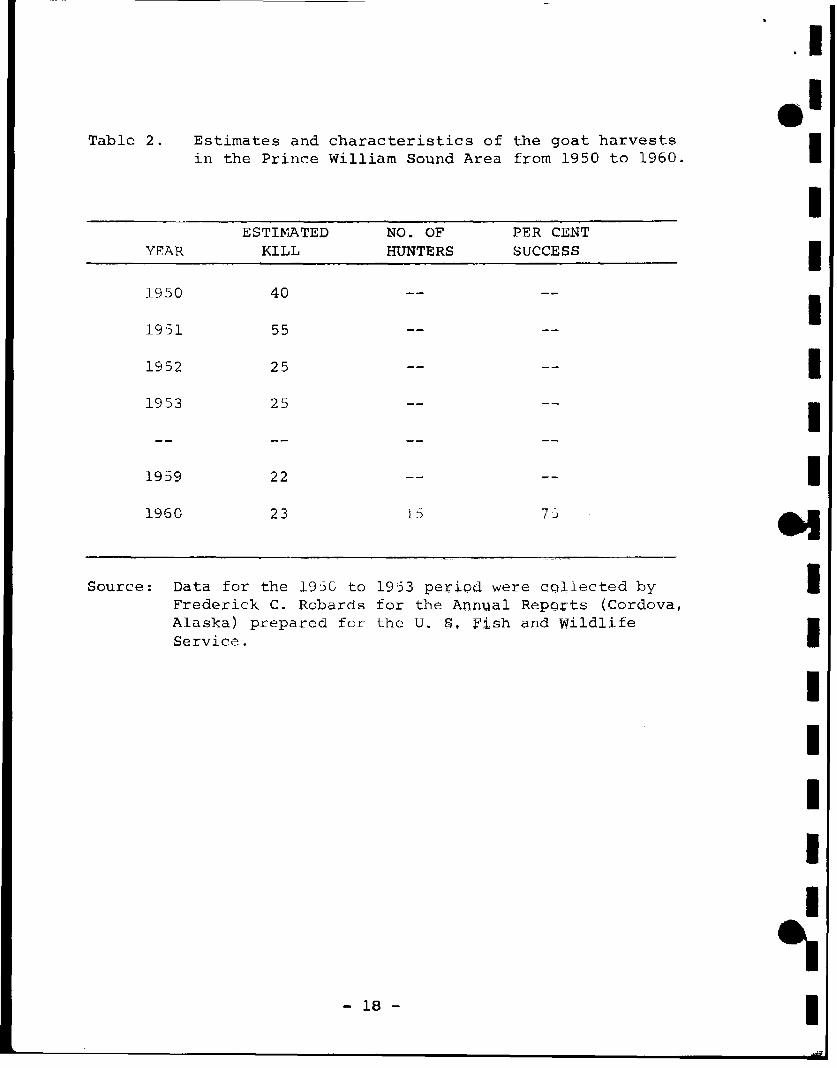
I The first kill estimate of the Prince William Sound goats was made in 1950 by Frederick C. Robards of the U. s. Fish and Wildlife Service. By this time military hunting had
I declined and the civilian hunter became more effective through the use of light aircraft. The kill, following the military hunting peak, has been probably half of that which occurred
I during that period. Similar estimates have been made intermittently for the past ten years (Table 2).
I Several conclusions emerge from a study of the relationship between hunting and the present goat population in this
I area.
1. Hunter success is high. Although few people hunt goats those who do, find little difficulty in
I getting at least one animal (the limit is two).
I 2. This success is in part due to the light hunting
pressure. The harvest of 25 goats a year is considered light in view of the indicated large .. population.
I - 17
.I
••ITable 2. Estimates and characteristics of the goat harvests
in the Prince William Sound Area from 1950 to 1960.
I YEAR
1950
19'51
1952
1953
1959
1960
ESTI~JATED NO. OF PER CENT KILL HUNTERS SUCCESS I
40
55 I
25 I 25
I 22 I 23 15 9'I
Source: Data for the l9SG to 19S3 period were collected by I Frederick C. Robards for the Annual Reports (Cordova, Alaska) prepared for the U. S, Fish and Wildlife Service. I
I I I I I ..
- 18 I
- - - - - - - - -- -.- - - - - - e
CHUGACH GOAT RANGES
SCALE 1: 768000 'Pe=a:f==o1:,=== 3110 w1LEs
Fiqure l KEY GOAT AREAS

.I
••I3. The trend extrapolated from information for the past
ten years does not indicate any immediate increase in hunting effort (Table 2).
Characteristics of Distribution. In the South Central I Coastal Regions of Alaska, the mountain goats found from Yakutat to Seward are present in local concentrations. Their present and potential recreational value depends upon the I degree of their availability for hunting and aesthetic appreciation. I
The herds in the Brabazon Range bordering the Yakutat lowlands presently afford limited hunting. Although there Iare no large concentrations in this area, the animals are accessible by light plane. The potential value of these goats is great. They will be hunted as an added feature to Imoose and bear hunts in the near future.
Northward to Icy Bay, the goats become less accessible. IIt is possible these herds will be hunted in the future as the use of private aircraft increases. However, at present few people are aware of their existence.
From Icy Bay to Bering River, goats are found intermittently along the coast. These herds, although not wholly Iinaccessible, are rarely hunted because they are quite distant from human population centers. It is possible that as hunting pressure increases on goat populations both north Iand south of this area, these animals will attract some interest.
IThe goats found between Bering River and Valdez should
be considered collectively, because like the Brabazon herds around Yakutat, they receive diffuse hunting effort. Hunters I from Valdez and Cordova harvest these animals by boat and airplane. A relatively small amount of goat range borders the Copper River Highwayi however, it is accessible by car. I For this reason, and because of the availability of boat transportation much benefit is derived from the goats near Cordova and Valdez through their aesthetic value to tourists I and recreational value to local hunters.
Westward from Valdez, along the north shore of Prince I William Sound, goat concentrations can be found at Sawmill ..
- 20 I
•• I .
I Bay and Columbia Glacier. The Sawmill Bay herds draw several parties of hunters each year; however, these and the Columbia Glacier herds are also an attraction to tourists who take
I advantage of excursion boats out of Valdez.
The Port Wells herds in the northwest corner of the Sound
I provided the military from the Port of Whittier with excellent sport and recreation from 1942 until they were reportedly reduced in 1946. There are still large herds in the area, but
I according to u. S. Fish and Wildlife Service personnel they can no longer be found close to the beach. With the closing of the Port of Whittier in December, 1960, the goats have
I been released from all human pressure except for a few fishermen.
I Goats have been reported in sizable numbers at Port
I Nellie Juan and Eshamy Bay since 1932 (Nelson, George B., 1932. Annual Wildlife Report for Warden District No. 4, unpublished. Alaska Game Commission). The only contact these animals have had with man has been through limited hunting
19 by fishermen.
1 Goats can be found from Cape Puget to Resurrection Bay.
Here, as in the case of the Port Wells herd, goats were reportedly harvested in considerable numbers during World War II by the military. Since 1946, however, they have only
I been taken in small numbers by civilian hunters going ashore
I at Puget Bay and Day Harbor. Except for these two places, the remaining ranges in the area are not considered accessible from the hunting standpoint. Nevertheless, some of these goats are of aesthetic value to people on passing boats.
I RECOMMENDATIONS:
I 1. The key-area system established to provide population
trend information should be continued. Counts should be made in August and early September prior to the accumulation of snow in alpine areas.
I I 2. Information concerning distribution and numbers
should be recorded to provide some estimate of the extent and trend of the goat populations .
.. I - 21
.I SUBMITTED BY:
Arthur Sheets Game Biologist
APPROVED BY: ••I IDavid R. Klein
P-R Coordinator
I I
James W. Brooks, Director Division of Game I
I I
"' I I I I I I I ..
- 22 I