Shedding Light on Canadians’ Total Wait for · PDF file · 2014-01-10Shedding...
16
Report Card on Wait Times in Canada June 2012 Shedding Light on Canadians’ Total Wait for Care THINKSTOCKPHOTOS.COM
Transcript of Shedding Light on Canadians’ Total Wait for · PDF file · 2014-01-10Shedding...

Report Card on Wait Times in CanadaJune 2012
Shedding Light on Canadians’Total Wait for Care
THIN
KSTO
CKP
HO
TOS.
CO
M

1
Shedding Light on Canadians’ Total Wait for Care
Overview
The Wait Time Alliance (WTA) has issued national reportcards annually since 2007. Initially, our report cards weresolely directed at provincial performance in the five areasidentified in the 2004 Health Accord: cancer (radiation ther-apy); heart (bypass surgery); joint replacement (hip andknee); sight restoration (cataract) and diagnostic imaging (CTand MRI). Since then, the WTA has directed its attentiontoward: (1) broadening the scope to include Canadians’ accessto all areas of care; (2) improving the quality of public report-ing on timely access; (3) highlighting issues that contribute tolengthy wait times; and, (4) identifying best practices toimprove wait times.
The 2012 report card is the WTA’s most comprehensiveeffort to date to shed light on all of these areas. It contains sixsections: 1. Grading performance for the five initial areas using thepan-Canadian government benchmarks and grading awider range of procedures/treatments using WTAbenchmarks: Unlike the past several years, the 2012results show a worsening of performance with regard topatients receiving care within the pan-Canadian bench-marks set by governments. Although some provinces haveshown improvement, the overall results point towardlengthier waits for Canadians. While provinces areincreasing the number of procedures for which they pub-licly report wait times, there remains little reporting formost of the procedures identified as priorities by theWTA. Some reporting exists for procedures in obstetricsand Gynecology and Plastic Surgery, but progress is lack-ing on any provincial reporting for such specialties aschronic pain (anesthesiology), gastroenterology and psy-chiatry.
2. Assessing Canadians’ total wait time to access neces-sary care:What is the real wait that Canadians face toaccess care? Much of the focus to date on wait times in
Canada has been directed toward only the wait periodbetween specialist consultation and start of treatment.But there is also the wait to access a family physician andthe wait for any subsequent referral to see another spe-cialist and any associated tests. This year’s report shedsmore light on the total wait Canadians face in obtainingnecessary medical care.
3. Identifying variation in Canadians’ access depending onwhere they live: Even in those instances where a provincedoes well, there remain significant variations in waittimes among its regions. These differences are strikingand clearly illustrate the need to improve timely accessacross regions to benefit all citizens.
4. Grading provincial wait-time websites: The quality ofprovincial wait-time websites continues to improve. Allprovinces now have their own websites that report onwait times for at least the initial five procedures for whichpan-Canadian benchmarks were established. While thereis still room for improvement, the WTA believes the2012 wait-time website grades represent a positive stepforward.
5. Shedding more light on the impact of alternate levels ofcare (ALC) on wait times: Last year, the WTA reportedthat the most important action to improve timely accessto specialty care for Canadians is to address the ALC issue.This year’s report identifies a significant contributor toALC stays and offers strategies to alleviate the problem.
6. Highlighting efforts by the WTA and governments toimprove timely access to care: Health care providers,including the members of the WTA, as well as govern-ments are implementing best practices to improve timelyaccess to care for patients. We highlight some of theseactions with a call to improve the sharing of best practicesamong provinces and regions.

1. Grading Canadians’ timely access to care
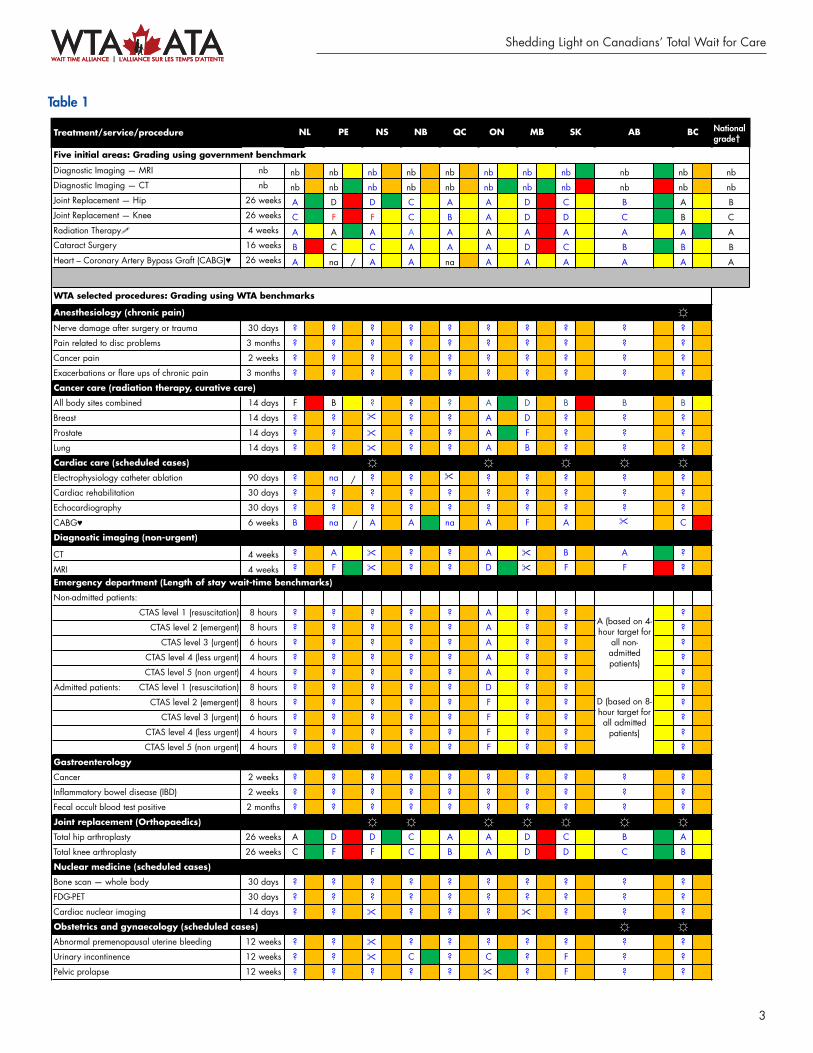
For the first time, the WTA has expanded its traditionalTable 1 to grade timely access for both procedures for whichpan-Canadian government benchmarks exist (i.e., hip andknee replacement, cataract surgery, radiation therapy, heartbypass surgery) as well as for a range of other procedureschosen by WTA member specialties using WTA bench-marks.
The letter grades pertain to how well provinces aredoing in terms of the percentage of patients receiving treat-ment within the benchmark (e.g., A=80% or more patientstreated within the benchmark). The colour grades indicatewhether the percentage of patients treated within thebenchmark has increased from spring 2011 to 2012(green), has significantly decreased (red) or stayed aboutthe same (yellow).
A. Grading performance using the governments’ pan-Canadian benchmarks
For several years, the WTA report cards have reported slightprogress in improving Canadians’ timely access to a narrowrange of procedures: cancer (radiation therapy); heart (bypasssurgery); joint replacement (hip and knee); sight restoration(cataract) and diagnostic imaging (CT and MRI). However,in 2012, this claim of “slight progress” can no longer be made(see top portion of Table 1): • There is no improvement in the overall national grades
between 2011 and 2012, and in some provinces gradeshave fallen. For example, there are two F grades using thegovernment benchmarks in the 2012 report card, com-pared to one in 2011.
• In several instances, the percentage of patients treatedwithin the benchmark has decreased in 2012 comparedto 2011. This can be seen with the increase in the num-ber of red squares (i.e., 9 in 2012 compared to only 2 in2011). In addition, the 2012 report card features only13 instances of improvement (i.e., a green square or 5%or greater increase in patients treated within the bench-mark) compared to 24 in 2011. The pursuit of more timely access to care is a journey
that will see its share of setbacks. However, the WTA is con-cerned with the backsliding seen in most provinces. This
year’s assessment clearly demonstrates the need to continueefforts to improve Canadians’ access to timely care.
B. Grading a wider range of procedures/treatmentsusing WTA benchmarks
Since 2007, the WTA has called on governments to endorsenational wait-time benchmarks/targets for health servicesbeyond the initial five areas. In fact, the 2004 HealthAccord stated governments were to “start” with the initialfive areas – not to begin and end with them. Recognizingthe importance of reducing waits for all patients, the WTA’s13 national specialty society members have established wait-time benchmarks for 925 treatments, procedures ordiagnoses.*
Table 1 also lists over 45 medical treatments/conditionsthat have either the highest volumes, the greatest potentialfor improvement or the greatest return-on-investment,based on WTA member input. Waits were graded based oninformation publicly available on provincial websites. Aquestion mark (?) is assigned if the province does not reportwait times for the particular treatment/service. An eye-glasses symbol ($) indicates that the province tracks waittimes for this specialty but not for the specific procedure ina manner that would permit it to be graded by WTA mea-sures. This includes grading coronary artery bypasssurgery (CABG), radiation therapy and diagnostic imag-ing using WTA benchmarks which are significantlydifferent than the pan-Canadian government benchmarks.For example, while all provinces providing CABGreceived a grade of A using the government benchmark(26 weeks), the grades were lower when compared to theWTA benchmark of six weeks.
There remains little provincial reporting for most ofthe procedures listed in this section of Table 1. Somereporting exists for procedures in obstetrics and gynecologyand plastic surgery but there remains a lack of progress onany provincial reporting for such specialties as chronic pain(anesthesiology), gastroenterology, emergency care (onlyOntario and Alberta report on emergency department waittimes) and psychiatry.
The lack of publicly reported wait-time data for mentalhealth services was identified in the Mental Health Commissionof Canada’s recently released Mental Health Strategy for
2
A Report Card on Wait Times in Canada 2012
*Wait Time Alliance. Wait times benchmarks. Available: www.waittimealliance.ca/wait_times.htm (accessed 2012 June 4).
3
Shedding Light on Canadians’ Total Wait for Care
Treatment/service/procedure National grade†
Five initial areas: Grading using government benchmarks
Diagnostic Imaging — MRI nb nb nb nb nb nb nb nb nb nb nb nbDiagnostic Imaging — CT nb nb nb nb nb nb nb nb nb nb nb nbJoint Replacement — Hip 26 weeks A D D C A A D C B A BJoint Replacement — Knee 26 weeks C F F C B A D D C B CRadiation Therapy! 4 weeks A A A A A A A A A A ACataract Surgery 16 weeks B C C A A A D C B B BHeart – Coronary Artery Bypass Graft (CABG)! 26 weeks A na / A A na A A A A A A
Anesthesiology (chronic pain) !Nerve damage after surgery or trauma 30 days ? ? ? ? ? ? ? ? ? ?
Pain related to disc problems 3 months ? ? ? ? ? ? ? ? ? ?
Cancer pain 2 weeks ? ? ? ? ? ? ? ? ? ?
Exacerbations or flare ups of chronic pain 3 months ? ? ? ? ? ? ? ? ? ?
All body sites combined 14 days F B ? ? ? A D B B B
Breast 14 days ? ? !" ? ? A D ? ? ?
Prostate 14 days ? ? !" ? ? A F ? ? ?
Lung 14 days ? ? !" ? ? A B ? ? ?
Cardiac care (scheduled cases) ! ! ! ! !Electrophysiology catheter ablation 90 days ? na / ? ? !" ? ? ? ? ?
Cardiac rehabilitation 30 days ? ? ? ? ? ? ? ? ? ?
Echocardiography 30 days ? ? ? ? ? ? ? ? ? ?
CABG! 6 weeks B na / A A na A F A !!" C
Diagnostic imaging (non-urgent)
CT 4 weeks ? A " ? ? A " B A ?
MRI 4 weeks ? F " ? ? D " F F ?
Emergency department (Length of stay wait-time benchmarks)
Non-admitted patients:
CTAS level 1 (resuscitation) 8 hours ? ? ? ? ? A ? ? ?
CTAS level 2 (emergent) 8 hours ? ? ? ? ? A ? ? ?
CTAS level 3 (urgent) 6 hours ? ? ? ? ? A ? ? ?
CTAS level 4 (less urgent) 4 hours ? ? ? ? ? A ? ? ?
CTAS level 5 (non urgent) 4 hours ? ? ? ? ? A ? ? ?
Admitted patients: CTAS level 1 (resuscitation) 8 hours ? ? ? ? ? D ? ? ?
CTAS level 2 (emergent) 8 hours ? ? ? ? ? F ? ? ?
CTAS level 3 (urgent) 6 hours ? ? ? ? ? F ? ? ?
CTAS level 4 (less urgent) 4 hours ? ? ? ? ? F ? ? ?
CTAS level 5 (non urgent) 4 hours ? ? ? ? ? F ? ? ?
Gastroenterology
Cancer 2 weeks ? ? ? ? ? ? ? ? ? ?
Inflammatory bowel disease (IBD) 2 weeks ? ? ? ? ? ? ? ? ? ?
Fecal occult blood test positive 2 months ? ? ? ? ? ? ? ? ? ?
Joint replacement (Orthopaedics) ! ! ! ! ! ! !Total hip arthroplasty 26 weeks A D D C A A D C B A
Total knee arthroplasty 26 weeks C F F C B A D D C B
Nuclear medicine (scheduled cases)
Bone scan — whole body 30 days ? ? ? ? ? ? ? ? ? ?
FDG-PET 30 days ? ? ? ? ? ? ? ? ? ?
Cardiac nuclear imaging 14 days ? ? " ? ? ? " ? ? ? Obstetrics and gynaecology (scheduled cases) ! !Abnormal premenopausal uterine bleeding 12 weeks ? ? " ? ? ? ? ? ? ?
Urinary incontinence 12 weeks ? ? " C ? C ? F ? ?
Pelvic prolapse 12 weeks ? ? ? ? ? " ? F ? ?
D (based on 8-hour target for all admitted
patients)
MB SK AB BC
A (based on 4-hour target for
all non-admitted patients)
ON
Cancer care (radiation therapy, curative care)
WTA selected procedures: Grading using WTA benchmarks
NL PE NS NB QC
Table 1

4
A Report Card on Wait Times in Canada 2012
Treatment/service/procedure
Plastic surgery
Breast cancer reconstruction 4 weeks ? ? ? ? ? F ? " ? F
Carpal tunnel release 2 months ? ? " B ? ? ? C D ?
Skin cancer treatment 4 months ? ? " ? ? ? ? " ? ?
Pediatric surgery*
Advanced Dental Caries: carious lesions/ pain 90 days ? ? " ? ? " ? ? ? ?
Cleft Lip/Palate 21 days ? ? " ? ? " ? ? ? ?
Strabismus: 2–6 years old 90 days ? ? " ? ? " ? ? ? ?
Psychiatry (scheduled)
Early psychosis 2 weeks ? ? ? ? ? ? ? ? ? ?
Postpartum severe mood disorders 4 weeks ? ? ? ? ? ? ? ? ? ?
Acute/urgent mental health concerns 1 week ? ? ? ? ? ? ? ? ? ?
Sight restoration ! ! ! ! ! !Cataract surgery 16 weeks B C C A A A D C B B
This table identifies the change in wait times using the most recent publicly available data for each of the five priorities by province as follows:
ON MB SK AB BCNL PE NS NB QC
Colour Grading Methodology
" decrease in wait times over the previous year
# increase in wait times over the previous year
? insufficient data to make determination
$ no significant change (i.e., less than 5% increase or less than 10% decrease) over the previous year
? Symbol is assigned if the province does not report wait times for the treatment.
* These benchmarks enable pediatric institutions to compare with peers and share learning.% The province reports on procedures for this specialty.
! The category of bypass surgery (CABG) above represents only a small part of the full continuum of cardiac care to patients. Please refer to the Canadian Cardiovascular Society website at www.ccs.ca for a full range of benchmarks for cardiovascular services and procedures. All of these benchmarks need to be adopted to meaningfully address wait times.! Cancer radiotherapy. Wait times currently reflect only waits for external beam radiotherapy, while waits for brachytherapy (implanted radiation treatment, e.g., for prostate and cervical cancers) go unreported.
" The province reports wait times for this specialty but not for the specific procedure in a manner that would permit it to be graded by WTA measures.
D: 50–59% of population treated within benchmark F: Less than 50% of population treated within benchmark
na: no data are provided or data do not lend themselves to estimates of performance. The diagonal line " ⁄ " in white squares indicates that the service is not provided i.e., CABGs in PEI.
nb (no benchmarks) — pan-Canadian benchmarks for diagnostic imaging have not yet been established by governments. Where provinces have reported wait times a colour grade is assigned to note progress made over the last 12 months.† National grades are based on a weighted average of provincial letter grades.
Methodology
Based on provincial websites from April–May 2012:A: 80–100% of population treated within benchmarkB: 70–79% of population treated within benchmarkC: 60–69% of population treated within benchmark

Shedding Light on Canadians’ Total Wait for Care
* In calendar year 2011, nine participating pediatric academic health sciences centres (PAHSC) and one community hospital.† Increase in percentage of cases that waited beyond benchmark may be attributed to the reduced number of participating sites in calendar year 2011;
hospitals were required to fund their participation in the project without external support.
Canada.1 It noted that many community services do not evenkeep waiting lists for mental health services “because it mightgive false hope to people in need that eventually their turn willcome.” The strategy calls for action to improve the collectionand measurement of waits for community-based mental healthservices (e.g., psychotherapy and clinical counselling). It alsocalls for standards/benchmarks to be set for the wide spectrumof community, acute and highly specialized services, similar tothose that exist for some physical illnesses.
There is also a dearth of public reporting on pediatricwait times. However, pediatric wait-time data have been col-lected by the Canadian Pediatric Surgical Wait Times(CPSWT) Project since 2007. According to the CanadianAssociation of Paediatric Surgeons, data collected in 2011from hospitals* across Canada participating in the CPSWTproject demonstrated that 15,406 children (31%) exceededthe recommended wait time for surgery (P-CATS2); a 3%†increase from the year before. As of December 31, 2011, 50%of children (almost 9,000) still waiting for surgery werealready past the recommended benchmark. More details onthis project are available on the WTA website under “LeadingPractices”. Funding is needed for an external organization totake over the collection and reporting of this important data.The CPSWT Project may be in its last year of self-funding.
Those instances where grades can be assigned frequentlyshow low grades. It is the WTA’s hope that in the near future,this table will feature more letter and colour grades than foundin this year’s report. We believe it is important for Canadiansto have timely access to the full range of medical care. Whilesome provinces may have received a low grade or a glassessymbol for some procedures, the WTA views any reportingas a positive development, as opposed to instances wherethere is no reporting on the procedure at all.
2. Assessing Canadians’ total wait time to access care
Most of the attention on improving wait times has beendirected at the wait between the specialist visit and the startof treatment (see Figure 1). In 2004, the College of FamilyPhysicians of Canada (CFPC) stated that: “Wait times shouldbe defined from when patients experience a problem andattempt to seek care through being seen by family physicians,through specialist consultation and specialty interventions,until definitive care is carried out.”3 This approach considersthe patient’s whole experience, not merely a portion of it. Thefirst WTA report concurred with this approach, noting that“the clock starts ticking long before a patient ends up inanother specialist’s office.”4
Decision bypatient tosee family physician
Familyphysician/GPconsultation: Differential diagnosis & referral as needed
Specialist consultation
Decision to treat or refer back to family doctor
Treatment received
Adapted from prototype shared by The College of Family Physicians of Canada and from ICES, Access to Health Services in Ontario, Fig. 1.1
Rehabilitation (if necessary) and follow up with family physician and specialist
Testing
Most wait-time reports measure only this portion
Figure 1: Wait times from the patient’s perspective
5
A Report Card on Wait Times in Canada 2012
Before a patient receives medical treatment, there arethree preliminary stages to the wait-time continuum: 1) find-ing a family physician; 2) being seen by your familyphysician; 3) diagnostic intervention or being seen by a con-sulting specialist. Just over four million Canadians do nothave a family doctor.5 These “orphan” patients often seek carefrom walk-in clinics and emergency rooms.
For those with their own family doctor, there may beproblems obtaining timely care. Timely access is rated bypatients as one of the most important elements of primarycare.6 Yet according to international studies, only 17% of pri-mary care practices in Canada offer patients same- ornext-day appointments and Canada placed fifth out of sevennations with respect to patients being able to access care onnights or weekends.7
One of the most problematic access-to-care points inthe wait-time continuum identified by the Primary CareWait Time Partnership of the CFPC and the CMA(Canadian Medical Association) is the wait experiencedby patients who are referred by their family physician toappointments with other specialists or specialty services.8
There are likely a myriad of reasons for these referralwaits, such as a diminished role for family physicians inhospitals, which may have lessened communicationbetween family physicians and other specialists.9
Improving access to care is the most critical step we cantake to address wait times. Timely access not only empha-sizes patient-centredness, it can “reduce redundancy andduplication of services (e.g., when a patient accepts andkeeps a later appointment but also consults anotherprovider in the interim), improve health outcomes,achieve better patient and provider satisfaction, and leadto a reduction in emergency visits.”10 There is an oppor-tunity for other specialists to become involved with familyphysicians in new approaches to access to care that wouldbenefit patients. These include participation with familyphysicians in Patient’s Medical Home practice models,11
involvement with family doctors in shared care in definedclinical areas, and advanced access booking for consulta-tions similar to the approaches being advocated forappointments with a family physician.
The CFPC’s Patient’s Medical Home seeks to address thewhole wait time experienced by patients for appointmentswith both their family doctors, as well as the waits encoun-tered in the referral-consultation process. With better accessand care centred on the patient, Patient Medical Homes will
help to achieve better health outcomes for each person, prac-tice population and community being served.
Wait times for specialist referrals
Currently, we know little about how long patients wait tobe seen by a consulting specialist. Until recently, very fewprovince-wide efforts were underway to capture this data.Those sources that do exist suggest the wait for a consulta-tion is just as problematic as the wait to receive aprocedure. One international survey of 11 leading industri-alized countries found that Canada ranked 10th in terms ofthe percentage of “sicker adults” being able to see a special-ist within a month (52% in Canada compared to 92% inSwitzerland).12 A 2011 survey of Canadian family physi-cians found that the most difficult specialties to access fortheir patients were: orthopedics; ear, nose and throat; gas-troenterology; psychiatry; and neurology. “Long waittimes” was the most frequently identified reason for theseproblems.13
In April 2012, nearly 200 gastroenterologists participatedin the third national survey of wait times for digestive care.Carried out by the Canadian Association of Gastroenterology(CAG) during the week of April 16, the survey sheds morelight on the issue of wait times for specialist referrals.
Participating physicians were asked to provide wait-timedata on five new patients seen in consultation and fivepatients scheduled for investigation. Having performed simi-lar wait-time assessments in 2005 and 2008, the CAG canplot trends in access to digestive care over a seven-year period.
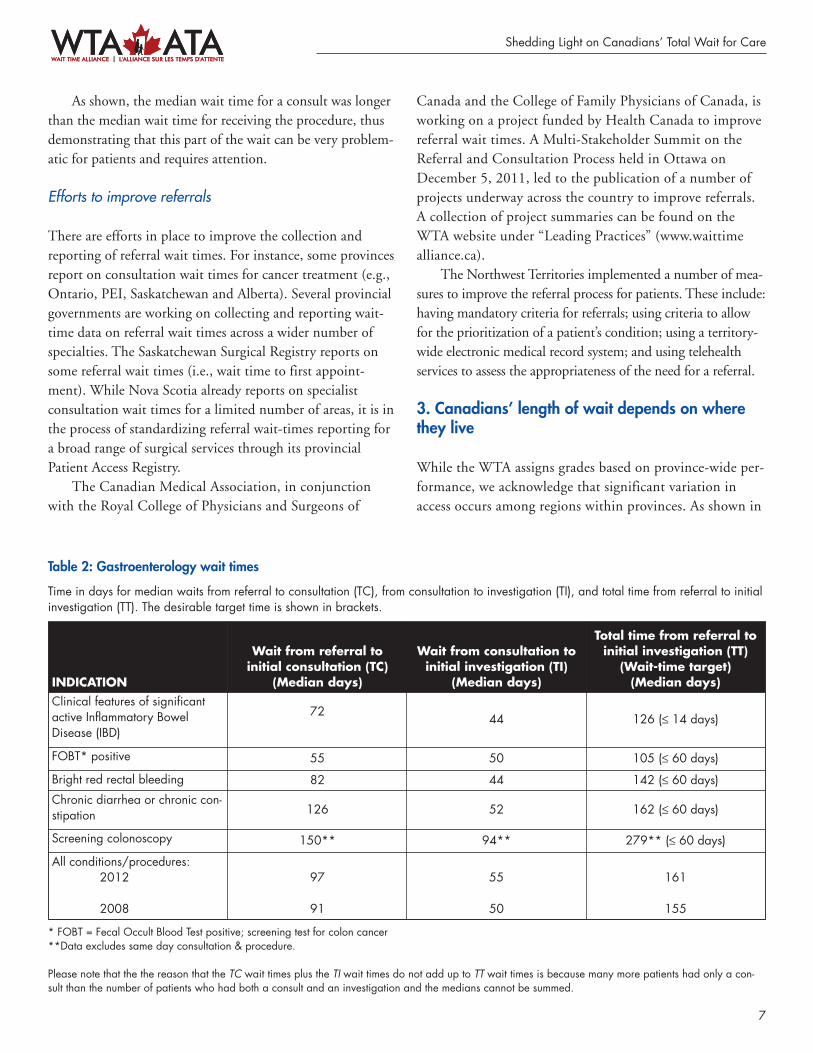
In its recent survey, data were obtained on nearly 2,000patient interactions with the health system. Data for six indi-cations are provided in Table 2.
For example, the total wait time for a patient with a highlikelihood of severe IBD is 126 days, which is 112 dayslonger than the target wait time. This total wait time for careis made up of a median wait for consultation of 72 days andthen another wait for diagnostic testing of 44 days. These arepatients with pain and bloody diarrhea, who are often unableto work or can only do so with difficulty. Analysis of totalwait times indicates that the Canadian total wait time, con-sidering all gastroenterology indications, has progressivelyincreased from 2005–2012 and is now 30 days longer than in2005. These results are of concern and indicate a need to pur-sue strategies that will ensure that patients receive the carethey need in a timely manner.
6
As shown, the median wait time for a consult was longerthan the median wait time for receiving the procedure, thusdemonstrating that this part of the wait can be very problem-atic for patients and requires attention.
Efforts to improve referrals
There are efforts in place to improve the collection andreporting of referral wait times. For instance, some provincesreport on consultation wait times for cancer treatment (e.g.,Ontario, PEI, Saskatchewan and Alberta). Several provincialgovernments are working on collecting and reporting wait-time data on referral wait times across a wider number ofspecialties. The Saskatchewan Surgical Registry reports onsome referral wait times (i.e., wait time to first appoint-ment). While Nova Scotia already reports on specialistconsultation wait times for a limited number of areas, it is inthe process of standardizing referral wait-times reporting fora broad range of surgical services through its provincialPatient Access Registry.
The Canadian Medical Association, in conjunctionwith the Royal College of Physicians and Surgeons of
Canada and the College of Family Physicians of Canada, isworking on a project funded by Health Canada to improvereferral wait times. A Multi-Stakeholder Summit on theReferral and Consultation Process held in Ottawa onDecember 5, 2011, led to the publication of a number ofprojects underway across the country to improve referrals.A collection of project summaries can be found on theWTA website under “Leading Practices” (www.waittimealliance.ca).
The Northwest Territories implemented a number of mea-sures to improve the referral process for patients. These include:having mandatory criteria for referrals; using criteria to allowfor the prioritization of a patient’s condition; using a territory-wide electronic medical record system; and using telehealthservices to assess the appropriateness of the need for a referral.
3. Canadians’ length of wait depends on wherethey live
While the WTA assigns grades based on province-wide per-formance, we acknowledge that significant variation inaccess occurs among regions within provinces. As shown in
Shedding Light on Canadians’ Total Wait for Care
INDICATION
Wait from referral to initial consultation (TC)
(Median days)
Wait from consultation toinitial investigation (TI)
(Median days)
Total time from referral to initial investigation (TT) (Wait-time target)(Median days)
Clinical features of significantactive Inflammatory BowelDisease (IBD)
7244 126 (≤ 14 days)
FOBT* positive 55 50 105 (≤ 60 days)
Bright red rectal bleeding 82 44 142 (≤ 60 days)
Chronic diarrhea or chronic con-stipation 126 52 162 (≤ 60 days)
Screening colonoscopy 150** 94** 279** (≤ 60 days)
All conditions/procedures: 2012
2008
97
91
55
50
161
155
* FOBT = Fecal Occult Blood Test positive; screening test for colon cancer **Data excludes same day consultation & procedure.
Please note that the the reason that the TC wait times plus the TI wait times do not add up to TT wait times is because many more patients had only a con-sult than the number of patients who had both a consult and an investigation and the medians cannot be summed.
7
Table 2: Gastroenterology wait times
Time in days for median waits from referral to consultation (TC), from consultation to investigation (TI), and total time from referral to initialinvestigation (TT). The desirable target time is shown in brackets.

A Report Card on Wait Times in Canada 2012
Figure 2 for wait times for hip replacement and Figure 3for knee replacement, these differences are striking and arepresent in most provinces.* A variety of factors lies behindthese variations (e.g., lack of operating rooms in someregions, lack of nurses and specialists, uneven demand, sub-optimal regional coordination, low rates of wait listpooling). Nevertheless, the causes need to be identified andstrategies must be implemented to reduce them to thegreatest extent possible.
4. Grading provincial wait-time websites
The ideal website should make it easy for patients, familymembers and health care providers to determine waittimes in their area in a timely fashion using reliable data.For the third consecutive year, the WTA rated provincialwait-time websites as of April–May 2012 using the follow-ing five criteria†:
1. Timely: How often are the website’s wait-time data updated?
2. Comprehensive: How many procedures are covered?3. Patient-friendly/Accessibility: How easy it is to find the
wait time by procedure?4. Performance oriented: Is it easy for patients to determine
how long the wait is compared to the benchmark?5. Quality/Reliability: Do reported wait times reflect the
actual wait times, and are they reliable?
2012 Results
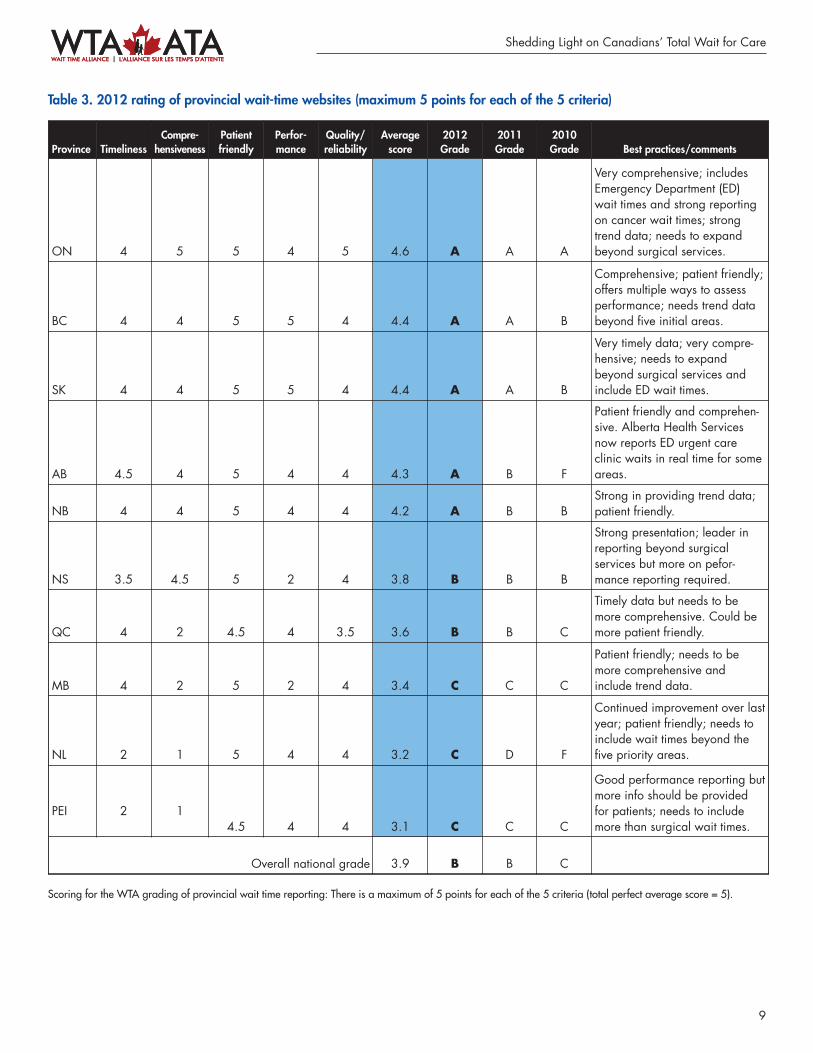
Table 3 provides the results of the 2012 website grading. Weare pleased to report that the quality of provincial wait-timewebsites continues to improve with the average score increas-ing from 3.7 out of 5 in 2011 to 3.9 in 2012 for an overallgrade of B. This year, five provinces received a grade of A,compared to only 1 in 2010. Notwithstanding the improvedgrades, the WTA would like to see more comprehensivereporting by all provinces in such areas as emergency care, can-cer treatment and non-surgical procedures such as psychiatry.
Although it is not included in with the provincial websites,the Government of Northwest Territories has plans to includeinformation related to wait times as part of its public reportingon system performance. This will include the tracking andmonitoring of Alternative Level of Care (ALC) bed days.
This year’s review of provincial wait-time websites includesinput from four patient representative groups as part of an effortto increase the patient voice in the process.†† A summary of theircomments is presented in Table 4 indicating both the strengthsand weaknesses of current provincial wait-time websites.
Figure 2
Figure 3
* Quebec does not report on wait times using 90th percentile measure so it was not included in this chart. However, a review of wait times for hip andknee replacement in that province also shows wide variation between its regions (based on percentage of patients treated within the 6 month bench-mark).
† A full explanation of the website ratings can be found in the WTA’s technical backgrounder for the 2012 report card. †† The four participating patient representative groups included: The Canadian Home Care Association; The Canadian Epilepsy Alliance; The Canadian
Arthritis Patient Alliance and The Asthma Society of Canada.
8
9
Shedding Light on Canadians’ Total Wait for Care
Table 3. 2012 rating of provincial wait-time websites (maximum 5 points for each of the 5 criteria)
Scoring for the WTA grading of provincial wait time reporting: There is a maximum of 5 points for each of the 5 criteria (total perfect average score = 5).
Province TimelinessCompre -hen siveness
Patientfriendly
Perfor -mance
Quality/reliability
Averagescore
2012Grade
2011Grade
2010Grade Best practices/comments
ON 4 5 5 4 5 4.6 A A A
Very comprehensive; includesEmergency Department (ED)wait times and strong reportingon cancer wait times; strongtrend data; needs to expandbeyond surgical services.
BC 4 4 5 5 4 4.4 A A B
Comprehensive; patient friendly;offers multiple ways to assessperformance; needs trend databeyond five initial areas.
SK 4 4 5 5 4 4.4 A A B
Very timely data; very compre-hensive; needs to expandbeyond surgical services andinclude ED wait times.
AB 4.5 4 5 4 4 4.3 A B F
Patient friendly and comprehen-sive. Alberta Health Servicesnow reports ED urgent careclinic waits in real time for someareas.
NB 4 4 5 4 4 4.2 A B BStrong in providing trend data;patient friendly.
NS 3.5 4.5 5 2 4 3.8 B B B
Strong presentation; leader inreporting beyond surgical services but more on pefor-mance reporting required.
QC 4 2 4.5 4 3.5 3.6 B B C
Timely data but needs to bemore comprehensive. Could bemore patient friendly.
MB 4 2 5 2 4 3.4 C C C
Patient friendly; needs to bemore comprehensive andinclude trend data.
NL 2 1 5 4 4 3.2 C D F
Continued improvement over lastyear; patient friendly; needs toinclude wait times beyond thefive priority areas.
PEI 2 14.5 4 4 3.1 C C C
Good performance reporting butmore info should be providedfor patients; needs to includemore than surgical wait times.
Overall national grade 3.9 B B C

A patient representative commenting on the NewBrunswick website summarized well its value:
“I liked this website very much because theinformation was easy to find. I also appreciated see-ing the benchmarks and how they compare to thenational benchmarks. I like this accountability andthe transparency to the public. I also appreciatedfinding documents on how to prepare for the surgeryand that the measurements for wait times were calcu-lated from the day the patient came for their firstvisit.”
The patient representative comments are insightful andsuggest that patient input can be helpful in improving boththe design and utility of provincial wait-time websites.
5. Decreasing the impact of alternate-levels-of-care (ALC) on wait times
The 2011 WTA Report Card outlined the effect of ALC onwait times:• Emergency Department (ED) wait times are affected as
patients in the ED cannot get admitted to hospital bedsoccupied by ALC patients, contributing to ED over-crowding.
• The lack of proper patient flow in the ED can also affectparamedic services and first response wait times.
• The lack of available beds for post-operative patientsleads to many last-minute cancellations of scheduledsurgeries.
• High ALC rates may also be contributing to longer waits
10
A Report Card on Wait Times in Canada 2012
Identified strengths Identified weaknesses
The use of patient-friendly concepts by some websites such as:• Having a great layout (Nova Scotia and BC frequently cited).• Easy to select procedures such as the use of a human body
diagram (e.g., BC, Alberta).• Simple to navigate (Manitoba, New Brunswick and
Newfoundland and Labrador frequently cited).• Flow diagrams that show the care pathways and the waits that
are measured (e.g., PEI).• “What patients can do,” “Questions to ask,” “How to prepare
for surgery” sections (e.g., Newfoundland and Labrador andNew Brunswick).
• Having a search tool to view by city, hospital, region, etc.Links to Google maps (e.g., PEI, Ontario, Nova Scotia).
• Identifying region/hospital with shortest wait time (e.g.,Ontario); having information on patient wait time guarantee(BC, Quebec).
• Having a website survey to contribute to improvements (PEI).
Factors that contributed to websites not being patient friendlyincluded:• confusing layout• too much text• too many clicks required to get the desired information• the use of titles for procedures that are unclear for patients• small fonts • not having information available in printable format• broken links.
Having comprehensive range of services reported, including emergency department wait times (e.g., Ontario).
Having data separated out for pediatric patients (e.g., Ontario).
Lack of robust list of procedures (lack of reporting on EmergencyDepartment wait times was frequently identified as a problem).
Having timely data (several provinces). Variation in reporting by procedure (e.g., medians for some, averages for others).
Reporting on cancer wait times by both wait for consultation andwait for treatment.
Having cancer wait times on a different website.
Showing wait time trends; percentage of patients treated within thebenchmark.
Lack of trend charts/graphs; not being able to compare data towait time benchmarks/targets.
Table 4: Patient representative input on provincial wait-time websites

11
for urgent surgeries that often require an Intensive CareUnit bed.As a result of the above factors, the 2011 Report Card
stated “WTA members recognize that the most importantaction to improve timely access to specialty care forCanadians is by addressing the ALC issue.”
“Addressing the ALC issue” requires that we move beyonddiscussing the effect of ALC on wait times and drill deeper touncover some of the most prevalent causes of ALC. This, inturn, will inform potential solutions.
There are numerous contributors to the ALC crisis.Several reports indicated dementia is the “key diagnosisrelated to ALC.”14 In 2009, this was supported by theCanadian Institute for Health Information (CIHI) reportAlternate level of Care in Canada15 (https://secure.cihi.ca/free_products/ALC_AIB_FINAL.pdf ) which indicated that“overall, dementia accounted for almost one-quarter of ALChospitalizations and more than one-third of ALC days.”
In November 2011, the Ontario Institute for ClinicalEvaluative Sciences (ICES) report Health System Use by FrailOntario Seniors (www.ices.on.ca/file/ICES_AgingReport_2011.pdf ) noted that:• Current literature shows that hospitalization occurs at
least three times more often for older adults withAlzheimer’s disease than for age-matched older adultswithout the disease,16 with the clinical outcomes of hos-pitalization being worse for patients with Alzheimer’sdisease. Dementia is the primary cause of long-term careinstitutionalization among elderly Canadians.
• Just under half (43%) of older adults with dementia vis-ited the emergency department (ED) during the yearprior to baseline compared to 24.6% of older adultswithout dementia.
• Among older adults with dementia, 11.2% visited theED at least once for a potentially preventable condition,whereas the rate was only 5.2% among older adults with-out dementia.
• 16.8% of hospitalized older adults with dementia hadALC days, whereas this was the case in only 5.2% of theremaining group.
Dementia is not usually the reason for admission. It istherefore not picked up as a cause for ALC in chart reviews. Itdoes emerge as a main driver of ALC when complex, multi-year analysis of multiple, linked databases is carried out, asICES and CIHI have done.
When patients develop dementia, they lose their cogni-tive ability to manage their other chronic diseases (e.g.,diabetes, coronary artery disease, congestive heart failure,chronic obstructive pulmonary disease). This interactionbetween co-morbidities often results in what has been termeda “dementia domino effect” leading to destabilization ofchronic diseases, ED use and hospitalization. Such patientsare prone to prolonged deliriums leading to prolongedlengths of stay in hospital and, all too often, ALC.17
In planning for the future, we must therefore factordementia into the management of other chronic diseases. Amyriad of measures can be envisioned to lessen the effect ofALC on wait times. Three select community care, acute careand long-term care approaches to decrease the impact of ALCon wait times are:1. Community-based solutions focused on prevention ofALC: According to the World Health Organization(WHO) report ‘Dementia: A Public Health Priority’(whqlibdoc.who.int/publications/2012/9789241564458_eng.pdf ) released in April 2012, three G7 countrieshave developed a national dementia plan while two oth-ers are in the process of developing one — Canada hasnot.18 Canada needs a National Dementia Strategy thatformally integrates the functions of primary care, special-ist care and home care services with a strong focus onkeeping seniors in the community, out of the ED and outof hospital and preventing or delaying long-term careplacement. Such a strategy would decrease the impact ofdementia on ALC rates by both preventing ED use/hos-pitalization and by freeing up long-term care beds forthose acute care patients for whom placement in long-term care is truly unavoidable.
2. Hospital-based solutions focused on prevention of ALC:For those seniors for whom admission to hospital isappropriate and unavoidable, acute care hospitals mustdevelop screening approaches to detect those who are athighest risk for becoming an ALC stay (i.e., this willinvariably include screening for delirium and dementia;early and aggressive mobilization). This ALC risk screenand intervention should be applied as early as possibleduring the admission, and should trigger rapid assessmentand intervention by the most appropriate service (e.g.,geriatric medicine, care of the elderly, psychiatry) even ifthe patient is still in the ED awaiting a hospital bed.
3. Long-term care based solutions to open up more long-term care beds for acute care patients: Processes and
Shedding Light on Canadians’ Total Wait for Care

programs are required that permit seniors who wereadmitted to LTC from hospital but who have improvedto the point where they no longer need LTC level of ser-vices, to graduate to residential level of care (or subsidizedresidences if required). This would thereby free up LTCbeds for acute care patients for whom placement in long-term care is truly unavoidable.
Future reporting should assess progress on activities pertaining to these three actions.
6. Best practices in improving Canadians’ accessto necessary care
Providing timely access to necessary care is a shared responsi-bility. Governments have their role to play by, for example,adequately funding the system and supporting other stake-holders in making process improvements. Providers are alsopart of the overall solution to improve the performance of ourhealth care system. WTA members acknowledge that theymust work collaboratively with other health care providers,patients and governments to help Canadians attain timely,appropriate and equitable access to high quality, patient-centred health care. The WTA members can assist in a varietyof ways, such as:• Identifying best practices in improving access to quality
care across Canada, (such as care pathways, referral path-ways and EMR-embedded checklists), and share these tobring about positive change;
• Identifying system reforms that affect access, such asadvanced access models and multi-disciplinary teams;and
• Contributing toward the collection of wait-time data.Details on wait time related projects underway by WTA
members are available on the WTA website: www.waittimealliance.ca/leading_practices_e.htm
We note that during the preparation of this report card,many governments informed the WTA of their own effortsto reduce wait times and/or improve the collection andreporting of wait times in their respective jurisdictions. Forinstance, the Government of Newfoundland and Labradorrecently developed strategies to reduce wait times for hipand knee replacement surgeries, as well as for emergencydepartment visits.19 These include such actions as tacklingthe backlog of patients waiting for hip and knee jointreplacement surgeries, adopting best practices from otherprovinces, and improving the measurement, collection andpublic reporting of wait times in emergency departments.The Government of Nova Scotia took steps to expand thelist of procedures publicly reported on its website and sup-ports the standardization of wait-time reporting across allprovinces.
The WTA salutes these efforts and strongly encouragesthe collection and sharing of such projects across the countryfor the benefit of others.
12
A Report Card on Wait Times in Canada 2012
13
About the Wait Time Alliance
The Wait Time Alliance (WTA) was created in the fall of2004, following the release of that year’s Health Accord (A10-year plan to strengthen health care). WTA members haveused their unique expertise to develop and advocate for medi-cal wait-time benchmarks, as well as monitor governments’implementation of wait-time commitments.
WTA Mission Statement
The WTA is concerned over delayed access to health care forCanadians. We work collaboratively with our stakeholders toinform, advocate, and provide solutions to achieve timely,appropriate and equitable access to high-quality health care.
The WTA is comprised of 14 national medical organiza-tions whose members are directly involved in providing careto patients. The WTA members are:• Canadian Anesthesiologists’ Society (CAS) — www.cas.ca• Canadian Association of Emergency Physicians (CAEP)
— www.caep.ca• Canadian Association of Gastroenterology (CAG) —
www.cag-acg.org• Canadian Association of Paediatric Surgeons (CAPS) —
www.caps.ca• Canadian Association of Nuclear Medicine (CANM) —
www.csnm-scmn.ca• Canadian Association of Radiation Oncology (CARO)
— www.caro-acro.ca• Canadian Association of Radiologists (CAR) —
www.car.ca• Canadian Cardiovascular Society (CCS) — www.ccs.ca• Canadian Medical Association (CMA) — www.cma.ca• Canadian Ophthalmological Society (COS) —
www.eyesite.ca• Canadian Orthopaedic Association (COA) —
www.coa-aco.org• Canadian Psychiatric Association (CPA) —
www.cpa-apc.org• Canadian Society of Plastic Surgeons (CSPS) —
www.plasticsurgery.ca• Society of Obstetricians and Gynaecologists of Canada
(SOGC) — www.sogc.org
In addition to these members, the WTA is partneringwith a number of other organizations including The Collegeof Family Physicians of Canada, the Canadian GeriatricsSociety and the Canadian Association of General Surgeons.
Shedding Light on Canadians’ Total Wait for Care

References1. Mental Health Commission of Canada. Changing directions,
changing lives: the mental health strategy for Canada. Calgary(AB) and Ottawa (ON): The Commission; 2012. Available:http://strategy.mentalhealthcommission.ca/ (accessed 2012June 4).
2. P-CATS list. Toronto (ON): Canadian Paediatric Surgical WaitTimes Project; 2008. Available: www.waittimealliance.ca /waittimes/P-CATS-List_en.pdf (accessed 2012 June 4).
3. The College of Family Physicians of Canada. Family medicinein Canada: vision for the future. Mississauga (ON): TheCollege; 2004. p. 35.
4. Wait Time Alliance. It’s about time: achieving benchmarks andbest practices in wait time management. Wait Time Alliance forTimely Access to Health Care; 2005. p. 68.
5. Canadian Community Health Survey. Ottawa (ON): StatisticsCanada; 2010. Available: www.statcan.gc.ca/daily-quoti-dien/110621/dq110621b-eng.htm (accessed 2012 June 4).
6. Wong ST, Watson DE, Young E, et al. What do people think isimportant about primary healthcare? Healthc Policy 2008;3:89-104.
7. Davis K, Schoen C, Stremikis K. Mirror, mirror on the wall:How the performance of the US health care system compares inter-nationally. New York (NY) and Washington (DC): TheCommonwealth Fund; 2010.
8. The wait starts here: final report. Mississauga (ON): TheCollege of Family Physicians of Canada and Ottawa (ON):Canadian Medical Association and Primary Care Wait TimeParternership; 2009.
9. The College of Family Physicians of Canada. A vision forCanada: family practice: the patient’s medical home. Mississauga(ON): The College; 2011. p. 34.
10. Ibid., p. 29
11. College of Family Physicians of Canada. Patient’s medical home.Mississauga (ON): The College; 2011. Available: www.cfpc.ca/A_Vision_for_Canada_Family_Practice_2011 (accessed 2012June 4).
12. The Commonwealth Fund. The 2011 Commonwealth FundInternational Health Policy Survey. New York (NY): The Fund;2011. Available: www.commonwealthfund.org /Surveys/2011/Nov/2011-International-Survey.aspx (accessed 2012 June 4).
13. Canadian Medical Association. Family physician survey on refer-rals. Ottawa (ON): The Association; 2011. Available:http://www.cma.ca/advocacy/experiences-referrals-primary-to-specialty .
14. Yassi A, Ostry A, Ratner P, et al. Caring for the Caregivers of"Alternate Level Care" (ALC) Patients: The Impact of HealthcareOrganizational Factors in Nurse Health, Well-Being, Recruitmentand Retention in the South Fraser Health Region of BritishColumbia. Vancouver (BC): Occupational Health and SafetyAgency for Healthcare; 2011. Available: www.ohsah.bc.ca/media/ALC_Final%20_Report.pdf (accessed 2005 June 25).
15. Canadian Institute for Health Information. Alternate level ofcare in Canada. Ottawa (ON): The Institute; 2009. Available:https://secure.cihi.ca/free_products/ALC_AIB_FINAL.pdf(accessed 2012 June 4).
16. Institute for Clinical Evaluative Sciences. Health system use byfrail Ontario seniors. Toronto (ON): The Institute; 2011.Available: www.ices.on.ca/file/ICES_Aging Report_2011.pdf.(accessed 2012 June 4).
17. Parliament, Report of the Standing Committee on Health.Chronic Disease Related to Aging and Health Promotion andDisease Prevention. 41st Leg, 1st Sess, No 13. Available:www.parl.gc.ca/Content/HOC/Committee/411/HESA/Reports/RP5600468/411_HESA_Rpt08_PDF/411_HESA_Rpt08-e.pdf (accessed 2012 June 4).
18. World Health Organization. Dementia: a public health priority.Geneva: The Organization; 2012 Available: http://whqlibdoc.who.int/publications/2012/9789241564458_eng.pdf(accessed 2012 June 4).
19. A Strategy to Reduce Hip and Knee Joint Replacement SurgeryWait Times in Newfoundland and Labrador 2012; St. John’s(NL): Government of Newfoundland and Labrador; 2012.Available: www.health.gov.nl.ca/health/wait_ times/wait_time_reduction.html (accessed 2012 June 4).
14
A Report Card on Wait Times in Canada 2012