Shear Strenght
21
A Study of Short Beam Shear and Double Lap Shear Specimens of Glass Fabric/Epoxy Composites D. H. Pahr a,∗ F. G. Rammerstorfer a a Institute of Lightweight Structures and Aerospace Engineering, TU Vienna P. Rosenkranz, K. Humer, H. W. Weber b b Atomic Institute of the Austrian Universities, Vienna Abstract Two experimental methods for determining the inter-laminar shear strength (ILSS), are compared: the short-beam-shear (SBS) and the double-lap-shear (DLS) test method. Specimens with a constant ply angle for all layers are considered. The experimental results show a significant difference (up to 50%) in the obtained ILSS. A finite element analysis shows that both test methods underestimate the real ILSS and demonstrate that the standardized ILSS-evaluation procedures are more or less valid for the SBS test, but require modifications in the case of the DLS test. Acoustic emission measurements and numerical investigations were performed to determine the real ILSS from the DLS results. The real ILSS cannot be obtained from the SBS test without an extended analysis. It is, however, possible to determine bounds for the real ILSS from the SBS-results. Key words: Delamination, Finite Element Analysis, Mechanical testing, Acoustic Emission Preprint submitted to Elsevier Science 25 October 2006
-
Upload
serge-page -
Category
Documents
-
view
212 -
download
2
Transcript of Shear Strenght
A Study of Short Beam Shear and Double Lap
Shear Specimens of Glass Fabric/Epoxy
Composites
D. H. Pahr a,∗ F. G. Rammerstorfer a
aInstitute of Lightweight Structures and Aerospace Engineering, TU Vienna
P. Rosenkranz, K. Humer, H. W. Weber b
bAtomic Institute of the Austrian Universities, Vienna
Abstract
Two experimental methods for determining the inter-laminar shear strength (ILSS),
are compared: the short-beam-shear (SBS) and the double-lap-shear (DLS) test
method. Specimens with a constant ply angle for all layers are considered. The
experimental results show a significant difference (up to 50%) in the obtained ILSS.
A finite element analysis shows that both test methods underestimate the real ILSS
and demonstrate that the standardized ILSS-evaluation procedures are more or less
valid for the SBS test, but require modifications in the case of the DLS test. Acoustic
emission measurements and numerical investigations were performed to determine
the real ILSS from the DLS results. The real ILSS cannot be obtained from the SBS
test without an extended analysis. It is, however, possible to determine bounds for
the real ILSS from the SBS-results.
Key words: Delamination, Finite Element Analysis, Mechanical testing, Acoustic
Emission
Preprint submitted to Elsevier Science 25 October 2006
Introduction
Delamination (the failure at the interface between different layers) is one of
the most critical failure mechanism of laminates. The resistance against de-
lamination is characterized by the inter-laminar shear strength (ILSS). The
inter-laminar shear strength is defined as the shear stress at rupture where the
plane of fracture is located between the layers of reinforcement of a composite
structure (ASTM D 3846-94). Different experimental arrangements have been
established for the estimation of the ILSS of anisotropic materials or mate-
rial combinations. The main methods for the determination of the ILSS are
the short-beam-shear test (ASTM D-2344-00), the four-point shear test, the
Iosipescu test (ASTM D-5379-98), the tensile test (ASTM D-3518-94), and the
double notch shear test (ASTM D-3846-94). A new apparatus for the deter-
mination of the ILSS of flat and curved composite material is the compression
shear device (CSD) (see Rosselli and Santare [1], Schneider et al. [2]).
An important contribution to an assessment of the three-dimensional material
properties could be an ILSS test method, which allows to measure the static
ILSS as well as the fatigue strength under inter-laminar stresses. The above
mentioned Iosipescu test method has been examined extensively and was found
to be a highly effective and reliable method for predicting the static ILSS
(Adams and Lewis [3], Schneider et al. [2]). However, measuring the fatigue
strength by this method is difficult.
∗ Corresponding author.
Email address: [email protected] (D. H. Pahr).
2
Unlike the Iosipescu shear test, the double notch shear test method does not
require an extensive set-up or fixture, the specimen is simple, and fatigue
strength investigations can be performed (Shokrieh and Lessard [4]). One
of the drawbacks of the double notch (single-lap) shear test is the bending
moment created by the unsymmetric specimen shape. Clamps are used to
eliminate this unwanted loading but the fixation might have an influence on
the measured ILSS. Therefore, another notched ILS-specimen, the so-called
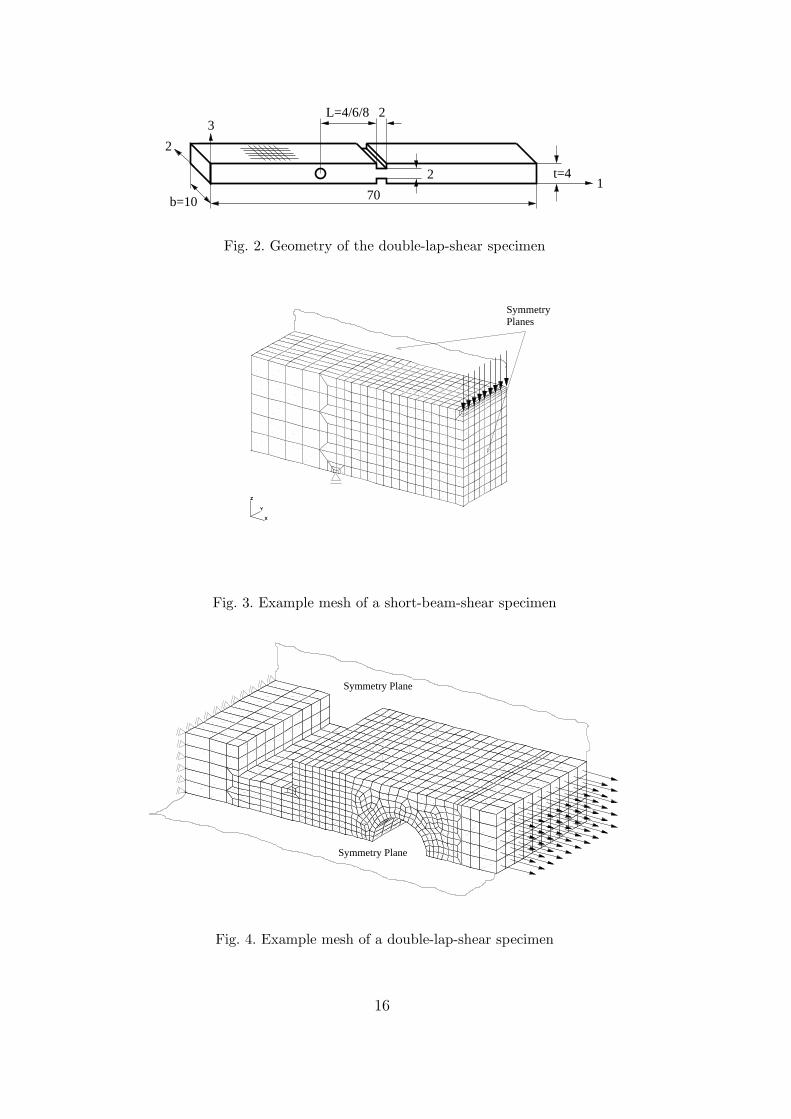
double-lap-shear (DLS) specimen, was introduced (Figure 2), which has a
symmetric shape and therefore avoids the above drawback (Rosenkranz et al.
[5]).
This paper reports investigations of the DLS specimen and its suitability for an
accurate assessment of the static ILSS. Based on these results it can be decided
whether or not the DLS-method is appropriate for fatigue strength predictions.
Results obtained from the double-lap-shear test are compared with those ob-
tained from the short-beam-shear test. Many investigators already discussed
the SBS-method (e.g. Adams and Lewis [6], Adams and Lewis [3], Schneider
et al. [2]) and described certain problems with the determination of the ILSS.
We review the SBS-method as well and find it suitable (in combination with
simple finite element calculations) to predict upper and lower bounds for the
true ILSS. Such bounds are especially useful for establishing the quality of a
new ILSS test method.
The double-lap-shear specimen is investigated numerically and experimentally.
The first delamination failure loads (FDF-loads) are determined from acoustic
emission experiments. The FE-analyses are based on these FDF-loads and the
real ILSS is finally obtained by applying some kind of fitting procedure.
3
Failure Models
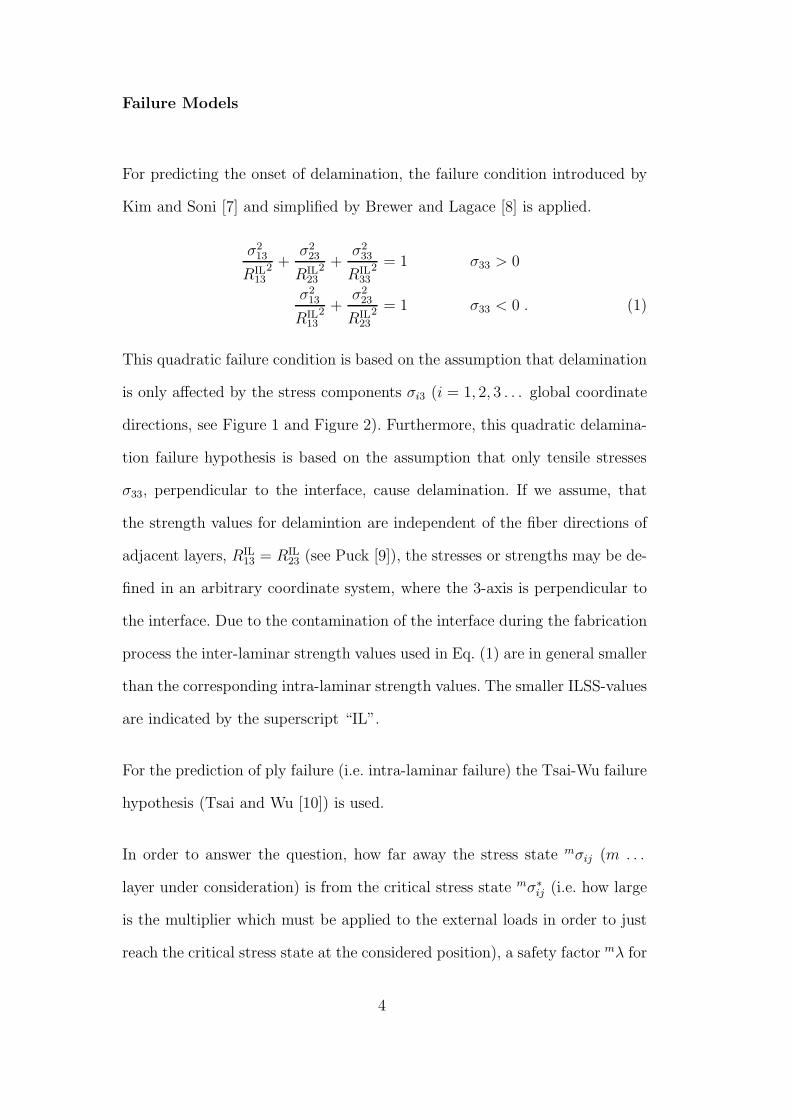
For predicting the onset of delamination, the failure condition introduced by
Kim and Soni [7] and simplified by Brewer and Lagace [8] is applied.
σ213
RIL13
2 +σ2
23
RIL23
2 +σ2
33
RIL33
2 = 1 σ33 > 0
σ213
RIL13
2 +σ2
23
RIL23
2 = 1 σ33 < 0 . (1)
This quadratic failure condition is based on the assumption that delamination
is only affected by the stress components σi3 (i = 1, 2, 3 . . . global coordinate
directions, see Figure 1 and Figure 2). Furthermore, this quadratic delamina-
tion failure hypothesis is based on the assumption that only tensile stresses
σ33, perpendicular to the interface, cause delamination. If we assume, that
the strength values for delamintion are independent of the fiber directions of
adjacent layers, RIL13 = RIL
23 (see Puck [9]), the stresses or strengths may be de-
fined in an arbitrary coordinate system, where the 3-axis is perpendicular to
the interface. Due to the contamination of the interface during the fabrication
process the inter-laminar strength values used in Eq. (1) are in general smaller
than the corresponding intra-laminar strength values. The smaller ILSS-values
are indicated by the superscript “IL”.
For the prediction of ply failure (i.e. intra-laminar failure) the Tsai-Wu failure
hypothesis (Tsai and Wu [10]) is used.
In order to answer the question, how far away the stress state mσij (m . . .
layer under consideration) is from the critical stress state mσ∗
ij (i.e. how large
is the multiplier which must be applied to the external loads in order to just
reach the critical stress state at the considered position), a safety factor mλ for
4
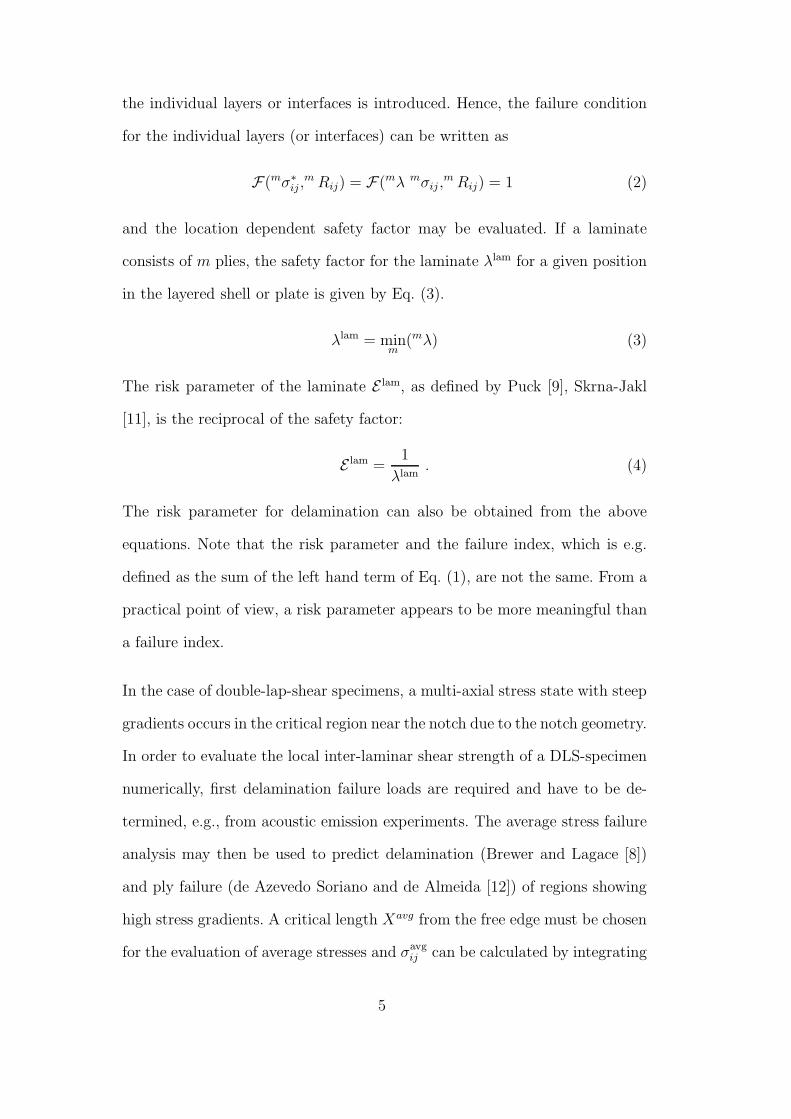
the individual layers or interfaces is introduced. Hence, the failure condition
for the individual layers (or interfaces) can be written as
F(mσ∗
ij ,m Rij) = F(mλ mσij ,
m Rij) = 1 (2)
and the location dependent safety factor may be evaluated. If a laminate
consists of m plies, the safety factor for the laminate λlam for a given position
in the layered shell or plate is given by Eq. (3).
λlam = minm
(mλ) (3)
The risk parameter of the laminate E lam, as defined by Puck [9], Skrna-Jakl
[11], is the reciprocal of the safety factor:
E lam =1
λlam. (4)
The risk parameter for delamination can also be obtained from the above
equations. Note that the risk parameter and the failure index, which is e.g.
defined as the sum of the left hand term of Eq. (1), are not the same. From a
practical point of view, a risk parameter appears to be more meaningful than
a failure index.
In the case of double-lap-shear specimens, a multi-axial stress state with steep
gradients occurs in the critical region near the notch due to the notch geometry.
In order to evaluate the local inter-laminar shear strength of a DLS-specimen
numerically, first delamination failure loads are required and have to be de-
termined, e.g., from acoustic emission experiments. The average stress failure
analysis may then be used to predict delamination (Brewer and Lagace [8])
and ply failure (de Azevedo Soriano and de Almeida [12]) of regions showing
high stress gradients. A critical length Xavg from the free edge must be chosen
for the evaluation of average stresses and σavgij can be calculated by integrating
5
the stress value σij over Xavg. These stress values are then used as stress input
for the above failure criteria.
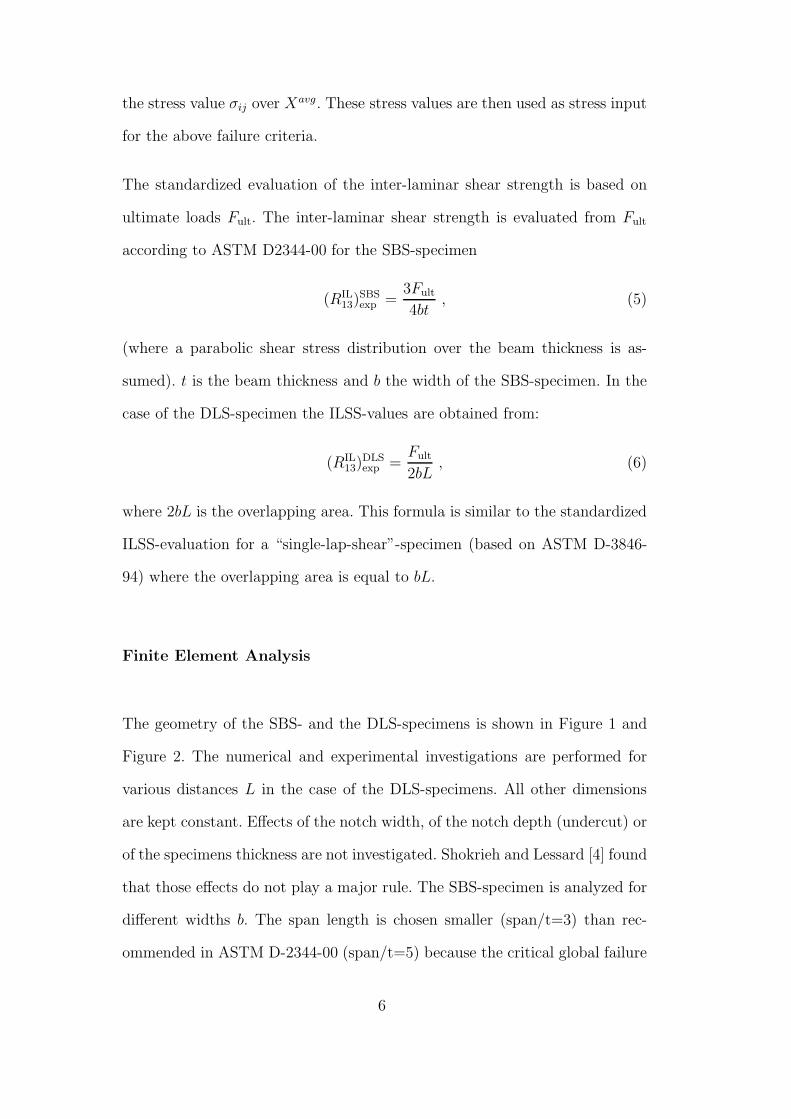
The standardized evaluation of the inter-laminar shear strength is based on
ultimate loads Fult. The inter-laminar shear strength is evaluated from Fult
according to ASTM D2344-00 for the SBS-specimen
(RIL13)
SBSexp =
3Fult
4bt, (5)
(where a parabolic shear stress distribution over the beam thickness is as-
sumed). t is the beam thickness and b the width of the SBS-specimen. In the
case of the DLS-specimen the ILSS-values are obtained from:
(RIL13)
DLSexp =
Fult
2bL, (6)
where 2bL is the overlapping area. This formula is similar to the standardized
ILSS-evaluation for a “single-lap-shear”-specimen (based on ASTM D-3846-
94) where the overlapping area is equal to bL.
Finite Element Analysis
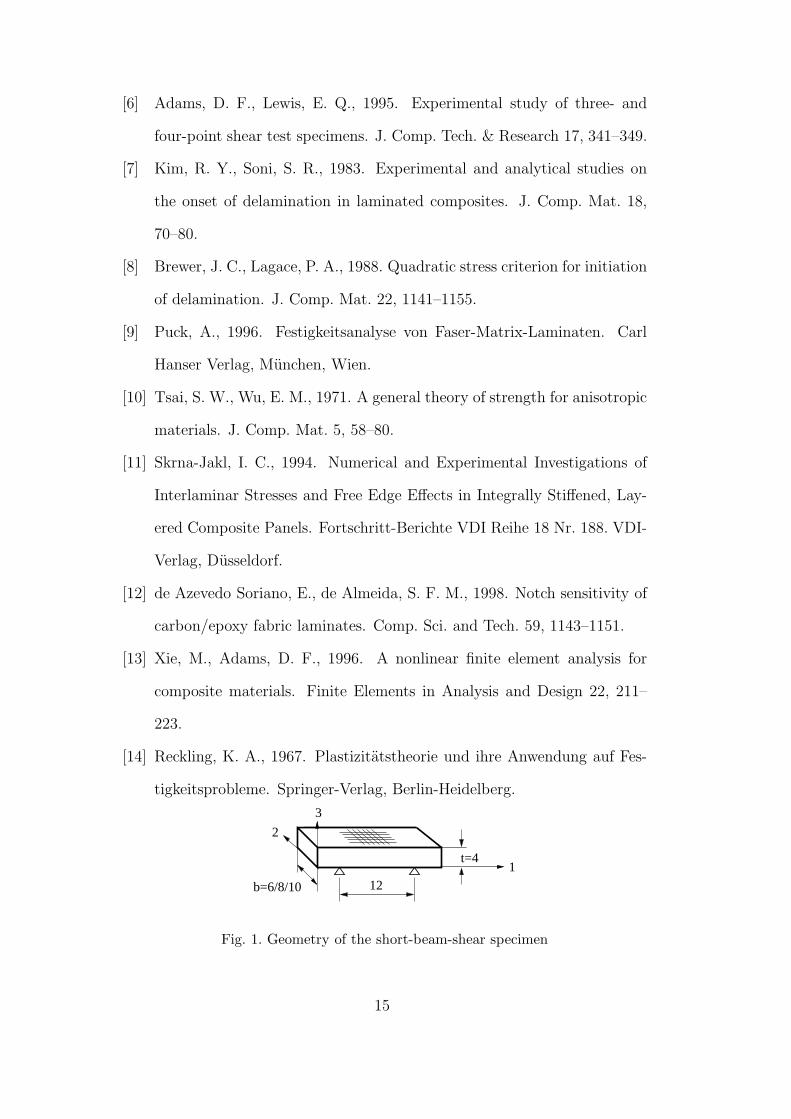
The geometry of the SBS- and the DLS-specimens is shown in Figure 1 and
Figure 2. The numerical and experimental investigations are performed for
various distances L in the case of the DLS-specimens. All other dimensions
are kept constant. Effects of the notch width, of the notch depth (undercut) or
of the specimens thickness are not investigated. Shokrieh and Lessard [4] found
that those effects do not play a major rule. The SBS-specimen is analyzed for
different widths b. The span length is chosen smaller (span/t=3) than rec-
ommended in ASTM D-2344-00 (span/t=5) because the critical global failure
6
mode would be ply failure under the load introduction for the recommended
span length.
The finite element analysis code MSC-Nastran is used for all numerical inves-
tigations. Pre- and Post-processing is done by the program MSC-Patran. The
failure models are implemented by FORTRAN routines.
Three dimensional linear elastic finite element models are employed to obtain
accurate stress results. The assumption of linear elastic material behavior
is justified for the DLS-specimen if, first delamination loads are applied. In
contrast, the ILSS in the SBS-specimen is based on ultimate loads, although
local failure occurs before complete failure. A comparison of linear and non-
linear FE-analyses on SBS-specimens (see Xie and Adams [13]) demonstrates
that the difference in the ILS-stress is small (approximately 4%). Therefore,
linear FE-analyses are sufficient for the investigation of SBS-specimens.
Examples of meshes for the SBS- and the DLS-specimen are shown in Figure 3
and Figure 4, respectively. Due to the symmetries in geometry, loading and
material it is sufficient to model only one quarter of the DLS- and the SBS-
specimens. Here linear, full integrated HEX-elements are used. A comparison
with other element types and integration schemes as well as with finer mesh
densities show a very small influence on the obtained results.
Experimental Procedures
The laminate ISOVAL 10/E (NEMA/ASTM: G 10; ISOVOLTA AG, Aus-
tria) consists of 20 woven fabric glass fiber plies with a [0]20-lay-up in epoxy
(DGEBA) matrix. The material parameters are listed in Table 1, where l, q, t
7
are the local and 1, 2, 3 are the global coordinate axes. The subscripts “C”
and “T” denote the compressive and the tensile loading direction. The values
in brackets are the material parameters at test temperature of 77 K. All other
values refer to 293 K (room temperature). The experiments were performed
with an MTS 810 TestStar II Material Testing System under static loading
conditions with a cross head speed of 0.5 mm/min (DLS tests) and of 1.3
mm/min (SBS-tests, ASTM D-2344-00), respectively. Where the cross head
speed of 0.5 mm/min was chosen from the tensile test standard ASTM D-
3039M-00, because the investigated DLS specimen is not standardized. Each
specimen geometry was investigated on four or five samples. For more details
regarding the test procedure see our work Rosenkranz et al. [5]. As mentioned
above the span length is chosen smaller (span/t=3) than recommended in
ASTM D-2344-00 (span/t=5) because the critical global failure mode would
be ply failure under the load introduction for the recommended span length.
This fact can be proved by the formula for the bending stress of a beam, which
can be written in the investigated case as:
span
t<
2 RlT b t
3Fult
(7)
Analytical and Experimental Results
Short-Beam-Shear Specimen
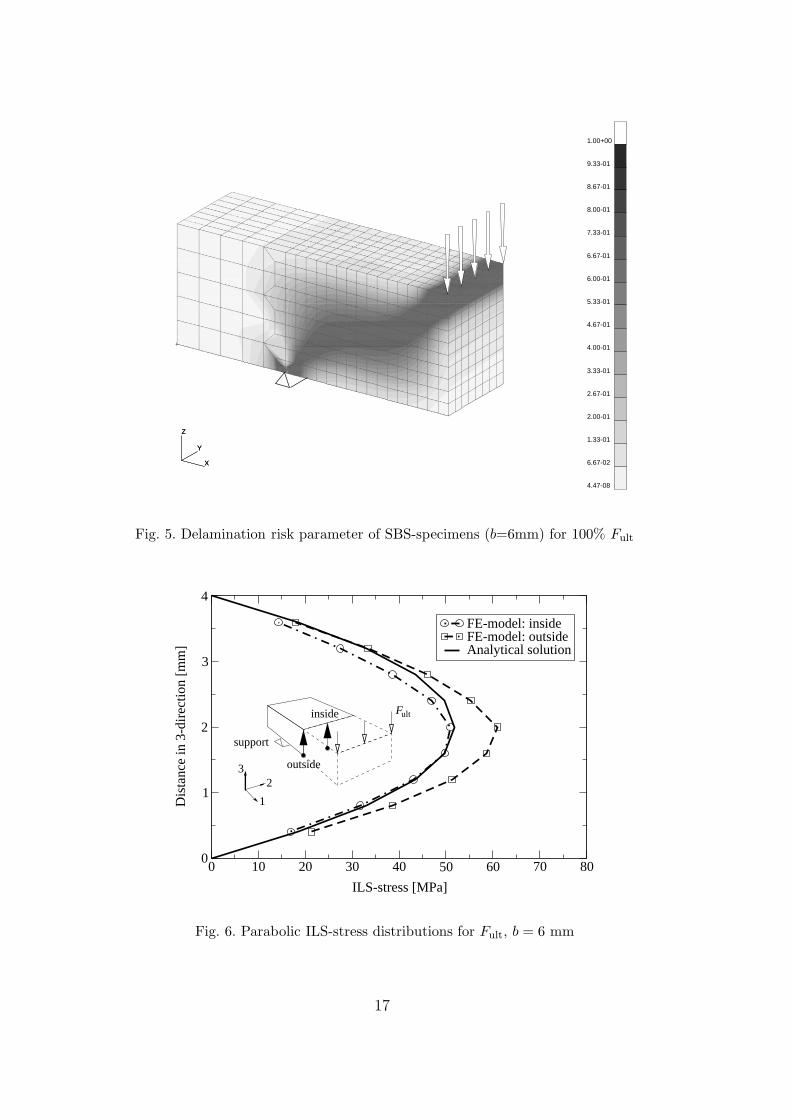
Figure 5 shows the delamination risk parameter computed for an SBS-specimen.
FE-results on other SBS-geometries look similar. The first local failure, ac-
cording to the FE-calculations, is observed in regions around the support and
the load introduction at approximately fifty percent of the experimentally
8
determined ultimate load. This local failure does not affect the global fail-
ure behavior of the SBS-specimen. The complete delamination failure at the
ultimate load level is mainly affected by the parabolically distributed shear
stresses in the cross section between the support and the load introduction.
In this critical region all other stress components are negligible.
The shear stress distributions are plotted in Figure 6 for the “inside” and
“outside” region. These results are compared with those obtained from ASTM
D-2344-00, which is based on the assumption of a parabolic shear stress distri-
bution being constant over the width of the specimen (analytical 2D solution).
It can be seen that the shear stresses which are predicted by the numerical
analyses in the inside region are approximately equal to the analytical result.
However, they are significantly higher at the outside region, although for the
considered laminate no classical “free edge effect” appears. This stress concen-
tration at the free edge cannot be reproduced by 2D analysis, where a plane
stress state (σi2 = 0) is assumed. Only 3D considerations of the beam problem
show additional stresses (σi2 6= 0, see Reckling [14]) and produce ILS-stress
concentrations at the free edge, which should be distinguished from the “free
edge effects” in laminates.
The ILS-stress concentration at the free edge depends on the width-to-specimen
thickness ratio b/t and may be characterized by an ILS-stress concentration
factor f as follows
f =(σ13)3D
(σ13)2D
, (8)
where (σ13)2D and (σ13)3D stands for the shear stress obtained from 2D and
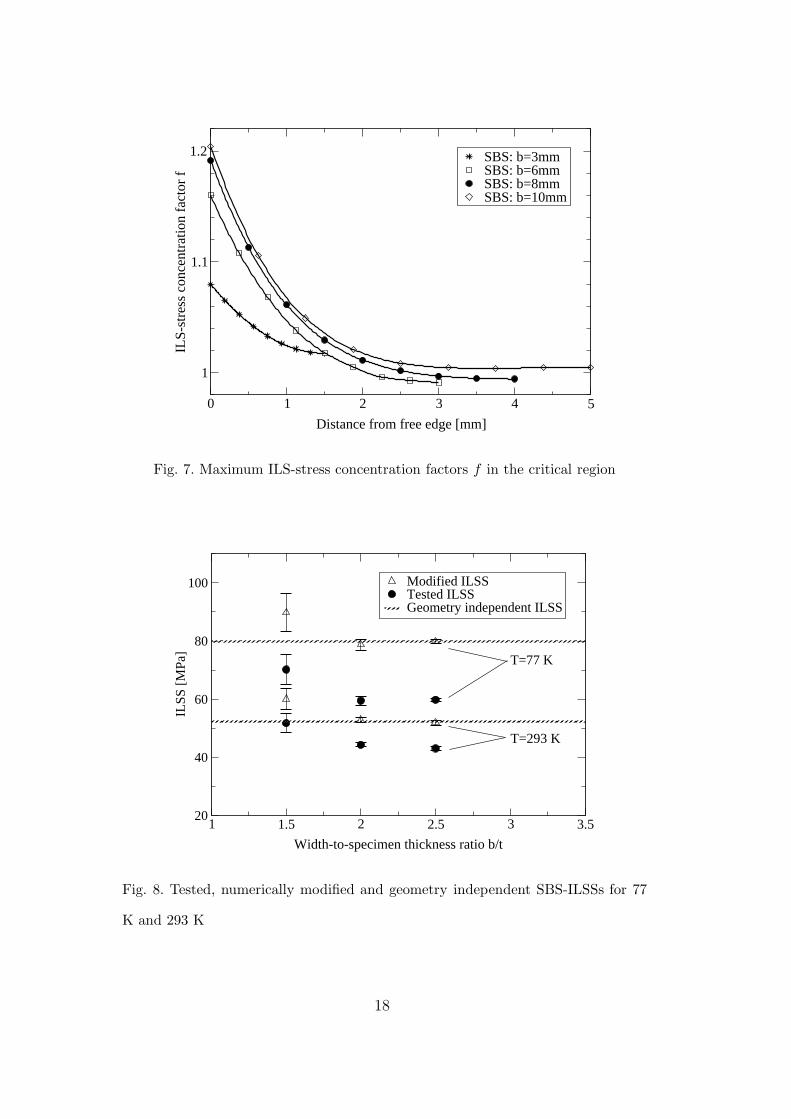
3D investigations, respectively. The distribution of the maximum ILS-stress
concentration factors within the critical region (between support and load
9
introduction in the middle of the specimen) is shown in Figure 7. The ILS-
stress concentration factors are drawn over the distance from the free edge for
all specimen widths b = 4, 6, 8 mm as well as for b = 3 mm. It can be seen that
a stress concentration appears at the free edge and approaches 1.21, when b
increases to 10 mm. The f -factor is approximately 1 inside the specimens i.e.
the stress is equal to the shear stress obtained from an analytical 2D solution.
Only the specimen with b=3 mm shows a different behavior. In that case, the
attenuation length (approximately 4 mm) of the ILS-stress concentration is
much smaller than b/2, which leads to a smaller difference in the ILS-stresses
between the inside and outside region. This shows that a decreasing width
of the specimen leads to a more uniform ILS-stress distribution within the
critical region and, therefore, to higher experimental ILSS values.
The experimental ILSS results for different width-to-specimen-thickness ratios
are shown in Figure 8. A significant increase of the ILSS with decreasing
temperature is noted. As found above the “real ILSSs” are higher than the
experimental results. One way to modify the experimental ILSS results is to
assume that the ILSSs are equal to the maximum shear stresses in the critical
region. Then the modified ILSS is obtained by multiplying the data by the
corresponding stress concentration factors. The modified ILSS-values are also
shown in Figure 8. They should be geometry independent and are found to
be 53 MPa for 293 K and 80 MPa for 77 K. Slight derivations occur only for
b/t = 1.5, but this specimen type showed large confidence intervals and should
be discarded.
Based on the above investigations two statements regarding the ILSS obtained
from SBS-specimens can be made:
10
(1) The experimental ILSS represents a lower bound for the real ILSS. The
experimental ILSS is the smallest ILSS-value in the critical region, which
is based on linear elastic material behavior and ultimate loads. In reality
the non-linear material behavior leads, after the occurance of first delam-
ination, to a stress transfer from the outside region (first delamination
within the critical region) to the inside region, and therefore this leads to
higher shear stresses at the ultimate load level. For this reason the real
ILSS-values are higher than the experimental ILSS-values.
(2) The maximum ILSS, which is obtained from the numerical analyses, rep-
resents an upper bound for the ILSS, if we assume that for F = Fult the
numerically modified ILSS is equal to the maximum shear stress appear-
ing in the critical region. In the real structure a load F < Fult leads to the
first local delamination and, therefore, the real ILSS-values are smaller
than the computed ones.
The difference between the computed and the experimental ILSS-values is
approximately 15 % (293 K) and 20 % (77 K), respectively. The real ILSS lies
between 43 and 53 MPa at 293 K and between 60 and 80 MPa at 77 K.
Double-Lap-Shear Specimen
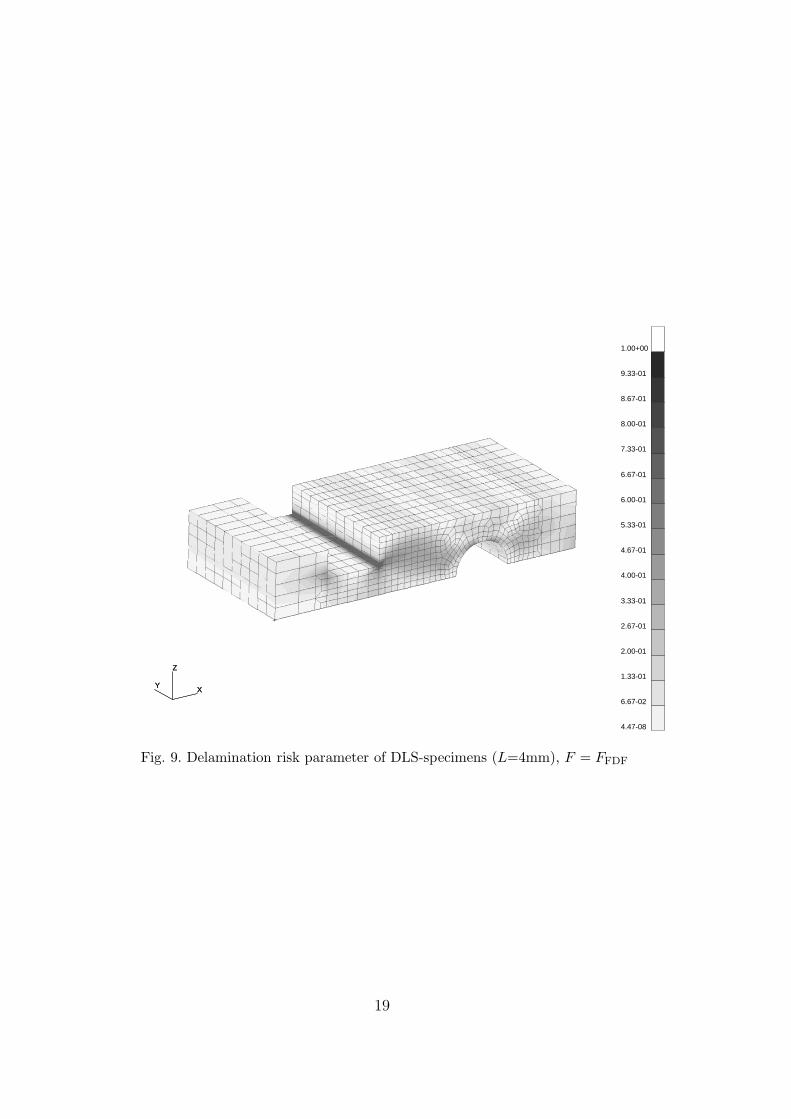
Figure 9 shows the computed delamination risk parameter of one of the in-
vestigated DLS-models for F = Fult. The critical region occurs near the notch
(not around the hole), i.e. crack initiation starts at the notch for F < Fult.
The evaluation of the average delamination risk parameter within the over-
lapping zone leads to a value of approximately 50-60%. Hence, from this point
of view the inter-laminar shear strength is significantly underestimated by
11
the “standardized” analysis method (Eq. (6)) which is based on mean shear
stresses within the overlapping zone for F = Fult. The problem of the double-
lap-shear test comes from the fact that the standard procedure describes a
complex fracture mechanical problem (crack initiation and crack growth) by
a simple strength analysis.
The average stress analysis method (Brewer and Lagace [8]) was applied to
obtain the unknown ILSS-value. A priori, only the experimental first delami-
nation (FDF) loads are known from acoustic emission testing. The averaging
length Xavg and the “real ILSS” are unknown. An ILSS evaluation consisting
of the following steps is applied:
(1) Experimental determination of the FDF-loads.
(2) Linear FE-analysis and computation of the stress state σij within the
critical notch region based on FDF-loads.
(3) Evaluation of the local ILSS (RIL13) leading to the onset of delamination
in dependence of the averaging length Xavg. To do so, Eq. (1) can be
rewritten as:
RIL13(X
avg) = F(σavg13 , σavg
33 , RIL33), (9)
where σavg13 and σavg
33 are the averaged shear and tensile stresses over
the averaging distance Xavg, respectively. RIL33 is the inter-laminar ten-
sile strength which must be known.
(4) Determination of the “real ILSS” using RIL13(X
avg)-curves.
The local ILSSs are shown in Figure 10 1 . The averaging length has a sig-
1 For these results the mesh shown in Figure 4 is refined. The critical region is
meshed using 30 elements/mm.
12
nificant influence only for Xavg < 0.34 mm. For Xavg > 0.34 mm all curves
coincide at both test temperature. The difference between the DLS-specimen
with L = 4 mm and the other DLS-specimens comes from the influence of the
stress concentration due to the hole on the stress field in the notch region.
This influence is not observed in the case of the two other specimens. The
proper averaging distance for the present material system is found to be 0.34
mm. This corresponds to the point on the RIL13(X
avg)-curves, where the ILSS
of all three curves first meet. Based on this investigation the “real ILSS” is
obtained as 48 MPa at 293 K and 69 MPa at 77 K.
Figure 11 shows a comparison of the ILSS based on SBS investigations and
the “real ILSS”. As mentioned above, the SBS results provide bounds for the
“real ILSS”.
In Table 2 the “real ILSSs” are compared with the experimental SBS and DLS
ILSS-results. The 6 mm SBS-specimen is not included, because this specimen
type did not lead to reliable ILSSs. It can be seen that both tests underesti-
mate the real ILSS, but that especially the DLS-specimens shows a significant
underestimation by up to 48%, if the standard evaluation procedure is em-
ployed.
Conclusions
A comparison of experiments of two different ILSS specimens shows, that the
double-lap-shear test is not well suited for predicting the ILSS, if standard-
ized analysis methods are employed. Acoustic emission results and numerical
investigations must be combined, in order to obtain realistic ILSS-values. The
13
short-beam-shear test has the advantage of a simpler test arrangement, but it
provides only ILSS-bounds which can be useful if the quality of other ILSS-
tests is evaluated.
Acknowledgements
This work has been carried out within the Association EURATOM-OEAW.
References
[1] Rosselli, F., Santare, M. H., 1997. Comparison of short beam shear (SBS)
and interlaminar shear device (ISD) tests. Composites Part A 28A, 587–
594.
[2] Schneider, K., Lauke, B., Beckert, W., 2001. Compression shear test
(CST) - A convenient apparatus for the estimation of apparent shear
strength of composite materials. Appl. Comp. Mat. 8, 43–62.
[3] Adams, D. F., Lewis, E. Q., 1997. Experimental assessment of four com-
posite material shear test methods. J. Testing & Evaluat. 25, 174–181.
[4] Shokrieh, M. M., Lessard, L. B., 1998. An assessment of the double-
notch shear test for interlaminar shear characterization of a unidirectional
Graphite/Epoxy under static and fatigue loading. Appl. Comp. Mat. 5,
49–64.
[5] Rosenkranz, P., Humer, K., Weber, H. W., Pahr, D. H., Rammerstorfer,
F. G., 2001. Static and dynamic scaling experiments on double lap shear
specimens at room temperature and at 77 k. Cryogenics 41, 21–25.
14
[6] Adams, D. F., Lewis, E. Q., 1995. Experimental study of three- and
four-point shear test specimens. J. Comp. Tech. & Research 17, 341–349.
[7] Kim, R. Y., Soni, S. R., 1983. Experimental and analytical studies on
the onset of delamination in laminated composites. J. Comp. Mat. 18,
70–80.
[8] Brewer, J. C., Lagace, P. A., 1988. Quadratic stress criterion for initiation
of delamination. J. Comp. Mat. 22, 1141–1155.
[9] Puck, A., 1996. Festigkeitsanalyse von Faser-Matrix-Laminaten. Carl
Hanser Verlag, Munchen, Wien.
[10] Tsai, S. W., Wu, E. M., 1971. A general theory of strength for anisotropic
materials. J. Comp. Mat. 5, 58–80.
[11] Skrna-Jakl, I. C., 1994. Numerical and Experimental Investigations of
Interlaminar Stresses and Free Edge Effects in Integrally Stiffened, Lay-
ered Composite Panels. Fortschritt-Berichte VDI Reihe 18 Nr. 188. VDI-
Verlag, Dusseldorf.
[12] de Azevedo Soriano, E., de Almeida, S. F. M., 1998. Notch sensitivity of
carbon/epoxy fabric laminates. Comp. Sci. and Tech. 59, 1143–1151.
[13] Xie, M., Adams, D. F., 1996. A nonlinear finite element analysis for
composite materials. Finite Elements in Analysis and Design 22, 211–
223.
[14] Reckling, K. A., 1967. Plastizitatstheorie und ihre Anwendung auf Fes-
tigkeitsprobleme. Springer-Verlag, Berlin-Heidelberg.
12b=6/8/10
t=41
3
2
Fig. 1. Geometry of the short-beam-shear specimen
15
2
2
b=10 70
L=4/6/8
t=4
3
2
1
Fig. 2. Geometry of the double-lap-shear specimen
X
Y
Z
X
Y
Z
PlanesSymmetry
Fig. 3. Example mesh of a short-beam-shear specimen
Symmetry Plane
Symmetry Plane
Fig. 4. Example mesh of a double-lap-shear specimen
16
X
Y
Z
1.00+00
9.33-01
8.67-01
8.00-01
7.33-01
6.67-01
6.00-01
5.33-01
4.67-01
4.00-01
3.33-01
2.67-01
2.00-01
1.33-01
6.67-02
4.47-08
X
Y
Z
Fig. 5. Delamination risk parameter of SBS-specimens (b=6mm) for 100% Fult
0 10 20 30 40 50 60 70 80
ILS-stress [MPa]
0
1
2
3
4
Dis
tanc
e in
3-d
irec
tion
[mm
]
FE-model: insideFE-model: outsideAnalytical solution
1
23
Fultinside
outside
support
Fig. 6. Parabolic ILS-stress distributions for Fult, b = 6 mm
17
0 1 2 3 4 5
Distance from free edge [mm]
1
1.1
1.2
ILS-
stre
ss c
once
ntra
tion
fact
or f
SBS: b=3mmSBS: b=6mmSBS: b=8mmSBS: b=10mm
Fig. 7. Maximum ILS-stress concentration factors f in the critical region
1 1.5 2 2.5 3 3.5
Width-to-specimen thickness ratio b/t
20
40
60
80
100
ILSS
[M
Pa]
T=77 K
T=293 K
Modified ILSSTested ILSSGeometry independent ILSS
Fig. 8. Tested, numerically modified and geometry independent SBS-ILSSs for 77
K and 293 K
18
XY
Z
1.00+00
9.33-01
8.67-01
8.00-01
7.33-01
6.67-01
6.00-01
5.33-01
4.67-01
4.00-01
3.33-01
2.67-01
2.00-01
1.33-01
6.67-02
4.47-08
XY
Z
Fig. 9. Delamination risk parameter of DLS-specimens (L=4mm), F = FFDF
19

0.15 0.2 0.25 0.3 0.35 0.4
Distance from notch [mm]
40
60
80
100
120
loca
l IL
SS
T=77 K
T=293 K
DLS: L=4mmDLS: L=6mmDLS: L=8mm
Fig. 10. Local ILSS based on numerical DLS investigations and experimental FD-
F-loads
Fig. 11. Comparison of the different ILSS values for 77 K and 293 K
20
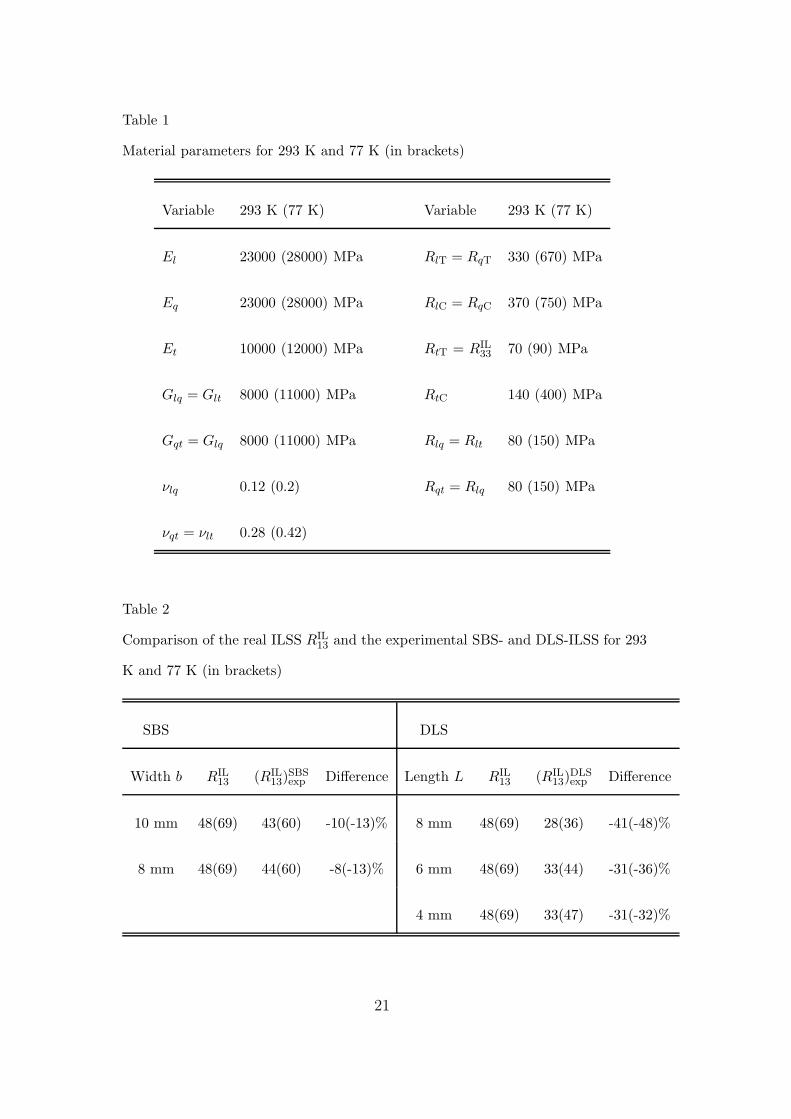
Table 1
Material parameters for 293 K and 77 K (in brackets)
Variable 293 K (77 K) Variable 293 K (77 K)
El 23000 (28000) MPa RlT = RqT 330 (670) MPa
Eq 23000 (28000) MPa RlC = RqC 370 (750) MPa
Et 10000 (12000) MPa RtT = RIL33 70 (90) MPa
Glq = Glt 8000 (11000) MPa RtC 140 (400) MPa
Gqt = Glq 8000 (11000) MPa Rlq = Rlt 80 (150) MPa
νlq 0.12 (0.2) Rqt = Rlq 80 (150) MPa
νqt = νlt 0.28 (0.42)
Table 2
Comparison of the real ILSS RIL13 and the experimental SBS- and DLS-ILSS for 293
K and 77 K (in brackets)
SBS DLS
Width b RIL13 (RIL
13)SBSexp Difference Length L RIL
13 (RIL13)
DLSexp Difference
10 mm 48(69) 43(60) -10(-13)% 8 mm 48(69) 28(36) -41(-48)%
8 mm 48(69) 44(60) -8(-13)% 6 mm 48(69) 33(44) -31(-36)%
4 mm 48(69) 33(47) -31(-32)%
21