
Shear Resistance of High Strength Concrete I-Beams with ... · Shear Resistance of High Strength...
134
Shear Resistance of High Strength Concrete I-Beams with Large Shear Reinforcement Ratios by Roger Yuan Xu A thesis submitted in conformity with the requirements for the degree of Master of Applied Science Graduate Department of Civil Engineering University of Toronto © Roger Yuan Xu 2012
Transcript of Shear Resistance of High Strength Concrete I-Beams with ... · Shear Resistance of High Strength...

Shear Resistance of High Strength Concrete I-Beams with Large Shear Reinforcement Ratios
by
Roger Yuan Xu
A thesis submitted in conformity with the requirements for the degree of
Master of Applied Science
Graduate Department of Civil Engineering
University of Toronto
© Roger Yuan Xu 2012

Shear Resistance of High Strength Concrete I-Beams with Large
Shear Reinforcement Ratios
Roger Yuan Xu
Master of Applied Science, 2011
Graduate Department of Civil Engineering University of Toronto
Abstract
Experiments were performed to examine the shear resistance of heavily reinforced I-beams. Six I-beams
with identical cross sections were constructed using high strength self-consolidating concrete, and were
tested under monotonic anti-symmetric loading. All specimens had almost the same amount of
longitudinal reinforcement, which provided sufficient flexural capacities. There were two variables: shear
span and shear reinforcement ratio.
Test results showed that ACI code was too conservative in predicting the shear strengths of heavily shear
reinforced I-beams, and the shear strength limit for deep beams should be increased to account for the
benefit of high strength concrete. However, doubling the amount of stirrups did not improve the ultimate
shear resistance much. The three beams that contained around 2.45% stirrups showed over-reinforced
shear failures. Longitudinal flange cracking occurred to every specimen due to lack of cross tie
reinforcement in the flanges, and it was believed to have reduced the ultimate shear strength.
ii

Acknowledgments
I would like to express my deepest gratitude to my supervisors, Professor M. P. Collins and
Professor E. C. Bentz. They granted me with this valuable opportunity to step into my desired
field of study. Within the past two years, I have benefited tremendously from their inspiring ideas,
insightful comments, and constant encouragements. I have been and will always be greatly
influenced by their enthusiasm and professionalism.
I thank every staff member in the Structures Laboratory. Renzo J. Basset, John MacDonald, and
Xiaoming Sun have pointed out many mistakes I made and given me numerous constructive
suggestions throughout my experiments, I have learned a lot from their expertise. Giovanni
Buzzeo and Joel Babbin taught me on using every tool I needed in the lab, and they always
showed kindness and patience even when I bothered them during their coffee breaks.
I also appreciate Innocon for supporting this research by supplying the concrete at a discounted
price.
I am grateful to my friends and colleagues: Paolo Calvi, Loreto Caprara, Andrew Cheung, Cyrille
Dunant, David Johnson, Robert Netopilik, Stephen Perkins, David Ruggiero, Min Sun, and
Liping Xie. Without their generous help, the success of this project would be impossible. I
especially thank Dr. Boyan Mihaylov, who not only helped me many times in the lab, but also
taught me lots of valuable knowledge and skills.
Finally, I want to dedicate this thesis to my parents.
iii

Table of Contents
1 Introduction 1
1.1 Motivation of Study . . . . . . . . . . . . . . . . . . . . . . . . . . . . . . . . . . . . . . . . . . 1
1.2 Current Study . . . . . . . . . . . . . . . . . . . . . . . . . . . . . . . . . . . . . . . . . . . . . . 5
2 Experimental Programme 6
2.1 Specimen Description . . . . . . . . . . . . . . . . . . . . . . . . . . . . . . . . . . . . . . . . . 6
2.1.1 Specimen Design . . . . . . . . . . . . . . . . . . . . . . . . . . . . . . . . . . . . . . . . . . . 6
2.1.2 Specimen Dimensions . . . . . . . . . . . . . . . . . . . . . . . . . . . . . . . . . . . . . . 7
2.1.3 Reinforcement Layout . . . . . . . . . . . . . . . . . . . . . . . . . . . . . . . . . . . 12
2.1.4 Formwork . . . . . . . . . . . . . . . . . . . . . . . . . . . . . . . . . . . . . . . . . . . . 21
2.2 Material Properties . . . . . . . . . . . . . . . . . . . . . . . . . . . . . . . . . . . . . . . . . . . . . . 22
2.2.1 Concrete . . . . . . . . . . . . . . . . . . . . . . . . . . . . . . . . . . . . . . . . . . . . . . . . 22
2.2.2 Reinforcement . . . . . . . . . . . . . . . . . . . . . . . . . . . . . . . . . . . . . . . . . 24
2.3 Test Setup . . . . . . . . . . . . . . . . . . . . . . . . . . . . . . . . . . . . . . . . . . . . . . . . . . . . 26
2.4 Instrumentation . . . . . . . . . . . . . . . . . . . . . . . . . . . . . . . . . . . . . . . . . . . . . . . 29
2.4.1 LVDTs . . . . . . . . . . . . . . . . . . . . . . . . . . . . . . . . . . . . . . . . . . . . . . . 29
2.4.2 Clinometers . . . . . . . . . . . . . . . . . . . . . . . . . . . . . . . . . . . . . . . . . . . . 29
2.4.3 Zurich Targets . . . . . . . . . . . . . . . . . . . . . . . . . . . . . . . . . . . . . . . . . 31
2.4.4 Strain Gauges . . . . . . . . . . . . . . . . . . . . . . . . . . . . . . . . . . . . . . . . . . 32
2.4.5 Optical Scanner and LEDs . . . . . . . . . . . . . . . . . . . . . . . . . . . . . . . . . 35
2.5 Test Arrangement and Procedure . . . . . . . . . . . . . . . . . . . . . . . . . . . . . . . . 37
3 Experimental Observation . . . . . . . . . . . . . . . . . . . . . . . . . . . . . . . . . . . . . . 38
3.1 Overview . . . . . . . . . . . . . . . . . . . . . . . . . . . . . . . . . . . . . . . . . . . . . . . . . . . . . . . 38
3.2 Specimen Behavior . . . . . . . . . . . . . . . . . . . . . . . . . . . . . . . . . . . . . . . . . . . . . . . 40
3.2.1 L1 . . . . . . . . . . . . . . . . . . . . . . . . . . . . . . . . . . . . . . . . . . . . . . . . . . . . 40
3.2.2 L2 . . . . . . . . . . . . . . . . . . . . . . . . . . . . . . . . . . . . . . . . . . . . . . . . . . . . . 42
3.2.3 M1 . . . . . . . . . . . . . . . . . . . . . . . . . . . . . . . . . . . . . . . . . . . . . . . . . . . . . 44
3.2.4 M2 . . . . . . . . . . . . . . . . . . . . . . . . . . . . . . . . . . . . . . . . . . . . . . . . . . . . . 46
3.2.5 S1 . . . . . . . . . . . . . . . . . . . . . . . . . . . . . . . . . . . . . . . . . . . . . . . . . . . . 48
iv

3.2.6 S2 . . . . . . . . . . . . . . . . . . . . . . . . . . . . . . . . . . . . . . . . . . . . . . . . . . . . . . . 50
4 Evaluation of Test Results . . . . . . . . . . . . . . . . . . . . . . . . . . . . . . . . . . . . . . . . . 53
4.1 LVDT Data . . . . . . . . . . . . . . . . . . . . . . . . . . . . . . . . . . . . . . . . . . . . . . . . . . . 53
4.1.1 Deflection . . . . . . . . . . . . . . . . . . . . . . . . . . . . . . . . . . . . . . . . . . . . . . . 53
4.1.2 Shear Strain . . . . . . . . . . . . . . . . . . . . . . . . . . . . . . . . . . . . . . . . . . . . . 55
4.2 Strain Gauge Data . . . . . . . . . . . . . . . . . . . . . . . . . . . . . . . . . . . . . . . . . . . . . . 57
4.2.1 Longitudinal Strains . . . . . . . . . . . . . . . . . . . . . . . . . . . . . . . . . . . . . . . . . 57
4.2.2 Transverse Strains . . . . . . . . . . . . . . . . . . . . . . . . . . . . . . . . . . . . . . . . . 60
4.3 Zurich Data . . . . . . . . . . . . . . . . . . . . . . . . . . . . . . . . . . . . . . . . . . . . . . . 62
4.3.1 L1 . . . . . . . . . . . . . . . . . . . . . . . . . . . . . . . . . . . . . . . . . . . . . . . . . . . 63
4.3.2 L2 . . . . . . . . . . . . . . . . . . . . . . . . . . . . . . . . . . . . . . . . . . . . . . . . . . . 64
4.3.3 M1 . . . . . . . . . . . . . . . . . . . . . . . . . . . . . . . . . . . . . . . . . . . . . . . . . 65
4.3.4 M2 . . . . . . . . . . . . . . . . . . . . . . . . . . . . . . . . . . . . . . . . . . . . . . . . . . . 65
4.3.5 S1 . . . . . . . . . . . . . . . . . . . . . . . . . . . . . . . . . . . . . . . . . . . . . . . . . . 66
4.3.6 S2 . . . . . . . . . . . . . . . . . . . . . . . . . . . . . . . . . . . . . . . . . . . . . . . . . . . 67
4.4 Clinometer Data . . . . . . . . . . . . . . . . . . . . . . . . . . . . . . . . . . . . . . . . . . . . . 68
5 Comparison of Experimental and Analytical Results. . . . . . . . . . . . . . . . . . . . . . . . . . . 70
5.1 ACI Code . . . . . . . . . . . . . . . . . . . . . . . . . . . . . . . . . . . . . . . . . . . . . . . . . . . 70
5.2 CSA Code . . . . . . . . . . . . . . . . . . . . . . . . . . . . . . . . . . . . . . . . . . . . . . . . . . . . 71
5.3 Predicted Results . . . . . . . . . . . . . . . . . . . . . . . . . . . . . . . . . . . . . . . . . . . . . . 72
6 Conclusions and Recommendations . . . . . . . . . . . . . . . . . . . . . . . . . . . . . . . . . 73
6.1 Conclusions . . . . . . . . . . . . . . . . . . . . . . . . . . . . . . . . . . . . . . . . . . . . . . . . . . . 73
6.2 Recommendations for Future Work . . . . . . . . . . . . . . . . . . . . . . . . . . . . . . . . 74
A Material Properties . . . . . . . . . . . . . . . . . . . . . . . . . . . . . . . . . . . . . . . . . . . . . . 77
B Method for Estimating the Vertical Displacement . . . . . . . . . . . . . . . . . . . . . . . . . . 82
C Test Results . . . . . . . . . . . . . . . . . . . . . . . . . . . . . . . . . . . . . . . . . . . . . . . . . . . . . . . . . . 85
v

List of Tables
2.1 Specified Dimensions of Beams . . . . . . . . . . . . . . . . . . . . . . . . . . . . . . . . . . . . . . . 11
2.2 As-built Dimensions of Beams . . . . . . . . . . . . . . . . . . . . . . . . . . . . . . . . . . . . . . . . . 11
2.3 Concrete Compressive Strength . . . . . . . . . . . . . . . . . . . . . . . . . . . . . . . . . . . . . 23
2.4 Reinforcement Properties . . . . . . . . . . . . . . . . . . . . . . . . . . . . . . . . . . . . . . . . . . 25
2.5 Shear Forces at the End of Each Load Stage (kN) . . . . . . . . . . . . . . . . . . . . . . . 37
3.1 Summary of Test Results for Beams . . . . . . . . . . . . . . . . . . . . . . . . . . . . . . . 38
5.1 Shear Strength Predictions (kN) . . . . . . . . . . . . . . . . . . . . . . . . . . . . . . . . . . 72
vi

List of Figures
1.1 Shear Strength as a Function of ρt fyt/ fc′ (Lee and Hwang, 2010) . . . . . . . . . . . . . . . . 3
2.1 Sample View of the Specimen Geometry, Loading Condition, and Deflected Shape. . .6
2.2 Specified Cross Sectional Dimensions for the I-section of Each Beam (units: mm) . . .8
2.3 Longitudinal Dimensions, Shear Force Diagram, and Bending Moment Diagram for
Group L Beams . . . . . . . . . . . . . . . . . . . . . . . . . . . . . . . . . . . . . . . . . . . . . . . . . 9
2.4 Longitudinal Dimensions, Shear Force Diagram, and Bending Moment Diagram for
Group M (Left) and Group S (Right) Beams . . . . . . . . . . . . . . . . . . . . . . . . . . .10
2.5 Reinforcement Details at the Cross Sections for All Specimens . . . . . . . . . . . . . . . . 14
2.6 Typical Upper and Lower Reinforcement Cages . . . . . . . . . . . . . . . . . . . . . . . . 15
2.7 Reinforcement Cages . . . . . . . . . . . . . . . . . . . . . . . . . . . . . . . . . . . . . . . . . . . 16
2.8 Dimensions and Reinforcement Details for L1 . . . . . . . . . . . . . . . . . . . . . . . 17
2.9 Dimensions and Reinforcement Details for L2 . . . . . . . . . . . . . . . . . . . . . . . 18
2.10 Dimensions and Reinforcement Details for M1 and M2 . . . . . . . . . . . . . . . . . 19
2.11 Dimensions and Reinforcement Details for S1 and S2 . . . . . . . . . . . . . . . . . . 20
2.12 Formwork containing all Reinforcement Cages . . . . . . . . . . . . . . . . . . . . . . 21
2.13 Selected Pictures of Styrofoams . . . . . . . . . . . . . . . . . . . . . . . . . . . . . . . . 22
2.14 Stress Strain Relationship of One Cylinder Sample . . . . . . . . . . . . . . . . . . . . 24
2.15 Stress Strain Relationships of Reinforcement Steel (10M & 25M) . . . . . . . . . . . 25
2.15 Stress Strain Relationships of Reinforcement Steel (Dywidag & D4) . . . . . . . . . 26
2.17 Illustration of Loading Setup . . . . . . . . . . . . . . . . . . . . . . . . . . . . . . . . . . . . 27
2.18 Typical Test Setup (M1) . . . . . . . . . . . . . . . . . . . . . . . . . . . . . . . . . . . . . . 28
2.19 Arrangements of LVDTs and Clinometers . . . . . . . . . . . . . . . . . . . . . . . . 30
2.20 Arrangement of Zurich Targets for L1 and L2 . . . . . . . . . . . . . . . . . . . . . . 31
2.21 Arrangement of Zurich Targets for M1, M2, S1 and S2 . . . . . . . . . . . . . . . 32
2.22 Strain Gauge Layout for L1 and L2 . . . . . . . . . . . . . . . . . . . . . . . . . . . . . . 33
2.23 Strain Gauge Layout for M1, M2, S1 and S2 . . . . . . . . . . . . . . . . . . . . . . 34
2.24 Arrangement of LED Targets . . . . . . . . . . . . . . . . . . . . . . . . . . . . . 36
vii

viii
3.1 L1 Crack Diagrams for Selected Load Stages . . . . . . . . . . . . . . . . . . . . . . 41
3.2 L1 after Failure . . . . . . . . . . . . . . . . . . . . . . . . . . . . . . . . . . . . . . . . . 42
3.3 L2 Crack Diagrams for Selected Load Stages . . . . . . . . . . . . . . . . . . . . . . 43
3.4 L2 during Failure . . . . . . . . . . . . . . . . . . . . . . . . . . . . . . . . . . . . . . . . 44
3.5 L2 after Failure . . . . . . . . . . . . . . . . . . . . . . . . . . . . . . . . . . . . . . . . . 44
3.6 M1 Crack Diagrams for Selected Load Stages . . . . . . . . . . . . . . . . . . . . . . 45
3.7 M1 after Failure . . . . . . . . . . . . . . . . . . . . . . . . . . . . . . . . . . . . . . . . . 46
3.8 M2 Crack Diagrams for Selected Load Stages . . . . . . . . . . . . . . . . . . . . . . 47
3.9 M2 during Failure . . . . . . . . . . . . . . . . . . . . . . . . . . . . . . . . . . . . . . . . 47
3.10 M2 after Failure . . . . . . . . . . . . . . . . . . . . . . . . . . . . . . . . . . . . . . . . . 48
3.11 S1 Crack Diagrams for Selected Load Stages . . . . . . . . . . . . . . . . . . . . . . 49
3.12 S1 after Failure . . . . . . . . . . . . . . . . . . . . . . . . . . . . . . . . . . . . . . . . . 50
3.13 S2 Crack Diagrams for Selected Load Stages . . . . . . . . . . . . . . . . . . . . . . 51
3.14 S2 after Failure . . . . . . . . . . . . . . . . . . . . . . . . . . . . . . . . . . . . . . . . . 52
4.1 Deflections of Beams . . . . . . . . . . . . . . . . . . . . . . . . . . . . . . . . . . . . . . 54
4.2 Shear Force vs. Shear Strain (L1, M1, M2, and S1) . . . . . . . . . . . . . . . . . . 56
4.3 Shear Force vs. Shear Strain (S2) . . . . . . . . . . . . . . . . . . . . . . . . . . . . . 57
4.4 Longitudinal Strain (L1 and L2) . . . . . . . . . . . . . . . . . . . . . . . . . . . . . 58
4.5 Longitudinal Strain (M1, M2 and S1) . . . . . . . . . . . . . . . . . . . . . . . . . . 59
4.6 Longitudinal Strain (S2) . . . . . . . . . . . . . . . . . . . . . . . . . . . . . . . . . . . . 60
4.7 Transverse Strain . . . . . . . . . . . . . . . . . . . . . . . . . . . . . . . . . . . . . . . . . 61
4.8 L1 Zurich Strains and Web Deformations at Selected Load Stages . . . . . . . . . . 63
4.9 L2 Zurich Strains and Web Deformations at Selected Load Stages . . . . . . . . . . 64
4.10 M1 Zurich Strains and Web Deformations at Selected Load Stages . . . . . . . . . . 65
4.11 M2 Zurich Strains and Web Deformations at Selected Load Stages . . . . . . . . . . 66
4.12 S1 Zurich Strains and Web Deformations at Selected Load Stages . . . . . . . . . . 67
4.13 S2 Zurich Strains and Web Deformations at Selected Load Stages . . . . . . . . . . 67
4.14 Inclinations at West Reaction Support . . . . . . . . . . . . . . . . . . . . . . . . . . . 68

CHAPTER 1
Introduction
1.1 Motivations of Study As high strength concrete became more widely used nowadays, many studies were also performed on
examining the shear behavior of high strength reinforced concrete members. While high strength concrete
can certainly bring up the shear strength, its brittleness also increases compare to normal strength concrete.
With a stronger interface between the cement paste and the aggregate, the failure surface of high strength
concrete is smoother and thus lead to a weaker post-cracking shear resistance due to less aggregate
interlock (Cladera and Mari, 2005). Therefore, to re-evaluate the failure shear strength, most of the
previous studies involved testing members with either no shear reinforcement or minimum of shear
reinforcement. Not many tests, however, have been done in the past on high strength concrete beams that
are heavily reinforced in shear. While brittle failure that occurs due to lack of shear reinforcement is
dangerous, it is also believed that having too much stirrups can cause sudden shear failure when the
concrete crushes before stirrups yield (Lee and Hwang, 2010). Therefore, each of the two major concrete
design codes in North America: CSA A23.3-04 and ACI 318-08, imposes a shear strength upper limit that
is governed only by the concrete strength and the sectional geometry of a member.
In CSA A23.3-04, the shear design equations for reinforced concrete members with no prestress and axial
load are given below (units: mm/N):
Vc = 'β cf vwdb Where 'cf 8 MPa,
Vs = θcots
dfA vytv
Vn = Vc + Vs 0.25fc′ (1-1) vwdb
In ACI 318-08, the shear design equations for members with no prestress and axial load are given below
(units: in/lb):
Vc = (1.9 'cf +2500 wu
u
M
dV) dbw 3.5 'cf dbw (1-2)
Where 'cf 100 psi,
1

Vs = s
dfA ytv 8 'cf dbw (1-3)
For deep beams, Clause 11.7.3 states that:
Vn = Vc + Vs 10 'cf dbw (1-4)
As shown above, Eq. (1-1) and Eq. (1-4) set the shear strength upper limits for CSA A23.3-04 and ACI
318-08 respectively. Different from the CSA code, besides having a limit on the total shear resistance,
ACI also specifies the maximum shear that can be carried by the concrete and the stirrups separately, as
shown by Eq. (1-2) and Eq. (1-3).
Although previous research has shown that the shear provisions in ACI 318-08 is dangerously
unconservative for predicting members without stirrups (Collins et al. 2008), for members that already
contain more than minimum transverse reinforcements, however, it may be too conservative when
compared to CSA A23.3-04. Comparing the shear strength upper limits specified by both design codes, it
can be seen that they give similar results for low strength concrete, but for high strength concrete
structures, Eq. (1-4) from ACI results in much lower predictions than Eq. (1-1) from CSA, which is
expected since the controlling parameter in Eq. (1-4) is 'cf rather than fc′. An important issue with the
current ACI shear provisions is that they were developed based on the experimental data in the 1950’s and
1960’s (Xie, L. 2009) when the use of high strength concrete was very limited at that time. Hence, the
maximum value of Vn set by Eq. (1-4) was meant to apply for low strength and normal strength concrete
structures only (Russo et al, 2009). When applying to members constructed with high strength concrete,
Eq. (1-4) may become inadequate in predicting the actual shear capacity. Because the term 'cf could
significantly underestimate the shear that can be carried by transverse reinforcements, since stirrups
become more effective as the concrete strength increases (Cladera and Mari, 2005). Studies have also
shown that the shear strength of concrete beams could be increased further by putting more stirrups than
that allowed by Eq. (1-3) in ACI 318-08 (Lee and Hwang, 2010).
Lee and Hwang defined that a beam is under-reinforced in shear if the contribution of shear reinforcement
(ρt fyt) is less than the effective strength of concrete (vfc′), and the failure is triggered by yielding of the
shear reinforcement before crushing the concrete. When a beam is over-reinforced in shear, ρt fyt is greater
than vfc′, and failure occurs by web concrete crushing rather than yielding of shear reinforcement (Lee
and Hwang, 2010). In CSA A23.3-04, this reduction factor v is defined to be 0.25.
In the experiments done by Lee and Hwang, the shear behaviors of 18 RC beams were investigated. The
specimens were divided into four groups that differed by geometries and concrete strengths ranging from
2

26MPa to 84MPa, and the beams within each group had different shear reinforcement ratios ranging from
0.2% to 3%. All of their specimens failed after yielding of the stirrups despite some of the beams had
more than twice the maximum amount of shear reinforcement allowed by the ACI code, and the shear
strengths of these beams were also more than twice the values predicted by Eq. (1-4). The results from
Lee and Hwang’s experiments are summarized in Figure 1.1. It can be seen in Figure 1.1 that as the
concrete strength increases, the difference on the maximum allowed shear reinforcement ratio between
ACI and CSA also becomes greater, and some heavily shear reinforced specimens have reached strengths
far beyond the limit specified by Eq. (1-4).
Figure 1.1: Shear Strength as a Function of ρt fyt/ fc′ (Lee and Hwang, 2010)
(a) fc′ = 26.8MPa, (b) fc′ = 37.2MPa, (c) fc′ = 63MPa, (d) fc′ = 84.6MPa. The vertical lines in each
graph represent ρ t-max allowed by each code.
Besides testing the 18 RC beams, Lee and Hwang have also reviewed the failure mode of 178 RC beams
reported in a number of literatures. Based on all these results, they suggest that the maximum shear
reinforcement ratio can be as high as 0.2 fc′/ fyt before over-reinforced shear failure occurs, and the
maximum shear reinforcement limit in ACI 318-08 should be increased to account for high strength
concrete.
Although the research done by Lee and Hwang involved varying concrete strengths and shear
reinforcement ratios, all of their specimens had solid rectangular cross-sections, same shear span to depth
3
ratio (a/d = 3), and were tested under simply supported loading condition. Hence, their study is not
adequate to determine if ACI318-08 is also conservative for predicting the shear strengths of beams with
different geometry and loading conditions.
Compare to solid rectangular cross-section, beams constructed with I-sections can save materials and
have much less weight while maintaining most of the flexural capacity. This makes I-section a common
geometry used in many structural concrete members, such as transfer girders. However, one weakness of
I-beam is the significantly reduced shear strength, depending on the web width. To make I-section
structures not shear critical, the web shear reinforcement ratio is often expected to be much higher than
that of solid rectangular members. Therefore, the limit on maximum shear reinforcement ratio in
ACI318-08 could have a more negative influence on the application of I-section members in structures
that need to resist large shear forces. Although widely used in constructions, I-section is not preferred in
laboratory research for being much harder and more time consuming to build compare to solid rectangular
section. Thus, few experiments were conducted in the past with I-section specimens, and more data is
definitely needed to examine their shear behaviors.
The maximum shear reinforcement ratio suggested by Lee and Hwang is a function of fyt and fc′ only. It is
determined statistically based on the observed failure modes of 178 beams reported in previous literatures
and the 18 beams from their own experiment. However, one parameter that Lee and Hwang did not
include in their study was the shear span to depth ratio, which could have a large effect on the maximum
shear reinforcement ratio since stirrups become less effective as a/d ratio decreases. In the case of deep
beams when a/d is less than 2, shear transfers through arch action and the shear resistance will depend
primarily on the compressive strength of concrete. Transverse reinforcement has little influence on shear
strength except minimizing cracks widths and reducing deformations (Tuchscherer et al, 2011). Therefore
it is also necessary to have more experimental data on heavily shear reinforced beams covering a large
range of shear span to depth ratios.
Increasing the amount of shear reinforcement will make the structure more congested, which may become
a problem when casting the concrete. To ensure adequate consolidation in highly congested structures that
can not be easily reached by external vibrators, self-consolidating concrete is often used instead of normal
concrete because of its high fluidity. Compare to normal concrete, SCC has smaller amount of coarse
aggregates in order to achieve its workability. This fact will result in SCC having smoother cracked planes,
which can reduce the shear resistance of a member due to less aggregate interlock. Researches have
shown that with the same maximum coarse aggregate size, SCC that has lower coarse aggregate content
shows lower post-cracking shear resistance than normal concrete. By increasing the coarse aggregate size
from 12mm to 19mm, the pre-cracking strength of an SCC beam has decreased, but its ultimate shear
4

resistance has increased (Lachemi et al, 2005). Other studies had compared the shear performances of
SCC and conventional concrete on prestressed I-beams with varying a/d ratios. These beams were tested
under simply supported loading, and it was found that for concrete having the same compressive strength,
beams constructed with SCC had lower post-cracking stiffness and about 10% reduction in ultimate shear
resistance (Choulli et al, 2008). However, none of the past studies involved performing experiments on
SCC members that were heavily reinforced in shear.
1.2 Current Study This study will focus on some parameters that were not considered in experiments done in the past. The
shear behaviors of heavily reinforced I-beams constructed with high strength SCC will be examined. The
variables will be the transverse reinforcement ratio and the shear span-to-depth ratio. The primary
objective of this project is to show if using high strength concrete and more stirrups can bring up the shear
resistance of I-section beams above the upper limit specified by ACI 318-08. It is also expect to find out
what the maximum shear reinforcement ratio will be for the I-section beams before causing any
over-reinforced shear failures.
5

CHAPTER 2
Experimental Programme
2.1 Specimen Description
2.1.1 Specimen Design
This experimental Program involved destructive testing of six thin web I-section beams. Since the
objective was to study the shear behavior of these specimens, the loading condition was designed to
minimize the ratio of M/V so that shear strength would not be affected much by the flexural moment. This
was achieved through the anti-symmetric loading condition, which was used only among 8% of all past
shear tests (Collins et al., 2008). The anti-symmetric loading would result in a large shear force and zero
moment at mid-span of the beam. Therefore, the middle portion of a beam would be its test region. The
specimens and loading condition were designed as shown in Figure 2.1 below, which also includes the
expected deflected shape:
Figure 2.1: Sample View of the Specimen Geometry, Loading Condition, and Deflected Shape
The numerical labels in the Figure 2.1 indicate the following:
Region 1: This is the inner I-section located at the middle of each beam. It is also the test region where the
shear failure is expected to occur. The deflected shape of this region is expected to always have
double curvatures and a point of inflection at mid span.
Region 2: These are the two diaphragms that have the same width as the flanges and same thickness as the
6

load bearing plate. Instead of having a continuous I-section from Region 1 to 3, building two
diaphragms in between would prevent the flanges from collapsing under the two point loads P1.
Region 3: These are the two outer I-sections that have exactly the same cross sectional dimensions as
region 1, except they will always have more stirrups in order to ensure a much higher shear
resistance than the test region.
Region 4: These are the two solid rectangular blocks at the ends of each specimen that have the same
width as the flanges. There is also a 45o transition zone between region 3 and 4.
Note that for the rest of this thesis, phrases such as “shear force”, “reinforcement ratio”, “cracks”, etc.
all refer to the test region only, unless otherwise specified. The self weights of the specimens are
sufficiently small and thus will be ignored in all measurements and calculations.
The six beams were to be tested under the same loading condition. They were designed to have the same
cross sections but two different shear reinforcement ratios and three different shear span-to- depth ratios.
The longitudinal dimensions and reinforcement layouts were specifically chosen so that each beam would
fail in shear at its inner I-section. Details of beam geometries and reinforcements will be presented in
Section 2.12 and Section 2.13.
Ready-mixed self-consolidating concrete (SCC) with a specified 90-day strength of 70MPa was used for
designing all specimens. The actual concrete strength during the tests ranged between 86MPa and 88MPa,
which were typical for high strength concrete.
The name of each specimen was given by two characters that starting with a capital letter and ending with
a single digit number. The letter gives a qualitative description of the shear span-to-depth ratio, and the
number indicates the amount of shear reinforcement. For example: “M2” is the beam that has Medium
length (or Medium a/d ratio) and 2 times the amount of shear reinforcement allowed by ACI 318-08.
2.1.2 Specimen Dimensions
All six beams were designed with exactly the same cross sections. The specified height was h = 590 mm
and the width was bftop = bftop = 385 mm. The specified web thickness was bw = 80 mm. The only
geometric differences between the six beams were in the longitudinal dimensions. The beams were
divided into three groups with different lengths. Group L were the longest beams that had a shear span of
2220 mm. Group M were the medium length beams, and they had a shear span of 1278 mm. Group S
were the shortest beams with a shear span of 620 mm. The widths of load bearings were kept at a constant
of 150 mm for all beams, hence the thickness of all diaphragms was also 150 mm. The specified cross
7

sectional dimensions for the I-section part of each beam are shown in Figure 2.2.
Figure 2.2: Specified Cross Sectional Dimensions for the I-section of Each Beam (units: mm)
The specified longitudinal dimensions of Group L beams and their corresponding shear force and bending
moment diagrams are shown in Figure 2.3, and the ones for the other two groups are shown in Figure 2.4.
All shear force and bending moment diagrams are drawn by assuming the shear force in the test region
has a magnitude of V. Since every beam is symmetric about the mid-span, some of the dimensions are
only labeled on one half of the beam.
The specified dimensions of all beams are shown in Table 2.1. The as-built dimensions are shown in
Table 2.2 and were used in Chapter 5 for calculating the shear strength predictions using ACI and CSA
code.
8

L =
605
0
a =
222
0
V
1480
1162
525 67
8
150
2070
435
PW =
0.7
5VP E
= 1
.75V
RW =
1.7
5VR
E = 0
.75V
0.75
V0.
75V
S.F
.D (
kN)
B.M
.D (
kN*m
)
1.11
V
1.11
V
435
150
Fig
ure
2.3
: L
ongi
tud
inal
Dim
ensi
ons,
Sh
ear
For
ce D
iagr
am, a
nd
Ben
din
g M
omen
t D
iagr
am f
or G
rou
p L
Bea
ms
9

L =
358
2L
= 2
320
RW =
1.7
5VR
E = 0
.75V
PW =
0.7
5VPE
= 1
.75V
852
a =
127
8
150
608
317 46
911
28 V
0.75
VS
.F.D
(kN
)
B.M
.D (
kN*m
)
0.63
9V
0.75
V
0.63
9V
RE =
0.5
64V
PW =
0.5
64V
150
470
215 36
840
8
RW =
1.5
64V
PE =
1.5
64V
a =
620
550
V
S.F
.D (
kN)
B.M
.D (
kN*m
)
0.56
4V0.
564V
0.31
V
0.31
V
Fig
ure
2.4
: L
ongi
tud
inal
Dim
ensi
ons,
Sh
ear
For
ce D
iagr
am, a
nd
Ben
din
g M
omen
t D
iagr
am f
or G
rou
p M
(L
eft)
an
d G
rou
p S
(R
igh
t) B
eam
s
300
300
300
300
10
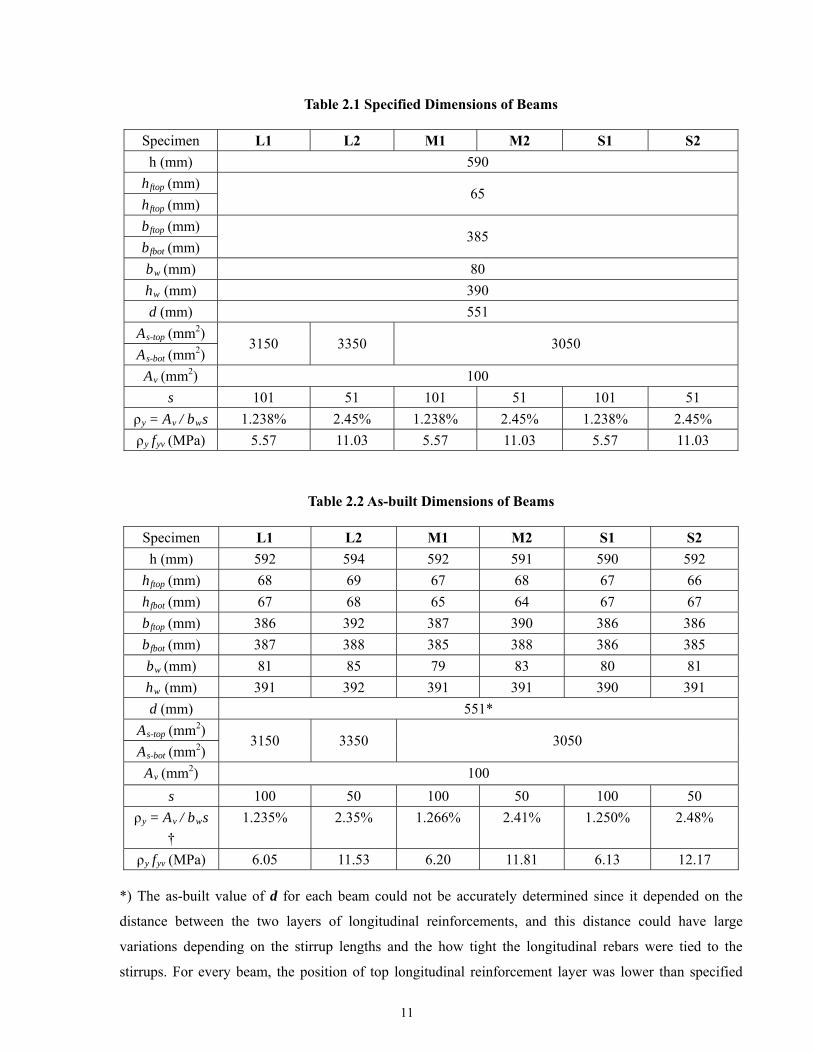
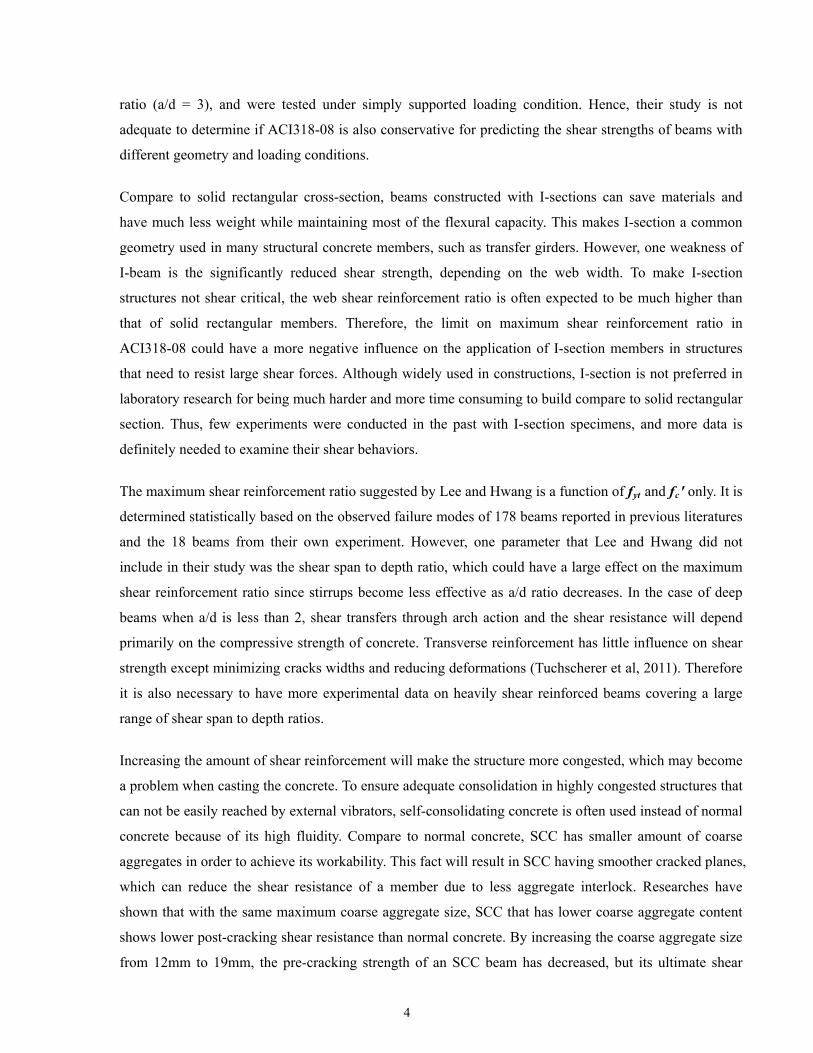
Table 2.1 Specified Dimensions of Beams
Specimen L1 L2 M1 M2 S1 S2
h (mm) 590
hftop (mm)
hftop (mm) 65
bftop (mm)
bfbot (mm) 385
bw (mm) 80
hw (mm) 390
d (mm) 551
As-top (mm2)
As-bot (mm2) 3150 3350 3050
Av (mm2) 100
s 101 51 101 51 101 51
ρy = Av / bws 1.238% 2.45% 1.238% 2.45% 1.238% 2.45%
ρy fyv (MPa) 5.57 11.03 5.57 11.03 5.57 11.03
Table 2.2 As-built Dimensions of Beams
Specimen L1 L2 M1 M2 S1 S2
h (mm) 592 594 592 591 590 592
hftop (mm) 68 69 67 68 67 66
hfbot (mm) 67 68 65 64 67 67
bftop (mm) 386 392 387 390 386 386
bfbot (mm) 387 388 385 388 386 385
bw (mm) 81 85 79 83 80 81
hw (mm) 391 392 391 391 390 391
d (mm) 551*
As-top (mm2)
As-bot (mm2) 3150 3350 3050
Av (mm2) 100
s 100 50 100 50 100 50
ρy = Av / bws
†
1.235% 2.35% 1.266% 2.41% 1.250% 2.48%
ρ f (MPa) 6.05 11.53 6.20 11.81 6.13 12.17 y yv
*) The as-built value of d for each beam could not be accurately determined since it depended on the
distance between the two layers of longitudinal reinforcements, and this distance could have large
variations depending on the stirrup lengths and the how tight the longitudinal rebars were tied to the
stirrups. For every beam, the position of top longitudinal reinforcement layer was lower than specified
11

due to self weight. Furthermore, even within the same reinforcement layer, every rebar had a different
height than others. While the specimen depths measured from the top surface to bottom rebar layer were
close to 551 mm, the ones measured from the bottom surface to top rebar layer were as many as 5 to 10
mm less than the specified value. For consistency, d will be taken as the specified value of 551 mm in all
calculations since it will give close approximations in predicted shear strength.
†) According to the as-built dimensions, every beam had a different shear reinforcement ratio, which was
very close to the specified value. Hence, for the ease of discussions, unless speaking about a particular
specimen, the specified shear reinforcement ratio shown in Table 2.1 will be used when referring to
several beams together.
2.1.3 Reinforcement Layout
The six specimens were designed to have two different transverse reinforcement ratios. Within each group,
one beam had the maximum amount of shear reinforcement allowed by ACI 318-08, and the other one
had twice the amount as the first beam. These ratios were initially calculated based on a specified concrete
strength of 70 MPa and stirrup yield strength of 450 MPa. Using the specified cross sectional dimensions
shown in Table 2.1, the maximum shear reinforcement ratio given by ACI 318-08 was 1.238%, which
was the quantity used when constructing the specimens. With a web width of 80 mm, the cross section of
every beam had only one single leg 10M stirrup in order to maintain adequate clear cover. The spacing of
stirrups for the specified 1.238% shear reinforcement was 101 mm, and the spacing was 51 mm for
doubling the amount of stirrups. The stirrups were more closely spaced in the outer I-sections of each
beam to ensure that the shear failure would first occur in the test region. In order to bring up the shear
reinforcement ratio, lots of stirrups were also put in the end blocks of each beam although they have much
higher shear resistance than the I-section parts. Stirrups at the two end blocks were scattered across the
entire width, and their spacing along each longitudinal bar was twice of that in the test region. The
reinforcement layout of every beam was symmetrical about the mid-span.
The longitudinal reinforcements in the two flanges of each beam were designed to provide sufficient
flexural capacity to prevent flexural failure from occurring before the beam fails in shear. The longitudinal
reinforcements for group M and group S beams were identical, which consisted of six 25M deformed bars
in each flange. Stronger longitudinal rebars were used for group L beams as they would be subjected to
higher bending moments. For specimen L1, each reinforcement layer contained four 25M deformed bars
and two 1″ Dywidag bars, which had specified yield strength of 800 MPa. For L2, six 1″ Dywidag bars
were used in each flange. A 10M longitudinal bar was put at the mid-height of each beam on the south
side of the stirrups to provide better crack control.
12

To hold together the six rebars within each layer of longitudinal reinforcements during caging, cross ties
were used for every beam. Since the reinforcement cages were very dense due to the high reinforcement
ratio in both longitudinal and transverse directions, small D4 wires were chosen for the cross ties and only
a few of them were placed at the two flanges in order to allow better flow of concrete during casting and
to maintain sufficient clear cover. This decision was later proved to be very mistaken, since the few
amount of cross ties were not able to reinforce the flanges from longitudinal splitting. This issue will be
discussed in detail in the next chapters.
The reinforcement details for the cross sections of each beam are shown in Figure 2.5, and the full
reinforcement drawings are shown from Figure 2.8 to Figure 2.11 that include both side view and top
view of the reinforcement layout. The top view shows the positions of D4 wires and also the detailed
arrangements of stirrups in the end blocks. Stirrups are also drawn to scale in the top view of every beam
instead of being represented by a single line.
The reinforcement cage for each beam was constructed separately in two parts. The upper part was a “T”
shaped cage that included the top layer of six longitudinal rebars, web stirrups, and one longitudinal bar at
the bottom that hang on the stirrups. The stirrups were always tied to the third longitudinal bar from south
side of the beam. The lower part of reinforcement cage contained the other five longitudinal rebars in the
bottom reinforcement layer. The entire cage was assembled by first putting its lower part at bottom of the
formwork, and then put the upper part on top. Stirrups for the end blocks were then slid into the beam
from the two ends. This method of assembly made the two diaphragms to be regions that have the lowest
transverse reinforcement ratio for each beam, because styrofoams that were used to create the outer
I-sections blocked the passages for sliding stirrups into the diaphragms.
13

10M
25M
25M
D4
10M
25M
25M
D4
1'' Dywidag
1'' Dywidag
10M
D4
1'' Dywidag
1'' Dywidag
63
56
61
69
57
1542
39 40
39
551
L1
Rebar positionsof all beams
L2
M1, M2, S1, S2
N S
Figure 2.5: Reinforcement Details at the Cross Sections for All Specimens
14

Upper reinforcement cage
Lower reinforcement cage
Figure 2.6: Typical Upper and Lower Reinforcement Cages
*Note that the 10M cross bar here was not a cross tie, it was simply used to hold the longitudinal
bars at the right positions when they were put into the formwork.
Places with white tapes are where the strain gauges were mounted.
StirrupsLongitudinal
Reinforcement
Cross Ties
North
South
Cross Ties
10M Cross Bar*
15
L2
M1
M2
S1 S2
Figure 2.7: Reinforcement Cages
16

L =
605
0
1480
1162
525 67
8
150
150
435
1110
1035
390
460
590
727
10
M@
10
11
0M
@1
011
0M
@75
6000
112
132
116
101
Top
Vie
w
Sid
e V
iew
4-2
5M
& 2
-1''
Dyw
ida
g
64
Fig
ure
2.8
: D
imen
sion
s an
d R
ein
forc
emen
t D
etai
ls f
or L
1
17

L =
605
0
1480
1162
525 67
8
150
150
435
1110
1035
390
460
590
727
Top
Vie
w
Sid
e V
iew
6000
7511
6
6-1
'' D
ywid
ag
2418
7
46
62
10M
@51
10M
@51
51
10M
@40
Fig
ure
2.9
: D
imen
sion
s an
d R
ein
forc
emen
t D
etai
ls f
or L
2
18

5176
L = 3582
852
150608317
469
150
564
639
390 460 300308590
10M@10110M@101 10M@75
129100 115 101
6-25M
3532
10M@51 10M@4010M@51
3532
60 90
87
26
6-25M
M1SideView
M1TopView
M2SideView
M2TopView
Figure 2.10: Dimensions and Reinforcement Details for M1 and M2
19

L = 2320
150 215
368408
550
150
300
107390 590460
10M@101 10M@7510M@101
75120103 101
65 14169
2270
2270
5156
10M@51 10M@51 10M@51
6-25M
6-25M
S1SideView
S1TopView
S2SideView
S2TopView
Figure 2.11: Dimensions and Reinforcement Details for S1 and S2
20

2.1.4 Formwork The formwork was constructed to allow all six specimens to be casted at once. The base was made by two
layers of interlacing plywood with four slots screwed onto it. Two of the slots were used for casting the
two long beams and the other two were built to cast the two medium and short beams. Each slot was
separated by a wall made of two layers of marine plywood with a 2” by 4” wood in between. Considering
that the formwork might be used for more than a single cast, marine plywood was chosen instead of
regular plywood in order to minimize the damages done by concrete during casting and curing. To prevent
the formwork from collapsing under the hydraulic pressure of unsettled concrete, its two sides were held
with diagonal struts spaced at 40 to 50 cm that were cut from 2” by 4” wood.
Another major component of the formwork was the styrofoams. They were used to create the I-sections
parts of all beams. The flange and web widths of each beam were designed such that when three layers of
styrofoams were pasted on each side of a casting slot, the middle gap in between was equal to the web
width. After cutting the tilted edges of styrofoams using a table saw, three styrofoam layers were pasted
together using normal spray glue to form a bundle, which was then wrapped around using adhesive
kitchen shelf paper to prevent it from falling apart during casting. The bundled styrofoams were attached
to the slot walls of formwork using standard construction glue. Each beam required six bundles to form its
inner I-section and the two outer I-sections, and before these styrofoams could be attached to the
formwork, the lower reinforcement cage must be put at bottom of the formwork first.
Figure 2.12: Formwork containing all Reinforcement Cages
21

Bundled Styrofoams Attached to the Slot Wall
Styrofoams for the long beams.
Small foam blocks used to
hold the bundled styrofoams
from sliding downwards
when the glue was not dried
Figure 2.13: Selected Pictures of Styrofoams
2.2 Material Properties 2.2.1 Concrete All specimens were casted at the same time using ready mixed high strength self consolidating concrete
with a specified strength of 70 MPa. Regular concrete could not be used because the poker vibrators were
not able to fit into the dense reinforcement cages. The casting process was finished in less than 90 minutes,
and the flowability of SCC did not have much decrease during that interval. Although SCC were meant
not be vibrated, it was still difficult for the air bubbles at the bottom flange to come out during casting.
Therefore, the casting of each beam was done in two steps by first pouring concrete only up to the mid
height of each beam, then filling up the rest. This allowed more time for the air bubbles to float up from
bottom of the beam.
The specimens were moist-cured using damp burlap. A thin layer of plastic sheet was covered on top of
the burlap to prevent moist loss. The moist curing lasted a week, and the formwork was then disassembled,
22

leaving the specimens in ambient environment. For every cured beam, lots of voids were found at the
surfaces that had contact with the styrofoam, including the web and the tapered inner flanges surfaces.
The largest of these voids had nearly 2cm diameter and more than 5mm depth, but they did not appear to
have any influence on the specimen behaviors during testing. There were few voids at parts of the beams
that had direct contact with the marine plywood such as the end blocks and two sides of the flanges. The
only concern was a noticeable honeycomb in the upper flange at the outer I-section of specimen S2. After
repaired using hydrostone that had strength of at least 40 MPa, the honeycomb region did not affect the
specimen behavior either.
The concrete strength was measured using standard cylinder compression test. Three or four cylinders
with 6″ diameter and 12″ height were tested each time to measure the concrete strength at a particular age.
The cylinder strengths were determined on 3 days and 7 days after the cast and also on the day after every
beam test, but the 28-day concrete strength was not available. The cylinder tests were performed using
three different equipments, and the loading rate was controlled at the standard 4.5 kN/s every time.
The stress-strain relationship of the concrete was only determined after all beams had been tested, but it
was reasonable to assume that Ec was almost constant throughout all six beam tests since the concrete
strengths had only slight changes between the first and last beam test. The concrete stress strain plot is
shown in Figure 2.14, and the detailed cylinder strength results are listed in Table 2.3.
Table 2.3 Concrete Compressive Strength
At Test (listed in chronological order of testing)
3-day 7-day M1 M2 S2 S1 L1 L2
Strength
(MPa) 44.3 62.6 86.0 86.2 85.0* 86.8 88.4 88.4
Ec (MPa) † — — 37700 37700 37500 37800 38100 38100
*) S2 was test after M2, so theoretically its concrete strength should be greater or equal to that of M2. The
cylinders for these two beams were not tested using the same equipment, which indicate the smaller
strength result for S2 might be due to the deviations between different equipments or the defects in
cylinders. Therefore, it is reasonable to assume that the concrete strength and Ec for S2 were equal to that
of M2.
†) Ec is computed using the equation Ec = 3320 'cf + 6900 for normal weight concrete (Collins and
Mitchell, 1997). Ec is measured to be 39500 MPa by averaging the slopes of the stress-strain plots for all
four cylinder tests, and it is sufficiently close to the calculated value for specimen L2.
23

0
20
40
60
80
100
0.0 0.5 1.0 1.5 2.0 2.5
Strain (mm/m)
Stress (MPa)
Figure 2.14: Stress Strain Relationship of One Cylinder Sample
Note that when measuring the stress strain relationship, the concrete cylinder was not tested to failure in order
to prevent damages to the equipment.
2.2.2 Reinforcement There were two types of longitudinal reinforcements used: the 25M deformed bar (As=500 mm2) and 1″
dywidag bar (As=550 mm2). The 25M bars had sudden decrease in elastic modulus before reaching the
yield plateau. The cause of this strange mechanical behavior is unknown, but it is reasonable to take fy
and εy as values corresponding to the start of yield plateau and calculate Es based on the stress-strain
relationship before the sudden decrease in stiffness.
There was only one type of reinforcement used for the stirrups, which was the 10M deformed bar
(As=100 mm2). However, these bars came in two separate shipments. For consistency, stirrups in the test
regions of all beams were cut from the bars that came from the first shipment only. Stirrups in other
regions of each specimen contained mixed bars from both shipments.
D4 wires (As≈30 mm2) were used for the flange cross ties. Breaking at small ultimate strain, the D4 wires
were much more brittle than other rebars.
The strength of reinforcement steel was determined through standard coupon test of 18″ long rebar
samples. For each type of reinforcement, the three coupon test samples gave consistent results. Therefore
24

the stress-strain relationship of only one sample is plotted in Figure 2.15 and Figure 2.16. The full plots
that include all test samples are shown in Appendix A. The results of coupon tests are summarized in
Table 2.4.
Table 2.4 Reinforcement Properties
Size db
(mm)
As
(mm2)
fy
(MPa)
fu
(MPa)
εy
(mε)
εu
(mε)
Es
(MPa)
D4 3 30 561 665 2.94 27 190931
10M (TR) 11.3 100 490 580 2.49 164 196540
10M (NTR) 11.3 100 500 611 2.50 161 200000
25M 25.2 500 460 583 3.13 130 191920
Dywidag 1 inch 550 966 — 4.74 — 203597
10M (Test Region)
0
100
200
300
400
500
600
0.00 0.05 0.10 0.15 0.20 0.25
Strain (mm/mm)
Str
ess
(MP
a)
10M (Non Test Region)
0
100
200
300
400
500
600
0.00 0.05 0.10 0.15 0.20
Strain (mm/mm)
Str
ess
(MP
a)
25M
0
100
200
300
400
500
600
0.00 0.05 0.10 0.15 0.20 0.25
Strain (mm/mm)
Str
ess
(MP
a)
25M (magnified plot)
0
100
200
300
400
500
600
0 2 4 6
Strain (mm/m)
Str
ess
(MP
a)
Drop in Es
8
Figure 2.15: Stress Strain Relationships of Reinforcement Steel (10M & 25M)
25

1" Dywidag
0
200
400
600
800
1000
1200
0 5 10 15 20 25 30
Strain (mm/m)
Str
ess
(MP
a)
D4
0
100
200
300
400
500
600
700
0 10 20 30 40 50
Strain (mm/m)
Str
ess
(MP
a)
Figure 2.16: Stress Strain Relationships of Reinforcement Steel (Dywidag & D4)
Note that the 1″ dywidag bars were not tested to failure due to the concern that instantly dropping the
applied force from more than 550 kN to zero could damage the coupon test equipment.
2.3 Test Setup All specimens were to be tested under downward monotonic loading using the Baldwin machine that had
1.2 million pound capacity. Since all beams were designed to have anti-symmetric loading, two point
loads and two reaction supports were required for each test. A spreader beam was used to distribute the
load from of Baldwin machine into two vertical point loads. The spreader beam was tightly clamped onto
the spherical head of Baldwin so that it did not need to be moved separately when switching specimens
between tests. There were two different spreader beams used among the six tests, one for M1, M2, S1,
and S2, and a larger one with higher flexural capacity was used for L1 and L2 because of a longer
distance between the two point loads. There was no load cells placed between the spreader beam and
specimen, because the point loads might exceed the maximum capacity of available load cells and cause
damage.
Every specimen had uneven surfaces due to the limited accuracy of casting. Therefore, a bag containing
plaster was placed between the beam and load/support bearing plate. The plaster was hardened several
minutes after mixing with water, but if they were not mixed properly, some water would be squeezed out
of the plaster bag under heavy load and cause rusting of the steel floor.
Since all beams were to be statically determinate, only the west reaction support was set up as a pin, the
26

east support and two point loads were all set up as rollers.
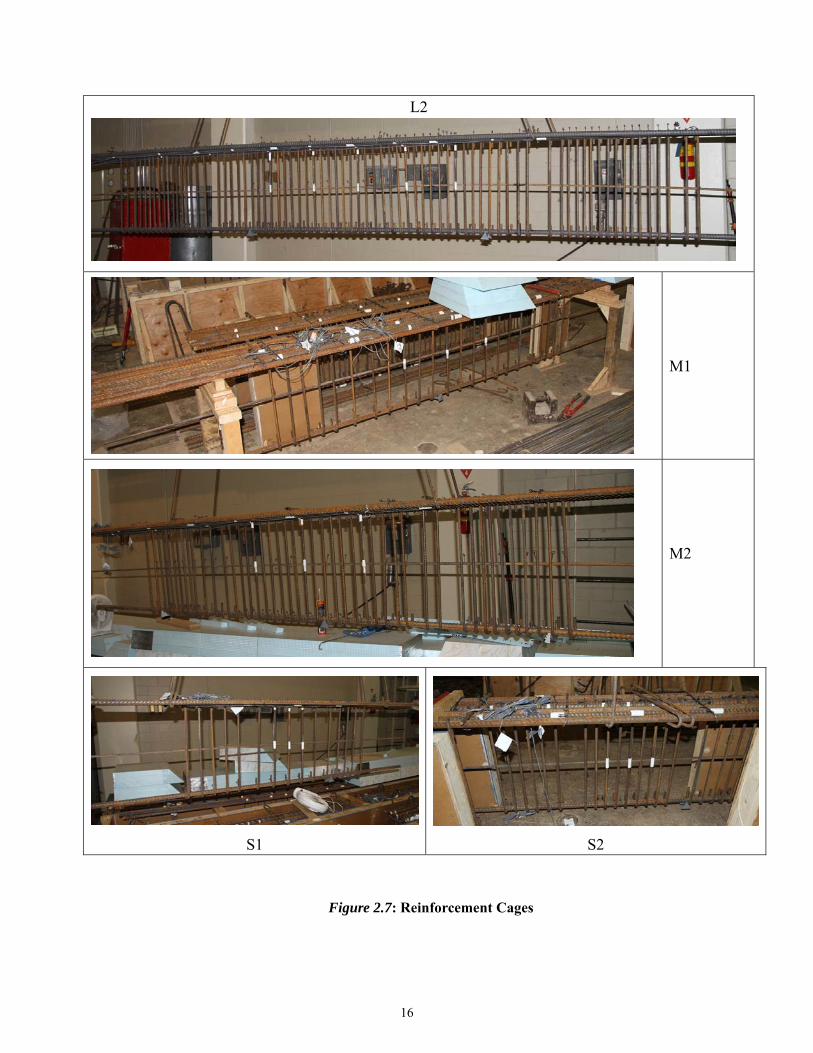
Lateral supports were not used in any of the experiments since the height to width ratio of all specimens
were small enough that the possibility of lateral buckling could be neglected. The detailed loading setup is
illustrated in Figure 2.17. Photos taken at both the north and south side of a specimen ready for test are
shown in Figure 2.18.
Spreader Beam
Roller Roller
RollerPin
Baldwin Head
Loading from Baldwin
West East
Figure 2.17: Illustration of Loading Setup
27
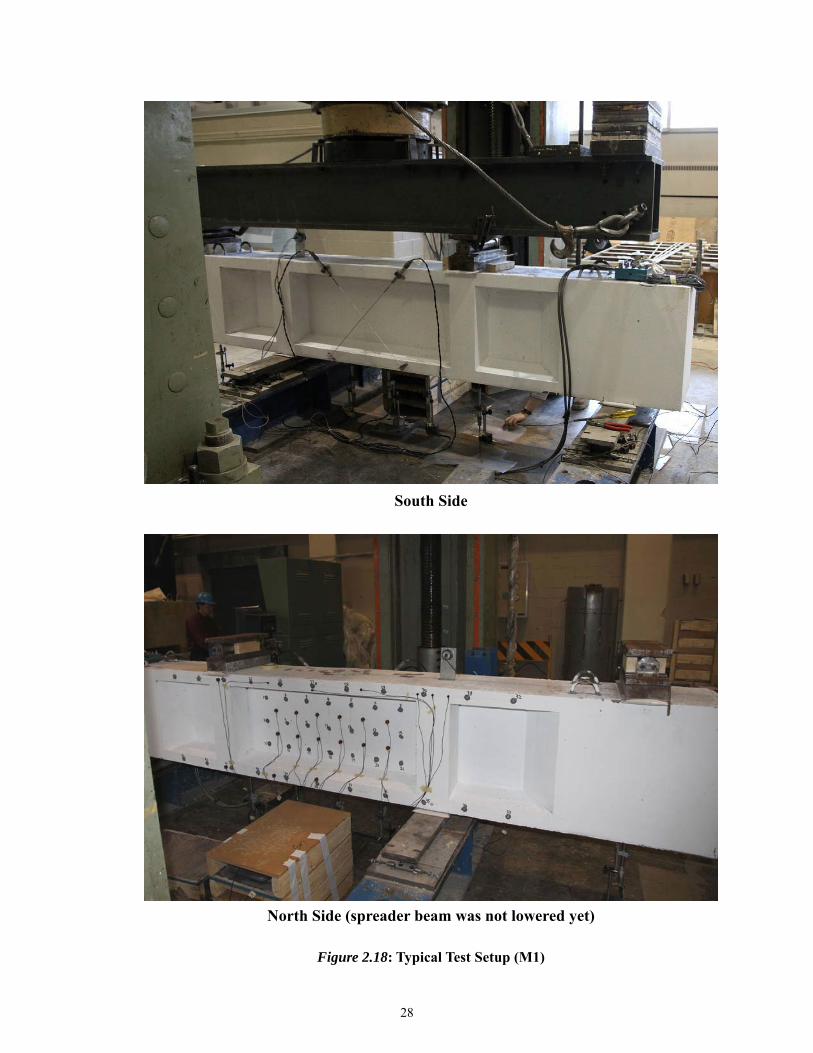
South Side
North Side (spreader beam was not lowered yet)
Figure 2.18: Typical Test Setup (M1)
28

2.4 Instrumentation 2.4.1 LVDTs The vertical deflection of each beam was continuously recorded by five vertical LVDTs with ±25 mm
measurement ranges that were centered at mid-width of the beam. Two of them were placed directly
under the two point loads (named WLD and ELD), the other three were placed at 1/4, 1/2, and 3/4
positions of the test region (named TCW, TC, and TCE). For specimens L1 and L2, four additional
vertical LVDTs were used to monitor displacements of the two reaction supports at two sides of the beam.
Each one of them was placed on top of an aluminum plate that was mounted on the beam at about 5 cm
above the support. No support LVDTs were used for the other four specimens since it was thought that the
LED targets mounted at the supports would provide the required displacement data, but in fact they did
not (to be explained in Section 2.4.5).
All vertical LVDTs were fixed to the steel floor using strong magnetic bases. For M1, M2, S1, and S2, the
shear deformation of test region was measured with two diagonal LVDTs installed on the flanges (named
TW-BE and TE-BW). They crossed each other at 90o at mid-span of the beam. There were four diagonal
cross LVDTs used for L1 because of a longer shear span. Two of them were installed at a quarter clear
span of test region from the west diaphragm, and the other two were at the same distance from east
diaphragm. Specimen L2 had no diagonal LVDTs at all because the external flange clamps would
intercept the LVDT passages.
2.4.2 Clinometers
Two clinometers were used for every test to measure rotations of the west reaction support. They were
mounted back to back on an aluminum plate, which was fixed on top of the west diaphragms centered at
mid-width. The two clinometers were most unstable among all instruments, and they produced completely
noisy data for L1 and M2. The detailed setups including all LVDTs and clinometers are shown in Figure
2.19.
29

TC
WT
CE
TC
ELD
WL
DT
CW
TC
ET
CE
LDW
LD
TC
WT
CE
TC
ELD
WL
D
SW
SE
Clin
om
eter
Clin
om
eter
Clin
om
eter
W-T
E-B
WW
-TW
-BE
E-T
E-B
WE
-TW
-BE
TE
-BW
TW
-BE
TE
-BW
TW
-BE
51
81
03
55
18
19
31
18
19
31
18
55
05
50
35
72
82
28
23
57
85
28
52
56
45
64
23
52
35
59
35
18
51
85
93
14
80
14
80
L1
S1
S2
M1
M2
Fig
ure
2.1
9: A
rran
gem
ents
of
LV
DT
s an
d C
lin
omet
ers
(N
ote
that
the
arra
ngem
ents
for
L2
are
the
sam
e as
thos
e fo
r L
1 ex
cept
hav
ing
no d
iago
nal L
VD
Ts)
30

2.4.3 Zurich Targets Electronic Zurich gauges with a precision of ±1μm were used in all experiments to measure deformations
at the specimen surfaces. For each beam, there were three rows of targets on the web, and the number of
columns was proportional to the shear span. Grids of 141 mm by 141 mm were used for web Zurich
targets on all beams. There were also targets mounted at one side of each flange. They covered through
the entire test region and extended to the outer I-sections so that more strain data could be obtained at the
extreme tension and compression faces of the beam. The spacing between flange Zurich targets was 141
mm for the two short beams and 200 mm for other four beams. The locations of flange Zurich targets
were an exception for Specimen L2. Instead of being mounted at the side faces, they were pasted onto the
tapered sections of flanges because the external clamps had blocked the pathways of these targets. All
Zurich targets were mounted on the north face of each beam and their positions were symmetrical about
the mid-span and mid-height.
21 3 4 5 6 7 98 10 11 12 13
1514 16 17 18 19 20 2221 23 24 25 26
2827 29 30 31 32 33 3534 36 37 38 39
41 4240 43 44 45 46 47 48 49 50 5554535251 56
72 7173 70 69 68 67 66 65 64 63 5859606162 57
41 4240 4344 45 46 47 48 49 50
5554535251
56
72 7173 7069 68 67 66 65 64 63
5859606162
57
6070
43 53
L1
L2
Grid Size:141mm × 141mm
Gauge Length inFlange: 200mm
Grid Size:141mm × 141mm
Gauge Length inFlange: 200mm
21 3 4 5 6 7 98 10 11 12 13
1514 16 17 18 19 20 2221 23 24 25 26
2827 29 30 31 32 33 3534 36 37 38 39
Figure 2.20: Arrangement of Zurich Targets for L1 and L2
31

2322 25 26 27 28 29 30 31 32
4243 40 39 38 37 36 34 3341
98 10 11 12 13 14
1615 17 18 19 20 21
21 3 4 5 6 7
21 3
54 6
87 9
1110
12
14 1513 1816 17
2019 21 23 2422 27
25
26
35
24
Grid Size:141mm × 141mm
Gauge Length inFlange: 200mm
M1M2
Grid Size:141mm × 141mm
Gauge Length inFlange: 141mm
S1S2
Figure 2.21: Arrangement of Zurich Targets for M1, M2, S1 and S2
2.4.4 Strain Gauges Strain Gauges were mounted at both the top and bottom longitudinal reinforcements and also at the
stirrups. They were attached onto the smoothened rebar surfaces using ductile CNY glue that could allow
extra deformations after been dried. The amount of strain gauges depended on the lengths of shear span.
There were a total of 15 strain gauges used for each of the two long beams and 9 gauges for each medium
and short beam. Only stirrups located within the test regions were mounted with strain gauges at the mid
height. There was always one gauge mounted on the stirrup at mid-span and the others were positioned
symmetrically about this center stirrup. The strain gauges for longitudinal reinforcements were only
instrumented on one of the six rebars, and that was always the second bar from north at the top layer and
second bar from south at the bottom. For each longitudinal reinforcement layer, there were two strain
gauges mounted at locations of the two diaphragms, and the other gauges were distributed within the test
region. All strain gauge positions were identical for the two beams within each length group.
The strain gauges were named with a letter followed by a number, and the number was sequenced from
west to east. For example, “T3” indicated the third strain gauge at top longitudinal rebar counted from the
west and “B5” was the fifth bottom longitudinal gauge from west. The stirrups were denoted as “C”
instead of “S” in order to avoid confusions with names of the two short beams. The detailed layouts of
strain gauges are shown in Figure 2.22 and Figure 2.23 with the directions labeled. Note that these
figures do not include parts of specimens that did not have strain gauges.
32
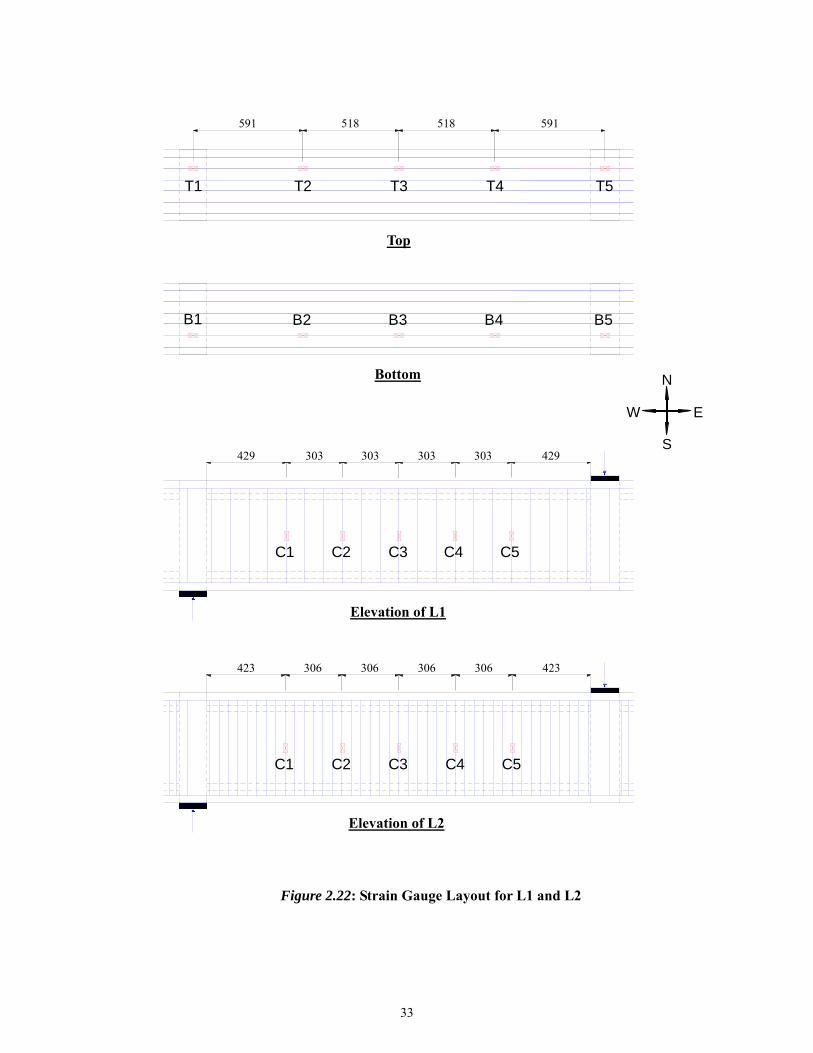
T1 T2 T3 T4 T5
B1 B2 B3 B4 B5
C1 C2 C3
591 518 591518
C1 C2 C3 C4 C5
C5C4
429 303 303 429303303
423 306 306 423306306
Top
Bottom
EW
S
N
Elevation of L1
Elevation of L2
Figure 2.22: Strain Gauge Layout for L1 and L2
33

T1 T2 T3
B1 B2 B3
C1 C2 C3
C1 C2 C3
T1 T2 T3
B1 B2 B3
C1
C2
C3
C1
C2
C3
134 101 134101
133 102 133102
310 310
261 303 261303
258 306 258306
639 639
Top of M1 & M2 Top of S1 & S2
Bottom of M1 & M2 Bottom of S1 & S2 N
S
W E
Elevation of M1 Elevation of S1
Elevation of M2 Elevation of S2
Figure 2.23: Strain Gauge Layout for M1, M2, S1, and S2
34
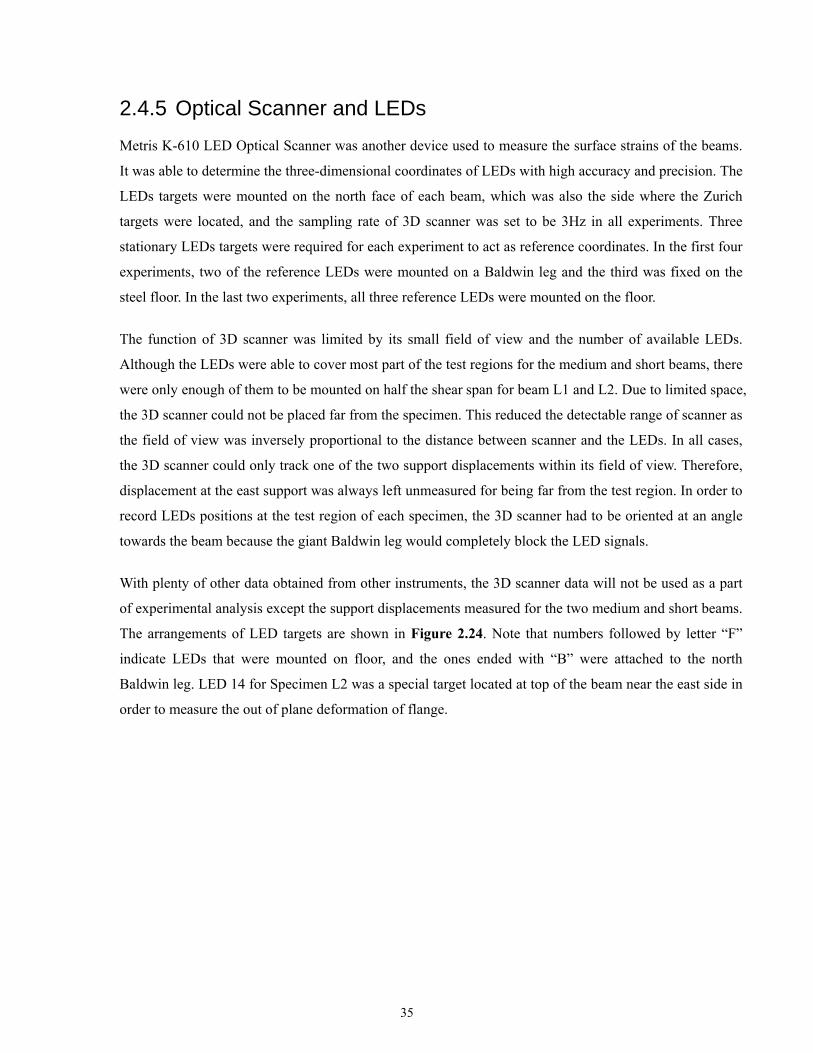
2.4.5 Optical Scanner and LEDs Metris K-610 LED Optical Scanner was another device used to measure the surface strains of the beams.
It was able to determine the three-dimensional coordinates of LEDs with high accuracy and precision. The
LEDs targets were mounted on the north face of each beam, which was also the side where the Zurich
targets were located, and the sampling rate of 3D scanner was set to be 3Hz in all experiments. Three
stationary LEDs targets were required for each experiment to act as reference coordinates. In the first four
experiments, two of the reference LEDs were mounted on a Baldwin leg and the third was fixed on the
steel floor. In the last two experiments, all three reference LEDs were mounted on the floor.
The function of 3D scanner was limited by its small field of view and the number of available LEDs.
Although the LEDs were able to cover most part of the test regions for the medium and short beams, there
were only enough of them to be mounted on half the shear span for beam L1 and L2. Due to limited space,
the 3D scanner could not be placed far from the specimen. This reduced the detectable range of scanner as
the field of view was inversely proportional to the distance between scanner and the LEDs. In all cases,
the 3D scanner could only track one of the two support displacements within its field of view. Therefore,
displacement at the east support was always left unmeasured for being far from the test region. In order to
record LEDs positions at the test region of each specimen, the 3D scanner had to be oriented at an angle
towards the beam because the giant Baldwin leg would completely block the LED signals.
With plenty of other data obtained from other instruments, the 3D scanner data will not be used as a part
of experimental analysis except the support displacements measured for the two medium and short beams.
The arrangements of LED targets are shown in Figure 2.24. Note that numbers followed by letter “F”
indicate LEDs that were mounted on floor, and the ones ended with “B” were attached to the north
Baldwin leg. LED 14 for Specimen L2 was a special target located at top of the beam near the east side in
order to measure the out of plane deformation of flange.
35

1 2 3 4 5 6
7
1314 15 16 17
2221 20 19 18
23 F24 F25 F
23 F24 F 22 F
1315 16 17
14
21 2019
18
8 9 10 11 12
259 259
1 2 3 4 5 6
7 8 9 10 11 12
260 141
239 294 112
324 317 283 112
259 259
391
L1
L2
12 3
4
5 F 6 F
9 10 11 12 13
15 16 17
14
201918
21 F
23 2422 2526
27
12 3 4
5
6
11 12 13
1514 16
2120 22
1817 19
9 B 10 B
7 F8 F
7 B 8 B
282 282
117 117118118
282 282
212 141
235 71
M1M2
S1S2
Figure 2.24: Arrangement of LED Targets
36

2.5 Test Arrangement and Procedure Each of the six experiments was scheduled to last for one working day. The first thing to do on the day of
test was to zero instruments that included LVDTs, clinometers, and strain gauges. Two sets of Zurich
readings were also taken to represent initial state of the beam so that all the Zurich strains would be
calculated based on these readings. After calibrating all equipments, the Baldwin head with spreader beam
attached was then lowered to slightly touch the top of specimen without applying any force. The extra
constrains on the two load points and reaction supports were then removed so that only one pin and three
rollers remained.
The 3D scanner started recording data at the same time as the Baldwin started loading. The load rate was
controlled to be around 1kN/s in all tests, but this number always decreased drastically as the beam
approached its peak load. Each test had between 4-7 load stages. For all beams except L1, the increment
during load stages was around 250kN Baldwin force before reaching an applied load of 1000kN, and the
increment was halved after this point until failure. For L1, the increment was taken to around 200kN
Baldwin force. After reaching the end of a load stage, the applied load was reduced by around 10% for the
safety of manual measurements and to prevent excessive creep. Between load stages, updated crack traces
and Zurich readings were done, and the 3D scanner was stopped immediately after the 10% reduction in
load. However, the LVDTs, clinometers, and strain gauge readings were continuously recorded by the data
acquisition system at even between load stages. One set of readings were taken whenever there was a
10kN difference in Baldwin force or a 0.1 mm change in any of the LVDT measurements. For every test,
the loading was stopped immediately when the Load vs. Deflection (WLD & ELD LVDT) plot appeared
to flatten out as it might indicate a failure. A camcorder was mounted on a tripod to record the test, but
was stopped between load stages. Continuous fast photos at intervals of around 0.125s were taken when
the specimen appeared to be failing. Table 2.5 below shows the load stage information for all six beams.
Table 2.5 Shear Forces at the End of Each Load Stage (kN)
Specimen LS #1 LS #2 LS #3 LS #4 LS #5 LS #6 LS #7 ultimate
L1 80.6 159.5 239.5 305.1 − − − 320.3
L2 98.7 199.5 298.7 399.5 479.5 532.3 − 532.3
M1 109.1 200.1 301.1 401.4 450.5 − − 456.9
M2 101.0 201.6 303.2 399.3 450.5 501.8 531.7 531.7
S1 129.2 236.4 353.8 471.8 532 589.7 639.9 639.9
S2 123.0 236.6 353.8 469.2 589.7 649.9 677.5 677.5
37

CHAPTER 3
Experimental Observation
3.1 Overview All six beams failed in shear at their test regions. L1, M1, and S1 that contained roughly 1.238% shear
reinforcement showed under-reinforced shear failure. They failed gradually through opening up shear
cracks and crushing concrete in the web. L2 and M2 that had about 2.45% shear reinforcement, failed
abruptly by violent concrete crushing and spalling, which looked like brittle over-reinforced shear
failure. Despite having the same amount of stirrups as L2 and M2, S2 failed slowly, as it was a deep
beam and the shear force was carried primarily by compression strut, which appeared to have prevented
an abrupt failure from happening.
In general, doubling the amount of shear reinforcement did not improve the shear resistance as much as
expected, especially for S2, which had merely 5.8% increase in ultimate strength compared to S1. Table
3.1 below shows shear force and shear stress at first crack and ultimate loads.
Table 3.1 Summary of Test Results for Beams
Specimen Vcr-exp † (kN)
vcr-exp *(MPa)
Vu-exp
(kN) vu-exp *
(MPa)
L1 68.4 1.70 320.3 7.97
L2 70.4 1.67 532.3 12.63
M1 109.1 2.78 456.9 11.66
M2 94.6 2.30 531.7 12.92
S1 79 1.99 639.9 16.13
S2 123.0 3.08 677.5 16.97
*) vw
crcr db
Vv exp
exp
, and vw
uu db
Vv exp
exp
†) Vcr-exp is the shear force recorded with the first web-shear crack appeared within the test region. Note that the shear force above for each beam was calculated based on the total force exerted by the
Baldwin. Since there were no load cells attached to the spreader beam, the exact magnitudes of the two
point loads were unknown, but the test setup was sufficiently accurate that we can assume the actual
38

shear resistance was very close to the one listed in Table 3.1.
L1, L2, and M2 failed at the west half of their test regions at distances of 1.2 to 1.5 times dv from the
nearest support, while the failure of other three beams occurred roughly at the center. All beams had
more than sufficient flexural capacity. None of the beams had any major flexural cracks even at failure,
and the few flexural cracks developed on the flanges appeared to have little impact on the shear strength
of each specimen.
L1, L2, M1, and M2 showed sectional shear behavior, which were indicated by the almost parallel
cracks on the webs. For S1 and S2, although their small shear span to depth ratio should allow
strut-and-tie actions to dominate, the cracks were still mostly parallel, which was not expected.
The existence of two diaphragms in each beam had more influence on the behavior of the beam other
than simply holding the flanges under the point loads. They blocked the propagation of cracks from the
outer I-sections to the inner I-section so that the shear resistance of each beam was not affected by these
cracks. Furthermore, by greatly increasing the shear resistance at the load and support, the two
diaphragms could have reduced the length of disturbed regions, and thus making beam action to be the
governing mechanism for M1 and M2, which had a/d ratio as low as 2.32.
For every beam, two sides of the web looked different at failure, because the reinforcement layout was
highly unsymmetrical at the web cross section. As shown in Figure 2.5, the 10M longitudinal rebar at
mid-height of the beam was placed at south of the stirrups, which left only about 15 mm clear cover to
the south face of the web, while the clear cover at the north side was as thick as 42 mm. Therefore, every
beam was more damaged on the south side at failure with severe concrete spalling, but on the north side
there were only large diagonal shear cracks. For L1, L2, and M2, concrete spalled out along a distinct
horizontal crack on the south face of web. This crack was at the mid-height of the beam, which was
apparently a result of the weak plane caused by the 10M longitudinal rebar.
Except S1 and S2, all other four specimens had vertical shrinkage cracks before the tests. Some of the
cracks were through out the entire height of the beam. However, they seemed to have little effect on the
behaviors of the beams because neither flexural nor shear cracks were observed to have developed from
these shrinkage cracks in any of the six tests. Furthermore, for each test, the shrinkage crack widths had
unnoticeable changes at every load stage until failure.
One important observation for every test is that large longitudinal cracks were always developed at the
top and bottom faces of the flanges during middle load stages. This phenomenon could be caused by the
very lack of out of plane reinforcements in the flanges. Compare to ordinary flexural cracks, these
39

unexpected longitudinal cracks might have more detrimental effects on the shear resistance of each
beam since the confinement around the web region was reduced significantly due to damaged flanges.
3.2 Specimen Behavior The details of every specimen are discussed in this section. The descriptions will be primarily based on
measured cracks and other qualitative observations made during each experiment. Photos showing the
failure of each specimen and crack diagrams of selected load stages are also presented. All crack
diagrams are drawn on the south side of the specimen, because this was the side where the cracks
widths were measured. The cracks were marked in three different colors: black represents shear or
flexural cracks, green represents shrinkage cracks, and red indicates cracks that are especially discussed
in the text. Only crack diagrams for selected load stages are shown in this section, the detailed crack
traces of every load stage will be presented in the Appendix C.
3.2.1 L1
L1 had the longest shear span-to-depth ratio and a lower shear reinforcement ratio of 1.235%, it had the
lowest shear resistance among all six beams as expected. The beam had two 0.05 mm vertical shrinkage
cracks on both sides of the web, each located at roughly 43 cm from its closest diaphragm. The first
shear crack was in the west outer I-section when the shear force reached 32.8 kN. This crack was rather
random and unexpected since the outer I-section always had only 75% of the shear force in the test
region. Shortly after this crack, the first load stage was restarted due to the loosen LVDT under the west
cantilever. This restart had little effect on the specimen since the test region had no cracks yet.
The first web shear crack in the test region was formed at 68.4 kN. The first load stage was taken when
the shear force reached 80.6 kN. Three diagonal shear cracks were formed at Load Stage 1 in the test
region and they were all at roughly 45o. As shown in Figure 3.1, the crack near east diaphragm became
vertical below the mid-height, which might be caused by stress due to shrinkage and flexure.
A few more cracks were found in the second load stage, including two long diagonal cracks that
developed through the entire height of web at mid west of the test region. Many more new cracks were
formed during Load Stage 3, and the existing cracks from Load Stage 2 grew larger as expected. There
were a few small flexural cracks and longitudinal cracks developed on the flanges, but the beam still
maintained a linear load deflection response at the end of the third load stage. During Load Stage 4,
there were only a few new shear cracks formed and all of these new cracks were small and were
developed from the top and bottom of the web without extending much further. The shrinkage cracks
40
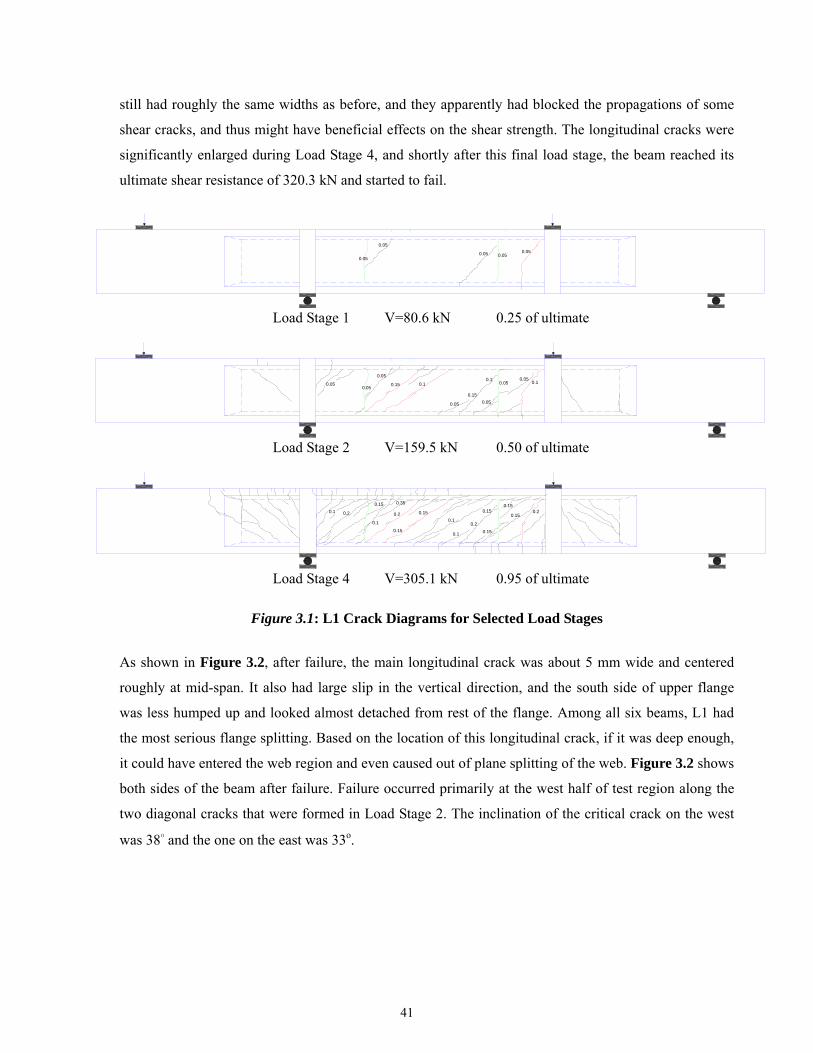
still had roughly the same widths as before, and they apparently had blocked the propagations of some
shear cracks, and thus might have beneficial effects on the shear strength. The longitudinal cracks were
significantly enlarged during Load Stage 4, and shortly after this final load stage, the beam reached its
ultimate shear resistance of 320.3 kN and started to fail.
0.05
0.05
0.05 0.050.05
Load Stage 1 V=80.6 kN 0.25 of ultimate
0.10.05 0.1
0.05
0.05
0.15
0.05
0.10.15
0.05
0.050.05
Load Stage 2 V=159.5 kN 0.50 of ultimate
0.1 0.150.15
0.20.15
0.15
0.2
0.1
0.150.2
0.15
0.1
0.15
0.1
0.2
0.35
Load Stage 4 V=305.1 kN 0.95 of ultimate
Figure 3.1: L1 Crack Diagrams for Selected Load Stages
As shown in Figure 3.2, after failure, the main longitudinal crack was about 5 mm wide and centered
roughly at mid-span. It also had large slip in the vertical direction, and the south side of upper flange
was less humped up and looked almost detached from rest of the flange. Among all six beams, L1 had
the most serious flange splitting. Based on the location of this longitudinal crack, if it was deep enough,
it could have entered the web region and even caused out of plane splitting of the web. Figure 3.2 shows
both sides of the beam after failure. Failure occurred primarily at the west half of test region along the
two diagonal cracks that were formed in Load Stage 2. The inclination of the critical crack on the west
was 38o and the one on the east was 33o.
41

South Side
North Side
Longitudinal Cracks at Top Flange W E
Figure 3.2: L1 after Failure
3.2.2 L2
L2 had the same shear span as L1 but had twice the amount of shear reinforcement. L2 was the last
specimen tested, and it had an ultimate shear resistance of 532.3 kN, which was 66% higher than that of
L1. Part of this large increase in strength was definitely contributed by the ten external clamps that were
used to reinforce the flanges. However, even with the external clamps, longitudinal cracks were still
developed during Load Stage 4 on the compression side of the two flanges. Fortunately, theses cracks
were much smaller than the ones in L1 and thus had much less detrimental effects.
The first shear crack in test region formed when shear force reached 70.4 kN, which was only slightly
higher than the 68.4 kN cracking strength of L1. The first load stage was taken at 98.7 kN. Two cracks at
the east of web near the mid-span had much larger angles than other cracks, but the one formed at top
half of the web soon developed into a large continuous shear crack during Load Stage 2. This crack
decreased its angle as it extended downwards until it was almost parallel to other shear cracks. The
stiffness of the beam appeared to be constant after the first crack and before the end of Load Stage 4
despite many new cracks were formed during this interval. L2 reached its peak load at the end of Load
42

Stage 6, but the beam still maintained very good integrity without any delaminations, and most of the
crack widths were also smaller than expected. Compare to L1, there were more shear cracks in L2 at its
last load stage. However, L2 had generally smaller crack widths than L1 did under similar shear forces.
While this difference was not apparent for Load Stages 1 and 2, the cracks widths of L2 at the end of
Load Stage 3 with a shear for of 298.7 kN were noticeably smaller than those of L1 at the end of Load
Stage 4 with V = 305.1 kN.
0.1
0.1
0.050.1
0.1
0.150.15
Load Stage 1 V=98.7 kN 0.19 of ultimate
0.15
0.15
0.1
0.1
0.1 0.15
0.15
0.1
0.1 0.05
0.1
0.05
0.05
0.1
0.15
0.05
0.05
0.050.15
0.15
0.1
Load Stage 3 V=298.7 kN 0.56 of ultimate
0.4
0.25
0.15
0.15
0.25 0.3
0.25
0.15
0.1 0.15
0.15
0.10.2
0.15
0.15
0.25
0.4
0.10.25
0.150.15
0.15
Load Stage 6 V=532.3 kN Peak load
Figure 3.3: L2 Crack Diagrams for Selected Load Stages
Shortly after the final load stage, L2 failed abruptly at the west half of the test region. As shown in
Figure 3.4, at the moment of failure, violent concrete spalling occurred along a horizontal line near the
mid-height. Although the two web shrinkage cracks had little change in widths from the first to last load
stage, the one near mid-span did open up at failure and became the east boundary of the failure region on
south side of the web. On the north side, however, the failure location extended beyond west of the
shrinkage crack, but the web was still less damaged. The two critical cracks on the south side appeared
to be in between the two shrinkage cracks, and they were first formed during Load Stage 3. The critical
crack on the north side was the one that crossed the west shrinkage crack at mid height. Inclinations of
all three cracks were around 33o.
43

t = −0.125 s
t = −0 s
t = 0.125 s
Figure 3.4: L2 during Failure
South Side
North Side
Figure 3.5: L2 after Failure
3.2.3 M1
M1 had a shear span to depth ratio of 2.32 and a shear reinforcement ratio that was the same as L1. M1
was the first beam tested, and it had an ultimate shear resistance of 456.9 kN, which was higher than the
shear strength of L1 as expected, but lower than that of L2. As displayed in Figure 3.6, cracks near the
two diaphragms were less inclined, while the ones closer to the mid-span had smaller angles and were
mostly parallel to each other. Therefore, M1 carried shear force primarily through beam action rather
44

than arch action.
0.15
0.1
0.10.1
0.15
0.1
Load stage 1 V=109.1 kN 0.24 of ultimate
0.2
0.1
0.15
0.15
0.1
0.1
0.15
0.1
0.10.1
0.2
0.15
Load stage 2 V=200.1 kN 0.44 of ultimate
0.3
0.2
0.15
0.2
0.250.25
0.45
0.25
0.45
0.2
0.250.15
0.3
0.25
0.55 0.2
Load stage 5 V=450.5 kN 0.99 of ultimate
Figure 3.6: M1 Crack Diagrams for Selected Load Stages
The first two shear cracks seemed to have formed simultaneously at around 109.1 kN in west of the test
region. This cracking strength was much higher than that of L1 and L2, but the initial crack widths were
also significantly larger. During the second load stage, more shear cracks were formed on the web at the
test region and some of them extended to the flanges. The diagonal shear crack formed at mid-span later
became the critical crack that initiated the failure of M1. More shear and flexural cracks developed
between the third and last load stage, and longitudinal cracks were formed in Load Stage 4 on both top
and bottom flanges.
M1 reached its peak load shortly after Load Stage 5 and started to fail gradually. The beam failed at its
mid-span, which was expected since it was very close to a distance of dv from the support. The failure
started from the top half of the web by opening up the critical crack, which was inclined at around 35o,
other cracks nearby also opened up shortly after. This result could be foreseen back in the last load stage
when the two web cracks at top mid-span had widths as large as 0.45 mm. Different from the two long
beams, M1 did not have concrete spalled out along a distinct horizontal crack along mid-height of the
web, although its south side was still more damaged than the north side.
45

South Side
North Side
Longitudinal Cracks at Top Flange W E
Figure 3.7: M1 after Failure
3.2.4 M2
M2 had twice the amount of shear reinforcement of M1, but its ultimate shear resistance was 531.7 kN,
which was only 16.4% higher than M1. Despite the presence of longitudinal cracks that weakened the
beam, it could still be seen that doubling the amount of stirrups did not increase the shear strength as
much as expected.
The web shear cracks for M2 also looked parallel, although cracks near the two diaphragms had less
inclinations than the rest, the differences were not as obvious as in M1. However, there was one
exception, which was the diagonal crack located right at the mid-span. Formed at a shear force of around
94.6 kN, this was the first crack during the test, and it had an inclination of 56o. Having a much larger
angle than other cracks, the formation of this first crack could also have been contributed by stress due
to shrinkage other than shear stress. The benefit of having more stirrups on crack control is clearly
demonstrated by M2. Compare to M1, the crack widths of M2 at each load stage were noticeably
smaller (they can be compared easily since the same load stage number for these two beams
corresponded to almost the same shear force). Many more shear cracks are developed during the second
46

load stage. Tiny flexural cracks also appeared on two sides of the upper flange, but it was not until the
third load stage that some of these flexural cracks became visible on the top flange face. During Load
Stage 2, there was also a large shear crack formed at the east outer I-section that passed through a nearly
2 cm large void, but this did not affect the beam since the failure still ended up in the test region. The
first longitudinal crack was formed during Load Stage 4 at the top east flange and it had propagated to
the mid-span during Load Stage 7. A few more longitudinal cracks were also formed before at the end of
final load stage.
0.05
Load stage 1 V=101.0 kN 0.19 of ultimate
0.05
0.050.05
0.05
0.05
0.05
0.05
0.05
0.1
Load stage 2 V=201.6 kN 0.38 of ultimate
0.25 0.3
0.4 0.5
0.1
0.25
0.15
0.1
0.45
0.25
0.350.3
0.15
Load stage 7 V=531.7 kN Peak load
Figure 3.8: M2 Crack Diagrams for Selected Load Stages
t = −0.125 s t = 0 s t = 0.125 s
Figure 3.9: M2 during Failure
47

Abrupt failure shown in Figure 3.9 occurred shortly after Load Stage 7. Similar to the behavior of L2,
part of the web at west half of the test region was split along a horizontal line at mid height accompanied
by violent concrete spalling. By examining the north side of M2 after failure, it seemed that there were
two critical cracks, and one of them was actually the 56o crack formed during the first load stage. The
other critical crack at the west was formed during Load Stage 2, and it had an inclination of around 36o.
Compare to M1, the longitudinal cracks of M2 caused similar damages in the two flanges, but the crack
slips in vertical direction were much less compare to the ones in specimen L1.
South Side
North Side
Longitudinal Cracks at Top Flange W E
Figure 3.10: M2 after Failure
3.2.5 S1
S1 was one of the two deep beams with a/d ratio of 1.125 and shear reinforcement ratio of 1.25%. The
beam had an ultimate shear resistance of 639.9 kN and it failed slowly like L1 and L2. Having a crack
pattern similar to that of M1, S1 also had more inclined parallel cracks near mid-span and two less
inclined cracks near the two diaphragms.
48

The exact cracking strength of S1 was not clearly known, because unlike other specimens, S1 did not
produce a very distinct sound when its first crack developed and this sound was mixed up with the noise
made by the Baldwin machine. The first crack might have occurred at around 79 kN since the beam had
a sudden increase in deflection at this load. The first load stage ended with a shear force of 129.2 kN,
and two cracks have already formed at the west half of test region. No crack was formed at the east half
until Load Stage 3, but the cracks started to distribute more evenly through out the web after this load
stage. The two discontinuous shear cracks at mid-span opened up greatly during Load Stage 7, with a
0.4 mm width, they were the largest shear cracks before failure. Delamination was also detected on
south face of the web at this final load stage.
0.10.05
Load stage 1 V=129.2 kN 0.20 of ultimate
0.05
0.20.2
0.15
0.1
Load stage 3 V=353.8 kN 0.55 of ultimate
0.150.1
0.3
0.4
0.40.25
0.2
0.25
Load stage 7 V=639.9 kN Peak load
Figure 3.11: S1 Crack Diagrams for Selected Load Stages The beam was not able to withstand higher load after Load Stage 7. Failure happened slowly through
crushing of the direct compression strut between the load and support. The inclination of compression
strut was around 42o. The south side of web had much more damages than the north side, but the bottom
flange on both sides appeared equally damaged as they both had large portions of concrete falling off.
The first longitudinal crack was formed early in Load Stage 3 at the top east flange, and multiple cracks
were developed afterwards on both flanges. Top of the east diaphragm was cracked under the point load
49

and thus allowed two of the longitudinal cracks extending to the flange at east outer I-section, which was
a never expected phenomenon. The longitudinal cracks were more concentrated near the load point or
support on both the top and bottom flanges. Therefore these cracks were most likely contributed by
stresses at the nodal regions of compression strut, since the two diaphragms should have provided the
flanges with much stronger confinement against longitudinal splitting compare to the long and medium
length beams.
South Side North Side
Bottom
W E
Top
W E
Figure 3.12: S1 after Failure
3.2.6 S2
S2 had the same a/d ratio as S1 but twice the amount of shear reinforcement. Despite being the strongest
beam among all specimens, it only had an ultimate shear resistance of 677.5 kN, which was only 5.8%
higher than S1. This tiny increase in shear strength could even by accounted as an error or deviation
within the normal range of tolerance. The differences on the crack widths between S1 and S2 were also
very small. This result showed that for deep beams with geometries and loading conditions similar to S2,
increasing the amount of shear reinforcement from 1.25% to 2.48% had almost no effect on the ultimate
shear resistance and crack widths.
The crack pattern of S2 was opposite from that of S1. Instead of having more inclined shear cracks near
the mid-span, S2 had more inclined cracks near the two diaphragms and one crack with the largest angle
formed at mid-span during Load Stage 1. This crack had an angle of 56o and was formed when the shear
50

forced reached 123 kN. Compare to S1, this cracking strength was much higher. During the second load
stage, two shear cracks were developed on each side of the central crack at inclinations of approximately
46o. The central crack opened up greatly during Load Stage 7 from 0.3 mm to 0.55 mm. Meanwhile,
delamination was also detected at south face of the web.
0.1
Load stage 1 V=123.0 kN 0.18 of ultimate
0.1
0.1
0.1
0.05
Load stage 2 V=236.6 kN 0.35 of ultimate
0.15
0.25 0.550.25
0.15
0.2
0.15
0.2
0.2
Load stage 7 V=677.5 kN Peak load
Figure 3.13: S2 Crack Diagrams for Selected Load Stages
Shear failure occurred soon after Load Stage 7. Unlike L2 and M2, S2 failed slowly despite having
roughly the same amount shear reinforcement. The failure of S2 also looked different than that of S1.
Rather than gradually crushing the compression strut and causing damages over a large area on the web,
S2 appeared to be failing along that 56o crack at mid span, which was formed back in Load Stage 1.
Although concrete spalling had also occurred at the top and bottom of web, it was apparently less severe
compare to S1. On north side of S2, the damages were more concentrated at top half of the web. The
first longitudinal crack was developed in Load Stage 4. The longitudinal cracks dealt significant
damages to the flanges within the region. Similar to S1, these damages were mostly near the load and
support and they appeared to be primarily caused by concrete crushing at nodal regions of the
compression strut. The inclination of this compression strut should be roughly between 46o and 56o.
Longitudinal cracks also extended to the top of east diaphragm and the bottom of west diaphragm, but
51

the damages were much less compare to the cracking on the east diaphragm of S1.
South Side North Side
Bottom
W E
Top
W E
Figure 3.14: S2 after Failure
52
CHAPTER 4
Evaluation of Test Results
This chapter focuses on the evaluation and analysis of the quantitative test data obtained from all the
instruments. The chapter will include: deflection and shear strain measured by the LVDTs, inclination of
reaction support measured by the clinometers, longitudinal and transverse strain gauge readings, and web
deformations at the test region for selected load stages calculated from the Zurich data. For the ease of
comparison, some of the test results are presented for all six beams together rather than for each specimen
separately.
4.1 LVDT Data
4.1.1 Deflection
The transverse displacements at five locations of each beam were measured by vertical LVDTs placed on
the floor. These displacements do not represent the actual deflection of the beam, because a large portion
of the displacements were contributed by the settlements of plasters at the two supports. The net
deflection could be easily calculated when the support displacements data were available. However, as
mentioned in Chapter 2, mistakes were made by not having LVDTs measuring the support displacements
during the first four experiments, and the 3D scanner was only able to track one of the two support
displacements on the north side of each specimen due to limited field of view. Therefore, except L1 and
L2, exact deflections of the other four specimens could never be known. Since the plasters always had
significant amount of settlements, instead of showing the total displacements measured by the five
vertical LVDTs, which apparently were not representative, a method was proposed to give a rough but
closer approximation to the actual deflection of each beam based on the available LED and LVDT data
from all six tests. The details of this method are explained in Appendix B. Figure 4.1 shows the
calculated deflections of all specimens at the end of each load stage. They are presented as a function of
the distance from mid-span, and the two locations that always have zero displacements on the graph are
the two reaction supports.
53

-2590 -1110 -518 0 518 1110 2590-10
-9
-8
-7
-6
-5
-4
-3
-2
-1
0
Distance From Mid-Span (mm)
De
flect
ion
(mm
)
L1
-2590 -1110 -518 0 518 1110
0
2590-12
-10
-8
-6
-4
-2
Distance From Mid-Span (mm)
De
flect
ion
(mm
)
L2
1*
2
3
4
Ultimate
-1491 -639 -282 0 282 639 1491-6
-5
-4
-3
-2
-1
0
Distance From Mid-Span (mm)
De
flect
ion
(m
m)
M1
-1491 -639 -282 0 282 639 1491-6
-5
-4
-3
-2
-1
0
Distance From Mid-Span (mm)
De
flect
ion
(m
m)
M2
-860 -310 -118 0 118 310 860-4
-3.5
-3
-2.5
-2
-1.5
-1
-0.5
0
Distance From Mid-Span (mm)
De
flect
ion
(mm
)
S1
-860 -310 -118 0 118 310 860-3.5
-3
-2.5
-2
-1.5
-1
-0.5
0
Distance From Mid-Span (mm)
De
flect
ion
(mm
)
S2
Figure 4.1: Deflections of Beams
*The detailed load stage data can be found in Table 2.5 in Chapter 2. As each beam approached failure, stirrups at the failure location began to greatly elongate and the web
region started to bulge out in the transverse direction, making the beam no longer following the elastic
deflected shape. Thus, when reaching the ultimate load, it was reasonable for a beam to have greater
displacements near its mid-span than the one under the east point load. For specimen M1, the
54
displacement at 282 mm to the east of mid-span exceeded the one at east point load after Load Stage 4,
and kept to be the largest vertical displacement within the test region. Unlike M1 that failed at mid-span,
the failure location of M2 was mainly at west half of the test region. Hence, the maximum deflected point
of M2 at ultimate load was more towards the west compare to that of M1. Different from the two medium
beams, the two short beams always had their largest displacements under the east point load. This was
actually possible since the shear force in each short beam was primarily carried by the direct compression
strut between east load and west support, which could leave web regions near the mid-span not expanding
transversely as much compare to the medium beams. The deflections of L1 and L2 were mostly governed
by flexure and therefore were closer to the elastic deflected shape.
Under ideal conditions, displacements at the two point loads are expected to be equal due to symmetry.
For the long and medium beams, although displacements under the west load were always greater than the
ones under east load, the differences were within acceptable range. For S1 and S2, however,
displacements at the west were much less than the east.
For the medium and short beams, doubling the amount of shear reinforcement did not have much
influence on the deflections at ultimate load. The long beams were different as L2 had significantly larger
deflections at its ultimate load than L1, partly because without the external clamps, L1 failed very early
before reaching higher loads and greater deflections.
4.1.2 Shear Strain
Shear strains at the test regions were measured using cross LVDTs mounted on the top and bottom flanges.
These measurements were based on an assumption that the principal strains were aligned at 45o and 135o
to the horizontal axis, which would give reasonably close estimates to the actual results. The shear strain
data is not available for specimen L2 because the cross LVDTs were unable to be installed in the presence
of external flange clamps. Figure 4.2 and Figure 4.3 show the shear strains plotted as a function of shear
forces for each beam. Note that plots for S1 and S2 are not shown at the full range since the shear strains
kept increasing as these two beams failed slowly, and by the end of data acquisitions when the beams
were completely damaged, the measured values were too large that a portion of the them needed to be
excluded from the graphs in order to preserve details of the shear strain variations before ultimate loads.
55

L1
0
50
100
150
200
250
300
350
-1 1 3 5 7 9 11 13 15 17 19 21Shear Strain (mm/m)
V (
kN)
West
East
M1
0
100
200
300
400
500
-1 2 5 8 11 14 17 20 23 26Shear Strain (mm/m)
V (
kN)
M2
0
100
200
300
400
500
600
0 4 8 12 16 20 24 28Shear Strain (mm/m)
V (
kN)
S1
0
100
200
300
400
500
600
700
-1 2 5 8 11 14 17 20 23 26Shear Strain (mm/m)
V (
kN)
Figure 4.2: Shear Force vs. Shear Strain (L1, M1, M2, and S1)
56

S2
0
100
200
300
400
500
600
700
-1 2 5 8 11 14 17 20 23 26Shear Strain (mm/m)
V (
kN)
Figure 4.3: Shear Force vs. Shear Strain (S2)
Specimen L1 had two sets of shear strain readings measured at the each half of the clear span. The two
measurements were reasonably close to each other for the first three load stages. Shear strain at the east
half become much greater than the ones at west as the experiment was approaching Load Stage 4. After
reaching the ultimate load, shear strain at the west half increased drastically since this was where the
failure started to occur. As the load decreased, shear strain at the east half also started increasing at a
higher rate, which was expected since part of the upper flange in the east half of test region was also
damaged as the failure location expanded towards both sides. Unlike L1, shear strains were only
measured at the mid-span for each of the other four beams. Comparing the shear strains of M1 and M2 at
their ultimate loads, the one for M2 was 15.7% greater, which was reasonable. The shear strain difference
between S1 and S2 was completely unexpected, because S2 had larger strain than S1 at any given shear
force despite of having twice the amount of transverse reinforcements. Creep in shear trains occurred
mostly at late load stages and it seemed that they were not dependent upon the amount of stirrups or the
a/d ratios.
4.2 Strain Gauge Data
4.2.1 Longitudinal Strains
Strains in the longitudinal reinforcements measured by strain gauges at the end of each load stage are
shown in Figure 4.4 to Figure 4.6. Note that some data were missing due to damaged strain gauges. None
of the longitudinal reinforcements yielded since the beams were constructed with sufficient flexural
capacity. When reaching ultimate load, bond slip occurred to specimen L1 at the top reinforcement layer
near mid-span.
In ideal cases, the two sets of strain gauge readings for each specimen should be identical due to
57
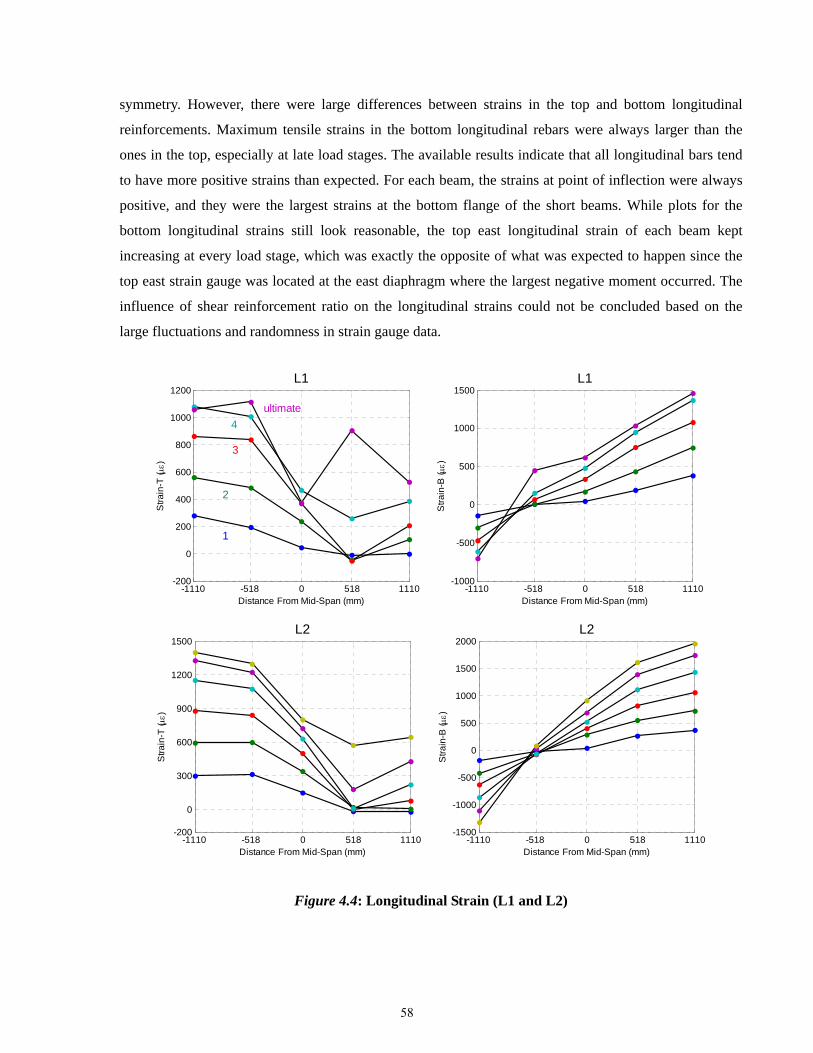
symmetry. However, there were large differences between strains in the top and bottom longitudinal
reinforcements. Maximum tensile strains in the bottom longitudinal rebars were always larger than the
ones in the top, especially at late load stages. The available results indicate that all longitudinal bars tend
to have more positive strains than expected. For each beam, the strains at point of inflection were always
positive, and they were the largest strains at the bottom flange of the short beams. While plots for the
bottom longitudinal strains still look reasonable, the top east longitudinal strain of each beam kept
increasing at every load stage, which was exactly the opposite of what was expected to happen since the
top east strain gauge was located at the east diaphragm where the largest negative moment occurred. The
influence of shear reinforcement ratio on the longitudinal strains could not be concluded based on the
large fluctuations and randomness in strain gauge data.
-1110 -518 0 518 1110-200
0
200
400
600
800
1000
1200
Distance From Mid-Span (mm)
Str
ain
-T ( )
L1
-1110 -518 0 518 1110-1000
-500
0
500
1000
1500
Distance From Mid-Span (mm)
Str
ain
-B ( )
L1
ultimate
4
3
2
1
-1110 -518 0 518 1110-200
0
300
600
900
1200
1500
Distance From Mid-Span (mm)
Str
ain
-T ( )
L2
-1110 -518 0 518 1110-1500
-1000
-500
0
500
1000
1500
2000
Distance From Mid-Span (mm)
Stra
in-B
( )
L2
Figure 4.4: Longitudinal Strain (L1 and L2)
58

-639 0 639-200
0
300
600
900
1200
Distance From Mid-Span (mm)
Str
ain
-T ( )
M1
-639 0 6390
300
600
900
1200
1500
Distance From Mid-Span (mm)
Stra
in-B
( )
M1
-639 0 639-200
0
400
800
1200
1600
Distance From Mid-Span (mm)
Str
ain
-T ( )
M2
-639 0 6390
400
800
1200
1600
Distance From Mid-Span (mm)
Str
ain
-B ( )
M2
-310 0 3100
500
1000
1500
2000
Distance From Mid-Span (mm)
Str
ain
-T ( )
S1
-310 0 310-400
0
400
800
1200
Distance From Mid-Span (mm)
Stra
in-B
( )
S1
Figure 4.5: Longitudinal Strain (M1, M2, and S1)
59

-310 0 3100
400
800
1200
1600
Distance From Mid-Span (mm)
Str
ain
-T ( )
S2
-310 0 3100
300
600
900
1200
1500
Distance From Mid-Span (mm)
Str
ain
-B ( )
S2
Figure 4.6: Longitudinal Strain (S2)
4.2.2 Transverse Strains
Figure 4.6 shows the strains in the transverse reinforcements that were measured by strain gauges
mounted at the mid-height of the stirrups. Transverse strains of each beam at early load stages were
heavily dependent upon on the locations of web cracks, as strains were increased significantly when
regions near the strain gauges were crossed by cracks. At late load stages, the strains became more
consistent with the predictions as more cracks were distributed throughout the web.
The maximum transverse strains for specimens L1 and L2 were at west half of the test regions, which was
the location of failure. For the other four beams, maximum strains occurred at the middle stirrups during
late load stages, which were also reasonable since the beams were expected to fail at around the mid-span
according to the sectional shear predictions from both CSA A23.3-04 and ACI 318-08. Beam M2 was an
exception, despite having symmetrical strains about the mid-span, it eventually failed abruptly at west
half of the test region.
The available strain gauge data shows that none of the stirrups had yielded for L2, although data was
missing for the one at 612 mm west of mid-span, it was very possible that this stirrup had yielded. The
middle stirrups in M2 and S2 just reached the yield strain at ultimate loads. The results indicate that
over-reinforced shear failure occurred for these beams. For the other three beams that had half the amount
of shear reinforcements, the stirrups did yield before reaching the ultimate loads, but none of them had
ruptured.
60

-606 -303 0 303 6060
600
1200
1800
2400
3000
Distance From Mid-Span (mm)
Str
ain
-C ( )
L1
-612 -306 0 306 6120
500
1000
1500
2000
2500
Distance From Mid-Span (mm)
Str
ain
-C ( )
L2
1
ultimate
4
3
3
2
-303 0 3030
700
1400
2100
2800
3500
Distance From Mid-Span (mm)
Str
ain
-C ( )
M1
-306 0 3060
600
1200
1800
2400
3000
Distance From Mid-Span (mm)
Str
ain
-C ( )
M2
-101 0 101
0
700
1400
2100
2800
3500
Distance From Mid-Span (mm)
Str
ain
-C ( )
S1
-102 0 102
0
500
1000
1500
2000
2500
Distance From Mid-Span (mm)
Str
ain
-C ( )
S2
Figure 4.7: Transverse Strain
61

4.3 Zurich Data This section shows the Zurich data at selected load stages of each test. The load stage selections are the
same as those in Chapter 3 except that Load Stage 1 of each test is not be included. The data is presented
in two forms: the numerical strains measured directly by the electronic Zurich gauges and the two
dimensional web displaced shapes (scaled at 30x) at test regions computed using the method proposed by
Dr. Boyan Mihaylov. Each displaced shape shown here is computed as a reference to the initial state of
the specimen prior to loading. For each specimen, both the numerical strains and displaced shapes are
drawn on south side of the beam in order to be consistent with the orientation of crack trace diaphragms.
However, the actual Zurich data only represent measurements at the north face.
It is found that within each group of specimens, the horizontal Zurich strains on the two flanges were
generally smaller in the higher shear reinforced beam under similar shear forces. When comparing beams
with the same amount of stirrups, the flange Zurich strains appeared to be independent of the a/d ratios.
Opposite to what was expected from elastic beam actions, the absolute values of web horizontal surface
strains were usually much larger than the ones in flanges, indicating that deformations in the web regions
due to shear were larger than the ones due to flexure. At early load stages, the vertical Zurich strains were
apparently influenced by both the a/d ratios and shear reinforcement ratios. Under similar shear forces,
beams with more stirrups or smaller a/d ratios did have noticeably smaller vertical strains. However, these
were no longer effective as the specimens were approaching failure. At the final load stages, vertical
strains in the two long beams were much less than those in the other four beams, and despite of having
smaller shear forces, the two medium beams had larger vertical strains than the short beams did.
Although the Zurichs could only measure strains at concrete surface, they are expected to produce similar
results as the reinforcement strains measured at near locations. However, there were actually many
discrepancies between the Zurich strains at the strain gauge data. Unlike the longitudinal reinforcement
strains in which the largest measurements were always found at one of the two diaphragms, locations of
the largest horizontal Zurich strain on each of the two flanges appeared to be random. Vertical Zurich
strains were smaller than the stirrup strains at early load stages, but became much larger as the beams
were approaching failure. One thing that both flange Zurich strains and longitudinal reinforcement strains
had in common was that positive strain values were observed for each beam at regions near the point load
or the reaction support, which had maximum negative moment. This unexpected phenomenon could be
caused by the transverse expanding of the test region under shear force, which would possibly result in
stretching of the flanges.
62

4.3.1 L1
Unlike the top longitudinal reinforcement strains, the surface strains of L1 at top flange showed
reasonable changes from Load Stage 2 to 4. The most noticeable ones are the strains near east point load
that became more negative as the shear force increased instead of becoming more positive like the
reinforcement did. Surface strains at the bottom flange are exactly the opposite as they were all increasing
in the positive direction, even including ones above the west support. Based on the web displaced shapes,
it can be seen that the distributions of transverse Zurich strains and transverse reinforcement strains were
similar, although the two sets of measurement still had large differences in magnitudes.
Load Stage 2 V=159.5 kN 0.50 of ultimate
12345612
2026
2829303132333436373839
-108-123-79.5-182-40.8-109
-357-176-173-117-245-295-9.22
1234-193-75.6-66.8-114
2-57.3
6
-155
-252
-396
-2
789101113
1415161718192122232425
2735
244513389469999965
9588067111046621
74872446648072985.757.7
7741280
1271063
11421168
181567
1.1703
164
10925.2
6271544
1756933
13011392
1.421076
104
55310.3
788
541
2
849
5 -1
23
-159
-198
-140
-1
99
742
1523
1192
-286
-155
-200
2515
-2
00
1115
814
2337
900 2148
1221
350 964
4.
5
807
-327
-180
-2
38
-2
25
-2
86
-2
35
-1
82
-2
21
-1
69
-123
-8
8.6
-2
44
2118
2043
600
-3
02
-4
20
-2
03
-82.9
40
57
41
58
42
59
43
60
44
61
45
62
46
63
47
64
48
65
49
66
50
67
51
68
52
69
53
70
54
71
55
72
56
73
10.3127
15.8
161350
275
488
389
383
217
603
922
741
368
451
719
468
388
656
937
-113
-197
-200
-189
-169
-244
-126
-190
-138
-102 -67.8 -39.5
2 4
Load Stage 4 V=305.1 kN 0.95 of ultimate
12345678910111213
14152526
282930323436373839
-45.9-236-545
2179-736-3541083-67985.122261616
-4411925-126-466-68.31590
-1
3.5
-371
-12.
5-1
10 -1
68-3
57-8
9.1
-2
30
-2
20
-2
0
-309
-1
04
-1
19
-4
2
-189
-2
10
-3
84
-4
06
161718192021222324
27313335
15850.211010.3328223612089492068
136-427452314
1978980286898694230
17262231
5302427
31663221
19282375
28711227
15722795
25932392
6032715
27442500
43162488
44741900
17082859
13221230
2596
2179
2880
36
8
2043
3144
96
.6
2260
2255
166
1807
5489
5530
5269
3850
4668
2807
4231
12
7
1565
3005
288
2184
3357
613
1533
3326
2592
4086
4136
40
57
41
58
42
59
43
60
44
61
45
62
46
63
47
64
48
65
49
66
50
67
51
68
52
69
53
70
54
71
55
72
56
73127 141 265 229 289 414
206
707
904
727
26891
1109
24933
1406
747
809
808
2030
1207
1153
752
1692
922
1201
954
1722
-332-417-258-217-268-23.8
Figure 4.8: L1 Zurich Strains and Web Deformations at Selected Load Stages
63

4.3.2 L2
For specimen L2, most of the Zurich strains at both top and bottom flanges became more positive after
Load Stage 3, and they had significantly different values compared to the longitudinal reinforcement
strains at the corresponding locations. As expected, most of the flange Zurich strains of L2 were smaller
than that of L1 at their last load stages, but the web surface strains for these two beams did not have much
difference. The web displaced shapes of L2 seem to be consistent with the distribution of stirrup strains as
the vertical Zurich strains at mid-span were apparently less than those at the two sides near locations of
the 2nd and 4th stirrup strain gauges. The vertical Zurich strains indicate that the damaged stirrup strain
gauge at 612 mm west of mid-span most likely had similar strains compared to the one at its east.
Load Stage 3 V=298.7 kN 0.56 of ultimate
12345678910111213
141516171819202122232425
282930313233343536373839
-733-235-422-45.6
-58.4-525-791-622
-524-86388.9-69.8-90.1-317
28.2
-169
-514
-492
-540
-609
-320
-713
-389
-726
27
409475292553604812613493
890404441049748131286724
766735862339374108
264681
5551031
456583
188284
6731876
1496890
175526
583533
1286717
4771109
1970-
5051110
1202
1773
781
1020
1828
1556
1632
1582
7
1297
2237
1981
2561
1493
2250
1635
1442
1506
1665
8 -4
42 -4
61
-3
59 -7
53
-4
20
-5
07
-2
05
-2
85
-2
7.3
-4
66
1734
1634
701 2116
992 1848
2680
-4
15
-6
79
-4
17
-5
10
-5
50
-8
42
40
57
41
58
42
59
43
60
44
61
45
62
46
63
47
64
48
65
49
66
50
67
51
68
52
69
53
70
54
71
55
72
56
73
15785.5154
175 157
613
574
304
451
898
362
266
674
566
331
572
482
925
720
1258
934
-309
-307
-397
-275
-245
-228
-68.7
-120 -173 -97.2
-50.7
3 6
Load Stage 6 V=532.3 kN Peak load
12345678910111213
141516171819202122232425
282930313233343536373839
-227-914-950-380-952-665
-22.3-562-61.51387-11781207-7493368
-93810191224-877-292-190-112
-201
-497
-736
-67
26
27
664179830241967275999.7
8604232052926
17585232344789197
7821834
15311642
11312074
2891097
14304073
34092394
9432192
22411667
29822010
34831741
5778
42602500
3662
2654
7
2024
1791
2331
2699
3152
4386
3579
6678
6325
8661
4617
3776
3022
3773
2566
3485
3705
3722
1826
3820
1468
3569
6208
-793
-107
0
-293
-689
-654
-135
9
-631
-495
-5
03 -6
27
-6
25
-6
38
-7
64
-4
20
-4
19
-6
08
-7
32
-9
48
-6
36
-7
19
-7
17
-9
94
40
57
41
58
42
59
43
60
44
61
45
62
46
63
47
64
48
65
49
66
50
67
51
68
52
69
53
70
54
71
55
72
56
7371.8
473
837 249
4051282
50.5 931
1432
1787
397
129
1532
1131
799
1002
1268
775
914
897
1422
1316
1937
1586
-470
-421
-462
-359
-65.8-310
-459
-541
Figure 4.9: L2 Zurich Strains and Web Deformations at Selected Load Stages
64

4.3.3 M1
Zurich strains on the two flanges of M1 within the test region were getting more positive as the shear
force increased, even including ones at the negative moment regions, although their values are much less
compared to the longitudinal strain gauge readings. Different from the longitudinal reinforcement strains,
the largest surface strains on the top flange were near the mid-span rather than at one of the diaphragms at
Load Stage 5. While the vertical Zurich strains are less than the stirrup strains at Load Stage 2, but having
a higher rate of increase, they became much larger than the stirrup strains at Load Stage 5. The displaced
shapes of M1 are fairly symmetrical about the mid-span, which was also the location where failure
occurred.
Load Stage 2 V=200.1 kN 0.44 of ultimate
1234567
89101314
161718192021
-95
-306-444
-245-1.65
151
-29
0
346
-1
42
-6
6.3
-1
1112
15
177463491122645
5472052371265
975275241138
687
760
28.3
-
1068
998
2287
2099
926
1240
173
-143
1
738
815
1
36
1638
2
9.7
2607
1
2035
1984
1790
867
839
819
1576
2539
3
-1
66
-3
12
-8
2.8
-6
66
-4
38
-5
88
-5
86
22
33
23
34
24
35
25
36
26
37
27
38
28
39
29
40
30
41
31
42
32
43
52.7
35
98
95.1
257
318
546
220
393
395
447
532
433
369
383
593
-177
-105
-149
-133
Load Stage 5 V=450.5 kN 0.99 of ultimate
1234567
891011121314
15161718192021
-427
-727-228
-371
-767
-53.
4
-942
-1
79
-8
63
-6
3
20364018752161441854
169926897532672411
222513025874140
14172684
41153387
107422083
86145701
55936145
33121653
4684
5535
2
29
7482
2
089
9707
8890
3
98
4706
4349
1
50
4855
3121
6034
3
8809
4302
4904
-9
06
-8
80
22
33
23
34
24
35
25
36
26
37
27
38
28
39
29
40
30
41
31
42
32
43
9.83
262
566
334
928
966
1019
811
1191
489
670
578
1019
838
988
678
1070
1051
-182
-220
Figure 4.10: M1 Zurich Strains and Web Deformations at Selected Load Stages
4.3.4 M2
M2 had noticeably smaller Zurich strains than M1 at Load Stage 2 (the shear forces were almost the
same). However, at their final load stages, the Zurich strains of M2 were slightly larger overall. Similar to
M1, the stirrups strains of M2 were greater than its vertical Zurich strains at Load Stage 2 but were
smaller than those at Load Stage 7. The beam failed at west half of the test region, and this is confirmed
by the web displaced shape at Load Stage 7, which shows maximum deformation at the west side of
65

mid-span.
Load Stage 2 V=201.6 kN 0.38 of ultimate
1234567
891011121314
15161718192021
-249
-323-204
38
-76.57
-3
02
-2
438355472322222
4921063624152
28138.3328403299416
558182
920618
8556
167
923736
430849
212316
1609
2
849
1604
781
1300
723
801
467
1
-50
9
-28
0 -2
03-1
47
-1
92
-3
04
-3
7
Load Stage 7 V=531.7 kN Peak load
1234567
891011121314
161718192021
-842
-765-945
-372-857-1829
-7
35
-2
70
-2
518
-9
32
-2
80
-1
75
-2
51
-3
12
-5
15
686470323010681279
220114061100470
40882093557
12861779
31542205
31743740
11586063
114142203
29196723
19521560
4506
2641
5660
8484
8608
3628
5486
3016
5
7780
3513
5598
4279
8
-1
19
-9
09
-8
12
22
33
23
34
24
35
25
36
26
37
27
38
28
39
29
40
30
41
31
42
32
43256
163
360
2220
1797
1045
1185
730
1086
580
708
934
445
607
989
529
688
-249
-388
-457
Figure 4.11: M2 Zurich Strains and Web Deformations at Selected Load Stages
4.3.5 S1
All horizontal strains on the flanges became positive after Load Stage 2, except the one between Zurich
targets 13 and 14. Zurich strains on the top flange showed similar distribution as the available longitudinal
strain gauge data, but the ones at bottom flange above the west reaction support were completely different
than the longitudinal reinforcement strains at that location. At the end of Load Stage 3, the vertical surface
strains were very different from the stirrups strains, but they showed similar distributions at later load
stages. With only three columns of Zurich targets in the web, the displaced shapes look symmetrical about
the mid-span as no significant deformations occurred on either half of the test region. Therefore, unlike
the long and medium beams, displaced shapes of S1 do not effectively reveal the location at which failure
would occur.
7
2009
-2
44
1283
1402
-3
95
1207
-418
22
33
23
34
24
35
25
36
26
37
27
38
28
39
29
40
30
41
31
42
32
43
0
40.5
13.3
10.2
21.5
165
132
269
392
343
460
248
83.1
370
187
68
-10
-89.8
-167-13.2
-49.8
66

Load stage 3 V=353.8 kN 0.55 of ultimate
123
456
789 -235
-16
4
-6
31 -5
32
-6
82
-8
92
1788706
11401489
1791
1507
1616
181
1
1097
123
0
3556
3083
1868
3752
10
19
11
20
12
21
13
22
14
23
15
24
16
25
17
26
18
27
529
482
400
185
869
259
509
269
104
352
206
1117
229
168
687
85.9
Load stage 7 V=639.9 kN Peak load
123
456
89
-8
57
-6
57
-8
02
-1
579
7
30761827
31723838
11261856
4384
993
4391
3638
2316
3994
8003
6586
5104
8181
10
19
11
20
12
21
13
22
14
23
15
24
16
25
17
26
18
27
1478
1102
3015
651
4070
9431209
31.8
1123
174
1875
245
689
1232
96.5
-228
Figure 4.12: S1 Zurich Strains and Web Deformations at Selected Load Stages
4.3.6 S2
The horizontal Zurich strains at both flanges were similar to the longitudinal reinforcement strains at the
end of Load Stage 2. At Load Stage 7, however, Zurich strains at the bottom flange were much smaller
than the strain gauge measurements. S2 and S1 had similar strains on the flanges when they were both at
Load Stage 7, except the ones under east point load that were much smaller in S2. The vertical Zurich
strains of S2 were generally consistent with the strain distributions in stirrups, but at late load stages, the
surface strain became much larger than the stirrup strain at mid-span. There was a very large transverse
strain between targets number 2 and 5 at Load Stage 7, which is clearly shown by the web displaced shape.
This is consistent with the result of the experiment since top half of the web had more damage than the
bottom half at failure.
Load stage 2 V=236.6 kN 0.35 of ultimate
123
456
89
-180
-89
-43.1
-4
0
7
981
4851201
1066
44259.2
1644407
489
0
2244
1660
624
-3
57
-4
03
-7
22
2267
10
19
11
20
12
21
13
22
14
23
15
24
16
25
17
26
18
27 18.7150
239
317
341
203
262
437
238
405
163173 -30.8-31.9
-31.9-60
Load stage 7 V=677.5 kN Peak load
123
456
89
-88.6
-9
34
-6
97
-5
80
-3
692
7
1321
28072355
11821743
3007613
77072309
6603470
7698
6663
3822
8416
10
19
11
20
12
21
13
22
14
23
15
24
16
25
17
26
18
27 633
255
467
1175
363
1139
249
948
1411
964
1218
1223
1945
647
120
-211
Figure 4.13: S2 Zurich Strains and Web Deformations at Selected Load Stages
67

4.4 Clinometer Data Each specimen had two clinometers mounted at the top center of west diaphragm in order to continuously
track the inclination of west reaction support. Clinometers were the least stable instrument used in the
experiments because the recorded data always contained lots of noise. The measurements for specimen L1
and M2 were completely governed by noise that made them useless for experimental analysis. For the
other four specimens, the inclinations are plotted as functions of the shear forces shown in Figure 4.14.
Rotations are obtained by averaging the readings from the two clinometers. Similar to the settings used
for shear strain graphs, the inclination plots do not include the full range of data on the x-axis in order to
preserve more details for parts of the plots before the ultimate loads. Note that negative rotation indicates
the inclination was towards the east.
L2
0
100
200
300
400
500
600
-0.05 0.05 0.15 0.25 0.35 0.45 0.55
Inclination (degrees)
V (
kN)
M1
0
100
200
300
400
500
0 0.1 0.2 0.3 0.4 0.5 0.6
Inclination (degrees)
V (
kN)
S1
0
100
200
300
400
500
600
700
-0.05 0 0.05 0.1 0.15 0.2 0.25 0.3
Inclination (degrees)
V (
kN)
S2
0
100
200
300
400
500
600
700
800
-0.05 0 0.05 0.1 0.15 0.2 0.25 0.3 0.35 0.4
Inclination (degrees)
V (
kN)
Figure 4.14: Inclinations at West Reaction Support
Rotation of west reaction support mainly depended upon the magnitude of loading and flexural behavior
of each beam. The two specimens within each group had the same geometry and loading conditions, thus
before cracking, they were expected to have the same support inclinations under equal shear forces
68
regardless of the difference in the amount of shear reinforcements. However, flexural properties of the
specimens were actually affected by the cracks, which would cause the rotations to be less predictable.
The plots showed large differences in the west support rotations of S1 and S2. While S1 had larger
inclinations than S2 at early load stages, it had a significant decrease in rotation after Load Stage 5. This
decrease also occurred on specimen L2 and M1. L2 also had a rapid increase in the support rotation
during Load Stage 4, but there were not much increase in the crack widths and number of cracks between
Load Stage 3 and 4. Based on the available data, M1 was the only one that did not have negative
inclinations.
69

CHAPTER 5
Comparison of Experimental and Analytical Results
This Chapter provides comparisons between the experimental and predicted results. Shear strengths of the
six specimens were calculated using equations from the ACI code and CSA code. Everything used in the
calculations are as-built values that include the measured specimen dimensions shown in Table 2.2 and
the measured material properties listed in Table 2.3 and Table 2.4.
5.1 ACI Code The shear provisions from Chapter 11 of ACI 318-08 are used to calculate the shear strengths of the six
specimens. Since none of the beams was prestressed, according to the loading condition, the maximum
factored shear force Vu would occur inside the test region at a distance d from the edge of either one of
the diaphragms. All equations in this section have lb/in units.
Eq. (11-2) of ACI code defines the nominal shear strength of a beam to be the sum of strengths provided
by concrete and shear reinforcement separately:
Vn = Vc + Vs (5-1)
The shear strength contributed by concrete alone is given by Eq. (11-5) of the code:
Vc = (1.9 'cf +2500 wu
u
M
dV) dbw 3.5 'cf dbw (5-2)
Where w = db
A
w
s , and u
u
M
dV 1
According to Eq. (11-15) of the code, the shear strength provided by the stirrups is calculated as
following:
Vs = s
dfA ytv 8 'cf dbw (5-3)
In accordance with Clause 11.7.3, the maximum allowed shear strength of deep beams is given by:
Vn 10 'cf d bw (5-4)
As stated by Clause 11.1.2 of ACI 318-08, the concrete strength is limited by 'cf 100 psi for
calculating Vs and Vn, but according to Clause 11.1.2.1, this limit can be exceeded when computing Vc
alone, since the beams already contain more than minimum amount of web reinforcement. The maximum
70

yield strength of shear reinforcement can not exceed 60000 psi according to Clause 11.4.2, but for these
six beams it is reasonable to ignore this limit and use the actual measured values in calculations. The
shear strength is computed through iterative process by assuming a value of Vu for each new iteration
until Vu and Vn are equal.
5.2 CSA Code For CSA predictions, equations from Chapter 11 of CSA A23.3-04 are used. Based on the reinforcement
layout of the six beams, the critical section is taken at a distance dv from face of the support instead of d
as in ACI code. All equations in this section have N/mm units.
In CSA A23.3-04, the shear resistance is also obtained by summing the strengths provided by concrete
and shear reinforcement together:
Vr = Vc + Vs (5-5)
The shear strength provided by concrete is given is give by Eq. (11-6) of the code:
Vc = 'cf vwdb (5-6)
The shear strength provided by transverse reinforcement is given by Eq. (11-7) of the code:
Vs = cots
dfA vytv
(5-7)
The parameters β and θ used in the above equations are determined as the following:
)1000(
1300
)1(
40.0
zex s
(5-8)
ss
fvfx AE
VdM
2
/ , where f
v
f Vd
M (5-9)
g
zze a15
ss
35 = 300 mm for all six beams
x 700029 (5-10)
Clause 11.3.3 of the code specifies an upper limit to the shear strength of any reinforced concrete
member:
Vr 0.25fc′ vwdb (5-11)
In CSA A23.3-04, there is no limit on the reinforcement yield strength, but for concrete,
'cf 8 MPa
must be applied when determining Vc. The value of Vr is computed through iterative process by assuming
a value of Vf in each iteration until both quantities are equal.
71
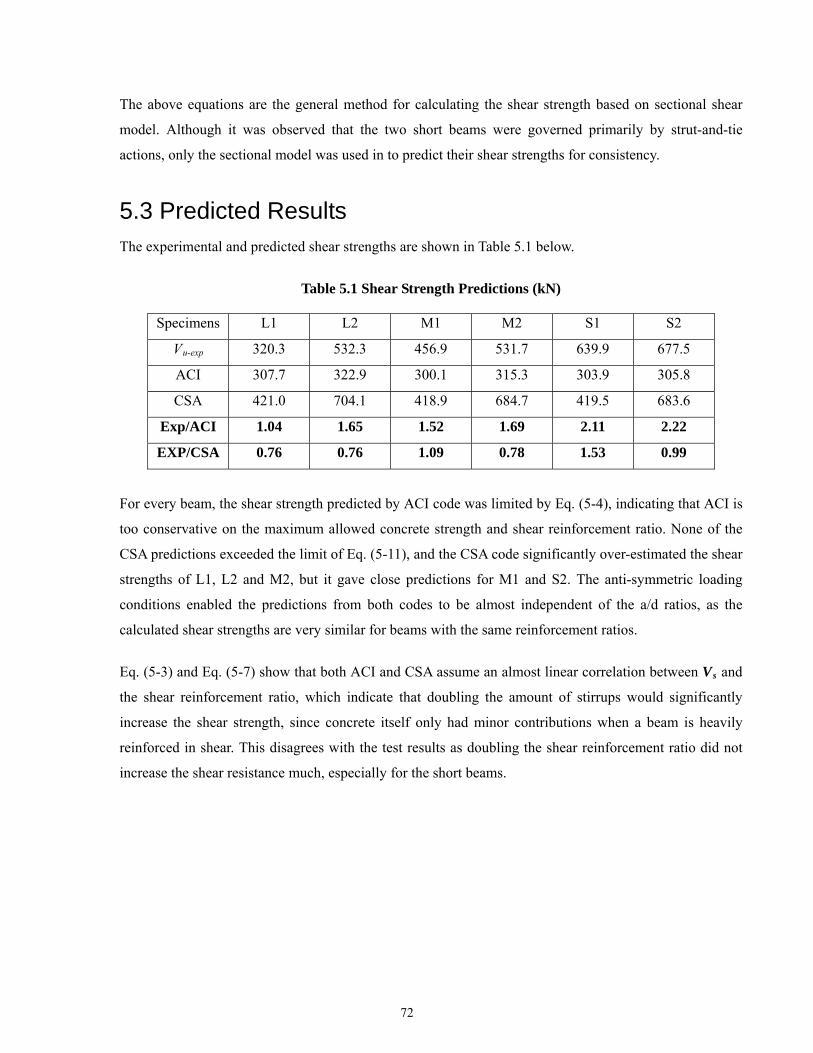
The above equations are the general method for calculating the shear strength based on sectional shear
model. Although it was observed that the two short beams were governed primarily by strut-and-tie
ctions, only the sectional model was used in to predict their shear strengths for consistency.
he experimental and predicted shear strengths are shown in Table 5.1 below.
Table 5.1 Shear Str Predictions (kN)
Sp
a
5.3 Predicted Results T
ength
ecimens L1 L2 M1 M2 S1 S2
Vu-exp 320.3 532.3 456.9 531.7 639.9 677.5
ACI 307.7 322.9 300.1 315.3 303.9 305.8
CSA 421.0 704.1 418.9 684.7 419.5 683.6
Exp/ACI 1.04 1.65 1.52 1.69 2.11 2.22
EXP/CSA 0.76 0.76 1.09 0.78 1.53 0.99
For every beam, the shear strength predicted by ACI code was limited by Eq. (5-4), indicating that ACI is
too conservative on the maximum allowed concrete strength and shear reinforcement ratio. None of the
CSA predictions exceeded the limit of Eq. (5-11), and the CSA code significantly over-estimated the shear
strengths of L1, L2 and M2, but it gave close predictions for M1 and S2. The anti-symmetric loading
conditions enabled the predictions from both codes to be almost independent of the a/d ratios, as the
alculated shear strengths are very similar for beams with the same reinforcement ratios.
ent ratio did not
rease the shear resistance much, especially for the short beams.
c
Eq. (5-3) and Eq. (5-7) show that both ACI and CSA assume an almost linear correlation between Vs and
the shear reinforcement ratio, which indicate that doubling the amount of stirrups would significantly
increase the shear strength, since concrete itself only had minor contributions when a beam is heavily
reinforced in shear. This disagrees with the test results as doubling the shear reinforcem
inc
72

CHAPTER 6
Conclusions and Recommendations
6.1 Conclusions The objective of this study was to find out the shear strength upper limit of heavily shear reinforced high
strength concrete beams and the maximum amount of transverse reinforcement that could be put into a
beam before over-reinforced shear failure would occur. Through the destructive testing of six I-beams
with three different shear span-to-depth ratios and two different shear reinforcement ratios, it was found
that the shear provision of ACI 318-08 was too conservative for high strength concrete members and the
limit on concrete strength and transverse reinforcement ratio should be increased. However, the sectional
model in CSA A23.3-04 over-estimated the ultimate shear resistance of the three beams that contained
roughly twice the maximum amount of stirrups allowed by ACI code. In general, none of the two current
concrete codes was able to give close predictions to all six experiments.
The more detailed conclusions are listed as below:
1). Increasing the transverse reinforcement ratio from 1.238% to 2.45% did not double the ultimate shear
resistances, and the percentage of strength gain diminished as the a/d ratio decreased. S2 had only
5.8% higher shear strength than S1, indicating that for deep beams with I-sections, putting more shear
reinforcement beyond the maximum allowed by ACI code would have little effect on improving the
shear strength.
2). Since the two short beams both had more than twice the shear resistance predicted by the ACI code,
the shear strength upper limit described by Eq. (5-4) should be increased. It is reasonable to raise the
concrete strength limit and increase the coefficient from 10 to a larger number. For slender beams, the
maximum allowed shear reinforcement ratio in ACI code could be doubled, but Eq. (5-3) would also
need to be modified since Vs would not increase linearly with further increase of shear reinforcement
ratio.
3). Specimen L1, M1, and S1 with lower shear reinforcement ratios had under-reinforced shear failures
through yielding of the stirrups at the failure locations. The other three beams that had more stirrups
showed over-reinforced shear failures since their stirrups were just starting to yield at the peak loads.
Among them, L2 and M2 failed abruptly, but S2 had a slower failure since its shear force was carried
directly through the diagonal compression strut and its web region received greater confining forces
from the flange diaphragms due to smaller a/d ratio.
4). According to strain gauge data and qualitative observations, the maximum transverse reinforcement
73

ratio should be around 2.45% for high strength concrete beams as it appeared to be the point where
over-reinforced shear failure started to occur. This ratio is equal to 0.138 fc′/ fyt, which is much less
than the 0.2 fc′/ fyt suggested in other studies (Lee and Hwang, 2010), although the latter was obtained
by testing beams with solid rectangular sections instead of I-sections.
5). For every specimen, the web surface at north side appeared very differently from the one at south side
after failure. The south face was always much more damaged than north face because the 10M
longitudinal rebar at mid-height of each beam resulted in much less concrete cover for the south web
surface, making it easily delaminated. Although this rebar helped crack width control, it weakened the
shear resistance of the web in a way that was predicted by neither ACI nor CSA code.
6). The lack of out of plane reinforcements in the two flanges caused longitudinal flange splitting during
every test. This problem was especially serious for specimen L1, which had a very large crack in the
middle of the top flange and eventually failed at a shear force much lower than expected. The external
flange clamps allowed L2 to have much fewer and smaller longitudinal cracks than L1, and reach
shear strength as high as that of M2. Therefore, flange cracking did affect the shear resistance of the
beams and this effect became smaller as a/d ratio decreased because of stronger constraints from the
two diaphragms.
7). Existence of the two diaphragms likely reduced the length of disturbed regions by spreading large
portions of the point loads outside the web and thus made each beam showing more sectional shear
behavior than expected. This was demonstrated by the parallel cracks that appeared on the two
medium and even the short beams, although the anti-symmetric loading condition would also result in
more parallel cracks due to zero moment at mid-span.
8). Measurements from both stirrup strain gauges and Zurich gauges showed that at similar shear forces,
increasing the shear reinforcement ratio or decreasing the a/d ratio would result in smaller transverse
strains. However, variations in these two parameters did not have apparent influences on other
deformations such as shear strains and longitudinal strains.
6.2 Recommendations for Future Work Despite the popularity of I-sections members in a wide variety of constructions, not many studies were
performed on examining the shear behaviors of I-beams with high transverse reinforcement ratios. The six
tests in this study only provided limited data for this topic, and more experiments are required for better
understanding of the shear behaviors of I-beams so that more accurate shear strength predictions can be
developed. The following future researches are recommended:
1). Every specimen in this project suffered longitudinal flange splitting for not having enough cross ties
74

in the flanges. Unlike solid rectangular beams, the shear flow in an I-section is not in a uniform
direction and will produce out of plane tension in the flanges that can cause them to split if not
enough cross ties were available. Therefore, it is important to test some specimens that are strongly
reinforced in the out of plane direction in order to prevent longitudinal cracking of the flanges at high
shear forces. By comparing with the results from this thesis, the effects of longitudinal cracking on
the ultimate shear strengths could be clearly shown.
2). The anti-symmetric loading condition used in this study provided each specimen with a very low
moment-to-shear force ratio at its critical section within the test region, which was ideal for analyzing
the behavior of a beam under almost pure shear. However, this loading condition made both
predictions from ACI and CSA code nearly independent of the a/d ratios, and the predicted results for
all three groups of beams were all roughly the same. Thus, more similar specimens should be tested
under different loading conditions to examine how their shear strengths will be affected. If possible,
slender I-section beams with a/d ratios much larger than that of L1 should also be tested.
3). Having different concrete covers at two faces of the web would not be a problem if a beam is lightly
reinforced in shear. However, when the beam contains lots of web reinforcements, a week plane is
created, and if one side of the web has much less clear cover than the other, it will fail earlier. Hence,
further experiments on thin web I-section beams should ensure that both sides of the web have similar
concrete clear covers. The six tests from this project should be repeated by simply removing the 10M
longitudinal rebar at mid-height to give each beam additional 11 mm concrete cover at south face of
the web. Although the north face still has more clear cover, the beams should be expected to have
higher ultimate shear strengths, especially for the ones with more stirrups.
75

References Canadian Standards Association (2004). A23.3-04, Design of Concrete Structures. Missisauga, Ontario.
Committee 318, A. C. I. (2008). Building Code Requirements for Structural Concrete (ACI
318-08) and Commentary. American Concrete Institute, Farmington Hills, MI.
Choulli, Y., Mari, A. R., and Cladera, A. (2008). Shear Behaviour of Full-Scale Prestressed I-Beams Made
with Self Compacting Concrete. Materials and Structures, 41, pp. 131-141.
Cladera, A., and Mari, A. R. (2005). Experimental Study on High-Strength Beams Failing in Shear.
Engineering Structures, 27, pp. 1519-1527.
Collins, M. P., Bentz, E. C., and Sherwood, E. G. (2008). Where is Shear Reinforcement
Required? Review of Research Results and Design Procedures. ACI Structural Journal, 105(5), pp.
590-600.
Collins, M. P., and Mitchell, D. (1997) Prestressed Concrete Structures, Response Publications, Toronto and Montreal, Canada.
Lachemi, M., Hossain, K. M. A., and Lambros, V. (2005). Shear Resistance of Self-Consolidating
Concrete Beams—Experimental Investigations. Canadian Journal of Civil Engineering, 32, pp.
1103-1113.
Lee, J. Y., and Hwang, H. B. (2010). Maximum Shear Reinforcement of Reinforced Concrete Beams. ACI
Structural Journal, 107(5), pp. 580-588.
Russo, G., Venir, R., and Pauletta, M. (2009). Reinforced Concrete Deep Beams—Shear Strength Model
and Design Formula. ACI Structural Journal, 102(3), pp. 429-437.
Tuchscherer, R., Birrcher, D., Huizinga, M., and Bayrak, O. (2011). Distribution of Stirrups across Web of
Deep Beams. ACI Structural Journal, 108(1), pp. 108-115.
Xie, L. (2009). The Influence of Axial Load and Prestress on The Shear Strength of Web-Shear Critical
Reinforced Concrete Elements. Ph.D. thesis, University of Toronto.
76

APPENDIX A
Material Properties
The detailed material properties are summarized in this appendix. These include the concrete
strength test results and the coupon test results of all steel reinforcements.
A.1 Concrete Properties Traditional slump flow method was used to measure the concrete workability. The workability of
the ready-mix SCC used in this test was acceptable. Diameter of the slump flow was measured to
be 590 mm, and this was reached in 3.5 seconds. There were no additional admixtures added to
the concrete before casting. The stress strain behavior of the concrete tested on the 148 day after
casting is shown in Figure A.1.
90
80
Cylinder #170 Cylinder #2
Cylinder #360
Figure A.1: Compressive Stress-Strain Curves for Concrete Cylinders
0
10
20
30
40
50
0.0 0.5 1.0 1.5 2.0 2.5
Cylinder #4
Stress (MPa)
Strain (×10-³)
77

The concrete strength was tested using three different equipments. The detailed test results are tabulated in table A.1 in chronological order.
Table A.1: Concrete Cylinder Compressive Strengths
Specimen Cylinder fc′ (MPa) Age at cylinder testing (days)
Age of specimen at testing (days)
1 44.2 2 44.5
— 3 44.1
3
—
1 63.9 2 61.0
— 3 62.9
7
—
1 86.9 2 85.1
M1
3 85.9
52
51
1 86.9 2 86.2
M2
3 85.6
64
63
1 89.2 2 84.8 3 84.5
S2
4 81.4
71
71
1 88.2 2 88.5 3 84.5
S1
4 85.9
85
84
1 88.8 2 88.8 3 87.9
L1, L2
4 88.2
129
127 (L1)
143 (L2)
78

A.2 Steel Reinforcement Properties The results of all tensile coupon tests are provided through Figures A.2 to Figures A.6.
0
100
200
300
400
500
600
700
0.00 0.05 0.10 0.15 0.20 0.25 0.30
Strain
Stress (MPa)
Figure A.2: Stress Strain Relationship of 25M Deformed steel bar
0
200
400
600
800
1000
1200
0 5 10 15 20 25 30
Strain (mm/m)
Stress (MPa)
Figure A.3: Stress Strain Relationship of 1″ Dywidag bar
79

0
100
200
300
400
500
600
700
0.00 0.05 0.10 0.15 0.20 0.25
Strain
Stress (MPa)
Figure A.4: Stress Strain Relationship of 10M Deformed Bar used in Test Region
0
100
200
300
400
500
600
700
0.00 0.05 0.10 0.15 0.20
Strain
Stress (MPa)
Figure A.5: Stress Strain Relationship of 10M Deformed Bar used in Non Test Region
80

0
100
200
300
400
500
600
700
0 10 20 30 40 5
Strain (mm/m)
Stress (MPa)
0
Figure A.6: Stress Strain Relationship of D4 wire
81

APPENDIX B
Method for Estimating the Vertical Displacement
This appendix explains the detailed method used to obtain the vertical deflections for specimens
M1, M2, S1 and S2 shown in Figure 4.1 in Chapter 4.
Due to the mistakes of not having LVDTs measuring the support displacements in the first four
experiments, the actual vertical deflections of the two medium beams and two short beams could
not be determined using the existing LVDT data along. In order to calculate the support
displacements, the 3D scanner data was used.
As shown in Figure 2.24, Specimens S1 and S2 both had two LED targets mounted on the west
diaphragm with one LED at the top and the other one at the bottom. This bottom target provided
an estimation of the displacement for the west support. It was just an estimation was because the
LED target was only at north side of the beam, where for specimens L1 and L2, the displacement
at each support was measured by two LVDTs with one placed at each side of the beam. Based on
data from the two long beams, there was indeed a large difference between the support
displacements measured at the two sides. Furthermore, the LED data was not available between
load stages, so the support displacements between load stages were generated using linear
interpolation based on the LED measurements from the end of previous load stage and the start of
next load stage.
Unlike the two short beams, M1 and M2 only had one LED target on the west diaphragm, and it
was mounted at the top since the 3D scanner was not able to detect a target at the bottom. Data
from the two LED targets mounted on the east diaphragms of these two beams showed that there
was negligible amount of compression in the east diaphragm throughout the experiments.
Therefore, this LED at the top of west diaphragm was able to provide an estimated displacement
data for the west support except that it was also affected by rotation of the diaphragm compare to
the bottom LED. For both M1 and M2, this rotation resulted in smaller vertical displacement
measured by the top LED at the last load stages. To account for this, the support displacement
was taken to be the last measurement before it started to drastically decrease, and then kept
constant until the loading stopped. This adjustment was based on assuming that the support
displacement was contributed primarily by the settlement of plaster, which was not ductile. This
assumption was reasonable because the maximum vertical movement of the floor was only
82

around 0.2 mm, less than 10% of the total support displacement.
Calculating the net deflection of a beam requires the vertical displacements at both supports.
However, due to the limit on field of view, the 3D scanner was only able to capture the LED
position at the west support, leaving the east support displacement completely unknown for these
four beams. Therefore, displacement at the east support must be estimated based on the data that
is already available. This is achieved through the following steps:
1. Plot all the available support displacements as a function of the corresponding reaction force.
This include the displacements recorded by the LVDTs at both east and west supports for the
two long beams and the ones measured by LEDs at the west support for the other four beams.
2. Assume the supports had a linear load-deflection relationship and draw a line of best fit for all
data on the plot.
3. Use this line of best fit to calculate the expected displacement at the east support.
Figure B.1 on the next page shows the available support displacement data for all six beams.
Note that displacement at the west support of L2 was not taken into account when producing the
line of best fit because the plaster at that support was more fluid than the others, and resulted in
large settlement at early load stages.
83

0
200
400
600
800
1000
0 1 2 3 4 5
Support Displacement (mm)
6
L1 West supportL1 East supportL2 West supportL2 East supportM1 West supportM2 West supportS1 West supportS2 West support
Reaction Force (kN)
Figure B.1: Support Displacement as a Function of Reaction Force
The line of best fit in the Figure above has a slope of approximately 240 kN/mm, which is the
number used to calculated the east support displacements for M1, M2, S1, and S2. Note that this
method only yields a very rough estimation of the displacement at east support, and the LED
target alone could not accurately track the displacement at west support either. Hence, the net
deflections calculated for these four beams were not accurate, but at least they gave closer
representations of the actual deflections compare to the ones measured directly by the vertical
LVDTs underneath the beams.
84

APPENDIX C
Test Results
This Appendix contains the results from all six experiments. These include all the crack diagrams,
load-displacement and shear strain plots, Zurich data, and load stage data.
The load-displacement graphs for M1, S1, S2, and L1 do not include the full ranges of
displacements because these four beams all had slow failures and the increasing damages in the
test region made the LVDT readings no longer accurate as the beams were failing. Same things
also apply for the shear strain plots.
The Zurich data will include displaced shape diagrams and numerical Zurich strains. The
displaced shape diagrams were drawn using the MATLAB script provided by Dr. Boyan
Mihaylov. Although the Zurich targets and crack traces were on two different sides of the web,
the displaced shape diagrams produced by Zurich readings are drawn in the same orientation as
the crack trace diagrams since they are placed adjacent to each other for each of comparison. The
displaced shape diagrams are only shown for the web region of each beam, since Zurich grids in
the flanges had readings in the horizontal direction only, which made it impossible to construct
two dimensional displaced shapes.
The numerical Zurich strain data are also provided for every load stage of each beam. All strains
are calculated based on the initial Zurich readings before starting the experiment. All negative
strains were labeled in red color, and others are labeled in blue. These numerical strains are
displayed in the same orientation as the crack trace diagrams.
The load stage data for each specimen is summarized in a table that includes selected readings
from the LVDTs, strain gauges, and clinometer. Numbers listed for the five vertical LVDTs placed
at bottom of the beam are the net deflections that have already taken into the account of the
support displacements. Note that for beams M1, M2, S1, and S2, the displacement of west
support was measured by the 3D scanner, and the one of east support was calculated using the
method shown in Appendix B.
85

C.1 L1
0
50
100
150
200
250
300
350
0 2 4 6 8 10 12
Displacement (mm)
V (kN)
14
ELD
WLD
TC
TCE
TCW
Figure C.1: Net Displacement of L1 Measured by Five Vertical LVDTs
0
50
100
150
200
250
300
350
-1 1 3 5 7 9
Shear Strain (mm/m)
V (kN)
11
West
East
Figure C.2: Shear Strain of L1 Measured by the Cross LVDTs
86

Cro
ss L
VD
Ts
Ver
tica
l LV
DT
s C
lino
met
erSt
rain
Gau
ges
Net
Dis
plac
emen
t of
Bea
m
Sup
port
Dis
plac
emen
t D
set
T
ime
V
γ–
Wes
t γ–
Eas
t
WL
DT
CW
TC
T
CE
EL
DW
est
Eas
t
Wes
t
Dia
phra
gm
Rot
atio
n
B3
C3
T3
Loa
d
Sta
ge
(#)
(h:m
m:s
s)
(kN
) (με)
(με)
(m
m)
(mm
)(m
m)
(mm
)(m
m)
(mm
) (m
m)
(deg
rees
) (με)
)(με
(με)
0 in
itia
lize
0
0 0
0 0
0 0
0 0
0 0
0 0
0
31
0:00
:00
6.9
6 2
0.06
-0
.012
0.
030
0.03
2 0.
034
0.08
0
0.05
6 0.
15
11
11
15
53
0:12
:40
36.4
10
47
101
0.57
0.
07
0.16
0.
24
0.25
0.
19
0.22
0.
16
16
10
21
1
65
0:30
:14
8.7
-81
17
0.34
-0
.014
0.
032
0.03
8 0.
064
0.15
0.
10
0.16
16
13
20
114
0:37
:35
80.6
35
1 51
1 1.
33
0.23
0.
50
0.83
0.
96
0.28
0.
34
0.23
44
46
45
1
(res
tart
)
125
0:55
:28
73.8
36
3 51
2 1.
29
0.24
0.
47
0.85
0.
96
0.29
0.
34
0.15
45
47
47
190
1:07
:27
159.
5 14
89
1475
3.
15
0.73
1.
52
2.39
2.
68
0.71
0.
49
0.13
16
7 64
23
7 2
207
1:25
:11
145.
8 15
08
1516
3.
01
0.64
1.
42
2.28
2.
55
0.94
0.
49
0.11
16
5 73
23
7
268
1:37
:38
239.
5 29
62
2810
5.
20
1.59
3.
02
4.38
4.
69
1.60
0.
62
0.18
33
1 14
02
367
3
296
2:58
:26
213.
9 29
11
2801
4.
92
1.51
2.
85
4.11
4.
45
2.09
0.
65
0.31
31
3 13
57
354
358
3:10
:34
305.
1 36
47
4544
7.
09
2.25
4.
19
6.04
6.
43
2.19
0.
76
0.42
47
8 19
22
464
4
375
3:50
:26
274.
7 35
85
4607
6.
86
2.21
4.
06
5.83
6.
17
2.32
0.
81
0.41
45
8 17
84
434
onse
t to
fail
ure
415
3:56
:54
320.
3 52
65
6877
9.
15
3.77
6.
17
7.96
7.
95
2.33
0.
86
0.4
613
1777
37
2 ul
tim
ate
Tab
le C
.1:
Loa
d S
tage
Dat
a fo
r S
pec
imen
L1
87
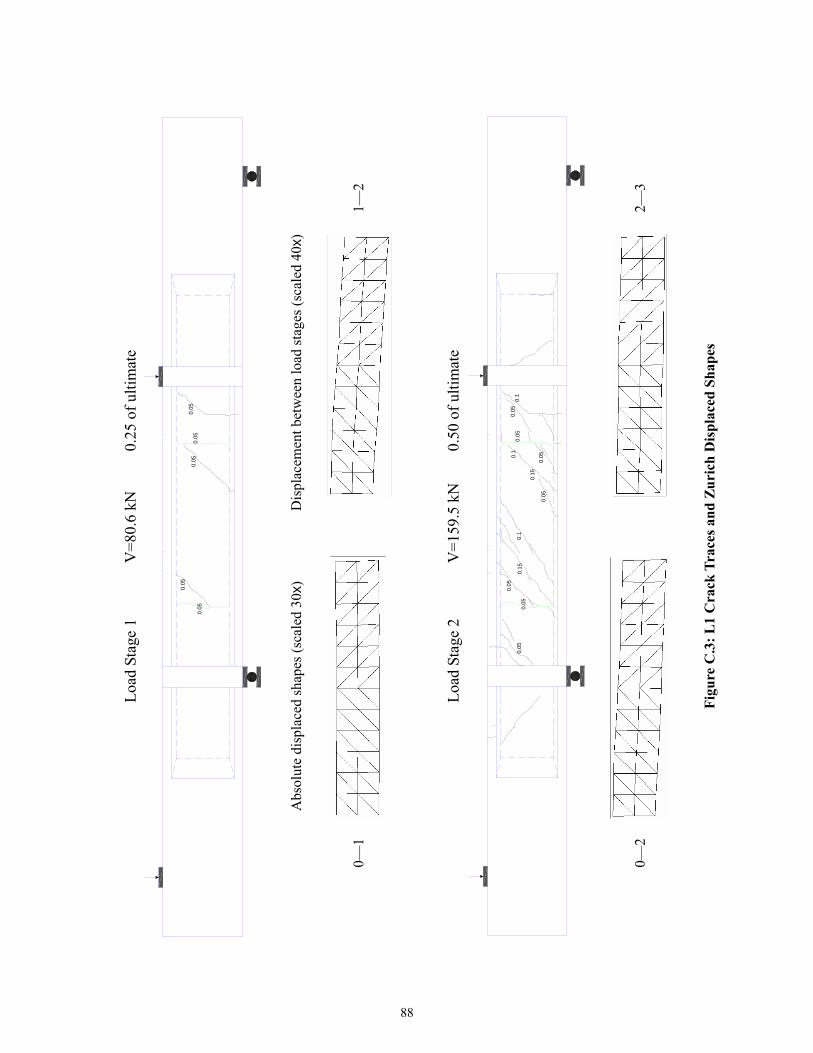
Loa
d St
age
1
V=
80.6
kN
0.25
of
ulti
mat
e
0.05
0.0
5
0.0
50.
05
0.0
5
0—1
Abs
olut
e di
spla
ced
shap
es (
scal
ed 3
0x)
Dis
plac
emen
t bet
wee
n lo
ad s
tage
s (s
cale
d 40
x) 1—
2
Loa
d St
age
2
V=
159.
5 kN
0.
50 o
f ul
tim
ate
0.1
0.0
50.
10.
05
0.0
5
0.1
5
0.0
5
0.1
0.1
5
0.05
0.0
50.
05
0—2
2—3
Fig
ure
C.3
: L
1 C
rack
Tra
ces
and
Zu
rich
Dis
pla
ced
Sh
apes
88

Loa
d St
age
3
V=
239.
5 kN
0.
75 o
f ul
tim
ate
0.1
50
.10.
150.
15
0.1
0.2
0.1
0.1
50
.15
0.1
5
0.1
0.1
0.15
0.1
0—3
Abs
olut
e di
spla
ced
shap
es (
scal
ed 3
0x)
Dis
plac
emen
t bet
wee
n lo
ad s
tage
s (s
cale
d 40
x) 3—
4
L
oad
Stag
e 4
V
=30
5.1
kN
0.95
of
ulti
mat
e
0.1
0.1
50.
15
0.2
0.15
0.1
5
0.2
0.1
0.1
50
.2
0.1
5
0.1
0.15
0.1
0.2
0.35
0—4
Fig
ure
C.4
: L
1 C
rack
Tra
ces
and
Zu
rich
Dis
pla
ced
Sh
apes
89

F
ailu
re
V
=32
0.3
kN
Fig
ure
C.5
: L
1 C
rack
Tra
ces
at F
ailu
re
90

L
oad
Stag
e 1
V
=80
.6 k
N
0
.25
of u
ltim
ate
12 15
1617
1819
2021
2223
2425
2829
3031
3233
3536
3738
39
-202
-96.8
-124
-45
-249
-288
-117
-102
-47
-96.6
-289
-99.3
-112
-213
-237
-149
-204
-207
-0.709
-16.9
-243
-26.9
-29.1
-72.8
-30.8
-135
68.2
-551
-539 -223
36.8
23.7
-120
4
-179
1.06
-39
-2
-249
-60
-48.
7
-8
8.7
1
-72
-67.
8
-4
3.2
-1
36
-145
-191
-100
-3
8.6
-1
35
-5
6.6
-2
54
-1
03
-2
68
-4
0.6
-5
4
-1
2.5
-6
6.1
-2
.5
-1
10
-2
33
-6
0.7
34
56
78
910
1112
13
1426
2734
107
706
50.3
692
610
497
19.8
936
55.5
238
66.5 383
4.59 -
480 71.7
590
- 138
46.6 234
- 313
74.1
520 8.8
596
147 211
48.5 -
534
731
13.5
7.
3
48.5
14.8
26
.5
80
3
784
53.5
55.6
547
93.
8
796
771
65.
1
44
9.5
2
645
445
10.
3
40
57
41
58
42
59
43
60
44
61
45
62
46
63
47
64
48 65
49
66
50
67
51
68
52
69
53
70
54
71
55
72
56
73
3.5
83.3
80.6
113
168
41.5
225
141
298
97.6
402
405
436
17.3
315
362
248
158
445
515
-12.8
-23.5
-84.6
-21.5
-16.8
-91.6
-80.8
-16.6
-64.3
-58.3
-37.3
-12.5
Loa
d St
age
2
V=
159.
5 kN
0.50
of
ulti
mat
e
12
34
56
12
1516
1718
1920
2122
2425
26
2829
3031
3233
3436
3738
39
-108
-123
-79.5
-182
-40.8
-109
-357
-176
-173
-117
-245
10-295
-9.22
1-193
-75.6
-66.8
-114
-57.3
-155
-25
2
-39
6
-22
5
-12
3
-1
59
-19
8
-1
40
-1
99
-28
6
-15
5
-200
-20
0
-32
7
-1
80
-2
38
-2
25
-2
86
-2
35
-1
82
-2
21
-1
69
-1
23
-8
8.6
-2
44
-3
02
-4
20
-2
03
-8
2.9
78
910
1113
1423
2735
244
513
389
469
999
965
958
806
711
46621
234
748
724
466
480
729
85.7
57.7
774 1280
127 1063
1142 1168
18 1567
21.1 703
164
1092 65.2
627 1544
1756 933
1301 1392
1.42 1076
104
553 10.3
788
541
849
742
1523
1192
2515
1115
814
233
7
900
214
8
122
1
350
964
4.5
807
211
8
204
3
600
40
57
41
58
42
59
43
60
44
61
45
62
46
63
47
64
48 65
49
66
50
67
51
68
52
69
53
70
54
71
55
72
56
73
10.3
127
15.8
161
350
275
488
389
383
217
603
922
741
368
451
719
468
388
656
937
-113
-197
-200
-189
-169
-244
-126
-190
-138
-102
-67.8
-39.5
Fig
ure
C.6
: L
1 N
um
eric
al Z
uri
ch S
trai
ns
for
Loa
d S
tage
1—
2 (u
nit
s: με)
91
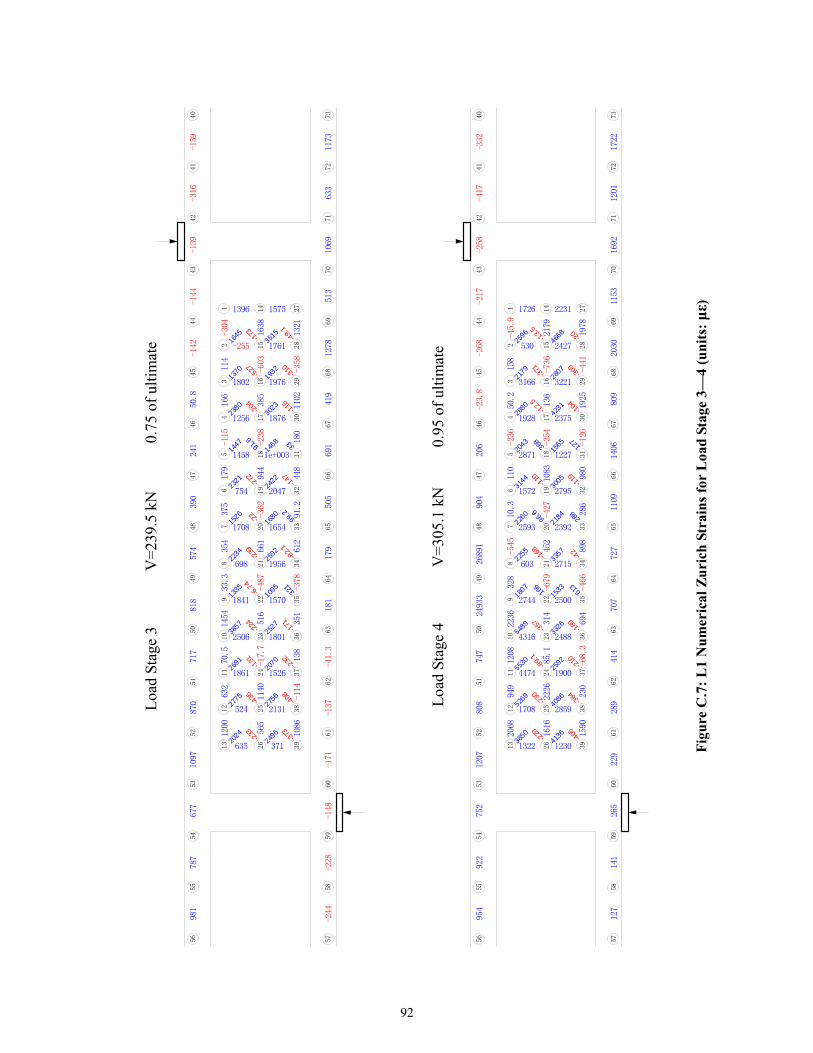
Loa
d St
age
3
V=
239.
5 kN
0.75
of
ulti
mat
e
12
34
56
78
910
1112
13
1415
21
2324
26
28
2930
32
34
3637
38
39
-304
-115
-603
-238
-362
-487
-17.7
-358
-378
-114
55 -
173
-52
7
-20
4
-27
2
-22
-23
9
-6.
74
-22
4
-13
1
-43
6
-233
-4
9.1
3
-3
10
-1
16
46
-1
47
-8
2.1
2
109
-1
71
2
-2
32
207
-4
08
-3
73
1617
18
19
2022
25
2731
3335
114
166
179
375
354
33.3
1454
70.5
632
1200
1638
385
944
661
516
1140
565
1321
1102
180
448
91.2
612
351
138
1086
1396 1575
-2 1761
1802 1976
1256 1876
1458 1e+003
754 2047
1708 1654
698 1956
1841 1570
2506 1801
1861 1526
524 2131
635 371
1645
1370
2380
91
.6
14
47
2321
1526
2234
1335
3857
2691
2775
2024
51
5
193
2
302
3
33
1
8
242
2
99
.2
168
0
59
2
32
1
5
52
7
0
275
6
249
6
40
57
41
58
42
59
43
60
44
61
45
62
46
63
47
64
48 65
49
66
50
67
51
68
52
69
53
70
54
71
55
72
56
73
50.8
241
181
390
179
574
505
818
691
717
419
870
1278
1097
513
677
1069
787
633
981
1173
-159
-244
-316
-228
-139
-148
-144
-171
-142
-137
-41.3
Loa
d St
age
4
V=
305.
1 kN
0
.95
of u
ltim
ate
12
34
56
78
910
1112
13
1415
21
2324
26
28
2930
32
34
3637
38
39
-45.9
-236
-545
-736
-354
-427
-679
8
-441
-126
-466
-68.3
-13.
5
-371
-12.
5
-110
-168
-357
-89.
1
-230
-220
-2
0
-3
09
-1
04
-1
19
-4
2
3
-1
89
3
-2
10
2
-3
84
-4
06
4
1617
18
19
2022
25
2731
3335
158
50.2
110
10.3
328
2236
1208
949
2068
2179
136
1083
452
314
5.1
2226
1616
1978
1925
980
286
898
694
230
1590
1726 2231
530 2427
3166 3221
1928 2375
2871 1227
1572 2795
2593 2392
603 2715
2744 2500
4316 2488
4474 1900
1708 2859
1322 1230
2596
2179
2880
36
8
20
43
3144
96
.6
22
60
2255
16
6
18
07
5489
5530
5269
3850
46
68
28
07
42
31
12
7
15
65
30
05
28
8
21
84
35
7
61
3
15
33
32
6
59
2
40
86
13
6
40
57
41
58
42
59
43
60
44
61
45
62
46
63
47
64
48 65
49
66
50
67
51
68
52
69
53
70
54
71
55
72
56
73
127
141
265
229
289
414
206
707
904
727
26891
1109
24933
1406
747
809
808
2030
1207
1153
752
1692
922
1201
954
1722
-332
-417
-258
-217
-268
-23.8
Fig
ure
C.7
: L
1 N
um
eric
al Z
uri
ch S
trai
ns
for
Loa
d S
tage
3—
4 (u
nit
s: με)
92

C.2 L2
0
100
200
300
400
500
600
0 5 10 15 20 25 30
Displacement (mm)
V (kN)
WLD
TCW
TC
TCE
ELD
Figure C.8: Net Displacement of L2 Measured by Five Vertical LVDTs
There is no shear strain measured for L2 because the cross LVDTs were not able to be mounted in
the presence of external clamps on the flanges.
93
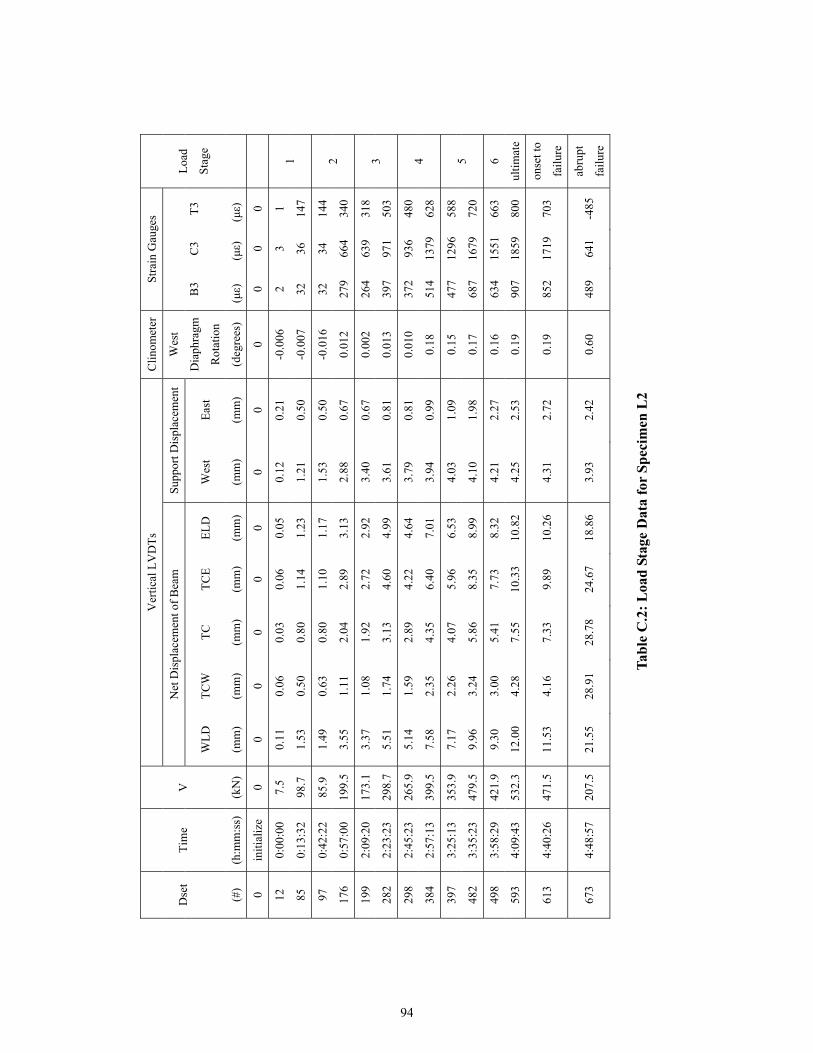
Ver
tica
l LV
DT
s C
lino
met
erSt
rain
Gau
ges
Net
Dis
plac
emen
t of
Bea
m
Sup
port
Dis
plac
emen
tD
set
T
ime
V
WL
D
TC
W
TC
T
CE
E
LD
W
est
Eas
t
Wes
t
Dia
phra
gm
Rot
atio
n
B3
C3
T3
(#)
(h:m
m:s
s)
(kN
) (m
m)
(mm
) (m
m)
(mm
) (m
m)
(mm
) (m
m)
(deg
rees
)(με)
(με)
(με)
Loa
d
Stag
e
0 in
itia
lize
0
0 0
0 0
0 0
0 0
0 0
0
12
0:00
:00
7.5
0.
11
0.06
0.
03
0.06
0.
05
0.12
0.
21
-0.0
06
2 3
1
85
0:13
:32
98.7
1.
53
0.50
0.
80
1.14
1.
23
1.21
0.
50
-0.0
07
32
36
147
1
97
0:42
:22
85.9
1.
49
0.63
0.
80
1.10
1.
17
1.53
0.
50
-0.0
16
32
34
144
176
0:57
:00
199.
5
3.55
1.
11
2.04
2.
89
3.13
2.
88
0.67
0.
012
27
9 66
4 34
0 2
199
2:09
:20
173.
1
3.37
1.
08
1.92
2.
72
2.92
3.
40
0.67
0.
002
26
4 63
9 31
8
282
2:23
:23
298.
7
5.51
1.
74
3.13
4.
60
4.99
3.
61
0.81
0.
013
39
7 97
1 50
3 3
298
2:45
:23
265.
9
5.14
1.
59
2.89
4.
22
4.64
3.
79
0.81
0.
010
37
2 93
6 48
0
384
2:57
:13
399.
5
7.58
2.
35
4.35
6.
40
7.01
3.
94
0.99
0.
18
514
1379
62
8 4
397
3:25
:13
353.
9
7.17
2.
26
4.07
5.
96
6.53
4.
03
1.09
0.
15
477
1296
58
8
482
3:35
:23
479.
5
9.96
3.
24
5.86
8.
35
8.99
4.
10
1.98
0.
17
687
1679
72
0 5
498
3:58
:29
421.
9
9.30
3.
00
5.41
7.
73
8.32
4.
21
2.27
0.
16
634
1551
66
3
593
4:09
:43
532.
3
12.0
0 4.
28
7.55
10
.33
10.8
2 4.
25
2.53
0.
19
907
1859
80
0
6
ulti
mat
e
613
4:40
:26
471.
5
11.5
3 4.
16
7.33
9.
89
10.2
6 4.
31
2.72
0.
19
852
1719
70
3 on
set t
o
fail
ure
673
4:48
:57
207.
5
21.5
5 28
.91
28.7
8 24
.67
18.8
6 3.
93
2.42
0.
60
489
641
-485
ab
rupt
fail
ure
Tab
le C
.2:
Loa
d S
tage
Dat
a fo
r S
pec
imen
L2
94

Loa
d St
age
1
V=
98.7
kN
0.1
9 of
ult
imat
e
0.1
0.1
0.0
50.
1
0.1
0.1
50.
15
0—1
Abs
olut
e di
spla
ced
shap
es (
scal
ed 3
0x)
Dis
plac
emen
t bet
wee
n lo
ad s
tage
s (s
cale
d 40
x) 1—
2
L
oad
Stag
e 2
V
=19
9.5
kN
0.3
7 of
ult
imat
e
0.1
0.15
0.1
0.1
0.1
0.1
5
0.1 0.1
0.1
0.1
0.0
5 0.1
0.1
0.05
0.1
0.0
5
0—2
2—3
F
igu
re C
.9:
L2
Cra
ck T
race
s an
d Z
uri
ch D
isp
lace
d S
hap
es
95
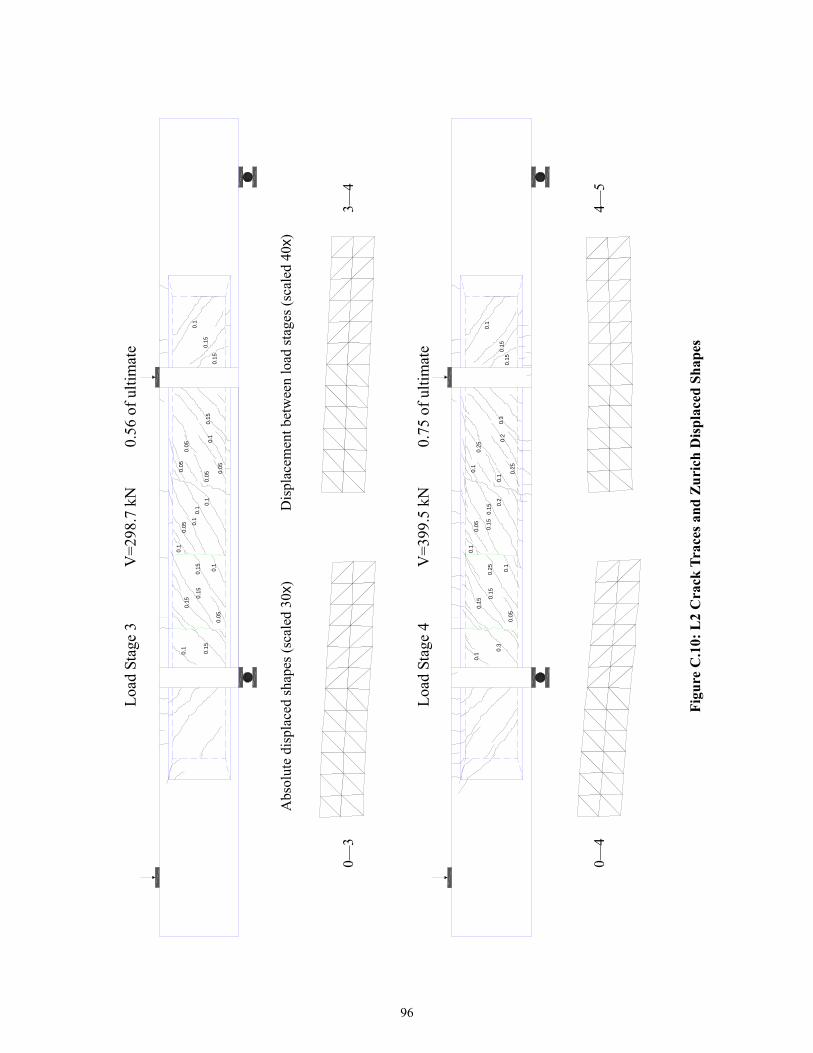
Loa
d St
age
3
V=
298.
7 kN
0
.56
of u
ltim
ate
0.1
5
0.1
5
0.1
0.1
0.1
0.1
5
0.1
5
0.1
0.1
0.0
5 0.1
0.0
50.0
5
0.1
0.1
5
0.0
5
0.0
5
0.05
0.1
5
0.1
5
0.1
0—3
Abs
olut
e di
spla
ced
shap
es (
scal
ed 3
0x)
Dis
plac
emen
t bet
wee
n lo
ad s
tage
s (s
cale
d 40
x) 3—
4
L
oad
Stag
e 4
V
=39
9.5
kN
0.7
5 of
ult
imat
e
0.3
0.1
5
0.1
0.1
5 0.2
0.3
0.2
5
0.1
0.1
0.05 0.1
5
0.1
0.1
0.2
0.1
5
0.0
5
0.25
0.2
50
.15
0.1
5
0.1
0—4
4—5
F
igu
re C
.10:
L2
Cra
ck T
race
s an
d Z
uri
ch D
isp
lace
d S
hap
es
96

Loa
d St
age
5
V=
479.
5 kN
0
.90
of u
ltim
ate
0.4
0.2
0.15
0.15 0
.25
0.3
0.2
5 0.1
0.1
0.15
0.15
0.1
0.1
0.2
0.15
0.1
0.25
0.3
0.1
50.
15
0.1
0—5
Abs
olut
e di
spla
ced
shap
es (
scal
ed 3
0x)
Dis
plac
emen
t bet
wee
n lo
ad s
tage
s (s
cale
d 40
x) 5—
6
L
oad
Stag
e 6
V
=53
2.3
kN
P
eak
load
0.4
0.25
0.15
0.15 0
.25
0.3
0.2
5 0.1
5
0.1
0.1
5 0.1
5
0.1
0.2
0.15
0.1
5
0.2
5
0.4
0.1
0.2
5
0.1
50
.15
0.1
5
0—6
Fig
ure
C.1
1: L
2 C
rack
Tra
ces
and
Zu
rich
Dis
pla
ced
Sh
apes
97
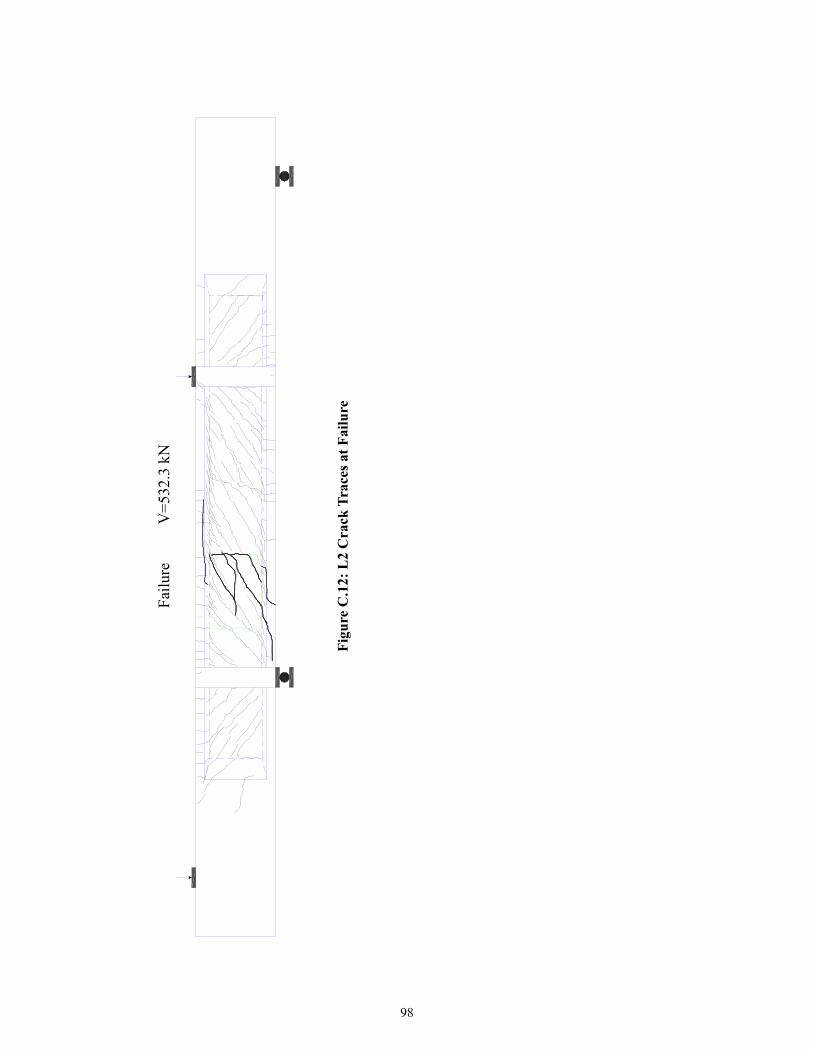
F
ailu
re
V
=53
2.3
kN
Fig
ure
C.1
2: L
2 C
rack
Tra
ces
at F
ailu
re
98

L
oad
Stag
e 1
V
=98
.7 k
N
0
.19
of u
ltim
ate
12
34
56
78
910
1112
13
14
15
1617
1920
22
2425
28
2930
3132
33
34
35
36
3738
39
-50.5
-132
-55.2
-150
-61
-123
-80.3
-237
-202
-349
-198
-100
-96.8
-278
-155
-250
-140
-194
-1.06
-190
-58.3
-293
-48.7 -153
-8.89
-338 -211
-92.1
-124 6.7
-192
-57.1
-173
-2
77
-229
-130
-168
-458
-152
-307
-198
-2
56
-263
-371
-1
31
-1
08
-2
7.3
-1
68
-2
16
-2
33
-1
79
-1
85
-2
80
-1
31
-2
40
-9
.51
-1
55
-3
72
1821
23
26
27
547
59.4
198
11.3
487
240
643
398
336
821
373
481
615
8.86
184
19 417
25.7
125
30.5 221
63.7 29.7
15.3 4.61
116
-7
329 83
658
409
2.02
26.
5
0.752
622
119
97.7
86.9
305
83.4
641
662
590
630
53.
4
627
626
119
126
249
135
721
109
5
40
57
41
58
42
59
43
60
44
61
45
62
46
63
47
64
48
65
49
66
50
67
51
68
52
69
53
70
54
71
55
72
56
73
72.3
97256
97
52.8
61.1
178
94
216
109
314
164
399
225
-80.5
-97.8
-89.1
-60.8
-130
-167
-72.1
-94.1
-120
-177
-190
-48.9
-73.4
-41.7
-75.3
-127
-13.3
-31.5
Loa
d St
age
2
V=
199.
5 kN
0
.37
of u
ltim
ate
12
3 1617
1920
2122
25
2829
3031
3233
3435
36
3738
39
-219
-332
-141
-350
-225
-362
-658
-311
-114
-681
-351
-137
-392
-67.7
-598
-166
-106
-111
-36.8
-400
97.3
-378
-232
-418
-443
-8
.82
-360
-441
-317
-669
-339
-636
-279
-370
-410
-604
-2
03
-2
60
-1
24
-3
13
-3
8.9
-3
82
-3
85
-5
81
-3
82
-4
87
-3
67
-7
02
45
67
89
10
1112
13
14
1518
23
2426
27
532
256
141
234
562
213
350
409
454
844
660
605
747
494
443
509
323
126
79.7
289 740
-31.4 832
171
185
447 1165
1086 771
204 490
359 621
993 576
682
468 -
441
610
724
230
1482
1276
1329
1193
1204
1054
896
1183
1133
17
79
10
03
24
4
10
81
11
77
12
12
12
75
64
3
15
39
63
3
83
2
17
49
40
57
41
58
42
59
43
60
44
61
45
62
46
63
47
64
48 65
49
66
50
67
51
68
52
69
53
70
54
71
55
72
56
73
108
26.5
109
24.2
32.5
225
30.5
122
308
636
182
80.6
300
367
177
401
192
601
401
815
478
-150
-210
-247
-231
-219
-195
-96.6
-78.5
-74
-116
-48.6
Fig
ure
C.1
3: L
2 N
um
eric
al Z
uri
ch S
trai
ns
for
Loa
d S
tage
s 1—
2 (u
nit
s: με)
99

L
oad
Stag
e 3
V
=29
8.7
kN
0.5
6 of
ult
imat
e
12
34
56
78
910
1112
13
14
15
1617
1920
22
2425
28
2930
3132
33
34
35
36
3738
39
-733
-235
-422
-45.6
-58.4
-525
-791
-622
-524
-863
-69.8
-90.1
-317
-169
-514
-492
-540
-609
-320
-713
-389
-778
-442
-46
1
-3
59
-753
-4
20
-5
07
-2
05
-2
85
-2
7.3
-4
66
-4
15
-6
79
-4
17
-5
10
-5
50
-8
42
1821
23
26
27
409
475
292
553
604
812
613
493
890
40444
104
974
813
1286
724
766
735
862
339
374
108
88.9
264 681
555 1031
456 583
188 284
673 1876
1496 890
175 526
583 533
1286 717
477 1109
1970 -28.2
505 1110
1202
1773
781
1020
1828
1556
1632
1582
1297
2237
1981
256
1
1493
225
0
163
5
144
2
150
6
166
5
173
4
163
4
701
211
6
992
184
8
268
0
40
57
41
58
42
59
43
60
44
61
45
62
46
63
47
64
48
65
49
66
50
67
51
68
52
69
53
70
54
71
55
72
56
73
157
85.5
154
175
157
613
574
304
451
898
362
266
674
566
331
572
482
925
720
1258
934
-309
-307
-397
-275
-245
-228
-68.7
-120
-173
-97.2
-50.7
Loa
d St
age
4
V=
399.
5 kN
0
.75
of u
ltim
ate
12
34
56
78
910
1112
13
14
1516
1719
2022
25
2829
3031
3233
3435
36
3738
39
-481
-7.08
-694
-392
-404
1-1082
-658
1
-810
-677
7-29.7
-205
-764
-91
2
-93
2
-111
1
-66
8
-11
08
-790
-69
1
-505
-403
-42
1
-71
6
-5
24
-6
60
-4
38
-4
01
-2
81
-5
15
2
-4
72
-6
98
-4
54
-6
12
1821
23
2426
27
101
775
549
685
980
968
1076
353
1107
106
529
493
431
163
1027
422
1382
961
884
1220
704
584
498
260
112
0.3
740 703
1243 1092
863 1166
551 857
1030 2784
2142 1370
496 1068
1093 845
1689 992
1064 1577
2758 93
1216 1701
1991
2338
1409
1623
2352
2212
2249
2473
1750
3255
2953
3939
2433
27
42
23
72
25
33
22
51
24
75
17
4
22
27
92
3
26
18
11
91
43
0
37
99
-6
22
2
-8
67
40
57
41
58
42
59
43
60
44
61
45
62
46
63
47
64
48 65
49
66
50
67
51
68
52
69
53
70
54
71
55
72
56
73
129
114
319
82.2
68.2
788
891
533
270
1158
405
425
778
774
334
729
497
1165
818
1617
1068
-377
-413
-412
-311
-240
-152
-93.1
-175
-423
-200
-6.35
Fig
ure
C.1
4: L
2 N
um
eric
al Z
uri
ch S
trai
ns
for
Loa
d S
tage
3—
4 (u
nit
s: με)
100

L
oad
Stag
e 5
V
=47
9.5
kN
0.9
0 of
ult
imat
e
12
34
56
78
910
1112
13
14
15
1617
1920
22
2425
28
2930
3132
33
34
35
36
3738
39
-642
-253
-1043
-741
-681
-1552
-422
-1066
-941
-105
-77.4
-159
-53.1
-402
-715
-770
-79
9
-974
-28
6
-78
6
-582
-11
22
-551
-72
7
-65
9
-925
-7
40
-7
76
-7
08
-5
70
-4
50
-7
54
-3
91
-9
73
-7
20
-8
182
-7
98
-1
137
1821
23
26
27
203
327
756
1215
1998
1296
1964
417
966
6.72
453
241
244
1243
1302
1635
1574
1318
864
1278
769
579
772
341
761 1285
1373 1370
1036 1481
343 1020
1164 2812
3113 1160
763 1723
1650 1587
2146 1230
1620 1634
4064
2530 2080
2710
2604
1784
1780
2389
2992
2719
3097
2205
4609
3968
5616
2916
33
41
28
28
32
15
23
84
28
80
30
35
32
26
14
15
31
26
1
33
27
79
46
68
40
57
41
58
42
59
43
60
44
61
45
62
46
63
47
64
48
65
49
66
50
67
51
68
52
69
53
70
54
71
55
72
56
73
48.3
418
525
103
378
515
287
501
720
1638
627
193
1376
720
583
1042
987
615
1029
801
1484
1155
1967
1472
-430
-210
-422
-152
-243
-8.56
-94.7
-83.5
Loa
d St
age
6
V=
532.
3 kN
Pea
k lo
ad
12
34
56
78
910
1112
13
14
1516
1719
2021
2225
2829
3031
3233
3435
36
3738
39
-227
-914
-950
-380
-952
-665
-22.3
-562
-61.5
1-1178
-749
2
-938
1-877
-292
-190
-112
-201
-497
-736
-677
-793
-107
0
-293
-689
-654
-135
9
-631
-495
-503
-627
-6
25
-6
38
-7
64
-4
20
-4
19
-6
08
-7
32
-9
48
-6
36
-7
19
-7
17
-9
94
1823
2426
27
664
1798
3024
1967
2759
99.7
860
423
205
387
1207
926
3368
1758
523
2344
1019
789
224
197
782 1834
1531 1642
1131 2074
289 1097
1430 4073
3409 2394
943 2192
2241 1667
2982 2010
3483 1741
5778
4260 2500
3662
2654
2024
1791
2331
2699
3152
4386
3579
6678
6325
8661
4617
377
6
302
2
377
3
256
6
348
5
370
5
372
2
182
6
382
0
146
8
356
9
620
8
40
57
41
58
42
59
43
60
44
61
45
62
46
63
47
64
48 65
49
66
50
67
51
68
52
69
53
70
54
71
55
72
56
7371.8
473
837
249
405
1282
50.5
931
1432
1787
397
129
1532
1131
799
1002
1268
775
914
897
1422
1316
1937
1586
-470
-421
-462
-359
-65.8
-310
-459
-541
Fig
ure
C.1
4: L
2 N
um
eric
al Z
uri
ch S
trai
ns
(un
its:
με)
Loa
d S
tage
5—
6
101

C.3 M1
0
100
200
300
400
500
0 1 2 3 4 5 6 7
Displacement (mm)
V (kN)
8
WLD
TCW
TC
TCE
ELD
Figure C.15: Net Displacement of M1 Computed Based on Vertical LVDT Data
0.0
100.0
200.0
300.0
400.0
500.0
-1 1 3 5 7 9
Shear Strain (mm/m)
V (kN)
11
Figure C.16: Shear Strain of M1 Measured by the Cross LVDTs
102

Cro
ss L
VD
Ts
Ver
tica
l LV
DT
s 3D
Sca
nner
C
lino
met
erS
trai
n G
auge
s
Net
Dis
plac
emen
t of
Bea
m
Sup
port
Dis
plac
emen
tD
set
Tim
e V
γ
– C
ente
r W
LD
T
CW
T
C
TC
E
EL
D
Wes
t E
ast
Wes
t
Dia
phra
gm
Rot
atio
n
B2
C2
T2
(#)
(h:m
m:s
s)
(kN
) (με)
(m
m)
(mm
) (m
m)
(mm
) (m
m)
(mm
) (m
m)
(deg
rees
)(με)
)(με
(με)
Loa
d
Stag
e
0 in
itia
lize
0
0 0
0 0
0 0
0 0
0 0
0 0
6 0:
00:0
0 2.
6 5
0.13
0.
02
0.05
0.
03
0.10
0.
09
0.01
0.
000
1 0
4
33
0:17
:06
109.
1 39
0 0.
57
0.29
0.
41
0.47
0.
57
0.47
0.
34
0.03
7 23
35
52
1
42
0:38
:04
96.9
57
4 0.
67
0.33
0.
49
0.51
0.
60
0.46
0.
30
0.04
0 55
17
16
4
118
0:53
:23
200.
1 17
65
1.43
0.
57
0.87
1.
19
1.27
0.
95
0.62
0.
080
458
1255
293
2
133
1:17
:15
180.
0 17
00
1.42
0.
61
0.88
1.
20
1.27
1.
08
0.56
0.
045
440
1188
283
272
1:32
:45
301.
1 28
96
2.40
0.
99
1.61
2.
13
2.15
1.
81
0.93
0.
12
688
1928
403
3
295
1:55
:41
269
2781
2.
38
1.02
1.
61
2.07
2.
14
1.95
0.
83
0.12
65
818
3538
5
431
2:08
:19
401.
4 43
87
3.83
1.
82
2.71
3.
35
3.20
2.
17
1.24
0.
19
988
2835
510
4
461
3:40
:26
365.
1 44
00
3.69
1.
87
2.70
3.
34
3.23
2.
52
1.13
0.
19
930
2698
475
513
3:45
:58
450.
5 56
55
4.80
2.
69
3.89
4.
48
4.14
2.
57
1.40
0.
25
1113
3250
610
5
535
4:07
:49
401.
4 55
91
4.66
2.
76
3.92
4.
43
4.12
2.
59
1.24
0.
23
1048
3025
570
onse
t to
fail
ure
580
4:13
:25
456.
9 64
94
5.58
3.
47
4.81
5.
27
4.70
2.
47
1.42
0.
27
1200
3350
613
ulti
mat
e
Tab
le C
.3:
Loa
d S
tage
Dat
a fo
r S
pec
imen
M1
103
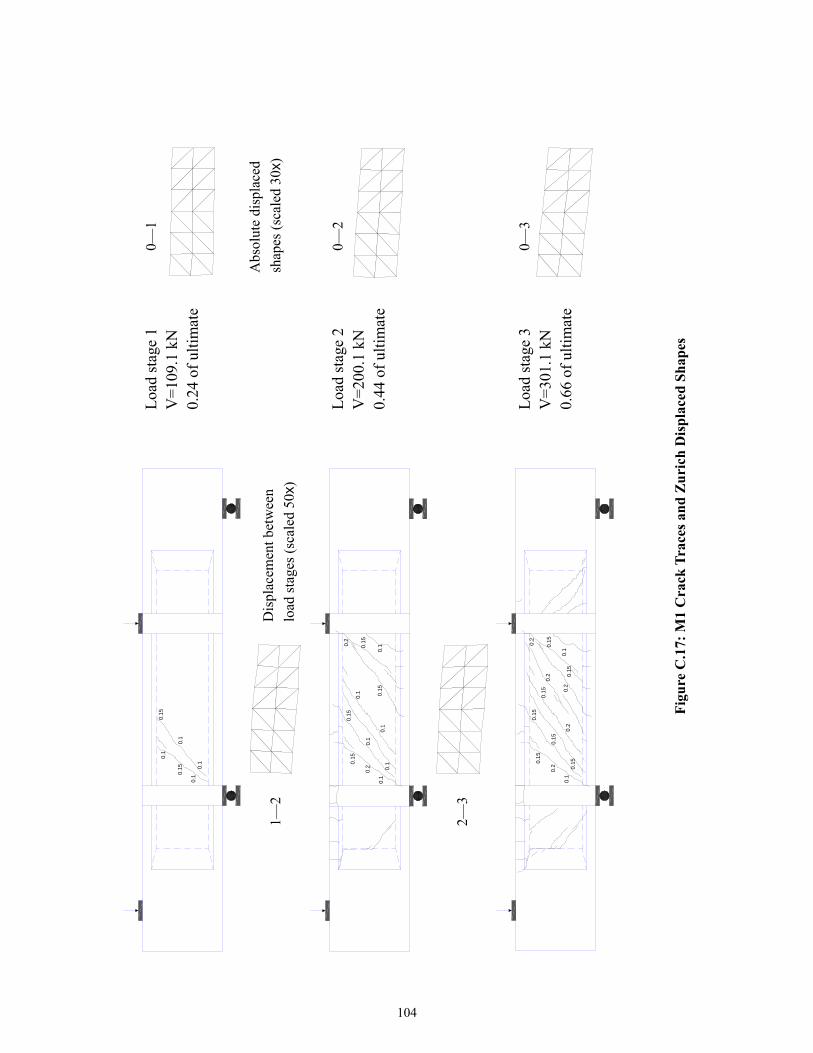
0.1
5
0.1
0.1
0.1
0.15
0.1
Loa
d st
age
1 V
=10
9.1
kN
0.24
of
ulti
mat
e
0—
1
1—2
Dis
plac
emen
t bet
wee
n
load
sta
ges
(sca
led
50x)
Abs
olut
e di
spla
ced
shap
es (
scal
ed 3
0x)
0.2
0.10.1
5
0.1
5
0.1
0.1
0.1
5
0.1
0.1
0.1
0.2
0.1
5
Loa
d st
age
2 V
=20
0.1
kN
0.44
of
ulti
mat
e
0—
2
2—3
0.2
0.2
0.1
0.15
0.15
0.2
0.15
0.2
0.1
5
0.1
5
0.1
50
.1
0.2
0.15
Loa
d st
age
3 V
=30
1.1
kN
0.66
of
ulti
mat
e
0—
3
Fig
ure
C.1
7: M
1 C
rack
Tra
ces
and
Zu
rich
Dis
pla
ced
Sh
apes
104

3—4
Dis
plac
emen
t bet
wee
n
load
sta
ges
(sca
led
50x)
Abs
olut
e di
spla
ced
shap
es (
scal
ed 3
0x)
0.25
0.2
0.1
0.1
5
0.2
50.
25
0.2
0.2
50.3
0.2
0.2
0.1
5
0.2
50.1
5
0.2
Loa
d st
age
4 V
=40
1.4
kN
0.88
of
ulti
mat
e
0—
4
4—5
0.3
0.2
0.1
50.2
0.2
50
.25
0.4
5
0.2
50.4
5
0.2
0.25
0.1
5
0.3
0.2
5
0.5
50
.2
Loa
d st
age
5 V
=45
0.5
kN
0.99
of
ulti
mat
e
0—
5
Fai
lure
V
=45
6.9
kN
Fig
ure
C.1
8: M
1 C
rack
Tra
ces
and
Zu
rich
Dis
pla
ced
Sh
apes
105

Load Stage 1 V=109.1 kN 0.24 of ultimate
1234567
891011121314
15161718192021
-29.9-78.2-110
-89.6-99.2-179-204
-17.9-10.9-110-127
-25
-35
-1
99
-1
51
-1
31
-2
02
-2
02
15
7
-4
3.6
-117
-47.5
-1
65
-68.7
-8
8.3
-107
-1
85
-128
-2
79
59658.5615
72.91604
12.57.8
348
95.471.1
85.50.70
7
13.711.6
85754.2
994
8.51347
97.6
229
45.2
818
972
-
1699
1
42
1546
22
33
23
34
24
35
25
36
26
37
27
38
28
39
29
40
30
41
31
42
32
43
116067.221175.529.574.6
23.3-227
-59.2
-91.6
-47.3
-117 -147 -125 -116 -88.1 -13.2 -32
-7
Load Stage 2 V=200.1 kN 0.44 of ultimate
1234567
8910
161718192021
-95
-306-444
-245-1.65
-151
-290
346
-1
42
-6
6.3
-113
-166
-3
12
-8
2.8
-6
66
-4
38
-5
88
-5
86
11121314
15
177463491122645
5472052371265
975275241138
68776
0
28.3
1068
998
2287
2099
926
1240
173
-143
1
738
815
1
36
1638
2
9.7
2607
2035
1984
1790
867
839
819
1576
2539
22
33
23
34
24
35
25
36
26
37
27
38
28
39
29
40
30
41
31
42
32
43
52.7
35
98
95.1
257
318
546
220
393
395
447
532
433
369
383
593
-177
-105
-149
-133
Load Stage 3 V=301.1 kN 0.66 of ultimate
1234567
89101114
161718192021
-344
-274
.6
-4
23
-1
51
-5
2.4
-1
27
-4
93
-4
44
-8
6.8
-6
36
-5
30
-7
71
-6
93
1123
15
739334461665393602
10334984913802014
1196705814239382
908
1290
1469
1541
3045
1683
3062
1652
2907
1636
2060
1044
-5428
68
2412
2382
4
7.4
3526
3644
2974
2809
2583
1435
2559
2553
2175
3554
22
33
23
34
24
35
25
36
26
37
27
38
28
39
29
40
30
41
31
42
32
43121
109
241
51.5
277
208
434
231
370
217
742
-253
-241
-852
-591
-482
-372
-560
-166
-293
Figure C.19: M1 Numerical Zurich Strains for Load Stages 1—3 (units: με)
106
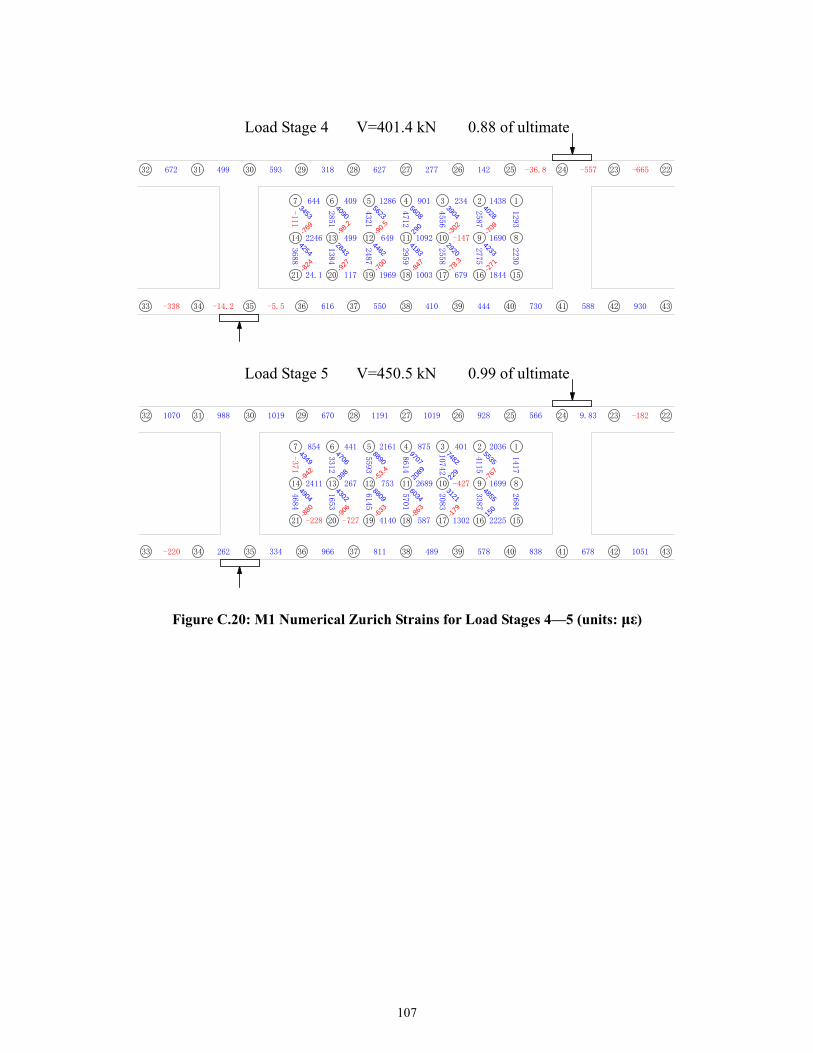
Load Stage 4 V=401.4 kN 0.88 of ultimate
1234567
891213
1617181920
-147
111
-7
09
-3
02
-9
0.5
-9
8.2
-7
69
-2
71
-7
8.3
-8
47
-7
00
-9
27
-8
24
101114
1521
14382349011286409644
169010926494992246
18446791003196911724.1
1293
2230
2587
2775
4556
2558
4712
2959
4321
2487
2851
1384
-3688
4028
3904
2
90
5608
5623
4090
3453
4233
2920
4183
4462
2843
4254
22
33
23
34
24
35
25
36
26
37
27
38
28
39
29
40
30
41
31
42
32
43
142
616
277
550
627
410
318
444
593
730
499
588
672
930
-665
-338
-557
-14.2
-36.8
-5.5
Load Stage 5 V=450.5 kN 0.99 of ultimate
1234567
891011121314
15161718192021
-427
-727-228
31
314
-767
-53.
4-9
42
-1
79
-8
63
-6
33
-9
06
-8
80
20364018752161441854
169926897532672411
222513025874140
14172684
41153387
10742208
8614570
5596145
33121653
-37468
5535
2
29
7482
2
089
9707
8890
3
98
4706
4349
1
50
4855
3121
6034
8809
4302
4904
22
33
23
34
24
35
25
36
26
37
27
38
28
39
29
40
30
41
31
42
32
43
9.83
262
566
334
928
966
1019
811
1191
489
670
578
1019
838
988
678
1070
1051
-182
-220
Figure C.20: M1 Numerical Zurich Strains for Load Stages 4—5 (units: με)
107
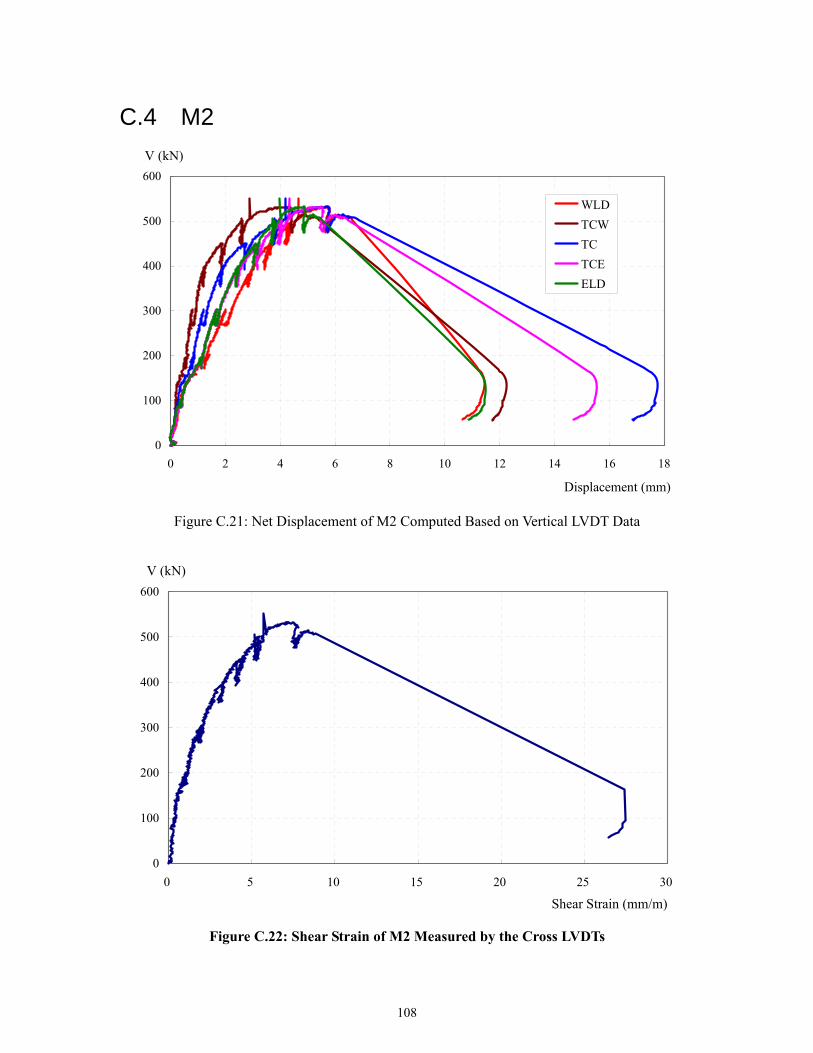
C.4 M2
0
100
200
300
400
500
600
0 2 4 6 8 10 12 14 16 1
Displacement (mm)
V (kN)
8
WLD
TCW
TC
TCE
ELD
Figure C.21: Net Displacement of M2 Computed Based on Vertical LVDT Data
0
100
200
300
400
500
600
0 5 10 15 20 25 30
Shear Strain (mm/m)
V (kN)
Figure C.22: Shear Strain of M2 Measured by the Cross LVDTs
108

Cro
ss L
VD
Ts
Ver
tica
l LV
DT
s 3D
Sca
nner
C
lino
met
erS
trai
n G
auge
s
Net
Dis
plac
emen
t of
Bea
m
Sup
port
Dis
plac
emen
tD
set
Tim
e V
γ
– C
ente
r W
LD
T
CW
T
C
TC
E
EL
D
Wes
t E
ast
Wes
t
Dia
phra
gm
Rot
atio
n
B2
C2
T2
(#)
(h:m
m:s
s)
(kN
) (με)
(m
m)
(mm
) (m
m)
(mm
) (m
m)
(mm
) (m
m)
(deg
rees
)(με)
)(με
(με)
Loa
d
Stag
e
0 in
itia
lize
0
0 0
0 0
0 0
0 0
0 0
0 0
5 0:
00:0
0 4.
3 17
1 0.
19
0.16
0.
13
0.20
0.
17
0.01
2 0.
013
0.12
6
-3
-7
52
0:05
:55
101.
0 38
0 0.
40
0.21
0.
29
0.40
0.
35
0.35
0.
31
0.13
73
60
029
1
62
0:32
:12
89.3
34
5 0.
40
0.19
0.
30
0.42
0.
40
0.38
0.
28
0.88
83
59
534
153
0:45
:17
201.
6 12
00
1.42
0.
64
0.89
1.
20
1.18
0.
61
0.62
0.
12
221
1058
290
2
164
1:08
:13
173.
2 96
6 1.
23
0.56
0.
81
1.13
1.
12
0.73
0.
54
0.08
21
410
1328
0
247
1:16
:34
303.
2 19
92
2.01
0.
80
1.20
1.
67
1.70
1.
29
0.94
0.
24
365
1410
490
3
270
2:19
:17
271.
2 18
64
2.08
0.
89
1.27
1.
70
1.70
1.
43
0.84
0.
70
353
1360
470
345
2:28
:35
399.
3 32
49
3.04
1.
25
1.91
2.
50
2.44
1.
69
1.24
0.
53
665
1968
650
4
359
2:45
:01
354.
4 30
30
2.82
1.
21
1.82
2.
42
2.39
1.
79
1.10
0.
20
633
1870
608
413
2:52
:26
450.
5 43
29
3.64
1.
85
2.72
3.
24
3.09
1.
92
1.40
0.
04
845
2160
705
5
443
3:08
:16
405.
7 40
44
3.44
1.
84
2.71
3.
15
3.02
1.
97
1.26
0.
45
795
2058
663
521
3:17
:11
501.
8 54
52
4.43
2.
59
3.84
4.
06
3.79
2.
05
1.56
0.
39
853
2320
743
6
537
3:32
:15
452.
7 52
08
4.23
2.
59
3.79
3.
96
3.70
2.
08
1.40
0.
44
813
2240
705
616
3:40
:08
531.
7 75
14
5.78
4.
36
5.74
5.
52
4.87
2.
04
1.65
0.
25
973
2543
698
7
ulti
mat
e
641
3:54
:06
476.
2 75
18
5.65
4.
44
5.76
5.
56
4.86
2.
03
1.48
0.
42
918
2400
620
onse
t to
fail
ure
696
3:57
:58
162.
3 27
444
11.3
3 12
.07
17.5
4 15
.30
11.3
0 1.
85
0.50
0.
71
1553
895
-194
8ab
rupt
fail
ure
Tab
le C
.4:
Loa
d S
tage
Dat
a fo
r S
pec
imen
M2
109

0.0
5
Loa
d st
age
1 V
=10
1.0
kN
0.19
of
ulti
mat
e
0—
1
1—2
Dis
plac
emen
t bet
wee
n
load
sta
ges
(sca
led
50x)
Abs
olut
e di
spla
ced
shap
es (
scal
ed 3
0x)
0.0
5 0.0
50.
05
0.0
5
0.0
5
0.0
5
0.0
5 0.0
5
0.1
Loa
d st
age
2 V
=20
1.6
kN
0.38
of
ulti
mat
e
0—
2
2—3
0.0
5
0.05
0.1
0.1
0.1
5
0.0
5
0.1
0.1
0.05
Loa
d st
age
3 V
=30
3.2
kN
0.57
of
ulti
mat
e
0—
3
Fig
ure
C.2
3: M
2 C
rack
Tra
ces
and
Zu
rich
Dis
pla
ced
Sh
apes
110
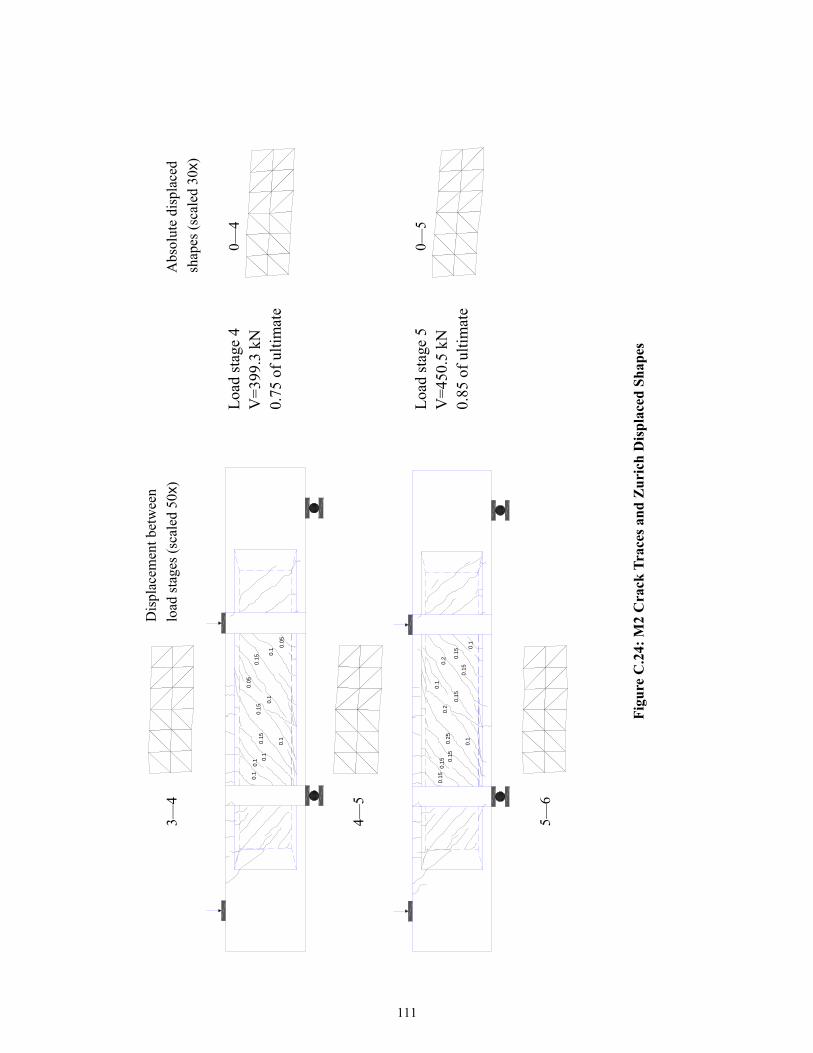
3—4
Dis
plac
emen
t bet
wee
n
load
sta
ges
(sca
led
50x)
Abs
olut
e di
spla
ced
shap
es (
scal
ed 3
0x)
0.1
0.1 0.
10
.15
0.1
0.1
5
0.1
0.05
0.15
0.1
0.0
5
Loa
d st
age
4 V
=39
9.3
kN
0.75
of
ulti
mat
e
0—
4
4—5
0.15
0.1
5 0.15
0.25
0.1
0.2
0.15
0.1
0.2
0.15
0.15
0.1
Loa
d st
age
5 V
=45
0.5
kN
0.85
of
ulti
mat
e
0—
5
5—6
Fig
ure
C.2
4: M
2 C
rack
Tra
ces
and
Zu
rich
Dis
pla
ced
Sh
apes
111

0.2
50
.2 0.2
0.4
0.1
0.2
5
0.15
0.1
0.25
0.25
0.2
0.2
5 0.1
5
Loa
d st
age
6 V
=50
1.8
kN
0.94
of
ulti
mat
e
0—
6
6—7
Dis
plac
emen
t bet
wee
n
load
sta
ges
(sca
led
50x)
Abs
olut
e di
spla
ced
shap
es (
scal
ed 3
0x)
0.2
50
.3 0.4
0.5
0.1
0.25
0.15
0.1
0.4
5
0.2
5
0.3
50.
3
0.15
Loa
d st
age
7 V
=53
1.7
kN
Pea
k lo
ad
0—
7
Fai
lure
V
=53
1.7
kN
Fig
ure
C.2
5: M
2 C
rack
Tra
ces
and
Zu
rich
Dis
pla
ced
Sh
apes
112

Figure C.26: M2 Numerical Zurich Strains for Load Stage 1—4 (units: με)
1234567
891011121314
15161718192021
438-249
-323-20476.5
-302
-2
355472322222
1063624152
38.3328403299416
920
618
853
568
-16
77
923
736
430
849
212
316
16 849
1604
781
1300
723
80 467
2009
1283
1402
1207
492
281
558
182
09
2
1
1
-5
09 -2
80
-2
03
-1
47
-1
92
-3
04
-3
77-2
44
-3
95
-4
18
22232425
40 41 42 4340.5
13.3
10.2
21.5
165
132
269
392
343
460
248
83.1
370
187
6833 34 35 36
26
37
27
38
28
39
29303132 -100
-89.8
-167-13.2
-49.8
1234567
891011121314
171821
-396
-399-349
-78
11
-80.1
-5
15161920
87431546650493
6831375663510
645678270407452
681
489
170864
1561000
2336
1277
1114
1045
1195
523
952
5
2475
1525
-
2239
1056
2152
1644
1606
818
2973
1762
2054
1975
2
-2
76
75
8
-3
96-3
20
-2
26
-2
73
-3
07
-4
04
-2
03
-4
38
-4
79
22
33
23
34
24
35
25
36
26
37
27
38
28
39
29
40
30
41
31
42
32
43176
61.2
27.8
132
14.2
193
271
624
471
589
611
806
524
457
814
459
422
-74.7
-72.8
-69.3
1234567
89101
17
-430-164
-513-386
-98.5
-68
1112314
151618192021
100115761189838
105217741281598
905389898690298471
980675
20741490
22151297
3495
24231206
16121735
10931012
8
3224
-4
22
2008
-
2901
-
2100
3551
2390
1075
419
-3
74 -2
67
-3
00
2435
1625
4096
2648
2782
2593
-3
76
-3
96 -1
43
-4
68
-5
04
22
33
23
34
24
35
25
36
26
37
27
38
28
39
29
40
30
41
31
42
32
43165
27.2
145
673
417
411
429
752
610
666
783
1067
736
684
1012
552
637
-131
-162
-138
14567
891111
15161920
523110
686
24.854106
19.5
45.325.5
53.2479
7.8112
73.5137
90.474.1
2
53
1
94
2
29
280
34.1
65.9
3.
51
56.3
3
0.1
22.34
642 444
23
012134
171821
-116-118-127-191
-106-63.2-216-30.5-261
-9.22-32.2-701.
-23.7
-27.6-36.4
-315
-370
-1
38
-8
0.8
-3
57
-14
-1
94
-4
01
-3
83
-69.3
-2
93
-52.1
22
33
23
34
24
35
25
36
26
37
27
38
28
39
29
40
30
41
31
42
32
4345.8 112 54.2 61.6
84.2464
25
50.7
32.8
202 -30.2-74.8-23.7
-29.3
-35.8
-57.7
-70.5-30.2
-58.5 -32
Load Stage 1 V=101.0 kN 0.19 of ultimate
Load Stage 2 V=201.6 kN 0.38 of ultimate
Load Stage 3 V=303.2 kN 0.57 of ultimate
Load Stage 4 V=399.3 kN 0.75 of ultimate
113
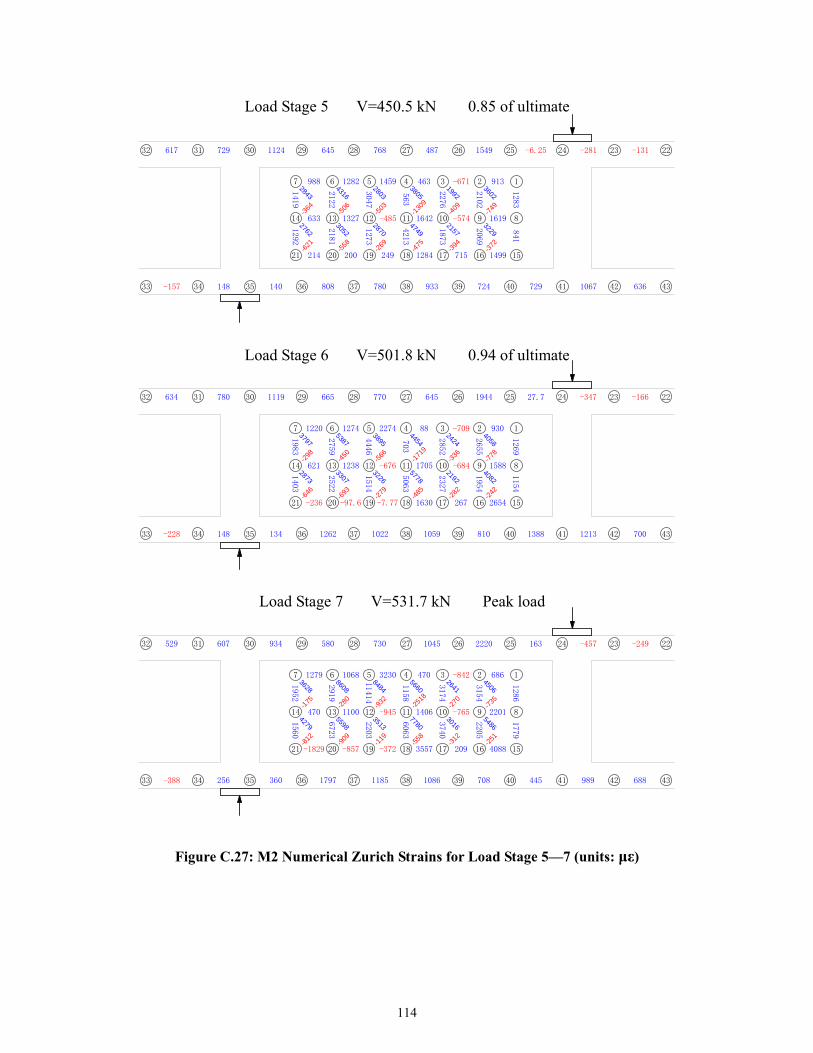
Load Stage 5 V=450.5 kN 0.85 of ultimate
1234567
891011121
1618192021
-671
-574-485 -7
49 -4
09
-1
309
-5
03
-5
06 -3
64
-3
72
-3
94
-4
75
-2
69
-5
58
-6
21
314
1517
91346314591282988
161916421327633
14997151284249200214
1283
841
2102
2069
2276
1873
563
4213
3047
1273
2122
2181
1419
1292
3602
1992
3805
2803
4316
2843
3229
2157
4749
2870
3052
2762
22
33
23
34
24
35
25
36
26
37
27
38
28
39
29
40
30
41
31
42
32
43148 140
1549
808
487
780
768
933
645
724
1124
729
729
1067
617
636
-131
-157
-281-6.25
Load Stage 6 V=501.8 kN 0.94 of ultimate
1234567
89101111314
161718192021
-709
-684-676
-7.77-97.6-236
-7
78
-3
36
-1
719
-5
66
-4
50
-2
98
-2
42
-2
82
-4
85
-2
79
-6
93
-6
46
2
15
93088227412741220
158817051238621
26542671630
126
91154
265
51954
285
22327
7035063
444
61514
275
92522
198
31403
4058
2424
4454
3895
5387
3797
4082
2192
5778
3226
3307
2873
22
33
23
34
24
35
25
36
26
37
27
38
28
39
29
40
30
41
31
42
32
43148
27.7
134
1944
1262
645
1022
770
1059
665
810
1119
1388
780
1213
634
700
-166
-228
-347
Load Stage 7 V=531.7 kN Peak load
1234567
891011121
161718192021
842
-765-945
-372-857-1829
-7
35 -2
70
-2
518
-9
32
-2
80-1
75
-2
51
-3
12
-5
58
-1
19
-9
09
-8
12
314
15
686-470323010681279
220114061100470
40882093557
1286
1779
3154
2205
3174
3740
1158
6063
11414
2203
2919
6723
1952
1560
4506
2641
5660
8484
8608
3628
5486
3016
7780
3513
5598
4279
22
33
23
34
24
35
25
36
26
37
27
38
28
39
29
40
30
41
31
42
32
43256
163
360
2220
1797
1045
1185
730
1086
580
708
934
445
607
989
529
688
-249
-388
-457
Figure C.27: M2 Numerical Zurich Strains for Load Stage 5—7 (units: με)
114
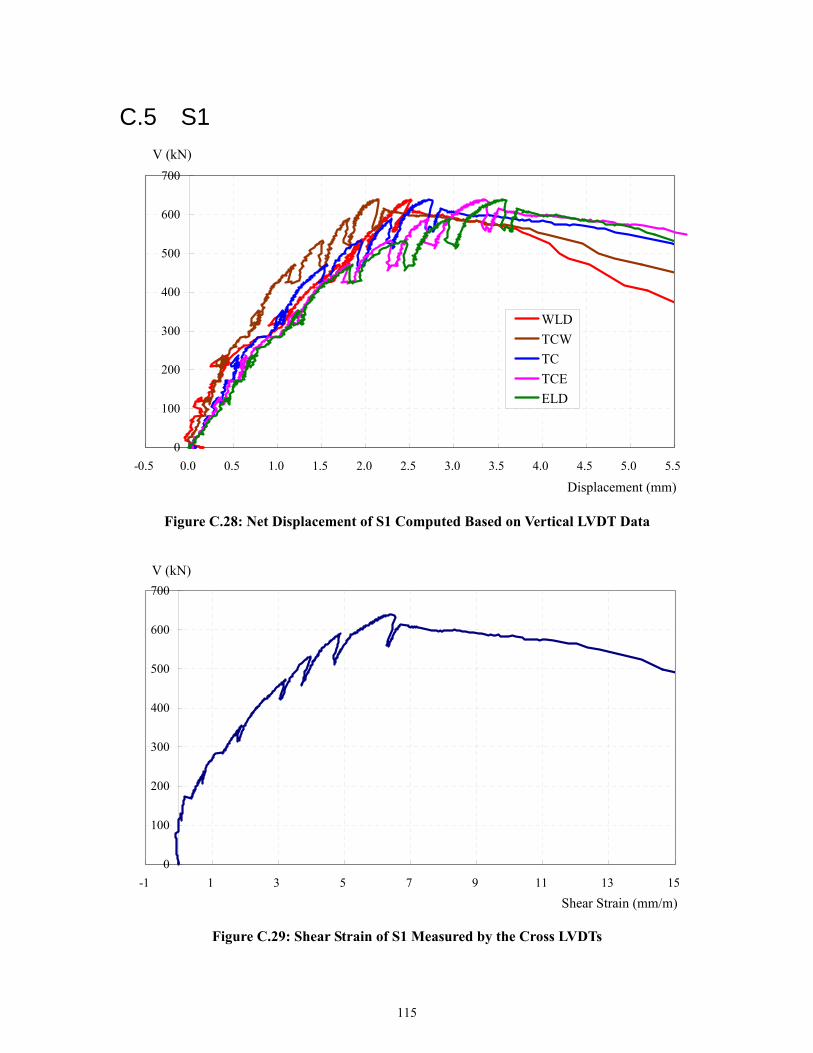
C.5 S1
0
100
200
300
400
500
600
700
-0.5 0.0 0.5 1.0 1.5 2.0 2.5 3.0 3.5 4.0 4.5 5.0 5.5
Displacement (mm)
V (kN)
WLD
TCW
TC
TCE
ELD
Figure C.28: Net Displacement of S1 Computed Based on Vertical LVDT Data
0
100
200
300
400
500
600
700
-1 1 3 5 7 9 11 13
Shear Strain (mm/m)
V (kN)
15
Figure C.29: Shear Strain of S1 Measured by the Cross LVDTs
115
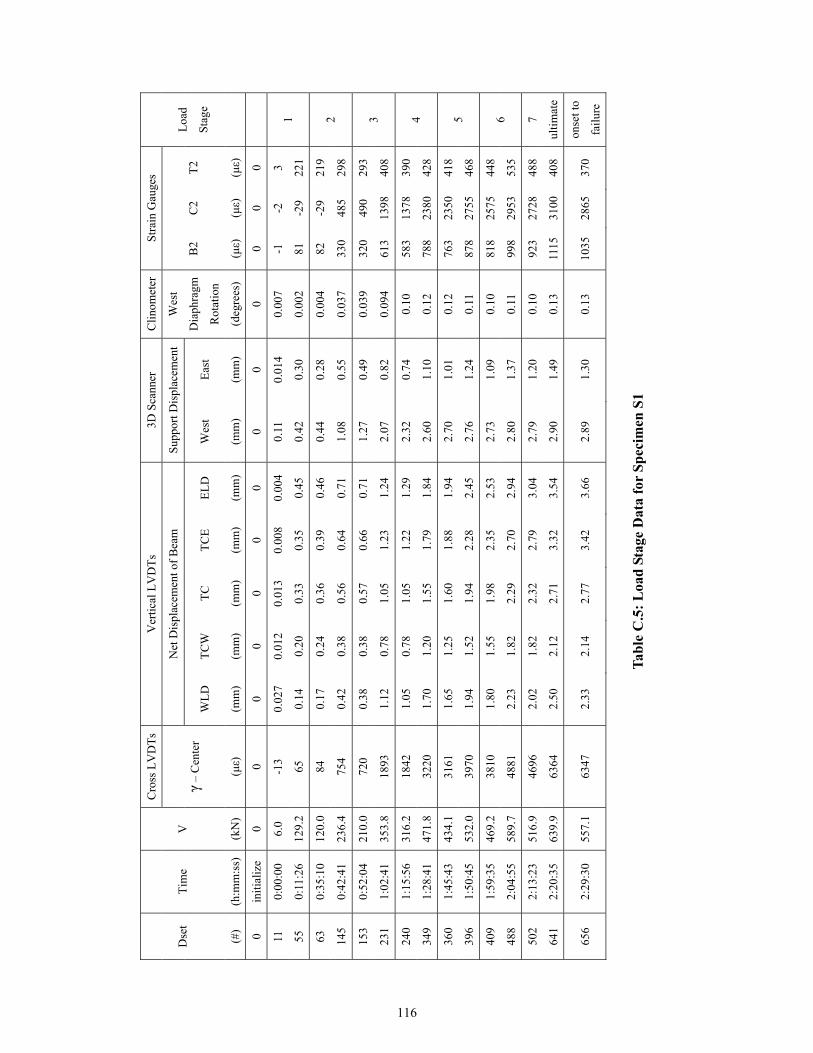
Cro
ss L
VD
Ts
Ver
tica
l LV
DT
s 3D
Sca
nner
C
lino
met
erS
trai
n G
auge
s
Net
Dis
plac
emen
t of
Bea
m
Sup
port
Dis
plac
emen
tD
set
Tim
e V
γ
– C
ente
r W
LD
T
CW
T
C
TC
E
EL
D
Wes
t E
ast
Wes
t
Dia
phra
gm
Rot
atio
n
B2
C2
T2
(#)
(h:m
m:s
s)
(kN
) (με)
(m
m)
(mm
) (m
m)
(mm
) (m
m)
(mm
) (m
m)
(deg
rees
)(με)
)(με
(με)
Loa
d
Stag
e
0 in
itia
lize
0
0 0
0 0
0 0
0 0
0 0
0 0
11
0:00
:00
6.0
-13
0.02
7 0.
012
0.01
3 0.
008
0.00
4 0.
11
0.01
4 0.
007
-1
-2
3
55
0:11
:26
129.
2 65
0.
14
0.20
0.
33
0.35
0.
45
0.42
0.
30
0.00
2 81
-2
922
11
63
0:35
:10
120.
0 84
0.
17
0.24
0.
36
0.39
0.
46
0.44
0.
28
0.00
4 82
-2
921
9
145
0:42
:41
236.
4 75
4 0.
42
0.38
0.
56
0.64
0.
71
1.08
0.
55
0.03
7 33
048
529
82
153
0:52
:04
210.
0 72
0 0.
38
0.38
0.
57
0.66
0.
71
1.27
0.
49
0.03
9 32
049
029
3
231
1:02
:41
353.
8 18
93
1.12
0.
78
1.05
1.
23
1.24
2.
07
0.82
0.
094
613
1398
408
3
240
1:15
:56
316.
2 18
42
1.05
0.
78
1.05
1.
22
1.29
2.
32
0.74
0.
10
583
1378
390
349
1:28
:41
471.
8 32
20
1.70
1.
20
1.55
1.
79
1.84
2.
60
1.10
0.
12
788
2380
428
4
360
1:45
:43
434.
1 31
61
1.65
1.
25
1.60
1.
88
1.94
2.
70
1.01
0.
12
763
2350
418
396
1:50
:45
532.
0 39
70
1.94
1.
52
1.94
2.
28
2.45
2.
76
1.24
0.
11
878
2755
468
5
409
1:59
:35
469.
2 38
10
1.80
1.
55
1.98
2.
35
2.53
2.
73
1.09
0.
10
818
2575
448
488
2:04
:55
589.
7 48
81
2.23
1.
82
2.29
2.
70
2.94
2.
80
1.37
0.
11
998
2953
535
6
502
2:13
:23
516.
9 46
96
2.02
1.
82
2.32
2.
79
3.04
2.
79
1.20
0.
10
923
2728
488
641
2:20
:35
639.
9 63
64
2.50
2.
12
2.71
3.
32
3.54
2.
90
1.49
0.
13
1115
3100
408
7
ulti
mat
e
656
2:29
:30
557.
1 63
47
2.33
2.
14
2.77
3.
42
3.66
2.
89
1.30
0.
13
1035
2865
370
onse
t to
fail
ure
Tab
le C
.5:
Loa
d S
tage
Dat
a fo
r S
pec
imen
S1
116

0.10.05
Load stage 1V=129.2 kN0.20 of ultimate
0—1
1—2
Displacement between
load stages (scaled 50x)
Absolute displaced
Shapes (scaled 30x)
0.150.15
0.05
Load stage 2V=236.4 kN0.37 of ultimate
0—2
2—3
0.05
0.20.2
0.15
0.1
Load stage 3V=353.8 kN0.55 of ultimate
0—3
3—4
0.05 0.05
0.2
0.1
0.20.15
0.1
Load stage 4V=471.8 kN0.74 of ultimate
0—4
4—5
Figure C.30: S1 Crack Traces and Zurich Displaced Shapes
117

0.10.1
0.25
0.1
0.20.15
0.15
Load stage 5V=532.0 kN0.83 of ultimate
0—5
5—6
Displacement between
load stages (scaled 50x)
Absolute displaced
Shapes (scaled 30x)
0.10.1
0.3
0.1
0.250.2
0.15
Load stage 6V=589.7 kN0.92 of ultimate
0—6
6—7
0.150.1
0.3
0.4
0.40.25
0.2
0.25
Load stage 7V=639.9 kNPeak load
0—7
Failure V=639.9 kN
Figure C.31: S1 Crack Traces and Zurich Displaced Shapes
118

Load stage 1 V=129.2 kN 0.20 of ultimate
Load stage 2 V=236.4 kN 0.37 of ultimate
Load stage 3 V=353.8 kN 0.55 of ultimate
123
456
89
-90-119
-147
-112
-1
98
-2
90
-2
37
-9
1.3
7
14.8937
49.9495
39.7
121
76196.8
27.3
1007
156
196
10
19
11
20
12
21
13
22
14
23
15
24
16
25
17
26
18
27
50.3
43.6
52.5
32.3
152
7.8
92.771.5
53.9
119
37311.7
180
39.2 -5.32
-65.3
123
45
7
1169656
1253
1082
84481
0
1453
2565
118
1682
6
89
-276
-116-46.3
-109
-118
-53.5
-496
-4
01
-3
64
-3
15
10
19
11
20
12
21
13
22
14
23
15
24
16
25
17
26
18
27 69.1159
443
111
229
256
166
162
229
619
46.3
39.3
439
115
-153-70.9
123
4
7
1788706
11401489
1791
1507
16161811
10971230
3556
3083
1868
3752
56
89 -235
-164
-6
31
-5
32
-6
82
-8
92
10
19
11
20
12
21
13
22
14
23
15
24
16
25
17
26
18
27
529
482
400
185
869
259
509
269
104
352
206
1117
229
168
687
85.9
123
456
7
2335986
21691855
5451511
244
065
6
219
1292
1
137
2262
8
5228
3882
3704
5133
89
-7
15 -5
85
-8
88
-9
49
10
19
11
20
12
21
13
22
14
23
15
24
16
25
17
26
18
27
1238
603
661
346
1143
476
739
336
345
629
192
1369
234
452
913
118
Load stage 4 V=471.8 kN 0.74 of ultimate
Figure C.32: S1 Numerical Zurich Strains for Load Stages 1—4 (units: με)
119

Load stage 5 V=532.0 kN 0.83 of ultimate
Load stage 6 V=589.7 kN 0.92 of ultimate
123
456
789
-8
22 -5
83
-9
25
-1
086
27361033
26121964
5801409
2628369
23153191
16692893
6077
4297
4290
5874
10
19
11
20
12
21
13
22
14
23
15
24
16
25
17
26
18
27
1848
800
935
389
1434
616
672
408
253
741
78.2
1620
182
499
986
78.1
123
46
7
28811433
31382430
90116092770
527
26673196
20233129
6478
4744
5
89
-9
05
-5
73
4711
6263
-787
-1
247
10
19
11
20
12
21
13
22
14
23
15
24
16
25
17
26
18
27
2001
968
1486
457
2607
776758
291
813
83.9
1385
153
374
1034
12.4
-76.4
Load stage 7 V=639.9 kN Peak load
123
46
7
30761827
31723838
11261856
4384
993
4391
3638
2316
3994
8003
6586
5104
8181
5
89
-8
57
-6
57
-8
02
-1
579
10
19
11
20
12
21
13
22
14
23
15
24
16
25
17
26
18
27
1478
1102
3015
651
4070
9431209
31.8
1123
174
1875
245
689
1232
96.5
-228
Figure C.33: S1 Numerical Zurich Strains for Load Stages 5—7 (units: με)
120

C.6 S2
0
100
200
300
400
500
600
700
0 1 2 3 4 5 6
Displacement (mm)
V (kN)
WLD
TCW
TC
TCE
ELD
Figure C.34: Net Displacement of S2 Computed Based on Vertical LVDT Data
0
100
200
300
400
500
600
700
-1 1 3 5 7 9 11 13 15 17
Shear Strain (mm/m)
V (kN)
19
Figure C.35: Shear Strain of S2 Measured by the Cross LVDTs
121

Cro
ss L
VD
Ts
Ver
tica
l LV
DT
s 3D
Sca
nner
C
lino
met
erS
trai
n G
auge
s
Net
Dis
plac
emen
t of
Bea
m
Sup
port
Dis
plac
emen
tD
set
Tim
e V
γ
– C
ente
r W
LD
T
CW
TC
T
CE
E
LD
Wes
t E
ast
Wes
t
Dia
phra
gm
Rot
atio
n
B2
C2
T2
(#)
(h:m
m:s
s)
(kN
) (με)
(m
m)
(mm
)(m
m)
(mm
)(m
m)
(mm
) (m
m)
(deg
rees
)(με)
)(με
(με)
Loa
d
Stag
e
0 in
itia
lize
0
0 0
0 0
0 0
0 0
0 0
0 0
11
0:00
:00
4.3
-30
0.39
-0
.007
-0.0
07-0
.008
-0.0
080.
007
0.01
0 0.
007
-3
1 -4
24
0:03
:47
50.2
37
0.
43
0.29
0.
32
0.33
0.
35
0.01
2 0.
12
-0.0
02
-3
3 -8
1
32
0:08
:00
9.0
-26
0.30
0.
08
0.13
0.
13
0.16
0.
07
0.02
0.
000
-2
1 -5
65
0:13
:01
123.
0 42
9 0.
17
0.20
0.
35
0.45
0.
53
0.51
0.
29
-0.0
10
79
688
52
1
(res
tart
)
75
0:29
:30
115.
4 42
4 0.
14
0.21
0.
36
0.47
0.
56
0.56
0.
27
-0.0
20
88
665
60
156
0:36
:35
236.
6 11
62
0.13
0.
27
0.55
0.
76
0.77
1.
22
0.55
-0
.002
23
210
8814
82
165
0:53
:20
219.
3 11
21
0.03
0.
22
0.51
0.
73
0.80
1.
33
0.51
-0
.009
22
810
1814
9
235
1:01
:30
353.
8 22
79
0.27
0.
37
0.76
1.
07
1.08
2.
13
0.82
0.
030
410
1410
245
3
251
1:19
:24
306.
1 21
49
0.14
0.
35
0.73
1.
07
1.15
2.
32
0.71
0.
034
390
1300
235
330
1:26
:13
469.
2 38
19
0.82
0.
72
1.17
1.
64
1.67
3.
38
1.09
0.
083
738
1708
343
4
352
1:43
:50
414.
0 37
39
0.71
0.
73
1.20
1.
67
1.79
3.
65
0.96
0.
088
708
1578
323
487
1:52
:17
589.
7 55
27
1.22
1.
17
1.74
2.
37
2.49
4.
08
1.37
0.
11
963
2050
440
5
502
2:08
:25
516.
9 54
76
1.06
1.
17
1.75
2.
40
2.60
4.
26
1.20
0.
10
910
1870
413
596
2:15
:30
649.
9 68
91
1.47
1.
40
2.05
2.
78
2.90
4.
50
1.51
0.
13
1080
2258
510
6
608
2:26
:56
572.
1 67
73
1.30
1.
43
2.05
2.
78
2.97
4.
57
1.33
0.
13
1045
2073
485
676
2:31
:01
677.
5 82
90
1.63
1.
64
2.32
3.
11
3.22
4.
82
1.58
0.
16
1298
2500
555
7
ulti
mat
e
708
2:47
:24
602.
2 91
82
1.73
2.
02
2.61
3.
44
3.53
4.
90
1.40
0.
18
1383
2563
453
onse
t to
fail
ure
Tab
le C
.6:
Loa
d S
tage
Dat
a fo
r S
pec
imen
S2
122

0.1
Load stage 1V=123.0 kN0.18 of ultimate
0—1
1—2
Displacement between
load stages (scaled 50x)
Absolute displaced
Shapes (scaled 30x)
0.1
0.1
0.1
0.05
Load stage 2V=236.6 kN0.35 of ultimate
0—2
2—3
0.15
0.15
0.05
0.150.1
0.1
0.15
Load stage 3V=353.8 kN0.52 of ultimate
0—3
3—4
0.1
0.15 0.2
0.15
0.1
0.15
0.1
0.15
0.1
Load stage 4V=469.2 kN0.69 of ultimate
0—4
4—5
Figure C.36: S2 Crack Traces and Zurich Displaced Shapes
123

0.15
0.250.3
0.2
0.1
0.15
0.1
0.15
0.15
Load stage 5V=589.7 kN0.87 of ultimate
0—5
5—6
Displacement between
load stages (scaled 50x)
Absolute displaced
Shapes (scaled 30x)
0.15
0.25 0.30.2
0.1
0.15
0.1
0.2
0.2
Load stage 6V=649.9 kN0.96 of ultimate
0—6
6—7
0.15
0.25 0.550.25
0.15
0.2
0.15
0.2
0.2
Load stage 7V=677.5 kNPeak load
0—7
Failure V=677.5 kN
Figure C.37: S2 Crack Traces and Zurich Displaced Shapes
124

Load stage 1 V=123.0 kN 0.18 of ultimate
Load stage 2 V=236.6 kN 0.35 of ultimate
Load stage 3 V=353.8 kN 0.52 of ultimate
123
45
89
-60.9
-22.3
-9.57
-71.
5
-107
-133
-2
30 -1
90
-1
06
-48.8
-2
42
6
7
675
798
599
65.6
7670
781
843
799
10
19
11
20
12
21
13
22
14
23
15
24
16
25
17
26
18
27
2.47
20.8
53.2
135
61.4
168
238
40.6
208
310
81.6
90.7
37.9
26.940.3
-1.77
123
456
7
981
4851201
1066
442
59.2
1644
407
489
89
-180
-89
-43.1
-4
00
2244
1660
624
2267
-3
57
-4
03
-7
22
10
19
11
20
12
21
13
22
14
23
15
24
16
25
17
26
18
27 18.7150
239
317
341
203
262
437
238
405
163173 -30.8-31.9
-31.9-60
123
46
7
1202
8411621
1751041
94820
1
246965
6
1140
3309
2400
1165
5
89
-237
-145
-5
67
-4
82
-4
99
-1
1
3263
28
10
19
11
20
12
21
13
22
14
23
15
24
16
25
17
26
18
27 190274
391
527
360
210
315
613
444
401
380
334
219
11.3
-81.6-16.3
Load stage 4 V=469.2 kN 0.69 of ultimate
123
456
7
110380
11721819
339933
1440390
31871231
1977
4078
89
-56.5
-7
01
3131
1935
-653
-6
51
4309
-165
0
10
19
11
20
12
21
13
22
14
23
15
24
16
25
17
26
18
27 458
177
304
632
516
575
175
307
1016
477
529
621
801
268 -109
-5.65
Figure C.38: S2 Numerical Zurich Strains for Load Stages 1—4 (units: με)
125

Load stage 5 V=589.7 kN 0.87 of ultimate
Load stage 6 V=649.9 kN 0.96 of ultimate
123
456
789
-6
96 -6
86
-6
01
-1
807
741775
17001840
423941
2056
333
3948
1573
343
2654
4983
4146
2456
5265
10
19
11
20
12
21
13
22
14
23
15
24
16
25
17
26
18
27 574
340
454
895
500
795
247
304
1271
651
646
842
1016
404
484
-95.8
123
46
7
5621193
19421941
9399832317
218
44231633
6142590
5446
4723
2990
5
89
-9
14
-6
82
-7
59
-2
2
5851
75
10
19
11
20
12
21
13
22
14
23
15
24
16
25
17
26
18
27 609
360
485
1044
406
926
232
494
1276
870
831
1011
1799
453
516
-152
Load stage 7 V=677.5 kN Peak load
123
456
7
1321
28072355
11821743
3007
613
7707
2309
660347
0
7698
6663
3822
8416
89
-88.6
-9
34
-6
97
-5
80
-3
692
10
19
11
20
12
21
13
22
14
23
15
24
16
25
17
26
18
27 633
255
467
1175
363
1139
249
948
1411
964
1218
1223
1945
647
120
-211
Figure C.39: S2 Numerical Zurich Strains for Load Stages 5—7 (units: με)
126