Shear contribution of fiber-reinforced lightweight ... · iv Les capacités de cisaillement...
107
© Abdulrahman Abbadi, 2018 Shear contribution of fiber-reinforced lightweight concrete (FRLWC) reinforced with basalt fiber reinforced Polymer (BFRP) bars Mémoire Abdulrahman Abbadi Maîtrise en génie civil - avec mémoire Maître ès sciences (M. Sc.) Québec, Canada
Transcript of Shear contribution of fiber-reinforced lightweight ... · iv Les capacités de cisaillement...

© Abdulrahman Abbadi, 2018
Shear contribution of fiber-reinforced lightweight concrete (FRLWC) reinforced with basalt fiber
reinforced Polymer (BFRP) bars
Mémoire
Abdulrahman Abbadi
Maîtrise en génie civil - avec mémoire
Maître ès sciences (M. Sc.)
Québec, Canada

ii

iii
Résumé
Cette étude porte sur le comportement au cisaillement des poutres en béton léger fibré et
renforcées par des barres de polymère renforcé de fibres de basalte (PRFB). Dix poutres
(150x250x2400 mm) coulées avec du béton fibré ou non-fibré ont été testées en flexion. Deux
poutres ont été coulées sans fibres (poutres contrôles) tandis que les huit autres poutres ont été
coulées avec du béton contenant des différents types et pourcentages de fibres. Les paramètres
étudiés comprenaient le type de fibres ajoutés au béton (fibres de basalte, de polypropylène et
d’acier), la fraction volumique des fibres (0, 0,5 et 1,0%) et les taux de renforcement des barres de
PRFB (0,95 et 1,37%). Une comparaison entre les résultats expérimentaux et les modèles
analytiques actuellement disponibles dans la littérature a été réalisée pour évaluer l'applicabilité
de tels modèles pour prévoir la capacité des poutres testées en cisaillement.
Les résultats de la présente étude indiquent que la géométrie des fibres joue un rôle important
dans l'augmentation du nombre de fissures que celles observées dans les poutres contrôles. L'ajout
de fibres a entraîné une défaillance plus ductile et le taux d'ouverture des fissures était retardé. La
largeur de la fissure a diminué avec l'augmentation des ratios de renforcement longitudinal et des
fractions volumiques des fibres. L'augmentation du taux de renforcement longitudinal a entraîné
une rigidité plus élevée et a diminué les flèches à tous les stades du chargement. Les poutres
coulées avec 1% de fibres de basalte, de polypropylène et d'acier ont montré une augmentation
dans leurs capacités de cisaillement par rapport aux poutres contrôles d'environ 11, 16 et 63%,
respectivement.
Le type de fibres affectait de manière significative le gain dans les capacités de cisaillement
des poutres, ce qui était attribué aux différentes propriétés physiques et mécaniques des fibres
utilisées, telles que leurs dimensions, leurs géométries, et leurs mécanismes de liaison avec le
béton. Les poutres coulées avec des fibres en acier à 0,5% présentaient des capacités de
cisaillement plus élevées que celles coulées avec des fibres de basalte et de polypropylène de 23
et 16% respectivement, alors que les poutres coulées avec des fibres en acier à 1% de volume
présentaient un gain de 47 et 41%, respectivement, dans leurs capacités.

iv
Les capacités de cisaillement prévues selon les équations de la norme CSA-S806-12 étaient
conservatrices avec un rapport moyen Vprév/Vexp de 0,80 (écart type, ÉT = 0,12) pour les poutres
sans fibres. Les modèles établis par Shin (1994) et Gopinath (2016) ont fourni de bonnes prévisions
quant aux capacités de cisaillement des poutres en béton renforcé de fibres de basalte avec des
ratios moyens Vprév/Vexp de 1,34 (ÉT = 0,09) et de 1,35 (ÉT = 0,07), respectivement. De même, le
modèle de Shin (1994) a bien prédit les capacités de cisaillement des poutres en béton armé de
fibres de polypropylène avec un rapport Vprév/Vexp de 1,34 (ÉT = 0,18). Les modèles de Gopinath
(2016), Ashour A (1992) et Shin (1994) ont prédit les capacités de cisaillement des poutres en
béton armé de fibres d'acier assez raisonnablement avec des ratio Vprév/Vexp de 1,01 (ÉT = 0,06),
1,07 (ÉT = 0,01) et 1,20 (ÉT = 0,08), respectivement.
Un nouveau modèle a été proposé pour prédire les capacités de cisaillement des poutres en
béton léger fibré renforcées par des barres longitudinales PRFB. Le modèle proposé prédit bien
les capacités de cisaillement des poutres en béton léger (avec des fibres de basalte) avec un rapport
Vprév/Vexp de 1,01 (ÉT = 0,05) et celles des poutres en béton léger (avec des fibres de polypropylène)
avec un rapport Vprév/Vexp de 0,99 (ÉT = 0,06). Le facteur de liaison et la matrice de liaison
d'interface utilisés étaient respectivement 0,75 et 4,18 MPa. En même temps, le modèle proposé
prédit bien les capacités de cisaillement des poutres coulées avec des fibres d’acier avec un rapport
Vprév/Vexp de 0,9 (ÉT = 0,00) quand le facteur de liaison et la matrice de liaison d'interface utilisés
étaient respectivement 1,0 et 6,8 MPa.

v
Abstract
This study reports on the shear behavior of fiber-reinforced lightweight
concrete (FRLWC) beams reinforced with basalt fiber-reinforced polymer (BFRP) bars. Ten
beams (150x250x2400 mm) cast with concrete with and without fibers were tested under four-
point loading configuration until failure occurred. Two beams were cast without fibers and
acted as control while the other eight beams were cast with different types and percentages of fiber.
The investigated parameters included the fiber type (basalt, polypropylene, and steel fibers), the
fibers volume fraction (0, 0.5, and 1.0%), and the beams’ reinforcement ratios (0.95 and 1.37%).
Comparison between the experimental results and the analytical models currently available in the
literature was performed to assess the applicability of such models for LWC reinforced with BFRP
bars.
Based on the outcome of the current study, the geometry of fibers played an important role
in increasing the number of cracks than those observed in the control beams. The addition of fibers
led to a more ductile failure and the rate of crack opening was delayed. Crack width decreased
with the increase of the longitudinal reinforcement ratios and the fibers’ volume fractions.
Increasing the reinforcement ratio resulted in higher stiffness and decreased its deflection at all
stages of loading. Beams cast with 1% of basalt, polypropylene, and steel fibers showed an increase
in their shear capacities in compared to control beams about 11, 16, and 63%, respectively.
The type of fibers significantly affected the gain in the shear capacities of the beams, which
can be attributed to the different physical and mechanical properties of the fibers used such as
aspect ratios, lengths, geometries, densities, and their bonding mechanisms. Beams cast with 0.5%
steel fibers exhibited higher shear capacities than those cast with basalt and polypropylene fibers
by 23 and 16%, respectively, whereas the beams cast with 1% steel fibers showed a gain by 47
and 41%, respectively.
The predicted shear capacities according to CSA-S806-12 code provisions were
conservative with an average ratio 𝑉𝑝𝑟𝑒𝑑/𝑉𝑒𝑥𝑝 of 0.80 (standard deviation, SD = 0.12) for beams
without fibers. Good predictions for the shear capacities of the basalt-fiber reinforced concrete
beams (BLWC) were provided by the models derived by Shin (1994) and Gopinath (2016) in

vi
which the ratios Vpred /Vexp were 1.34 (SD = 0.09) and 1.35 (SD = 0.07), respectively. Also, the
model of Shin (1994) predicted well the shear capacities of the polypropylene-fiber reinforced
concrete beams (PLWC) with a Vpred /Vexp ratio of 1.34 and SD of 0.18. The models of Gopinath
(2016), Ashour A (1992), and Shin (1994) predicted the shear capacities of steel-fiber reinforced
concrete beams (SLWC) fairly reasonable with a Vpred /Vexp ratio of 1.01 (SD = 0.06), 1.07 (SD =
0.01) and 1.20 (SD = 0.08), respectively. A new model was proposed to predict the shear capacities
of FRWLC beams reinforced with BFRP longitudinal bars. The proposed model predicted well
the shear capacities of BLWC beams with a Vpred /Vexp ratio of 1.01 (SD = 0.05) and those of PLWC
beams with a Vpred /Vexp ratio of 0.99 (SD = 0.06). The bond factor and the interface bond matrix
used were 0.75 and 4.18 MPa, respectively. The proposed model also predicted well the shear
capacities of beams cast with SLWC with a Vpred /Vexp ratio of 0.9 when the bond factor and the
interface bond matrix were taken equal to 1.00 and 6.8 MPa, respectively.

vii

viii
Table of contents
Résumé .......................................................................................................................................... iii
Abstract .......................................................................................................................................... v
Table of contents ........................................................................................................................ viii
List of tables.................................................................................................................................. xi
List of figures ............................................................................................................................... xii
Abbreviations ............................................................................................................................. xiv
Notations ..................................................................................................................................... xvi
Dedication ................................................................................................................................. xviii
Acknowledgement ...................................................................................................................... xix
1. Introduction ............................................................................................................................... 1
1.1 Scope ............................................................................................................................. 1
1.2 Thesis structure ............................................................................................................... 3
Chapter 2: Literature Review ...................................................................................................... 5
2.1 Introduction ............................................................................................................................. 5
2.2 Lightweight concrete (LWC) ........................................................................................... 5
2.3 Fiber-reinforced concrete (FRC) ....................................................................................... 6
2.3.1 Type of fibers ................................................................................................................. 7
2.3.1.1 Basalt fibers .................................................................................................................... 8
2.3.1.2 Steel fibers ...................................................................................................................... 9
2.3.1.3 Synthetic fibers ............................................................................................................... 9
2.3.2 Factors affecting FRC properties .................................................................................... 10
2.3.2.1 Fiber volume fraction .................................................................................................... 10
2.3.2.2 Fiber geometry .............................................................................................................. 11
2.4 Fiber-reinforced polymer (FRP) bars .............................................................................. 13
2.4.1 Basalt-fiber reinforced polymers (BFRP) .................................................................... 13
2.4.1.1 Mechanical properties of BFRP bars ............................................................................... 14
2.4.1.2 Shear behavior of BFRP-reinforced concrete beams ................................................. 14
2.5 Shear design equations of FRP-reinforced beams ............................................................ 15
2.5.1 CSA S806-12 equations ............................................................................................. 15
2.5.2 CSA S6-06 equations .................................................................................................... 16
2.5.3 ACI 440.1R-15 equations .............................................................................................. 17
2.5.4 JSCE (1997) equations .................................................................................................. 17
2.6 Shear design equations of FRC beams ............................................................................ 18
2.6.1 Narayanan and Darwish (1987) ...................................................................................... 18
2.6.2 Ashour model A (1992) ................................................................................................. 19

ix
2.6.3 Ashour model B (1992) ................................................................................................. 19
2.6.4 Kawak et al. (2002) ....................................................................................................... 19
2.6.5 Shin et al. (1994) ........................................................................................................... 20
2.6.6 Gopinath et al. (2016) .................................................................................................... 20
2.6.7 Modification of current models for LWC ........................................................................ 21
2.7 Outcome and objectives ................................................................................................. 22
Chapter 3: Experimental Program ........................................................................................... 24
3.1 Scope ..................................................................................................................................... 24
3.2 Test matrix ............................................................................................................................. 24
3.3 Test specimen ........................................................................................................................ 25
3.4 Materials ................................................................................................................................ 27
3.5 Fibers ........................................................................................................................... 30
3.5.1 BFRP fibers .................................................................................................................. 30
3.5.2 Hooked-end steel fibers ................................................................................................. 31
3.5.3 Polypropylene fibers ...................................................................................................... 31
3.6 Specimens preparation ................................................................................................... 32
3.7 Instrumentation of the test specimens ............................................................................. 34
3.8 Test setup ..................................................................................................................... 35
Chapter 4: Experimental Results .............................................................................................. 37
4.1 Introduction .................................................................................................................. 37
4.2 Material properties ........................................................................................................ 37
4.2.1 Fresh concrete properties ............................................................................................... 37
4.2.2 Hardened concrete properties ......................................................................................... 38
4.2.2.1 Compressive strength .................................................................................................... 38
4.2.2.2 Splitting tensile strength ................................................................................................ 39
4.3 Beam test results ........................................................................................................... 40
4.3.1 Mode of failure and crack pattern ................................................................................... 42
4.3.2 Shear strength ............................................................................................................... 45
4.3.2.1 Effect of type of concrete on the shear strength ............................................................... 45
4.3.2.2 Effect of longitudinal reinforcement ratio on the shear strength ........................................ 45
4.3.2.3 Effect of fiber content on the shear strength ................................................................. 46
4.3.2.4 Effect of the fiber type on the shear strength ................................................................ 48
4.3.3 Crack width .................................................................................................................. 50
4.3.3.1 Effect of reinforcement ratio on crack width ................................................................ 50
4.3.3.2 Effect of fiber content on crack width ......................................................................... 51
4.3.3.3 Effect of fiber type on crack width .............................................................................. 52
4.3.4 Load-deflection curves .................................................................................................. 54
4.3.4.1 Effect of type of concrete on load-deflection curve ...................................................... 56
4.3.4.2 Effect of reinforcement ratio on the load-deflection curves ........................................... 56
4.3.4.3 Effect of fiber content on the load-deflection behavior ................................................. 57
4.3.4.4 Effect of fiber type on the load deflection behavior ...................................................... 58
4.3.5 Load strain response ...................................................................................................... 60
Chapter 5: Analytical Predictions ............................................................................................. 64
5.1 Introduction .................................................................................................................. 64

x
5.2 Shear strength of BFRP-reinforced LWC beams with no fibers ........................................ 64
5.3 Shear strength of BFRP-reinforced FRLWC beams ......................................................... 67
5.3.1 Effect of type of fibers on the predicted capacities ........................................................... 71
5.3.2 Discussion .................................................................................................................... 72
5.3.3 Proposed model ............................................................................................................ 74
6. Conclusions and Recommendations ...................................................................................... 77
6.1 Introduction .................................................................................................................. 77
6.2 Conclusions .................................................................................................................. 77
6.3 Recommendations for future work .................................................................................. 80
Bibliography ................................................................................................................................ 81

xi
List of tables
Table 2.1: Properties of fibers ............................................................................................................. 7
Table 3.1: Test matrix ................................................................................................................... 24
Table 3.2: Quantity of mix design ................................................................................................ 28
Table 3.3: Mechanical properties of BFRP bars ........................................................................... 28
Table 3.4: Sieve size and percent passing of Stalite aggregates ................................................... 28
Table 3.5: The physical properties of natural sand used ............................................................... 29
Table 3.6: Sieve size and percent passing of sand used ................................................................ 29
Table 3.7: Properties of Fly ash .................................................................................................... 29
Table 3.8: Properties of fibers ....................................................................................................... 30
Table 4.1: Slump test results ............................................................................................................. 38
Table 4.2: Compressive strength 𝑓′𝑐 and splitting tensile strength 𝑓𝑠𝑝 ................................................ 39
Table 4.3: Test results ...................................................................................................................... 41
Table 4.4: Crack width of beams ...................................................................................................... 50
Table 4.5: Load deflection results ..................................................................................................... 55
Table 5.1: Comparison of test result values and predicted shear capacity values ................................... 65
Table 5.2: Comparison between the predicted and experimental shear strengths of the tested beams ..... 68
Table 5. 3 Mean, standard deviation, and coefficient of variation of the Vpred /Vexp ratio of all specimens69

xii
List of figures
Figure 2.1: Load-deflection relationship for plain concrete and FRC (ACI 544-1R-02) ........................... 7 Figure 2.2: Types of basalt fibers: (a) chopped fibers (Xiao et al. 2016), (b) continuous fibers (adopted
from rednewswire.com), (c) dry basalt fibers, and (d) precured fiber (High et al. 2015) .......................... 8
Figure 2.3: Steel fibers: (a) hooked-end steel fibers (Kang 2010) and (b) crimped fibers (Sahoo 2014) .... 9 Figure 2.4: Synthetic fibers: (a) polypropylene and polyethylene (Ababneh et al. 2017) and (b) macro
synthetic fibers (Yazdanbakhsh, 2015) .............................................................................................. 10 Figure 2.5: (a) Fibers geometry as reported in: (a) Katzer et al. (2012) and (b) Holschemacher et al.
(2010) ............................................................................................................................................. 12
Figure 3.1: Specimens details (all dimensions in mm) ........................................................................ 26
Figure 3.2: BFRP bars used in this study ........................................................................................... 28
Figure 3.3: Grading curve for Stalite crushed stone (data from suppliers) ............................................ 29
Figure 3.4: Basalt fibers ................................................................................................................... 30
Figure 3.5: Steel fibers ..................................................................................................................... 31
Figure 3.6: Polypropylene fibers ....................................................................................................... 32 Figure 3.7: Fabrication of the beam specimens: (a) cage fabrication, (b) placing cages in wooden forms,
(c) adding fibers to concrete, (d) concrete casting, (e) concrete finishing, and (f) curing of the test
specimens ....................................................................................................................................... 33
Figure 3.8: Painted beam specimen ................................................................................................... 34 Figure 3.9: Strain gauge installation on BFRP bars: (a) rubbing the bars’ surface and (b) adhering strain
gauges ............................................................................................................................................ 34
Figure 3.10: Concrete strain gauge installed ...................................................................................... 35
Figure 3.11: LVDT locations ............................................................................................................ 36
Figure 3.12: Schematic drawing for inclined LVDTs (all dimensions are in mm) ................................. 36
Figure 4.1: Slump test results of (a) BLWC and (b) PLWC mixes ....................................................... 38
Figure 4.2: Compressive strength of concrete mixes ........................................................................... 40
Figure 4.3: Splitting tensile strength of concrete mixes ....................................................................... 40
Figure 4.4: Crack patterns of LWC beams at failure ........................................................................... 43
Figure 4.5: Crack pattern of NWC beams at failure (from El Refai and Abed 2015) ............................. 44
Figure 4.6: Effect of reinforcement ratio on shear capacity ................................................................. 46 Figure 4.7: Effect of fiber content on the shear capacities of beams with different longitudinal
reinforcement ratios ......................................................................................................................... 48
Figure 4.8: Effect of the type of fibers on the shear capacity of beams of (a) group B and (b) group C ... 49
Figure 4.9: Effect of reinforcement ratio on crack width ..................................................................... 51
Figure 4.10: Effect of fiber content on crack width ............................................................................ 52
Figure 4.11: Effect of fiber type on crack width ................................................................................. 53
Figure 4.12: Load-deflection curves for beams .................................................................................. 54
Figure 4.13: Load-deflection curve NWC vs LWC ............................................................................ 56
Figure 4.14: Effect of reinforcement ratio on load-deflection curve ..................................................... 57
Figure 4.15: Effect of fiber dosage on load deflection curve ............................................................... 58
Figure 4.16: a and b: Effect of fiber type on load deflection curve ....................................................... 59
Figure 4.17 (a) and (b): Strain gauge of beams with different longitudinal reinforcement ..................... 61
Figure 4.18: Strain gauge of beams with the 0.5% volume fraction ..................................................... 62
Figure 4.19: Strain gauge of beams with the 1.0% volume fraction ..................................................... 63
Figure 5.1: Predicted-to-experimental ratios of LWC beams ............................................................... 66

xiii
Figure 5.2: Ratio of predicted-to-experimental shear capacities of the tested beams ............................. 71

xiv
Abbreviations
4PB Four points bending
ACI American concrete institute
ASTM American Society for testing and materials standard
B-0.5-10 Beam contain 0.5 % basalt fiber reinforced with BFRP bars diameter 10
B-0.5-12 Beam contain 0.5 % basalt fiber-reinforced with BFRP bars diameter 12
B-1.0-10 Beam contain 1.0 % basalt fiber-reinforced with BFRP bars diameter 10
B-1.0-12 Beam contain 1.0 % basalt fiber-reinforced with BFRP bars diameter 12
BF Basalt fibers
BLWC Basalt fiber-reinforced lightweight concrete
BFRP Basalt fiber-reinforced polymer
C-10 Control beam reinforced with diameter 10
C-12 Control beam with diameter 12
dia Diameter
FRC Fiber-reinforced concrete
FRLWC Fiber-reinforced lightweight concrete
FRNWC Fiber-reinforced normal weight concrete
L Fiber length
LWC Lightweight concrete
L/d Aspect ratio
NWC Normal weight concrete
P Load
P-0.5-12 Beam contain 0.5 % polypropylene fiber-reinforced with BFRP bars diameter 12
P-1.0-12 Beam contain 1.0 % polypropylene fiber-reinforced with BFRP bars diameter 12
PLWC Polypropylene fiber-reinforced lightweight concrete

xv
S-0.5-12 Beam contain 0.5 % steel fiber-reinforced with BFRP bars diameter 12
S-1.0-12 Beam contain 1.0 % steel fiber-reinforced with BFRP bars diameter 12
SF Steel fibers
SFRC Steel fiber-reinforced concrete
SLWC Steel fiber reinforced lightweight concrete
PF Polypropylene fibers
w/c Water/Cement Ratio
∆ Deflection

xvi
Notations
a Shear span (mm)
𝐴𝑓 Area of longitudinal FRP bars reinforcement (𝑚𝑚2)
𝑎𝑔 Aggregate size (mm)
a/d Shear span to depth ratio
d Effective depth of beam (mm)
𝑑𝑣 Effective shear depth (mm)
𝐷𝑓 Diameter of fiber (mm)
𝑑𝑓 Bond factor = 0.5 for round fiber, 0.75 for crimped fiber, and 1 for indented fiber
e Arch action factor
𝐸𝑓 Modulus of elasticity of FRP reinforcement (MPa)
F Fiber factor = (𝐿𝑓
𝐷𝑓𝑉𝑓𝑑𝑓)
𝑓′𝑐 Compressive strength of concrete (MPa)
𝐹𝑐𝑟 Concrete tensile strength (MPa)
𝑓𝑐𝑢𝑓 Cube strength of fiber concrete (MPa)
𝐹𝐹𝑈 Ultimate strength of FRP bars (MPa)
𝑓𝑠𝑝 Splitting tensile strength (MPa)
h Total height of beam (mm)
𝐿𝑓 Length of fiber (mm)
𝑀𝑓 Factored applied moment (kN.m)
xvii
𝜌 Reinforcement ratio
𝑠𝑧𝑒 Crack spacing (mm)
𝜏 Average fiber matrix = 4.15 (MPa)
𝑣𝑏 Fiber pullout stress = 0.41𝜏F
𝑣𝑓 Volume fraction of fibers (%)
𝑉𝑐 Contribution of concrete in shear (MPa)
𝑉𝐹 factored shear force (kN)
𝑉𝑟 Ultimate shear strength (MPa)
𝜑𝑐 Concrete resistance factor
𝛾𝑏 Strength reduction factor, equal to 1.3

xviii
Dedication
To my beloved family (father, mother, brothers, sisters, wife, and daughter) for their endless
support and inspiration.

xix
Acknowledgement
I would like to take the chance to send my deepest thanks and acknowledgment to the
people who have helped me through this work and without whom this work would not be done.
Foremost, I would like to thank Allah for giving me inspiration, strength, ability, and grace
time and again throughout my work.
I would like to send special thanks and say how sincerely grateful I am to my master
supervisor Dr. Ahmed El-Refai, and for granting me the chance to work under his supervision. I
am grateful for his guidance, useful advice, endless encouragements, support, and motivation. I
owe him an incredible value of appreciation for his notable role in helping me during my studies.
His office door was always open for me every time I encountered problems in my work or had
inquiries. He guided me in the right direction whenever he thought I needed it. I am so glad to be
one of your research group.
I am grateful to co-advisor Dr. Hisham Sukr and Dr. Hossam Sallam, who helped me
throughout my studies. All of the helpful information, invaluable assistance, priceless suggestions,
endless support, sharing of vast knowledge, consulting, and valuable comments were and still are
highly appreciated. They are always glad and ready to help me solve the problems.
My deepest thanks go to my family (father, mother, brother and sisters) for their help,
patience, encouragements, endless love, spiritual support, their devoted cooperation, and their
continuous source of inspiration to achieve this degree. They have continuously supported my
aspiration and dreams. I cannot praise them enough for their endless support and particularly my
parents’ prayers at night.
I am greatly indebted to my wife and daughter and I have to send them my deepest
appreciation. All of the constant support, encouragements, and showing enthusiasm. My wife
always stood beside me to give me constant effort to complete this challenge. Also, my gratitude
to my lovely daughter for her smile that gave me the enthusiasm and motivation to accomplish my
dream.

xx
I would like to extend my recognition to the structural laboratory staff at Laval University
for their help, advice, and organization during preparation, casting, and testing.
Also, I want to extend my gratitude to my lab mates, and my friends for helping me throughout
my studies.
Finally, I, thankfully, acknowledge the Jazan University for the co-operation and funding my
research to complete my studies in Canada.
Thank you all. I am blessed.


1
1. Introduction
1.1 Scope
Corrosion of steel reinforcement in concrete has motivated engineers to introduce
innovative reinforcing materials such as fiber-reinforced polymers (FRP). Known for their
corrosion resistance, FRP bars became a reliable alternative for conventional steel bars in the last
decades. Due to the superior features of FRP bars, they have been used in various concrete
applications especially in regions where harsh environments prevail.
FRPs are produced in various shapes and from different materials. Glass (GFRP) and
carbon (CFRP) are the most commonly-used materials in construction. Recently, basalt fibers have
joined the family of fibers to produce new BFRP bars. Basalt fibers are extracted from volcanic
rocks, which can be found all around the planet. Basalt fibers have higher tensile strength than the
well-known E-glass fibers and higher strains than the carbon fibers at ultimate (Hassan et al. 2016).
Moreover, basalt fibers are known for their enhanced resistance to alkaline, overcoming a common
drawback of glass fibers (El Refai et al. 2015; Issa, 2015). However, the lack of studies on the
performance of BFRP-reinforced concrete members has limited their applications in construction.
Therefore, BFRP bars have not been accepted yet as reinforcing bars in North American design
codes.
Despite their numerous advantages, FRP-reinforced concrete structures are limited by their
low ductility, excessive deflections, and wide cracks, which is attributed to their linear elastic
behavior up to failure. Hence, design codes recommend over designing FRP-reinforced structures
to prevent the premature rupture of the bars prior to concrete crushing. These high ratios of
reinforcements led to brittle concrete members that lack ductility and energy dissipation, which is
a concern especially in seismic regions. To overcome these limitations, fiber-reinforced concrete
(FRC) in which discrete fibers are added to concrete, emerged as a viable solution to overcome
the brittleness of FRP-reinforced structures.
FRC has been used in construction for several decades and are known for their enhanced
serviceability and better post-cracking behavior (Cucchiaraet al. 2004; Juárez et al. 2007;
Hassanpouret al. 2012). The fibers delay the crack formation and act as an additional reinforcement

2
that bridge cracks during service (Cucchiara et al. 2004; Wight, 2009). FRC are also characterized
by their high tensile strength and hence, their high resistance to shear stresses as compared to plain
concrete. There are different types of fibers that have been used in FRC applications. The most
common fibers are steel, glass, and synthetic fibers. With the advancement in the fibers’ industry,
new fibers made of basalt have emerged as alternatives to conventional fibers. Basalt fibers come
in two forms namely, chopped and macrofibers. Chopped basalt fibers were reported to reduce
concrete workability and to have major durability concerns in Branston et al. (2016) and Jiang et
al. (2014). On the other hand, using basalt macrofibers enhanced the concrete properties in the post
cracking stage and increased the energy absorption capacity, the impact strength, and the modulus
of concrete (High et al. 2015). More details about the macrofibers used in this study are given in
the following chapters.
Despite the advantages of FRC, the need for lighter concrete structures, for economic- and
design-related motives, have driven the use of lightweight concrete (LWC) in construction.
Members cast with LWC have reduced dead and seismic loads owing to their low density,
compared to normal weight concrete (NWC) members. In addition, LWC are known for their
enhanced freezing, fire, and heat resistances (Xiao et al. 2016). Despite these features, LWC are
more brittle than NWC, which is attributed to the weak strength of the lightweight aggregates used
in LWC mixes (Zinkaah, 2014; Hassanpour et al. 2012; Wight, 2009). Moreover, the low modulus
of elasticity of LWC can lead to excessive deflections and large cracks as reported in Altun et al.
(2013).
The use of FRP bars in LWC adds another dimension of complexity and increases the
severity of the brittleness problem and the lack of toughness of FRP-reinforced structures.
However, the anti-corrosion properties of FRP bars combined to the weight reduction in LWC
structures have motivated engineers to find alternative solutions. One of these solutions was the
addition of discrete fibers to the LWC in order to offset its lack of ductility and at the same time
increase its tensile and shear strengths. Many studies have been reported on the use of steel fibers
in LWC and the results were satisfactory. However, the high density of steel fibers might offset
the benefit of using LWC to minimize the weight of the structure. Therefore, the use of synthetic
fibers and the newly emerged basalt macrofibers might be a feasible alternative to maintain the
reduced weight of LWC structures.

3
To date, none of previous studies have reported on the use of fiber-reinforced light weight
concrete (FRLWC) in constructing concrete elements reinforced with longitudinal FRP bars, not
to mention the use of BFRP bars or the newly-emerged basalt macrofibers. Therefore, the
performance of such elements is not well understood. Since the addition of fibers to concrete
influences the most the tensile properties of the mix, and hence its shear strength, the current
research focused on investigating the shear behavior of different FRLWC beams reinforced with
BFRP bars. The effect of different types of fibers, their volume fractions, and the longitudinal
reinforcement ratios on the shear behavior of the beams was examined both experimentally and
analytically. The analytical investigation aimed at assessing the applicability of the available
models and design codes formulations to predict the shear resistance of the new BFRP-FRLWC
system.
1.2 Thesis structure
This thesis is divided into five chapters as follows:
• Chapter 1 provides background on the subject and defines the research problem.
• Chapter 2 provides a literature review on the LWC and FRLWC. It also reports on the
use of FRP bars as longitudinal reinforcement in reinforced concrete elements. It
discusses the factors influencing the shear behavior of concrete elements and the shear
design provisions of LWC and FRLWC. Finally, the chapter includes a summary of the
previous research, the objective, and the significance of the current research work.
• Chapter 3 presents the experimental program of this study. It includes the description of
the materials used and their properties, the design, preparation, fabrication, and testing of
the specimens.
• Chapter 4 discusses the experimental results with a focus on the shear behavior of the
tested beams. It explains the effect of each investigated parameter on the crack pattern,
shear capacity, crack width, load-deflection curves, and strains in bars and concrete.

4
• Chapter 5 compares between the experimental shear capacities and those predicted using
the available shear models. It also highlights the effect of different parameters used in
these models on the prediction of the shear capacities of the beams.
• Chapter 6 demonstrates the main conclusions that have been drawn from this current
research along with recommendations for future work studies.

5
Chapter 2: Literature Review
2.1 Introduction
In this chapter, an overview of previously-conducted research on the mechanical properties
of fiber-reinforced polymer (FRP) bars and fiber-reinforced concrete (FRC) is presented. Studies
conducted on the shear response of lightweight concrete (LWC) beams are also presented and
discussed. In addition, different factors influencing the shear response of beams, such as
reinforcement ratio, size effect, and span-to-depth ratio are discussed. Furthermore, the current
proposed models for predicting the shear response of LWC beams with fibers are
illustrated. Finally, the significance and the main objectives of the current research are highlighted.
2.2 Lightweight concrete (LWC)
LWC has been used in concrete structures since the early twentieth century. LWC is
characterized by its low density that ranges between 90 and 115 𝐼𝑏/𝑓𝑡3 (1440 -1840 𝐾𝑔/𝑚3),
which is less than that of normal weight concrete (NWC) (Rakoczy and Nowak 2014). This low
density decreases the dead load, minimizes the damages caused by earthquakes, and lead to more
economical structures (Düzgün et al. 2005). Due to the high strength-weight ratio in structural
LWC, it becomes more effective in structural components than NWC (Rakoczy and Nowak 2014).
Furthermore, LWC has many other features, such as low thermal accessibility, ease of transport,
and longer lasting durability (Hassanpouret al. 2012). LWC also has excellent resistance to damage
from freezing and elevated temperature (Xiao et al. 2016).
On the other hand, LWC has lower mechanical properties (such as lower modulus of
elasticity and lower tensile strength) and higher brittleness than NWC (Hassanpour et al. 2012;
Wight, 2009). However, creep and shrinkage of LWC are equal to or a slightly higher than those
of NWC (Wight, 2009). It has been reported that the tensile strength of LWC can reach between
70 and 100 % of that of NWC (Wight, 2009). Lower modulus of elasticity of LWC results in crack
growth at higher rate than that encountered in NWC (Altun et al. 2013). Having said that, LWC
elements can attain similar strength as those made from NWC (Zinkaah, 2014).

6
LWC can be categorized to natural and artificial concrete according to the type of
aggregates used (ASTM-C330). Natural lightweight concrete is produced by processing some
aggregates such as pumice, tuff, and scoria. However, the artificial lightweight concrete is
produced by sintering, pelletizing, and expanding products such as clay, blast-furnace, slag,
diatomite, shale, fly ash, and slate (ASTM-C330).
2.3 Fiber-reinforced concrete (FRC)
Figure 2.1 shows the load-deflection relationship for plain concrete and FRC and how
presence of fibers decreases deflection. FRC is the term used to denote concrete strengthened with
short, random oriented fibers (Wight, 2009). FRC has many advantages compared to regular
concrete mixes, such as minimizing the number and the width of cracks, increasing the shear and
flexure strengths, increasing ductility, and decrease deflection (Thomas et al. 2007). FRC can be
used as an alternative solution to reinforcement to alleviate cracking problems and as minimum
reinforcement for shear and flexural strength as permitted by several codes and design guidelines
(ACI 544-88; ACI 318-08; and RILEM TC-162-TDF-2000; Wight, 2009; Cucchiara et al. 2004).
Moreover, the use of FRC in concrete enhances its toughness, energy absorption, and compressive
ductility as reported by (Hassanpour et al. 2012).
It is important to note that fibers in FRC mixes restrict the propagation of cracks due to the
bonding between the fibers and the surrounding concrete (Hassanpour et al. 2012). Because of the
high toughness of FRC mixes, FRC can be used as a repair material to rehabilitation existing
structures particularly in seismic zones (Okuyucu et al. 2011; Cucchiara et al. 2004).

7
Figure 2.1: Load-deflection relationship for plain concrete and FRC (ACI 544-1R-02)
2.3.1 Type of fibers
There are various types of fibers available for use in concrete structures. They include steel
fibers, glass fibers, natural organic or mineral fibers and synthetic fibers. Steel fibers and synthetic
fibers are the most common types of fibers used in concrete. Recently, a new type of fibers, the
basalt fibers, has joined the fibers family as alternative to conventional fibers. Table 2.1: Properties
of fibers lists the physical properties of the current types of fibers.
Table 2.1: Properties of fibers
Type Specific Gravity
(g/cm³)
Length
(mm)
Diameter
(mm)
Elastic Modulus
(Gpa)
Chopped Basalt Fiber 2.61 17-19 13 μm 78.2 - 94.1
Dry Basalt Fiber 2.8 24 13-20 μm 89
Precured Fiber 1.9 40 2.6 43
Synthetic Fiber 0.92 40 0.44 9.5
Polypropylene Fiber 0.92 50 0.9 9.5
Hooked-end 7.85 50 0.8 200
Bundled Steel Fiber 7.85 31.84 0.49 200

8
2.3.1.1 Basalt fibers
Basalt fibers is a newly-emerged type of fibers made from the natural basalt ore as a raw
material. Basalt fiber can be found in form of chopped or continuous fibers as shown in Figure
2.2: Types of basalt fibers: (a) chopped fibers (Xiao et al. 2016), (b) continuous fibers (adopted
from rednewswire.com), (c) dry basalt fibers, and (d) precured fiber (High et al. 2015). The
addition of BF to the concrete mix enhance the material properties of mix (High et al. 2015). The
obtained basalt fiber-reinforced concrete (BFRC) is characterized by its ductile post-cracking
behavior, its high energy absorption, increased impact strength, and a high flexural modulus (Xiao
et al. 2016). Xiao et al. (2016) and Vijay et al. (2011) reported that BFRC has a low moisture
absorption and good alkali resistance in addition its high strength and good fatigue resistance. On
the other hand, increasing the volume fraction of BF decreases the slump and affects its workability
(High et al. 2015).
a) b)
c) d)
Figure 2.2: Types of basalt fibers: (a) chopped fibers (Xiao et al. 2016), (b) continuous fibers
(adopted from rednewswire.com), (c) dry basalt fibers, and (d) precured fiber (High et al. 2015)

9
2.3.1.2 Steel fibers
Steel fibers are commonly used in concrete structures due to its high-strength, ductility,
and improved post-cracking behaviors as shown in Figure 2.3: Steel fibers: (a) hooked-end steel fibers
(Kang 2010) and (b) crimped fibers (Sahoo 2014)(Kang et al. 2010). Kwak et al. (2003) reported that
the use of steel fibers could increase the shear strength of concrete beams from 13 to 170%, thus
changing the brittle mode of failure of concrete to a more ductile failure. Zinkah (2014) reported
that steel fibers up to 0.75% volume fraction enhanced the compressive strength of LWC because
of the good mechanical bond between the cement matrix and the fibers, which led to a significant
delay in the growth of micro-cracks. However, increasing the steel fibers to 1% resulted in a
reduction in the compressive strength, which was attributed to the creation of voids inside the
concrete during mixing (Zinkah, 2014).
a) b)
Figure 2.3: Steel fibers: (a) hooked-end steel fibers (Kang 2010) and (b) crimped fibers (Sahoo
2014)
2.3.1.3 Synthetic fibers
Compared to steel fibers, experimental and analytical research into macro synthetic fibers
are limited. There are different types of synthetic fibers namely, the nylon, para-aramid, polyester,
and polypropylene as shown in Figure 2.4: Synthetic fibers: (a) polypropylene and polyethylene
(Ababneh et al. 2017) and (b) macro synthetic fibers (Yazdanbakhsh, 2015) (Hamad et al. 2011).
Synthetic fibers are generally made of polypropylene and are non-corrosive, easy to apply, and are
alkali resistant (Ayman et al. 2017). Due to the lack of research, most of the applications that

10
involve the use of synthetic fibers focus on controlling the cracks especially in non-structural
applications (Yazdanbakhsh, 2013).
a) b)
Figure 2.4: Synthetic fibers: (a) polypropylene and polyethylene (Ababneh et al. 2017) and (b)
macro synthetic fibers (Yazdanbakhsh, 2015)
2.3.2 Factors affecting FRC properties
2.3.2.1 Fiber volume fraction
The fiber volume fraction is defined as the percentage of the fiber volume added to of
concrete. High et al. (2015) reported that the addition of basalt fibers enhanced the mechanical
properties of the beam, in particular the splitting tensile strength, without affecting the concrete
workability. Vijay et al. (2011) reported that the increase of volume fraction increased the tensile
strength, ductility, and toughness of the tested specimens.
Kwak et al. (2003) studied the shear strength of steel fiber-reinforced concrete beams. Their
test program included three different steel fibers volume fractions namely, 0, 0.5 and 0.75%
respectively. Test results suggested that increasing the fibers volume fraction increased the
ultimate shear strength of the tested beams between 122 to 180%. Furthermore, the mode of failure
changed with the increase of the fibers volume and the crack spacing decreased from 90-170 mm
to 70-90 mm when the fibers increased from 0 to 0.5%, respectively. The increase in the fibers
volume fraction also increased the ultimate deflection of the beams having the same length and
a/d, where a is the shear span and d is the beam’s depth.

11
Thomas et al. (2011) investigated the shear strength of steel fiber-reinforced lightweight
concrete (SFRLC) beams. The test program included three different volume fractions of steel
fibers: 0.5, 0.75, and 1%. It was reported that the addition of 0.75% fibers boosted the ductility by
5.3 times compared to that of the control beams. The shear capacity increased by 18% for a volume
fraction of 0.5% and by 30% for a volume fraction of 0.75%. Increasing the volume fraction of
fibers to 1% increased the shear capacity by 60 to 210% and the ductility by 20 to 150%. Steel
fiber-reinforced concrete beams (SFRC) and steel fiber-reinforced lightweight concrete (SFRLC)
beams showed 10% higher shear strength and energy absorption with 𝑣𝑓=1% than those without
steel fibers.
Kang et al. (2010) studied the shear strength of SFRLC beams. Their test program included
different volume fractions of steel fibers namely 0.5 and 0.75%. The authors reported that the
volume fraction of steel fibers of 0.5 and 0.75% increased the shear strength by about 25 to 45%.
Steel fibers volume fraction of 1% resulted higher shear strengths by 60 to 210% in comparison to
those of control beams without fibers.
2.3.2.2 Fiber geometry
Lately, different types of fibers have been developed and with different shapes such as
straight, crimped, hooked-end, indented, round, twisted, paddled, irregular, and flat-ended
geometries for steel fibers and plain, twisted, fibrillated, and buttoned-ends for synthetic fibers as
shown in Figure 2.5: (a) Fibers geometry as reported in: (a) Katzer et al. (2012) and (b) Holschemacher et
al. (2010) (Hamad et al. 2011). The fibers with an end deformation (crimped or hooked) helped the
concrete resist cracking, while the stocky and smooth fibers were better from the point of view of
workability (Yoon, 2001).

12
a)
b)
Figure 2.5: (a) Fibers geometry as reported in: (a) Katzer et al. (2012) and (b)
Holschemacher et al. (2010)
A study by Dylan (2016) examined the effect of steel fiber size and geometry. It was
concluded that the larger fibers were more effective in redistributing stresses and bridging cracks
at ultimate, whereas smaller fibers increased the tensile strength up to 100% compared to their
larger counterparts. However, the size and geometry of the fibers had no effect on the compressive
strength of concrete.
In another study carried out by Abbas et al. (2016), the authors investigated the influence
of different types of fibers on the shear strength of beams without web reinforcement. It was
observed that straight, crimped, and hooked-end fibers had nearly identical effects on the ultimate
shear strength of deep beams, while straight and rounded fibers had a slight effect on the ultimate
shear strength of shallow beams. It was concluded that the shear strength of beams with straight
rounded fibers decreased as the span-to-depth ratio increased, whereas the shear strength of
hooked-end steel fibers remained constant when the span to depth ratio increased up to 2.5. The

13
effect of hooked-end steel fibers on the shear strength was the highest compared to other types of
fibers (crimped and straight).
2.4 Fiber-reinforced polymer (FRP) bars
FRP bars are widely used as reinforcement in concrete structures due to their lightweight,
high strength to weight ratio, resistance to corrosion, and ease of transport (El Refai et al. 2016).
However, FRP-reinforced concrete structures suffer from their low ductility and low energy
dissipation capacity (Muntasir et al. 2012).
There are four different types of FRP bars that are currently used in infrastructure
applications namely, carbon FRP (CFRP), glass FRP (GFRP), aramid FRP (AFRP) and basalt FRP
(BFRP). BFRP bars were used in this study to reinforce the beam specimens.
2.4.1 Basalt-fiber reinforced polymers (BFRP)
BFRP is the latest member of FRP composites and it is engaging the attention of both
researchers and industry. Basalt fibers are extracted from the volcanic rock with a melting
procedure like that applied for glass fibers, but with higher tensile strength than the well-known
E-glass fibers and higher strains than carbon fibers at failure (Hassan et al. 2016). BFRP are the
most cost-effective FRP bars compared to other FRPs such as CFRP (Dong et al. 2016; Wang et
al. 2017; Wang et al. 2014; Elgabbas et al. 2015; Elgabbas et al. 2016). However, the lack of
knowledge on BFRP bars has limited its spread and use in construction. Moreover, none of North
American building codes included the BFRP bars in their design formulations.
BFRP bars have several advantages in concrete structures due to their nontoxic,
noncorrosive, magnetic isolation, and environmentally friendly properties. Moreover, BFRP bars
are distinguished by their greater resistance to alkalinity in surrounding concrete, which eliminates
a usual disadvantage of GFRP bars (El Refai et al. 2015). In addition, these fibers have higher
resistance to high temperatures, moisture conditions, and have very good fatigue resistance and
chemical stability (El Refai et al. 2015). The mechanical properties of BFRP bars and the
experimental studies that were conducted using BFRP bars as main reinforcement for concrete
structures are presented below.

14
2.4.1.1 Mechanical properties of BFRP bars
Elgabbas et al. (2015) studied the mechanical and physical features of BFRP bars by
exposing them to alkaline solutions for up to 3000 hours at 60° C. The test results suggested that
BFRP bars can be considered in the same category as grade II and III of GFRP bars. BFRP bars
showed tensile strength higher than that predicted from CSA S807-10 for CFRP bars. However,
BFRP bars exhibited poor alkali resistance and showed a notable decrease in their mechanical
properties when subjected to alkaline solutions and considerable degradation yet reached the
requirements of ACI 440.6M-08 and CSA S807-10.
El Refai et al. (2015) reported that BFRP bars achieved about 75% bond strength as
compared to GFRP bars, which indicated that BFRP bars could be a promising alternative for
GFRP. In another study, Altalmas et al. (2015) reported that the bond strength and adhesion to
concrete of BFRP bars were higher than that of GFRP bars. The bond strength of BFRP bars
showed a 25% loss in their bond strength after 90 days of exposure in ocean water and 14% loss
after 90 days of exposure in acid solution (Altalmas et al. 2015). After 6 months of exposure to
alkaline solution, the bond strength of BFRP bars reached the minimum requirements provided by
ACI-440.6M-08 and CSA S807-10 (R2015) specifications (Hassan et al. 2016). Due to the
increase of temperature the bond strength decreased gradually, and the influence of temperature
on the bond strength of pullout of BFRP bars showed a lower effect than GFRP bars, which was
more severe. Similar results were confirmed by Li et al. (2017) who demonstrated that the bond
strength between BFRP and concrete was greater than that of GFRP bars after exposure to high
temperatures.
2.4.1.2 Shear behavior of BFRP-reinforced concrete beams
El Refai et al. (2016) investigated the concrete contribution to the shear resistance of
concrete beams reinforced with BFRP bars. The test program included 8 beams reinforced with
BFRP bars and 2 beams reinforced with steel bars. Beams were cast with different reinforcement
ratios and span-to-depth ratios (a/d). The test results were compared with the predictions of
different codes and design guidelines. The test results showed that the CSA S806-12 and JSCE-97
formulations provided precise predictions of the shear capacities of the tested beams with mean
values of 1.03 and 1.25, respectively, whereas the CSA S6-10 and ACI-440.1R-15 provided

15
conservative predictions with mean values of 1.57 and 1.94, respectively. The concrete
contribution to the shear strength decreased when a/d ratio increased and increased with the
increase of the axial rigidity of the beam.
Issa (2012) studied the shear behavior of concrete beams reinforced with BFRP bars. The
test program included 12 beams with and without BFRP shear reinforcement and with different
parameters such as the longitudinal reinforcement ratio and the span to depth ratio. Test results
showed that increasing the reinforcement ratio increased the shear capacity of the beams, however,
with the increase of span to depth ratio the shear capacity decreased. The shear failure of reinforced
concrete beams with higher longitudinal reinforcement ratio and without shear reinforcement was
brittle.
Tomlinson et al. (2014) investigated the performance of beams reinforced with BFRP bars
in shear. It was reported that the increase of the flexural reinforcement ratio increased the shear
strengths of the beams. The shear strengths of BFRP-reinforced beams in both shear and flexure
were higher by 2.6-2.9 times than those reinforced with steel bars at the same reinforcement ratio.
The ACI 440.1R-06 was conservative in predicting the shear strength of BFRP-reinforced beams
with a ratio of experimental to predicted results of 1.22 whereas the CSA S806-12 overestimated
the shear capacities of the beams with a mean ratio of 0.88.
2.5 Shear design equations of FRP-reinforced beams
This section defined the provisions of different codes namely, CAN/CSA-S806-12,
CAN/CSA-S6-10, ACI-440.1R-15 and JSCE-97 codes, to predict the shear strength of FRP-
reinforced beams. It should be noted that these equations were initially developed for FRP-
reinforced elements cast with NWC and reinforced with FRP bars.
2.5.1 CSA S806-12 equations
According to CSA S806-12, Equations 2.1 to 2.7 are used to predict the concrete
contribution to the shear strength of FRP-reinforced beam (for 𝑓′𝑐 ≤ 60 MPa) as follows:
𝑉𝑐= 0.05λ𝜑𝑐𝑘𝑚𝑘𝑟𝑘𝑎𝑘𝑠√𝑓′𝑐3
𝑏𝑤 𝑑𝑣 (2.1)

16
According to CSA-S806-12, the concrete contribution should be smaller than the
maximum shear strength, 𝑉𝑟𝑚𝑎𝑥 as follows:
𝑉𝑐 ≤ 𝑉𝑟𝑚𝑎𝑥 = 0.22φc 𝑓𝑐′𝑏𝑤𝑑𝑣 (2.2)
In addition, the concrete contribution should also be more than the minimum strength
calculated as follows:
𝑉𝑐 ≥ 0.11𝜑𝑐√𝑓𝑐′ 𝑏𝑤 𝑑𝑣 (2.3)
where
𝑘𝑚 = √𝑉𝑓𝑑
𝑀𝑓 ≤ 1.0 (2.4)
𝑘𝑟=1+(𝜌𝑓 ∗ 𝐸𝑓)1/3 (2.5)
1.0 ≤ 𝑘𝑎 =
2.5𝑀𝑓
𝑉𝑓𝑑
≤ 2.5 (2.6)
𝜌𝑓 = (𝐴𝑓𝑟𝑝
𝑏𝑑) (2.7)
where
𝑉𝑓= factored shear force (KN); 𝑀𝑓= applied moment factor (KN.m); 𝑏𝑤 = the width of beams
(mm); d = the depth of beams (mm); 𝑑𝑣 is the greater of 0.72 h or 0.9 d; 𝜌𝑓 = longitudinal
reinforcement ratio; 𝐸𝑓= modulus of elasticity of FRP bars (GPa); 𝜑𝑐 = is the concrete factor
reduction.
2.5.2 CSA S6-06 equations
According to CSA S6-06, Equations 2.8 and 2.9 are used to predict the concrete
contribution to the shear strength of FRP-reinforced beams as follows:

17
𝑉𝑐 = 2.5𝛽𝜑𝑐𝐹𝑐𝑟𝑏𝑤𝑑 (2.8)
where the concrete tensile strength, 𝐹𝑐𝑟 , is calculated as follows:
𝐹𝑐𝑟= 0.4√𝑓𝑐′ ≯ 3.2 (MPa) (2.9)
where 𝛽 is a coefficient that depends on the section geometry and the reinforcement provided.
2.5.3 ACI 440.1R-15 equations
The procedure adopted by ACI 440.1R-15 to compute the concrete contribution, 𝑉𝑐, was
derived from the results reported by Tureyen and Frosch (2003) as follows:
𝑉𝑐 = 2
5𝑘√𝑓𝑐′𝑏𝑤𝑑 (2.10)
where
𝑘 = √(𝑛𝜌)2 + 2𝑛𝜌 − 𝑛𝜌 (2.11)
n = modular ratio; 𝜌 = longitudinal reinforcement ratio
2.5.4 JSCE (1997) equations
The Japanese code uses the following equations to calculate the concrete contribution, 𝑉𝑐,
of FRP-reinforced concrete members:
𝑉𝑐 = 𝛽𝑑𝛽𝑝𝛽𝑛𝑓𝑣𝑐𝑑
𝛾𝑏𝑏𝑤𝑑 (2.12)
𝛾𝑏 = Strength reduction factor = 1.3
where
𝛽𝑝 = (100𝜌𝐸
𝐸𝑠)0.25
≤ 1.5 (2.13)

18
𝛽𝑑 = (1000
𝑑)0.25
(2.14)
𝛽𝑛 = 1 if no axial forces are applied
𝑓𝑣𝑐𝑑 = 0.2 (𝑓𝑐′
𝛾𝑐)0.333
≤ 0.72 MPa (2.15)
2.6 Shear design equations of FRC beams
Many researchers have proposed equations to calculate the shear strength of FRNWC
beams. Some studies used these models to predict the shear strength of FRLWC elements while
considering the special characteristics of LWC as detailed below.
2.6.1 Narayanan and Darwish (1987)
Narayanan and Darwish (1987) proposed a model to predict the shear strength, vu, of
FRNWC beams as given in Equation 2.16:
𝑣𝑢 = 𝑒{0.24𝑓𝑠𝑝 + 80𝜌𝑑
𝑎} + 𝑣𝑏 (2.16)
where 𝑓𝑠𝑝 is defined as splitting tensile strength and taken equal to:
𝑓𝑠𝑝 =𝑓𝑐𝑢𝑓
(20 − √𝐹)+ 0.7 + 1.0√𝐹 (2.17)
e is a constant =
{1 for
𝑎
𝑑> 2.8
2.8𝑑
𝑎 for
𝑎
𝑑< 2.8
}
(2.18)
𝑣𝑏= 0.41𝜏𝐹 (2.19)

19
F= (𝐿𝑓
𝐷𝑓)𝑉𝑓𝑑𝑓 (2.20)
𝑓𝑐𝑢𝑓 = cube strength of fibers concrete = 1.2𝑓𝑐′ MPa; a = shear span (mm); 𝑣𝑏 is called fibers
pullout stress; 𝜏 is the interface bond matrix = 4.15 MPa based on the recommendation of Swamy
et al. (1974) and Narayanan and Darwish (1987) and 6.8 MPa for hooked-end steel fibers based
on the recommendation of Lim et al. (1987); F = fibers’ factor; 𝐿𝑓 = length of fibers (mm); 𝑑𝑓=
bond factor = 0.5 for round fiber, 0.75 for crimped fiber, and 1 for indented fiber; 𝐷𝑓 = diameter
of fibers (mm); 𝑉𝑓 = volume fraction of fibers.
2.6.2 Ashour model A (1992)
Ashour (1992) (model A) proposed a model based on Zsutty’s formula to predict the shear
strength of FRNWC beams having a/d ratio more than 2.5 as given in Equation 2.21:
𝑣𝑢 = (2.11√𝑓𝑐′3 + 7𝐹)(√𝜌
𝑑
𝑎
3) (2.21)
2.6.3 Ashour model B (1992)
Ashour (1992) modified model A and proposed a new model to predict the shear strength
of FRNWC beams as given in Equation 2.22.
𝑣𝑢 = (0.7√𝑓𝑐′ + 7𝐹)𝑑
𝑎+ 17.2𝜌
𝑑
𝑎 (2.22)
2.6.4 Kawak et al. (2002)
Kawak et al. (2002) examined 12 beams with different steel fiber volume fractions,
different span to depth ratios, and different compressive strengths. The test program included 139
test results that were used to evaluate the accuracy of six different models namely Sharma (1986),
Narayanan and Darwish (1987), Ashour models A and B (1992), Imam (1997). The test results
showed that the model proposed by Narayanan and Darwish (1987) was the most accurate model
to predict the experimental results with a mean value of experimental to predicted shear strength

20
of 1.12. Kawak (2002) proposed a model to predict the shear strength of FRNWC beams as given
in Equation 2.23:
𝑣𝑢 = 3.7𝑒(𝑓𝑠𝑝2/3)(√𝜌
𝑑
𝑎
3) + 0.8𝑣𝑏 (2.23)
where
e is a constant =
{
1 𝑓𝑜𝑟
𝑎
𝑑> 3.4
𝑎𝑛𝑑
3.4𝑑
𝑎 for
𝑎
𝑑≤ 2.8
}
(2.24)
2.6.5 Shin et al. (1994)
Shin (1994) proposed a model to predict the shear strength of FRNWC beams as given in
Equation 2.25:
For 𝑎
𝑑 ≥ 3.0,
𝑣𝑢 = 0.19𝑓𝑠𝑝 + 93𝜌(𝑑
𝑎) +0.834𝑣𝑏 (2.25)
2.6.6 Gopinath et al. (2016)
Gopinath et al. (2016) investigated the analytical and experimental shear behavior of
concrete beams reinforced with BFRP bars and cast with steel fibers. Test results showed that the
JSCE-97 accurately predicted the shear strength of the beams without steel fibers. However, the
model of Ashour (1992) showed a reasonable accuracy for predicting the shear strength of beams
with steel fibers. On the other hand, the model of Narayanan and Darwish (1987) underestimated
their shear strength. The author proposed a new model to predict the shear strength of beams cast
with steel fibers and reinforced with BFRP bars, which took into account the effect of combined
steel fibers and BFRP bars. The new model was a combination of the JSCE-97 equation and that
of Ashour (1992) model A as given in Equation 2.26:

21
𝑣𝑢 = (𝛽𝑑𝛽𝑝𝛽𝑛𝑓𝑣𝑐𝑑
𝛾𝑏𝑏𝑤𝑑 + (2.11√𝑓𝑐′
3+ 7𝐹)(√𝜌
𝑑
𝑎
3
)
0.91
(2.26)
2.6.7 Modification of current models for LWC
Kang et al. (2010; 2011) tested 15 steel fiber-reinforced lightweight concrete beams (SFRLC)
beams cast with steel fibers at two volume fractions namely 0.5 and 0.75%. It was reported that
the models proposed by Narayanan and Darwish (1987), Ashour et al. (1992) (model A), and by
Kawak et al. (2002) overestimated the shear strength of steel fiber-reinforced concrete beams by
almost 30%. Similar observations were found when the models proposed by Shin (1994) and
Ashour et al. (1992) (model B) were used. Both models overestimated the shear strength of the
beams by an average of 16%.
In order to account for the use of lightweight aggregates, the authors modified Ashour’s model
A (1992) and that of Kwak et al. (2002) as shown in Equation 2.27 and 2.28, respectively. In the
modified models, the authors calibrated both models by replacing the compressive strength,
𝑓𝑐′, 𝑡𝑜 𝜆2𝑓𝑐
′ and the cube strength of fibers concrete, 𝑓𝑐𝑢𝑓, to 𝜆2𝑓𝑐𝑢𝑓, when calculate the splitting
tensile strength, 𝑓𝑠𝑝, where 𝜆 equals 0.75.
Ashour model A (1992) (modified version to account for lightweight aggregates):
𝑣𝑢 = (2.11√𝜆2𝑓𝑐′3
+ 7𝐹)(√𝜌𝑑
𝑎
3) (2.27)
𝑣𝑢 = 3.7𝑒(𝑓𝑠𝑝2/3)(√𝜌
𝑑
𝑎
3) + 0.8𝑣𝑏 (2.28)
𝑓𝑠𝑝 =𝜆2𝑓𝑐𝑢𝑓
(20 − √𝐹)+ 0.7 + 1.0√𝐹 (2.29)

22
Ababneh et al. (2017) examined 24 beams to study the effect of synthetic fibers on the
shear strength of lightweight reinforced concrete beams with different volume fraction of synthetic
fibers at 0, 0.33, 0.55, and 0.77%. The test program included 11 different models to evaluate the
accuracy of various models. It was reported that the models proposed by Narayanan and Darwish
(1987) was the most accurate model to predict the experimental results with a mean value of
predicted-to-experimental shear strength ratio of 1.0.
On the other hand, the model of Ashour et al. (1992) (Model A) underestimated the shear
strength with a mean value of predicted-to-experimental shear strength ratio of 0.88 while the
models of Ashour et al. (1992) (Model B) and Kawak et al. (2002) overestimated the shear strength
with a mean value of predicted-to-experimental shear strength ratio of 1.21 and 1.22, respectively.
The authors proposed a new model to predict the shear strength of lightweight concrete beams cast
with synthetic fibers as shown in Equation 2.30, which provided reasonable results with a mean
value of predicted-to-experimental shear strength ratio of 0.992.
𝑣𝑢 = 1.7(1 + 0.75𝑉𝑓)(0.16𝜆 √𝑓𝑐′ + 17.2 𝜌𝑉𝑢𝑑
𝑀𝑢 ) (2.30)
2.7 Outcome and objectives
The following points can be drawn from the literature review:
• LWC has lower mechanical properties such as lower modulus of elasticity, lower tensile
strength, and higher brittleness than those of NWC whereas the tensile strength is equal to
or slightly higher. Moreover, members cast with LWC have reduced dead and seismic loads
owing to their low density compared to NWC members.
• The addition of fibers influences the behavior of the concrete elements and leads to the
reduction in the number and the width of cracks, decreases the slump of concrete, enhances
serviceability, increases the shear and flexure strength, increases ductility, and leads to
better post-cracking behavior.

23
• Type and shape of fibers are important factors that influence the shear behavior of concrete
members. The change in the aspect ratio and type of fibers influences the shear strength of
the members.
• There is a lack of knowledge on the use of basalt discrete fibers in enhancing the properties
of concrete. None of the previous studies have studied the shear strength of members cast
with BFRC mixes.
• None of the previous studies have investigated the shear strength of members cast with
fiber-reinforced lightweight concrete not to mention when basalt discrete fibers are added
to the mixes.
• None of the previous researches have inspected the influence of different fiber volume
ratios and aspect ratio of basalt fibers on the shear strength of FRLWC-FRP-reinforced
concrete beams.
• There is lack of information on the shear strength of FRP-reinforced members cast with
fiber-reinforced lightweight concrete. This hybrid BFRP-BLWC system is worth to be
investigated.
Therefore, the current study aims at filling some of these gaps that were found in the
literature to understand better the behavior of the hybrid BFRP-BLWC system. Based on the
outcome of the conducted literature review, the research objectives have been set as follows:
• To examine the effect of different types and volume fractions of fibers on the shear
behavior of concrete beams reinforced with BFRP longitudinal bars.
• To assess and validate the applicability of different formulations available in the literature
to describe the behavior of basalt fiber-reinforced lightweight concrete reinforced with
BFRP longitudinal bars.

24
Chapter 3: Experimental Program
3.1 Scope
In this chapter, the experimental program is presented. The test matrix, the test specimen, the
specimen’s instrumentation, and the test setup are presented.
3.2 Test matrix
The experimental program consisted of ten rectangular beams reinforced longitudinally with
basalt fiber-reinforced polymer (BFRP) bars with two reinforcement ratios (ρ = 0.95 and 1.37%)
and cast with three different types of fibers (basalt, polypropylene, and steel fibers) at two volume
fractions (0.5 and 1%). The test matrix is shown in Table 3.1.
Table 3.1: Test matrix
*Beams reported from (El Refai et al. 2015)
The beams were divided into three groups: [A], [B], and [C] based on the fiber volume fraction
used as shown in Table 3.1. Group A consisted of two beams CL-10 and CL-12 cast in plain light
weight concrete (i.e., 0% fibers) and reinforced with longitudinal bars of 4-10M and 4-12M of
diameters 10 and 12 mm, respectively, with reinforcement ratios of 0.95 and 1.37%. In addition,
Beam Type of fibers No. of BFRP bars ρ (%) ρ/ρb Volume fraction
of fibers (%)
Group A: Control beams
CL-10 - 4 – 10 M 0.95 2.84 -
CL-12 - 4 – 12 M 1.37 4.10 -
CN-10* - 4 – 10 M 1.05 3.69 -
CN-12* - 4 – 12 M 1.52 5.35 -
Group B: Beams with volume fraction of fibers = 0.5%
B-0.5-10 Basalt 4 – 10 M 0.95 2.84 0.5
B-0.5-12 Basalt 4 – 12 M 1.37 4.10 0.5
S-0.5-12 Steel 4 – 12 M 1.37 4.10 0.5
P-0.5-12 Polypropylene 4 – 12 M 1.37 4.10 0.5
Group C: Beams with volume fraction of fibers = 1%
B-1.0-10 Basalt 4 – 10 M 0.95 2.84 1.0
B-1.0-12 Basalt 4 – 12 M 1.37 4.10 1.0
S-1.0-12 Steel 4 – 12 M 1.37 4.10 1.0
P-1.0-12 Polypropylene 4 – 12 M 1.37 4.10 1.0

25
two beams, CN-10 and CN-12, cast with normal weight concrete (NWC) and having the same
reinforcement ratio and the same span-to-depth ratio a/d as those of beams of group A consisted
part of the test matrix for comparison purpose. Beams CN-10 and CN-12 are reported in El Refai
et al. (2015).
Beams of groups B and C were labelled following the format X-Y-Z. X stands for the fibers’
type used in the concrete mix (B for basalt, P for polypropylene, and S for steel). Y stands for the
volume fraction of the added fibers (0.5 and 1.0%), and Z stands for the diameter of the BFRP bars
used as longitudinal reinforcement (10 and 12 mm). Group B consisted of four beams. Three of
the four beams (B-0.5-12, P-0.5-12, and S-0.5-12) were cast with fiber-reinforced lightweight
concrete (FRLWC) with a volume fraction of 0.5%. The three beams were longitudinally
reinforced with 4-12M BFRP bars (ρ = 1.37%). The fourth beam (beam B-0.5-10) was
longitudinally reinforced with 4-10M BFRP bars (ρ = 0.95%). Group C consisted of four
specimens similar to those of group B but cast with FRLWC at a fiber content of 1.0%.
3.3 Test specimen
Figure 3.1 shows the details of the beam specimens. All beams were fabricated at the
Structural Laboratory of Laval University. The beams had a cross-section of 150×250 mm with a
total span of 2400 mm and a shear span of 750 mm. The span-to-depth ratio, a/d, of all beams was
3.41. The BFRP bars were located at the tension face with a clear cover of 15 mm.
Specimens of group [A] had no stirrups along their length whereas those of group [B] and
[C] had double-leg 10M stirrups (diameter = 11.2 mm) in one of their shear spans. The stirrups in
specimens of groups [B] and [C] were spaced at 100 mm, which corresponded to 0.46 d, where d
is the depth of the tensile steel measured from the compression face. Two steel bars of 15M
(diameter = 15.2 mm) acted stirrups’ hungers as shown in Figure 3.1. The shear spans with stirrups
were cast with plain LWC while the rest of the beam was cast using FRLWC.

26
Figure 3.1: Specimens details (all dimensions in mm)

27
3.4 Materials
The constituents of the concrete mix are shown in Table 3.2. Portland cement was used
with a water-cement ratio of 0.46. Sand-coated BFRP bars were used as reinforcement in all of the
tested beams as shown in Figure 3.2.
The mechanical properties of the BFRP bars used in this study are given in Table 3.3:
Mechanical properties of BFRP bars. As reported in El Refai et al. (2015), the nominal tensile strength
of BFRP bars was 1168 MPa with an elastic modulus of 50 GPa. The elongation of the bars at
ultimate was 0.023.
As reported by the manufacturer, the nominal yield strength of steel bars used for stirrups
and top reinforcement was 400 MPa with an elastic modulus of 200 GPa. The elongation of steel
at ultimate was 0.002.
Lightweight aggregates commercially known as Stalite were used as coarse aggregates in
this study. Stalite aggregates are produced from expanded slate aggregates created from volcanic
ash. The maximum aggregate size of Stalite aggregates was 12.5 mm. The sieve analysis and the
grading curve of the aggregates are shown in Table 3.4 and Figure 3.3, respectively as given by
the suppliers. On the other hand, natural sand was used as fine aggregate in this concrete mix. The
physical properties and sieve analysis of natural sand are given in Table 3.5 and Table 3.6,
respectively.
Fly Ash of type F was used in the mix design. Table 3.7 describes the properties of the Fly
ash as received from suppliers. In order to ensure the workability of concrete, superplasticizer
commercially known as Eucon 37, which is a high range water reducing admixture, was used. The
plasticizer kept the plastic consistency of concrete for 30 to 60 minutes after its addition. The
dosage of the superplasticizer was determined as 2.5 liters/m3 after several trial mixes were
performed.

28
Table 3.2: Quantity of mix design
Type Quantity (kg/𝑚3)
Cement 410
Fly ash 50
Water 190
Coarse aggregates 522
Fine aggregates 680
Admixture Variable
Figure 3.2: BFRP bars used in this study
Table 3.3: Mechanical properties of BFRP bars
Type Diameter
Cross
sectional
Area (mm2)
Ultimate tensile
strength (MPa)*
Modulus of Elasticity
(GPa)*
Elongation at
Ultimate*
BFRP 10 78.5 1168 50 0.023
BFRP 12 113.1 1168 50 0.023 * As reported by El Refai et al. (2015)
Table 3.4: Sieve size and percent passing of Stalite aggregates
Sieve (mm) 20 14 10 5 2.5 1.25 0.63 0.315 0.16 0.08
Percentage passing % 100 98 64 3 2 2 1 1 1 1.2
4-10M
4-12M

29
Figure 3.3: Grading curve for Stalite crushed stone (data from suppliers)
Table 3.5: The physical properties of natural sand used
Test Measured
Gross density (LC 21-065) 2,687
Gross density S.S.S (LC 21-065) 2,700
Apparent density (LC 21-065) 2,724
Absorption (LC 21-065) (%) 0,50
Table 3.6: Sieve size and percent passing of sand used
Sieve (mm) 10 5 2.5 1.25 0.63 0.315 0.16 0.08
Percentage % 100 99 94 82 52 20 6 2.6
Table 3.7: Properties of fly ash
0
10
20
30
40
50
60
70
80
90
100
0.01 0.1 1 10 100
Perc
en
t (%
)
Sieve size, mm
Silicon Dioxide (%) 43.8
Aluminum Oxide ((%) 22.9
Iron Oxide (%) 18.7
Total Calcium Oxide ((%) 6.8
Magnesium Oxide ((%) 1.24
Sulfur Trioxide ((%) 0.38
Alkalis ((%) 1.5
Fire Loss (%) 3.05

30
3.5 Fibers
Three types of fibers were used in this study namely basalt, steel, and polypropylene fibers.
The properties of the fibers are given in Table 3.8.
Table 3.8: Properties of fibers
3.5.1 BFRP fibers
Newly-developed basalt macrofibers made of continuous basalt fiber-reinforced polymer bars
were used in this study. The basalt fibers were characterized by their helix shape and rough surface
to increase bond to concrete as shown in Figure 3.4. They are 43 mm long (𝑙𝑓) and 0.66 mm in
diameter (𝑑𝑓) with an aspect ratio, (𝑙𝑓/𝑑𝑓), of 65.15. According to the manufacturer datasheet, the
macrofibers have a tensile strength and modulus of elasticity of 1100 MPa and 60 GPa,
respectively, with water absorption almost nil and density of 1.9 g/cm³. Their specific gravity is
close to that of concrete, which enables their use in concrete with high volume fractions (up to 4%)
without segregation or loss of workability (Adhikari, 2013).
Figure 3.4: Basalt fibers
Type Specific Gravity
(g/cm³)
Length
(mm)
Diameter
(mm) Aspect Ratio
Basalt Fiber 1.9 43 0.66 65.15
Steel Fiber 7.85 60 0.92 65
Polypropylene Fiber 0.92 51 0.68 74

31
3.5.2 Hooked-end steel fibers
The hooked-end steel fibers used in this study consisted of low carbon cold-drawn steel
wire. The tensile strength of steel fibers was about 1100 MPa with a modulus of elasticity of 210
GPa as reported by the manufacturer. They are 60 mm long (𝑙𝑓) and 0.92 mm in diameter (𝑑𝑓)
with an aspect ratio (𝑙𝑓/𝑑𝑓) of 65. Figure 3.5 shows the shape of steel fibers used.
Figure 3.5: Steel fibers
3.5.3 Polypropylene fibers
The polypropylene macro synthetic fibers in Figure 3.6 were used in this study. The fibers
comply with ASTM-C1116 provisions. According to the manufacturer, polypropylene fibers are
51 mm long (𝑙𝑓) and 0.68 mm in diameter (𝑑𝑓) with an aspect ratio (𝑙𝑓/𝑑𝑓) of 74. The tensile
strength of polypropylene fibers ranged between 600 and 650 MPa with a modulus of elasticity of
9.5 GPa.

32
Figure 3.6: Polypropylene fibers
3.6 Specimens preparation
Figure 3.7 shows the different stages of preparing and fabricating of the beam specimens. All
form works were prepared in the Structures Laboratory at Laval University. First, the cages were
fabricated as per the test matrix shown in Table 3.1. The wooden forms were then oiled, and the
cages were installed.
Mixing of concrete was accomplished according to the standard practice in ASTM-C192. First,
fine and coarse aggregates were mixed for one minute with one-third of the quantity of water
required. Then, the cement, fly ash, and the remaining quantity of water were added and mixed for
two minutes. The fibers were then added, and mixing continued for two or three minutes to ensure
the uniform distribution of the fibers in concrete. Then, the mixer was stopped for two minutes
and covered with plastic sheet to prevent water evaporation. Finally, mixing started for one more
minute before casting took place as shown in Figure 3.7. After casting, the concrete surface was
finished using flat steel trowels.
All specimens were cured according to the standard practice provided in ASTM-C192.
After finishing, beams were overlaid by wet burlap to prevent excessive evaporation of water. The
cast beams were kept in their wooden forms for 48 hours. After dismantling the forms, the beams
were cured for 28 days in the lab environment. All beams were painted after curing to be ready for
testing as shown in Figure 3.8 to facilitate the visual observation of cracks during testing.

33
Figure 3.7: Fabrication of the beam specimens: (a) cage fabrication, (b) placing cages in
wooden forms, (c) adding fibers to concrete, (d) concrete casting, (e) concrete finishing, and (f)
curing of the test specimens
(e) (f)
(c) (d)
(a) (b)

34
Figure 3.8: Painted beam specimen
3.7 Instrumentation of the test specimens
All beams were instrumented with 5 and 60 mm long strain gauges installed at midspan on
the BFRP bars and the top surface of concrete, respectively, as shown in Figure 3.9 and Figure
3.10.
Figure 3.9: Strain gauge installation on BFRP bars: (a) rubbing the bars’ surface and (b) adhering
strain gauges
(a) b) (b)

35
Figure 3.10: Concrete strain gauge installed
3.8 Test setup
All specimens were tested in shear under four-point load configuration with a clear span of
2100 mm. The load was applied using a hydraulic jack at two locations spaced 600 mm as shown
in Figure 3.12. Epoxy was used below the loading plates and between the supports and the bottom
of the specimens to balance the specimen during the test.
A linear variable differential transducer (LVDT) was placed under the point load to measure
deflections during testing as shown in Figure 3.11. Two inclined LVDTs making 45 with the
vertical were installed prior to testing at 150 and 300 mm apart from the point load in the shear
span where shear failure was expected as illustrated in Figure 3.12. The entire test was carried out
under displacement control at a rate of 1 mm/min. Data from strain gauges and LVDTs were
recorded using a 30-channel data acquisition system at a rate of 5 readings/second.

36
Figure 3.11: LVDT locations
Figure 3.12: Schematic drawing for inclined LVDTs (all dimensions are in mm)

37
Chapter 4: Experimental Results
4.1 Introduction
This chapter presents and analyzes the outcome of the test results. The effect of fibers on
the mechanical properties of lightweight concrete is firstly presented followed by the results of the
four-point flexural tests conducted on the beams. Comparison between different beams in terms of
failure modes, load-deflection relationships, shear capacities, and strains in longitudinal BFRP
bars and concrete are discussed.
4.2 Material properties
In this section, the effect of fibers on the physical and mechanical properties of fresh and
hard lightweight concrete is presented. As explained in Chapter 3, slump tests were carried out
according to ASTM C143 to determine the workability of the concrete mix. Standard concrete
cylinders (100×200 mm) were cast and tested to determine the compressive and splitting strengths
of concrete according to ASTM C39 and ASTM C496, respectively. Cylinders were subjected to
the same curing conditions as for the tested beams, then kept in room temperature until testing.
For each test, the effect of different volume fractions of fibers, 𝑣𝑓 , on the mechanical properties
of concrete is emphasized.
4.2.1 Fresh concrete properties
Slump test results are given in Table 4.1. Figure 4.1(a) and 4.1(b) show slump values for
both basalt lightweight concrete (BLWC) and polypropylene lightweight concrete (PLWC),
respectively. Slump of steel lightweight concrete (SLWC) are not available.

38
Table 4.1: Slump test results
*Slump limits according to ASTM C143 guidelines
Figure 4.1: Slump test results of (a) BLWC and (b) PLWC mixes
4.2.2 Hardened concrete properties
4.2.2.1 Compressive strength
Compression tests were conducted with accordance to ASTM-C469 provisions. Three
concrete cylinders were cast for each concrete batch and cured for 28 days. Prior to testing, the top
surface of cylinders was leveled to eliminate irregularities. The average compression strength, 𝑓′𝑐,
for each concrete batch is given in Table 4.2 and Figure 4.2.
Sample Concrete with fibers Limit (mm)*
C-10 N/A 15-230
C-12 N/A 15-230
B-0.5-10 79 15-230
B-0.5-12 N/A 15-230
S-0.5-12 65 15-230
P-0.5-12 120 15-230
B-1.0-10 55 15-230
B-1.0-12 76 15-230
S-1.0-12 80 15-230
P-1.0-12 75 15-230

39
4.2.2.2 Splitting tensile strength
Splitting tensile tests were performed according to ASTM C496 provisions. Similar to
compression strength tests, three standard concrete cylinders were cast and cured for 28 days
before testing. The obtained values of the splitting tensile strength, 𝑓𝑠𝑝, are given in Table 4.2.
Table 4.2: Compressive strength 𝑓′𝑐 and splitting tensile strength 𝑓𝑠𝑝
Concrete mix Compressive strength
(MPa)
Splitting tensile strength
(MPa)
Control 49.66 3.49
B-0.5% 52.97 3.69
B-1.0% 51.54 3.62
S-0.5% N/A 5.20
S-1.0% 53.58 5.45
P-0.5% 50.71 3.93
P-1.0% 49.83 3.89
Figure 4.2 and Figure 4.3 show the effect of different volume fractions of fibers on the
compressive and tensile strengths of concrete, respectively. It can be observed that the addition of
fibers slightly affected the mechanical properties of concrete. An enhancement in the compressive
strength ranged between 0 and 8% after the addition of fibers.
However, an enhancement of 13 and 56% in the tensile strength of concrete was
encountered by adding 0.5% of polypropylene fibers and 1% steel fibers to the concrete mix,
respectively. These values were previously confirmed by (Zinkaah, 2014) who reported a decrease
in the compression strength of steel fibers reinforced concrete (SFRC) and attributed this decrease
to many factors such as the voids created by steel fibers, the disperse orientation of the fibers, and
the lack of compaction of concrete when the fibers were added.

40
Figure 4.2: Compressive strength of concrete mixes
Figure 4.3: Splitting tensile strength of concrete mixes
4.3 Beam test results
This section provides a summary of the overall behavior of the tested beams. Table 4.3
compares the experimental results of the tested specimens in terms of shear capacity, ultimate
deflection, angle of shear failure, and ultimate strains recorded in the BFRP bars and concrete.
49.6652.97 51.54
53.5850.71 49.83
0
10
20
30
40
50
60
Control B-0.5% B-1.0% S-1.0% P-0.5% P-1.0%
Co
mp
ressiv
e S
tren
gth
(M
Pa)
3.493.69 3.62
5.205.45
3.93 3.89
0
1
2
3
4
5
6
Control B-0.5% B-1.0% S-0.5% S-1.0% P-0.5% P-1.0%
Sp
litt
ing
ten
sile S
tren
gth
(M
Pa)

41
During the tests, it was observed that vertical flexural cracks developed in the moment zone at
loads ranging between 15 and 20 kN for LWC whereas the cracking load of NWC was higher
compared to LWC that ranged from 20.6 kN to 27.5 kN. As the applied loads increased, cracks
propagated toward the compression zone and new cracks formed in the shear spans. Further
increase in the applied loads widened the shear cracks in the shear spans without stirrups. Large
increase in deflections was observed until sudden and abrupt diagonal tension shear failure
occurred. None of the beams failed in the shear spans where stirrups were installed.
Table 4.3 presents the test results of the current beams that were cast in lightweight concrete
(LWC) in addition to two beams cast in normal weight concrete (NWC) and tested previously by
(El Refai and Abed 2015), as previously mentioned in Chapter 3. Table 4.3 gives the test results
in terms of maximum deflection, maximum applied load, strain in bars and concrete, mode of
failure, and angles of failure.
Table 4.3: Test results
Measured strains
ε*10−6
Specimens 𝑃𝑢(kN) Δ𝑚𝑎𝑥 (mm)**
Max crack
width***
(mm)
BFRP
bars Concrete
𝑉𝑐 (kN)
Angle of
shear
failure,
degrees
CL-10 44.5 11.3 0.96 5480 N/A 22.2 40
CL-12 61 10.8 0.80 5200 -1243 30.4 45
CN-10* 56 13**** - 5600 -1800 28 25
CN-12* 60 10.8**** - 5400 -1900 30 32
B-0.5-10 53 10.7 0.61 7100 -1337 26.6 20
B-0.5-12 63 12.6 1.20 6020 -1654 31.6 25
S-0.5-12 78 16.1 1.76 8490 -2193 39 25
P-0.5-12 67 16.4 4.20 5980 -1381 33.5 30
B-1.0-10 68 19 5.59 8730 -1290 33.8 55
B-1.0-12 67.5 13.7 1.72 6090 -1467 33.8 30
S-1.0-12 99 19.6 2.39 10070 -2063 49.6 20
P-1.0-12 70.5 16.4 3.99 N/A -1430 35.2 35 *Data adopted from (El Refai et al. 2015) **Deflection at ultimate under point load. ***Max crack at ultimate.
****Deflection at ultimate in midspan.

42
4.3.1 Mode of failure and crack pattern
Diagonal tension failure was the dominant mode of failure of all the tested beams as can
be depicted from Figure 4.4. All beams failed in shear span where no stirrups were installed.
It was observed that all beams cast in plain concrete failed in a brittle manner, as a sudden
load drop occurred, upon reaching their ultimate shear capacity. However, the presence of fibers
led to a more ductile failure compared to their plain concrete counterparts. This was evident from
the crack patterns of fiber-reinforced concrete beams in which an increased number of cracks with
small widths was observed. This observation was in good agreement with the previous study
conducted by (Juárez et al. 2007) who reported that the increase of volume fractions of fibers
increase the number of cracks and the addition of fibers showed a higher ductility of beam when
compared to the beams without fibers.
It can be observed that adding 0.5% of fibers slightly enhanced the behavior of the beams
leading to an increased number of flexural cracks than those observed in the control beams. For
instance, beam S-0.5-12 showed higher numbers of flexural cracks than other beams having same
dosage of fibers (P-0.5-12 and B-0.5-12).
For beams cast with fiber-reinforced concrete, it was observed that the rate of crack
opening was delayed, and failure occurred in a more ductile manner than that compared in the
control beams. This was attributed to the bridging mechanism of the randomly oriented fibers,
which resisted the diagonal cracking and improved the toughness of the beams.
Increasing the fiber dosage delayed the failure of the beam by resisting the formation of
shear cracks. Moreover, the geometry of fibers played an important role in increasing the number
of flexural cracks and changed the behavior of beams at failure from brittle to a more ductile failure
due to the different bond mechanisms of the different types of fibers. This can be depicted from
the high shear capacity of beams cast with steel fibers as will be explained in the following
sections. Moreover, higher reinforcement ratio resulted in higher shear capacities than those of
beams with lower reinforcement ratios, as will be detailed later.

43
The inclination of shear cracks at failure of all beams are given in Table 4.3. It can be
noticed that all beams cast with fiber-reinforced concrete showed less inclined shear cracks than
those encountered in the control beams CL-10 and CL-12 (except beam B-1.0-10 that showed an
inclined crack at 55o). The angles of inclination of the shear cracks ranged between 20 and 35o
(compared to 40 and 45o for beams CL-10 and CL-12) and similar to those of the control beams
CN-10 and CN-12 as shown in Figure 4.5. This finding indicated the effect of fibers in resisting
the shear stresses in the LWC beams. It is important to note that the discrepancy in the degree of
inclination of the shear cracks could be attributed to the random distribution and orientation of
fibers in concrete during mixing.
Figure 4.4: Crack patterns of LWC beams at failure
(a) Beam CL-10 (b) Beam CL-12
(c) Beam B-0.5-10 (d) Beam B-0.5-12
(e) Beam B-1.0-10 (f) Beam B-1.0-12
(g) Beam S-0.5-12 (h) Beam S-1.0-12
(i) Beam P-0.5-12 (j) Beam P-1.0-12

44
Figure 4.5: Crack pattern of NWC beams at failure (from El Refai et al. 2015)

45
4.3.2 Shear strength
4.3.2.1 Effect of type of concrete on the shear strength
As shown in Table 4.3, beams cast with NWC showed higher shear capacities than their
LWC counterparts. Beams CN-10 and CL-10 showed capacities of 28 and 22.2 KN, respectively,
which represented a decrease of 25% in beam CL-10, which was attributed to the low shear
resistance of the lightweight aggregates in beam CL-10. Note that both beams had the same
compressive strength of concrete. On the other hand, beams CN-12 and CL-12 showed almost the
same shear capacities of 30 KN. This was explained by the fact that the high reinforcement ratio
used in both beams offset the low shear strength of light weight aggregates in the latter beam.
4.3.2.2 Effect of longitudinal reinforcement ratio on the shear strength
Figure 4.6 shows the shear capacities of beams having different reinforcement ratios. It
was noticed that the maximum shear capacities increased with the increase of reinforcement ratio
in all control beams. The shear capacity of beam CL-12 increased by 37% as the reinforcement
ratio increased from 0.95 to 1.37% while that of beam CN-12 increased by only 7% as compared
to that of beam CN-10. This finding indicated that the dowel action of the BFRP bars was more
pronounced in LWC beams than their NWC counterparts.
On the other hand, beam B-0.5-12 of group B (with 0.5% of basalt fibers added) showed a
shear capacity 16% more than that of beam B-0.5-10 of the same group. However, beam B-1.0-12
of group C (with 1% of basalt fibers added) showed almost the same capacity of beam B-1.0-10.
This finding indicated the contribution of the fibers added to the shear capacity of the beams as
will be detailed later. It also indicated that the effect of longitudinal reinforcement ratio on the
shear capacity of the beams was offset by the addition of 1% basalt fibers.
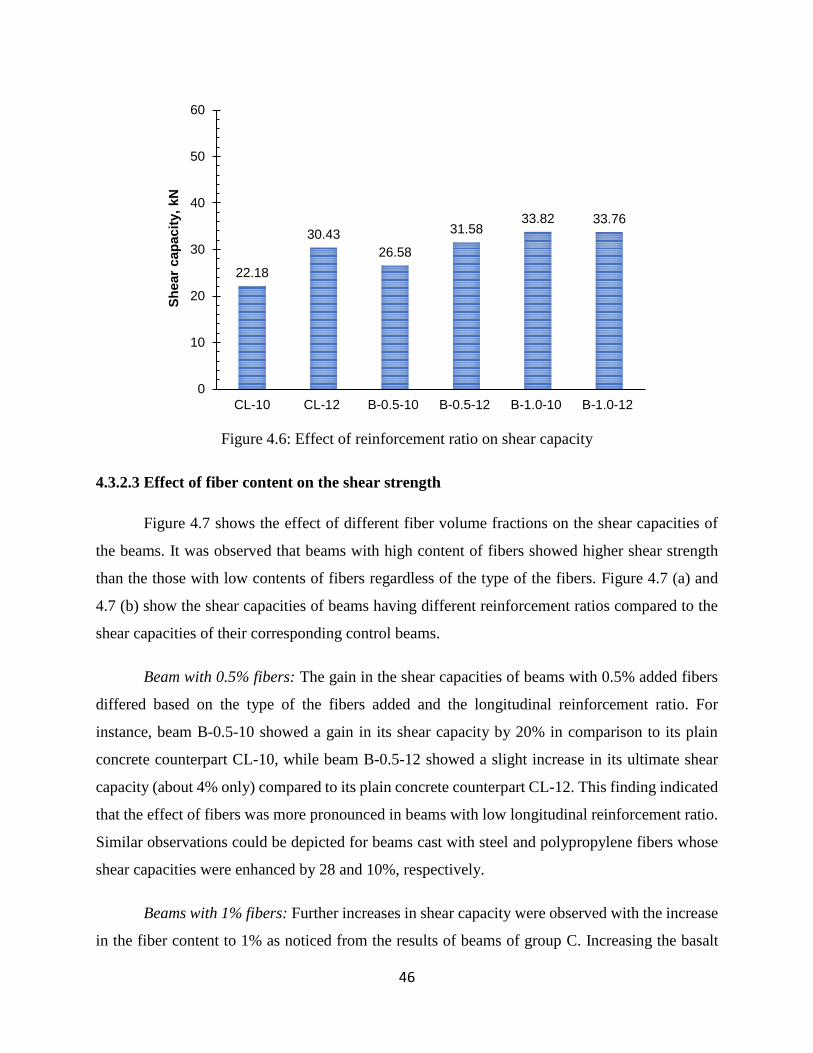
46
Figure 4.6: Effect of reinforcement ratio on shear capacity
4.3.2.3 Effect of fiber content on the shear strength
Figure 4.7 shows the effect of different fiber volume fractions on the shear capacities of
the beams. It was observed that beams with high content of fibers showed higher shear strength
than the those with low contents of fibers regardless of the type of the fibers. Figure 4.7 (a) and
4.7 (b) show the shear capacities of beams having different reinforcement ratios compared to the
shear capacities of their corresponding control beams.
Beam with 0.5% fibers: The gain in the shear capacities of beams with 0.5% added fibers
differed based on the type of the fibers added and the longitudinal reinforcement ratio. For
instance, beam B-0.5-10 showed a gain in its shear capacity by 20% in comparison to its plain
concrete counterpart CL-10, while beam B-0.5-12 showed a slight increase in its ultimate shear
capacity (about 4% only) compared to its plain concrete counterpart CL-12. This finding indicated
that the effect of fibers was more pronounced in beams with low longitudinal reinforcement ratio.
Similar observations could be depicted for beams cast with steel and polypropylene fibers whose
shear capacities were enhanced by 28 and 10%, respectively.
Beams with 1% fibers: Further increases in shear capacity were observed with the increase
in the fiber content to 1% as noticed from the results of beams of group C. Increasing the basalt
22.18
30.43
26.58
31.5833.82 33.76
0
10
20
30
40
50
60
CL-10 CL-12 B-0.5-10 B-0.5-12 B-1.0-10 B-1.0-12
Sh
ear
cap
acit
y,
kN

47
fiber volume fraction from 0.5 to 1% in beams B-1.0-10 and B-1.0-12 enhanced their shear
capacities by 27 and 7%, respectively. The highest gain in shear capacity was encountered in beam
S-1.0-12 that showed a gain in its shear capacity by more than 27% with respect to its counterpart
S-0.5-12. On the other hand, the increase of the volume fraction of polypropylene fibers from 0.5
to 1% resulted in a gain in the shear capacity of 5%.
a)
22.18
26.58
33.82
0
10
20
30
40
50
60
CL-10 B-0.5-10 B-1.0-10
Sh
ear
cap
acit
y,
kN
30.43 31.5833.76
38.98
49.59
33.4635.23
0
10
20
30
40
50
60
CL
-12
B-0
.5-1
2
B-1
.0-1
2
S-0
.5-1
2
S-1
.0-1
2
P-0
.5-1
2
P-1
.0-1
2
Sh
ear
cap
acit
y,
kN

48
b)
Figure 4.7: Effect of fiber content on the shear capacities of beams with different longitudinal
reinforcement ratios
4.3.2.4 Effect of the fiber type on the shear strength
As briefly explained in the previous sections, it was observed that the type of fibers
significantly affected the gain in the shear capacities of the beams. This finding can be attributed
to the different physical and mechanical properties of the fibers used such as aspect ratios, lengths,
geometries, and densities of the fibers in addition to their bonding mechanism to the surrounding
concrete.
Beams with 0.5%: Figure 4.8 (a) showed the shear capacities of beams of group B of having
the same longitudinal reinforcement ratio (1.37%) and the same fiber content (0.5%) but cast with
different types of fibers. It can be observed that beams cast with steel fibers exhibited higher shear
capacities than those cast with basalt and polypropylene fibers by 23 and 16%, respectively, which
was attributed to the superior properties of steel fibers and its high density that lead to bridge cracks
and increase the resistance of beams. B-0.5-12 had an ultimate shear strength of 31.6 kN while
those of beams P-0.5-12 and S-0.5-12 were 33.5 kN and 39 kN, respectively. Interestingly, beams
with polypropylene and basalt fibers (beams P-0.5-12 and B-0.5-12) exhibited almost similar shear
strength with a slight decrease of 6% in the former beam, B-0.5-12. Compared to the control beam
CL-12, both beams exhibited an insignificant gain in their shear capacities, which indicated the
slight effect of adding 0.5% of basalt and polypropylene fibers on the shear capacities of LWC
beams.
Beams with 1% fibers: Similar behavior was encountered in beams of group C having the
same longitudinal reinforcement ratio (1.37%) and the same fiber content (1%), as shown in Figure
4.8 (b). Beam S-1.0-12 with 1% steel fibers showed the highest shear capacity of 49.6 kN
compared to beams B-1.0-12 and P-1.0-12 that showed capacities of 33.8 kN and 35.2 kN,
respectively. The gain in shear strength in beam S-1.0-12 was 47 and 41% with respect to beams
B-1.0-12 and P-1.0-12, respectively. Beams B-1.0-12 and P-1.0-12 showed gain of 11 and 16%
compared to their control beam CL-12.

49
a)
b)
Figure 4.8: Effect of the type of fibers on the shear capacity of beams of (a) group B and (b)
group C
30.43 31.5833.46
38.98
0
10
20
30
40
50
60
CL-12 B-0.5-12 P-0.5-12 S-0.5-12
Sh
ear
cap
acit
y,
kN
30.43
33.7635.23
49.59
0
10
20
30
40
50
60
CL-12 B-1.0-12 P-1.0-12 S-1.0-12
Sh
ear
cap
acit
y,
kN

50
4.3.3 Crack width
Crack widths were measured in all of the tested beams using inclined LVDTs as explained
in Chapter 3. Table 4.4 shows the associated results of the crack width of the beams at 30 and 50%
of the ultimate load obtained from the experimental tests at 300 mm spacing from point loads.
Table 4.4: Crack width of beams
Specimens 30% 𝑃𝑢(𝑘𝑁) Crack width
(mm) 50% 𝑃𝑢(𝑘𝑁)
Crack width
(mm)
Group A: Control beams
CL-10 13.305 0.035 22.17 0.159
CL-12 18.261 0.025 30.43 0.185
Group B: Beams with volume fraction of fibers = 0.5%
B-0.5-10 15.945 0.035 26.58 0.077
B-0.5-12 18.945 0.025 31.58 0.077
S-0.5-12 23.385 0.038 38.98 0.159
P-0.5-12 20.076 0.038 33.46 0.160
Group C: Beams with volume fraction of fibers = 1.0%
B-1.0-10 20.289 0.005 33.82 0.049
B-1.0-12 20.256 0 33.76 0.084
S-1.0-12 29.736 0.057 49.56 0.185
P-1.0-12 21.135 0.007 35.22 0.092
4.3.3.1 Effect of reinforcement ratio on crack width
Figure 4.9 shows the variation of crack widths with the applied loads of beams with
different reinforcement ratios. Beam CL-12 showed smaller crack widths than beam CL-10. For
instance, beam CL-12 recorded value of 0.08 at 50% of the ultimate load, which was about 42%
smaller than that of its counterpart CL-10.
Similarly, the increase of reinforcement ratio decreased the widths of cracks observed
during testing. This finding was valid for beams cast with BLWC regardless of the percentage of
fibers added.

51
Figure 4.9: Effect of reinforcement ratio on crack width
4.3.3.2 Effect of fiber content on crack width
Figure 4.9 and Figure 4.10 showed the effect of fiber content on the crack widths observed
during testing. It was noted that the increase of fiber content decreased the crack opening. Beam
B-1.0-10 showed a 60% reduction in crack width at 50% of the ultimate load than beam B-0.5-10.
Similar observations were found in beams S-0.5-12 and S-1.0-12 which showed a decrease
in crack width with the increase of fiber content by about 42% (from 0.14 to 0.1 mm, respectively)
at 50% of the ultimate load. Also, beams P-0.5-12 and P-1.0-12 showed a decrease in crack width
from 0.16 to 0.092 mm, respectively, with the increase of fibers content at 50% of their ultimate
load. On the other hand, beam B-1.0-12 showed smaller crack widths than beam B-0.5-12.
0
20
40
60
80
0 0.1 0.2 0.3 0.4 0.5 0.6 0.7
% o
f lo
ad
Crack width, mm
B-0.5-10
B-0.5-12
B-1.0-10
B-1.0-12
CL-12
CL-10

52
Figure 4.10: Effect of fiber content on crack width
4.3.3.3 Effect of fiber type on crack width
Figure 4.11 showed the effect of fiber type on the cracks widths. It can be noticed that steel
fibers had the most influence on reducing the crack widths followed by the basalt and the propylene
fibers. This can be depicted from the variation of the crack widths of the tested beams S-0.5-12,
B-0.5-12, and P-0.5-12 in Figure 4.11 (a). Similar trends were observed by comparing the test
results of beams S-1.0-12, B-1.0-12, and P-1.0-12. It can be noticed that beam S-1.0-12 showed
the smaller crack widths than the other two beams.
The higher effect of steel fibers on reducing the crack widths of the beams was attributed to
the excellent properties of steel fibers in terms of high modulus, its yielding capacity, and the
physical properties of the fibers (such as the existence of end-hooks, which increase the bonding
mechanism between the fiber and the paste). Polypropylene fibers showed the weakest behavior
due the weak bond between concrete and fibers matrix that resulted in pullout of fibers from the
surrounding concrete in addition to their low modulus.
0
20
40
60
80
0 0.1 0.2 0.3 0.4 0.5 0.6 0.7
% o
f lo
ad
Crack width, mm
B-1.0-12
B-0.5-12
S-1.0-12
S-0.5-12
P-0.5-12
P-1.0-12

53
The basalt fibers showed an intermediate behavior between the steel and polypropylene
fibers. This was observed from the recorded crack widths during testing, with the results being
closer to those of polypropylene fibers especially at 0.5% volume fraction.
a)
b)
Figure 4.11: Effect of fiber type on crack width
0
20
40
60
80
0 0.1 0.2 0.3 0.4 0.5 0.6 0.7
% o
f lo
ad
Crack width, mm
B-0.5-12
S-0.5-12
P-0.5-12
0
20
40
60
80
0 0.1 0.2 0.3 0.4 0.5 0.6 0.7
% o
f lo
ad
Crack width, mm
S-1.0-12
P-1.0-12
B-1.0-12

54
4.3.4 Load-deflection curves
Figure 4.12 shows the relationships between the applied loads and the point loads
deflections of the tested beams. Table 4.5 shows the associated results obtained from the
experimental tests. All beams exhibited a linear response until reaching their cracking load
regardless of their reinforcement ratio and concrete type. After cracking, all specimens showed a
significant loss of stiffness accompanied by a considerable increase in their point loads deflections.
The decreased stiffness varied from one beam to another depending on the reinforcement ratio and
the amount of fibers added. In the following sections, the effect of each parameter on the load-
deflection relationships of the tested beams is discussed.
Figure 4.12: Load-deflection curves for beams
0
20
40
60
80
100
0 4 8 12 16 20
Lo
ad
, kN
Point load displacement, mm
CL-10CL-12B-0.5-10B-0.5-12B-1.0-10B-1.0-12P-0.5-12P-1.0-12S-0.5-12S-1.0-12

55
Table 4.5: Load deflection results
Specimens 50% 𝑃𝑢(𝑘𝑁) Δ (mm) 80% 𝑃𝑢(𝑘𝑁) Δ (mm) 𝑃𝑢(𝑘𝑁) Δ (mm)
Group A: Control beams
CL-10 22.17 3.12 35.48 7.97 44.35 11.27
CL-12 30.43 4.12 48.69 8.13 60.87 10.82
Group B: Beams with volume fraction of fibers = 0.5%
B-0.5-10 26.58 3.85 42.52 7.73 53.15 10.70
B-0.5-12 31.58 4.72 50.52 9.25 63.15 12.56
S-0.5-12 38.98 6.14 62.36 10.97 77.95 16.09
P-0.5-12 33.46 5.11 53.54 10.32 66.92 16.36
Group C: Beams with volume fraction of fibers = 1.0%
B-1.0-10 33.82 6.35 54.11 11.83 67.63 19.00
B-1.0-12 33.76 4.99 54.02 9.68 67.52 13.67
S-1.0-12 49.56 7.85 79.30 13.48 99.12 19.58
P-1.0-12 35.22 4.88 56.36 9.60 70.45 16.36

56
4.3.4.1 Effect of type of concrete on load-deflection curve
Figure 4.13 shows the load-deflection relationships of the control beams. As can be
noticed, beams cast with NWC (beams CN-10 and CN-12) showed similar stiffness at almost all
stages of loading while beams cast with LWC (beams CL-10 and CL-12) had distinct stiffness at
all stages. This finding indicated that the reinforcement ratio has a more pronounced effect on the
stiffness of the LWC beams than in NWC beams, which could be attributed to the high mechanical
properties of the NWC.
Figure 4.13: Load-deflection curve NWC vs LWC
4.3.4.2 Effect of reinforcement ratio on the load-deflection curves
Figure 4.14 compares the load-deflection response of beams with different reinforcement
ratios. It can be observed that the reinforcement ratio governed the under-point loads deflection of
the beams in the post-cracking phase.
As expected, increasing the reinforcement ratio resulted in higher stiffness and decreased its
deflection at all stages of loading. For instance, specimen CL-10 had a midspan deflection of 3.12
mm compared to 4.12 mm for beam CL-12 at 50% of their ultimate load. Moreover, increasing
the reinforcement ratio from 0.95 to 1.37% resulted a slight increase in its stiffness at all stages of
0
20
40
60
80
100
0 4 8 12 16 20
Lo
ad
, kN
Displacement, mm
CL-12
CN-12
CL-10
CN-10

57
loading as can be depicted from Figure 4.14. Figure 4.14 also shows the load deflection
relationships of beams B-0.5-10 and B-0.5-12. It can be noticed that B-0.5-12 showed a slightly
higher post-cracking stiffness and higher ultimate deflection and capacity than its counterpart.
Similarly, the increase of reinforcement ratio from 0.95 to 1.37% in beam B-1.0-12 resulted in an
increase in stiffness by 39% than that of beam B-1.0-10.
Figure 4.14: Effect of reinforcement ratio on load-deflection curve
4.3.4.3 Effect of fiber content on the load-deflection behavior
Figure 4.15 showed the effect of fiber content on the load deflection behavior of the tested
beams. It can be observed that increasing the fiber dosage from 0.5 to 1.0% in beams B-0.5-10 and
B-1.0-10 increased the ultimate deflection with no significant effect on the beams’ stiffness as
shown in Figure 4.14. This effect was less pronounced in beams with higher reinforcement ratio
(beams B-0.5-12 and B-1.0-12), particularly when basalt and polypropylene fibers were used.
Similar findings were reported in Ababneh et al. (2017).
0
20
40
60
80
100
0 4 8 12 16 20
Lo
ad
, kN
Point load displacement, mm
CL-10
CL-12
B-0.5-10
B-0.5-12
B-1.0-10
B-1.0-12

58
Figure 4.15: Effect of fiber dosage on load deflection curve
4.3.4.4 Effect of fiber type on the load deflection behavior
Figure 4.16 (a) and Figure 4.16 (b) present the effect of fiber type on the load deflection
behavior. The type of fiber had a slight effect on the pre-cracking behavior of the tested beams and
most of the serviceability stages as can be depicted in Figure 4.16. However, the effect of type of
fiber was obvious as the beam approached its ultimate. The addition of steel fibers caused the
highest shear strength at volume fractions of 0.5 and 1% while the addition of 0.5 and 1% of basalt
fibers showed the lowest ultimate strength. This could be attributed to the geometry of fibers and
the presence of the hooked ends in steel fibers that seemed to be effective in bridging the shear
cracks and increasing the toughness of beams.
0
20
40
60
80
100
0 4 8 12 16 20
Lo
ad
, kN
Point load displacement, mm
S-0.5-12
S-1.0-12
P-0.5-12
P-1.0-12
B-0.5-12
B-1.0-12

59
a)
b)
Figure 4.16: a and b: Effect of fiber type on load deflection curve
0
20
40
60
80
100
0 4 8 12 16 20
Lo
ad
, kN
Point load displacement, mm
B-0.5-12
S-0.5-12
P-0.5-12
0
20
40
60
80
100
0 4 8 12 16 20
Lo
ad
, kN
Point load displacement, mm
B-1.0-12
P-1.0-12
S-1.0-12

60
4.3.5 Load strain response
Figure 4.17 shows the strain response of the BFRP bars and concrete in the tested beams
at midspan. The strain strain-response of beams CL-12 and P-1.0-12 were not recorded due to
malfunction of the gauges. As previously mentioned, all of the tested beams failed under shear
stresses with no signs of flexure failure. This finding was confirmed by the strains recorded for
concrete and BFRP bars.
Similar to the load-deflection curves, the strain-response of BFRP bars was divided into
two stages namely, the pre-cracking and post-cracking stages. In the pre-cracking stage, all the
tested beams behaved similarly with the strain in the BFRP bars increasing linearly with the
applied load. In addition, the BFRP bars response was negligible in the first phase. After crack
initiation, strains in the bars increased as the applied load increased until failure occurred.
As can be seen in Figure 4.17 (a), beam CL-10 showed higher strains in the BFRP bars
than beam CL-12. At ultimate, beams CL-10 and CL-12 exhibited strains of 5480 and 5210 µε,
respectively, which indicated that no failure had occurred in the BFRP bars. The addition of 0.5%
basalt fibers had a more pronounced effect on the ultimate strength of beam B-0.5-10 (with low
reinforcement ratio) than on the ultimate strength of beam B-0.5-12 (with high reinforcement
ratio). This finding can be depicted from the load-strain relationships shown in Figure 4.17 (a).
similar observations can be depicted from Figure 4.17 (b) for beams with 1% of basalt fibers added.

61
a)
b)
Figure 4.17 (a) and (b): Strain gauge of beams with different longitudinal reinforcement
0
20
40
60
80
100
-3000 0 3000 6000 9000 12000
Lo
ad
, kN
Strain µε
B-0.5-10
B-0.5-12
CL-12
CL-10
Concrete Bar
0
20
40
60
80
100
-3000 0 3000 6000 9000 12000
Lo
ad
, k
N
Strain µε
B-1.0-12
B-1.0-10
CL-10
CL-12
Concrete Bar

62
Figure 4.18 shows the load strain relationships of beams cast with 0.5% fibers. It can be
noticed that the type of fibers had a slight effect on the strains recorded in the bars. However, steel
fibers increased the strains in the BFRP bars at ultimate more than basalt and polypropylene fibers.
Beam S-0.5-12 recorded 8490 µε in the BFRP bars at ultimate, which was 63% higher than the
strains recorded in its counterpart CL-12 whereas beam B-0.5-12 and P-0.5-12 recorded 6020 µε
and 5980 µε, respectively, which were higher than their counterpart CL-12 by 16 and 15%,
respectively. A similar response could be depicted in strains recorded in concrete as can be shown
in Figure 4.18.
Figure 4.18: Strain gauge of beams with the 0.5% volume fraction
Beams having 1% of fibers showed a similar trend as seen in Figure 4.19. The recorded
strains in beam B-1.0-10 were 46% higher at ultimate than those recorded in its counterpart B-0.5-
10. Increasing the reinforcement ratio offset the effect of fibers on the recorded strains. B-1.0-12
showed a slight increase in its strain response as compared to beam B-0.5-12. Beam S-1.0-12
showed 19% higher strains with the increase of the fiber content from 0.5 to 1% than beam S-0.5-
12. Strains in beam P-1.0-12 were not recorded as previously mentioned due to the malfunction of
gauges.
0
20
40
60
80
100
-3000 0 3000 6000 9000 12000
Lo
ad
,K
N
Strain µε
B-0.5-12
P-0.5-12
S-0.5-12
Concrete Bar

63
Figure 4.19: Strain gauge of beams with the 1.0% volume fraction
0
20
40
60
80
100
-3000 0 3000 6000 9000 12000
Lo
ad
, K
N
Strain µε
S-1.0-12
P-1.0-12
B-1.0-12
Concrete Bar

64
Chapter 5: Analytical Predictions
5.1 Introduction
This chapter includes comparisons between the experimental shear capacities of the tested
beams and the predicted capacities following the provisions of different codes and models. The
experimental shear capacities of the FRP-reinforced beams cast in lightweight concrete (control
beams: with no fibers) were compared to the capacities predicted by the equations provided by
ACI-440.1R-15, CAN/CSA-S6-10, CAN/CSA-S806-12, and JSCE-97 codes, which were initially
developed for FRP-reinforced elements cast with NWC.
The experimental shear capacities of the tested beams cast with fiber-reinforced
lightweight concrete (FRLWC) were also compared to those predicted using previous models
developed for fiber-reinforced normal weight concrete (FRNWC). The objective of this
comparison was to assess the applicability of these models to beams cast with FRLWC. Details of
these models were previously explained in Chapter 2. Mean, standard deviation, and coefficient of
variance has been calculated for each beam and listed in Table 5.2.
5.2 Shear strength of BFRP-reinforced LWC beams with no fibers
Table 5.1 compares between the experimental shear strength, 𝑉𝑒𝑥𝑝, and the corresponding
prediction values, 𝑉𝑝𝑟𝑒𝑑, according to ACI-440.1R-15, CAN/CSA-S806-12, CAN/CSA-S6-14,
and JSCE-97. It should be noted that these equations were developed based on previous tests data
conducted on elements reinforced with GFRP, CFRP, and AFRP bars and not with BFRP bars.
Table 5.1 also includes the results of a previous study of Kim and Jang (2013) that was conducted
on concrete beams cast with LWC (with no fibers added) but reinforced with GFRP and CFRP
bars. In this study, two different compressive strengths (18 and 27 MPa) of LWC were used. The
ratios of experimental-to-predicted shear strength capacities are listed in Table 5.1: Comparison
of test result values and predicted shear capacity values and shown in Figure 5.1.

65
Table 5.1: Comparison of test result values and predicted shear capacity values
* Concrete beams cast with LWC (with no fibers added) but reinforced with GFRP and CFRP bars.
JSCE-97 CSA-S6-14 ACI-440-15 CSA-S806-12
Reference Beam Vexp
(kN)
Vpred
(kN) Vpred /Vexp
Vpred
(kN) Vpred /Vexp
Vpred
(kN) Vpred /Vexp
Vpred
(kN) Vpred /Vexp
Present Study CL-10 22.2 16.1 0.73 31.4 1.42 10.9 0.49 19.5 0.88
CL-12 30.4 18.2 0.60 31.4 1.03 12.8 0.42 21.8 0.72
Kim and Jang (2013) *
C-L-18-R1-1 25.8 15.5 0.60 24.7 0.96 10.8 0.42 16.0 0.62
C-L-18-R2-1 17.5 12.8 0.73 18.5 1.06 9.2 0.53 13.1 0.75
C-L-27-R1-1 24.4 17.7 0.73 30.2 1.24 12.1 0.50 18.3 0.75
C-L-27-R2-1 20.7 14.6 0.71 22.7 1.10 10.3 0.50 15.0 0.72
C-L-27-R3-1 25.9 17.7 0.68 22.5 0.87 13.2 0.51 17.8 0.69
G-L-18-R1-1 20.7 10.1 0.49 24.7 1.19 6.0 0.29 11.1 0.54
G-L-18-R2-1 16.3 8.4 0.51 18.5 1.14 5.2 0.32 9.0 0.55
G-L-27-R1-2 17.5 11.6 0.66 30.2 1.73 6.7 0.38 12.7 0.73
G-L-27-R2-2 18.0 9.6 0.53 22.7 1.26 5.8 0.32 10.3 0.57
G-L-27-R3-1 20.2 11.5 0.57 22.5 1.11 7.4 0.37 12.1 0.60
mean 0.63 1.17 0.42 0.68
SD 0.09 0.23 0.08 0.10
Coefficient of
Variation (%) 14.18 19.27 19.97 15.01

66
As shown in Figure 5.1, all code equations showed conservative shear capacities for the
tested beams (𝑉𝑝𝑟𝑒𝑑/𝑉𝑒𝑥𝑝 < 1) with different degrees of discrepancies regardless of the type of FRP
bars used. The only exception was the CSA-S6-14 code despite the fact that the CSA-S6-14 shear
provisions provided the most accurate predictions in comparison to other provisions. Some results
predicted by the CSA-S6-14 code were unconservative. The mean ratio 𝑉𝑝𝑟𝑒𝑑/𝑉𝑒𝑥𝑝 obtained using
the CSA-S6-14 shear provisions was 1.27, 1.04 and 1.29 for BFRP-, CFRP-, and GFRP-reinforced
beams, respectively, with SD of 0.27, 0.14, and 0.25, respectively. The mean of the ratio
𝑉𝑝𝑟𝑒𝑑/𝑉𝑒𝑥𝑝 of all beams was 1.27 with a SD of 0.23.
Figure 5.1: Predicted-to-experimental ratios of LWC beams
On the other hand, the predictions of CSA-S806-12 code were conservative with an
average ratio 𝑉𝑝𝑟𝑒𝑑/𝑉𝑒𝑥𝑝 of 0.80 (SD = 0.12), 0.71 (SD = 0.05), and 0.60 (SD = 0.08), for BFRP-
, CFRP-, and GFRP-reinforced beams, respectively, and an average ratio 𝑉𝑝𝑟𝑒𝑑/𝑉𝑒𝑥𝑝 of all beams
of 0.68 with a SD of 0.10. These findings can be attributed to the fact that CSA-S806 equations
consider the a/d ratio and the reinforcement rigidity, ρE, which are not considered in those of CSA-
S6-14 code. Please refer to Equations 2.4 and 2.5.
ACI-440-15 equations provided the most conservative predictions for all FRP-reinforced
beams regardless of the type of FRP bars used. This finding was in agreement with previous studies
conducted by El-Sayed and Soudki (2011) and Alam and Hussein (2012) for GFRP and CFRP-
0
1
2
3
CL
-10
CL
-12
C-L
-18
-R1-1
C-L
-18
-R2-1
C-L
-27
-R1-1
C-L
-27
-R2-1
C-L
-27
-R3-1
G-L
-18-R
1-1
G-L
-18-R
2-1
G-L
-27-R
1-2
G-L
-27-R
2-2
G-L
-27-R
3-1
Vp
red/V
exp
JSCE-97 CSA-S6 ACI-440 CSA-S806

67
reinforced beams. The ratio between the predicted-to-experimental shear capacities were 0.46 (SD
= 0.05), 0.49 (SD = 0.14), and 0.34 (SD = 0.04) for BFRP-, CFRP-, and GFRP-reinforced beams,
respectively, with an overall ratio 𝑉𝑝𝑟𝑒𝑑/𝑉𝑒𝑥𝑝 of all beams of 0.42. This high level of divergence
from the experimental results could be attributed to the empirical nature of the ACI equation in
addition to the absence of the a/d factor in the shear prediction equation.
Similar to ACI-440-15 equation, the equation provided by JSCE-97 ignores the effect of
the shear span-to-depth ratio, a/d, on the shear strength of the beams. However, the JSCE-97
equation accounts for the size effect of the beam as given by the parameters, 𝛽𝑑, in Equation (2.14).
This might explain the better predicted strengths obtained using the JSCE-97 equation when
compared to the ACI-440-15 predicted values. Yet, the predicted capacities using JSCE-97
equation were conservative. The ratio 𝑉𝑝𝑟𝑒𝑑/𝑉𝑒𝑥𝑝 was 0.66 (SD = 0.09), 0.69 (SD = 0.05) and 0.55
(SD = 0.07) for the BFRP-, CFRP-, and GFRP-reinforced beams, respectively, with an overall
ratio 𝑉𝑒𝑥𝑝 /𝑉𝑝𝑟𝑒𝑑 of all beams of 0.63.
5.3 Shear strength of BFRP-reinforced FRLWC beams
Several studies have been conducted to predict the shear capacity of fiber-reinforced
lightweight concrete (FRLWC) beams. In this study, six models namely Ashour model A (1992),
Ashour model B (1992), Narayanan and Darwish (1987), Kawak (2002), Gopinath (2016), and
Shin (1994) were used to assess their validity in determining the shear capacities of FRP-FRLWC
beams. The experimental results of the tested beams were compared with the predictions of the
above-mentioned models as listed in Table 5.2. It should be noted that these models were initially
developed to determine the shear capacity of concrete elements cast with fiber-reinforced NWC
(FRNWC) and reinforced with longitudinal steel bars except that of Gopinath (2016), which has
been developed for BFRP-reinforced elements.
To account for lightweight concrete in the above models, Thomas et al. (2011) suggested the
calibration of the above equations by replacing the compressive strength of concrete, 𝑓′𝑐, by 𝜆2𝑓′𝑐,
the cube strength of FRC, 𝑓𝑐𝑢𝑓, by 𝜆2𝑓𝑐𝑢𝑓, and by replacing the interfacial bond stress factor, 𝜏, by
𝜆𝜏. The modifications suggested by Thomas et al. (2011) have been adopted in the current analysis.
Table 5.3 lists the SD and COV of the shear strengths of all of the tested beams.

68
Table 5.2: Comparison between the predicted and experimental shear strengths of the tested beams
Beam
Ashour
A
(1992)
(kN)
Vpred
/Vexp
Narayanan
& Darwish
(1987)
(kN)
Vpred
/Vexp
Ashour
B (1992)
(kN)
Vpred
/Vexp
Kawak
(2002)
(kN)
Vpred
/Vexp
Shin
(1994)
(kN)
Vpred
/Vexp
Gopinath
(2016)
(kN)
Vpred
/Vexp
Proposed
model)
(kN)
Vpred
/Vexp
CL-10 29.5 1.33 26.3 1.19 37.5 1.69 30.8 1.39 23.5 1.06 32.4 1.46 23.4 1.1
CL-12 33.4 1.10 29.5 0.97 38.2 1.26 34.8 1.14 27.3 0.90 36.2 1.19 26.1 0.9
Mean 1.21 1.08 1.47 1.27 0.98 1.32 1.0
SD 0.17 0.15 0.31 0.17 0.12 0.19 0.14
COV % 13.8 14.1 20.9 13.8 11.9 14.5 14.6
B-0.5-10 37.4 1.41 40.6 1.53 53.8 2.03 43.3 1.63 35.3 1.33 37.4 1.41 28.5 1.1
B-0.5-12 42.2 1.34 43.9 1.39 54.5 1.73 47.9 1.52 39.1 1.24 41.8 1.32 31.1 1.0
S-0.5-12 43.0 1.07 71.7 1.79 55.9 1.40 54.4 1.36 45.8 1.15 42.2 1.06 33.9 0.8
P-0.5-12 43.5 1.30 45.7 1.36 56.9 1.70 49.4 1.48 40.6 1.21 42.6 1.27 31.7 0.9
B-1.0-10 45.2 1.34 52.5 1.55 70.1 2.07 53.2 1.57 45.2 1.34 42.4 1.25 32.6 1.0
B-1.0-12 51.1 1.51 51.9 1.74 70.8 2.10 58.0 1.72 48.9 1.45 47.3 1.40 35.1 1.0
S-1.0-12 52.6 1.06 71.7 1.45 73.6 1.48 70.8 1.43 62.3 1.26 48.2 0.97 40.5 0.8
P-1.0-12 53.7 1.52 59.1 1.68 75.6 2.15 60.8 1.73 51.7 1.47 48.9 1.39 36.3 1.0
Mean 1.32 1.54 1.83 1.55 1.30 1.26 0.96
SD 0.18 0.14 0.29 0.13 0.11 0.16 0.09
COV % 13.3 9.4 16.0 8.5 8.7 13.0 9.4

69
Table 5.3 Mean, standard deviation, and coefficient of variation of the Vpred /Vexp ratio of all specimens
Ashour A
(1992)
(kN)
Narayanan
& Darwish
(1987)
(kN)
Ashour B
(1992)
(kN)
Kawak
(2002)
(kN)
Shin
(1994)
(kN)
Gopinath
(2016)
(kN)
Proposed
model
(kN)
Mean𝐵 1.40 1.55 1.98 1.61 1.34 1.35 1.01
SD𝐵 0.08 0.14 0.17 0.09 0.09 0.07 0.05
COV %𝐵 5.94 9.17 8.70 5.33 6.48 5.44 4.90
Mean𝑃 1.41 1.52 1.92 1.60 1.34 1.33 0.99
SD𝑃 0.16 0.22 0.32 0.18 0.18 0.08 0.06
COV %𝑃 11.18 14.63 16.38 11.05 13.53 6.17 5.90
Mean𝑆 1.07 1.62 1.44 1.39 1.20 1.01 0.9*
SD𝑆 0.01 0.25 0.06 0.05 0.08 0.06 0.00
COV %𝑆 0.97 15.17 4.20 3.48 6.47 5.85 0.07 B: Mean, standard deviation, and coefficient of variation calculated for concrete beams with basalt fibers only
P: Mean, standard deviation, and coefficient of variation calculated for concrete beams with polypropylene fibers only
S: Mean, standard deviation, and coefficient of variation calculated for concrete beams with steel fibers only * Bond factor of fibers equal to 1.00 and 𝜏 equal to 6.8 MPa

70
Control beams: Figure 5.2 shows the ratio of the experimental and predicted shear
capacities. It can be noticed that most of the models overestimated the shear capacities of the tested
beams leading to unsafe predictions. The model of Narayanan and Darwish (1987) overestimated
the shear capacity of the control beams (with no fibers added) by 8% on average, in comparison
with the experimental results. Similar observation was found when using Kawak model (2002),
which resulted in a predicted-to-experimental ratio of shear strength of 1.27. Both models proposed
by Ashour (1992) overestimated the shear capacity of the plain concrete beams, in comparison
with the experimental values, by an average of 21 and 47%, for model A and B (1992),
respectively. Similar observation was found with Gopinath et al. model (2016) where the mean
predicted-to-experimental ratio was 1.32. Better predictions for plain concrete beams were
obtained using the model of Shin (1994) where Vpred /Vexp was 0.98.
Fiber-reinforced beams: For the tested beams cast with fiber-reinforced concrete, it was
observed that Ashour Model B (1992), Kawak (2002) and Narayanan and Darwish (1987)
significantly overestimated the ultimate capacity of all beams by an average of 83, 55, and 54%,
respectively. Similar trend, but with less overprediction, was observed for Ashour Model A (1992),
Gopinath (2016), and Shin (1994), where ratios Vpred /Vexp were equal to 1.32 (SD = 0.18), 1.26
(SD = 0.16) and 1.30 (SD = 0.11), respectively.

71
Figure 5.2: Ratio of predicted-to-experimental shear capacities of the tested beams
5.3.1 Effect of type of fibers on the predicted capacities
Basalt fibers: It can be noticed from Table 5.3 that the provisions of Ashour model B
(1992) overestimated the shear capacity of basalt-fiber reinforced concrete beams (BLWC) by
98% on average, in comparison with the experimental results. Similar observation was found for
Ashour model A (1992), Narayanan and Darwish (1987), and Kawak (2002) for which the mean
predicted-to-experimental ratio was 1.40, 1.55 and 1.61, respectively. Better predictions for
BLWC were provided by Shin (1994) and Gopinath (2016), where the ratios Vpred /Vexp were 1.34,
and 1.35, respectively.
Polypropylene fibers: On the other hand, both models proposed by Ashour (models A and
B, 1992), Narayanan and Darwish (1987), and Kawak (2002) overestimated the shear capacities
of the polypropylene fiber-reinforced lightweight concrete beams (PLWC) by an average of 41,
92, 52, and 60%, respectively. Models of Gopinath (2016) and Shin (1994) overestimated the the
shear capacities by 33 and 34%, respectively.
0
1
2
CL
-10
CL
-12
B-0
.5-1
0
B-0
.5-1
2
B-1
.0-1
0
B-1
.0-1
2
S-0
.5-1
2
S-1
.0-1
2
P-0
.5-1
2
P-1
.0-1
2
VP
RE
D/V
EX
P
Ashour model A (1992) Narayanan & Darwish (1987)
Ashour model B (1992) Kawak (2002)
Shin (1994) Gopinath (2016)
Proposed model

72
Steel fibers: For steel fiber-reinforced lightweight concrete beams, it was observed that
predictions obtained from Ashour Model B (1992) and Narayanan and Darwish (1987)
overestimated the ultimate capacities of the tested beams by an average of 44 and 62%. Similar
trend was observed for Shin (1994) and Kawak (2002) models, where Vpred /Vexp was equal to 1.20
and 1.39, respectively. Other models predicted the ultimate shear capacities of the SLWC beams
fairly reasonable, where Vpred /Vexp for Ashour models A (1992) and Gopinath (2016) were equal
to 1.07 and 1.01, respectively.
5.3.2 Discussion
In the analysis of the test results, three factors were considered while assessing the
applicability of the models used to predict the shear capacities of the tested beams. These factors
are namely: a) the type of the longitudinal reinforcement used to develop the model (steel versus
FRP bars), b) the type of aggregates used in the concrete mix (normal versus light weight concrete),
and c) the type of fibers used to produce the FRC mix (steel, basalt, or polypropylene fibers). It is
important to note that most of the assessed models were developed to predict the shear capacities
of beams reinforced longitudinally with steel bars and cast with steel fiber-reinforced normal
weight concrete (SNWC). As previously mentioned, all models were calibrated to account for the
use of light-weight aggregates in the tested specimens by modifying the compressive strength of
concrete as suggested by Thomas et al. (2011).
Based on the results listed in Table 5.3 and shown in Figure 5.2, it was observed that most
models used to predict the shear capacities of FRLWC beams took into account the contribution
of the fibers to the development of the shear capacities such as the fiber pullout stress, 𝑣𝑏, as will
be detailed below.
It was noted that Shin (1994) model provided reasonable predictions for the shear
capacities of BFRP-reinforced beams cast with BLWC. The models of Shin (1994) and Gopinath
(2016) gave reasonable predictions for PLWC while the model of Kawak (2002), Gopinath (2016)
and Ashour model A (1992) predicted well the shear capacities of SLWC only.
In order to interpret these results, Equations (2.16, 2.23, and 2.25) are restated below for
convenience.

73
Narayanan & Darwish
(1987) 𝑣𝑢 = 𝑒 (0.24𝑓𝑠𝑝 + 80𝜌
𝑑
𝑎) + 𝑣𝑏 (2.16)
Kawak (2002) 𝑣𝑢 = (3.7𝑒(𝑓𝑠𝑝2/3) (√𝜌
𝑑
𝑎
3))+ 0.8 𝑣𝑏 (2.23)
Shin (1994) 𝑣𝑢 = 0.19𝑓𝑠𝑝 + 93𝜌 (𝑑
𝑎) + 0.834 𝑣𝑏 (2.25)
It can be noted that the first terms in Equations (2.16, 2.23, and 2.25) represent the
contribution of the added fibers in terms of the splitting tensile strength of concrete, 𝑓𝑠𝑝, whereas
the second term refers to the dowel action, 𝜌(𝑑
𝑎), provided by the longitudinal reinforcement. The
third term in the equations, 𝑣𝑏 , considers the interfacial bond stress between the fiber and the
cement paste besides the fiber’s factor, which includes the fiber’s aspect ratio, 𝐿𝑓
𝐷𝑓, the volume
fraction of fibers, 𝑉𝑓 , and the bond factor, 𝑑𝑓.
The consideration of the main parameters that influence the shear strength of concrete in
Equations (2.16, 2.23, and 2.25) resulted in close, yet unconservative, predictions for the shear
capacities of the tested beams. The degree of divergence from the experimental results depended
on the empirical factors used to weigh the different parameters as previously noted. Models of
Ashour model A (1992), Ashour model B (1992), Narayanan and Darwish (1987), Kawak (2002),
and Shin (1994) overestimated the capacities of most of the tested beams leading to unsafe
capacities in many cases. This was attributed to the fact that these models were developed for steel-
reinforced elements cast with steel-fiber NWC (SNWC). Despite the calibration of these models
to account for the LWC used during analysis, these models were not calibrated for the use of basalt
or polypropylene fibers nor for the use of BFRP longitudinal bars. Considering the superior
mechanical properties of steel fibers compared to those of basalt and polypropylene fibers, and
those of steel bars compared to BFRP bars, it was rational that the models overestimated the shear
capacities of the tested beams.

74
The model of Gopinath (2016) given in Equation (5.1) also overestimated the shear
capacities of the tested beams although it was initially developed for FRP-reinforced members.
This was attributed to the fact that the model was developed for NWC with steel fibers added. The
model consists of two parts: the first part is that of the JSCE model (1997) in which the effect of
using longitudinal FRP bars is considered whilst the second part is that of Ashour model A (1992)
in which the effect of using fiber-reinforced concrete is considered.
Gopinath
(2016) 𝑣𝑐 = {(𝛽𝑑𝛽𝑝𝛽𝑛𝑓𝑣𝑐𝑑
𝛾𝑏𝑏𝑤𝑑) + ((2.11√𝑓𝑐′
3+ 7𝐹)(√𝜌
𝑑
𝑎
3
))𝑏𝑤𝑑}
0.91
(5.1)
On the other hand, Ashour models B (1992) shown in Equation (2.21), and repeated here
for convenience, gave the poorest predicted values for almost all of the tested beams while Ashour
model A (1992) shown in Equation (2.21), predicted well the shear capacity when used for the
beams cast with SLWC (ratio Vpred/Vexp = 1.07). This divergence from the experimental results
could be attributed to the fact that both models do not account for the use of FRP bars as
longitudinal reinforcement nor for the use of fibers other than steel fibers in concrete.
Model B
(1992) 𝑣𝑢 = (0.7√𝑓′𝑐 + 7𝐹)
𝑑
𝑎+ 17.2𝜌
𝑑
𝑎 (2.21)
Model A
(1992) 𝑣𝑢 = (2.11√𝑓′𝑐
3 + 7𝐹)(√𝜌𝑑
𝑎
3) (2.22)
5.3.3 Proposed model
As previously mentioned, the shear strengths of FRLWC beams reinforced with BFRP bars
were predicted in the current study using several models. Most of the models were initially
developed for steel-reinforced elements except that of Gopinath (2016), which was a combination
of two models as previously explained.

75
It was also concluded from the analytical study that the code equations do not consider the
effect of using FRC in their equations to predict the shear strength of FRP-reinforced members.
While the equation of CSA-S806-12 provided good results for BFRP-reinforced beams when
compared to the experimental results, the model of Shin (1994) showed reasonable results to
predict the shear capacity of FRC beams.
Based on the review of the analytical models, the following design Equation (5.2) is proposed
to predict the shear capacity for FRLWC beams reinforced with BFRP bars. The equation follows
a procedure similar to that of Gopinath (2016), in which the equation of CSA-S806-12 code and
that of Shin (1994) are combined and elevated to an exponent of 0.85 as given in Equation (5.2).
𝑉𝑐 = {(0.05λ𝜑𝑐𝑘𝑚𝑘𝑟𝑘𝑎𝑘𝑠√𝑓′𝑐3
𝑏𝑤 𝑑𝑣) + (0.19𝑓𝑠𝑝 + 93𝜌 (𝑑
𝑎) + 0.834 𝑣𝑏) 𝑏𝑤𝑑𝑣}
0.85
(5.31)
where 𝑓𝑠𝑝 is defined as the splitting tensile strength and taken equal to:
𝑓𝑠𝑝 =λ2𝑓𝑐𝑢𝑓
(20 − √𝐹)+ 0.7 + 1.0√𝐹 (5.3)
𝑣𝑏= 0.41λ𝜏𝐹 (5.4)
F= (𝐿𝑓
𝐷𝑓)𝑉𝑓𝑑𝑓 (5.5)
where 𝑓𝑐𝑢𝑓 is the cube strength of FRC = 1.2𝑓𝑐′ MPa; a = shear span (mm); 𝑣𝑏 is the fiber pullout
stress; 𝜏 is the interface bond matrix = 4.15 MPa for basalt and polypropylene fibers based on the
recommendation of Swamy et al. (1974) and Narayanan and Darwish (1987) and 6.8 MPa for steel
fibers based on the recommendation of Lim et al. (1987); F = fibers factor; 𝐿𝑓 = length of fibers
(mm); 𝐷𝑓 = diameter of fibers (mm); 𝑉𝑓 = volume fraction of fibers; 𝑑𝑓 is the bond factor of fibers
taken as 0.75 for basalt and polypropylene fibers as recommended by Narayanan and Darwish
(1987) and 1.0 for hooked-end steel fibers as recommended by Imam (1997). Other parameters are
defined in Chapter 2.

76
It can be noted that the first part in Equation (5.2) represents the use of FRP longitudinal
bars and includes different parameters that are known to affect the shear capacities of FRP-
reinforced beams such as the span-to-depth ratio, a/d, and the reinforcement rigidity, ρE. The
second part reflects the use of fiber-reinforced concrete including the fibers’ factor, F, which
includes the length, diameter, bond, and volume fraction of fibers, in addition to the dowel action,
𝜌(𝑑
𝑎), provided by the longitudinal reinforcement. In the proposed model, the effect of LWC is
reflected by replacing the cube strength of concrete, 𝑓𝑐𝑢𝑓, by 𝜆2𝑓𝑐𝑢𝑓 and the fiber pullout stress,
𝑣𝑏, by 𝜆𝑣𝑏 , where 𝜆 = 0.75.
The consideration of the main parameters that affect the shear strength of concrete in Equation
(5.2) resulted in close predictions for the shear capacities to experimental values of the tested
beams as given in Table 5.2, Table 5.3, and Figure 5.2. The proposed model predicted the shear
capacity of the BLWC beams fairly reasonable, where the average Vpred /Vexp ratio obtained was
equal to 1.01. Good predictions for PLWC beams was provided by the proposed model where the
average Vpred /Vexp ratio was 0.99. On the other hand, the proposed model also predicted well the
shear capacities of beams cast with SLWC. The ratio Vpred /Vexp obtained for these beams was equal
to 0.9. It is important to note that a bond factor 𝑑𝑓 = 1.0 for hooked-end steel fibers and an interface
bond matrix τ = 6.8 MPa were used for SLWC beams, which is recommended. All values are
shown in Table 5.2 and Table 5.3.

77
6. Conclusions and Recommendations
6.1 Introduction
An experimental and analytical research was conducted to examine the shear behavior of
fiber-reinforced lightweight concrete (FRLWC) beams reinforced with basalt fiber-reinforced
polymer (BFRP) bars. Ten beams (150x250x2400 mm) cast in concrete with and without fibers
were tested in shear under four-point load configuration. Several parameters were investigated to
examine their influence on the shear strength of the beams such as the fibers’ type (basalt,
polypropylene, and steel fibers), the volume fraction of the fibers added (0, 0.5, and 1.0%), and
the reinforcement ratios (0.95 and 1.37%). Comparisons between the experimental results and the
shear strengths predicted using various models were presented to determine the applicability of
these models. A new proposed model that accounts for the use of FRLWC reinforced with FRP
bars is proposed.
6.2 Conclusions
The conclusions and observations of the work conducted are summarized as follows.
• Adding fibers with a volume fraction of 0.5% enhanced the compressive and tensile
strengths of lightweight concrete. However, increasing the fiber content from 0.5 to 1%
had a slight effect on these strengths. The gain in compressive strengths of 0.5% BLWC,
SLWC, and PLWC mixes (having basalt, steel, and polypropylene fibers, respectively) was
7, 8, and 2% respectively, whereas the corresponding tensile strengths increased by 6, 49,
and 13% respectively. The compressive and tensile strengths of 1% SLWC increased by 9
and 56%, respectively.
• The geometry of fibers played an important role in increasing the number of flexural cracks
and bridging crack widths. Adding 0.5% of fibers slightly enhanced the flexural behavior
of beams leading to an increased number of flexural cracks than those observed in the
control beams.

78
• Beams cast with fiber-reinforced concrete showed less inclined shear cracks than those
encountered in the control beams (without fibers). The discrepancy in the degree of
inclination of the shear cracks could be attributed to the random distribution and orientation
of fibers in concrete during mixing.
• Crack width decreased with the increase of the reinforcement ratios and the fibers volume
fraction. This effect of the longitudinal reinforcement on the crack widths was more
pronounced in beams with low reinforcement ratios. Steel fibers reduced the crack widths
more than the basalt and polypropylene fibers.
• Diagonal tension was the dominant mode of failure in all of the tested beams. All beams
cast in plain concrete failed in a brittle manner. However, the addition of fibers led to a
more ductile failure and the rate of crack opening was delayed, which was attributed to the
bridging mechanism of the randomly-oriented fibers.
• The effect of longitudinal reinforcement ratio on the shear capacity of the beams was offset
by the addition of 1% basalt fibers. The effect of fibers was more pronounced in beams
with low longitudinal reinforcement ratio.
• The type of fibers significantly affected the gain in the shear capacities of the beams, which
can be attributed to the different physical and mechanical properties of the fibers used such
as aspect ratios, lengths, geometries, densities, and their bonding mechanisms. Beams cast
with 0.5% steel fibers exhibited higher shear capacities than those cast with basalt and
polypropylene fibers by 23 and 16%, respectively, whereas the beams cast with 1% steel
fibers showed a gain of 47 and 41%, respectively.
• Increasing the volume fraction from 0.5 to 1% of steel fibers showed the highest gain in
shear capacity by 27% whilst for basalt and polypropylene fibers, a gain in shear capacity
by 7 and 5%, respectively, was encountered.
• Increasing the reinforcement ratio resulted in higher stiffness and decreased deflections at
all stages of loading. Increasing the fiber dosage from 0.5 to 1.0% in beams B-0.5-10 and
B-1.0-10 increased the ultimate deflection with no significant effect on the beams’

79
stiffness. This effect was less pronounced in beams with higher reinforcement ratios.
SLWC beams showed the highest deflections at ultimate followed by the BLWC and
PLWC beams.
• The addition of steel fibers caused the highest stiffness at volume fraction of 1% at ultimate
while the addition of 0.5 and 1% of polypropylene fibers showed the lowest stiffness at
ultimate. Hooked-ends in steel fibers were effective in bridging the shear cracks and
increasing the toughness of the beams. Therefore, beams with steel fibers showed higher
strains at ultimate than those cast with basalt and polypropylene fibers.
• The addition of 0.5 and 1% of basalt fibers had a more pronounced effect on the ultimate
strength of beam B-0.5-10 (with low reinforcement ratio) than on the ultimate strength of
beam B-0.5-12 (with high reinforcement ratio).
• The predicted shear capacities obtained by the CSA-S6-14 code equations were
overestimated leading to unsafe capacities for BFRP-reinforced beams without fibers. The
mean and standard deviation of the ratio 𝑉𝑝𝑟𝑒𝑑/𝑉𝑒𝑥𝑝 obtained using the CSA-S6-14 shear
provisions were 1.22 (SD = 0.27).
• The predictions of CSA-S806-12 code were conservative with an average ratio 𝑉𝑝𝑟𝑒𝑑/𝑉𝑒𝑥𝑝
of 0.80 (SD = 0.12) for BFRP-reinforced beams without fibers.
• Shin model (1994) predicted the best the experimental shear capacities of plain concrete
beams with a mean ratio Vpred /Vexp of 0.98 with a SD of 0.12.
• Good predictions for the shear capacities of BLWC beams were provided by Ashour model
A (1992), Shin (1994), and Gopinath (2016) models, where the ratios Vpred /Vexp were 1.40
(SD = 0.08), 1.34 (SD = 0.09), and 1.35 (SD = 0.07), respectively. Shin model (1994)
predicted the shear capacities of PLWC beams with a Vpred /Vexp ratio of 1.34 and SD of
0.18. Ashour models A (1992), Shin (1994), and Gopinath (2016) models predicted the
shear capacities of SLWC beams with a Vpred /Vexp ratio of 1.07 (SD = 0.01), 1.20 (SD =
0.08) and 1.01 (SD = 0.06), respectively.

80
• A new model was proposed to predict the shear capacities of FRWLC beams reinforced
with BFRP longitudinal bars. The proposed model predicted well the shear capacities of
BLWC beams with a Vpred /Vexp ratio of 1.01 (SD = 0.05) and those of PLWC beams with
a ratio Vpred /Vexp of 0.99 (SD = 0.06). The bond factor and the interface bond matrix used
were 0.75 and 4.18 MPa, respectively.
• The proposed model also predicted well the shear capacities of beams cast with SLWC
with a ratio Vpred /Vexp of 0.9 when the bond factor and the interface bond matrix were taken
equal to 1.00 and 6.8 MPa, respectively.
6.3 Recommendations for future work
The current study investigated the shear behavior of beams reinforced with BFRP bars and cast
with FRLWC. Based on the outcome of the current study, more investigations are required to better
understand the behavior of such elements.
• More tests on beams and slabs reinforced with longitudinal FRP bars and cast with FRLWC
are needed. Experimental data on such elements can rarely be found.
• More data are still required to verify the applicability of the available models and to have
an insight on the different parameters that affect the shear behavior.
• More experimental investigations are needed to verify the applicability of the proposed
model and to study the effect of different parameters on the shear behavior of the beams.

81
Bibliography
Ababneh, Ayman, Rajai Al-Rousan, Mohammad Alhassan, and Mohammed Alqadami. (2017).
“Influence of Synthetic Fibers on the Shear Behavior of Lightweight Concrete Beams.”
Advances in Structural Engineering, no. February: 136943321769177.
doi:10.1177/1369433217691773.
Abbas, Yassir M., and M. Iqbal Khan. (2016). “Influence of Fiber Properties on Shear Failure of
Steel Fiber Reinforced Beams without Web Reinforcement: ANN Modeling.” Latin
American Journal of Solids and Structures 13 (8): 1483–98. doi:10.1590/1679-78252851.
ACI Committee 318. “Building Code Requirements for Structural Concrete (ACI 318-11) ACI
Standard.”
ACI Committee 544. (2002). “State-of-the-Art Report on Fiber Reinforced Concrete Reported by
ACI Committee 544.” ACI Structural Journal 96 (Reapproved).
ACI (American Concrete Institute). (2015). “Guide for the design and construction of structural
concrete reinforced with FRP bars.” ACI 440.1R-15, Farmington Hills, MI.
Adhikari, S. (2013). “Mechanical and structural characterization of mini-bar reinforced concrete
beams. Doctor of Philosophy thesis, Akron University, Ohio, United States. The Graduate
Faculty of The University of Akron. Doctor of: 71.
Afifi, Mohammad Z., Hamdy M. Mohamed, and Brahim Benmokrane. (2014). “Axial Capacity of
Circular Concrete Columns Reinforced with GFRP Bars and Spirals.” Journal of Composites
for Construction 18(1): 4013017.
http://ascelibrary.org/doi/10.1061/%28ASCE%29CC.1943-5614.0000438.
Ahmed, Ehab a., Ehab F. El-Salakawy, and Brahim Benmokrane. (2010). “Shear Performance of
RC Bridge Girders Reinforced with Carbon FRP Stirrups.” Journal of Bridge Engineering
15(1): 44–54.
Altalmas, Ahmad, Ahmed El Refai, and Farid Abed. (2015). “Bond Degradation of Basalt Fiber-
Reinforced Polymer (BFRP) Bars Exposed to Accelerated Aging Conditions.” Construction
and Building Materials 81.
Altun, Fatih, and Bekir Aktaş. (2012). “Investigation of Reinforced Concrete Beams Behavior of
Steel Fiber Added Lightweight Concrete.” Construction and Building Materials 38: 575–81.
doi:10.1016/j.conbuildmat.2012.09.022.
Ashour, S. A.; Hassanain, G. S.; and Wafa, F. F., “Shear Behavior of High-Strength Fiber-
Reinforced Concrete Beams,” ACI Structural Journal, V. 89, No. 2, Mar.-Apr. 1992, pp. 176-
184.
ASTM C496/496M-04, “Standard Test Method for Splitting Tensile Strength of Cylindrical
Concrete Specimens,” ASTM International, West Conshohocken, PA, 2004, 5 pp.

82
ASTM C39/C39M-10, “Standard Test Method for Compressive Strength of Cylindrical Concrete
Specimens,” ASTM International, West Conshohocken, PA, 2010, 7 pp
Attom, Mousa F., and Adil K. Al-Tamimi. (2010). “Effects of Polypropylene Fibers on the Shear
Strength of Sandy Soil.” International Journal of Geosciences 1 (1): 44–50.
doi:10.4236/ijg.2010.11006.
Bank, Lawren C. (2007). “Design of FRP Reinforced and Strengthened Concrete.” Concrete
Construction Engineering Book 2007: 25.1-25.22.
Branston, J., Das, S., Kenno, S., Taylor, C. (2016). Mechanical behavior of basalt fibre reinforced
concrete. Journal for construction and Building Materials, 124, 878- 886.
Choo, Ching Chiaw, Issam E. Harik, and Hans Gesund. (2006). “Strength of Rectangular Concrete
Columns Reinforced with Fiber-Reinforced Polymer Bars.” ACI Structural Journal 103(3):
452–59.
CSA (Canadian Standards Association). (2012). “Design and construction of building components
with fiber-reinforced polymers.” CAN/CSAS806-12, Mississauga, ON, Canada.
CSA (Canadian Standards Association). (2010). “Canadian highway bridge design code.”
CAN/CSA-S6-10, Mississauga, ON, Canada.
Cucchiara, Calogero, Lidia La Mendola, and Maurizio Papia. (2004). “Effectiveness of Stirrups
and Steel Fibres as Shear Reinforcement.” Cement and Concrete Composites 26(7): 777–86.
Dong, Zhiqiang et al. (2016). “Bond Durability of BFRP Bars Embedded in Concrete under
Seawater Conditions and the Long-Term Bond Strength Prediction.” Materials and Design
92: 552–62.
Düzgün, Oǧuz Akin, Rüstem Gül, and A. C. Aydin. (2005). “Effect of Steel Fibers on the
Mechanical Properties of Natural Lightweight Aggregate Concrete.” Materials Letters
59(27): 3357–63.
Edgaras Atutis, Juozas Valivonis, Mantas Atutis. (2017). “Experimental Study of Concrete Beams
Prestressed with Basalt Fiber Reinforced Polymers. Part I: Flexural Behavior and
Serviceability.” Composite Structures.
http://linkinghub.elsevier.com/retrieve/pii/S0263822316328690.
El-Sayed, Ahmed K., and Khaled Soudki. (2011). “Evaluation of Shear Design Equations of
Concrete Beams with FRP Reinforcement.” Journal of Composites for Construction 15(1):
9–20.
Elgabbas, Fareed, Ehab A. Ahmed, and Brahim Benmokrane. (2015). “Physical and Mechanical
Characteristics of New Basalt-FRP Bars for Reinforcing Concrete Structures.” Construction
and Building Materials.
Elgabbas, Fareed, Patrick Vincent, Ehab A. Ahmed, and Brahim Benmokrane. (2016).

83
“Experimental Testing of Basalt-Fiber-Reinforced Polymer Bars in Concrete Beams.”
Composites Part B: Engineering.
El Refai, Ahmed. (2012). “Durability of Concrete Beams Externally Reinforced with CFRP
Composites Exposed to Various Environments.” Journal of Composites for Construction
16(1): 10–20. http://dx.doi.org/10.1061/(ASCE)CC.1943-5614.0000233.
El Refai, Ahmed, and Farid Abed. (2016). “Concrete Contribution to Shear Strength of Beams
Reinforced with Basalt Fiber-Reinforced Bars.” Journal of Composites for Construction
20(4): 4015082. http://ascelibrary.org/doi/10.1061/%28ASCE%29CC.1943-5614.0000648.
El Refai, Ahmed, Mohamed-Amine Ammar, and Radhouane Masmoudi. (2015). “Bond
Performance of Basalt Fiber-Reinforced Polymer Bars to Concrete.” Journal of Composites
for Construction 19(3): 4014050. http://ascelibrary.org/doi/abs/10.1061/(ASCE)CC.1943-
5614.0000487.
Fiore, V., T. Scalici, G. Di Bella, and A. Valenza. (2015). “A Review on Basalt Fibre and Its
Composites.” Composites Part B: Engineering 74: 74–94.
Gopinath, S., S. Meenu, and A. Ramachandra Murthy. 2016. “Shear Strength Evaluation of
Concrete Beams Reinforced with BFRP Bars and Steel Fibers without Stirrups.” Computers,
Materials and Continua 51 (2): 81–103. doi:10.3970/cmc.2016.051.081.pdf.
Hassan, Mohamed, Brahim Benmokrane, Adel ElSafty, and Amir Fam. (2016). “Bond Durability
of Basalt-Fiber-Reinforced-Polymer (BFRP) Bars Embedded in Concrete in Aggressive
Environments.” Composites Part B: Engineering.
Hassanpour, Mahmoud, Payam Shafigh, and Hilmi Bin Mahmud. (2012). “Lightweight Aggregate
Concrete Fiber Reinforcement - A Review.” Construction and Building Materials 37: 452–
61. http://dx.doi.org/10.1016/j.conbuildmat.2012.07.071.
Hamad, B S, and E Y Abou Haidar. (2011). “Effect of Steel Fibers on Bond Strength of Hooked
Bars in High-Strength Concrete.” Journal of Materials in Civil Engineering 23 (5): 673–81.
doi:10.1061/(ASCE)MT.1943-5533.0000230.
High, Cory, Hatem M. Seliem, Adel El-Safty, and Sami H. Rizkalla. (2015). “Use of Basalt Fibers
for Concrete Structures.” Construction and Building Materials 96: 37–46.
http://dx.doi.org/10.1016/j.conbuildmat.2015.07.138.
Holschemacher, K., T. Mueller, and Y. Ribakov. (2010). “Effect of Steel Fibres on Mechanical
Properties of High-Strength Concrete.” Materials and Design 31 (5). Elsevier Ltd: 2604–15.
doi:10.1016/j.matdes.2009.11.025.
Hoult, N. a., E. G. Sherwood, E. C. Bentz, and M. P. Collins. (2008). “Does the Use of FRP
Reinforcement Change the One-Way Shear Behavior of Reinforced Concrete Slabs?” Journal
of Composites for Construction 12 (2): 125–33. doi:10.1061/(ASCE)1090-
0268(2008)12:2(125).

84
Inman, Marianne, Eythor Rafn Thorhallsson, and Kamal Azrague. (2017). “A Mechanical and
Environmental Assessment and Comparison of Basalt Fibre Reinforced Polymer (BFRP)
Rebar and Steel Rebar in Concrete Beams.” Energy Procedia 111(1876): 31–40.
James K. wight, James G. MacGreogor. 2009. Reinforced Concrete Mechanics and Design. Fifth
Edit. New Jersery: Pearson Education, Inc, Pearson Prentice Hall.
Japan Society of Civil Engineers (JSCE). (1997). “Recommendation for design and construction
of concrete structures using continuous fiber reinforcing materials.” No. 23, Research
Committee on Continuous Fiber Reinforced Material, Tokyo.
Jiang, C., Fan, K., Wu, F., Chen, Da. (2014). Experimental study on the mechanical properties and
microstructure of chopped basalt fibre reinforced concrete. Journal of Materials and design,
58, 187-193.
Juárez, César, Pedro Valdez, Alejandro Durán, and Konstantin Sobolev. (2007). “The Diagonal
Tension Behavior of Fiber Reinforced Concrete Beams.” Cement and Concrete Composites
29 (5): 402–8. doi:10.1016/j.cemconcomp.2006.12.009.
Kang, T H, and W Kim. (2010). “Shear Strength of Steel Fiber-Reinforced Lightweight Concrete
Beams S + W.”
Katzer, Jacek, and Jacek Domski. (2012). “Quality and Mechanical Properties of Engineered Steel
Fibres Used as Reinforcement for Concrete.” Construction and Building Materials 34.
Elsevier Ltd: 243–48. doi:10.1016/j.conbuildmat.2012.02.058.
Khanfour, Mohamed Akram, and Ahmed El Refai. (2017). “Effect of Freeze-Thaw Cycles on
Concrete Reinforced with Basalt-Fiber Reinforced Polymers (BFRP) Bars.” Construction and
Building Materials 145: 135–46.
Kwak, Yoon-keun, Marc O Eberhard, Woo-suk Kim, and Jubum Kim. (2002). “Shear Strength of
Steel Fiber-Reinforced Concrete Beams without Stirrups.” ACI Structural Journal (99): 1–9.
http://faculty.washington.edu/eberhard/publications/aci_manuscript_f99s55.pdf.
Lapko, A., and M. Urbański. (2015). “Experimental and Theoretical Analysis of Deflections of
Concrete Beams Reinforced with Basalt Rebar.” Archives of Civil and Mechanical
Engineering 15(1): 223–30.
Li, Chenchen, Danying Gao, Yinglai Wang, and Jiyu Tang. (2017). “Effect of High Temperature
on the Bond Performance between Basalt Fibre Reinforced Polymer (BFRP) Bars and
Concrete.” Construction and Building Materials 141: 44–51.
Lim TY, Paramsivam P, Lee SL. Analytical model for tensile behavior of steel fiber concrete.
ACI Mater J 1987;84(4):286–98.
Mahroug, M. E M, A. F. Ashour, and D. Lam. (2014). “Experimental Response and Code
Modelling of Continuous Concrete Slabs Reinforced with BFRP Bars.” Composite Structures
107: 664–74. http://dx.doi.org/10.1016/j.compstruct.2013.08.029.

85
Mohsen A. Issa, Thilan Ovitigala and Mustapha Ibrahim. (2012). “Design-Oriented Strength
Model for FRP-Confined Concrete Members.” Journal of Composites for Construction 16(6):
615–25. http://dx.doi.org/10.1061/(ASCE)CC.1943-5614.0000233.
Muntasir Billah, A. H M, and M. Shahria Alam. (2012). “Seismic Performance of Concrete
Columns Reinforced with Hybrid Shape Memory Alloy (SMA) and Fiber Reinforced
Polymer (FRP) Bars.” Construction and Building Materials 28(1): 730–42.
http://dx.doi.org/10.1016/j.conbuildmat.2011.10.020.
Narayanan, R., and Darwish, I. Y. S., “Use of Steel Fibers as Shear Reinforcement,” ACI Structural
Journal, V. 84, No. 3, May-June 1987, pp. 216-227.
Okuyucu, Dilek, and Burak Uzal. (2011). “Some Characteristics of Fibre- Reinforced Semi-
Lightweight Concrete Containing Unexpanded Perlite Both as Aggregate and as a
Supplementary Cementing Material.” 63(1): 1–10.
Pearson, Maximus, Ted Donchev, and Juan Salazar. (2013). “Long-Term Behaviour of Prestressed
Basalt Fibre Reinforced Polymer Bars.” Procedia Engineering 54(2009): 261–69.
http://dx.doi.org/10.1016/j.proeng.2013.03.024.
Pilakoutas, Kypros, Maurizio Guadagnini, Kyriacos Neocleous, and Stijn Matthys. (2011).
“Design Guidelines for FRP Reinforced Concrete Structures.” Proceedings of the Institution
of Civil Engineers - Structures and Buildings 164(4): 255–63.
http://www.icevirtuallibrary.com/doi/10.1680/stbu.2011.164.4.255.
Rakoczy, Anna M, and Andrzej S Nowak. (2014). “Resistance Factors for Lightweight Concrete.”
(111): 103–12.
Rami Hamad, J. A., M. A. Megat Johari, and Rami H. Haddad. (2017). “Mechanical Properties
and Bond Characteristics of Different Fiber Reinforced Polymer Rebars at Elevated
Temperatures.” Construction and Building Materials 142: 521–35.
Sheikh, Shamim A., and Grace Yau. (2002). “Seismic Behavior of Concrete Columns Confined
with Steel and Fiber-Reinforced Polymers.” ACI Structural Journal 99(1): 72–80.
Shin, S.-W.; Oh, J.-K.; and Ghosh, S. K., “Shear Behavior of Laboratory-Sized High-Strength
Concrete Beams Reinforced with Bars and Steel Fibers,” Fiber Reinforced Concrete—
Developments and Innovations, SP-142, American Concrete Institute, Farmington Hills, MI,
1994, pp. 181-200.
Swamy, R N, and A H Jojagha. (1982). “Workability of Steel Fibre Reinforced Lightweight
Aggregate Concrete” 4 (2): 103–9.
Thomas H.-K. Kang, Woosuk Kim, Yoon-Keun Kwak, and Sung-Gul Hong. (2011). “Shear
Testing of Steel Fiber-Reinforced Concrete Beams without Web Reinforcement.” ACI
Structural Journal 104(1): 12–21.

86
Tobbi, Hany, Ahmed Sabry Farghaly, and Brahim Benmokrane. (2012). “Concrete Columns
Reinforced Longitudinally and Transversally with Glass Fiber-Reinforced Polymer Bars.”
ACI Structural Journal 109(4): 551–58.
Tomlinson, Douglas, and Amir Fam. (2014). “Performance of Concrete Beams Reinforced with
Basalt FRP for Flexure and Shear.” Dx.Doi.Org 4014036(10).
Urbanski, Marek, Andrzej Lapko, and Andrzej Garbacz. (2013). “Investigation on Concrete
Beams Reinforced with Basalt Rebars as an Effective Alternative of Conventional R/C
Structures.” Procedia Engineering 57: 1183–91.
http://dx.doi.org/10.1016/j.proeng.2013.04.149.
Vijay, Morampudi et al. (2011). “Characterization of Short Basalt Fiber Reinforced Syntactic
Foams.” : 3–7.
Wang, Xin, Zihao Wang, Zhishen Wu, and Fang Cheng. (2014). “Shear Behavior of Basalt Fiber
Reinforced Polymer (FRP) and Hybrid FRP Rods as Shear Resistance Members.”
Construction and Building Materials 73: 781–89.
http://dx.doi.org/10.1016/j.conbuildmat.2014.09.104.
Wang, Zike et al. (2017). “Long-Term Durability of Basalt- and Glass-Fibre Reinforced Polymer
(BFRP/GFRP) Bars in Seawater and Sea Sand Concrete Environment.” Construction and
Building Materials 139: 467–89. http://dx.doi.org/10.1016/j.conbuildmat.2017.02.038.
Xiao, Liguang, Qingshun Liu, and Jiheng Li. (2016). “Basalt Fiber on Cinder Strength of
Lightweight Aggregate Concrete.” In , 232–36.
Zinkaah, Othman Hameed. (2014). “Influence of Steel Fibers on the Behavior of Light Weight
Concrete Made from Crushed Clay Bricks.” 2(4): 109–16.