SHARON ANYANGO OBONYO
63
THE INFLUENCE OF OUT OF HOME ADVERTISING ON CONSUMER ATITUDE IN FAST MOVING CONSUMER GOODS IN WESTLANDS DIVISION, NAIROBI COUNTY SHARON ANYANGO OBONYO A RESEARCH PROJECT SUBMITTED IN PARTIAL FULLFILMENT OF THE REQUIREMENT FOR THE AWARD OF MASTER OF SCIENCE IN MARKETING RESEARCH, SCHOOL OF BUSINESS UNIVERSITY OF NAIROBI. 2019
Transcript of SHARON ANYANGO OBONYO

THE INFLUENCE OF OUT OF HOME ADVERTISING ON CONSUMER
ATITUDE IN FAST MOVING CONSUMER GOODS IN WESTLANDS
DIVISION, NAIROBI COUNTY
SHARON ANYANGO OBONYO
A RESEARCH PROJECT SUBMITTED IN PARTIAL
FULLFILMENT OF THE REQUIREMENT FOR THE AWARD
OF MASTER OF SCIENCE IN MARKETING RESEARCH,
SCHOOL OF BUSINESS UNIVERSITY OF NAIROBI.
2019

ii
DECLARATION
I, the undersigned do declare that this research project is my original work and has not
been previously presented in part or in totality to any other institution of learning for
the award of any degree or examination.
Signature :……………………………. Date:……………………….
Sharon Anyango Obonyo
Reg: D65/8476/2017
This research has been submitted with my approval as the university Supervisor.
Signature:……………………………. Date:……………………….
Dr. Muya Ndambuki
Senior Lecturer
School of Business Administration
University of Nairobi .

iii
ACKNOWLEDGEMENT
I wish to extend my sincere gratitude to my family, lecturer and friends for their moral
and financial contribution while undertaking the project.
Special thanks to my parents and my supervisor Dr. Muya Ndambuki. I would also
like to thank God for this far He has brought me.

iv
DEDICATION
This project is dedicated to my late uncle, Edward Abondo Kisero. For all the
sacrifices you made for us and for being someone we could always count on. You are
forever in our hearts and your light shines on. We miss you dearly.

v
TABLE OF CONTENTS
DECLARATION.......................................................................................................... ii
ACKNOWLEDGEMENT ..........................................................................................iii
DEDICATION............................................................................................................. iv
TABLE OF CONTENTS ............................................................................................ v
LIST OF TABLES ....................................................................................................viii
LIST OF FIGURES .................................................................................................... ix
ABBREVIATIONS AND ACRONYMS .................................................................... x
ABSTRACT ................................................................................................................. xi
CHAPTER ONE .......................................................................................................... 1
INTRODUCTION........................................................................................................ 1
1.1 Background of the Study ..................................................................................... 1
1.1.1 Out of Home Advertising .................................................................................... 3
1.1.2 Consumer Attitudes ............................................................................................. 4
1.1.3 Fast moving Consumer goods ............................................................................. 7
1.2 Research Problem ................................................................................................ 9
1.3 Objectives of study ............................................................................................ 12
1.4 Value of the study .............................................................................................. 12
CHAPTER TWO ....................................................................................................... 13
LITERATURE REVIEW ......................................................................................... 13
2.1 Introduction ....................................................................................................... 13
vi
2.2 Theoretical Foundation ...................................................................................... 13
2.2.1 Nudge Theory ................................................................................................... 13
2.2.2 Tri component theory ........................................................................................ 15
2.2.3 Attitude towards Ad Model ............................................................................... 17
2.3 Empirical Literature Review ............................................................................. 18
CHAPTER THREE ................................................................................................... 21
RESEARCH METHODOLOGY ............................................................................. 21
3.1 Introduction ....................................................................................................... 21
3.2 Research Design ................................................................................................ 21
3.3 Target Population .............................................................................................. 21
3.4 Sample Selection ............................................................................................... 22
3.5 Data Collection .................................................................................................. 22
3.6 Data Analysis .................................................................................................... 23
CHAPTER FOUR ...................................................................................................... 24
DATA ANALYSIS FINDINGS AND DISCUSSIONS OF FINDINGS ................ 24
4.1 Introduction ...................................................................................................... 24
4.2 Response Rate .................................................................................................. 24
4.3 Pilot Test Results ............................................................................................... 25
4.4 Demographic Information ................................................................................ 26
4.4.1 Gender of the Respondents ............................................................................... 26
4.4.2 Age bracket ........................................................................................................ 27

vii
4.4.3 Education Level ................................................................................................. 28
4.5 Descriptive Analysis .......................................................................................... 29
4.5.1 Awareness and Knowledge ............................................................................... 29
4.5.2 Feelings towards Billboards ............................................................................. 31
4.5.3 Attitude towards Billboards .............................................................................. 33
4.6 Inferential Statistics ........................................................................................... 34
4.6.1 Correlation Analysis .......................................................................................... 34
4.6.2 Regression Analysis ......................................................................................... 36
4.7 Discussion of the Findings ................................................................................ 39
CHAPTER FIVE ....................................................................................................... 41
SUMMARY, CONCLUSIONS AND RECOMMENDATIONS ........................... 41
5.1 Introduction ....................................................................................................... 41
5.2 Summary of Findings ........................................................................................ 41
5.3 Conclusion ......................................................................................................... 43
5.4 Recommendations ............................................................................................. 44
5.5 Limitations of the study ..................................................................................... 45
REFERENCES ........................................................................................................... 46
APPENDICES ............................................................................................................ 48
Appendix I: Questionnaire ........................................................................................... 48

viii
LIST OF TABLES
Table 4.1: Response Rate ............................................................................................ 25
Table 4.2: Reliability Test ........................................................................................... 26
Table 4.3: Awareness and Knowledge of Respondents .............................................. 30
Table 4.4: Feelings towards outdoor Advertising ....................................................... 31
Table 4.5: Attitudes towards Billboards ..................................................................... 33
Table 4.6: Correlation Analysis .................................................................................. 35
Table 4.7: Model Summary ........................................................................................ 37
Table 4.8: Analysis of Variance (ANOVA) ................................................................ 38
Table 4.9: Regression Coefficients ............................................................................. 39

ix
LIST OF FIGURES
Figure 4.1: Gender of the Respondents ...................................................................... 27
Figure 4.2: Age of Respondents ................................................................................. 28
Figure 4.3: Education Level of Respondents .............................................................. 29

x
ABBREVIATIONS AND ACRONYMS
CVI Content Validity Index
FMCGs Fast Moving Consumer Goods
KFC Kentucky Fried Chicken
OOH Out-Of-Home
SPSS Scientific Package for Social Sciences
xi
ABSTRACT
Marketers have been using advertisements not only to create awareness but also
achieve different objectives such as shifting consumer attitudes. Consumers are also
bombarded with lots of information through multiple media like newspapers,
magazines and internet but remain engaged from time to time hence lack time to
update themselves. This has made it difficult for advertisers to trap consumers hence
resort to outdoor messages to reach the target people. As a result this study sought to
establish the influence of out of home advertising on consumer attitudes in Fast
Moving Consumer Goods in Wetlands division, Nairobi County. The study adopted
Nudge theory, Tri component theory and Attitude towards ad model. The design
employed in the study was descriptive. The population of the study comprised of
residents of Westlands Area, Nairobi City County whereas purposive sampling was
employed to sample 100 respondents. Primary data was collected through
questionnaires in a Likert scale format. The data was analyzed quantitatively through
descriptive and inferential analysis such as means, standard deviation, and regression
analysis. The SPSS was used for analysis. The regression analysis findings showed
indicated a positive and significant influence of out of home advertising on consumer
attitude to purchase FMCGs in Westlands division, Nairobi County. The study
findings led to the conclusion that knowledge and awareness of billboards as a tool for
outdoor advertising positively and significantly affects consumer attitudes in Fast
Moving Consumer Goods. It was also concluded that feelings and attitudes of
consumers towards billboard advertising has a positive significant effect on consumer
attitudes in Fast Moving Consumer Goods. Accordingly, if consumers perceive
billboard advertising positively, they are likely to develop positive attitudes towards
Fast Moving Consumer Goods which would ultimately enhance their consumption of
the goods. The study findings led to the recommendations that producers of fast
moving consumer goods should focus more on out of home advertising such as use of
billboards as opposed to other forms of media like T.V and Radio to help boost
consumption and sale of their products. The study also recommends marketers of
FMCGs to enhance the knowledge and awareness of consumers with regard to
existence and location of billboards.

1
CHAPTER ONE
INTRODUCTION
1.1 Background of the Study
Consumer behavior deals with the various stages which consumers go through from
the time of purchase to consumption and post consumption. It is concerned with how
people make decisions regarding utilization of resources. Similarly, consumer
attitudes can be construed acquired tendencies by individuals to conduct themselves
in constantly favorable or unfavorable way regarding a give object (Jauhari 2007).
According to David, Yadav, and Donthu (2006), Conventional outdoor advertising
can be construed as marketing processes concerned with the use of such means as
publicly displayed billboards as well as posters. It is also called out-of-home (OOH)
advertising and has created more opportunities than threats by increasing
diversification of traditional media. With new practices such as digital out of home
and transit media, Out of home advertising stands out to be an efficient marketing
strategy of capturing consumers outside.
According to theory of reasoned action, three interrelated components are expected to
influence behavioral limitations. These include attitude, intentions and consumer
behavior. It also includes cognitive, affective and conative components (Ellen1999).
Fischbein’s model states that consumer attitudes towards a brand derive from the
belief about the attributes of the brands and their evaluations of these attributes (Trott
2000). The study will also be based on the Attitude towards ad model, which proposes
that the attitude a consumer adopts is governed by their belief that their actions will
result to a particular result, be it favourable or unfavourable (Liang 2004)

2
FMCGs are considered products that are fast selling at fairly low prices. They are
usually consumed regularly such that the stock turn over can be relatively high. They
usually have a short shelf life, attested to their high deterioration or high demand from
consumers. These include goods like sodas, backed products like cakes, toiletries,
meats and vegetables. In the Kenyan market, these goods have much more shelf
spaces in large retail shops such as supermarkets. However, small kiosks and
convenient stores are also known to stock these goods due to the high demand from
consumers. Individual vendors are also known to sell these goods along streets and
roads. Due to the nature of consumption, there exists cutthroat competition among
companies producing these goods, everyone wanting the lion’s share of the market.
This study will focus on the Nairobi Wetlands area. This area is populated by both the
high end and low end consumers each with a notable difference in purchasing power.
The Westland’s area is known to have many amenities including major schools,
luxurious apartments, major businesses and hotels. This has resulted in major retail
stores like Naivas and Tuskys having more than one outlet in the region. Other major
players in the fast food restaurants like KFC and Java have also highly invested in this
region. The major road, Waiyaki way, is a good catchment detail as it has eased the
infrastructure in the area not to mention the other interconnected roads in the area that
links wetlands to other parts of Nairobi. On the other hand, Kangemi slums, a well-
known informal settlement in the heart of Nairobi, also sat the heart of wetlands. The
diversity of population witnessed in Wetlands makes it a good reference in this study.
3
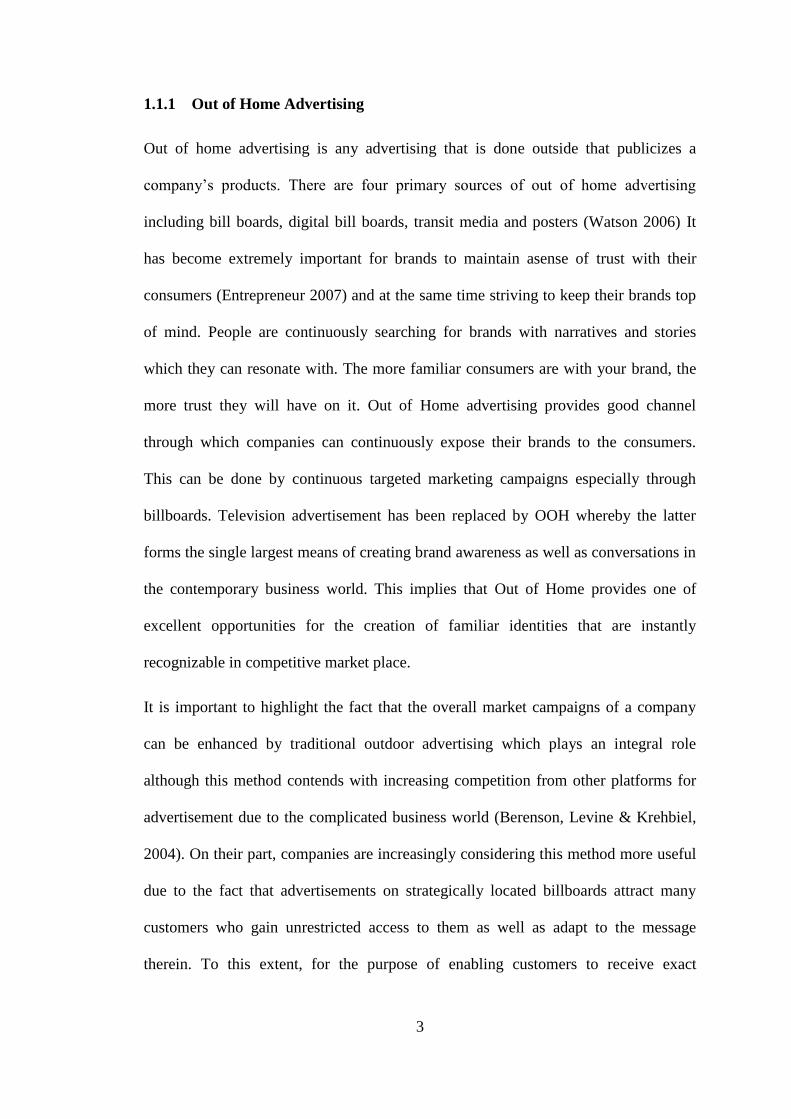
1.1.1 Out of Home Advertising
Out of home advertising is any advertising that is done outside that publicizes a
company’s products. There are four primary sources of out of home advertising
including bill boards, digital bill boards, transit media and posters (Watson 2006) It
has become extremely important for brands to maintain asense of trust with their
consumers (Entrepreneur 2007) and at the same time striving to keep their brands top
of mind. People are continuously searching for brands with narratives and stories
which they can resonate with. The more familiar consumers are with your brand, the
more trust they will have on it. Out of Home advertising provides good channel
through which companies can continuously expose their brands to the consumers.
This can be done by continuous targeted marketing campaigns especially through
billboards. Television advertisement has been replaced by OOH whereby the latter
forms the single largest means of creating brand awareness as well as conversations in
the contemporary business world. This implies that Out of Home provides one of
excellent opportunities for the creation of familiar identities that are instantly
recognizable in competitive market place.
It is important to highlight the fact that the overall market campaigns of a company
can be enhanced by traditional outdoor advertising which plays an integral role
although this method contends with increasing competition from other platforms for
advertisement due to the complicated business world (Berenson, Levine & Krehbiel,
2004). On their part, companies are increasingly considering this method more useful
due to the fact that advertisements on strategically located billboards attract many
customers who gain unrestricted access to them as well as adapt to the message
therein. To this extent, for the purpose of enabling customers to receive exact

4
information regarding products advertised, there is need to use appropriate platforms
to advertise products (Kotler et al. 2005).
1.1.2 Consumer Attitudes
Consumer behavior is a sequential process that consumers go through and each stage
can be influenced differently in order for a consumer to behave in a desired manner.
Initially consumers were thought to go through a straight line process which included
awareness, interest, desire and the final action. However, in the recent consumer’s
studies, consumers have been found to exude more complex behavior with a non-
hierarchical process. The study of consumer behavior examines the process through
which consumer make important decisions and ways by which consumers gather and
evaluate information from their environment (Solomon, 2013) The degree by which
consumers interact or involve themselves with different brands largely affects the
final decision to make a purchase. The level of importance of a product to a consumer
in terms of image, self-concept, etc. is reflected in the decision making process of
consumers.
The consumer is usually at the epicenter of a marketer’s universe whereby its
importance is highlighted by the vast field of consumer behavior. Consumers are
unique with regard to their needs, wants as well as buying choices. The choices of
each consumer as well as buying habits are also functions of psychological as well as
social drivers that jointly impact on the consumer’s decision making process
(Brassington & Pettitt, 2000). One of the processes of a successfully established
marketing strategy of a company that is deemed as its cornerstone is analysis of
consumer behavior by studying both the mental as well as emotional processes
alongside a consumer’s observable behavior in the stages of searching, buying and

5
post consumption of goods and services (Batra & Kazmi, 2004). Therefore, it is
imperative that companies make analysis of consumer decision making process an
important stage in examining consumer behavior.
Hawkins et al. (2001) view attitude as a collection of cognitive, motivational as well
as emotional processes with regard to one’s environment. The implication here is that
environmental stimuli through such processes as goods provided to consumers as well
as the manner in which the products are communicated to them underlines consumer
attitude development. As already defined, attitudes imply acquired tendencies to show
consistent favorable or unfavorable responses that often drives individual to
demonstrate relatively consistent behaviors with regard to the same objects
(Fischbein’s & Aizen, 1975). Attitudes are also more often than not determined by
values as well as beliefs attained overtime. On the other hand, Kahle (1986) argues
that the manner in which consumer perceive and utilize various products and services
is directly influenced by cultural values that also affects the kind of goals pursued by
individuals as well as the behaviors employed in pursuing the goals. It is on this basis
that values are recognized by marketing communication campaigns as advertising
themes that also provide adequate justifications to purchase products and services.
Winkler (2000) did a study on consumer attitude towards marketing activities in
Germany. The study was an inventory of how the consumer experiences and evaluates
modern marketing. It looked at whether consumers actually recognize and make use
of advertising as a source of information and how they judge advertising as a medium
of communication. The study used questionnaires to collect data from respondents. It
concluded that consumer discomfort with advertising does not result from
exaggeration of advertising rather it is consumers who doubt whether advertising
embodies the principle of truth. Jepchirchir (2014) undertook a study on packaging

6
attributes and consumer buying behavior of Fast Moving Consumer Goods in Kenya.
The study used questionnaires to collect data from shoppers from selected
supermarkets. The study concluded that packaging attributes examined, contribute in
communicating product quality and features in a manner that affects purchasing
behavior
Attitudes, being derivatives of several psychological processes are not directly
discernable but are derived from the actions and words of individuals and therefore
individuals have specific attitudes with regard to a variety of objects ranging from
behaviors that are product specific to those that are more general. The process of
assessing attitudes is therefore based on posing questions to individuals or through
inferring from their behaviors. Based on this, for the purpose of effective market
strategy development, marketing practices regulation as well as enhancing more
socially acceptable behaviors, comprehension of consumer attitudes is deemed key by
marketers who apply consumer behavior information to fashion effective marketing
strategies that are more competitive. The ultimate goal of most marketing managers is
therefore influencing the attitudes of consumers which is difficult to do directly as it is
difficult to directly influence the decisions of consumers to buy, use or even
recommend goods and services to other consumers. However, sale personnel, use of
packaging as well as advertisements are all means of marketing that appeal more to
consumers and therefore influence their purchasing decisions. Some of the processes
that directly influence consumers to purchase products include provision of
information regarding the products and services they intend to buy, physical evidence,
delivery processes, music and any other stimuli that can drive the beliefs or individual
feelings about a product.

7
1.1.3 Fast moving Consumer goods
Kenya’s FMCG sector has gained immensely from a predominantly increasing
demand for personal care products, food as well as beverages and has therefore
proved a key driver of the country’s quest for industrial growth which has resulted to
entry of foreign companies or augmentation of existing investment of these
companies. Among the top international firms that have entered the market as a result
of growing demand for FMCGs include USA based firms such as Coca Cola and
Wrigley Company and Pepsi. The FMCG sector is also expected to be kept stable due
to vigorous growth of the population coupled with growing middle class which
continue to suppress the effects of constant adjustments of the tax regime, competition
pressures as well as constant currency depreciation on the growth of FMCG sector.
Other factors that have also continued to enhance the growth and visibility of the
FMCG sector and consequently greater adaption to local consumption in addition to
demand include an increase in sales at formal retailers as well as more effective
product distribution channels. Burgeoning demand especially in the F&B as well as
personal care subsectors provides larger potential for expansion of the FMCG sector
making Kenya among the top ten countries in Africa. A report by KPMG (2014)
indicated that the FMCG sector continues to grow driven by a number of factors such
as burgeoning middle class, vibrant private, Population growth as well as a well-
educated workforce. On the other hand, some of the factors that continue to pose
major challenges to the sector according to the report include insecurity issues, high
inflationary tendencies as well as taxation.

8
Marketing FMCGs in Kenya requires more define and targeted marketing strategies
and plans. Today, more disposable income by consumers, increase in consumer
choices in addition to wholly innovative purchasing as well as spending patterns have
altered the demand for FMCGs. Consumers spending patterns are different depending
on age, geography and social status. Marketers need to close the gap between
consumer’s evolved needs and present marketing strategies they adopt. Today, 80%
of consumers believe in superior customer experience (Bain & Company 2103). Fast
Moving Consumer Brands can focus on achieving superior brand value, simply done
by ensuring that ingredients in the goods are safe for consumption. However,
marketers need to also realize that consumers have options and therefore they should
build stronger brands that will enhance consumer loyalty.
Nairobi’s Westlands is a social an entertainment hub majorly for expatriates as well as
rich Kenyans. The area is endowed with a constellation of shops, bars as well as fancy
restaurants with majority of the population being the youth that constitute 41.43% of
the entire population. Among these, 35.68% are less than 20 years while 61.85% of
are less than 30 years. This translates to an upsurge in the demand for products and
services that meet the needs of students which has exerted more pressure on the
existing facilities to provide these items. Westlands stands to be an economic hub
with high end living, luxurious hotels and major corporates and business. However,
the region also has low income areas including Kibagare, Kangemi and Waruku.
These areas are dominantly populated by residents involved in small scale businesses
and casual employments or unemployment. The informal settlements have improper
hygiene characterized with open sewers and poor drainage. There is also availability
of pipes water from the city council.

9
1.2 Research Problem
Advertisements not only create awareness but also are used to achieve different
objectives by the company like shifting consumer attitudes to ways more desired by
the companies. According to Belch and Belch (2009), advertisements impact the
attitude of consumers as well as their behaviors, preferences in addition to decisions
regarding the type of products to buy and therefore play a central part in the
marketing as well as overall sales. Consequently, potential consumers are attracted
more to more appealing advertisements as compared to those that lack any visual
appeal and therefore increase the likelihood of improving the sales of a product. The
implication here therefore is that for the purpose of creating an effective
advertisement, a marketer’s intention ought to be communicated to the consumers
clearly and should be aimed at specific consumer segment. The important role of
brand awareness is effectively created by outdoor advertising as a marketing strategy
which also improves the sales of a particular product. There are multiple sources of
product information available to consumers in the present day mainly by the use of
newspapers, magazines, billboards televisions and internet (Latiff & Aberdeen 2011).
However, people are engaged from time to time and they do not have time update
themselves. This has made it difficult for advertisers to trap consumers, so in these
circumstances, advertisers select billboards as an advertisement tool that effectively
conveys messages to the target people (Balkaf & Kortopu 2005).
In as much as Fast Moving Consumer goods has recorded increased growth in sales in
the past few years, the industry still remains a complicated industry whereby such
factors as political and financial instability, sale of counterfeit products as well as
ineffective supply chains continue to threaten its success. Availability of counterfeit
products which are mere copies of the original as well as proliferation of fake

10
products that are low in quality continues to pose a significant challenge in the FMCG
sector in Kenya.
Investors are also made aware of more stringent regulations that are meant to enhance
domestic protection in Kenya. Awareness of the different government restrictions and
tariffs are also impediment factors to FMCG companies in Kenya. In addition,
regional stability of the East African Community has also influenced the pricing in
addition to availability of FMCG suppliers and consequently affected sales volume.
Another factors that has hampered the operations of firms within the FMCG sector in
the region is ineffective supply chain system whereby poor infrastructure affects
transit of raw materials as well as finished products. Even though urbanization rates in
Kenya have risen, the distribution as well as transit of FMCGs is not supported due to
nonexistence of well-developed physical infrastructure.
OOH offers a brand safe environment with unparalleled view ability. Marketers
always want to communicate their message to consumers in order to influence their
behavior in ways suitable to the marketers. By this they adopt different marketing
tools to pass product information to targeted consumers. With companies leveraging
on this, billboards have been strategically developed using catchy creatives and placed
strategically along catchment areas with high human traffics and footfall. Major
highways like Thika road, Waiyaki way and Mombasa road have become lucrative
sited for OOH companies hence being cluttered by billboards. This advancement of
billboards in Kenya led to the entry of foreign companies like Alliance media, Havas
Africa all trying to get a share of the Kenyan market. OOH advertising in Kenya is
also adapting to certain trends like Digital OOH and transit media advertising. Motion
digital OOH captures the attention of audiences even better, they are twice more
likely to be seen and are more impactful compared to static OOH. Transit OOH on the
11
other hand is OOH media typically attached on the outside or inside of public
transport such as busses and taxis. In Kenya this has been witnessed by the branding
of city hoppas, Kenya busses and other public service vehicles. Companies like
Sportpesa, BetIn, Switch T.V among others have largely adopted this strategy.
A study by Kotler, Wong, Saunders and Armstrong (2005) indicated that OOH
influences the judgements, behavior, attitudes as well as preferences regarding
particular products by the use of clear visual manifestation of these products.
According to the scholars Carson, Gilmore, Perry and Gronhaug (2001), the
explanations for painting products using bright colors is based on the fact that an
increase or reduction of the appeals of any outdoor advertisement to consumer is
determined by the nature as well as the design of the advertisement. Additionally,
some of the common means of carrying out outdoor advertisements include erection
of billboards as well as large posters, brochures in addition to flyers. Creation of the
sought after visual as well as audio appeals to potential customers that is attained by
the use of a combination of several methods of displaying information on specific
products is the most recent outdoor advertisement trend.
A number of local studies have been done on outdoor advertising locally. Achieng
(2009) looked at the effectiveness of billboard advertising, Muchai (2011) wrote on
persuading Kenya youths, an analysis of the use of sex appeal on bill boards in
Nairobi. Gitamu (2014) looked at the development of outdoor advertising application
for Kenya business, Irumu (2011) considered the effectiveness of out of home
advertising of residential houses in Nairobi and lastly Ouma (1999) highlighted the
factors considered important in the successful usage of an outdoor advertising
program. This study focused on understanding how out of home advertising
influences consumer behavior.

12
1.3 Objective of study
The objective of the study was to establish the influence of out of home advertising on
consumer attitudes in Fast Moving Consumer Goods in Wetlands division, Nairobi
County.
1.4 Value of the study
In practice, the study leverages the role that out of home advertising plays in shaping
consumer attitudes. The study benefits many stakeholders like marketing managers,
marketing agencies, policy makers and scholars among others. Policy makers like
government regulatory agencies may benefit from this study as the findings of this
study could be used to determine various aspects of out of home advertising like
licensing of billboards and billboard placements. Marketing managers and agencies
may also benefit from this study as it advises them in the efficacy of billboards when
it comes to influencing consumer behavior. This study also forms a basis of future
references to scholars, students and others on the concept of consumer behavior. In
addition the knowledge of this study can also be used in the building of relevant
theories in the areas of out of home advertising and consumer attitudes.

13
CHAPTER TWO
LITERATURE REVIEW
2.1 Introduction
This chapter presents a literature summary on consumer attitudes towards out of home
advertising. It describes the theoretical framework, the concept of out of home
advertising.
2.2 Theoretical Foundation
This study is anchored by the Nudge theory, Tri component theory and Attitude
towards ad model
2.2.1 Nudge Theory
A thought in economics, behavioral science, as well as political science, nudge theory
states that decision making processes as well as motives of individual persons and
groups are relatively more effectively influenced by positive reinforcement in addition
to indirect suggestions, whereby non-forced compliance is attained, as compared to
direct instructions, enforcements as well as legislations. This more flexible as well as
contemporary change management perspective seeks to provide comprehension of the
manner in which people think, behave, and make their own decisions besides enabling
them to boost their thinking and decision making processes and adapt to different
changes.
Another useful application of the nudge theory is in exploring for the purpose of
comprehending and providing an account for prevailing influences regarding the
manner in which individuals behave in particular unhelpful influences with an aim of
eliminating or lessening them. Accordingly, the theory seeks to provide an

14
improvement in the comprehension as well as management of 'heuristic' influences on
human behavior that is considered key in changing individuals. The main concern of
the nudge theory is in creation of choices that affect the kind of decisions people
make and advocates design of choices based on actual thought and decisions
processes rather than the manner in which leaders and others in authority traditionally
and rather incorrectly believe individuals think and make decisions. Unlike the
conventional methods of achieving change in individuals such as use of punishment,
direct instruction as well as enforcement, nudge theory differs as it is a more
complicated approach of attaining the desired change in individuals. Its application is
therefore understood in light of providing indirect encouragement in addition to
individual enablement thereby shunning direct instruction.
One of the key foundations of nudge theory is its general acceptance of possession of
different attitudes, knowledge as well as capabilities and, unlike autocratic methods
allows for such traits. It therefore provides flexible grounds to allow and understand
the realism of different situations in addition to different human tendencies which is a
sharp contrast to more conservative methods such as forcible direct instruction that
does not take into account the reality of situations. Fundamentally, therefore, the
theory works through creation of different choices for individuals to spur more
positive decisions by the ones choosing and by extension the overall interests of the
society as well as the environment. Moreover, this theory provides a more effective
method for identification, analysis as well as readjustment of prevalent choices
presented to individuals by different authorities.

15
Some of the key areas in which nudge principles as well as techniques are being
widely applied include communications, marketing, in addition to the motivation of
groups, business, economics, education, marketing, organizational leadership, politics,
selling and welfare.
2.2.2 Tri component theory
Tri component attitude model proposed by Howard and Sheth (1990) states that
individual attitudes are made of three components that keep a somewhat steady as
well as a balanced connection to one another. These three constituents of human
attitude are the cognitive, affective and conative component and they jointly form an
individual’s attitude concerning an object and also exhibit a tendency of being
consistent (Boone & Kurtz, 2004). Cognitive consistency principles state that
individual consumers place great value in the harmony among their thoughts as well
as feeling and are therefore inspired to maintain consistency (Solomon, 2002). This
implies that for individuals to remain consistent with their experiences, they
constantly alter their thoughts, feelings as well as behaviors which provides a
consistency principle that serves to remind people that attitudes are not fashioned in
vacuum. How an object fits with respect to other existing attitudes thus determines
how it is evaluated by a consumer which forms the main basis for a considerable
volume of marketing strategies (Dabholkar, 1994)
The cognitive component can be construed as an individual’s knowledge, beliefs, and
opinions regarding an object. It is the individual’s collection of both information as
well as knowledge regarding an object. Knowledge and perceptions thus form an
individual’s cognition and they are attained through a mix of attitude-object
experience as well as associated from derived from different sources. Beliefs often

16
form the basis for knowledge in addition to resulting perceptions whereby an
individual is made to believe that attitude-object is made of various attributes in
which case specific behaviors spontaneously result to specific outcomes. In this
regard, brand equity is enhanced by the use of positive brands attained by several
positioning strategies. According to Berkman et al (1996), brand associations enable
marketers to establish in addition to prompting favorable beliefs concerning a
particular brand while at the same time prompting unfavorable beliefs about
competitors because the beliefs concerning a particular object has a tendency of
controlling any attitude change.
The affective component is concerned with the feelings, evaluation, or emotions about
attitude object and appeals to the emotional content thereby arousing object likes or
dislikes (Chisnall, 1975). Personality traits, social norms as well as motives yield
these kind of individual feelings. Typically, motions in addition to feelings are treated
by consumer researchers as being as principally evaluative which means that perceive
a consumer’s direct evaluation of attitudes upon which one rates the attitude-object as
favorable or unfavorable. It is on this basis that manifest emotional states enhance
either positive or negative experiences which also upon subsequent recollection can
influence how an individual acts upon what comes to mind. The conative component
reflects behavioral tendencies toward the attitude object. Conation is construed as an
attempt to do something. It demonstrates the propensity of a consumer to undertake or
refrain from a particular action or show certain behaviors based on attitude-object.

17
2.2.3 Attitude towards Ad Model
According to the attitude towards Ad Model, due to acquaintance to advertisements, a
variety of feelings as well as cognition are formed by consumers of different products
and this in turn influences the manner in which consumers show attitude regarding the
advertisement as well as the particular brand. This model puts a significant influence
alongside different variables that include credibility, ad perceptions in addition to
attitudes with regard to the advertiser and the general mood (Mackenzie & Lutz,
1989). By moderating the relationship among several measures of advertising
effectiveness, the model plays a central role as it influences intention to purchase and
brand attitude. There is a total of four likely specifications of the causal role of Aad
which are all founded on an overall effects framework hierarchy.
The four alternative advertising attitude models of dual mediation, reciprocal
mediation, affect transfer and independent influences hypotheses tend to account for
the manner in which antecedent variables associated with advertising outcomes tend
to be mediated by attitude toward advertising. A direct influence of Aad attitude on
Ab which is also a direct causation process is assumed by the affect transfer while the
attitude transfer which is the mostly researched model and assumes a positive linear
relationship between Aad and Ab which has been substantiated empirically. DMH
provides an account of both of the relationships whereby it combines direct and
indirect one-way causation. According to DMH, the tendency of consumers to accept
the advertisement statements regarding a brand is influenced by the affective
responses of the consumer which means that there is a direct linear association
between feelings towards ad and claims about the ad remembered by the consumer.
18
Reciprocal mediation hypothesis points to an existence of a direct relationship
between Aad and Ab based Heider (1946) balance theory which contends that
individuals strive to maintain their cognitive balance. Accordingly, a balanced
configuration only exists whenever there are similar parts of a causal unit. In this case,
strengths of the reciprocal mediation hypothesis provide a precise account of the
inherent differences that are dependent on situations as well as individual consumers.
An example introduction of a new product will see a relatively stronger Aad to Ab
flow due to the fact that an advertisement first serves the purpose of exposing a
consumer to a brand. On the other hand, the independent influence hypothesis is
based on the assumption that there is no association between Aad and Ab but they
independently influence the intention to purchase by a consumer. Its concepts are
founded on an adjustment of the discrepancy between brand concept and impersonal
attitude which was originally put forward by Howard (1977). According to him,
situational pressures play an integral part in purchase.
2.3 Empirical Literature Review
Several studies conducted internationally as well as locally that are related to the topic
of study. Globally, (Barrault 2006) carried out a study on consumers to establish their
attitudes towards coupons in France. The study aimed to obtain a better knowledge on
the consumers’ attitude couponing promotions. It also aimed to get the motives or
restraints towards couponing as well as people not using them. Data was collected
using questionnaires, which were given to housewives in households in France. The
study concluded that there was no unfavorable reaction against coupons either from
retailers or from consumers. Lunn (2005) did a study on attitudes and behavior in
consumer research. R=the purpose of the study was to provide an overview of the
current position in consumer attitude research with particular reference to the attitude

19
behavior controversy. The study adopted both qualitative and quantitative methods in
which in depth interviews were used and factor analysis used to get results.
Putschi (2007) also conducted a study on consumer attitudes towards instructions in
the pharmaceutical industry in Austria. The study showed the actual interest patients
feel towards instructions and the difficulties they face towards trying to understand
the instructions accurately. A survey was conducted for this study. The study
concluded that consumers generally are unable to understand properly the
explanations given for medication properly which makes them worry about side
effects. Winkler (2000) did a study on consumer attitude towards marketing activities
in Germany. The study was an inventory of how the consumer experiences and
evaluates modern marketing. It looked at whether consumers actually recognize and
make use of advertising as a source of information and how they judge advertising as
a medium of communication. The study used questionnaires to collect data from
respondents. It concluded that consumer discomfort with advertising does not result
from exaggeration of advertising rather it is consumers who doubt whether
advertising embodies the principle of truth.
Locally, studies have also been done relating to the topic. Munene (2000) carried out
a study investigating attitudes towards opaque beer and the factors which would
influence its sales performance. The study aimed at providing in depth understanding
of opaque beers and how people view them. The study collected data through
personally administered questionnaires. Data was analyzed through descriptive
statistics like percentages and frequency tables. It concluded that the public had a
negative attitude towards opaque beer due to the effects it had on society like loss of
lives. Jepchirchir (2014) undertook a study on packaging attributes and consumer
buying behavior of Fast Moving Consumer Goods in Kenya. The study used

20
questionnaires to collect data from shoppers from selected supermarkets. The study
concluded that packaging attributes examined, contribute in communicating product
quality and features in a manner that affects purchasing behavior.
Nyarunda (2016) undertook a study on consumer attitudes and patronage towards
purchase of imported vs locally produced apparel in Nairobi. The objective of the
study was to find out attributes considered in selecting apparel and determining public
servants’ perceptions towards locally produces and imported apparel. The study
conducted a survey which was conducted within Nairobi. Primary data was used in
this study and it was obtained by the use of questionnaires. The study conclusions
indicated lack of difference with regard to the attributes considered by consumers to
select apparel with imported and locally produced clothing viewed in the same
standards.

21
CHAPTER THREE
RESEARCH METHODOLOGY
3.1 Introduction
This chapter presents the research methodology that was applied in this study and the
procedure used in the study. Specifically, it highlights the research design, population
of the study, sampling technique, data collection methods and analysis techniques that
were used to draw insights from the data.
3.2 Research Design
A descriptive design refers to a scientific design that comprises of observation as well
as vivid description of a subject’s behavior that does not influence the subject at all
(Makenzie 2003). In circumstances where the possibility of testing as well as
measuring a mass volume of items required to conduct a quantitative experimentation
is not available, a descriptive research design usually proves more useful than other
research designs. It is important to highlight the fact that the outcomes of a descriptive
research provide a less definitive answer or hypothesis disapproval due to the
limitations that are encountered during research but also acknowledge the usefulness
of such findings in as far as various fields of research are concerned. According to
Nolah (2000), different descriptive measures are applied to summarize data such as
mean, standard deviation, mode, percentage as well as correlations between variables.
3.3 Target Population
A population refers to a group of individuals, objects or items with common
characteristics from which data is collected for analysis (Kombo and Tromp 2003).
The population of this study comprises of all residents of Westlands Area, Nairobi

22
City County. Westlands area is high economy area populated by the upper middle and
middle class. The area has many food joints and major shopping malls like Sarit
center and Westgate mall. This is because of the high purchasing power that the
residents have.
3.4 Sample Selection
This study employed judgmental sampling technique also called purposive sampling
which according to Sauller (2005) can be construed as non-probability sampling by
which a researcher uses their own knowledge as well as professional judgement to
choose sample units. This type of sampling technique is appropriate in selection of
representative sample that can convey the desired results more accurately as
compared to probability sampling. It involves purposely selecting sample units from a
given population on the basis of a researcher’s professional knowledge as well as
judgement which rules out application of probability sampling techniques. Fraenkel
and Wallen (2002) recommend a minimum of 100 subjects and a maximum of 1,000
for descriptive studies. This recommendation was used as a guide for the sample size
of 100 people, split equally between female and male. A sample size of between 100
and 1000 is a good representative of the target population for adequate analysis
(Mugenda & Mugenda, 2003).
3.5 Data Collection
Mall intercept method of data collection was applied in this study. This process
involves interviewer stopping or intercepting individuals who are passing by and
seeking to know if they would be willing to take part in a study whereby those who
oblige are interviewed in a facility set aside for the interview (Kheller 2008). Some of
the step involved in the method intercept method include stopping shoppers, probing

23
them to determine whether they are appropriate for the study and then either inviting
them to the interview facility or administering the interview on spot. Despite the fact
that shopping mall customers are generally less representative of the entire
population, they still make up majority of the consumers of different products and can
therefore be involved in a study of this kind.
3.6 Data Analysis
The purpose of carrying out data analysis is to explicate on the data collected
therefore attaching more meaning and usefulness of the data by bringing out better
structure and orderliness of the information. According to Kombo and Tromp (2006)
data analysis is the process of examining the information that has been obtained
during research and seeking to draw deductions as well as make inferences.
According to Ary, Jacobs and Razavieh (2002), the three basic steps of data analysis
are organization of data, interpretation of the findings and summarization of the
findings. For this study, SPSS was used to process the data collected after it was
edited and coded appropriately. Some of the descriptive statistics that were computed
and used in summarizing the findings for various variables of interest are frequencies,
mean scores, percentages as well as standard deviation. The study further used
correlation as well regression techniques whereby mean scores of the variables were
run to determine the associations among the variables.
24
CHAPTER FOUR
DATA ANALYSIS FINDINGS AND DISCUSSIONS OF FINDINGS
4.1 Introduction
Results as well as findings of the information obtained during research are presented
in this chapter. These findings are presented under various subsections which include
results on the demographic information of the respondents including their gender, age
and level of education followed by descriptive findings on the different objectives of
the study. The informed was obtained from questionnaires which was the main data
collection tool. Correlation as well as regression statistics are also presented in this
chapter to capture the relationship among the variables of the study.
4.2 Response Rate
It was noted that out of the 100 questionnaires give out to the consumers in Westlands
division, 80 questionnaires were completed which provided a response rate of 80%.
This response rate is deemed by several researchers as satisfactory for the purpose of
drawing inferences and making conclusions (Mugenda & Mugenda, 2003).
Accordingly, a response rate of 50% is deemed adequate, 60% is deemed good while
any response rate above 70% considered excellent (Bailey (2000). Data analysis based
on the current response rate was therefore justifiable based on the affirmation by
Mugenda et al (2003). The results are as presented in Table 4.1.

25
Table 4.1: Response Rate
Response rate Frequency Percentage
Complete Questionnaires 80 80%
Incomplete questionnaires 20 20%
Total 100 100%
Source: Primary data
4.3 Pilot Test Results
Questionnaires which were the min instruments used to obtain data for this study were
given to specialists for the purpose of establishing their validity as they used their
experience to evaluate the pertinence of each of the items of the questionnaire. A
rating of 1-4 was adopted with 1 considered very relevant and 4 not very relevant.
CVI, which is applied to establish validity, was obtained by summing up items that
were rated 3-4 and dividing the value by the sum of questionnaire items. This analysis
yielded a CVI value of 0.759 which was above the 0.7 threshold recommended as
acceptable to adopt the research tool (Oso & Onen, 2009).
Likert scale items were formulated in the questionnaire whereby SPSS was used to
ascertain the reliability using Cronbach’s alpha that normally ranges from 0-1.
Accordingly, a Cronbach’s alpha value that is more than the commonly set threshold
of 0.7 indicates reliability (Cooper & Schindler, 2008). As indicated on table 4.2, all
the coefficients exceeded the threshold of 0.7, the study concluded that the instrument
was reliable with adequate Cronbach’s alpha values and therefore confirmed the
suitability of the research tool.

26
Table 4.2: Reliability Test
Scale Cronbach's Alpha Number of Items Comment
Awareness and Knowledge 0.752 6 Reliable
Feelings towards billboards 0.796 10 Reliable
Attitude towards billboards 0.801 5 Reliable
4.4 Demographic Information
This section presents demographic results which provide more general information
with regard to the participants of the study. Some of the key demographic factors that
this study sought to establish were age, gender of the respondents and the highest
level of education. The findings are presented on each of these factors by the use of
figures and tables.
4.4.1 Gender of the Respondents
In order for the study to establish the gender disparity among the respondents,
questionnaire information was analyzed to establish if there is gender disparity of the
consumers in Westlands division. From the findings as indicated in Figure 4.1, there
was an equal split of 50% each between both males and females.

27
Figure 4.1: Gender of the Respondents
4.4.2 Age bracket
From the findings, majority of the participants of the study were aged between 26-35
years. This was noted as it made up the highest frequency of the respondents 22 stated
so, and resulted to 28.8%. Closely after were respondents aged between 18- 25 years
which covered 27.5%. This age bracket was noted to have a frequency of 22
respondents. 20.0% of all the respondents were aged between the ages of 36 and
45years determined from a frequency of 16 respondents. 15% of the respondents
stated that they were aged between 46-54 years old with a frequency of 12
respondents while the least group was of respondents aged above 55 years (frequency
7). The general inference that was made from this section is that the respondents were
old enough to provide dependable perceptions that were applicable to the study.
Male,50
Female,50

28
Figure 4.2: Age of Respondents
Source: Primary data
4.4.3 Education Level
Findings in this section indicated that majority of the respondents (28.8%) indicated
undergraduate as their highest form of education. This was closely followed by
college diploma calculating to 26.3% with a frequency of 21 respondents.23.8% of
the respondents stated their highest level of education to be Secondary school
calculating to a frequency of 19 respondents. This was followed by 13.8% of the
respondents having post graduate degrees as their highest level of education
translating to a frequency of 11 respondents. The least percentage were respondents
who attained primary school level to be their highest level of education calculating to
6 respondents. From these findings, this study inferred that majority of the
participants of the study had adequate level of academic qualification with sufficient
knowledge and therefore provided the study with reliable theoretical information
involving the research topic.
0
5
10
15
20
25
30
18-25 26-35 36-35 46-54 Above 55
Pe
rce
nt
Age bracket

29
Figure 4.3: Education Level of Respondents
Source: Primary data
4.5 Descriptive Analysis
The study established the influence of outdoor advertising on consumer attitudes in
fast moving consumer goods in Westlands division, Nairobi County. The respondents
were required to provide their own rating on their feelings regarding different
variables in connection to their attitude on outdoor advertising in a five point Likert
scale.
4.5.1 Awareness and Knowledge
The study determined whether awareness and knowledge had any influence on
outdoor advertising on consumer attitudes in FMCGs in Westlands division. Table 4.3
presents the findings.
0
5
10
15
20
25
30
Pe
rce
nt
Education level

30
Table 4.3: Awareness and Knowledge of Respondents
Statement N MEAN STD.DEV
I am aware of what a billboard is 80 4.24 0.767
I am aware of where I see billboards 80 4.14 0.882
I am aware of different billboard suppliers 80 2.56 1.041
I am aware of billboard placements in Westlands area 80 4.00 0.941
I am aware of different types of billboards 80 2.40 1.109
I am aware of the different advertisements placed on
billboards 80 4.11 0.886
Source: Primary data
From the results presented, there was an indication by majority of the respondents that
they were aware of what billboards are. This was noted by the highest mean of highest
mean of (4.24) meaning that majority strongly agreed that they were aware of outdoor
advertising. The standard deviation value of 0.767 indicated a dismal variation in the
responses provided on the statement. Similarly, majority strongly agreed that they
were aware of the different advertisements placed on billboards. This was supported
by the mean value calculated of 4.11. The standard deviation value of 0.866 indicated
a dismal variation in the responses provided on the statement. The study’s majority
respondents also pointed out that they were aware billboard placements in Westlands
division whereby the mean value to this effect was 4.00. The standard deviation of
0.941 derived by SPSS pointed out that majority of the respondents were of a similar
opinion. The study also noted that some of the respondents indicated that they were
not aware of the different billboard suppliers confirmed by a mean value of 2.56.

31
Winkler (2000) study also looked at whether consumers actually recognize and make
use of advertising as a source of information and how they judge advertising as a
medium of communication. It concluded that consumer discomfort with advertising
does not result from exaggeration of advertising rather it is consumers who doubt
whether advertising embodies the principle of truth.
4.5.2 Feelings towards Billboards
The influence of outdoor advertising on consumer attitudes in FMCGs in Westlands
division was determined by this study. Table 4.4 presents the findings.
Table 4.4: Feelings towards outdoor Advertising
Statement N MEAN STD.DEV
I like billboards because they provide information 80 3.58 1.230
Billboards are a sufficient way of getting information about
products 80 4.24 0.767
It easy to get information from billboards 80 2.63 1.036
It is cumbersome to identify billboards on busy areas 80 2.45 1.135
I will definitely buy a fast moving consumer good I have seen
on a billboard 80 4.05 0.940
Billboards are favorable for advertising 80 4.24 0.767
Fast moving consumer goods advertised on billboards are good
quality 80 2.75 0.974
One is hesitant to buy fast moving consumer goods seen on
billboards 80 2.63 1.036
Fast moving consumer goods do not advertise on billboards
because it is expensive 80 2.75 0.974
Seeing an advertisement on a billboard makes you more
confident about FMCG 80 4.05 0.940

32
Based on the analysis in Table 4.4, it was noted that majority of the respondents
strongly agreed that billboards are favorable for advertising. This was noted true from
a mean of 4.24. Also established in the analysis was that majority of the respondents
indicated that Billboards are a sufficient way of getting information about clients
confirmed a calculated mean of 4.24. The standard deviation of 0.767 provided an
indication that the responses among the respondents did not vary greatly. The study
also established that most respondents strongly agreed that they will definitely
purchase FMCG they saw on a billboard whereby the mean value was 4.05 and the
standard deviation of 0.940 confirmed that respondents had close to similar opinion
regarding the statement.
Most respondents also agreed that seeing an advertisement on a billboard would make
them more confident about FMCGs having a mean of 4.05. The study pointed out that
majority disagreed that billboards provide sufficient information. This was noted so
by the mean of 3.58. The standard deviation of 1.20 was an indication of low variation
of the responses to the statement. The study concurred with Nyarunda (2016) who
undertook a study on consumer attitudes and patronage towards purchase of imported
vs locally produced apparel in Nairobi. The study conclusions indicated lack of
difference with regard to the attributes considered by consumers to select apparel with
imported and locally produced clothing viewed in the same standards.

33
4.5.3 Attitude towards Billboards
The study further determined the influence of outdoor advertising on FMCGs in
Westlands division. Table 4.5 presents the findings.
Table 4.5: Attitudes towards Billboards
From the results obtained as illustrated in the above table, majority of the respondents
strongly agreed that billboard advertising has improved their attitudes towards fast
moving consumer goods. This was represented by a mean of 4.11 and standard
deviation of 0.886. From the analysis done, it also showed that majority of the
respondents agreed that billboard advertising increased their consumption of fast
moving consumer goods having a mean of 3.50 and a standard deviation of 1.41.
SPSS analysis also showed that a mean of 2.96 of the respondents indicated that
billboard advertising is a more effective way of advertising as compared to other
methods of promotion, giving a standard deviation of 1.263. According to table 4.4 it
indicated that consumers will agree purchase a product they have seen on a billboard
to a moderate extent; mean of 2.75 and a standard deviation of 0.974.
Statement N MEAN
STD.
DEV
I definitely will buy a product I have seen on a billboard 80 2.75 0.974
The fast moving consumer goods I take are advertised on
billboards 80 2.75 0.974
Billboard advertising is way more effective than other
forms of promotions 80 2.96 1.263
Billboard advertising has improved my attitude towards
fast moving consumer goods 80 4.11 0.886
Billboard advertising has increased my consumption of
fast moving consumer goods. 80 3.50 1.141

34
The study fining support those of Munene (2000) who carried out a study
investigating attitudes towards opaque beer and the factors which would influence its
sales performance. The study concluded that the public had a negative attitude
towards opaque beer due to the effects it had on society like loss of lives. Similalarly,
the finding concurs with those of Jepchirchir (2014) who undertook a study on
packaging attributes and consumer buying behavior of Fast Moving Consumer Goods
in Kenya. The study concluded that packaging attributes examined, contribute in
communicating product quality and features in a manner that affects purchasing
behavior.
4.6 Inferential Statistics
Results of inferential statistics are presented under this section whereby the strength
of the association between the variables of the study i.e. Awareness & Knowledge,
Feeling and Attitude towards billboards advertising and attitude to purchase the
FMCGs was measured by correlation while significance of each of the independent
variables on consumer attitude to purchase FMCGs was established through
regressions analysis.
4.6.1 Correlation Analysis
The Pearson correlation coefficient was used in this study and measured the strength
of the association between two variables. The Pearson correlation coefficient (R) was
used to measure the strength of the correlation between Awareness and Knowledge of
billboards, feelings towards billboards and attitude towards billboards which were the
independent variables against dependent variable which was consumer attitude to
purchase FMCGs. This was done using the responses to the questions in each of the
sections. The values are computed within a range of -1 to +1. To establish the
35
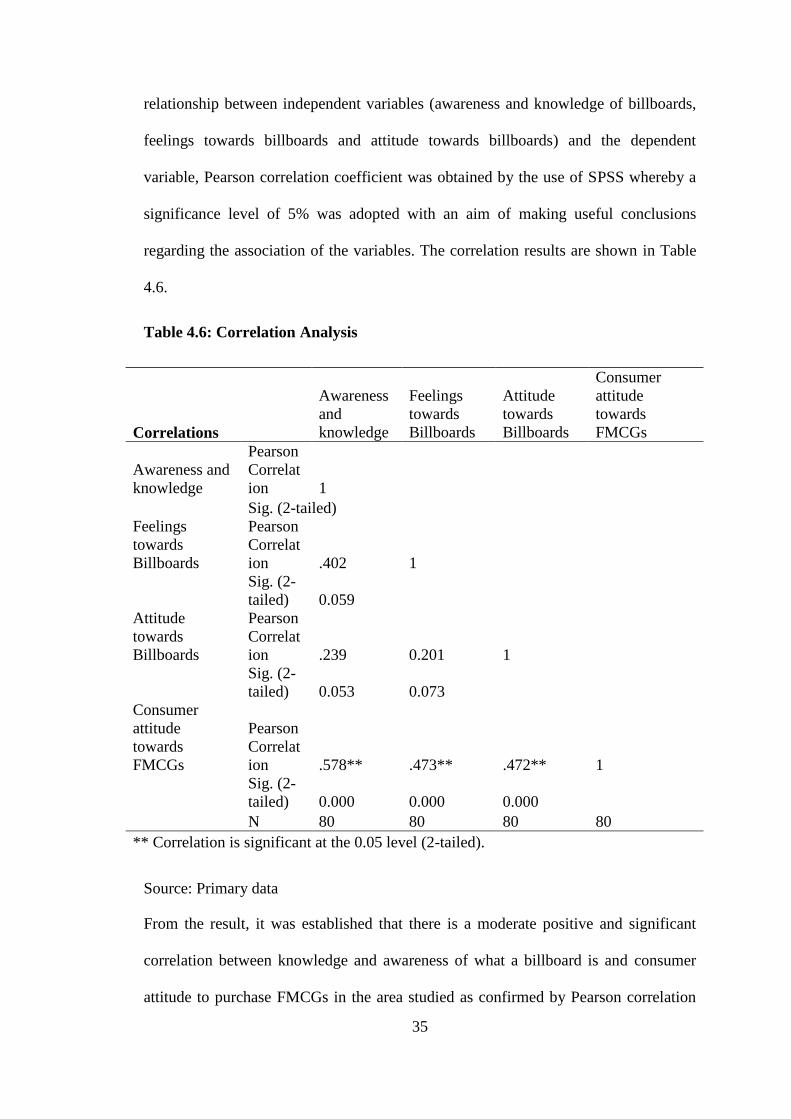
relationship between independent variables (awareness and knowledge of billboards,
feelings towards billboards and attitude towards billboards) and the dependent
variable, Pearson correlation coefficient was obtained by the use of SPSS whereby a
significance level of 5% was adopted with an aim of making useful conclusions
regarding the association of the variables. The correlation results are shown in Table
4.6.
Table 4.6: Correlation Analysis
Correlations
Awareness
and
knowledge
Feelings
towards
Billboards
Attitude
towards
Billboards
Consumer
attitude
towards
FMCGs
Awareness and
knowledge
Pearson
Correlat
ion 1
Sig. (2-tailed)
Feelings
towards
Billboards
Pearson
Correlat
ion .402 1
Sig. (2-
tailed) 0.059
Attitude
towards
Billboards
Pearson
Correlat
ion .239 0.201 1
Sig. (2-
tailed) 0.053 0.073
Consumer
attitude
towards
FMCGs
Pearson
Correlat
ion .578** .473** .472** 1
Sig. (2-
tailed) 0.000 0.000 0.000
N 80 80 80 80
** Correlation is significant at the 0.05 level (2-tailed).
Source: Primary data
From the result, it was established that there is a moderate positive and significant
correlation between knowledge and awareness of what a billboard is and consumer
attitude to purchase FMCGs in the area studied as confirmed by Pearson correlation

36
coefficient of 0.578 and a level of significance of 0.000 which is below the level of
significance threshold for this study (0.05). This implies that an increase in knowledge
and awareness of what a billboard is would result to significant increase in
consumption of FMCGs. Similarly, the findings of the study established that there is a
moderate positive and significant correlation between feelings and attitude towards a
billboard and consumer attitude to purchase FMCGs as confirmed by Pearson
correlation coefficients of 0.473 and 0.472 respectively at 0.05 level of significance.
This implies that an improvement in feelings and attitude towards billboards would
result to significant increase in consumption of FMCGs.
The study fining support those of Munene (2000) who carried out a study
investigating attitudes towards opaque beer and the factors which would influence its
sales performance. The study concluded that the public had a negative attitude
towards opaque beer due to the effects it had on society like loss of lives. Similalarly,
the finding concurs with those of Jepchirchir (2014) who undertook a study on
packaging attributes and consumer buying behavior of Fast Moving Consumer Goods
in Kenya. The study concluded that packaging attributes examined, contribute in
communicating product quality and features in a manner that affects purchasing
behavior.
4.6.2 Regression Analysis
The study also used multivariate regression to examine association between
knowledge and awareness of billboards, feelings towards billboards and attitudes
towards billboards and consumer attitude to purchase FMCGs. The following
regression model was used: Y= β0 + β1X1 + β2X2 + β 3X3 + ε Where; Y = consumer
attitude towards FMCGs, X1 = knowledge and awareness of billboards, X2= feelings

37
towards billboards, X3= attitudes towards billboards. The regression analysis
summary results presented in Table 4.7 indicated that the coefficient of correlation
(R) was 0.709 which implies that knowledge and awareness of billboards, feelings
towards billboards and attitudes towards billboards have a strong positive association
with consumer attitude to FMCGs. The results also indicated that the coefficient of
determination (R squared) was 0.503 which implies that 50.3% of the variation in
consumer attitude towards FMCGs in Westlands division is explained by out of home
advertising represented by knowledge and awareness of billboards, feelings towards
billboards and attitudes towards billboards.
Table 4.7: Model Summary
R R Square Adjusted R Square
Std. Error of the
Estimate
.709 0.503 0.483 0.26807
a Predictors: (Constant), Attitude towards Billboards, Feelings towards Billboards,
Awareness and knowledge of billboards
Source: Primary data
The study also established the model significance through ANOVA. The findings are
shown in Table 4.8. The findings indicated that the regression model linking
knowledge and awareness of billboards, feelings towards billboards and attitudes
towards billboards and attitude of the consumers to purchase FMCGs in Westlands
division was significant (Sig = 0.000). This implies that out of home advertising
through use of billboards can predict the attitude of the consumers to purchase
FMCGs in Westlands division significantly.

38
Table 4.8: Analysis of Variance (ANOVA)
Sum of
Squares df
Mean
Square F Sig.
Regression 5.518 3 1.839 25.594 .000
Residual 5.462 76 0.072
Total 10.98 79
a Dependent Variable: Consumer attitude to purchase FMCGs
b Predictors: (Constant), Attitude towards Billboards, Feelings towards Billboards,
Awareness and knowledge of billboards
Source: Primary data
The findings also established the regression coefficients as shown in Table 4.9. The
findings revealed that knowledge and awareness of billboards have a positive and
significant impact on consumer attitude towards FMCGs (Beta = 0.0.34, Sig = 0.000).
This implies that an increase in knowledge and awareness of billboards by one unit
leads to 0.34 unit increase in consumption of FMCGs. The findings also revealed that
attitude by consumers towards billboards have a positive and significant impact on
consumption of FMCGs (Beta = 0.195, Sig = 0.000).
This implies that an improvement in the attitude towards billboards by one unit would
result to 0.195 unit increase in consumption of FMCGs. Feelings towards billboards
had a positive and significant impact on consumption of FMCGs (Beta = 0.189, Sig =
0.007). This implies that an improvement in the feelings towards billboards by one
unit would result to 0.189 unit increase in consumption of FMCGs. The study fining
support those of Munene (2000) who carried out a study investigating attitudes
towards opaque beer and the factors which would influence its sales performance. The
study concluded that the public had a negative attitude towards opaque beer due to the
effects it had on society like loss of lives. Similalarly, the finding concurs with those
of Jepchirchir (2014) who undertook a study on packaging attributes and consumer
buying behavior of Fast Moving Consumer Goods in Kenya. The study concluded

39
that packaging attributes examined, contribute in communicating product quality and
features in a manner that affects purchasing behavior.
Table 4.9: Regression Coefficients
Unstandardized
Coefficients
Standardized
Coefficients
B
Std.
Error Beta t Sig.
(Constant) 1.204 0.342
3.519 0.001
Awareness and
knowledge of
billboards 0.34 0.076 0.401 4.467 0.000
Feelings towards
Billboards 0.189 0.068 0.246 2.764 0.007
Attitude towards
Billboards 0.195 0.05 0.327 3.894 0.000
a Dependent Variable: Consumer attitude to purchase FMCGs
Thus the optimal regression equation is:
Consumer attitude towards FMCGs= 1.204 + 0.34 (Awareness and knowledge of
billboards) + 0.189 (Feelings towards Billboards) + 0.195 (Attitude towards
Billboards)
4.7 Discussion of the Findings
The inferential results of this study indicated a positive and significant influence of
out of home advertising on consumer attitude to purchase FMCGs in Westlands
division, Nairobi County. In particular, correlation findings indicated that knowledge
and awareness of billboards, attitude towards billboards and feelings towards
billboards as a means of out of home advertising had a positive and significant impact
on the consumer attitude to purchase FMCGs in Westlands division. The results of the
study imply that an improvement in out of home advertising of FMCGs reflected in
increase in knowledge and awareness of billboards and a positive attitude and feelings

40
towards billboards would result to a significant improvement in purchase of the goods
in Westlands division. The findings are consistent with the findings of a study by
Lunn (2005) which concluded that consumers will have better attitudes towards
products which have been well researched. The findings are also consistent with the
study conclusions of Jepchirchir (2014) that advertising attributes contribute in
communicating product quality and features in a manner that affects purchasing
behavior.
The regression analysis findings indicated that 50.3% of the variation in the consumer
attitude to purchase FMCGs was explained by out of home advertising. Comparing
with the empirical literature of the study, (Barrault 2006) concluded that there was no
unfavorable reaction against coupons either from retailers or from consumers due to
increased out of home advertising activities, rather consumers are able to examine and
compare the features of the goods they purchased which guided their decisions to
purchase or not. Putschi (2007) also concluded that consumers generally are able to
understand properly the explanations given for goods they consume properly which
makes them less worried about side effects. On the other hand, Winkler (2000)
examined consumer attitude towards marketing activities in Germany and concluded
that consumer discomfort with advertising does not result from exaggeration of
advertising rather it is consumers who doubt whether advertising embodies the
principle of truth. These studies therefore concur with the results of this study, which
indicated that an improvement in out of home advertising by way of improving
consumer knowledge and awareness of billboards, positive attitude and feelings
towards billboards would result to improvement in consumer attitude to purchase
FMCGs.
41
CHAPTER FIVE
SUMMARY, CONCLUSIONS AND RECOMMENDATIONS
5.1 Introduction
The study purposed to establish the influence of out of home advertising on consumer
attitudes in FMCGs in Wetlands division, Nairobi County. This chapter outlines
summary of the key findings, the resulting conclusions, limitations, suggestions and
recommendations arising out of the study.
5.2 Summary of Findings
The study sought to investigate the influence of outdoor advertising on consumer
attitude in fast moving consumer goods in Westlands division, Nairobi County.
Descriptive statistics and inferential statistics, that is, correlation and regression were
the main techniques used for analysis. Chapter four also presented the results of the
study as well as discussions of the findings. The findings were also collaborated with
the findings of other studies on the theme.
The study revealed a number of key findings that would go a long way in providing a
deeper understanding of the concept of outdoor advertising in relation to fast moving
consumer goods. With regard to knowledge and awareness of outdoor advertising,
descriptive statistics indicated that majority of the consumers were found to be
cognizant of outdoor advertising and were able to identify billboards in their different
placement. The study also revealed that majority of the respondents agreed that
billboards are a favorable form of advertising. This was supported by the facts that
billboard that are strategically placed are in a position to provide consumers with
sufficient information.

42
In regards to the purchase of FMCGs advertised on billboards, majority of
respondents indicated that products advertised on billboards were of high quality and
the manufacturers could be trusted. They would therefore definitely be more confident
purchasing a product that they had seen being advertised on a billboard. The study
also indicated that billboards positively influenced consumer attitudes and improved
their perceptions towards fast moving consumer goods. Billboard advertising helped
shape the consumer attitudes making them more inclined towards products that they
had seen being advertised on billboard. This was a positive impact that was deduced
from the study, revealing that a majority of the respondents would perceive those
products in a better way.
These finding would also explain the number of billboards that have been placed in
Westlands region and also the reason why fast moving products including eating
joints are located in Westlands region. The high level of consumption of fast moving
consumer goods would also mean more sale of products in Westlands region. The
study also indicated that billboard advertising was a more efficient and effective
method of doing marketing promotion in Westlands area. The respondents indicated
that billboards had a higher value for money when it came to mass market advertising.
Inferential statistics also indicated that that knowledge and awareness of billboards,
attitude towards billboards and feelings towards billboards as a means of out of home
advertising had a positive and significant impact on the consumer attitude to purchase
FMCGs in Westlands division.

43
5.3 Conclusion
This research was a study on influence of out of home advertising on consumer
attitudes in FMCG in Wetlands division, Nairobi County. For this purpose, three
independent variables, knowledge and awareness of billboards, attitude towards
billboards and feeling towards billboards by consumers were considered. It was
concluded that out of home advertisement has a positive significant effect on
consumer attitudes in FMCGs. This study is useful especially with regard to
marketers who can seek to comprehend what prompts the intentions of consumers to
buy by determining which element in out of home advertising is most effective.
Another conclusion that can be made from this study is that knowledge and awareness
of billboards as a tool for outdoor advertising positively and significantly affects
consumer attitudes in FMCGs. In this regard, ability of consumer to recognize and
identify outdoor advertising tools such as billboards in their different placement
positively and significantly enhances their attitude towards Fast Moving Consumer
Goods. Similarly, having billboard that are strategically placed provides consumers
with sufficient information which boosts their confidence in the quality of Fast
Moving Consumer Goods.
It can also be concluded that feelings and attitudes of consumers towards billboard
advertising has a positive significant effect on consumer attitudes in Fast Moving
Consumer Goods. Accordingly, if consumers perceive billboard advertising
positively, they are likely to develop positive attitudes towards Fast Moving
Consumer Goods which would ultimately enhance their consumption of the goods.
Billboard advertising would therefore influence consumer attitudes in a positive way
and consequently increases purchase and consumption of fast moving consumer
goods.

44
5.4 Recommendations
The study findings led to the recommendations that producers of fast moving
consumer goods should focus more on out of home advertising such as use of
billboards as opposed to other forms of media like T.V and Radio to help boost
consumption and sale of their products based on the conclusion that home
advertisement has a positive significant effect on consumer attitudes in Fast Moving
Consumer Goods. Marketers of FMCGs should therefore seek to understand what
prompts the intentions of consumers to buy and therefore include effective elements
in in out of home advertising. Marketers of FMCGs should also determine the most
effective out of home advertising tool that most triggers a consumer to purchase
FMCGs.
The study also recommends marketers of FMCGs that for the purpose of increasing
their sales, there is need to enhance the knowledge and awareness of consumers with
regard to existence and location of billboards as knowledge and awareness of
billboards positively and significantly affects consumer attitude towards FMCGs. The
aspect of a 24 hour presence for billboards cannot be underplayed. It underpins, their
utility as a high reach tool of advertising and finally visual impacts from
advertisements sizes and message creativity are very important in advertising.
The study further recommends marketers of FMCGs to enhance the effectiveness of
billboard advertising in terms of their content since consumer of fast moving goods
are sensitive to some aspects of advertisement contained in the billboards. There is
need to ensure that the billboards provide accurate information about the quality of
the goods advertised, are sufficient as a means of getting information about products
and are designed to enhance the confidence of the consumer to purchase FMCGs.

45
Consumer develop a certain level of dependability on a brand whose advertisement
they have been exposed to and are keen to know the usage as well as benefits of the
product before making the decision to purchase.
5.5 Limitations of the study
The study used a sample from only Westlands region. However, the sample size used
is not representative of the total population in Kenya. Inference from the finding
would therefore be misleading for policy makers. In the course of data collection, the
researcher faced several challenges that were connected to the research. Firstly, dearth
of resources meant that the research was conducted under financial constrictions. The
second challenge that the research faced was inadequate or absence of cooperation
from respondents that proved the biggest hurdle. The fact that some respondents
failed to comprehend the purpose of the study meant that they were naturally
predisposed to feel uneasy and have suspicion especially when they were urged to
cooperate. In order to calm the respondents, the purpose as well as the nature of the
study was communicated by the researcher whereby they were informed of the
academic undertaking of the study and any information they provided would not be
revealed.
5.6 Recommendations for Further Research
Future studies should use a representative sample of the entire Kenya population in
investigating the influence of Outdoor advertising on Fast moving consumer goods.
This is because billboards are a form of advertising used nationwide in all the counties
and regions in Kenya. Although the information gotten from the residences in
Westlands region provided sufficient information for the study, other studies should
also include other sources of information like the companies that own billboards and
the fast moving consumer goods companies as well.

46
REFERENCES
Berkowitz E.N, Kerin R.A, Rudelius W. and Crane .F.G. (1991).Marketing.1st
Canadian Edition. Irwin. Boston
Black T.R. (1999). Doing quantitative research in the social sciences: An integrated
approach to research design, measurement and statistics.Sage.
Çelen, A., Erdogan, T. &Taymaz, E. (2005). Fast moving consumer goods
competitive conditions and policies. ERC Working Papers in
Economics.Middle East Technical
Charan. A. (2013-2018): Marketing Analytics: A Practitioner’s Guide to Marketing
Analytics and Research Methods. NUS Business School, National
University of Singapore. Retrieved from:
https://www.ashokcharan.com/Marketing- Analytics/~rt-coverage-analysis-
retail-tracking.php
Consultancy.uk (2015).50 largest Consumer Goods / FMCG firms of the globe:
Retrieved from: https://www.consultancy.uk/news/2453/50-largest-consumer-
goods-fmcg-firms-of-the-globe
Cytonn (2017).Kenya’s Real Estate Sector Retail Report; “Cautious Optimism in the
Face of Turbulence”. Retrieved
from:https://propertibazar.com/article/kenya- retail-sector-report-
cytonn-investments_5a45dc7ed64ab2451f23c4c7.html
David Yadav (2006). Competitive Strategies Adopted by Small and Medium Audit
Firms in Nairobi City County, Kenya.A Research Project. Master of Business
Administration, Faculty of Commerce. University of Nairobi
Denzin, N. and Lincoln.Y. (1994).Handbook of Qualitative Research. Thousand
Oaks, CA, US: Sage Publications Inc.
Dhruv .G. and Michael .L. (2009).Emerging Issues in Retailing Research.Journal of
Retailing. U.S: Elsiever Inc.
Euro monitor.(2015). Oils and fats in Kenya.Retrieved from
http://www.euromonitor.com/oils-and-fats-in-kenya/report.
47
Fisher .M. L, Krishnan .J and Netessine.S, (2006): Retail Store Execution: An
Empirical Study; Operations and Information Management Department.
The Wharton School, University of Pennsylvania.
Jouhari I. (2007). Marketing Diversification: Harvard Business Review.35:PP.113-
124
Jung, J. and Sung, E. Y., (2008). Consumer-based brand equity; Comparisons among
Americans and South Koreans in the USA and South Koreans in
Korea, Journal of Fashion Marketing and Management, Vol. 12, No. 1,
pp. 24-36.
Kotler .P. (2003).Marketing Management.11th Edition.Prentice Hall. India. New
Delhi.
Kotler, P. & Keller, KL.(2009). Marketing management, 13th Ed, Prentice Hall,
Pearson. International Edition, 59-60.
KPMG, (2016).Fast Moving Consumer Goods; Sector Report.Kpmg.com/Africa.
Retrieved from:
https://assets.kpmg.com/content/dam/kpmg/br/pdf/2016/09/fast- moving-
consumer-goods.pdf
Lee, K. (2009). Marketing of FMCG s in Kenya.Journal of marketing 22(1), 1-13.

48
APPENDICES
Appendix I: Questionnaire
I would like to seek your honest opinion of the issues highlighted in this
questionnaire. Please do not indicate your name, or any information that can identify
you anywhere since all responses are anonymous.
After filling the Questionnaire I will personally pick it from you.
Section One: General Information
Please tick where appropriate
1. Indicate your age;
18-25
26-35
36-45
46-54
Above 55
2. Indicate your gender;
Male
Female
4. Indicate the highest level of education you have achieved so far.
Primary

49
Secondary
Diploma/College
Undergraduate
Postgraduate
Section Two: Awareness and Knowledge
Please indicate the extent to which you agree or disagree with the following
statements based on the following rating: 1= Strongly Disagree 2=Disagree
3=Neutral 4=Agree 5=Strongly Agree
1 2 3 4 5
I am aware of what a billboard is
I am aware of where I see billboards
I aware of the different billboard suppliers
I am aware of billboard placements in Westlands area
I am aware of the different types of billboards
I am aware of the different advertisements placed on billboards

50
Section Three: Feelings towards Billboards
Please indicate the extent to which you agree or disagree with the following
statements based on the following scale: 1=not at all 2=small extent 3=moderate
extent 4=Great extent 5=very great extent
1 2 3 4 5
I like billboards because they provide information
Billboards are a sufficient way of getting information about
products
It easy to get information from billboards
It is cumbersome to identify billboards on busy areas
I will definitely buy a fast moving consumer good I have seen on a billboard
Billboards are favorable for advertising
Fast moving consumer goods advertised on billboards are good quality
One is hesitant to buy fast moving consumer goods seen on
billboards
Fast moving consumer goods do not advertise on billboards because it is expensive
Seeing an advertisement on a billboard makes you more
confident about FMCG

51
Section Four: Attitude towards Billboards
Indicate to what extent you agree with the following statements in relation to attitude
of consumers on billboards in a Likert scale form as shown.
1= Strongly Disagree 2=Disagree 3 =Neutral 4=Agree 5= strongly agree
1 2 3 4 5
I definitely will buy a product I have seen on a billboard
The fast moving consumer goods I take are
advertised on billboards
Billboard advertising is way more effective
than other forms of promotions
Billboard advertising has improved my
attitude towards fast moving consumer
goods
Billboard advertising has increased my
consumption of fast moving consumer
goods.
14. What are some of the challenges you have face as a consumer in billboard advertising?

52
15. What can be done to promote better billboard effectiveness fast moving
consumer goods?
THANK YOU!!