Shareholder Letter First Quarter 2017€¦ · Zendesk Shareholder Letter Q1 2017 - 2 ... That meant...
22
Shareholder Letter First Quarter 2017 May 04, 2017
Transcript of Shareholder Letter First Quarter 2017€¦ · Zendesk Shareholder Letter Q1 2017 - 2 ... That meant...

Shareholder LetterFirst Quarter 2017
May 04, 2017

Zendesk Shareholder Letter Q1 2017 - 2
IntroductionThe first quarter of 2017 marked a major milestone: We surpassed 100,000 paid customer
accounts worldwide. This number is significant because it demonstrates how Zendesk
and its products continue to appeal to a broad set of businesses of all sizes and across
industries. When we founded the company, we wanted to democratize access to modern,
easy-to-use business software for all organizations. That meant that a local bike shop
could have the same access to the best software as a global brand. We strive to be a core
part of an organization’s customer relationship strategy from the beginning, and we’re
proud that Zendesk’s products are flexible and scalable enough to serve such a broad
spectrum of organizations.
Along with strong account growth, we started 2017 by aggressively pursuing our long-term
growth opportunities, setting ourselves up to meet our financial goals and targets for the
year. In early May, we launched Zendesk Guide, our new and improved knowledge base
product that gives us additional monetization opportunities in self-service. And we are
today announcing our acquisition of Outbound, completed in April, which will significantly
advance our vision for enabling smarter customer messaging and proactive engagement.
We also made significant progress in expanding our market opportunities with new
integrations and partnerships with some of the world’s largest software, Internet, and
ecommerce companies, and we broadened our international operations to support global
growth. All of these moves set us on a course for strong and continued growth in the
coming quarters and years.
Mikkel Svane
CEO
Elena Gomez
CFO
Marc Cabi
Strategy & IR
$93.0M
36%
100,000+
Q1 2017 Revenue
Y/Y Revenue Growth
Paid Customer Accounts

Zendesk Shareholder Letter Q1 2017 - 3
First quarter 2017 financial summary (in thousands, except per share data)
Three Months Ended March 31,
GAAP Results 2017 2016
Revenue $ 93,007 $ 68,459
Gross profit 64,900 46,943
Gross margin 69.8% 68.6%
Operating loss $ (27,174) $ (26,687)
Operating margin -29.2% -39.0%
Net loss $ (26,994) $ (27,171)
Net loss per share (0.28) (0.30)
Non-GAAP Results
Non-GAAP gross profit $ 68,433 $ 49,955
Non-GAAP gross margin 73.6% 73.0%
Non-GAAP operating loss $ (5,245) $ (6,794)
Non-GAAP operating margin -5.6% -9.9%
Non-GAAP net loss $ (5,065) $ (7,278)
Non-GAAP net loss per share (0.05) (0.08)
In the first quarter, we delivered $93.0 million in revenue, or 36% revenue growth, as compared to
the first quarter of 2016. As expected, first quarter growth was characterized by strong growth in the
low-touch transactional segment of our business, as evidenced by strong results for net new paid
accounts. We ended the first quarter with 101,800 paid customer accounts.

Zendesk Shareholder Letter Q1 2017 - 4
Both the Knowledge Capture app and Answer
Bot are currently in early access programs (EAPs).
Answer Bot will initially launch via email and will
later be available across all channels that
customers use to engage with organizations.
Introducing GuideOur biggest product news of 2017 so far was
the recent launch of our new smart knowledge
base solution, Zendesk Guide, an evolution
of our Help Center product with new features
and functionality. Forrester reports that 76% of
customers prefer self-service support to find
their own answers as opposed to speaking
with a customer service representative.* Guide
capitalizes on this customer desire to help
themselves by giving customers self-service
support powered by machine learning while
similarly empowering customer service agents to
resolve inquiries with contextual insights.
Along with Zendesk Guide, two complementary
capabilities make the customer service experience
better and more efficient for both customers
and agents.
• With the Knowledge Capture app, available on our Guide Professional plan, agents can share their collective knowledge to respond to sup-port requests more effectively, update outdated information, and make more self-service content available over time.
• Answer Bot uses deep learning technology to improve self-service efficiency by responding to customers’ questions with relevant knowledge base articles before they ever reach an agent.
*Forrester blog post, “Online Self Service Dominates Yet
Again. Why? It’s An Effortless Way To Get To Your Answers,”
January 28, 2016, by Kate Leggett.
Zendesk Shareholder Letter Q1 2017 - 5
Acquisition of OutboundWe completed the acquisition of Outbound and welcomed the team into
Zendesk at the end of April. Without requiring a complex, engineering-
heavy implementation, Outbound enables businesses to automate and
deliver relevant messages across web, email, and mobile channels and to
better measure their effectiveness. At a time when customers are inundated
with automated messages, Outbound shifts the focus from the quantity of
messages delivered to the quality of customer interactions.
This is consistent with our core belief that customers today expect
experiences and communication to be built around them, not around
business departments and their siloed needs. Over the past year, our
interactions with and learnings from joint customers led us to conclude
that by combining Outbound’s and Zendesk Connect’s products and
go-to-market (GTM) initiatives, we could together build a differentiated
and better experience for our customers.
Outbound expands the product scope and market opportunity of our
Connect product—currently in an EAP—ultimately accelerating our time
to meaningful revenue. We will continue to market and sell Outbound as
we work to combine the Connect and Outbound products into a single,
multi channel solution.
The acquisition is not expected to have a material impact on our 2017
revenue or our non-GAAP operating loss. The impact of the acquisition on
our GAAP 2017 operating loss is not yet determinable and is subject to the
application of purchase accounting and will include additional expenses,
including amortization of purchased intangibles, expenses associated with
employee retention arrangements, and transaction fees.
Expanding our marketsWe pride ourselves on making our products easy to discover, deploy, and
purchase so that any organization, from startup to large enterprise, can realize
their value. A big part of making that possible is extending the reach of our
products through partnerships and integrations with other leading software
platforms and cloud-based services. During the first quarter, we saw major
progress in those efforts.
We were among the first AWS Partner Network partners to support Amazon
Connect, the new cloud-based contact center service from Amazon Web
Services. We are bringing our contact center expertise to the collaboration
through the integration of Zendesk Support with Amazon Connect. Support
provides organizations with the tools and information they need in one place
to quickly and easily solve customer inquiries when using Amazon Connect
for call center capabilities. The integration joins the more than 35 CTI vendors
available for Zendesk.
We also partnered with Adobe to connect parts of the newly launched Adobe
Experience Cloud—starting with the Adobe Cloud Platform “Launch” tag
management solution—to the Zendesk family of products, combining digital
experiences, support interactions, and marketing campaigns between the
respective platforms. The integration enables the creation of a proactive
Zendesk Chat with pre-defined messaging based on Launch by Adobe’s
behavioral tracking information—for example, automatically starting a chat
when a customer abandons an online shopping cart. The effort also includes
collaboration on a new open industry standard data model to develop a shared
scheme around customer support interactions.
Finally, our previously announced integration of Zendesk Support with
Microsoft Teams—the new chat-based workspace for Office 365—went live
in March as part of the broader Teams launch.

Zendesk Shareholder Letter Q1 2017 - 6
International presenceOur international presence and reach is another important way we expand
our markets and fuel growth. Our commitment to international opportunities
is demonstrated by the fact that 46% of our revenue comes from outside the
United States and 45% of our employees are based outside the U.S.
We see our global business continuing on a very promising trajectory.
In the first quarter of this year, we announced expansions and increased
focus in several regions where we’ve seen strong growth in business and
product development.
In Singapore, we expanded our Chat development center in February,
enlarging our office to accommodate more than 120 employees. This
expansion is supported by a grant from the Singapore Economic
Development Board and allows us to leverage relationships with messaging
companies and innovative customers in the region as we evolve Zendesk
Message and Chat. Singapore also serves as our commercial headquarters
in Asia to support our growth initiative throughout the region, where we saw
a 35% year-over-year growth in paid customer accounts as of the end of
the first quarter.
Our new office in Manila, announced in February, serves as a Customer
Experience Hub for the APAC region. The new office provides capacity for
more than 200 people, and the Metro Manila location provides access to a
local pool of highly skilled talent with strong English language skills capable
of providing highly technical support and assistance for our low-touch,
transactional business in this rapidly growing region.
We continue to expand our investment in France, in terms of both GTM
resources and product development. Our French customer base is
expanding—as of the end of the first quarter, our number of paid customer
accounts in France grew by more than 35% year over year. In March, we
announced that we will move our Paris office to Station F, one of the biggest
startup campuses in the world. Our agreement with Station F not only
provides a great hub for our GTM activities there, but it also provides more
than 45 seats at the campus to incubate local startups. Station F will also
use Zendesk products to provide customer support to the companies in its
3,000-seat campus. Additionally, we unveiled a new office in Montpellier, our
hub for development of Zendesk Explore. The new location is three times the
size of our previous Montpellier office, providing a much more spacious office
environment with room for about 50 employees.
Montpellier ManilaSingapore

Zendesk Shareholder Letter Q1 2017 - 7
1600 1700
Help Center“Copenhangen”
Google Play
AdvancedVoice
1000
AutomaticAnswers
ChannelFramework
80K
ZendeskMessage
SatisfactionPrediction
70K
PremiumLive Chat
60K
FacebookMessenger
Analytics
AnalystDay
SMS Rebrand
1400
Gartner MQLeader
Office 365Pathfinder
Gartner MQVisionary
1200
ForresterWave
Jan2015
Jan2016
Jan2017
IndiaOffice
Opening
90K
1500
ManilaOffice
Opening
100K
AWSConnect
SDKFabric
MontpellierOffice
Opening
SingaporeOffice
Opening
Key accomplishmentsTimeline not to scale

Zendesk Shareholder Letter Q1 2017 - 8
Customer momentum
Reaching our 100,000 paid customer account
milestone resulted from Zendesk products
appealing to a broad range of organizations.
While our low-touch, transactional business
helps us scale our reach to smaller and high-
growth organizations, we also attract traditional
and larger-sized businesses. We believe the
continued customer momentum demonstrates
our ability to serve both markets.
Among the customers to join us or expand with
us recently include:
• The Save Mart Companies, owner of sever-al grocery store chains including Save Mart, Lucky, FoodMaxx, and others
• Udemy, a global online learning platform
• Ebates, a shopping portal that offers coupons and cashback from online retailers
• WOW air, a low-fare airline based in Iceland
• University of Wisconsin-Madison Department of Medicine
• inDinero, an online platform for financial data for small businesses
Zendesk Shareholder Letter Q1 2017 - 9
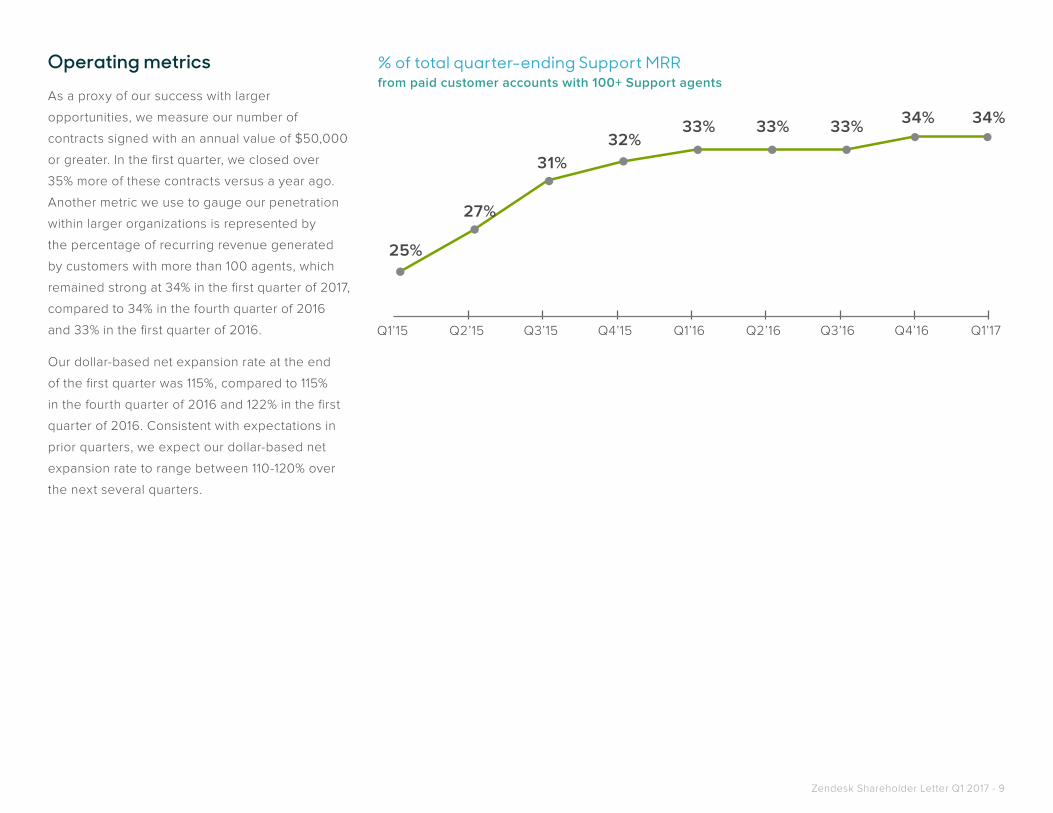
% of total quarter-ending Support MRR from paid customer accounts with 100+ Support agents
Operating metricsAs a proxy of our success with larger
opportunities, we measure our number of
contracts signed with an annual value of $50,000
or greater. In the first quarter, we closed over
35% more of these contracts versus a year ago.
Another metric we use to gauge our penetration
within larger organizations is represented by
the percentage of recurring revenue generated
by customers with more than 100 agents, which
remained strong at 34% in the first quarter of 2017,
compared to 34% in the fourth quarter of 2016
and 33% in the first quarter of 2016.
Our dollar-based net expansion rate at the end
of the first quarter was 115%, compared to 115%
in the fourth quarter of 2016 and 122% in the first
quarter of 2016. Consistent with expectations in
prior quarters, we expect our dollar-based net
expansion rate to range between 110-120% over
the next several quarters.

Zendesk Shareholder Letter Q1 2017 - 10
Brand awareness and social responsibilityWe further advanced the Zendesk brand through
both industry recognition and events as well
as new community and corporate social
responsibility (CSR) programs around the globe.
Brand recognition
Last October’s redesign of the Zendesk brand
and product family continues to gain accolades,
most recently at the Shorty Awards, which honor
the best of social media from the previous year.
Zendesk’s redesign campaign won the Shorty
Award and the public-voting-based Audience
Honor for “Best Brand Redesign” of 2016. Our
brand has long played a key role in our success,
and our new corporate and product branding
helped us enter the new year with a better
representation of the company we have grown to
become and of our expanding family of products.
On April 27, we hosted our first-ever virtual Relate
event, Relate Live Global. Approximately 1,400
people registered to view four keynotes and nine
breakout sessions live that day or on demand
after the event. Event registrants were added to
our Relate newsletter list, growing our marketable
database for Relate by 10%.
8 e 9 de junho de 2017
Inscrição
Por quê ComparecerO Zendesk Presents: São Paulo é uma experiência desen-hada para auxiliar empresas e empreendedores que procuram explorar a fundo a complicada natureza dos relacionamentos. Nossos par-ticipantes geralmente usam títulos como: CEO, CTO, CIO, Diretor de Atendimento ao Cliente, Diretor de Customer Success, Diretor de Marketing, VP de Relacionamento com o Cliente e Gerentes de Atendi-mento ao Cliente.
Customer service heroes can’t escape their destiny.Join us in São Paulo to take your customer relationships to the next level.
Ano passado foi incrívelEm 2016, o Relate Live São Paulo reuniu 14 líderes reno-mados internacionamente no Hotel Unique, em SP para um público de 1500 pessoas. Veio o CEO da Zendesk, o prefeito de São Francisco, a CFO do Comitê Olímpico e o Wash-ington Olivetto. Esse ano serão 19 palestrantes e pessoas vindo de todo lugar do mun-do para trocar experiências, contatos e expandir seus conhecimentos.
Sobre o RelateNo Zendesk Presents: São Paulo você irá se reunir com organizações inovadoras para discutir novas técnicas, melhorar a experiência dos seus cliente e consequent-emente criar um relacion-amento mais duradouro. O evento contará com keynotes líderes de mercado que já implementaram e execut-aram projetos inovadores no setor de relacionamento com o cliente, além disso participe
PlaceDate Time
São Paulo
06-07 June
09.00 - 18.00
Inscrição
Zendesk PresentsMicrosite concept
N A M E
C O M PA N Y
TOKE NYGAARD
ZENDESK
#relationshapes
N A M E
C O M PA N Y
# R E L AT I O N S H A P E S

Zendesk Shareholder Letter Q1 2017 - 11
Corporate social responsibility
In the first quarter of 2017, the Zendesk Neighbor
Foundation established deeper partnerships with
nonprofits near several of Zendesk’s offices. In
Manila, the Foundation broke ground on a day care
center that will be fully funded by a Foundation
grant and constructed with the help of Zendesk
employees. The Foundation has also committed
to investing $85,000 in local Manila nonprofits.
In Singapore, the Foundation launched a local
chapter of Cycling Without Age, becoming the sixth
Zendesk office engaged in this program aimed at
coaxing seniors out of isolation.
Breaking ground for a day care in Manila
Meanwhile, a top priority for Zendesk in 2017 is to
strengthen and expand our diversity and inclusion
strategy, and Zendesk recently hired its first
diversity and inclusion manager. The company’s
C-level executives also pledged their commitment
to #jamaissanselles (translation: #neverwithouther),
a movement that calls on events and conferences
to have sufficient female representation as speakers
before executives will agree to speak or join a panel.
Finally, the Zendesk CSR team continues to focus
on opportunities to tie its impact efforts to the
company’s products. In the first quarter, Zendesk
launched a partnership with Facebook and the
National Suicide Prevention Lifeline, through which
the Zendesk Message-Facebook Messenger
integration powers and manages the messaging
channel of various suicide prevention hotlines.

Zendesk Shareholder Letter Q1 2017 - 12
Financial measures and cash flowWe maintain our measured approach to investing in growth. Our commitment
to demonstrate continued scale through year-over-year margin improvement
was achieved during the first quarter of 2017, despite large investments we
are making in our roll out of cloud infrastructure to supplement our co-located
data center activities and which we previewed in our previous earnings
call. As a result of these investments, our GAAP gross margin declined
quarter-over-quarter to 69.8% in the first quarter of 2017, from 71.1% in the
fourth quarter of 2016. GAAP gross margin improved year over year from
68.6% in the first quarter of 2016. Non-GAAP gross margin declined quarter-
over-quarter to 73.6%, compared to 74.8% in the fourth quarter of 2016, and
improved year over year from 73.0% in the first quarter of 2016.
GAAP operating loss for the first quarter of 2017 was $27.2 million compared
to GAAP operating loss for the fourth quarter of 2016 of $25.1 million. GAAP
operating loss for the first quarter of 2016 was $26.7 million. Non-GAAP
operating loss for the first quarter of 2017 was $5.2 million and compares
to non-GAAP operating loss for the fourth quarter of 2016 of $4.4 million.
Non-GAAP operating loss for the first quarter of 2016 was $6.8 million.
In the first quarter of 2017, GAAP operating margin was -29.2% versus
-28.4% in the fourth quarter of 2016 and -39.0% in the first quarter of 2016.
Non-GAAP operating margin declined quarter-over-quarter to -5.6% in the
first quarter of 2017 from -5.0% in the fourth quarter of 2016. Non-GAAP
operating margin was -9.9% in the first quarter of 2016.
GAAP net loss for the first quarter of 2017 was $27.0 million or $0.28 loss per
share, compared to GAAP net loss of $24.5 million or $0.26 per share in the
fourth quarter of 2016. GAAP net loss was $27.2 million or $0.30 per share
for the first quarter of 2016. Non-GAAP net loss for the first quarter of 2017
was $5.1 million or $0.05 per share, compared to non-GAAP net loss of $3.8
million or $0.04 per share for the fourth quarter of 2016. Non-GAAP net loss
was $7.3 million or $0.08 per share for the first quarter of 2016. Weighted
average shares used to compute both GAAP and non-GAAP net loss per
share for the first quarter of 2017 was 97.5 million.
Non-GAAP results for the first quarter of 2017 exclude $21.0 million in
share-based compensation and related expenses (including $1.4 million
of employer tax related to employee stock transactions and $0.4 million
of amortization of share-based compensation capitalized in internal-use
software), and $0.9 million of amortization of purchased intangibles.
Non-GAAP results for the fourth quarter of 2016 exclude $19.8 million in
share-based compensation and related expenses (including $1.8 million of
employer tax related to employee stock transactions and $0.6 million of
amortized share-based compensation capitalized in internal-use software),
and $0.9 million of amortization of purchased intangibles. Non-GAAP
results for the first quarter of 2016 exclude $19.0 million in share-based
compensation and related expenses (including $0.8 million of employer tax
related to employee stock transactions and $0.5 million of amortized
share-based compensation capitalized in internal-use software), and
$0.9 million of amortization of purchased intangibles.
During the first quarter of 2017, net cash from operating activities was $7.1
million. We ended the first quarter of 2017 with $109.3 million of cash and
equivalents, and we had an additional $138.4 million of short-term marketable
securities and $68.3 million in long-term marketable securities.
Zendesk Shareholder Letter Q1 2017 - 13
Guidance
For the second quarter of 2017, we expect revenue to range between $98.0
and $100.0 million. An estimate for GAAP operating loss for the second
quarter of 2017 is not yet determinable as such estimate would include an
estimate for amortization of purchased intangibles, a portion of which is
subject to the completion and application of purchase accounting for our
acquisition of Outbound. We expect our non-GAAP operating loss for the
second quarter of 2017 to range between $5.0 and $7.0 million, which we
estimate to exclude share-based compensation and related expenses of
approximately $22.1 million and $0.8 million in acquisition-related expenses.
Non-GAAP operating loss also excludes amortization of purchased
intangibles, a portion of which is impacted by our acquisition of Outbound.
For the full year of 2017, we expect revenue to range between $417.0 and
$425.0 million, compared to our original guidance range of $415.0 and
$425.0 million. This range represents growth between 34% and 36% year
over year. An estimate for GAAP operating loss for the full year is not yet
determinable as such estimate would include an estimate for amortization of
purchased intangibles, a portion of which is subject to the completion and
application of purchase accounting for our acquisition of Outbound.
We expect our non-GAAP operating loss to range between $16.0 and $20.0
million, which we estimate to exclude share-based compensation and
related expenses of approximately $90.7 million and $2.2 million in
acquisition-related expenses. Non-GAAP operating loss also excludes
amortization of purchased intangibles, a portion of which is impacted by
our acquisition of Outbound. Our updated full-year guidance reflects our
confidence in being able to maintain a high growth rate in 2017.
We continue to expect net cash from operating activities and free cash
flow to be positive for the full year 2017. This target regarding free cash
flow includes cash used for purchases of property and equipment and
internal-use software development costs. We have not reconciled free cash
flow guidance to net cash from operating activities for this future period
because we do not provide guidance on the reconciling items between
net cash from operating activities and free cash flow, as a result of the
uncertainty regarding, and the potential variability of, these items. The
actual amount of such reconciling items will have a significant impact on
our free cash flow and, accordingly, a reconciliation of net cash from
operating activities to free cash flow for the period is not available
without unreasonable effort.
Finally, we estimate we will have approximately 99.5 million weighted
average shares outstanding for the second quarter of 2017 and 100.0
million weighted average shares outstanding for the full year of 2017,
each based only on current shares outstanding and anticipated activity
associated with equity incentive plans.

Zendesk Shareholder Letter Q1 2017 - 14
Condensed consolidated statements of operations(In thousands, except per share data; unaudited)
Three Months Ended March 31,
2017 2016
Revenue $93,007 $68,459
Cost of revenue 28,107 21,516
Gross profit 64,900 46,943
Operating expenses:
Research and development 26,456 21,597
Sales and marketing 47,301 36,172
General and administrative 18,317 15,861
Total operating expenses 92,074 73,630
Operating loss (27,174) (26,687)
Other income (expense), net 218 (70)
Loss before provision for income taxes (26,956) (26,757)
Provision for income taxes 38 414
Net loss $(26,994) $(27,171)
Net loss per share, basic and diluted $(0.28) $(0.30)
Weighted-average shares used to compute net loss per share, basic and diluted 97,475 90,519

Zendesk Shareholder Letter Q1 2017 - 15
Condensed consolidated balance sheets(In thousands, except par value; unaudited)
March 31, 2017 December 31, 2016Assets
Current assets:
Cash and cash equivalents $109,258 $93,677
Marketable securities 138,440 131,190
Accounts receivable, net of allowance for doubtful accounts of $2,264 and $1,269 as of March 31, 2017 and December 31, 2016, respectively
39,105 37,343
Prepaid expenses and other current assets 17,982 17,608
Total current assets 304,785 279,818
Marketable securities, noncurrent 68,320 75,168
Property and equipment, net 60,842 62,731
Goodwill and intangible assets, net 52,699 53,296
Other assets 4,382 4,272
Total assets $491,028 $475,285
Liabilities and stockholders’ equity
Current liabilities:
Accounts payable $5,890 $4,555
Accrued liabilities 18,448 19,106
Accrued compensation and related benefits 21,664 20,281
Deferred revenue 130,129 123,276
Total current liabilities 176,131 167,218
Deferred revenue, noncurrent 1,989 1,257
Other liabilities 7,511 7,382
Total liabilities 185,631 175,857
Stockholders’ equity:
Preferred stock, par value $0.01 per share - -
Common stock, par value $0.01 per share 991 971
Additional paid-in capital 655,792 624,026
Accumulated other comprehensive loss (3,792) (5,197)
Accumulated deficit (346,942) (319,720)
Treasury stock, at cost (652) (652)
Total stockholders’ equity 305,397 299,428
Total liabilities and stockholders’ equity $491,028 $475,285

Zendesk Shareholder Letter Q1 2017 - 16
Three Months Ended March 31,
2017 2016
Cash flows from operating activities
Net loss $(26,994) $(27,171)
Adjustments to reconcile net loss to net cash provided by operating activities:
Depreciation and amortization 7,923 6,526
Share-based compensation 19,213 17,695
Other 697 403
Changes in operating assets and liabilities:
Accounts receivable (2,316) 1,898
Prepaid expenses and other current assets (513) 862
Other assets and liabilities (332) (383)
Accounts payable 1,958 (1,851)
Accrued liabilities 2,524 2,307
Accrued compensation and related benefits (2,596) (2,066)
Deferred revenue 7,585 6,369
Net cash provided by operating activities 7,149 4,589
Cash flows from investing activities
Purchases of property and equipment (4,791) (3,249)
Internal-use software development costs (1,852) (1,351)
Purchases of marketable securities (40,758) (20,795)
Proceeds from maturities of marketable securities 31,654 10,051
Proceeds from sale of marketable securities 8,602 7,604
Net cash used in investing activities (7,145) (7,740)
Cash flows from financing activities
Proceeds from exercise of employee stock options 11,689 1,915
Proceeds from employee stock purchase plan 3,844 3,144
Taxes paid related to net share settlement of equity awards (154) (189)
Net cash provided by financing activities 15,379 4,870
Effect of exchange rate changes on cash and cash equivalents 198 (154)
Net increase in cash and cash equivalents 15,581 1,565
Cash and cash equivalents at beginning of period 93,677 216,226
Cash and cash equivalents at end of period $109,258 $ 217,791
Condensed consolidated statements of cash flows(In thousands; unaudited)

Zendesk Shareholder Letter Q1 2017 - 17
Non-GAAP results(In thousands, except per share data) The following table shows Zendesk’s GAAP results reconciled to non-GAAP results included in this letter.
Three Months Ended March 31,
2017 2016
Reconciliation of gross profit and gross margin
GAAP gross profit $64,900 $46,943
Plus: Share-based compensation 2,104 1,633
Plus: Employer tax related to employee stock transactions 169 90
Plus: Amortization of purchased intangibles 830 831
Plus: Amortization of share-based compensation capitalized in internal-use software 430 458
Non-GAAP gross profit $68,433 $49,955
GAAP gross margin 70% 69%
Non-GAAP adjustments 4% 4%
Non-GAAP gross margin 74% 73%
Reconciliation of operating expenses
GAAP research and development $26,456 $21,597
Less: Share-based compensation (6,914) (6,627)
Less: Employer tax related to employee stock transactions (548) (295)
Non-GAAP research and development $18,994 $14,675
GAAP research and development as percentage of revenue 28% 32%
Non-GAAP research and development as percentage of revenue 20% 21%
GAAP sales and marketing $47,301 $36,172
Less: Share-based compensation (5,633) (5,439)
Less: Employer tax related to employee stock transactions (367) (227)
Less: Amortization of purchased intangibles (102) (102)
Non-GAAP sales and marketing $41,199 $30,404
GAAP sales and marketing as percentage of revenue 51% 53%
Non-GAAP sales and marketing as percentage of revenue 44% 44%
GAAP general and administrative $18,317 $15,861
Less: Share-based compensation (4,562) (3,996)
Less: Employer tax related to employee stock transactions (270) (195)
Non-GAAP general and administrative $13,485 $11,670
GAAP general and administrative as percentage of revenue 20% 23%
Non-GAAP general and administrative as percentage of revenue 14% 17%

Zendesk Shareholder Letter Q1 2017 - 18
(continued...)
Non-GAAP results(In thousands, except per share data) The following table shows Zendesk’s GAAP results reconciled to non-GAAP results included in this letter.
Three Months Ended March 31,
2017 2016
Reconciliation of operating loss and operating margin
GAAP operating loss $(27,174) $(26,687)
Plus: Share-based compensation 19,213 17,695
Plus: Employer tax related to employee stock transactions 1,354 807
Plus: Amortization of purchased intangibles 932 933
Plus: Amortization of share-based compensation capitalized in internal-use software 430 458
Non-GAAP operating loss $(5,245) $(6,794)
GAAP operating margin (29)% (39)%
Non-GAAP adjustments 23% 29%
Non-GAAP operating margin (6)% (10)%
Reconciliation of net loss
GAAP net loss $(26,994) $(27,171)
Plus: Share-based compensation 19,213 17,695
Plus: Employer tax related to employee stock transactions 1,354 807
Plus: Amortization of purchased intangibles 932 933
Plus: Amortization of share-based compensation capitalized in internal-use software 430 458
Non-GAAP net loss $(5,065) $(7,278)
Reconciliation of net loss per share, basic and diluted
GAAP net loss per share, basic and diluted $(0.28) $(0.30)
Non-GAAP adjustments to net loss 0.23 0.22
Non-GAAP net loss per share, basic and diluted $(0.05) $(0.08)
Weighted-average shares used to compute net loss per share, basic and diluted 97,475 90,519
Computation of free cash flow
Net cash provided by operating activities $7,149 $4,589
Less: purchases of property and equipment (4,791) (3,249)
Less: internal-use software development costs (1,852) (1,351)
Free cash flow $506 $(11)

Zendesk Shareholder Letter Q1 2017 - 19
About ZendeskZendesk builds software for better customer relationships. It empowers organizations to im-prove customer engagement and better understand their customers. More than 101,000 paid customer accounts in over 150 countries and territories use Zendesk products. Based in San Francisco, Zendesk has operations in the United States, Europe, Asia, Australia, and South America. Learn more at www.zendesk.com.
Forward-Looking StatementsThis press release contains forward-looking statements, including, among other things, statements regarding Zendesk’s future financial performance, its continued investment to grow its business, and progress towards its long-term financial objectives. The words such as “may,” “should,” “will,” “believe,” “expect,” “anticipate,” “target,” “project,” and similar phrases that denote future expectation or intent regarding Zendesk’s financial results, operations, and other matters are intended to identify forward-looking statements. You should not rely upon forward-looking statements as predictions of future events.
The outcome of the events described in these forward-looking statements is subject to known and unknown risks, uncertainties, and other factors that may cause Zendesk’s actual results, performance, or achievements to differ materially, including (i) adverse changes in general economic or market conditions; (ii) Zendesk’s ability to adapt its products to chang-ing market dynamics and customer preferences or achieve increased market acceptance of its products; (iii) Zendesk’s expectation that the future growth rate of its revenues will decline, and that, as its costs increase, Zendesk may not be able to generate sufficient revenues to achieve or sustain profitability; (iv) Zendesk’s limited operating history, which makes it difficult to evaluate its prospects and future operating results; (v) Zendesk’s ability to effectively manage its growth and organizational change; (vi) the market in which Zendesk operates is intensely competitive, and Zendesk may not compete effectively; (vii) the development of the market for software as a service business software applications; (viii) Zendesk’s ability to introduce and market new products and to support its products on a shared services plat-form; (ix) Zendesk’s ability to integrate acquired businesses and technologies successfully or achieve the expected benefits of such acquisitions; (x) breaches in Zendesk’s security mea-sures or unauthorized access to its customers’ data; (xi) service interruptions or performance problems associated with Zendesk’s technology and infrastructure; (xii) real or perceived errors, failures, or bugs in its products; (xiii) Zendesk’s substantial reliance on its customers renewing their subscriptions and purchasing additional subscriptions; and (xiv) Zendesk’s ability to effectively expand its sales capabilities.
The forward-looking statements contained in this press release are also subject to additional risks, uncertainties, and factors, including those more fully described in Zendesk’s filings with the Securities and Exchange Commission, including its Annual Report on Form 10-K for the year ended December 31, 2016. Further information on potential risks that could affect actual results will be included in the subsequent periodic and current reports and other filings that Zendesk makes with the Securities and Exchange Commission from time to time, including its Quarterly Report on Form 10-Q for the quarter ended March 31, 2017.
Forward-looking statements represent Zendesk’s management’s beliefs and assumptions only as of the date such statements are made. Zendesk undertakes no obligation to update any forward-looking statements made in this press release to reflect events or circumstances after the date of this press release or to reflect new information or the occurrence of unantici-pated events, except as required by law.
About Non-GAAP Financial Measures To provide investors and others with additional information regarding Zendesk’s results, the following non-GAAP financial measures were disclosed: non-GAAP gross profit and gross margin, non-GAAP operating expenses, non-GAAP operating loss and operating margin, non-GAAP net loss, non-GAAP net loss per share, basic and diluted, and free cash flow.
Specifically, Zendesk excludes the following from its historical and prospective non-GAAP financial measures, as applicable:
Share-based Compensation and Amortization of Share-based Compensation Capitalized in Internal-use Software: Zendesk utilizes share-based compensation to attract and retain employees. It is principally aimed at aligning their interests with those of its stockholders and at long-term retention, rather than to address operational performance for any particular period. As a result, share-based compensation expenses vary for reasons that are generally unrelated to financial and operational performance in any particular period.
Employer Tax Related to Employee Stock Transactions: Zendesk views the amount of employer taxes related to its employee stock transactions as an expense that is dependent on its stock price, employee exercise and other award disposition activity, and other factors that are beyond Zendesk’s control. As a result, employer taxes related to its employee stock transactions vary for reasons that are generally unrelated to financial and operational perfor-mance in any particular period.
Amortization of Purchased Intangibles: Zendesk views amortization of purchased intangible assets, including the amortization of the cost associated with an acquired entity’s developed technology, as items arising from pre-acquisition activities determined at the time of an acquisition. While these intangible assets are evaluated for impairment regularly, amortization of the cost of purchased intangibles is an expense that is not typically affected by operations during any particular period.
Acquisition-Related Expenses: Zendesk views acquisition-related expenses, such as transac-tion costs, integration costs, restructuring costs, and acquisition-related retention payments as events that are not necessarily reflective of operational performance during a period. In particular, Zendesk believes the consideration of measures that exclude such expenses can assist in the comparison of operational performance in different periods which may or may not include such expenses.
Zendesk provides disclosures regarding its free cash flow, which is defined as net cash from operating activities, less purchases of property and equipment and internal-use software development costs. Zendesk uses free cash flow, among other measures, to evaluate the ability of its operations to generate cash that is available for purposes other than capital expenditures and capitalized software development costs. Zendesk believes that informa-tion regarding free cash flow provides investors with an important perspective on the cash available to fund ongoing operations.
Zendesk’s disclosures regarding its expectations for its non-GAAP operating margin include adjustments to its expectations for its GAAP operating margin that exclude the expected share-based compensation and related expenses and amortization of purchased intangibles excluded from its expectations for non-GAAP operating loss as compared to its expectation for GAAP operating loss for the same period.
Zendesk’s disclosures regarding its expectations for its non-GAAP gross margin include adjustments to its expectations for its GAAP gross margin that exclude share-based com-pensation and related expenses in Zendesk’s cost of revenue and amortization of purchased intangibles related to developed technology. The share-based compensation and related expenses excluded due to such adjustments are primarily comprised of the share-based compensation and related expenses for employees associated with Zendesk’s platform infrastructure, product support, and professional service organizations.

Zendesk Shareholder Letter Q1 2017 - 20
Zendesk does not provide a reconciliation of its non-GAAP gross margin guidance to GAAP gross margin for future periods because Zendesk does not provide guidance on the rec-onciling items between GAAP gross margin and non-GAAP gross margin, as a result of the uncertainty regarding, and the potential variability of, these items. The actual amount of such reconciling items will have a significant impact on Zendesk’s non-GAAP gross margin and, accordingly, a reconciliation of GAAP gross margin to non-GAAP gross margin guidance for the period is not available without unreasonable effort.
Zendesk uses non-GAAP financial information to evaluate its ongoing operations and for internal planning and forecasting purposes. Zendesk’s management does not itself, nor does it suggest that investors should, consider such non-GAAP financial measures in isolation from, or as a substitute for, financial information prepared in accordance with GAAP. Zendesk presents such non-GAAP financial measures in reporting its financial results to provide inves-tors with an additional tool to evaluate Zendesk’s operating results. Zendesk believes these non-GAAP financial measures are useful because they allow for greater transparency with respect to key metrics used by management in its financial and operational decision-making. This allows investors and others to better understand and evaluate Zendesk’s operating results and future prospects in the same manner as management.
Zendesk’s management believes it is useful for itself and investors to review, as applicable, both GAAP information that may include items such as share-based compensation and related expenses, amortization of purchased intangibles, transaction costs related to acqui-sitions, and the non-GAAP measures that exclude such information in order to assess the performance of Zendesk’s business and for planning and forecasting in subsequent periods. When Zendesk uses such a non-GAAP financial measure with respect to historical periods, it provides a reconciliation of the non-GAAP financial measure to the most closely compara-ble GAAP financial measure. When Zendesk uses such a non-GAAP financial measure in a forward-looking manner for future periods, and a reconciliation is not determinable without unreasonable effort, Zendesk provides the reconciling information that is determinable without unreasonable effort and identifies the information that would need to be added or subtracted from the non-GAAP measure to arrive at the most directly comparable GAAP measure. Investors are encouraged to review the related GAAP financial measures and the reconciliation of these non-GAAP financial measures to their most directly comparable GAAP financial measure as detailed above.
About Operating MetricsZendesk reviews a number of operating metrics to evaluate its business, measure performance, identify trends, formulate business plans, and make strategic decisions. These include the number of paid customer accounts on Zendesk Support, Zendesk Chat, and its other products, dollar-based net expansion rate, monthly recurring revenue represented by its churned customers, and the percentage of its monthly recurring revenue from Support originating from customers with more than 100 agents on Support.
Zendesk defines the number of paid customer accounts at the end of any particular period as the sum of (i) the number of accounts on Support, exclusive of its legacy Starter plan, free trials or other free services, (ii) the number of accounts using Chat, exclusive of free trials or other free services, and (iii) the number of accounts on all of its other products, exclusive of free trials and other free services, each as of the end of the period and as identified by a unique account identifier. Use of Support, Chat, and Zendesk’s other products requires separate subscriptions and each of these accounts are treated as a separate paid customer account. Existing customers may also expand their utilization of Zendesk’s products by adding new accounts and a single consolidated organization or customer may have multiple accounts across each of Zendesk’s products to service separate subsidiaries, divisions, or work processes. Each of these accounts is also treated as a separate paid customer account.
Zendesk’s dollar-based net expansion rate provides a measurement of its ability to increase revenue across its existing customer base through expansion of authorized agents associated with a paid customer account, upgrades in subscription plans, and the purchase of additional products as offset by churn, contraction in authorized agents associated with a paid customer account, and downgrades in subscription plans. Zendesk’s dollar-based net expansion rate is based upon monthly recurring revenue for a set of paid customer accounts on its products. Monthly recurring revenue for a paid customer account is a legal and contractual determination made by assessing the contractual terms of each paid customer account, as of the date of determination, as to the revenue Zendesk expects to generate in the next monthly period for that paid customer account, assuming no changes to the subscription and without taking into account any one-time discounts or any platform usage above the subscription base, if any, that may be applicable to such subscription. Monthly recurring revenue is not determined by reference to historical revenue, deferred revenue, or any other United States generally accepted accounting principles, or GAAP, financial measure over any period. It is forward-looking and contractually derived as of the date of determination.
Zendesk calculates its dollar-based net expansion rate by dividing the retained revenue net of contraction and churn by Zendesk’s base revenue. Zendesk defines its base revenue as the aggregate monthly recurring revenue across its products for customers with paid customer accounts on Support or Chat as of the date one year prior to the date of calculation. Zendesk defines the retained revenue net of contraction and churn as the aggregate monthly recurring revenue across its products for the same customer base included in the measure of base revenue at the end of the annual period being measured. The dollar-based net expansion rate is also adjusted to eliminate the effect of certain activities that Zendesk identifies involving the transfer of agents between paid customer accounts, consolidation of customer accounts, or the split of a single paid customer account into multiple paid customer accounts. In addition, the dollar-based net expansion rate is adjusted to include paid customer accounts in the customer base used to determine retained revenue net of contraction and churn that share common corporate information with customers in the customer base that are used to determine the base revenue. Giving effect to this consolidation results in Zendesk’s dollar-based net expansion rate being calculated across approximately 84,700 customers, as compared to the approximately 101,800 total paid customer accounts as of March 31, 2017.
To the extent that Zendesk can determine that the underlying customers do not share common corporate information, Zendesk does not aggregate paid customer accounts associated with reseller and other similar channel arrangements for the purposes of determining its dollar-based net expansion rate. While not material, Zendesk believes the failure to account for these activities would otherwise skew the dollar-based net expansion metrics associated with customers that maintain multiple paid customer accounts across its products and paid customer accounts associated with reseller and other similar channel arrangements.
Zendesk does not currently incorporate operating metrics associated with its analytics product into its measurement of dollar-based net expansion rate.
For a more detailed description of how Zendesk calculates its dollar-based net expansion rate, please refer to Zendesk’s periodic reports filed with the Securities and Exchange Commission.

Zendesk Shareholder Letter Q1 2017 - 21
Zendesk calculates its monthly recurring revenue represented by its churned customers on an annualized basis by dividing base revenue associated with paid customer accounts on Support that churn, either by termination of the subscription or failure to renew, during the annual period being measured, by Zendesk’s base revenue. Zendesk’s monthly recurring revenue represented by its churned customers excludes expansion or contraction associated with paid customer accounts on Support and the effect of upgrades or downgrades in subscription plan. The monthly recurring revenue represented by its churned customers is adjusted to exclude paid customer accounts that churned from the customer base used that share common corporate information with customer accounts that did not churn from the customer base during the annual period being measured. While not material, Zendesk believes the failure to make this adjustment could otherwise skew the monthly recurring revenue represented by its churned customers as a result of customers that maintain multiple paid customer accounts on Support.
Zendesk’s percentage of monthly recurring revenue from Support that is generated by customers with 100 or more agents on Support is determined by dividing the monthly recurring revenue from Support for paid customer accounts with more than 100 agents on Support as of the measurement date by the monthly recurring revenue from Support for all paid customer accounts on Support as of the measurement date. Zendesk determines the customers with 100 or more agents on Support as of the measurement date based on the number of activated agents on Support at the measurement date and includes adjustments to aggregate paid customer accounts that share common corporate information.
Zendesk determines the annualized value of a contract by annualizing the monthly recurring revenue for such contract.
Zendesk does not currently incorporate operating metrics associated with products other than Support into its measurement of monthly recurring revenue represented by its churned customers or the percentage of monthly recurring revenue from Support that is generated by customers with 100 or more agents on Support.
About Customer MetricsMarch
31, 2016June
30, 2016September
30, 2016 December
31, 2016 March
31, 2017
Paid customer accounts on Zendesk Support (approx.) 39,900 43,700 47,400 50,800 54,900
+ Paid customer accounts on Zendesk Chat (approx.) 35,700 37,800 40,000 41,300 44,000
+ Paid customer accounts on other Zendesk products (approx.) 800 1,300 1,700 2,200 2,900
= Approximate number of paid customer accounts 76,400 82,800 89,100 94,300 101,800
Source: Zendesk, Inc.
Contact:
Investor Contact
Marc Cabi, +1 415-852-3877
Media Contact
Natalia Wodecki, +1 415-694-9413