Shareholder Activism and Voluntary Disclosure Bourveau_2016... · Shareholder Activism and...
51
Shareholder Activism and Voluntary Disclosure * Thomas Bourveau HKUST [email protected] Jordan Schoenfeld University of Utah [email protected] January 2016 Abstract Public disclosure can theoretically increase or decrease the likelihood of shareholder activism. This study constructs an empirical model of activism and disclosure using a unique data set of 1,130 activism events from 2005 to 2011. Our findings indicate that when the threat of activism increases, managers respond by increasing disclosure, and these additional disclosures reduce the probability of being targeted by an activist. The negative association between disclosure and being targeted by an activist suggests that disclosure deters activist intervention. Additional findings reveal that upon being targeted by an activist, disclosure levels remain stable and firms are likely to adopt a poison pill. Keywords: Corporate Disclosure, Corporate Governance, Shareholder Activism * We thank seminar participants at HEC Paris, Maastricht University, the University of Michigan, and the 2015 Singapore Management University Accounting Symposium. We also thank the Harvard Law School Forum on Corporate Governance and Financial Regulation for featuring this paper on October 21, 2015. Corresponding author: Jordan Schoenfeld, 1655 Campus Center Drive, Salt Lake City, UT 84112; e-mail: [email protected]; tel: (801) 581-4065; fax: (801) 581-3581.
Transcript of Shareholder Activism and Voluntary Disclosure Bourveau_2016... · Shareholder Activism and...

Shareholder Activism and Voluntary Disclosure∗
Thomas BourveauHKUST
Jordan SchoenfeldUniversity of Utah
January 2016
Abstract
Public disclosure can theoretically increase or decrease the likelihood of shareholder
activism. This study constructs an empirical model of activism and disclosure using
a unique data set of 1,130 activism events from 2005 to 2011. Our findings indicate
that when the threat of activism increases, managers respond by increasing disclosure,
and these additional disclosures reduce the probability of being targeted by an activist.
The negative association between disclosure and being targeted by an activist suggests
that disclosure deters activist intervention. Additional findings reveal that upon being
targeted by an activist, disclosure levels remain stable and firms are likely to adopt a
poison pill.
Keywords: Corporate Disclosure, Corporate Governance, Shareholder Activism
∗We thank seminar participants at HEC Paris, Maastricht University, the University of Michigan, andthe 2015 Singapore Management University Accounting Symposium. We also thank the Harvard Law SchoolForum on Corporate Governance and Financial Regulation for featuring this paper on October 21, 2015.Corresponding author: Jordan Schoenfeld, 1655 Campus Center Drive, Salt Lake City, UT 84112; e-mail:[email protected]; tel: (801) 581-4065; fax: (801) 581-3581.

Shareholder Activism and Voluntary Disclosure
Abstract
Public disclosure can theoretically increase or decrease the likelihood of shareholderactivism. This study constructs an empirical model of activism and disclosure usinga unique data set of 1,130 activism events from 2005 to 2011. Our findings indicatethat when the threat of activism increases, managers respond by increasing disclosure,and these additional disclosures reduce the probability of being targeted by an activist.The negative association between disclosure and being targeted by an activist suggeststhat disclosure deters activist intervention. Additional findings reveal that upon beingtargeted by an activist, disclosure levels remain stable and firms are likely to adopt apoison pill.
1

1 Introduction
Information is the foundation on which traders form their beliefs about a company and
ultimately make their investment decisions. In empirical settings, information often arrives in
the form of a company disclosure. Since managers have significant discretion over disclosure,
accounting researchers have extensively studied the relation between disclosure and trading
via the price system. The general consensus in this literature is that company disclosures
have significant pricing implications, which is in turn construed as evidence that disclosure
affects traders’ beliefs. Disclosure preferences across investors, however, have been shown
to vary, motivating an influential body of research that focuses on these preferences. We
extend this literature by studying the relation between disclosure and shareholder activists.
Activist funds are a well-established governing force in today’s financial markets, yet it is
an open question how disclosure factors into the observed outcomes in the activism literature
(e.g., Ferri and Sandino, 2009). We examine the relation between managers’ voluntary
disclosure decisions, the threat of activism, and ultimately the activist’s targeting decision.
Any structural model of the relation between activism and disclosure, however, must account
for all the strategic reporting preferences of both managers and activists. Finding reasonable
proxies for all of these preferences would prove difficult (e.g., Leuz and Verrecchia, 2000; Joos,
2000). We therefore exploit activism-peer-firm settings and construct reduced-form empirical
models for the relation between activism and disclosure. Using propensity scores, we select
a set of closely matched industry peer firms of activist targets from 2005 to 2011. Our
argument is that the threat of activism plausibly increases for the peer firms, enabling us to
first study the relation between disclosure and managers’ perceived threat of activism.
Although we cannot directly confirm that peer-firm managers perceive an increased threat
of activism in this setting, we perform validation tests to substantiate this expectation. In
particular, we show that in any year from 2005 to 2011, there is about a 2.5% uncondi-
tional probability that an activist targets a company. By comparison, there is an 11.06%
chance that an activist targets one of the peer firms in our sample. We take this finding,
2
coupled with additional returns-based validation tests, as support for the prediction that
the peer-firm setting generates a meaningful increase in the perceived threat of activism.
Our understanding of this result is that activism directs investor attention to that industry
and reduces due diligence costs for other activists to engage similar firms because they can
observe the activist’s strategy (see Section 4.1).
Our intuition for why the threat of activism could be a salient determinant of disclosure
policy starts with the idea that managers have significant motivations to avoid activism.
Activism is associated with a drop in CEO compensation, an increase in CEO turnover, and
an increase in director turnover (Brav, Jiang, Partnoy, and Thomas, 2008; Ertimur, Ferri,
and Muslu, 2011; Fos and Tsoutsoura, 2014). These phenomena are damaging to managers’
career positions, reputations, and control authority over their firms.
To build on the above idea, we argue that disclosure has several properties that could
lower the possibility of becoming an activist target: (1) It reduces information asymmetries
between shareholders, including management and the board (Cornelli et al., 2013); (2) it
signals managerial credibility to the board and existing shareholders (Graham et al., 2005;
Beyer and Dye, 2012); (3) it erodes activists’ private information advantage (Grossman and
Stiglitz, 1980); and (4) it corrects mispricings, increasing firm value on average (Balakrishnan
et al., 2014a). To be sure, we do not assert that these effects apply to all company disclosures,
but assume that these effects share a common thread: they tilt the balance against a potential
activist. This intuition appears in practitioner literature. In a May 2015 report on activism,
PricewaterhouseCoopers noted that added disclosure is likely to lower the risk of becoming an
activist target.1 The opposing view is that disclosure could promote activism by advantaging
activists, who might be superior processors of company disclosures (Kim and Verrecchia,
1994). The above benefits to disclosure might also get offset by any stock liquidity effects of
disclosure, which might promote activism (Edmans et al., 2013). Managers in turn may not
increase disclosure or may decrease disclosure in our setting. The following analysis helps to
1See http://corpgov.law.harvard.edu/2015/05/11/shareholder-activism-are-you-prepared-to-respond/.
3

resolve this ambiguity.
We collect a sample of 1,130 activist-targeted firms from 2005 to 2011 and use a propen-
sity score matching specification to identify 1,130 closely matched industry peer firms. We
conduct the main analysis on the 1,130 matched peer firms. We use the frequency of man-
agement guidance disclosures of earnings and sales to proxy for disclosure. Although we fully
recognize that disclosure comes in many forms, guidance is likely to represent a firm’s over-
all disclosure regime, including in part its shareholder relations activities (Hirst et al., 2008;
Shroff et al., 2013; Armstrong et al., 2014; Balakrishnan et al., 2014b). Given the fast-acting
nature of activists, guidance disclosures, which can be released at any time, are more appro-
priate for our setting than infrequent quarterly- or annually-scheduled disclosures. Moreover,
Beyer et al. (2010, Table 1) report that 16% of stock return variance is explained by guid-
ance disclosures, whereas SEC filings, including 8-Ks, 10-Ks, and press releases, account for
just 4% in sum. We also draw on the findings of Rogers and Stocken (2005), who show that
external monitoring is likely to influence managers’ guidance choices. We make no prediction
on whether any specific guidance disclosure represents positive or negative news: negative
news may lower firm value but significantly enhance managers’ credibility with the board or
lower the possibility of shareholder litigation (Skinner, 1994; Skinner, 1997; Graham et al.,
2005, p. 6). In any case, Balakrishnan et al. (2014a) find that guidance disclosures increase
firm value on average.2
We exploit each peer firm’s disclosure behavior around the activist campaign announce-
ment date at its counterpart activist-targeted firm. We compare each peer firm’s disclosures
for a two-year pre-observation period to a two-year post-observation period, eliminating firm-
fixed effects from the analysis. To eliminate time-varying disclosure effects common to all
firms, we control for contemporaneous changes in disclosures for the average U.S. I/B/E/S
2The assumption in this research design is that the activist’s decision to target a firm is unrelated toits closely matched peer firm’s future disclosures except through its effect on the threat of activism (seeSection 4.1). Prior studies of the determinants of activist targets suggest that this assumption is appropriate(Brav et al., 2010; Edmans, 2014). In Sections 4.2 and 4.3, we empirically show that our results cannot beattributed to disclosure motivations for targeting a certain industry. We use the terms activist-targeted firmand activism firm interchangeably throughout the paper.
4

firm. To help rule out the possibility that some industry-specific time-varying effect drives
the results, we conduct extensive sensitivity analyses on the matching procedure and run al-
ternative matching techniques. Section 4.2 provides the exact specifications and identifying
assumptions.
Our findings indicate that peer firms respond to activism at their paired counterparts by
disclosing 3.03 more earnings and sales estimates in the two years following the announcement
of the activist campaign (post period) than in the two years before (pre period), relative to
contemporaneous changes in the same guidance disclosures for the average U.S. I/B/E/S firm
and for the activism firm. This change of 3.03 represents a 28% increase from the pre period
and occurs quickly. Figure 1 shows that peer firms elevate their disclosure levels within
one quarter after the activism campaign announcement date of their matched counterpart.
We also find that 9.2% of peer firms disclose guidance for the first time in the post period.
The economic magnitudes of these results are meaningful: Kothari, Shu, and Wysocki (2009)
and Rogers, Skinner, and Van Buskirk (2009) find that just one guidance disclosure increases
price informativeness.
We extend the analysis to three cross-sectional settings. Angrist and Krueger (2001,
p. 78) argue that most exogenous shock settings will have a heterogeneous effect across
affected subjects. In the first test, we identify firms that are more likely to be targeted
by activists—specifically, firms that do not pay cash dividends (e.g., La Porta et al., 2000;
Klein and Zur, 2009). We find that non-dividend-paying firms provide more disclosure than
dividend-paying firms in our setting. In the second test, we identify firms that we expect
to be less sensitive to the threat of activism—firms with strong takeover defenses and those
in which the boards of directors and management teams would be relatively difficult for an
activist to unseat (Bebchuk and Cohen, 2005; Bebchuk, Cohen, and Ferrell, 2009). We find
that strong takeover defense firms provide less disclosure than weak takeover defense firms.3
In the third test, we identify activist campaigns that appear more threatening—specifically,
3In Section 4.5, we explicitly test the alternative hypothesis that activists target insulated managers.
5

those in which activists release a public letter to management and/or shareholders with
their campaign announcement. Open letters are salient mechanisms in our setting because
by revealing their strategy, activists plausibly reduce due diligence costs for activism at
similar firms. We find that when the activist makes such a letter public, peer firms provide
more disclosure relative to when no such letter is made public.
In our second analysis, we test whether the increase in disclosure affects the probability
that a firm will be targeted by an activist. Recall that we must test this hypothesis directly
because disclosure can theoretically encourage or discourage activism (Harris and Raviv,
1993; Kim and Verrecchia, 1994). We split the peer-firm sample into two groups, high
disclosers and low disclosers. High-discloser firms include guidance-initiating peer firms and
peer firms disclosing more than the sample median percent change in guidance from the
pre to the post period. We find that high-disclosing peer firms are 16% less likely than
low-disclosing peer firms to be targeted by an activist in the two-year period following the
activist campaign announcement date. These results suggest a negative association between
disclosure and being targeted by an activist in our setting.
Our findings contribute to the shareholder activism and disclosure literatures in several
ways. First, this study speaks to the question of how managers’ disclosure choices relate to
large influential investors. Bushee and Noe (2000) argue that managers may adopt certain
disclosure practices to attract institutional investors, Ertimur, Sletten, and Sunder (2014)
find that managers strategically disclose to benefit venture capitalists, and Boone and White
(2015) argue that indexing institutions prefer high disclosure. In contrast to Chen and Jung
(2015), who study disclosure at activist-targeted companies, we do not focus our analysis
on companies already engaged by an activist. We expect these companies to pursue costlier
strategic mechanisms such as adopting poison pills or engaging in direct negotiation (we test
this assertion and verify the Chen and Jung (2015) findings in Section 5.4). Second, our
results connect to activism studies that focus on mandatory financial statement and com-
pensation disclosures. Brav et al. (2008, Table 4) show that activists target companies with
6

high ROA, low dividend payout, and strong cash flow, and Ertimur, Ferri, and Muslu (2011)
show that activists target companies with excessive executive pay. Third, we relate our study
to influential governance theories that assume that a firm’s information environment is an
exogenous force in activism settings (Maug, 1998; Edmans and Manso, 2011). Our perspec-
tive is that managers have significant influence over their firms’ information environments
because they can strategically disclose.
We also introduce a relatively new activism data set. These data do not rely exclusively on
13D filings, which pertain to shareholders that accumulate 5%+ of a company’s outstanding
stock, to identify shareholder activism. The analysis of activism at all levels of ownership
complements Brav et al. (2008) and Klein and Zur (2009), who use 13D filings to identify
activism. Section 3 provides examples of activism at relatively low ownership levels and
more detail on the data.
In Section 2, we motivate the hypotheses. In Section 3 we describe the data and in
Section 4 we report the empirical results. In Section 5, we conduct sensitivity analyses and
provide additional descriptive statistics. In Section 6, we conclude and suggest avenues for
future research.
2 Hypothesis Development
To situate this study in the literature, we adopt the activism life-cycle framework of Brav,
Jiang, and Kim (2010). They find that most activism studies relate to one or more stages
of activism: (1) the characteristics of activist target firms, (2) activist engagement tactics,
and (3) the activism outcome. Since we concentrate the analysis on voluntary disclosure
decisions and the threat of activism, our study best falls under category (1). Drawing on
prior research, we conceptualize the threat of activism as the chance that managers will
lose control of their firms, either in part or in whole; lose their jobs; and/or have their pay
reduced (Edmans, 2014).
7

We follow much of the strategic disclosure literature and assume that competitive forces
drive firms’ disclosure levels to a second-best equilibrium that trades off managers’ and in-
vestors’ disclosure preferences. We then locate an exogenous shock that causes the threat
of investor activism to increase. We conjecture that as the threat of activism increases, the
net benefit of an additional unit of disclosure increases. Although we cannot measure these
marginal costs and benefits directly, we argue that our research setting plays an important
role in determining such marginal returns. Disclosure then moves to a new second-best
level, and we can compare the difference in the disclosure levels (we verify that the threat
of activism indeed moves to elevated levels in Section 4). We set as a baseline the contem-
poraneous change in disclosure for the average firm in the U.S. I/B/E/S universe because
differences in the disclosure level could vary across pairs and time due to common shifts in
disclosure practices. The advantage of an exogenous shock setting is that it confers a reduced
form empirical structure on the relation between activism and disclosure. To the extent that
other drivers of disclosure, such as macroeconomic conditions, change in the same manner
across the peer firm and the average U.S. I/B/E/S firm (i.e., time-varying effects), or are
constant (i.e., firm-fixed effects), the research design eliminates these factors from the anal-
ysis (Bertrand, Duflo, and Mullainathan, 2004). The previous arguments lead to the first
hypothesis:
H1: When one company is engaged by an activist investor, its propensity score matched
peer firm discloses more guidance, relative to economy-wide changes in guidance and the
activism firm.
H1 relies on the assumption that prior to the increase in the threat of activism, managers
of the peer firm preferred less disclosure. That is, after the increase in the threat of activism,
the benefit of an additional unit of disclosure increases and managers increase disclosure.
To test this assumption further, we conduct three comparative statics tests. First, we test
whether a given increase in the threat of investor activism disproportionately affects man-
agers of non-dividend-paying firms. This test draws on prior studies that find that activists
8

are more likely to target non-dividend-paying firms (Klein and Zur, 2009). Accordingly, we
predict:
H2: The results for H1 are stronger when the peer firm does not pay a dividend.
Next, we test whether firms with strong takeover defenses (i.e., firms whose managers
and boards would be difficult for an activist to unseat) are less sensitive to a given increase in
the threat of activism. While activists might occasionally target a company purely because
its managers are insulated, prior research suggests that this phenomenon is unlikely to occur
on average; firms insulated from external shareholders systematically maintain low market
valuations relative to less insulated firms (Bebchuk and Cohen, 2005). Prior research also
suggests that activist investors impose changes in firms’ operations and payout policies by
replacing managers, replacing board members, and reducing managerial compensation. All of
these actions would be costlier at a firm with significant managerial protection mechanisms.
We therefore expect firms with stronger takeover defenses to be less sensitive to a given
increase in the threat of activism and predict:
H3: The results for H1 are weaker when the peer firm has strong takeover defenses.
H2 and H3 exploit heterogeneity in managerial sensitivity to activism. In the last compar-
ative analysis, we exploit heterogeneity in the activist campaigns based on the assumption
that not all activist campaigns convey the same magnitude of threat to the peer firms.
Specifically, we conjecture that:
H4: The results for H1 are stronger when the activist releases a public letter to the target
firm’s management and/or shareholders.
H4 relies on the assumption that activist campaigns accompanied by a public letter to
the target firm’s management and/or shareholders are perceived as more threatening by
managers of the peer firms. Activists often disseminate open letters—letters in which they
state their intentions toward and concerns about the target firm—to the media. These letters
are salient mechanisms in our setting because they plausibly reduce activism due diligence
costs for similar firms. We expect these letters to increase the perceived threat of activism
9

by managers of the peer firm.
The collective effect of H1 to H4 lead to the final prediction:
H5: When one company is engaged by an activist investor, its propensity score matched
peer firm discloses more guidance, relative to economy-wide changes in guidance and the
activism firm, and these guidance disclosures are negatively associated with the probability of
being targeted by an activist.
Testing H5 directly is important because, as noted in Section 1, theory suggests that
additional disclosure can either encourage or discourage shareholder activism. Resolving
this ambiguity by illustrating the relation between disclosure and shareholder activists thus
helps to provide an empirical test of the sophisticated market participant theory developed
in Harris and Raviv (1993) and Kim and Verrecchia (1994).
3 Data
We identify activist campaigns using data from SharkWatch, a corporate governance
database of FactSet Research Systems operated by Thomson Reuters. FactSet documents
all activist investor campaigns at publicly traded U.S. companies and provides accompanying
campaign characteristics, such as the announcement date of the activist campaign, whether
the activist campaign was associated with a 13D filing, and the activists’ engagement tactics.
As reported in Table 1, Panels A and B, our FactSet sample begins in 2005 and covers all
industry groups and years through 2011. A key feature of this data source is that it does not
rely on 13D filings or ownership level to identify activist campaigns. 13D filings, which apply
only to investors that accumulate 5% or more of a company’s outstanding common stock,
are not always indicative of activism and do not identify activist owners at lower levels of
10

ownership.4 Instead, the data source identifies activism campaigns based on Rule 14a-1 to
14a-13 disclosures, which a shareholder must file if they intend to wage a proxy fight; 13D
filings in which Item 4, the Purpose of Transaction, is activism-related; Rule 14a-2(b)(1)
disclosures, otherwise called exempt solicitations; and activist public disclosures or press
releases that indicate imminent activism and share ownership. 13D filings are the initiating
mechanism for 15% of the activism campaigns in our sample; exempt solicitations, 7%; proxy
fights, 23%; and public disclosures and press releases by the activist, 55% (note that 13D
filings may come later in the activism process).5
We obtain financial data for the activism firms by matching the SharkWatch sample
to Compustat and CRSP data. To identify the effect of investor activism threats, we pair
each activism firm with a closely matched industry peer using propensity scores. We conduct
validation tests for this setting in Section 4.1. We empirically model the activist’s decision to
engage with a firm by expanding on the same type of model in Brav et al. (2008) and use this
model as the propensity score specification (see variable definitions in Appendix A). After
obtaining propensity scores, we sort by industry and year and use nearest-neighbor matching
to select the peer firm. Appendix B reports the results from the propensity score regression.
The results show that size is the main determining factor for the matching procedure (1%
level). It is reassuring to note that a firm’s disclosure level is negatively associated with the
probability of being targeted by an activist (5% level). This result is consistent with Table
2, which reports that activism firms disclose less than peer firms in the pre period, although
this pre period difference is not statistically significant when measured in half-year windows
4An example of the latter point is Carl Icahn’s recent effort at eBay to replace board members andsell off PayPal with only 3% ownership (see “Ending Vitriol, Icahn and eBay Reach a Deal” by MichaelJ. de la Merced, The New York Times, April 10, 2014). Similarly, ValueAct succeeded in obtaining boardrepresentation at Microsoft with less than 1% ownership in the firm (see “New Alliances in Battle forCorporate Control” by David Gelles and Michael J. de la Merced, The New York Times, March 18, 2014).
5When data collection started in early 2014, we included a small number of firms from 2011 whose 2013Compustat and CRSP data had already become available. For this reason, the number of observations for2011 is limited. This data source is also used in related studies such as Cohen and Wang (2013), Gow, Shin,and Srinivasan (2014a,b), Popadak (2014), and Appel et al. (2015).
11

(see Figure 1). We conduct detailed matching sensitivity analyses in Section 4.3.6
To minimize the possibility that the matching procedure systematically selects on some
unobserved factor, we (1) eliminate firm-fixed effects, which removes any unobserved time-
invariant disclosure effect, and (2) follow Rosenbaum and Rubin (1985) and use differences in
the activism firm-peer-firm propensity scores to conduct sensitivity analyses on the matching
procedure. Sections 4.2 and 4.3 detail these analyses. Included in the main tests is also a set
of firm-specific, time-varying control variables to account for known and observed determi-
nants of disclosure. Also included are industry-specific and economy-wide disclosure trend
variables to control for common, time-varying changes in disclosure; these trend measures
are allowed to vary for each pairing.
The research design requires that for each activist-peer-firm match, we obtain financial
data for both the activist and peer firm at two years before and after the activist campaign
announcement date. This procedure limits our sample to 2005–2011. We choose a two-year
post window because it gives managers of the peer firms time to adjust their disclosures. After
we eliminate activist-peer-firm matches without two years of pre- and post-announcement-
date Compustat and CRSP data, the final sample comprises 1,130 activist campaigns, which
relates well to the number of campaigns analyzed in related studies.7 The relatively few
observations (135) that we eliminate due to mergers, bankruptcy, or missing Compustat and
CRSP data significantly limit the influence of a look-ahead or survivorship bias.
The disclosure proxy in this setting is management disclosures of quarterly and annual
EPS and sales estimates. We obtain management guidance from the Thomson Reuters
6To maximize the pool of potential matches, we do not include a firm-level governance proxy as a regressorin the propensity score specification. These data are generally available only for large companies, and we canonly obtain the FactSet governance proxy for the matched peer firm in the year of the activism campaign.However, Bebchuk et al. (2009, Table 2) report that governance structures are highly stable over time. Firm-fixed effect differencing therefore eliminates any pre-existing relation between governance and disclosure (seeSection 4.2).
7Brav et al. (2015) use 13D filings to identify activism and have a sample of 1,575 firms from 1994to 2007. The 10 most frequently occurring activist campaign initiators in our sample are GAMCO AssetManagement Inc. (72 campaigns), The California Public Employees’ Retirement System (29), ValueActCapital Management LP (29), Millennium Management LLC (25), Starboard Value LP (19), Third PointLLC (18), Discovery Group Inc. (17), Icahn Associates Corp. (17), PL Capital, LLC (16), and Loeb CapitalManagement LLC (15).
12

I/B/E/S Guidance file. We define the pre-period as [−2 years, 0) and post period as [0,
+2 years], where T = 0 is the activist campaign announcement date. For the matched and
activism firms’ pre- and post-period observation windows, we aggregate the total number of
management EPS and sales estimates in each period based on the guidance announcement
date.
Turning to descriptive statistics, Table 2 reports that activism firms are generally large
in size, with an average market capitalization of $7.3 billion (median of $294 million). On
average, the activism firms disclose 9.7 EPS and sales estimates in each of the two-year pre-
and post-campaign-announcement-date windows. The propensity matched control firms are
also large, with an average market capitalization of $4.5 billion (median of $540 million).
On average, the matched peer firms disclose 10.71 EPS and sales estimates in the pre period
and 12.73 estimates in the post period (difference is statistically significant at the 1% level).
The two sets of firms are similar on the dimensions of median ROA, cash, debt, capital
expenditures, and institutional ownership. We note that these companies are on average
larger than the companies in Brav et al. (2008). Activists during our sample period (which
is more recent) engaged both smaller and larger companies relative to the Brav et al. (2008)
sample, but with the largest companies being significantly larger. Our sample also includes
activist events at lower levels of ownership, not just 5%+.8
We follow three empirical approaches to address the differences between the activist and
peer firms. First, to the extent that disclosure relates to relatively stable factors such as
size and proprietary costs, the research design eliminates these factors as firm-fixed effects.
Second, we include a set of time-varying control regressors known to affect disclosure. These
variables and their sources are described in Appendix A and include profitability, stock
performance, R&D, capital expenditures, analyst following, and institutional ownership.
Third, we check for and find parallel disclosure trends across the peer firms, the target firms,
8Also contributing to the larger companies we observe is the fact that our data do not require a 13D filingto mark an activism event. These observations would not appear in the Brav et al. (2008) sample. Notethat FactSet covers all publicly traded U.S. companies and activist events at all ownership levels, not justlarge companies and 13D filings.
13

and the average U.S. firm (see Figure 1). As Angrist and Krueger (1999) and Lemmon and
Roberts (2010, p. 568) elucidate, the parallel trend is the key identifying assumption that
eliminates factors that might drive across-firm differences in disclosure levels. That is, even
if covariates are unevenly balanced for a matched sample, a parallel trend in the outcome
variable of interest assures the integrity of statistical inference for event-type analyses. Since
this assumption is realized in Figure 1, the change in disclosure is the empirical focus of this
study. Still, the peer firms might be poor matches based on the increased threat of activism
dimension. We conjecture that using poor matches in this sense biases against the results
and yields a lower bound estimate of the activism and disclosure relation. This conjecture
is explicitly validated in Section 4.3, where we re-estimate our main result using a second,
less comparable set of matched peer firms.
The cross-sectional analyses identify dividend payers using data from Compustat and
takeover defense strength using a firm-level proxy from FactSet. FactSet provides a takeover
defense strength variable for most U.S. public companies. This measure is similar to the
Bebchuk et al. (2009) Entrenchment Index and is compiled from a company’s articles of
incorporation and bylaws, including whether the company has staggered board voting and
a shareholder rights plan such as a poison pill, factors known to insulate management from
outside shareholders (Bebchuk and Cohen, 2005; Bebchuk et al., 2009). Studies such as
Cohen and Wang (2013) and Popadak (2014) also use this measure as a proxy for takeover
defense strength. We identify whether the activist publicly disclosed an open letter using
data from FactSet.
4 Empirical Results
4.1 Validation of the Peer-Firm Settings
We perform two exercises to validate the peer-firm settings. These tests ensure that
the activist campaign is not an idiosyncratic event that bears no relation to the threat of
14

activism at the peer firm. First, we check for a measurable increase in the threat of activism
at the peer firms using the observed level of activist targeting at these firms. Gantchev et al.
(2015) finds that the unconditional baseline probability of being targeted is about 2.5% in
any given year from 2002 to 2011. By comparison, we find an 11.06% probability that an
activist targets one of our peer firms in the post period. This elevated level is consistent
with our maintained assumption that activism in one firm leads to an increase in the threat
of activism at a closely matched peer firm. Our understanding of this result is that activism
directs investor attention to that industry and by observing the activist’s strategy, it reduces
due diligence costs for other activists to engage similar firms.9
In the second exercise, we validate the peer-firm setting using abnormal stock returns.
The motivation for checking returns is based on prior studies that use stock returns to test
the effect of other anticipated events. For example, Schwert (1981) and Binder (1985) use
stock returns to test the effect of anticipated regulation. Table 3 reports the results. In
Column (1), we find that activist-targeted firms experience, on average, cumulative absolute
abnormal returns of 8.8% (1% level) during the [−10 days, +10 days] window around the
activist campaign announcement date (T = 0). The magnitude of the activism firm effect is
comparable to Brav et al. (2008). In Column (2), we check returns at the closely matched
industry peer firms and find cumulative absolute abnormal returns of 6.2% (1% level) during
the same [−10 days, +10 days] window. We take the elevated abnormal returns as added
support for the validity of our peer-firm setting.10
9Peer-firm settings have also been used to evaluate responses to other threats, such as the risk of hostiletakeovers (Servaes and Tamayo, 2014) and the risk of securities lawsuits (Gande and Lewis, 2009; Arena andJulio, 2014).
10Signed abnormal returns for the peer firms are not statistically different from zero. Nonetheless, wecontrol for the direction of the signed abnormal return for both the activist and peer firm in our main tests.The short-window return results are not sensitive to other return benchmarks, such as a one-year market-model beta. Stock return volatility appears unchanged at the peer firms from the pre- to the post-period;therefore we do not include this measure as a control regressor.
15

4.2 Research Design and Regression Specifications
The difference-in-differences research design controls for firm-fixed effects, contemporane-
ous economy-wide disclosure trends, and changes in disclosure at the activist-targeted firm.
In contrast to studies that use propensity scores to identify control firms, in our setting the
matched peer firms are the treatment firms (i.e., they receive a shock to the threat of ac-
tivism). The average economy-wide firm and activist-targeted firms are the control disclosure
baselines. The main equations for the peer firms, in levels, are as follows:
DISCM ;T=0 =n∑
i=1
ControliM ;T=0+ γ̃M ;T=0 + θ̃M,A;T=0 + η̃M,E;T=0 + ε̃M ;T=0 (1)
DISCM ;T=1 =n∑
i=1
ControliM ;T=1+ γ̃M ;T=1 + θ̃M,A;T=1 + η̃M,E;T=1 + ε̃M ;T=1 (2)
The dependent variable DISC stands for the main disclosure proxy, management guid-
ance of EPS and sales. T = 0 represents the two-year period before the activist campaign
announcement date (pre period), and T = 1 represents the two-year period after the an-
nouncement date (post period). γ̃M ;T=0,1 represents firm-fixed effects, such as proprietary
costs, and θ̃M,A;T=0,1 represents unobservable time-varying effects common to each peer-
firm-activism-firm pairing, such as macroeconomic shocks. However, recall that because the
activist could have selected her target based on an unobservable factor, it could be that
some time-varying effect differs for the activist and peer firm. For example, the activist may
not want more disclosure at the target firm in order to maintain an information advantage.
We therefore include an economy-wide disclosure variable to control for any time-varying
effect common to all firms except the activism firm, based on the U.S. I/B/E/S universe,
and represented by η̃M,E;T=0,1.11
Following Bertrand, Duflo, and Mullainathan (2004), we compute the differences in our
11Note that the activist events occur at different times from 2005 to 2011, further reducing the possibilitythat any one time-varying factor would drive the results. In Section 4.3, we conduct detailed within-industrysensitivity analyses to rule out the possibility that an industry effect unrelated to the threat of activism orshifting activism risk at the targeted firm drive the results.
16

observed disclosure and control variable measurements from the pre to the post period for
each peer firm by subtracting equation (1) from (2). We then estimate the following regres-
sion:
∆DISCM = αM +n∑
i=1
βi∆ControliM + ε̃M (3)
The differencing procedure eliminates firm-fixed effects (DISCM ;T=1−DISCM ;T=0). We
obtain a difference-in-differences design by including average economy-wide changes in dis-
closure from the pre to post period as a regressor in our main specifications. The impetus for
including this regressor is that it eliminates variation in disclosure for each peer firm that is
common to the average U.S. firm.12 We compute the average U.S. I/B/E/S firm difference
by first measuring the average number of guidance disclosures per firm in the U.S. I/B/E/S
universe during each peer firm’s pre period, η̃M,E;T=0. We then subtract η̃M,E;T=0 from the
same measure calculated during the peer firm’s post period, η̃M,E;T=1. In contrast to year-
fixed effects, which impose that any time effect be constant across pairings in a given year,
the economy-wide disclosure trend variable is distinct for each pairing.13 All tests therefore
eliminate contemporaneous economy-wide trends in guidance disclosures. After subtracting
equation (1) from (2), we attribute the intercept effect of the peer firm’s change in manage-
ment guidance to the increased threat of activism. We estimate this effect by the intercept
term, αM . Any remaining idiosyncratic variation in guidance forms the error terms in our
regressions.14
12Using control firm outcome variables as regressors to achieve a control “baseline” is a difference-in-differences identification method discussed further in Bertrand et al. (2004) and used in such studies asCheng, Nagar, and Rajan (2004, Tables 12–16). This method sidesteps having to subtract the average U.S.firm’s disclosure difference (and other variables) from the peer firm’s difference.
13We repeat the same procedure for the activist-targeted firm’s pre to post change in disclosure and alsoinclude this variable as a control regressor. Pairing-specific time controls are ideal for this setting becauseeach observation spans four years (two years pre and two years post) and could begin at a different timewithin a given year (i.e., one activist campaign could start in January of one year and another could startin December of that same year).
14This methodology is considered to be semi-parametric because the main effect is non-linear (the interceptterm) but control regressors are also included (Heckman et al., 1998).
17

In addition to designating the economy-wide average and activism firm changes in guid-
ance as baselines, we take measures to reduce the likelihood that other covariates drive
the results. We include regressors for changes in ROA, capital expenditures, research and
development, debt, intangibles (such as goodwill due to M&A), dividends, institutional hold-
ings, stock performance, and analyst following. In Section 5.2, we decompose institutional
holdings into fund type (e.g., indexer, transient). In Section 5.4, we test for changes in
industry-level competition measures.
We also control for several activist campaign-specific characteristics. It could be that
when the market prices the activist campaign negatively at the activism firm, the peer firm
in turn views this as good news and subsequently provides more disclosure. We include
regressors for positive returns and the level of absolute abnormal returns around the activist
campaign announcement date for both the peer firm and the activism firm.
Despite taking the previous precautions to construct a properly specified model of dis-
closure and activism, we recognize that any systematic changes in disclosure at the peer
firms not eliminated by the average economy-wide contemporaneous changes in disclosure,
the activism firms’ contemporaneous changes in disclosure, or the specific control covariates
in our regressions will lead to misspecified models. This possibility is a limitation of all
research designs.
4.3 Activism and Management Disclosures
Table 4 reports univariate statistics for the disclosure measures and peer-firm covariates.
As hypothesized, peer firms disclose 2.02 more (1% level) EPS and sales estimates in the post
period relative to the pre period. The average U.S. I/B/E/S firm, meanwhile, increases EPS
and sales guidance disclosures by 0.17, an economically small and statistically insignificant
amount. Activism firms do not notably increase guidance either.15 Figure 1 plots the
peer firm, economy-wide trend, and activism firm disclosure frequencies for eight half-year
15We discuss the results for the activism firms in Section 5.4.
18

event time periods around the activist campaign announcement date. Peer firms appear
to increase disclosure in the half-year period immediately following the activist campaign
announcement date and maintain this disclosure level for the remainder of the post period.
No visual evidence suggests that disclosure for the peer firm or activism firm was trending
upward prior to the activist campaign announcement date. This evidence helps to rule out
the possibility that existing disclosure trends at the peer firms drive our results.
We next turn to the capital markets effects of activism and find that 46% of peer firms
and 62% of activism firms have positive abnormal returns during the [−10 days, +10 days]
window. The 62% level for activism firms and the accompanying 8.8% (1% level) on average
magnitude of the return are consistent with Brav et al. (2008). Recall from Section 4.1
that peer-firm absolute abnormal returns over the [−10 days, +10 days] window are, on
average, 6.2% (1% level). Table 4 also indicates that, on average, firms reduced total assets,
increased ROA, increased capital expenditures, reduced cash holdings, and garnered more
analyst following; however, all of these effects are economically insignificant.
Table 6 reports multivariate analyses for H1. The intercept term indicates that peer firms
disclose 3.027 more EPS and sales estimates (1% level) in the post period of [0, +2 years]
relative to the pre period of [−2 years, 0), after controlling for contemporaneous changes
in disclosure at the average U.S. I/B/E/S firm and activism firm. The 3.027 additional
guidance disclosures translate to an on average increase of 28.26% in guidance from the
pre to post period, an economically meaningful shift. Healy and Palepu (2001), Kothari
et al. (2009), and Rogers et al. (2009) find that just one guidance disclosure increases price
informativeness. The magnitude of this result is comparable to those of recent studies such
as Shroff et al. (2013), which finds that firms issuing new equity increase guidance by 36%.
To further eliminate the possibility that time trends in disclosure drive our main effect, we
check whether the effect is stronger over the years 2008–2011 relative to 2005–2007. We do
not find a statistically significant difference in our main effect over these two time periods
19

(3.040 for years 2005–2007 versus 3.011 for years 2008–2011).16
Turning to the control regressors, changes in total assets and capital expenditures are
negatively associated with peer-firm disclosures (10% level). These negative associations are,
however, economically insignificant in magnitudes, and we underscore that the intercept-
term disclosure effect is in addition to these disclosures. There is still variation in peer-firm
leverage, profitability, dividend payout policy, and future stock return performance, but our
results show that these factors do not significantly affect disclosure policy in our setting. In
fact, as Figure 1 illustrates, the Table 6 result obtains quickly, within one quarter after the
activism campaign announcement date. In unreported tests we also include changes in return
on sales, asset turnover, stock liquidity proxies, and distance to default—these covariates are
all statistically insignificant when included in Table 6. The peer firms’ cumulative abnormal
returns from [−2 years, −11 days] are positively associated with their changes in guidance in
the post period, but this effect is also economically small. No evidence suggests that the peer
firms’ changes in disclosure depend on whether the market prices the activist campaign—at
either the activism firm or the peer firm—positively or negatively.
The Table 6 results are after controlling for firm-fixed effects and contemporaneous
changes in disclosure at the average U.S. I/B/E/S firm and the activism firm. We also
control for a set of peer-firm and activist-campaign characteristics. Table 4 indicates that
the firm control covariates do not change much from the pre to the post period, which gives
assurance that a firm-fixed effects research design is appropriate for this setting. The re-
sults from Table 6 and the tables that follow are not sensitive to dropping the average U.S.
I/B/E/S firm and the activism firm regressors, consistent with the relatively flat disclosure
levels for these firms illustrated in Figure 1.17 Additionally, Figure 1 indicates that it is
unlikely that existing firm or industry trends drive the results. The results are also quanti-
16These results are robust to the monotonic transformation of sign(change) ∗ ln(1 + |change|). Thistransformation attenuates the magnitude while preserving the sign of large changes.
17Following Gormley and Matsa (2014), we also report detailed univariate statistics (see Figure 1 andTable 2) and run the main tests with Fama-French 12 industry fixed effects. The results from these analysesare quantitatively similar.
20

tatively similar when limiting the sample to companies with analyst following of 2 or more,
and to companies that exist in the I/B/E/S guidance database in both the pre- and post-
periods (Chuk et al., 2013).
Added steps ensure that our results are not systematically driven by industry disclosure
features or trends. Activists might target an industry based on their expectations of future
disclosures. This effect would exist for all firms in a given industry and we test for it
accordingly. We re-estimate the main test from Table 6 and substitute new peer firms into
the analysis, specifically firms with propensity scores furthest from those of the target firms
but still within the same SIC two-digit industry. In less similar peer-firm matches we expect
the threat of activism to be lower because, for example, activism will not reduce due diligence
costs for these firms as much. By contrast, if the alternative hypothesis holds—that the main
result is due to an industry disclosure effect—then the results for the new peer firms should
be close in magnitude to the initial set of peer firms because both sets of peer firms are in the
same industry. Appendix C reports that the disclosure effect is economically weaker for the
furthest within-industry-peer-firm matches (intercept term of 0.764 versus 3.027 in Table 6).
This significant decrease suggests that the main finding cannot be attributed to an industry
disclosure phenomenon. We also conduct the same test for the initial set of closely matched
peer firms. In Appendix D, we compute the absolute value of the difference in propensity
scores for the peer firms and the activist-targeted firms. The median value of this difference
is 0.00011 (mean of 0.00066). We then split the sample by the median value; the closest
activism to peer-firm matches fall below the median. We find a stronger disclosure effect for
more closely matched peer firms (3.789 versus 2.296; difference significant at the 1% level).
In sum, these analyses help to strengthen the validity of our setting.18
18Limiting the analysis to propensity scores within certain bounds relates to the distance idea described inMahalanobis (1936) and subsequently demonstrated with propensity scores in Rosenbaum and Rubin (1985).
21

4.4 Dividends and Disclosure
We next test H2 by partitioning the sample on whether or not the peer firm pays a
dividend at the time of the activist campaign announcement date. The expectation is that
managers of non-dividend-paying firms are more sensitive to the threat of activism because
activists explicitly target non-dividend-paying firms (e.g., Klein and Zur, 2009). This conjec-
ture holds in Table 7. The disclosure effect in the non-dividend-paying sample is 3.793 (1%
level) versus 2.349 (5% level) for the dividend-paying sample (difference is significant at the
1% level). This result suggests that although companies strategically choose their dividend
policies, they weigh their decision against other strategic choices, such as disclosure.19
4.5 Takeover Defenses and Disclosure
We test H3 by partitioning the sample on the median peer firm’s takeover defense
strength. The goal is to test whether management teams and boards that are insulated
from outside shareholders are less sensitive to the threat of activism (Bebchuk and Cohen,
2005; Bebchuk et al., 2009). We identify a peer firm’s takeover defense strength using a
numerical firm-level proxy from FactSet. FactSet provides a takeover defense strength rat-
ing for most U.S. public companies. Recent studies, such as Cohen and Wang (2013) and
Popadak (2014), also use this measure as a proxy for takeover defense strength. Table 8
reports that the disclosure effect in the weak takeover defense sample is 3.840 (1% level)
versus 2.350 (5% level) in the strong takeover defense sample (difference significant at the
1% level). As hypothesized, the disclosure effect is stronger in the weak takeover defense
sample. This result suggests that insulated managers and boards are less sensitive to the
19Split-sample tests are also used in Garvey and Hanka (1999), Ofek and Yermack (2000), Cheng, Nagar,and Rajan (2004), and Ertimur, Sletten, and Sunder (2014). In Table 7, 63% (715/1130) of peer firms inour sample do not pay a dividend in both the pre and post activist campaign announcement date periods,34% (389/1130) of our sample pay dividends in both the pre and post period, and the remaining 26 firmsbegan paying a dividend in the post period relative to the pre period. We classify the 26 firms that changedividend policy as dividend-paying-firms, and our results are not sensitive to removing these firms from thesample. Because the sample split reduces the number of observations in each regression, we do not clusterstandard errors by industry as in Table 6; however, standards errors are robust to heteroscedasticity.
22

threat of activism compared to their less insulated counterparts.20
4.6 Activist Open Letters and Disclosure
We test H4 by partitioning the sample on whether the activist released an open letter to
management and/or shareholders in conjunction with the initiation of her activist campaign.
Releasing a letter to the target firm’s existing board members and shareholders is a tactic
that activists use to express their strategic preferences to management and garner support
from shareholders (55% of activist campaigns in our sample release an open letter). Activists
typically release these letters through their fund’s website or the media. Open letters are
salient mechanisms in our setting because by making their activism strategy publicly known,
activists plausibly reduce due diligence costs for activism engagement at similar firms, mag-
nifying the threat of activism at these firms. The expectation is that peer-firm managers
will respond more forcefully to these activist campaigns. This conjecture holds in Table 9.
The disclosure effect in the open-letter sample is 3.468 (1% level) versus 2.351 (5% level) in
the no-open-letter sample (difference is significant at the 1% level).
4.7 Distinctness of Comparative Statics Tests
To ensure that the three comparative tests are distinct phenomena, we compute Pearson
correlations for the indicator variables for dividends, takeover defenses, and open letters.
The largest of the correlations is 0.075 and statistically significant at the 5% level (takeover
defense and open letter). The correlations for takeover defense and dividends and for open
letter and dividends are statistically insignificant at 0.031 and 0.020, respectively. The
comparative tests appear to be distinct tests of the relation between activism and disclosure.
20As described in Section 2, this measure is similar to the Bebchuk et al. (2009) Entrenchment Indexand is compiled from a company’s articles of incorporation and bylaws, including whether the companyhas staggered board voting and a shareholder rights plan such as a poison pill, factors known to insulatemanagement from outside shareholders (Bushman and Smith, 2001; Bebchuk and Cohen, 2005; Bebchuket al., 2009). We eschew the Entrenchment Index in this study because it does not cover our entire sampleperiod and is available only for large firms. The FactSet takeover defense rating is available for all of thesample firms. Note that several firms have the median rating, which results in an unbalanced split.
23

4.8 Activism and Guidance Initiators
To shed additional light on the relation between activism and disclosure, we test whether
the threat of activism leads managers to initiate guidance. Table 10 reports that, after
controls, 9.2% of the sample peer firms initiate guidance in the post period (1% level). That
is, 9.2% of the peer firms disclosed no guidance estimates in the [−2 years, 0) period, and
at least one guidance estimate in the [0, +2 years] period. This result shows that the threat
of activism leads managers not only to increase guidance disclosures, but also to initiate
guidance, further attesting to the economic significance of our findings and adding to the
discussion in Leuz and Verrecchia (2000) on the determinants of disclosure policy. To address
the guidance initiation issues uncovered in Chuk et al. (2013), we limit the analysis to peer
firms above the median market value of our sample and with more than two analysts and
find similar results.
4.9 Disclosure’s Effect on Being Targeted by an Activist
H5 predicts that added disclosure is negatively associated with the probability of being
targeted by an activist. Instead of constructing explicit empirical models for each mechanism
that disclosure might operate on (e.g., credibility, pricing, activists’ private information), we
test disclosure directly under the assumption that doing so captures all of the underlying
mechanisms. In Table 11 we split the sample into high disclosers and low disclosers. High
disclosers comprise peer firms whose percent change in guidance issuances from the pre to
the post period is above the sample median percent change. Guidance initiators will not
have such a change and are included in the high-discloser sample. Table 11 indicates that
in the [0, +2 years] post period, the probability of being targeted by an activist investor
is 11.5% for the high-discloser sample (Column 1) and 13.7% for the low-discloser sample
(Column 2). This 16% decrease, or 2.2% in levels, is an economically meaningful and statis-
tically significant difference (5% level). This evidence is consistent with H5 that disclosure
is negatively associated with the probability of being targeted by an activist investor.
24

5 Sensitivity Analyses
5.1 Competition
In this section we check whether changing competitive forces in the peer firm’s industry
induced by the activist campaign drive the results. Aslan and Kumar (2015) find that
activist targets increase their market shares by 3.7% and improve price-cost markups by
6.2% in subsequent years. However, Li (2010) finds that competition from rivals is negatively
associated with the frequency and the quality of disclosure. Therefore, our expectation is
that increased competition biases against the main results. Nonetheless, we check for and do
not find a statistically significant difference in competition for the sample of peer firms from
the pre to the post periods. Unreported results show that the Li, Lundholm, and Minnis
(2013) competition measure’s pre period mean is 0.299 and post period mean is 0.302. This
finding is largely consistent with that of Aslan and Kumar (2015), who find that it takes three
years or more after an activist campaign to observe measurable changes in the competitive
landscape, whereas we expect and find the disclosure effect to obtain immediately. It is
therefore reasonable to assume that the relation between competitive forces and disclosure
is eliminated as a firm-fixed effect in the differencing procedure from Section 4.2.
5.2 Other Institutional Holdings
In the main analyses we directly control for total institutional ownership. However, if
institutional investors of a certain type systematically change their ownership positions in
the peer firms, an aggregate ownership measure is an incomplete control for the disclosure
preferences of other large shareholders. For example, indexing institutions might prefer more
disclosure (Bushee and Noe, 2000; Boone and White, 2015). We therefore decompose the
change in institutional holdings into changes in quasi-indexer holdings, transient holdings,
and active holdings (Bushee, 1998). Including these three component parts as regressors
in the main tests does not affect any of the main results. Moreover, quasi-indexers and
25

transient holdings in the peer firms are not statistically different from zero from the pre to
the post period.
5.3 Timing of Disclosures
To ensure that the results are robust to alternative time periods, we first reduce the pre-
and post-period windows to one year. The main effect from Table 6 drops by 48%, to 1.451.
The reduction in magnitude is nearly proportionate to the 50% reduction in the time period
covered, suggesting that the disclosure effect obtains quickly at the peer firms. This result is
consistent with Figure 1, which graphically depicts the same result. We also check whether
the effect reverses after the initial response. Managers could increase disclosure initially and
decrease it later on, potentially when the threat of activism dissipates. By contrast, prior
research suggests that firms are reluctant to reduce disclosure in any case (Verrecchia, 1983;
Chen, Matsumoto, and Rajgopal, 2011). We construct an additional two-year post period
window of (+2 years, +4 years] for a sub-sample of 988 peer firms for which we can obtain
I/B/E/S guidance data over the entire (+2 years, +4 years] window. We subtract the peer
firm’s (+2 years, +4 years] guidance level from the peer firm’s [0 years, +2 years] guidance
level, and find this difference to be 0.19, economically small and statistically insignificant.
This finding is consistent with that of Chen et al. (2011), who find that few firms reduce
disclosure levels: From October 2000 to January 2006, only 254 firms stopped providing
quarterly earnings guidance. We draw two conclusions from this evidence: (1) managers
remain committed to the increased level of disclosure induced by the increased threat of
activism, and (2) an existing disclosure trend at the peer firm does not drive the main
effect in Table 6 because such a trend implies that the difference noted previously would be
significantly positive as the trend continues upward.
26

5.4 Disclosure at the Activist-Targeted Firms
We report descriptive evidence on disclosure at the activist-targeted firms. Recall that we
do not formally construct a full structural model for activists’ strategic disclosure preferences.
In Table 4, we report an economically small and statistically insignificant 0.15 increase in
guidance disclosures at the activist-targeted firm from the pre to the post activist campaign
announcement date periods. One can interpret this evidence several ways. It could be
that activist investors want to maintain a private information advantage and do not seek
more disclosure at their target firm. It could also be that once an activist targets a firm,
the managers of that firm engage in more costly activities to protect themselves, such as
activating a poison pill, initiating a dividend, or engaging in direct negotiation (Carleton
et al., 1998; Klein and Zur, 2009). We test this expectation and find that 4% of activist
targeted companies adopt poison pills during the activist campaign (1% level). This finding
helps explain the results of Chen and Jung (2015), who indeed find that activist targets
do not elevate disclosure. Finally, these results help to further bolster the validity of our
matching procedure. For it to be true that some unobserved factor common to both target
and peer firms drives our results, the disclosure effect should be similar in both sets of
companies. The findings here point to the contrary.
6 Conclusion
Voluntary disclosures can be interpreted differently by traders with different prior beliefs
(Kim and Verrecchia, 1994). An influential line of research therefore studies the disclosure
preferences across different classes of traders. This study focuses on the relation between
disclosure and one class of demonstrably impactful traders, shareholder activists. We find a
positive relation between the threat of activism and the frequency of guidance disclosures. In
particular, firms increase guidance disclosures by 28% on average when the threat of activism
increases in our empirical setting. Figure 1 illustrates that this finding obtains quickly, within
27

one quarter from event time. These additional disclosures are also negatively associated with
the likelihood of being targeted by an activist. Our extensive set of analyses suggests that a
plausible inference for this finding is that disclosure deters activist intervention.
Although our results are certainly consistent with the idea that disclosure deters activist
intervention, we do not mean to imply that disclosure always deters activist intervention or
that one should take our evidence as causal. The setting used here has limitations and raises
questions about external validity that would apply to any empirical analysis. Our sensitivity
checks help to rule out many of the alternative explanations, but the activist setting is
without doubt complex. Thus, a natural avenue for future research is to construct a full
structural model of the informational preferences of shareholder activists (Gow, Larcker,
and Reiss, 2015).
28

References
Angrist, J., and A. Krueger, 1999, Chapter 23 - Empirical Strategies in Labor Economics,
volume 3, Part A of Handbook of Labor Economics , 1277 – 1366 (Elsevier).
Angrist, J., and A. Krueger, 2001, Instrumental Variables and the Search for Identification:
From Supply and Demand to Natural Experiments, Journal of Economic Perspectives 15,
69 – 85.
Appel, I., T. Gormley, and D. Keim, 2015, Passive Investors, Not Passive Owners, Working
Paper.
Arena, M., and B. Julio, 2014, The Effects of Securities Class Action Litigation on Cor-
porate Liquidity and Investment Policy, Journal of Financial & Quantitative Analysis
Forthcoming.
Armstrong, C., J. Core, and W. Guay, 2014, Do Independent Directors Cause Improvements
in Firm Transparency?, Journal of Financial Economics 113, 383 – 403.
Aslan, H., and P. Kumar, 2015, The product market effects of hedge fund activism, Journal
of Financial Economics Forthcoming.
Balakrishnan, K., M. Billings, B. Kelly, and A. Ljungqvist, 2014a, Shaping Liquidity: On
the Causal Effects of Disclosure and Liquidity, Journal of Finance 69, 2237 – 2278.
Balakrishnan, K., J. Core, and R. Verdi, 2014b, The Relation Between Reporting Quality
and Financing and Investment: Evidence from Changes in Financing Capacity, Journal
of Accounting Research 52, 1 – 36.
Bebchuk, L., and A. Cohen, 2005, The Costs of Entrenched Boards, Journal of Financial
Economics 78, 409 – 433.
Bebchuk, L., A. Cohen, and A. Ferrell, 2009, What Matters in Corporate Governance?,
Review of Financial Studies 22, 783 – 827.
Bertrand, M., E. Duflo, and S. Mullainathan, 2004, How Much Should We Trust Differences-
in-Differences Estimates?, Quarterly Journal of Economics 119, 249 – 275.
Beyer, A., D. Cohen, T. Lys, and B. Walther, 2010, The Financial Reporting Environment:
Review of the Recent Literature, Journal of Accounting and Economics 50, 296 – 343.
29

Beyer, A., and R. Dye, 2012, Reputation management and the disclosure of earnings fore-
casts, Review of Accounting Studies 17, 877 – 912.
Binder, J., 1985, Measuring the Effects of Regulation with Stock Price Data, The RAND
Journal of Economics 16, 167 – 183.
Boone, A., and J. White, 2015, The effect of institutional ownership on firm transparency
and information production, Journal of Financial Economics 117, 508 – 533.
Brav, A., W. Jiang, and H. Kim, 2010, Hedge Fund Activism: A Review, Foundations and
Trends in Finance 4, 1 – 66.
Brav, A., W. Jiang, and H. Kim, 2015, The Real Effects of Hedge Fund Activism: Pro-
ductivity, Asset Allocation, and Labor Outcomes, Review of Financial Studies 28, 2723 –
2769.
Brav, A., W. Jiang, F. Partnoy, and R. Thomas, 2008, Hedge Fund Activism, Corporate
Governance, and Firm Performance, Journal of Finance 63, 1729 – 1775.
Bushee, B., 1998, The Influence of Institutional Investors on Myopic R&D Investment Be-
havior, Accounting Review 73, 305 – 333.
Bushee, B., and C. Noe, 2000, Corporate Disclosure Practices, Institutional Investors, and
Stock Return Volatility, Journal of Accounting Research 38, 171 – 202.
Bushman, R., and A. Smith, 2001, Financial accounting information and corporate gover-
nance, Journal of Accounting and Economics 32, 237 – 333.
Carleton, W., J. Nelson, and M. Weisbach, 1998, The Influence of Institutions on Corpo-
rate Governance through Private Negotiations: Evidence from TIAA-CREF, Journal of
Finance 53, 1335 – 1362.
Chen, J., and M. Jung, 2015, Activist Hedge Funds and Firm Disclosure, Review of Financial
Economics Forthcoming.
Chen, S., D. Matsumoto, and S. Rajgopal, 2011, Is Silence Golden? An Empirical Analy-
sis of Firms that Stop Giving Quarterly Earnings Guidance, Journal of Accounting and
Economics 51, 134 – 150.
Cheng, S., V. Nagar, and M. Rajan, 2004, Identifying Control Motives in Managerial Own-
ership: Evidence from Antitakeover Legislation, Review of Financial Studies 18, 637 –
672.
30

Chuk, E., D. Matsumoto, and G. Miller, 2013, Assessing methods of identifying management
forecasts: CIG vs. researcher collected, Journal of Accounting and Economics 55, 23 – 42.
Cohen, A., and C. Wang, 2013, How Do Staggered Boards Affect Shareholder Value? Evi-
dence from a Natural Experiment, Journal of Financial Economics 110, 627 – 641.
Cornelli, F., Z. Kominek, and A. Ljungqvist, 2013, Monitoring Managers: Does It Matter?,
The Journal of Finance 68, 431 – 481.
Edmans, A., 2014, Blockholders and Corporate Governance, Annual Review of Financial
Economics 6, 23 – 50.
Edmans, A., V. Fang, and E. Zur, 2013, The Effect of Liquidity on Governance, Review of
Financial Studies 26, 1443 – 1482.
Edmans, A., and G. Manso, 2011, Governance Through Trading and Intervention: A Theory
of Multiple Blockholders, Review of Financial Studies 24, 2395 – 2428.
Ertimur, Y., F. Ferri, and V. Muslu, 2011, Shareholder Activism and CEO Pay, Review of
Financial Studies 24, 535 – 592.
Ertimur, Y., E. Sletten, and Y. Sunder, 2014, Large Shareholders and Disclosure Strategies:
Evidence from IPO Lockup Expirations, Journal of Accounting and Economics 58, 79 –
95.
Ferri, F., and T. Sandino, 2009, The Impact of Shareholder Activism on Financial Reporting
and Compensation: The Case of Employee Stock Options Expensing, Accounting Review
84, 433 – 466.
Fos, V, and M. Tsoutsoura, 2014, Shareholder Democracy in Play: Career Consequences of
Proxy Contests, Journal of Financial Economics 114, 316 – 340.
Gande, A., and C. Lewis, 2009, Shareholder Initiated Class Action Lawsuits: Shareholder
Wealth Effects and Industry Spillovers, Journal of Financial and Quantitative Analysis
44, 823 – 850.
Gantchev, N., O. Gredil, and C. Jotikasthira, 2015, Governance under the Gun: Spillover
Effects of Hedge Fund Activism, Working Paper.
Garvey, G., and G. Hanka, 1999, Capital Structure and Corporate Control: The Effect of
Antitakeover Statutes on Firm Leverage, Journal of Finance 54, 519 – 546.
31

Gormley, T., and D. Matsa, 2014, Common Errors: How to (and Not to) Control for Unob-
served Heterogeneity, Review of Financial Studies 27, 617 – 661.
Gow, I., D. Larcker, and P. Reiss, 2015, Causal inference in accounting research, Working
Paper.
Gow, I., S.-P. Shin, and S. Srinivasan, 2014a, Activist Directors: Determinants and Conse-
quences, Working Paper.
Gow, I., S.-P. Shin, and S. Srinivasan, 2014b, Consequences to Directors of Shareholder
Activism, Working Paper.
Graham, J., C. Harvey, and S. Rajgopal, 2005, The Economic Implications of Corporate
Financial Reporting, Journal of Accounting and Economics 40, 3 – 73.
Grossman, S., and J. Stiglitz, 1980, On the Impossibility of Informationally Efficient Markets,
American Economic Review 70, 393–408.
Harris, M, and A Raviv, 1993, Differences of Opinion Make a Horse Race, Review of Financial
Studies 6, 473–506.
Healy, P., and K. Palepu, 2001, Information Asymmetry, Corporate Disclosure, and the
Capital Markets: A Review of the Empirical Disclosure Literature, Journal of Accounting
and Economics 31, 405 – 440.
Heckman, J., H. Ichimura, J. Smith, and P. Todd, 1998, Characterizing Selection Bias Using
Experimental Data, Econometrica 66, 1017 – 1098.
Hirst, E., L. Koonce, and S. Venkataraman, 2008, Management Earnings Forecasts: A Re-
view and Framework, Accounting Horizons 22, 315 – 338.
Joos, P., 2000, Discussion of “The Economic Consequences of Increased Disclosure”, Journal
of Accounting Research 38, 125 – 136.
Kim, O., and R. Verrecchia, 1994, Market Liquidity and Volume around Earnings Announce-
ments, Journal of Accounting and Economics 17, 41 – 67.
Klein, A., and E. Zur, 2009, Entrepreneurial Shareholder Activism: Hedge Funds and Other
Private Investors, Journal of Finance 64, 187 – 229.
Kothari, S.P., S. Shu, and P. Wysocki, 2009, Do Managers Withhold Bad News?, Journal of
Accounting Research 47, 241 – 276.
32

La Porta, R., F. Lopez-de Silanes, A. Shleifer, and R. Vishny, 2000, Agency Problems and
Dividend Policies around the World, Journal of Finance 55, 1 – 33.
Lemmon, M., and M. Roberts, 2010, The Response of Corporate Financing and Investment
to Changes in the Supply of Credit, Journal of Financial and Quantitative Analysis 45,
555 – 587.
Leuz, C., and R. Verrecchia, 2000, The Economic Consequences Increased Disclosure, Journal
of Accounting Research 38, 91 – 124.
Li, F., R. Lundholm, and M. Minnis, 2013, A Measure of Competition Based on 10-K Filings,
Journal of Accounting Research 51, 399 – 436.
Li, X., 2010, The Impact of Product Market Competition on the Quantity and Quality of
Voluntary Disclosure, Review of Accounting Studies 15, 663 – 711.
Mahalanobis, P., 1936, On the generalized distance in statistics, Proceedings of the National
Institute of Sciences (Calcutta) 2, 49 – 55.
Maug, E., 1998, Large Shareholders as Monitors: Is There a Trade-Off between Liquidity
and Control?, The Journal of Finance 53, 65 – 98.
Ofek, E., and D. Yermack, 2000, Taking Stock: Equity-Based Compensation and the Evo-
lution of Managerial Ownership, Journal of Finance 55, 1367 – 1384.
Popadak, J., 2014, A Corporate Culture Channel: How Increased Shareholder Governance
Reduces Firm Value, Working Paper.
Rogers, J., D. Skinner, and A. Van Buskirk, 2009, Earnings Guidance and Market Uncer-
tainty, Journal of Accounting and Economics 48, 90 – 109.
Rogers, J., and P. Stocken, 2005, Credibility of Management Forecasts, Accounting Review
80, 1233 – 1260.
Rosenbaum, P., and D. Rubin, 1985, Constructing a Control Group Using Multivariate
Matched Sampling Methods That Incorporate the Propensity Score, The American Statis-
tician 39, 33 – 38.
Schwert, W., 1981, Using Financial Data to Measure Effects of Regulation, Journal of Law
and Economics 24, 121 – 158.
Servaes, H., and A. Tamayo, 2014, How Do Industry Peers Respond to Control Threats?,
Management Science 60, 380 – 399.
33

Shroff, N., A. Sun, H. White, and W. Zhang, 2013, Voluntary Disclosure and Information
Asymmetry: Evidence from the 2005 Securities Offering Reform, Journal of Accounting
Research 51, 1299 – 1345.
Skinner, D., 1994, Why Firms Voluntarily Disclose Bad News, Journal of Accounting Re-
search 32, 38 – 60.
Skinner, D., 1997, Earnings Disclosures and Stockholder Lawsuits, Journal of Accounting
and Economics 23, 249 – 282.
Verrecchia, R., 1983, Discretionary Disclosure, Journal of Accounting and Economics 5, 179
– 194.
34

Appendix A: Variable Definitions
In this Appendix, we describe our empirical measures and provide their sources.
Variable Definition SourceManagement Guidance Issuances Annual and quarterly management EPS and sales estimates and revisions I/B/E/SMarket Cap. (millions) Log of firm market value CRSPTotal Assets (millions) Log of total assets CompustatMarket to Book Market Cap. / (Total Assets − Accumulated Depreciation) CRSP, CompustatCash Cash / Total Assets CompustatDebt (Long Term Debt + Current Debt) / Total Assets CompustatIntangibles Intangibles / Total Assets CompustatDividend Payer 1 if firm paid a dividend in the observation period, 0 otherwise CompustatCAPEX Capital Expenditures / Total Assets CompustatR&D R&D / Total Assets CompustatROA Net Income Before Extraordinary Items / Total Assets CompustatInst. Ownership Percentage of outstanding shares held by institutional investors Thomson 13F DatabaseAnalyst Following Number of outstanding analyst EPS forecasts I/B/E/SCumulative Abnormal Returns CARs are computed using the market value-weighted return as a baseline. CRSP
All cumulative abnormal return (CAR) variables use the announcement date ofthe activist campaign for T = 0.
35

Appendix B: Propensity Score Matching Specification for Activist Campaignsfrom 2005–2011
The specification includes two-digit industry and year controls. When selecting the matchedfirm, we select the closest match within the activism firm’s two-digit SIC industry andyear of the activist campaign announcement date (see Section 3 for more on the matchingprocedure). All variables are defined in Appendix A. T-statistics are in parentheses andstandard errors are clustered by two-digit SIC code. ***, **, and * indicate statisticalsignificance at the 1%, 5%, and 10% level, respectively.
(1)Variable Activism Firm = 1
Log of Total Assets 0.018*** (16.11)Market Cap. −0.016***(−14.03)Market to Book 0.000 (1.20)P/E Ratio 0.000 (−0.59)Firm CAR [−730, −11 days] 0.002*** (2.65)ROA 0.003 (1.24)CAPEX 0.036** (2.39)R&D −0.005 (−1.10)Debt −0.004* (−1.70)Intangibles −0.021*** (−3.72)Cash 0.024*** (4.01)Dividend Payer 0.007*** (3.35)Institutional Ownership 0.001 (0.92)Analyst Following 0.037 (1.02)[−2 years, 0) Guidance Disclosures −0.313** (−2.41)Observations 70,520Adjusted-R2 0.041
36

Appendix C: Effect of Activism Threat on Guidance Disclosures — SensitivityAnalysis of Second Peer-Firm Match from 2005–2011
This table reports the regression of the second propensity matched peer firms’ change inmanagement guidance on contemporaneous changes in firm characteristics. The secondfirm is the furthest within industry match based on propensity score. We use this firmto test whether managers at a less comparable firm are less sensitive to the threat ofactivism. The pre period is [-2 years, 0) and the post period is [0, +2 years], where T= 0 is the announcement date of the activist investor campaign. Subscript M indicatesmatched firm and subscript A indicates activism firm. All variables are defined in AppendixA. The empirical specification eliminates firm-fixed effects, time effects common to eachmatched firm-activism firm pairing, and time effects common to all firms. T-statistics arein parentheses and standard errors are clustered by two-digit SIC code. ***, **, and *indicate statistical significance at the 1%, 5%, and 10% level, respectively.
(1)Variable ∆M Mgmt. Guidance Issuances
Intercept 0.764* (1.67)∆M Total Assets −0.241 (−0.60)∆M ROA −0.436 (−0.45)∆M CAPEX −3.703 (−0.92)∆M R&D −0.208 (−0.08)∆M Debt −0.706 (−0.60)∆M Intangibles 0.491 (0.27)∆M Cash 1.235 (0.89)∆M Dividend Payer 0.850 (2.19)∆M Inst. Inv. Holdings −0.653 (−0.49)∆M Analyst Following 0.070 (1.11)∆M,A Economy-Wide Mgmt. Guidance Issuances 0.053 (0.41)∆A Activism Firm Mgmt. Guidance Issuances 0.001 (0.08)∆M Matched Firm CAR 0.162 (0.75)[−2 years, −11 days] Matched Firm CAR 0.043** (0.13)Positive [−10 days, +10 days] Matched Firm CAR −0.291 (−0.73)Positive [−10 days, +10 days] Activism Firm CAR 0.762* (1.84)Absolute [−10 days, +10 days] Matched Firm CAR −0.757 (−0.20)Absolute [−10 days, +10 days] Activism Firm CAR −3.263 (−1.52)Observations 1,130Adjusted-R2 0.014
37

Appendix D: Effect of Activism Threat on Guidance Disclosures — Sensitivity Analysis of Closest PropensityScore Peer Firms from 2005–2011
This table reports regressions of the propensity matched peer firms’ change in management guidance on contemporaneous changesin firm characteristics. The sample is split by the peer firm and activism firm median difference in propensity score from thepropensity score specification in Appendix B. The Top 50% Closest Matches are the below median group, and the Bottom 50%Closest Matches are the above median group. The pre period is [-2 years, 0) and the post period is [0, +2 years], where T = 0 isthe announcement date of the activist investor campaign. Subscript M indicates matched firm and subscript A indicates activismfirm. All variables are defined in Appendix A. The empirical specifications eliminate firm-fixed effects, time effects common to eachmatched firm-activism firm pairing, and time effects common to all firms. T-statistics are in parentheses and standard errors arerobust to heteroskedasticity. ***, **, and * indicate statistical significance at the 1%, 5%, and 10% level, respectively.
Top 50% Closest Matches Bottom 50% Closest Matches(1) (2)
Variable ∆M Mgmt. Guidance Issuances ∆M Mgmt. Guidance Issuances
Intercept 3.789*** (3.63) 2.296** (2.36)∆M Total Assets −1.389 (−1.43) −0.997 (−1.23)∆M ROA 0.654 (0.34) 0.698 (0.28)∆M CAPEX −12.153 (−1.33) −11.912 (−1.39)∆M R&D −1.957 (−0.40) 2.525 (0.26)∆M Debt 0.754 (0.31) 2.613 (0.93)∆M Intangibles −2.041 (−0.48) −3.410 (−0.89)∆M Cash −2.543 (−0.86) 1.693 (0.53)∆M Dividend Payer −0.038 (−0.02) −0.795 (−0.48)∆M Inst. Inv. Holdings 2.086 (0.68) 2.871 (1.02)∆M Analyst Following 0.250* (1.74) 0.127 (0.94)∆M,A Economy-Wide Mgmt. Guidance Issuances −0.559** (−1.97) −0.327 (−1.18)∆A Activism Firm Mgmt. Guidance Issuances −0.017 (−0.42) 0.065 (1.59)∆M Matched Firm CAR 0.553 (1.06) 0.057 (0.13)[−2 years, −11 days] Matched Firm CAR 1.683** (2.31) 0.426 (0.58)Positive [−10 day, +10 day] Matched Firm CAR 0.045 (0.05) 0.724 (0.83)
Positive [−10 day, +10 day] Activism Firm CAR −1.113 (−1.22) 0.846 (0.93)Absolute [−10 days, +10 days] Matched Firm CAR −9.664 (−1.22) −10.102 (−1.21)Absolute [−10 days, +10 days] Activism Firm CAR −4.650 (−0.82) −1.114 (−0.27)
t-test for difference in means by split: 0.00***Observations 565 565Adjusted-R2 0.034 0.012
38
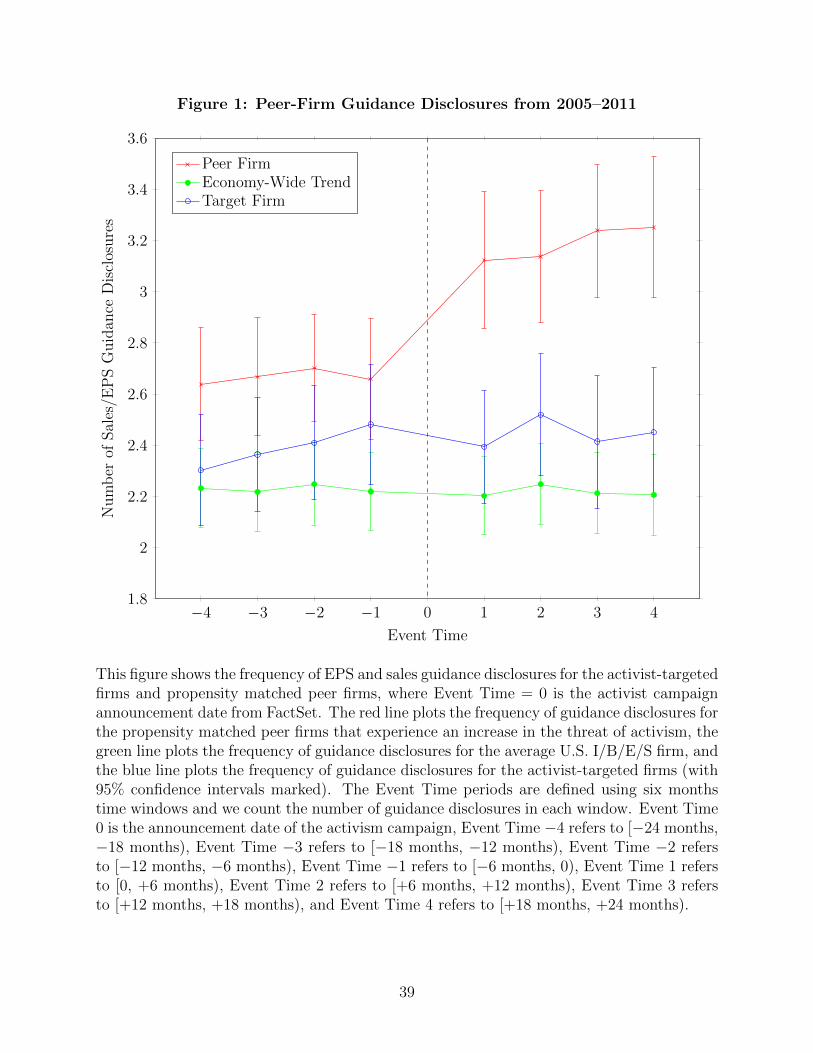
Figure 1: Peer-Firm Guidance Disclosures from 2005–2011
−4 −3 −2 −1 0 1 2 3 41.8
2
2.2
2.4
2.6
2.8
3
3.2
3.4
3.6
Event Time
Num
ber
ofSal
es/E
PS
Guid
ance
Dis
clos
ure
s
Peer FirmEconomy-Wide TrendTarget Firm
This figure shows the frequency of EPS and sales guidance disclosures for the activist-targetedfirms and propensity matched peer firms, where Event Time = 0 is the activist campaignannouncement date from FactSet. The red line plots the frequency of guidance disclosures forthe propensity matched peer firms that experience an increase in the threat of activism, thegreen line plots the frequency of guidance disclosures for the average U.S. I/B/E/S firm, andthe blue line plots the frequency of guidance disclosures for the activist-targeted firms (with95% confidence intervals marked). The Event Time periods are defined using six monthstime windows and we count the number of guidance disclosures in each window. Event Time0 is the announcement date of the activism campaign, Event Time −4 refers to [−24 months,−18 months), Event Time −3 refers to [−18 months, −12 months), Event Time −2 refersto [−12 months, −6 months), Event Time −1 refers to [−6 months, 0), Event Time 1 refersto [0, +6 months), Event Time 2 refers to [+6 months, +12 months), Event Time 3 refersto [+12 months, +18 months), and Event Time 4 refers to [+18 months, +24 months).
39

Table 1: Distribution of Activist Campaigns by Year and Industry
Panel A: Distribution of Activist Campaigns by Year
Year Number of Campaigns
2005 1252006 1852007 2452008 2352009 1712010 1502011 19Total 1,130
Panel B: Distribution of Activist Campaigns by Industry
Industry Number of Campaigns
Consumer Nondurables 47Consumer Durables 35Manufacturing 77Energy, Oil, Gas, and Coal 45Chemicals and Allied Products 26Business Equipment 231Telecommunications 45Utilities 21Wholesale and Retail 166Healthcare 125Finance 179Other 133Total 1,130
40

Table 2: Descriptive Statistics of Activism Firms and Propensity Matched PeerFirms from 2005–2011
Other than Total Assets, balance sheet variables are scaled by Total Assets. Except forreturns and guidance, the variables reported below are measured in the quarter of the activistcampaign announcement date (T = 0). Subscript M indicates matched firm and subscriptA indicates activism firm.
Panel A: Activism Firms
Variable (N=1,130) Mean Std. Dev. 25th Perc. Median 75th Perc.Market Cap.A (millions) 7,255.11 32,400.00 85.78 293.87 1,366.37Total AssetsA (millions) 22,376.98 160,161.70 135.07 531.21 2,084.57Market to BookA 1.02 1.07 0.39 0.77 1.31Firm CAR [−730, −11 days]A −0.02 0.75 −0.46 −0.13 0.20CashA 0.14 0.16 0.02 0.08 0.19DebtA 0.24 0.28 0.02 0.18 0.34IntangiblesA 0.15 0.18 0.00 0.06 0.24Dividend PayerA 0.40 0.49 0.00 0.00 1.00CAPEXA 0.04 0.06 0.01 0.03 0.06R&DA 0.04 0.10 0.00 0.00 0.05ROAA −0.04 0.21 −0.05 0.01 0.05Inst. OwnershipA 0.62 0.29 0.38 0.66 0.86Analyst FollowingA 4.78 5.99 0.00 2.00 7.00[−2 years, 0) Guidance DisclosuresA 9.64 13.65 0.00 3.00 16.00[0, +2 years] Guidance DisclosuresA 9.79 14.77 0.00 3.00 14.00
Panel B: Propensity Matched Peer Firms
Variable (N=1,130) Mean Std. Dev. 25th Perc. Median 75th Perc.Market Cap.M (millions) 4,517.28 18,200.00 137.25 540.26 2,098.06Total AssetsM (millions) 11,368.72 88,065.01 206.96 818.06 2,985.07Market to BookM 1.09 1.22 0.36 0.76 1.33Firm CAR [−730, −11 days]M 0.13 1.01 −0.37 −0.01 0.38CashM 0.13 0.16 0.02 0.07 0.18DebtM 0.24 0.24 0.03 0.18 0.35IntangiblesM 0.15 0.18 0.00 0.07 0.22Dividend PayerM 0.44 0.50 0.00 0.00 1.00CAPEXM 0.04 0.06 0.01 0.02 0.05R&DM 0.04 0.12 0.00 0.00 0.04ROAM −0.02 0.21 −0.02 0.02 0.06Inst. OwnershipM 0.63 0.31 0.39 0.68 0.87Analyst FollowingM 5.44 5.61 1.00 3.00 8.00[−2 years, 0) Guidance DisclosuresM 10.71 13.82 0.00 5.00 17.00[0, +2 years] Guidance DisclosuresM 12.73 16.25 0.00 6.00 21.00
41

Table 3: Abnormal Returns Around the Activist Campaign AnnouncementDate for Activism Firms and Propensity Matched Peer Firms from 2005–2011
This table reports regressions of absolute cumulative abnormal returns on characteristicsof activism firms and their propensity score matched peer firm. All variables are definedin Appendix A. T-statistics are in parentheses. Standard errors are clustered by two-digitSIC code. ***, **, and * indicate statistical significance at the 1%, 5%, and 10% level,respectively.
Activism Firms Matched Peer Firms(1) (2)
Variable [−10, +10] Absolute CAR [−10, +10] Absolute CAR
Intercept 0.088*** (3.47) 0.062*** (7.12)Log of Total Assets −0.001 (−0.23) −0.002 (−1.21)Market to Book −0.006 (−0.91) −0.002** (−2.42)Firm CAR [−730, −11 days] −0.007 (−1.13) −0.001 (−1.14)Cash −0.024* (−1.82) −0.009 (−0.78)Debt 0.017 (0.98) 0.027** (3.06)Intangibles −0.040*** (−3.18) −0.024** (−2.69)Dividend Payer −0.010 (−1.36) −0.012** (−2.37)CAPEX 0.092** (2.46) 0.059*** (4.29)R&D 0.030* (1.88) 0.010 (0.88)ROA −0.021 (−1.68) −0.026* (−2.01)Institutional Ownership −0.012* (−1.87) 0.000 (0.02)Analyst Following 0.000 (−0.16) 0.000 (−0.90)Observations 1,130 1,130Adjusted-R2 0.023 0.056
42

Table 4: Descriptive Statistics of Differenced Propensity Matched Peer-Firm Characteristics from 2005–2011
Other than Total Assets, balance sheet variables are scaled by Total Assets. Differenced variables are computed using thefollowing procedure: ∆FXi = XiF=M,A;T=1
−XiF=M,A;T=0, where X = variable, F = M for matched firm or A for activism firm,
and T = 0 for pre period or 1 for post period. ***, **, and * indicate statistical significance at the 1%, 5%, and 10% level,respectively.
Variable (N=1,130) Mean Std. Dev. 25th Perc. Median 75th Perc.∆M Mgmt. Guidance Issuances 2.02*** 10.30 −1.00 0.00 5.00∆M Total Assets −0.15*** 0.61 −0.45 −0.15 0.14∆M ROA 0.02*** 0.25 −0.03 0.01 0.06∆M CAPEX 0.01*** 0.05 −0.01 0.00 0.02∆M R&D 0.00 0.09 0.00 0.00 0.00∆M Debt 0.00 0.18 −0.05 0.00 0.06∆M Intangibles −0.01** 0.12 −0.03 0.00 0.02∆M Cash −0.02*** 0.15 −0.06 0.00 0.03∆M Dividend Payer 0.06*** 0.24 0.00 0.00 0.00∆M Institutional Investor Holdings 0.02*** 0.16 −0.03 0.00 0.09∆M Analyst Following 0.52*** 3.25 −1.00 0.00 2.00∆M,A Economy-Wide Mgmt. Guidance Issuances 0.17 0.16 −0.05 0.16 0.29∆A Activism Firm Mgmt. Guidance Issuances 0.15 10.67 −2.00 0.00 3.00∆M Matched Firm CAR 0.04 1.38 −0.37 0.01 0.39[−2 years, −11 day] Matched Firm CAR 0.02 0.95 −0.39 −0.13 0.17Positive [−10 day, +10 day] Matched Firm CAR 0.46*** 0.50 0.00 0.00 1.00Positive [−10 day, +10 day] Activism Firm CAR 0.62*** 0.49 0.00 1.00 1.00Absolute [−10 days, +10 days] Matched Firm CAR 0.04*** 0.06 0.01 0.03 0.06Absolute [−10 days, +10 days] Activism Firm CAR 0.07*** 0.10 0.02 0.04 0.08
43

Table 5: Correlation Matrix for Activism Firms and Propensity Matched Peer Firms from 2005–2011
Subscript M indicates matched firm and subscript A indicates activism firm. Bold indicates statistical significance at the 5%level.
Variable (N=1,130) (1) (2) (3) (4) (5) (6) (7) (8) (9) (10) (11) (12) (13) (14) (15) (16) (17) (18) (19)(1) ∆M Mgmt. Guidance Issuances 1.00(2) ∆M Total Assets -0.12 1.00(3) ∆M ROA -0.02 0.23 1.00(4) ∆M CAPEX -0.08 0.05 -0.03 1.00(5) ∆M R&D 0.02 -0.29 -0.55 0.03 1.00(6) ∆M Debt 0.04 0.04 -0.14 -0.05 0.01 1.00(7) ∆M Intangibles -0.06 0.34 0.00 -0.02 -0.04 0.11 1.00(8) ∆M Cash 0.02 -0.16 0.05 -0.03 -0.02 -0.09 -0.29 1.00(9) ∆M Dividend Payer -0.04 0.08 0.02 0.06 0.01 -0.08 0.00 0.03 1.00(10) ∆M Institutional Investor Holdings 0.09 -0.24 -0.11 -0.11 0.08 0.10 -0.06 0.00 -0.04 1.00(11) ∆M Analyst Following 0.11 -0.24 -0.03 -0.04 0.02 0.05 -0.08 0.08 -0.06 0.15 1.00(12) ∆M,A Economy-Wide Mgmt. Guidance Issuances -0.07 -0.01 0.03 -0.03 -0.01 -0.05 -0.01 -0.03 -0.01 0.06 -0.02 1.00(13) ∆A Activism Firm Mgmt. Guidance Issuances 0.03 -0.02 -0.02 -0.01 0.01 0.02 -0.02 0.10 0.00 0.00 0.02 -0.07 1.00(14) ∆M Matched Firm CAR -0.08 0.14 0.01 0.04 -0.05 0.03 0.06 -0.05 -0.01 -0.14 -0.12 0.03 0.07 1.00(15) [-2 years, -11 days] Matched Firm CAR 0.13 -0.31 -0.12 -0.11 0.10 0.07 -0.03 0.00 -0.06 0.26 0.18 -0.03 -0.04 -0.70 1.00(16) Positive [-10 day, +10 day] Matched Firm CAR 0.00 -0.02 -0.01 -0.01 0.02 -0.03 0.00 0.02 0.02 0.01 0.04 0.01 0.01 -0.04 0.02 1.00(17) Positive [-10 day, +10 day] Activism Firm CAR 0.01 0.02 0.02 0.00 -0.04 0.08 0.04 -0.05 -0.02 -0.02 -0.01 -0.01 -0.02 0.01 -0.01 0.02 1.00(18) Absolute [-10 days, +10 days] Matched Firm CAR -0.08 0.10 -0.01 0.07 0.00 0.00 0.08 -0.07 0.05 -0.03 -0.09 0.00 0.09 0.20 -0.04 0.02 0.11 1.00(19) Absolute [-10 days, +10 days] Activism Firm CAR -0.05 0.04 -0.03 0.08 0.07 -0.03 0.00 0.02 0.03 -0.05 -0.06 -0.03 0.12 0.15 -0.05 0.16 0.00 0.17 1.00
44

Table 6: Effect of Activism Threat on Guidance Disclosures for PropensityMatched Peer Firms from 2005–2011
This table reports the regression of the propensity matched peer firms’ change in man-agement guidance on contemporaneous changes in firm characteristics. The pre period is[-2 years, 0) and the post period is [0, +2 years], where T = 0 is the announcement dateof the activist investor campaign. Subscript M indicates matched firm and subscript Aindicates activism firm. All variables are defined in Appendix A. The empirical specificationeliminates firm-fixed effects, time effects common to each matched firm-activism firmpairing, and time effects common to all firms. T-statistics are in parentheses and standarderrors are clustered by two-digit SIC code. ***, **, and * indicate statistical significance atthe 1%, 5%, and 10% level, respectively.
(1)Variable ∆M Mgmt. Guidance Issuances
Intercept 3.027*** (3.43)∆M Total Assets −0.988* (−1.99)∆M ROA 0.341 (0.27)∆M CAPEX −11.203* (−1.81)∆M R&D −0.862 (−0.42)∆M Debt 1.189 (0.75)∆M Intangibles −2.982 (−1.21)∆M Cash −0.388 (−0.19)∆M Dividend Payer −0.497 (−0.47)∆M Inst. Inv. Holdings 2.836 (1.59)∆M Analyst Following 0.183 (0.96)∆M,A Economy-Wide Mgmt. Guidance Issuances −0.429** (−2.20)∆A Activism Firm Mgmt. Guidance Issuances 0.026 (0.83)∆M Matched Firm CAR 0.242 (0.84)[−2 years, −11 days] Matched Firm CAR 1.056** (2.24)Positive [−10 days, +10 days] Matched Firm CAR 0.311 (0.70)Positive [−10 days, +10 days] Activism Firm CAR −0.098 (−0.15)Absolute [−10 days, +10 days] Matched Firm CAR −9.919* (−1.99)Absolute [−10 days, +10 days] Activism Firm CAR −2.075 (−0.57)Observations 1,130Adjusted-R2 0.030
45

Table 7: Effect of Activism Threat on Guidance Disclosures for Propensity Matched Peer Firms from2005–2011 Split by Dividend Payer
This table reports regressions of the propensity matched peer firms’ change in management guidance on contemporaneouschanges in firm characteristics. The sample is split on whether a firm pays a dividend in the pre period. The pre period is[-2 years, 0) and the post period is [0, +2 years], where T = 0 is the announcement date of the activist investor campaign.Subscript M indicates matched firm and subscript A indicates activism firm. All variables are defined in Appendix A. Theempirical specifications eliminate firm-fixed effects, time effects common to each matched firm-activism firm pairing, and timeeffects common to all firms. T-statistics are in parentheses and standard errors are robust to heteroscedasticity. ***, **, and *indicate statistical significance at the 1%, 5%, and 10% level, respectively.
Non-Dividend Payers Dividend Payers(1) (2)
Variable ∆M Mgmt. Guidance Issuances ∆M Mgmt. Guidance Issuances
Intercept 3.793*** (4.00) 2.349** (2.26)∆M Total Assets −0.876 (−1.17) −0.349 (−0.29)∆M ROA 0.189 (0.12) 0.433 (0.07)∆M CAPEX −14.642* (−1.95) 10.558 (0.90)∆M R&D −0.454 (−0.10) 36.895 (0.74)∆M Debt 0.679 (0.32) 3.357 (0.83)∆M Intangibles −2.623 (−0.78) −6.017 (−1.01)∆M Cash −0.500 (−0.21) 2.489 (0.42)∆M Dividend Payer −0.459 (−0.33) - -∆M Inst. Inv. Holdings 4.955* (1.92) −1.943 (−0.57)∆M Analyst Following 0.376*** (2.71) −0.062 (−0.47)∆M,A Economy-Wide Mgmt. Guidance Issuances −0.212 (−0.79) −0.614** (−2.18)∆A Activism Firm Mgmt. Guidance Issuances 0.011 (0.31) 0.054 (1.24)∆M Matched Firm CAR 0.225 (0.59) −0.378 (−0.47)[−2 years, −11 days] Matched Firm CAR 0.833 (1.46) 1.065 (0.82)Positive [−10 day, +10 day] Matched Firm CAR −0.459 (−0.56) 1.298 (1.43)Positive [−10 day, +10 day] Activism Firm CAR −0.378 (−0.44) 0.013 (0.01)Absolute [−10 days, +10 days] Matched Firm CAR −8.475 (−1.26) −14.416 (−1.20)Absolute [−10 days, +10 days] Activism Firm CAR −10.788** (−2.08) 7.147 (1.63)
t-test for difference in means by split: 0.00***Observations 715 415Adjusted-R2 0.050 0.010
46

Table 8: Effect of Activism Threat on Guidance Disclosures for Propensity Matched Peer Firms from 2005–2011Split by Takeover Defense Strength
This table reports regressions of the propensity matched peer firms’ change in management guidance on contemporaneous changesin firm characteristics. The sample is split on whether the firm is above the median takeover defense rating assigned by FactSet.The takeover defense rating is similar to the Bebchuk et al. (2009) Entrenchment Index, and is compiled from a company’s articlesof incorporation and bylaws, including whether the company has staggered board voting and a shareholder rights plan, such as apoison pill, factors known to insulate managers from outside shareholders (Bebchuk and Cohen, 2005; Bebchuk et al., 2009). Thepre period is [-2 years, 0) and the post period is [0, +2 years], where T = 0 is the announcement date of the activist investorcampaign. Subscript M indicates matched firm and subscript A indicates activism firm. All variables are defined in Appendix A.The empirical specifications eliminate firm-fixed effects, time effects common to each matched firm-activism firm pairing, and timeeffects common to all firms. T-statistics are in parentheses and standard errors are robust to heteroskedasticity. ***, **, and *indicate statistical significance at the 1%, 5%, and 10% level, respectively.
Weak Takeover Defense Firms Strong Takeover Defense Firms(1) (2)
Variable ∆M Mgmt. Guidance Issuances ∆M Mgmt. Guidance Issuances
Intercept 3.840*** (3.53) 2.350** (2.52)∆M Total Assets −0.113 (−0.12) −1.481* (−1.82)∆M ROA −2.096 (−0.84) 1.751 (0.94)∆M CAPEX −5.075 (−0.55) −17.989** (−2.15)∆M R&D −5.355 (−0.63) 1.326 (0.27)∆M Debt −2.259 (−0.76) 3.545 (1.54)∆M Intangibles 1.281 (0.30) −6.649* (−1.70)∆M Cash 1.671 (0.51) −1.795 (−0.64)∆M Dividend Payer −1.412 (−0.75) 1.055 (0.57)∆M Inst. Inv. Holdings 3.073 (0.93) 2.719 (1.03)∆M Analyst Following 0.348** (2.14) 0.086 (0.71)∆M,A Economy-Wide Mgmt. Guidance Issuances −0.636** (−2.06) −0.252 (−0.99)∆A Activism Firm Mgmt. Guidance Issuances 0.060 (1.36) 0.001 (0.02)∆M Matched Firm CAR −0.389 (−0.74) 0.555 (1.26)[−2 years, −11 days] Matched Firm CAR 0.662 (0.82) 1.104* (1.70)Positive [−10 day, +10 day] Matched Firm CAR 1.193 (1.22) −0.331 (−0.42)Positive [−10 day, +10 day] Activism Firm CAR −0.430 (−0.42) 0.379 (0.46)Absolute [−10 days, +10 days] Matched Firm CAR −11.454 (−1.35) −6.625 (−0.84)Absolute [−10 days, +10 days] Activism Firm CAR −8.624 (−1.34) −0.827 (−0.21)
t-test for difference in means by split: 0.00***Observations 471 659Adjusted-R2 0.034 0.028
47

Table 9: Effect of Activism Threat on Guidance Disclosures for Propensity Matched Peer Firms from 2005–2011Split by Public Disclosure of Activist Campaign
This table reports regressions of the propensity matched peer firms’ change in management guidance on contemporaneous changesin firm characteristics. The sample is split on whether the activist publicly disclosed their campaign through an open letterto management and/or shareholders. The pre period is [-2 years, 0) and the post period is [0, +2 years], where T = 0 is theannouncement date of the activist investor campaign. Subscript M indicates matched firm and subscript A indicates activismfirm. All variables are defined in Appendix A. The empirical specifications eliminate firm-fixed effects, time effects common to eachmatched firm-activism firm pairing, and time effects common to all firms. T-statistics are in parentheses and standard errors arerobust to heteroskedasticity. ***, **, and * indicate statistical significance at the 1%, 5%, and 10% level, respectively.
Public Disclosure of the Campaign No Public Disclosure of the Campaign(1) (2)
Variable ∆M Mgmt. Guidance Issuances ∆M Mgmt. Guidance Issuances
Intercept 3.468*** (3.74) 2.351** (2.14)∆M Total Assets −1.169 (−1.41) −0.806 (−0.85)∆M ROA 0.678 (0.27) −0.373 (−0.20)∆M CAPEX −16.435** (−2.01) −4.442 (−0.46)∆M R&D −3.665 (−0.51) −0.949 (−0.17)∆M Debt 0.465 (0.20) 1.786 (0.61)∆M Intangibles −3.858 (−0.99) −1.576 (−0.36)∆M Cash −1.193 (−0.38) 0.187 (0.06)∆M Dividend Payer −2.249 (−1.33) 2.062 (1.01)∆M Inst. Inv. Holdings 0.536 (0.20) 5.605* (1.79)∆M Analyst Following −0.026 (−0.20) 0.440*** (3.07)∆M,A Economy-Wide Mgmt. Guidance Issuances −0.425 (−1.61) −0.333 (−1.11)∆A Activism Firm Mgmt. Guidance Issuances 0.043 (1.04) 0.012 (0.31)∆M Matched Firm CAR 0.291 (0.68) 0.109 (0.20)[−2 years, −11 days] Matched Firm CAR 1.260* (1.67) 0.789 (1.10)Positive [−10 day, +10 day] Matched Firm CAR 0.725 (0.86) 0.125 (0.14)Positive [−10 day, +10 day] Activism Firm CAR −0.478 (−0.55) 0.325 (0.34)Absolute [−10 days, +10 days] Matched Firm CAR −7.832 (−0.98) −12.363 (−1.50)Absolute [−10 days, +10 days] Activism Firm CAR −0.590 (−0.15) −6.983 (−1.09)
t-test for difference in means by split: 0.00***Observations 632 498Adjusted-R2 0.014 0.043
48

Table 10: Effect of Activism Threat on Guidance Initiation for PropensityMatched Peer Firms from 2005–2011
This table reports a linear probability model of whether the propensity matched peer firmsinitiate guidance during the post period on contemporaneous changes in firm characteristics.The pre period is [-2 years, 0) and the post period is [0, +2 years], where T = 0 is theannouncement date of the activist investor campaign. Subscript M indicates matchedfirm and subscript A indicates activism firm. All variables are defined in Appendix A.The empirical specification eliminates firm-fixed effects, time effects common to eachmatched firm-activism firm pairing, and time effects common to all firms. T-statistics arein parentheses and standard errors are clustered by two-digit SIC code. ***, **, and *indicate statistical significance at the 1%, 5%, and 10% level, respectively.
(1)Variable Initiate GuidanceM
Intercept 0.092*** (4.50)∆M Total Assets 0.026 (1.13)∆M ROA −0.023 (−0.49)∆M CAPEX −0.413*** (−3.31)∆M R&D 0.184** (2.16)∆M Debt −0.009 (−0.14)∆M Intangibles 0.029 (0.36)∆M Cash 0.167*** (3.94)∆M Dividend Payer 0.019 (0.56)∆M Inst. Inv. Holdings 0.030 (0.57)∆M Analyst Following 0.002 (0.94)∆M,A Economy-Wide Mgmt. Guidance Issuances 0.002 (0.51)∆A Activism Firm Mgmt. Guidance Issuances 0.000 (0.37)∆M Matched Firm CAR 0.019** (2.02)[−2 years, −11 days] Matched Firm CAR 0.035* (1.67)Positive [−10 days, +10 days] Matched Firm CAR −0.020 (−1.10)Positive [−10 days, +10 days] Activism Firm CAR 0.011 (0.65)Absolute [−10 days, +10 days] Matched Firm CAR −0.084 (−0.52)Absolute [−10 days, +10 days] Activism Firm CAR 0.160 (1.41)Observations 1,130R2 0.030
49

Table 11: Effect of Change in Guidance Issuances on the Probability of Activist Event for Propensity MatchedPeer Firms from 2005–2011
This table reports linear probability regressions of the probability of an activist event at the propensity matched peer firm in years[0, +2 years] on contemporaneous changes in peer-firm characteristics. The sample is split into high disclosers and low disclosers.High disclosers comprise of peer firms whose percent change in guidance issuances from the pre to the post period is above thesample median percent change. Guidance initiators will not have such a change, and are included in the high discloser sample.The pre period is [-2 years, 0) and the post period is [0, +2 years], where T = 0 is the announcement date of the activist investorcampaign. Subscript M indicates matched firm and subscript A indicates activism firm. All variables are defined in Appendix A.The empirical specifications eliminate firm-fixed effects, time effects common to each matched firm and activism firm pairing, andtime effects common to all firms. T-statistics are in parentheses and standard errors are robust to heteroskedasticity. ***, **, and* indicate statistical significance at the 1%, 5%, and 10% level, respectively.
High DisclosersM Low DisclosersM(1) (2)
Variable Activist Event in (0, +2 years]M Activist Event in (0, +2 years]M
Intercept 0.115*** (4.49) 0.137*** (3.36)∆M Total Assets 0.060*** (2.87) 0.038 (0.88)∆M ROA −0.160*** (−2.65) 0.043 (0.58)∆M CAPEX 0.161 (0.73) −0.379 (−1.00)∆M R&D −0.056 (−0.38) 0.278 (0.89)∆M Debt 0.033 (0.53) −0.198 (−1.64)∆M Intangibles −0.153 (−1.48) −0.268 (−1.63)∆M Cash 0.039 (0.53) −0.136 (−0.91)∆M Dividend Payer −0.045 (−0.97) 0.148* (1.87)∆M Inst. Inv. Holdings 0.048 (0.64) 0.290** (2.46)∆M Analyst Following 0.003 (0.67) 0.014*** (2.80)∆M Economy-Wide Mgmt. Guidance Issuances 0.007 (0.93) 0.005 (0.41)∆M Activism Firm Mgmt. Guidance Issuances −0.001 (−0.62) 0.002 (0.97)∆M Matched Firm CAR −0.013 (−1.06) −0.013 (−0.73)[−2 years, −11 day] Matched Firm CAR −0.014 (−0.81) −0.061* (−1.73)Positive [−10 day, +10 day] Matched Firm CAR −0.002 (−0.09) −0.030 (−0.83)Positive [−10 day, +10 day] Activism Firm CAR −0.007 (−0.30) −0.008 (−0.21)Absolute [−10 days, +10 days] Matched Firm CAR −0.242 (−1.17) −0.294 (−0.89)Absolute [−10 days, +10 days] Activism Firm CAR 0.031 (0.28) 0.062 (0.28)
t-test for difference in means by split: 0.04**Observations 764 366Adjusted-R2 0.010 0.041
50