Shared Molecular Targets Confer Resistance over Short and ...
18
Shared Molecular Targets Confer Resistance over Short and Long Evolutionary Timescales Jing Li, 1 Ignacio V azquez-Garc ıa, 2,3,4,5 Karl Persson, 6 Asier Gonz alez, 7 Jia-Xing Yue, 1 Benjamin Barr e, 1 Michael N. Hall, 7 Anthony Long, 8 Jonas Warringer, 6 Ville Mustonen, 9 and Gianni Liti* ,1 1 Universit e Co ˆte d’Azur, CNRS, Inserm, IRCAN, Nice, France 2 Wellcome Trust Sanger Institute, Cambridge, United Kingdom 3 Department of Applied Mathematics and Theoretical Physics, University of Cambridge, Cambridge, United Kingdom 4 Department of Epidemiology and Biostatistics, Memorial Sloan Kettering Cancer Center, New York, NY 5 Department of Statistics, Columbia University, New York, NY 6 Department of Chemistry and Molecular Biology, University of Gothenburg, Gothenburg, Sweden 7 Biozentrum, University of Basel, Basel, Switzerland 8 Department of Ecology and Evolutionary Biology, University of California, Irvine, CA 9 Organismal and Evolutionary Biology Research Programme, Department of Computer Science, Institute of Biotechnology, University of Helsinki, Helsinki, Finland *Corresponding author: E-mail: [email protected]. Associate Editor: Harmit Malik Abstract Pre-existing and de novo genetic variants can both drive adaptation to environmental changes, but their relative contributions and interplay remain poorly understood. Here we investigated the evolutionary dynamics in drug- treated yeast populations with different levels of pre-existing variation by experimental evolution coupled with time- resolved sequencing and phenotyping. We found a doubling of pre-existing variation alone boosts the adaptation by 64.1% and 51.5% in hydroxyurea and rapamycin, respectively. The causative pre-existing and de novo variants were selected on shared targets: RNR4 in hydroxyurea and TOR1, TOR2 in rapamycin. Interestingly, the pre-existing and de novo TOR variants map to different functional domains and act via distinct mechanisms. The pre-existing TOR variants from two domesticated strains exhibited opposite rapamycin resistance effects, reflecting lineage-specific functional divergence. This study provides a dynamic view on how pre-existing and de novo variants interactively drive adaptation and deepens our understanding of clonally evolving populations. Key words: adaptation, drug resistance, pre-existing genetic variation, de novo mutation, budding yeast. Introduction Darwinian evolution promotes phenotypic adaptation in na- ture and has important implications in biomedical practices. For example, the emergence of drug resistance is the conse- quence of Darwinian evolution in response to drug selection. According to the classic Neo-Darwinism paradigm, the im- provement of population fitness can be achieved by promot- ing beneficial alleles and purging deleterious alleles. Both pre- existing and de novo variants are subject to this process. One critical question therefore is the relative contribution of pre- existing and de novo variation in driving adaptation to new conditions (Barrett and Schluter 2008; Berg and Coop 2015), which empirically remains poorly characterized (Teot onio et al. 2009; Burke et al. 2014; V azquez-Garc ıa et al. 2017; Kosheleva and Desai 2018). Multiple factors can influence the relative contribution, such as the level of pre-existing variation, the variant-specific fitness effect, and the type and duration of selective regimes (Long et al. 2015). Pre-exist- ing variants are predicted to disproportionately drive adaptation when de novo beneficial mutations are rare and have small selection coefficients, or when selection is transient (Hermisson and Pennings 2005). Pre-existing variants can also rapidly respond to stress given their immediate availability and higher resilience to drift (Barrett and Schluter 2008). Connecting genotypes, phenotypes, and fitness changes in a causally cohesive manner is challenging in both natural and clinical populations, but feasible in experimental populations. Experimental evolution can reveal the molecular determi- nants of adaptation across a wide range of biological systems with unprecedented resolution (Long et al. 2015). It can be initiated from populations with known levels of pre-existing variation, evolved under fixed selection regimes, and pre- served ad infinitum as frozen fossil records that can be revived and studied in detail. Experimental evolution of initially iso- genic populations has confirmed theoretical predictions such as how expanding clones carrying different beneficial muta- tions compete with each other (clonal interference), and how neutral or slightly deleterious mutations can hitchhike to higher frequencies together with beneficial mutations Article ß The Author(s) 2019. Published by Oxford University Press on behalf of the Society for Molecular Biology and Evolution. All rights reserved. For permissions, please e-mail: [email protected] Mol. Biol. Evol. 36(4):691–708 doi:10.1093/molbev/msz006 Advance Access publication January 17, 2019 691 Downloaded from https://academic.oup.com/mbe/article-abstract/36/4/691/5290101 by CNRS UNSA UMR 6549 user on 03 April 2019
Transcript of Shared Molecular Targets Confer Resistance over Short and ...
Shared Molecular Targets Confer Resistance over Short andLong Evolutionary Timescales
Jing Li,1 Ignacio V�azquez-Garc�ıa,2,3,4,5 Karl Persson,6 Asier Gonz�alez,7 Jia-Xing Yue,1 Benjamin Barr�e,1
Michael N. Hall,7 Anthony Long,8 Jonas Warringer,6 Ville Mustonen,9 and Gianni Liti*,1
1Universit�e Cote d’Azur, CNRS, Inserm, IRCAN, Nice, France2Wellcome Trust Sanger Institute, Cambridge, United Kingdom3Department of Applied Mathematics and Theoretical Physics, University of Cambridge, Cambridge, United Kingdom4Department of Epidemiology and Biostatistics, Memorial Sloan Kettering Cancer Center, New York, NY5Department of Statistics, Columbia University, New York, NY6Department of Chemistry and Molecular Biology, University of Gothenburg, Gothenburg, Sweden7Biozentrum, University of Basel, Basel, Switzerland8Department of Ecology and Evolutionary Biology, University of California, Irvine, CA9Organismal and Evolutionary Biology Research Programme, Department of Computer Science, Institute of Biotechnology, University ofHelsinki, Helsinki, Finland
*Corresponding author: E-mail: [email protected].
Associate Editor: Harmit Malik
Abstract
Pre-existing and de novo genetic variants can both drive adaptation to environmental changes, but their relativecontributions and interplay remain poorly understood. Here we investigated the evolutionary dynamics in drug-treated yeast populations with different levels of pre-existing variation by experimental evolution coupled with time-resolved sequencing and phenotyping. We found a doubling of pre-existing variation alone boosts the adaptation by64.1% and 51.5% in hydroxyurea and rapamycin, respectively. The causative pre-existing and de novo variants wereselected on shared targets: RNR4 in hydroxyurea and TOR1, TOR2 in rapamycin. Interestingly, the pre-existing and denovo TOR variants map to different functional domains and act via distinct mechanisms. The pre-existing TOR variantsfrom two domesticated strains exhibited opposite rapamycin resistance effects, reflecting lineage-specific functionaldivergence. This study provides a dynamic view on how pre-existing and de novo variants interactively drive adaptationand deepens our understanding of clonally evolving populations.
Key words: adaptation, drug resistance, pre-existing genetic variation, de novo mutation, budding yeast.
Introduction
Darwinian evolution promotes phenotypic adaptation in na-ture and has important implications in biomedical practices.For example, the emergence of drug resistance is the conse-quence of Darwinian evolution in response to drug selection.According to the classic Neo-Darwinism paradigm, the im-provement of population fitness can be achieved by promot-ing beneficial alleles and purging deleterious alleles. Both pre-existing and de novo variants are subject to this process. Onecritical question therefore is the relative contribution of pre-existing and de novo variation in driving adaptation to newconditions (Barrett and Schluter 2008; Berg and Coop 2015),which empirically remains poorly characterized (Teot�onioet al. 2009; Burke et al. 2014; V�azquez-Garc�ıa et al. 2017;Kosheleva and Desai 2018). Multiple factors can influencethe relative contribution, such as the level of pre-existingvariation, the variant-specific fitness effect, and the typeand duration of selective regimes (Long et al. 2015). Pre-exist-ing variants are predicted to disproportionately drive
adaptation when de novo beneficial mutations are rare andhave small selection coefficients, or when selection is transient(Hermisson and Pennings 2005). Pre-existing variants can alsorapidly respond to stress given their immediate availabilityand higher resilience to drift (Barrett and Schluter 2008).
Connecting genotypes, phenotypes, and fitness changes ina causally cohesive manner is challenging in both natural andclinical populations, but feasible in experimental populations.Experimental evolution can reveal the molecular determi-nants of adaptation across a wide range of biological systemswith unprecedented resolution (Long et al. 2015). It can beinitiated from populations with known levels of pre-existingvariation, evolved under fixed selection regimes, and pre-served ad infinitum as frozen fossil records that can be revivedand studied in detail. Experimental evolution of initially iso-genic populations has confirmed theoretical predictions suchas how expanding clones carrying different beneficial muta-tions compete with each other (clonal interference), and howneutral or slightly deleterious mutations can hitchhike tohigher frequencies together with beneficial mutations
Article
� The Author(s) 2019. Published by Oxford University Press on behalf of the Society for Molecular Biology and Evolution.All rights reserved. For permissions, please e-mail: [email protected]
Mol. Biol. Evol. 36(4):691–708 doi:10.1093/molbev/msz006 Advance Access publication January 17, 2019 691
Dow
nloaded from https://academ
ic.oup.com/m
be/article-abstract/36/4/691/5290101 by CN
RS U
NSA U
MR
6549 user on 03 April 2019
(Gerrish and Lenski 1998; Barrick et al. 2009; Herron andDoebeli 2013; Kvitek and Sherlock 2013; Lang et al. 2013;Levy et al. 2015; Payen et al. 2016; Venkataram et al. 2016).In contrast, it is more challenging to pinpoint the causalrelationships in heterogeneous populations due to the largenumber of segregating variants and the effects of geneticlinkage. Previous studies in experimental evolution using het-erogeneous populations of budding yeast, fly, and Virginiachicken have all shown that pre-existing variation alone candrive adaptation (Burke et al. 2010; Parts et al. 2011; Burkeet al. 2014; Sheng et al. 2015; Kosheleva and Desai 2018). Inour recent study, we evolved heterogeneous yeast popula-tions derived from two genetically divergent parents (hereaf-ter referred to as “two-parent population”) in cancer drugsand show the joint contributions and interplay of pre-existingand de novo variants to adaptation (V�azquez-Garc�ıa et al.2017).
To better understand such interplay, two important ques-tions remain to be explored: (1) how the levels of pre-existingvariation quantitatively affect the adaptation rate and yieldand (2) whether pre-existing and de novo variants act uponshared selection targets and mechanisms. These questionshave direct implications on our understanding of the evolu-tion of resistance to chemotherapy and antimicrobials(Turner and Reis-Filho 2012; Palmer and Kishony 2013). Tothis end, we evolved highly heterogeneous yeast populationsderived from four diverged parents (Cubillos et al. 2013)(hereafter referred to as “four-parent population,” fig. 1A)under anticancer drugs. We used rapamycin (RM) and hy-droxyurea (HU) because of their high specificities and well-studied mechanisms of action. As the target of RM, bothTOR1 and TOR2 can form the RM-sensitive TOR complex 1(TORC1) in yeast but only TOR2 can also form the RM-insensitive TORC2. HU selectively inhibits ribonucleotide di-phosphate reductase (RNR), preventing cells from leaving theG1/S phase of the cell cycle. The two drugs also cover theaction of two common modes of antimicrobial and antican-cer drugs: inhibition of nucleic acid synthesis (HU) and inhi-bition of protein synthesis and cell growth (RM). Incomparison to the two-parent population, the four-parentpopulation has approximately doubled the level of pre-exist-ing variation: 1 single nucleotide polymorphism (SNP)/120 bpversus 1 SNP/230 bp (Cubillos et al. 2013). In this experimen-tal system, we define pre-existing variation as the segregatingnatural variants that accumulated over long evolutionarytimescale (i.e., after the diversification of the four parentalstrains) and define de novo mutations as new variants thatarose within much shorter evolutionary timescale (i.e., duringeither the intercross or the drug selection phase of this ex-periment). We monitored and dissected the adaptation ofthe four-parent populations in the two drugs by time-resolved population genome sequencing and comprehensivephenotyping. Combined with paralleled experiments usingisogenic populations as well as the two-parent populations(V�azquez-Garc�ıa et al. 2017), our unique experimental systemprovides the first empirical evidence of how higher level ofpre-existing variation quantitatively altering the dynamics ofevolution. In stark contrast to the two-parent population
experiment where only one pre-existing causative variantwas mapped, the experimental evolution using four-parentpopulations revealed more than 20 quantitative trait loci(QTLs) contributing to drug resistance, underlying a complexgenetic trait architecture that drives adaptation in popula-tions with higher levels of genetic variation. Moreover, ournucleotide-resolution mapping further revealed that causa-tive pre-existing and de novo variants converged on sharedmolecular targets but their underlying molecular mechanismsturned out to be significantly differed.
Results
Evolution of Isogenic and Heterogeneous Populationsto RM and HUWe asexually evolved diploid Saccharomyces cerevisiae pop-ulations with different levels of pre-existing variation for32 days (>50 generations) under RM, HU, and no drug con-trol conditions (fig. 1A and supplementary tables S1 and S2,Supplementary Material online). The isogenic populations—WA, NA, WE, and SA—corresponding to strains from theWest African, North American, Wine/European, and Sakesubpopulations, respectively, were homogeneous, corre-sponding to clonal expansions of the four respective parents.The two-parent populations were heterogeneous, derivedfrom the WA and NA parents by 12 rounds of intercrossing(Parts et al. 2011; V�azquez-Garc�ıa et al. 2017). The four-parentpopulations derived from all the four parents (Cubillos et al.2013), thus were highly heterogeneous with doubled segre-gating variants than their two-parent counterparts.Therefore, the isogenic, two-parent and four-parent popula-tions provide a unique system with increasing levels of pre-existing variation at the onset of selection, which is critical forquantitatively dissecting the impact of pre-existing variationon evolution. We evolved two replicates of each isogenicparental population and eight replicates of the four-parentpopulations by periodic population bottlenecks of 1/10 every2 or 3 days and stored a subsample of each transfer to create adense fossil record (T0 to T14 in HU and T0 to T15 in RM,supplementary table S1, Supplementary Material online). Thepopulation size varied between �107 and 108 cells. All thepopulations are labeled in a format of“population_condition_replicate_time” (e.g.,“NA_HU_1_T2” represents the NA population evolved inHU, the first replicate at T2).
To track the evolutionary dynamics comprehensively, werevived the frozen subsamples of all the populations across allthe time points (supplementary tables S1 and S2,Supplementary Material online). We estimated their fitness-related properties by spotting assay and precise measure-ments of their doubling time (fig. 1B and supplementaryfigs. S1–S3, Supplementary Material online). In the RM exper-iment, the overall adaptive gain of the four-parent and two-parent populations throughout the whole experiment wassimilar (45.3% vs. 42.6% of doubling time reduction, Mann–Whitney U test, P¼ 0.96). However, the early-phase adaptivegain (T0 to T2) was larger in the four-parent populations(19.2% vs. 11.2% of doubling time reduction, Mann–
Li et al. . doi:10.1093/molbev/msz006 MBE
692
Dow
nloaded from https://academ
ic.oup.com/m
be/article-abstract/36/4/691/5290101 by CN
RS U
NSA U
MR
6549 user on 03 April 2019
A
B C
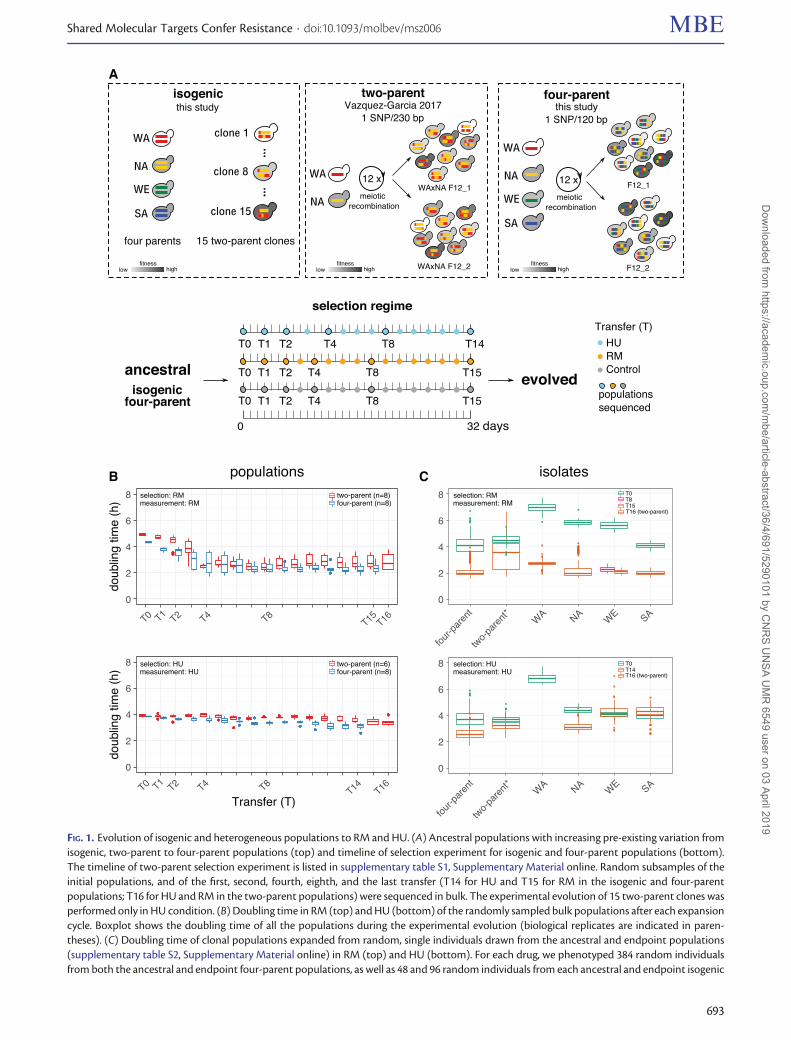
FIG. 1. Evolution of isogenic and heterogeneous populations to RM and HU. (A) Ancestral populations with increasing pre-existing variation fromisogenic, two-parent to four-parent populations (top) and timeline of selection experiment for isogenic and four-parent populations (bottom).The timeline of two-parent selection experiment is listed in supplementary table S1, Supplementary Material online. Random subsamples of theinitial populations, and of the first, second, fourth, eighth, and the last transfer (T14 for HU and T15 for RM in the isogenic and four-parentpopulations; T16 for HU and RM in the two-parent populations) were sequenced in bulk. The experimental evolution of 15 two-parent clones wasperformed only in HU condition. (B) Doubling time in RM (top) and HU (bottom) of the randomly sampled bulk populations after each expansioncycle. Boxplot shows the doubling time of all the populations during the experimental evolution (biological replicates are indicated in paren-theses). (C) Doubling time of clonal populations expanded from random, single individuals drawn from the ancestral and endpoint populations(supplementary table S2, Supplementary Material online) in RM (top) and HU (bottom). For each drug, we phenotyped 384 random individualsfrom both the ancestral and endpoint four-parent populations, as well as 48 and 96 random individuals from each ancestral and endpoint isogenic
Shared Molecular Targets Confer Resistance . doi:10.1093/molbev/msz006 MBE
693
Dow
nloaded from https://academ
ic.oup.com/m
be/article-abstract/36/4/691/5290101 by CN
RS U
NSA U
MR
6549 user on 03 April 2019
Whitney U test, P¼ 0.038), highlighting the advantage ofhigher level of pre-existing variation in driving rapid adapta-tion. There was no substantial late stage adaptation (i.e., dur-ing the last three time points) in either four-parent or two-parent populations (5.1% of doubling time increase and 1.1%decrease, respectively), suggesting the exhaustion of adaptivepotentials within the experimental timescale. In the HU ex-periment, the adaptation was slow, gradual, and persisted tothe end in both the four-parent and two-parent populations,although seemingly greater adaptive gains were observed inthe four-parent populations (20.4% vs. 12.3% of doublingtime reduction, Mann–Whitney U test, P¼ 0.06). Therefore,a doubling of segregating diversity in the four-parent popu-lations translated into more rapid and likely greater adaptivegains in both RM and HU. No observable adaptation to con-trol condition (no drug) was observed (supplementary fig. S1,Supplementary Material online).
To measure the adaptive gains of individuals indepen-dently of their background populations, we randomly isolated>2,600 clones from both ancestral and endpoint populations(supplementary table S2, Supplementary Material online) andmeasured their respective doubling time. Before selection(T0), the variation in doubling time of the four-parent indi-viduals was much greater than those of the two-parent pop-ulations (fig. 1C, coefficient of variation¼ 0.16 vs. 0.08 in bothRM and HU). Thus, the higher genetic diversity of the four-parent populations also translated into higher variation in thekey fitness component under selection, creating a necessaryfoundation for faster adaptation. The mean adaptive gain ofthe four-parent individuals at the endpoint exceeded that oftheir counterparts from the two-parent populations, with adoubling time reduction of 48.2% versus 27.2% in RM(Mann–Whitney U test, P< 2.2� 10�16) and 29.9% ver-sus 11.2% in HU (Mann–Whitney U test, P< 2.2� 10�16).These measurements further verified the accelerated ad-aptation in populations with higher level of pre-existingvariation (fig. 1C and supplementary fig. S4,Supplementary Material online).
Interestingly, the isogenic parental populations exhibiteddistinct evolutionary dynamics in RM and HU conditions. InRM, all the isogenic lines grew faster than their ancestralpopulations regardless of the founding genetic backgrounds(fig. 1C and supplementary figs. S1, S3, and S4, SupplementaryMaterial online, Mann–Whitney U test, P< 2.2� 10�16).Individuals drawn from the NA, SA, and WE endpoint pop-ulations reached the same level of adaptation as those fromthe evolved four-parent populations, whereas those from theWA populations adapted more slowly, which was consistentwith their weaker initial growth. In HU, however, only NA
managed to adapt (28.2% of doubling time reduction, Mann–Whitney U test, P< 2.2� 10�16), although still failed to reachthe same adaptation level of the four-parent individuals(fig. 1C; mean endpoint doubling time 3.16 vs. 2.62 h,Mann–Whitney U test, P< 2.2� 10�16). SA and WE grewworse at the end of HU selection than their respective ances-tral states (6.5% of doubling time increase in SA, Mann–Whitney U test, P¼ 4.1� 10�6; and 4.2% of doubling timeincrease in WE, P¼ 6.6� 10�3). The WA populations wentextinct at earlier time points (T2).
In summary, we found a general trend of positive correla-tions between the levels of pre-existing variation and the rateof adaptation, the absolute adaptive gains, and the endpointperformance regardless of the selection regimes. These obser-vations collectively suggest a greater adaption potential forpopulations with higher genetic diversity, likely enabled by aricher reservoir of selection targets that are immediatelyaccessible.
De novo Mutations Are Prevalent for RM Resistancebut Background-Dependent for HU in IsogenicPopulationsWe first profiled de novo mutations in isogenic parentalpopulations (supplementary tables S1–S3, SupplementaryMaterial online), which served as a baseline for the compar-ison with the four-parent populations. In RM, we detectedrecurrent mutations in TOR1 and FPR1 (fig. 2A). Six TOR1mutations hit three amino acid sites in all the eight parentalpopulations, indicating TOR1 as a background-independentselection target for RM resistance. In contrast, the FPR1 muta-tions (frame shift and start codon disruption at two aminoacid sites) emerged only in the two NA populations.Surprisingly, all the NA clones carrying FPR1 mutations be-came haploids during selection. This may be a collective con-sequence of NA diploids being highly prone to sporulationeven in rich medium (Cubillos et al. 2009) and the fact thatthe loss-of-function FPR1 mutations are fully recessive andthus favor the haploid status during rapid adaptation(V�azquez-Garc�ıa et al. 2017). The frequency increase of theTOR1 and FPR1 mutations agrees well with the doubling timereduction of the populations in which they emerged (fig. 2A),indicating that they are true drivers of the adaptation, ratherthan hitchhikers or drifters, and that the adaptation is genetic,rather than initially epigenetic and later genetically assimi-lated (Gjuvsland et al. 2016). Interestingly, there is a slightdelay between the mutation frequency increase and the dou-bling time decrease at T2 and T4 in a few populations. Wefurther phenotyped 192 clones from the relevant populations
FIG. 1. Continuedparental population. The mean doubling time of these individuals were pooled based on their category (e.g., four-parent, two-parent) and timepoints (e.g., T0, T15) and shown by the boxplots. The details of technical replicates and standard deviation are listed in supplementary table S12,Supplementary Material online. The WA isogenic populations went extinct after T2 in HU. One WE isogenic population in RM was contaminatedat T15 and therefore T8 was analyzed instead. *The wide doubling time distribution of two-parent individuals in RM at T16 is due to thecoexistence of fast and slow growth individuals with and without driver mutations, see V�azquez-Garc�ıa et al. (2017). Boxplot: center lines ¼median; boxes ¼ interquartile range (IQR); whiskers ¼ 1.5�IQR; points ¼ outliers beyond 1.5�IQR.
Li et al. . doi:10.1093/molbev/msz006 MBE
694
Dow
nloaded from https://academ
ic.oup.com/m
be/article-abstract/36/4/691/5290101 by CN
RS U
NSA U
MR
6549 user on 03 April 2019
A
B
C D
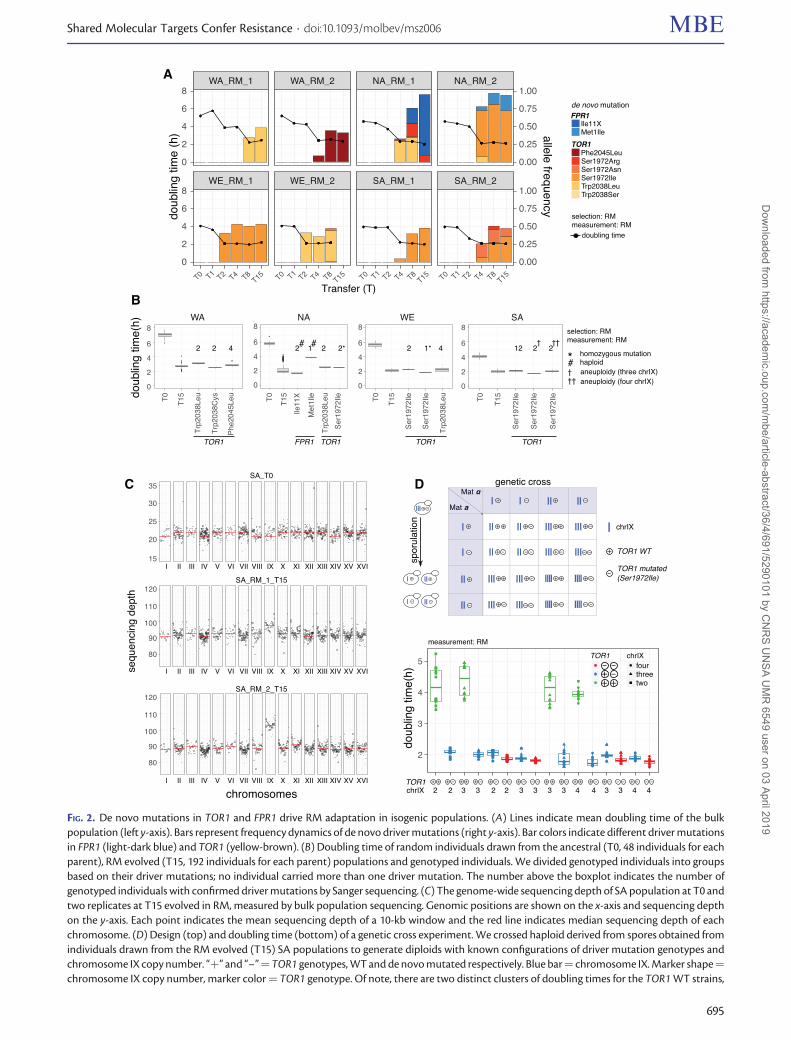
FIG. 2. De novo mutations in TOR1 and FPR1 drive RM adaptation in isogenic populations. (A) Lines indicate mean doubling time of the bulkpopulation (left y-axis). Bars represent frequency dynamics of de novo driver mutations (right y-axis). Bar colors indicate different driver mutationsin FPR1 (light-dark blue) and TOR1 (yellow-brown). (B) Doubling time of random individuals drawn from the ancestral (T0, 48 individuals for eachparent), RM evolved (T15, 192 individuals for each parent) populations and genotyped individuals. We divided genotyped individuals into groupsbased on their driver mutations; no individual carried more than one driver mutation. The number above the boxplot indicates the number ofgenotyped individuals with confirmed driver mutations by Sanger sequencing. (C) The genome-wide sequencing depth of SA population at T0 andtwo replicates at T15 evolved in RM, measured by bulk population sequencing. Genomic positions are shown on the x-axis and sequencing depthon the y-axis. Each point indicates the mean sequencing depth of a 10-kb window and the red line indicates median sequencing depth of eachchromosome. (D) Design (top) and doubling time (bottom) of a genetic cross experiment. We crossed haploid derived from spores obtained fromindividuals drawn from the RM evolved (T15) SA populations to generate diploids with known configurations of driver mutation genotypes andchromosome IX copy number. “þ” and “–”¼TOR1 genotypes, WT and de novo mutated respectively. Blue bar¼ chromosome IX. Marker shape¼chromosome IX copy number, marker color¼ TOR1 genotype. Of note, there are two distinct clusters of doubling times for the TOR1 WT strains,
Shared Molecular Targets Confer Resistance . doi:10.1093/molbev/msz006 MBE
695
Dow
nloaded from https://academ
ic.oup.com/m
be/article-abstract/36/4/691/5290101 by CN
RS U
NSA U
MR
6549 user on 03 April 2019
and observed none or few resistant clones at T2 but more atT4 (supplementary fig. S5G, Supplementary Material online),which is consistent with the doubling time measurements(fig. 2A) as well as the population level spotting assay (sup-plementary fig. S1, Supplementary Material online). Suchslight delay therefore can be explained by either early andlow-frequency mutations that escaped our detection or clonefrequencies increasing during the phenotyping phase.
To quantify the individual contributions of the TOR1 andFPR1 mutations to RM adaptation, we isolated and estimatedthe doubling time of individual clones carrying these muta-tions (fig. 2B and supplementary table S4, SupplementaryMaterial online). Except for the FPR1 Met1Ile mutation, thedoubling time reduction conferred by each individual muta-tion equals (e.g., TOR1 S1972I in WE) or approaches (>90%,e.g., TOR1 W2038L and S1972I in NA) that of the evolvedpopulation carrying these mutations (fig. 2B), therefore capa-ble of explaining almost the complete adaptive gains. All RM-adapted populations showed comparable growth perfor-mance in the presence or absence of RM, suggesting thatthe RM adaptation had plateaued within the experimentaltimescale (supplementary fig. S4, Supplementary Material on-line). The TOR1 mutations recurrently emerged in differentgenetic backgrounds (Ser1972Ile in NA, SA, and WE andTrp2038Leu in WA and WE) and conferred complete toler-ance to RM (fig. 2B). In the NA background, a larger adaptivegain was acquired by the FPR1 Ile11X frame shift mutationthan by the FPR1 start codon disruption (Met1Ile) (69.8% vs.32.9% of doubling time reduction, Mann–Whitney U test,P¼ 2.7� 10�6, fig. 2B), which agreed with the near fixationof FPR1 Ile11X in NA_RM_1 and the lower frequency of theFPR1 Met1Ile in NA_RM_2 (fig. 2A). Given that both muta-tions should lead to complete loss-of-function, this distinc-tion is intriguing. In the WE background, the TOR1 Ser1972Ilehomozygous clones grow faster than those with the hetero-zygous mutation (fig. 2B, 68.1% vs. 59.8% of doubling timereduction, Mann–Whitney U test, P¼ 1.9� 10�4), givingthem a competitive edge. One would expect continued se-lection to drive the homozygote state to fixation via loss ofheterozygosity (LOH), as demonstrated in our previous study(V�azquez-Garc�ıa et al. 2017).
Population-wide whole-genome sequencing revealed thecopy number gain of chromosome IX (chrIX) under RM se-lection in both replicates of the SA populations (fig. 2C andsupplementary table S3, Supplementary Material online).Quantitative PCR (qPCR) further confirmed that the RM-evolved diploid SA clones carried three or four copies ofchrIX (supplementary notes, Supplementary Material online).We noticed a strong association between chrIX copy numberand heat sensitivity in the SA background, based on which weestimated �12.5% and �8.3% of the evolved population(SA_RM_2_T15) carried three and four copies of chrIX,
respectively (supplementary fig. S5F, SupplementaryMaterial online), consistent with our estimates based on se-quencing depth (fig. 2C). All the chrIX-gained SA clones alsocarried the TOR1 Ser1972Ile heterozygous mutation, and wefound those with three copies of chrIX grew faster in RM thanthose with two or four copies (Mann–Whitney U test,P¼ 6.90� 10�5 and P¼ 3.43� 10�3, respectively) (fig. 2B).To dissect the interactions between the TOR1 Ser1972Ile mu-tation and chrIX aneuploidy, we constructed a genetic crossof strains with all possible combinations of TOR1 (wild type ormutated) and chrIX copy number (2, 3, and 4 copies) andmeasured their respective doubling time (fig. 2D, supplemen-tary notes). We found the TOR1 Ser1972Ile mutation as amajor contributor to the RM resistance (53.2% and 56.1%of doubling time reduction for heterozygous and homozy-gous mutation, respectively) whereas the copy number gainof chrIX only conferred marginal benefits.
In sharp contrast to RM selection, isogenic parental pop-ulations propagated in HU almost uniformly failed to acquirede novo mutations except for the RNR4 mutations (Arg34Ileand Lys114Met) in the NA populations. To confirm that suchcontrast was not due to the limited number of replicates, weperformed a second batch of experimental evolution in HU.In this batch, we evolved three replicates for each parent,phenotyped the populations by spotting assay and geno-typed RNR2 and RNR4 (supplementary fig. S1 and tables S2and S4, Supplementary Material online). Again, the NA pop-ulations showed clear fitness improvement associated withRNR2 and RNR4 mutations. Among the three WE and threeSA populations in HU, only one SA population acquired abeneficial RNR4 mutation, whereas all the others showed lim-ited fitness gain (supplementary fig. S1G, SupplementaryMaterial online). All the WA populations died out early on.These results are consistent with those of the first batch ofexperimental evolution. Therefore, we concluded that differ-ent homozygous genetic backgrounds had important effectson the acquisition of de novo mutations in HU. To furtherdissect the background-dependent constraints, we evolved15 clones (each with three replicates) randomly drawnfrom the two-parent population (WA x NA F12) in HU.These clones should all harbor a mosaic of comparable num-bers of NA (highly adaptable) and WA (poorly adaptable)alleles. After 32-day evolution, all the 45 populations adaptedto HU, regardless of their initial tolerance to HU (supplemen-tary fig. S1, Supplementary Material online). All evolved pop-ulations acquired beneficial de novo mutations in at least oneof RNR2 and RNR4. The amino acid sites 169 (Y169H) and 280(A280V) of RNR2 as well as 34 (R34I) and 111 (P111H) ofRNR4 appeared to be driver mutation hotspots (supplemen-tary tables S2 and S4, Supplementary Material online). Also,clones carrying WA RNR2 and RNR4 alleles could acquire thebeneficial RNR2 and RNR4 de novo mutations, showing that
FIG. 2. Continuedwhich is due to the batch effect of two different scanners used to monitor the colony growth (e.g., local variation in humidity within the cabinet).Nevertheless, this did not influence the conclusion that TOR1 was the driver mutation rather than the chrIX copy number changes. Boxplot: centerlines, median; boxes, interquartile range (IQR); whiskers, 1.5�IQR. Data points beyond the whiskers are outliers.
Li et al. . doi:10.1093/molbev/msz006 MBE
696
Dow
nloaded from https://academ
ic.oup.com/m
be/article-abstract/36/4/691/5290101 by CN
RS U
NSA U
MR
6549 user on 03 April 2019
the incapacity of isogenic WA populations to adapt shouldcome from the epistatic constraints of the original WA back-ground. Taken together, the evolutionary dynamics in HU isstrongly background dependent.
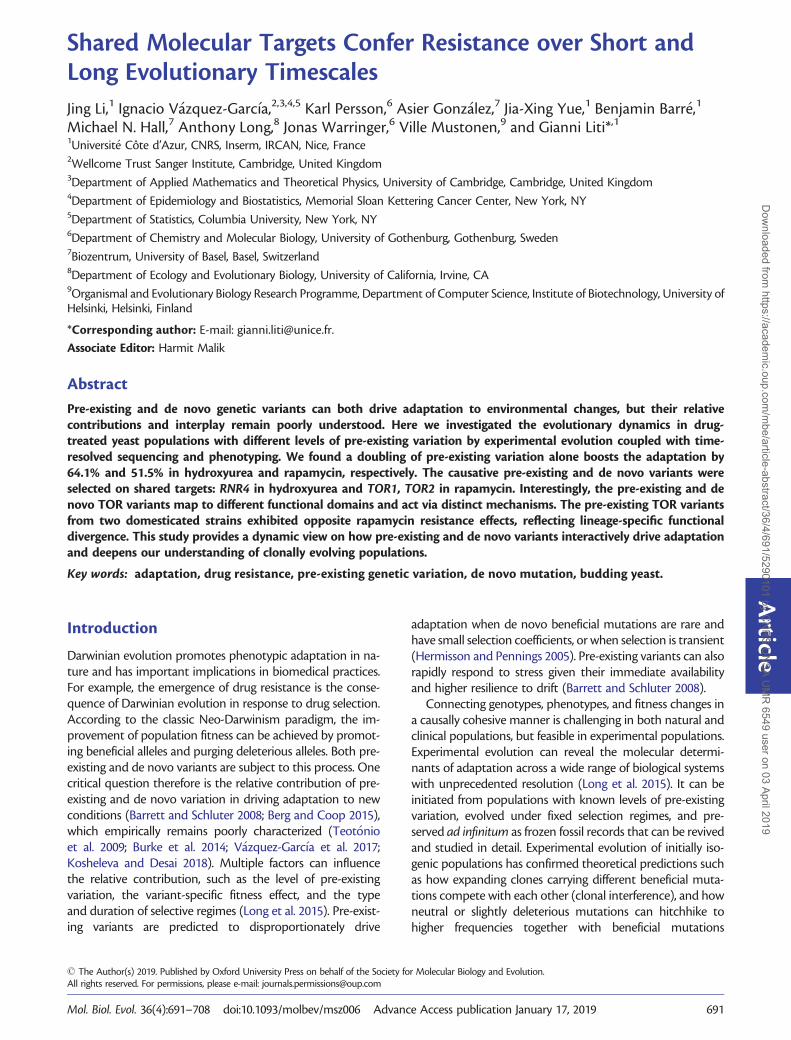
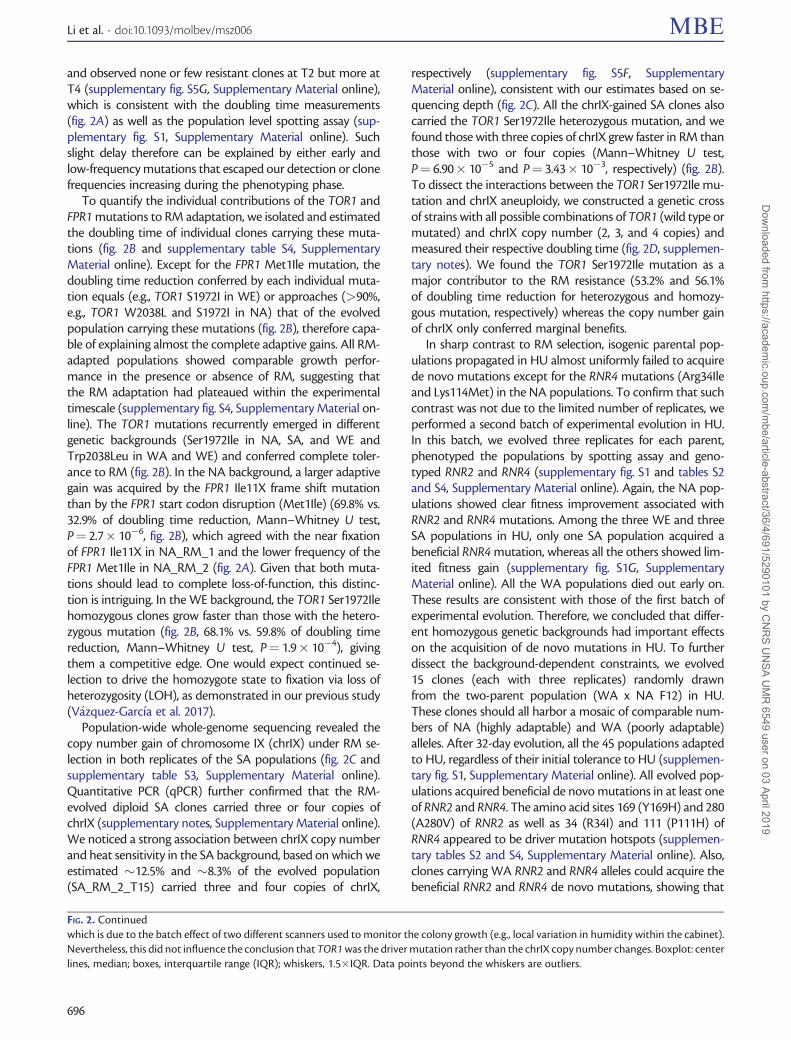
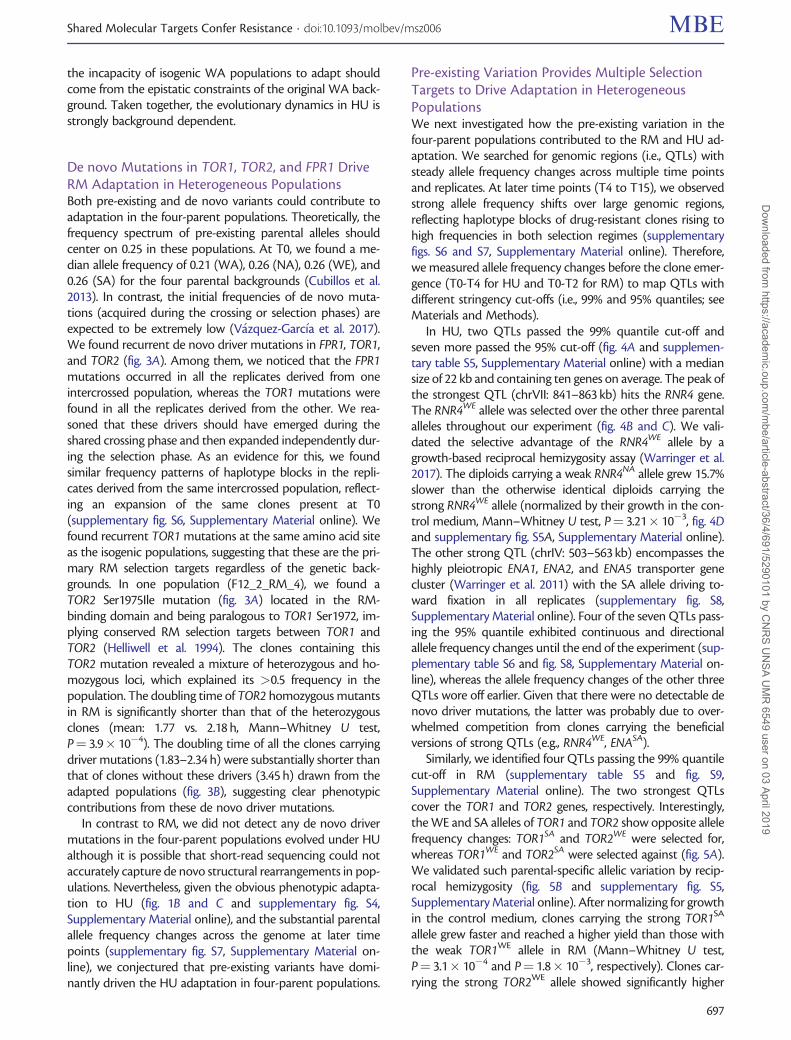
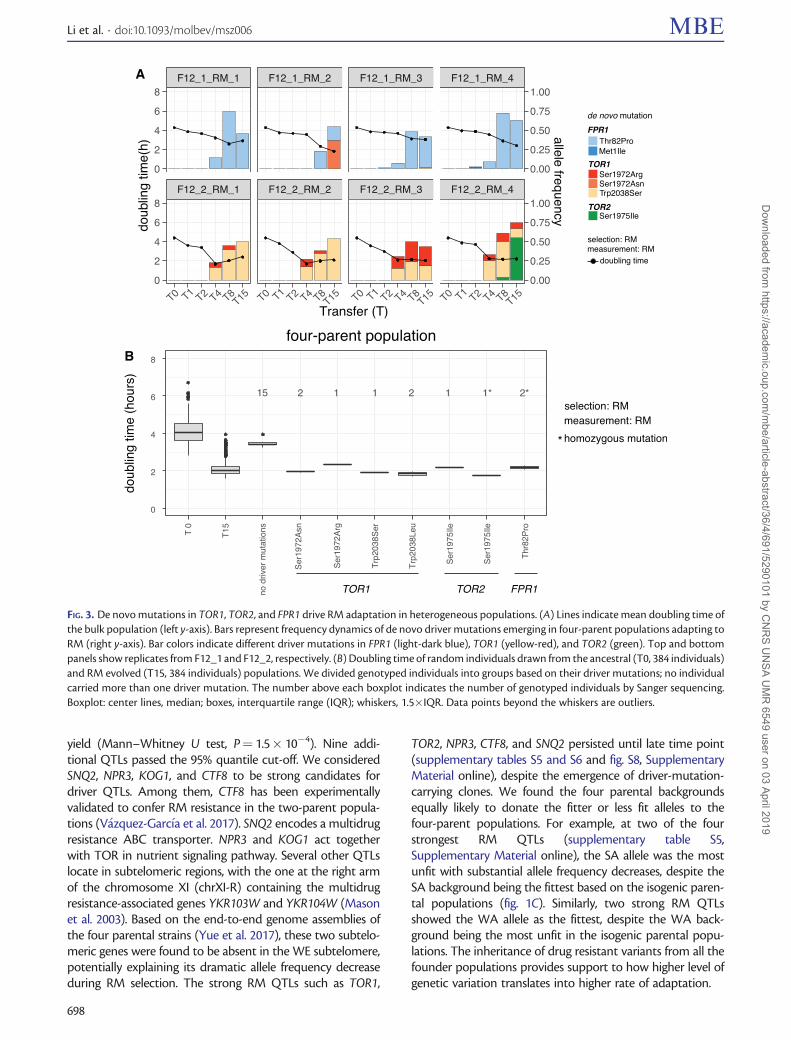
De novo Mutations in TOR1, TOR2, and FPR1 DriveRM Adaptation in Heterogeneous PopulationsBoth pre-existing and de novo variants could contribute toadaptation in the four-parent populations. Theoretically, thefrequency spectrum of pre-existing parental alleles shouldcenter on 0.25 in these populations. At T0, we found a me-dian allele frequency of 0.21 (WA), 0.26 (NA), 0.26 (WE), and0.26 (SA) for the four parental backgrounds (Cubillos et al.2013). In contrast, the initial frequencies of de novo muta-tions (acquired during the crossing or selection phases) areexpected to be extremely low (V�azquez-Garc�ıa et al. 2017).We found recurrent de novo driver mutations in FPR1, TOR1,and TOR2 (fig. 3A). Among them, we noticed that the FPR1mutations occurred in all the replicates derived from oneintercrossed population, whereas the TOR1 mutations werefound in all the replicates derived from the other. We rea-soned that these drivers should have emerged during theshared crossing phase and then expanded independently dur-ing the selection phase. As an evidence for this, we foundsimilar frequency patterns of haplotype blocks in the repli-cates derived from the same intercrossed population, reflect-ing an expansion of the same clones present at T0(supplementary fig. S6, Supplementary Material online). Wefound recurrent TOR1 mutations at the same amino acid siteas the isogenic populations, suggesting that these are the pri-mary RM selection targets regardless of the genetic back-grounds. In one population (F12_2_RM_4), we found aTOR2 Ser1975Ile mutation (fig. 3A) located in the RM-binding domain and being paralogous to TOR1 Ser1972, im-plying conserved RM selection targets between TOR1 andTOR2 (Helliwell et al. 1994). The clones containing thisTOR2 mutation revealed a mixture of heterozygous and ho-mozygous loci, which explained its >0.5 frequency in thepopulation. The doubling time of TOR2 homozygous mutantsin RM is significantly shorter than that of the heterozygousclones (mean: 1.77 vs. 2.18 h, Mann–Whitney U test,P¼ 3.9� 10�4). The doubling time of all the clones carryingdriver mutations (1.83–2.34 h) were substantially shorter thanthat of clones without these drivers (3.45 h) drawn from theadapted populations (fig. 3B), suggesting clear phenotypiccontributions from these de novo driver mutations.
In contrast to RM, we did not detect any de novo drivermutations in the four-parent populations evolved under HUalthough it is possible that short-read sequencing could notaccurately capture de novo structural rearrangements in pop-ulations. Nevertheless, given the obvious phenotypic adapta-tion to HU (fig. 1B and C and supplementary fig. S4,Supplementary Material online), and the substantial parentalallele frequency changes across the genome at later timepoints (supplementary fig. S7, Supplementary Material on-line), we conjectured that pre-existing variants have domi-nantly driven the HU adaptation in four-parent populations.
Pre-existing Variation Provides Multiple SelectionTargets to Drive Adaptation in HeterogeneousPopulationsWe next investigated how the pre-existing variation in thefour-parent populations contributed to the RM and HU ad-aptation. We searched for genomic regions (i.e., QTLs) withsteady allele frequency changes across multiple time pointsand replicates. At later time points (T4 to T15), we observedstrong allele frequency shifts over large genomic regions,reflecting haplotype blocks of drug-resistant clones rising tohigh frequencies in both selection regimes (supplementaryfigs. S6 and S7, Supplementary Material online). Therefore,we measured allele frequency changes before the clone emer-gence (T0-T4 for HU and T0-T2 for RM) to map QTLs withdifferent stringency cut-offs (i.e., 99% and 95% quantiles; seeMaterials and Methods).
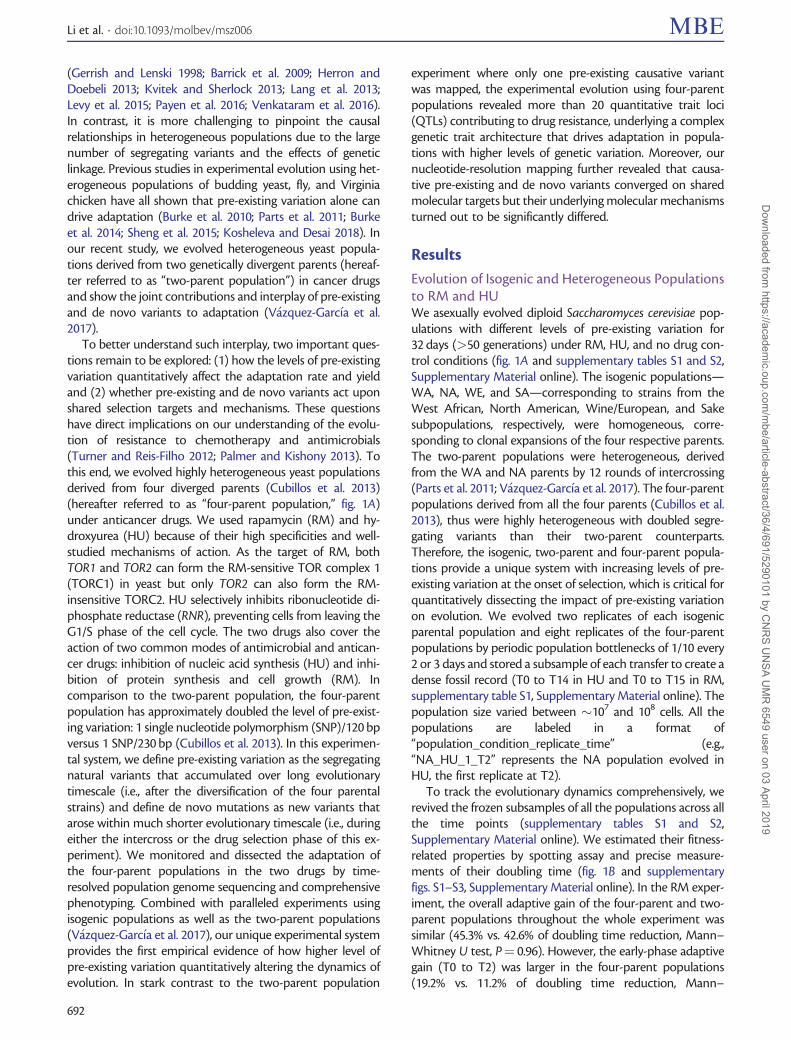
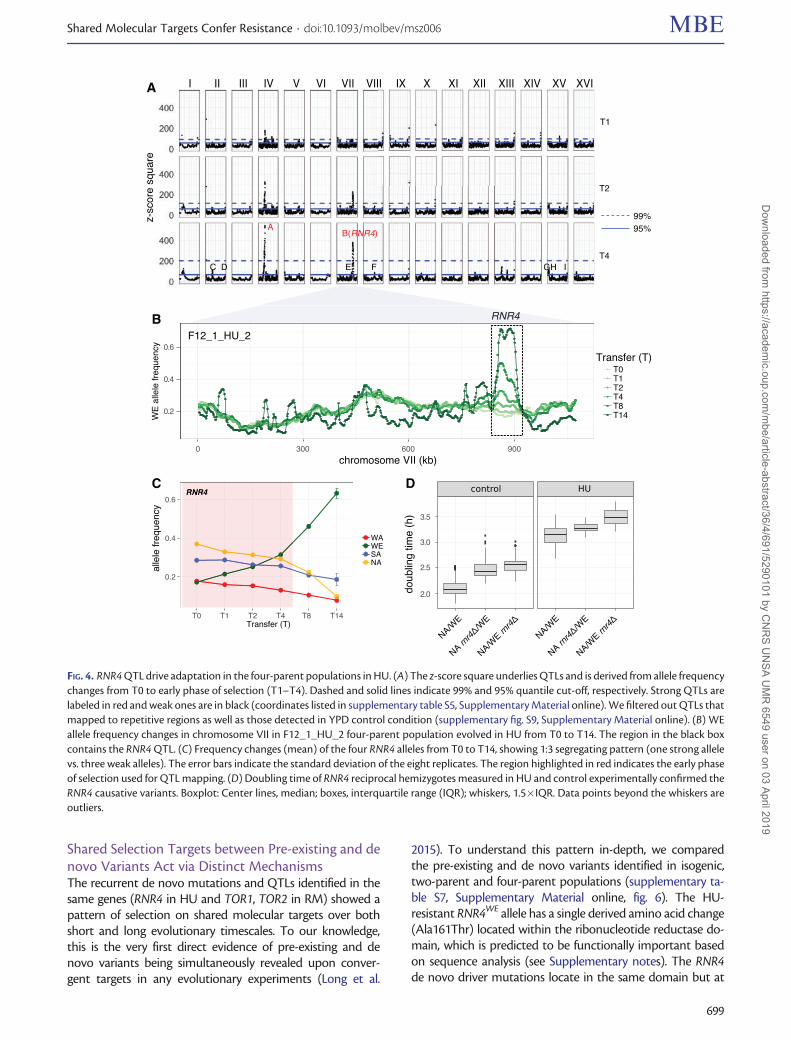
In HU, two QTLs passed the 99% quantile cut-off andseven more passed the 95% cut-off (fig. 4A and supplemen-tary table S5, Supplementary Material online) with a mediansize of 22 kb and containing ten genes on average. The peak ofthe strongest QTL (chrVII: 841–863 kb) hits the RNR4 gene.The RNR4WE allele was selected over the other three parentalalleles throughout our experiment (fig. 4B and C). We vali-dated the selective advantage of the RNR4WE allele by agrowth-based reciprocal hemizygosity assay (Warringer et al.2017). The diploids carrying a weak RNR4NA allele grew 15.7%slower than the otherwise identical diploids carrying thestrong RNR4WE allele (normalized by their growth in the con-trol medium, Mann–Whitney U test, P¼ 3.21� 10�3, fig. 4Dand supplementary fig. S5A, Supplementary Material online).The other strong QTL (chrIV: 503–563 kb) encompasses thehighly pleiotropic ENA1, ENA2, and ENA5 transporter genecluster (Warringer et al. 2011) with the SA allele driving to-ward fixation in all replicates (supplementary fig. S8,Supplementary Material online). Four of the seven QTLs pass-ing the 95% quantile exhibited continuous and directionalallele frequency changes until the end of the experiment (sup-plementary table S6 and fig. S8, Supplementary Material on-line), whereas the allele frequency changes of the other threeQTLs wore off earlier. Given that there were no detectable denovo driver mutations, the latter was probably due to over-whelmed competition from clones carrying the beneficialversions of strong QTLs (e.g., RNR4WE, ENASA).
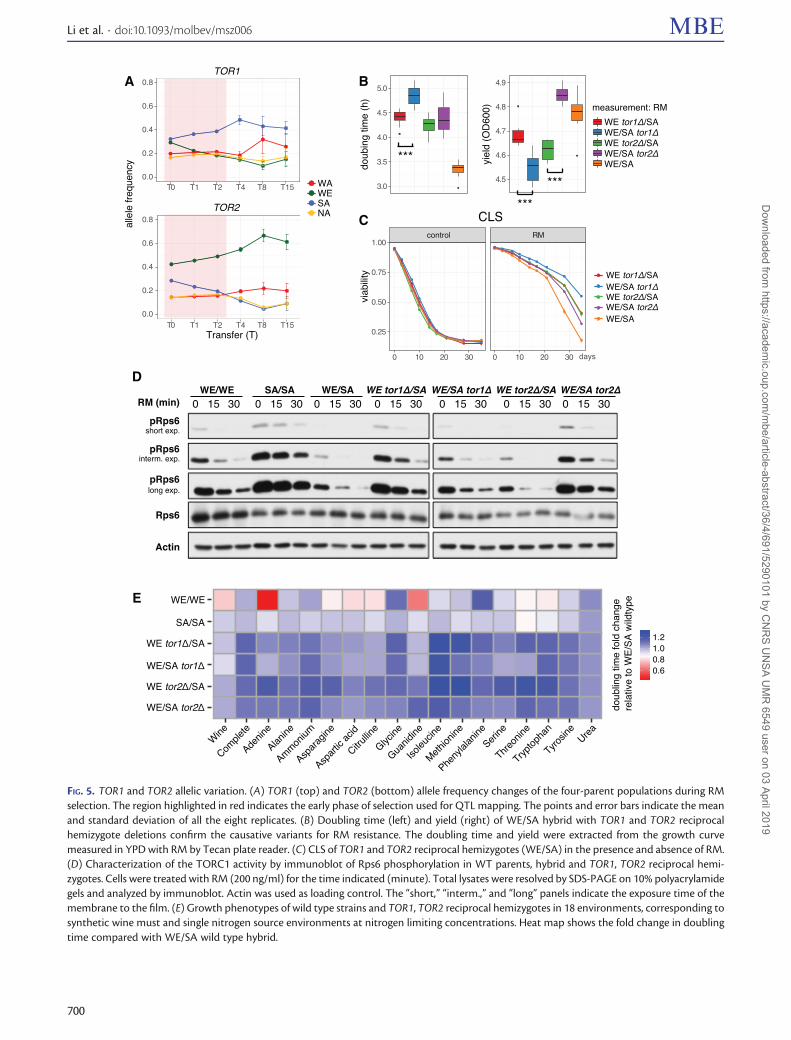
Similarly, we identified four QTLs passing the 99% quantilecut-off in RM (supplementary table S5 and fig. S9,Supplementary Material online). The two strongest QTLscover the TOR1 and TOR2 genes, respectively. Interestingly,the WE and SA alleles of TOR1 and TOR2 show opposite allelefrequency changes: TOR1SA and TOR2WE were selected for,whereas TOR1WE and TOR2SA were selected against (fig. 5A).We validated such parental-specific allelic variation by recip-rocal hemizygosity (fig. 5B and supplementary fig. S5,Supplementary Material online). After normalizing for growthin the control medium, clones carrying the strong TOR1SA
allele grew faster and reached a higher yield than those withthe weak TOR1WE allele in RM (Mann–Whitney U test,P¼ 3.1� 10�4 and P¼ 1.8� 10�3, respectively). Clones car-rying the strong TOR2WE allele showed significantly higher
Shared Molecular Targets Confer Resistance . doi:10.1093/molbev/msz006 MBE
697
Dow
nloaded from https://academ
ic.oup.com/m
be/article-abstract/36/4/691/5290101 by CN
RS U
NSA U
MR
6549 user on 03 April 2019
yield (Mann–Whitney U test, P¼ 1.5� 10�4). Nine addi-tional QTLs passed the 95% quantile cut-off. We consideredSNQ2, NPR3, KOG1, and CTF8 to be strong candidates fordriver QTLs. Among them, CTF8 has been experimentallyvalidated to confer RM resistance in the two-parent popula-tions (V�azquez-Garc�ıa et al. 2017). SNQ2 encodes a multidrugresistance ABC transporter. NPR3 and KOG1 act togetherwith TOR in nutrient signaling pathway. Several other QTLslocate in subtelomeric regions, with the one at the right armof the chromosome XI (chrXI-R) containing the multidrugresistance-associated genes YKR103W and YKR104W (Masonet al. 2003). Based on the end-to-end genome assemblies ofthe four parental strains (Yue et al. 2017), these two subtelo-meric genes were found to be absent in the WE subtelomere,potentially explaining its dramatic allele frequency decreaseduring RM selection. The strong RM QTLs such as TOR1,
TOR2, NPR3, CTF8, and SNQ2 persisted until late time point(supplementary tables S5 and S6 and fig. S8, SupplementaryMaterial online), despite the emergence of driver-mutation-carrying clones. We found the four parental backgroundsequally likely to donate the fitter or less fit alleles to thefour-parent populations. For example, at two of the fourstrongest RM QTLs (supplementary table S5,Supplementary Material online), the SA allele was the mostunfit with substantial allele frequency decreases, despite theSA background being the fittest based on the isogenic paren-tal populations (fig. 1C). Similarly, two strong RM QTLsshowed the WA allele as the fittest, despite the WA back-ground being the most unfit in the isogenic parental popu-lations. The inheritance of drug resistant variants from all thefounder populations provides support to how higher level ofgenetic variation translates into higher rate of adaptation.
A
B
FIG. 3. De novo mutations in TOR1, TOR2, and FPR1 drive RM adaptation in heterogeneous populations. (A) Lines indicate mean doubling time ofthe bulk population (left y-axis). Bars represent frequency dynamics of de novo driver mutations emerging in four-parent populations adapting toRM (right y-axis). Bar colors indicate different driver mutations in FPR1 (light-dark blue), TOR1 (yellow-red), and TOR2 (green). Top and bottompanels show replicates from F12_1 and F12_2, respectively. (B) Doubling time of random individuals drawn from the ancestral (T0, 384 individuals)and RM evolved (T15, 384 individuals) populations. We divided genotyped individuals into groups based on their driver mutations; no individualcarried more than one driver mutation. The number above each boxplot indicates the number of genotyped individuals by Sanger sequencing.Boxplot: center lines, median; boxes, interquartile range (IQR); whiskers, 1.5�IQR. Data points beyond the whiskers are outliers.
Li et al. . doi:10.1093/molbev/msz006 MBE
698
Dow
nloaded from https://academ
ic.oup.com/m
be/article-abstract/36/4/691/5290101 by CN
RS U
NSA U
MR
6549 user on 03 April 2019
Shared Selection Targets between Pre-existing and denovo Variants Act via Distinct MechanismsThe recurrent de novo mutations and QTLs identified in thesame genes (RNR4 in HU and TOR1, TOR2 in RM) showed apattern of selection on shared molecular targets over bothshort and long evolutionary timescales. To our knowledge,this is the very first direct evidence of pre-existing and denovo variants being simultaneously revealed upon conver-gent targets in any evolutionary experiments (Long et al.
2015). To understand this pattern in-depth, we comparedthe pre-existing and de novo variants identified in isogenic,two-parent and four-parent populations (supplementary ta-ble S7, Supplementary Material online, fig. 6). The HU-resistant RNR4WE allele has a single derived amino acid change(Ala161Thr) located within the ribonucleotide reductase do-main, which is predicted to be functionally important basedon sequence analysis (see Supplementary notes). The RNR4de novo driver mutations locate in the same domain but at
A
B
C D
FIG. 4. RNR4 QTL drive adaptation in the four-parent populations in HU. (A) The z-score square underlies QTLs and is derived from allele frequencychanges from T0 to early phase of selection (T1–T4). Dashed and solid lines indicate 99% and 95% quantile cut-off, respectively. Strong QTLs arelabeled in red and weak ones are in black (coordinates listed in supplementary table S5, Supplementary Material online). We filtered out QTLs thatmapped to repetitive regions as well as those detected in YPD control condition (supplementary fig. S9, Supplementary Material online). (B) WEallele frequency changes in chromosome VII in F12_1_HU_2 four-parent population evolved in HU from T0 to T14. The region in the black boxcontains the RNR4 QTL. (C) Frequency changes (mean) of the four RNR4 alleles from T0 to T14, showing 1:3 segregating pattern (one strong allelevs. three weak alleles). The error bars indicate the standard deviation of the eight replicates. The region highlighted in red indicates the early phaseof selection used for QTL mapping. (D) Doubling time of RNR4 reciprocal hemizygotes measured in HU and control experimentally confirmed theRNR4 causative variants. Boxplot: Center lines, median; boxes, interquartile range (IQR); whiskers, 1.5�IQR. Data points beyond the whiskers areoutliers.
Shared Molecular Targets Confer Resistance . doi:10.1093/molbev/msz006 MBE
699
Dow
nloaded from https://academ
ic.oup.com/m
be/article-abstract/36/4/691/5290101 by CN
RS U
NSA U
MR
6549 user on 03 April 2019
A B
C
D
E
FIG. 5. TOR1 and TOR2 allelic variation. (A) TOR1 (top) and TOR2 (bottom) allele frequency changes of the four-parent populations during RMselection. The region highlighted in red indicates the early phase of selection used for QTL mapping. The points and error bars indicate the meanand standard deviation of all the eight replicates. (B) Doubling time (left) and yield (right) of WE/SA hybrid with TOR1 and TOR2 reciprocalhemizygote deletions confirm the causative variants for RM resistance. The doubling time and yield were extracted from the growth curvemeasured in YPD with RM by Tecan plate reader. (C) CLS of TOR1 and TOR2 reciprocal hemizygotes (WE/SA) in the presence and absence of RM.(D) Characterization of the TORC1 activity by immunoblot of Rps6 phosphorylation in WT parents, hybrid and TOR1, TOR2 reciprocal hemi-zygotes. Cells were treated with RM (200 ng/ml) for the time indicated (minute). Total lysates were resolved by SDS-PAGE on 10% polyacrylamidegels and analyzed by immunoblot. Actin was used as loading control. The “short,” “interm.,” and “long” panels indicate the exposure time of themembrane to the film. (E) Growth phenotypes of wild type strains and TOR1, TOR2 reciprocal hemizygotes in 18 environments, corresponding tosynthetic wine must and single nitrogen source environments at nitrogen limiting concentrations. Heat map shows the fold change in doublingtime compared with WE/SA wild type hybrid.
Li et al. . doi:10.1093/molbev/msz006 MBE
700
Dow
nloaded from https://academ
ic.oup.com/m
be/article-abstract/36/4/691/5290101 by CN
RS U
NSA U
MR
6549 user on 03 April 2019
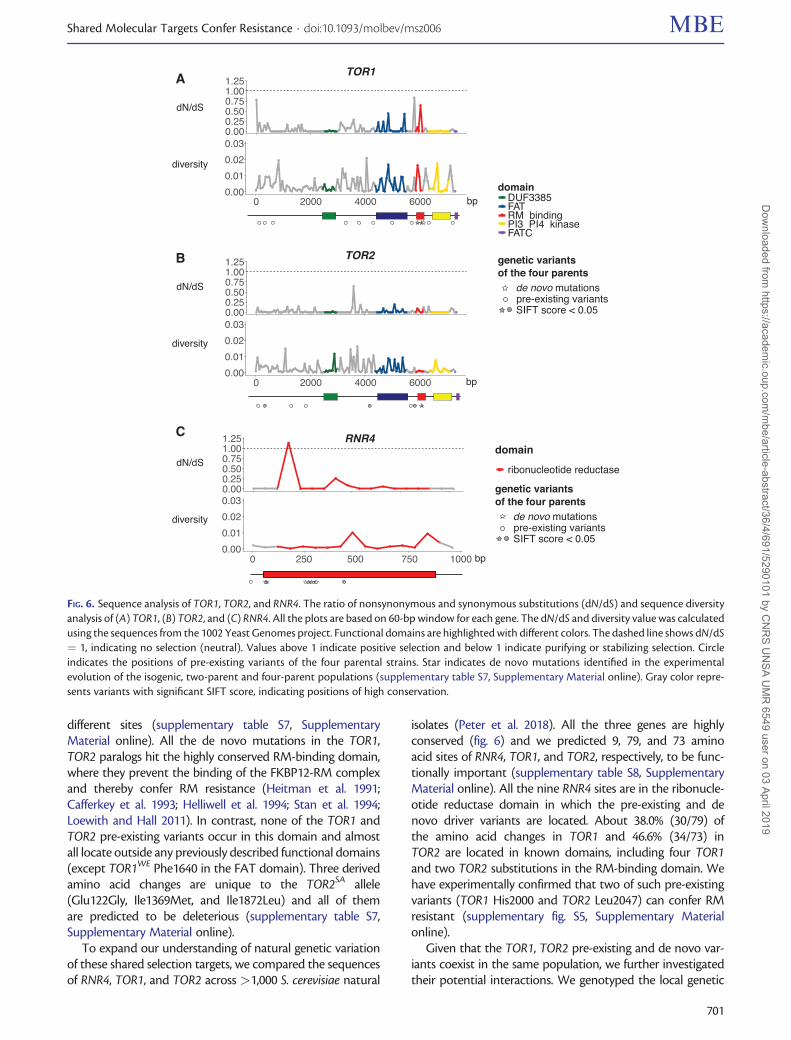
different sites (supplementary table S7, SupplementaryMaterial online). All the de novo mutations in the TOR1,TOR2 paralogs hit the highly conserved RM-binding domain,where they prevent the binding of the FKBP12-RM complexand thereby confer RM resistance (Heitman et al. 1991;Cafferkey et al. 1993; Helliwell et al. 1994; Stan et al. 1994;Loewith and Hall 2011). In contrast, none of the TOR1 andTOR2 pre-existing variants occur in this domain and almostall locate outside any previously described functional domains(except TOR1WE Phe1640 in the FAT domain). Three derivedamino acid changes are unique to the TOR2SA allele(Glu122Gly, Ile1369Met, and Ile1872Leu) and all of themare predicted to be deleterious (supplementary table S7,Supplementary Material online).
To expand our understanding of natural genetic variationof these shared selection targets, we compared the sequencesof RNR4, TOR1, and TOR2 across >1,000 S. cerevisiae natural
isolates (Peter et al. 2018). All the three genes are highlyconserved (fig. 6) and we predicted 9, 79, and 73 aminoacid sites of RNR4, TOR1, and TOR2, respectively, to be func-tionally important (supplementary table S8, SupplementaryMaterial online). All the nine RNR4 sites are in the ribonucle-otide reductase domain in which the pre-existing and denovo driver variants are located. About 38.0% (30/79) ofthe amino acid changes in TOR1 and 46.6% (34/73) inTOR2 are located in known domains, including four TOR1and two TOR2 substitutions in the RM-binding domain. Wehave experimentally confirmed that two of such pre-existingvariants (TOR1 His2000 and TOR2 Leu2047) can confer RMresistant (supplementary fig. S5, Supplementary Materialonline).
Given that the TOR1, TOR2 pre-existing and de novo var-iants coexist in the same population, we further investigatedtheir potential interactions. We genotyped the local genetic
A
B
C
FIG. 6. Sequence analysis of TOR1, TOR2, and RNR4. The ratio of nonsynonymous and synonymous substitutions (dN/dS) and sequence diversityanalysis of (A) TOR1, (B) TOR2, and (C) RNR4. All the plots are based on 60-bp window for each gene. The dN/dS and diversity value was calculatedusing the sequences from the 1002 Yeast Genomes project. Functional domains are highlighted with different colors. The dashed line shows dN/dS¼ 1, indicating no selection (neutral). Values above 1 indicate positive selection and below 1 indicate purifying or stabilizing selection. Circleindicates the positions of pre-existing variants of the four parental strains. Star indicates de novo mutations identified in the experimentalevolution of the isogenic, two-parent and four-parent populations (supplementary table S7, Supplementary Material online). Gray color repre-sents variants with significant SIFT score, indicating positions of high conservation.
Shared Molecular Targets Confer Resistance . doi:10.1093/molbev/msz006 MBE
701
Dow
nloaded from https://academ
ic.oup.com/m
be/article-abstract/36/4/691/5290101 by CN
RS U
NSA U
MR
6549 user on 03 April 2019
backgrounds of TOR1 de novo mutants and found them tobe heterogeneous (supplementary table S4, SupplementaryMaterial online). This lack of interplay between TOR1 muta-tions and their local genetic backgrounds is consistent withthe background-independent emergence of TOR1 mutations.Surprisingly, the TOR2 mutation emerged in a clone carryingthe weak TOR2SA allele. The frequency of TOR2SA initiallydropped from 0.29 (T0) to 0.04 (T8). After being hijackedby the TOR2 Ser1975Ile de novo mutation, its frequencyabruptly increased to 0.46 (T15, supplementary fig. S10,Supplementary Material online). Thus, the emergence ofthe de novo TOR2 mutation masked the RM-susceptibilityof the weak TOR2SA background. One interpretation of this isthat pre-existing and de novo TOR variants affect RM resis-tance via distinct mechanisms. The de novo mutation pre-dominantly occurred in the RM binding domain and acted byimpairing FKBP12-RM binding. We hypothesized that thepre-existing variants acted by providing higher basal TORC1activity. This would maintain sufficient TORC1 activity de-spite a subset of complexes consistently being inactivated byFKBP12-RM binding. In contrast, the de novo mutations inthe RM-binding domain were known not to affect TORC1activity (Gonz�alez et al. 2015). To explore this, we measuredthe TORC1 activity of the TOR1 and TOR2 pre-existing var-iants by a highly specific antibody that assessed the phosphor-ylation of the ribosomal protein S6 (Rps6) under RMexposure (Supplementary notes). Rps6 phosphorylation isregulated by TORC1 and can therefore be used as a specificin vivo assay for TORC1 activity (Gonz�alez et al. 2015). Rps6phosphorylation increased in the strains with the RM resis-tant TOR1SA and TOR2WE alleles (fig. 5D), indicating enhancedTORC1 activity. The enhanced TORC1 activity of TOR1SA andTOR2WE alleles is intriguing, especially considering a majorityof the SNVs in these alleles occur outside known functionaldomains. Taken together, we conclude that the pre-existingand de novo variants converged to TOR1 and TOR2 for RMresistance but via distinct functional mechanisms.
Functional Consequences of TOR Natural VariantsTOR1 and TOR2 are master regulators of growth with ashared role in forming TORC1, which is uniquely sensitiveto RM (Loewith et al. 2002). We were particularly intriguedby the opposite RM resistance phenotypes of the SA and WEalleles of these two paralogous genes, as they occur in twoindependently domesticated lineages for alcoholic beverageproduction (Fay and Benavides 2005). We therefore charac-terized the TOR1 and TOR2 alleles from these two parentalbackgrounds to assess their respective impacts on fitness inenvironments of industrial and medical interest.
Given the role of TORC1 in regulating chronological lifespan (CLS) (Powers et al. 2006), we measured the impact ofTOR variants on CLS (see Supplementary notes). In the pres-ence of RM, clones with the TOR1SA and TOR2WE alleles con-ferred faster growth but shorter CLS than their counterpartswith the TOR1WE and TOR2SA alleles (fig. 5A–C). The wild typehybrid WE/SA showed fastest growth and shortest CLS, indi-cating TOR1 and TOR2 haplo-insufficiency for growth buthaplo-proficiency for CLS. In the absence of RM, there is
almost no difference in CLS between strains, indicating thatthe haplo-proficient effect of single copy TOR1 and TOR2 hasalready saturated in rich medium.
Although RM is an unlikely selection pressure for naturalyeast populations, real ecological constraints such as nitrogenlimitation do affect cell growth via TOR-dependent pathways(Loewith and Hall 2011) and is of central importance for winefermentation. To further explore the TOR1, TOR2 allele pref-erences between the SA and WE backgrounds and to illumi-nate the underlying mechanism, we measured their effect ondoubling time in 18 environments, including nitrogen-limitations and synthetic wine must (fig. 5E). As expected,the WE strain showed fastest growth in synthetic winemust, consistent with its niche-specific domestication history.In general, the removal of one TOR allele led to growth defectsin nitrogen-limited environments, and the removal of the WEallele seemed more adverse than the removal of the SA allele.For example, hybrids carrying TOR1WE grew faster than thosecarrying TOR1SA on methionine and threonine; and hybridswith TOR2WE grew faster than those with TOR2SA in trypto-phan, threonine, serine, methionine, isoleucine, asparagine,and adenine.
Taken together, the background-specific functional diver-gence of the WE and SA alleles on both TOR1 and TOR2 arenot limited to RM resistance. Substantial differences are alsofound in many other biological traits such as TORC1 activity,chronological aging, and nitrogen-dependent growth, whichfurther highlight the functional impact of the independentdomestication histories of the WE and SA strains (Fay andBenavides 2005).
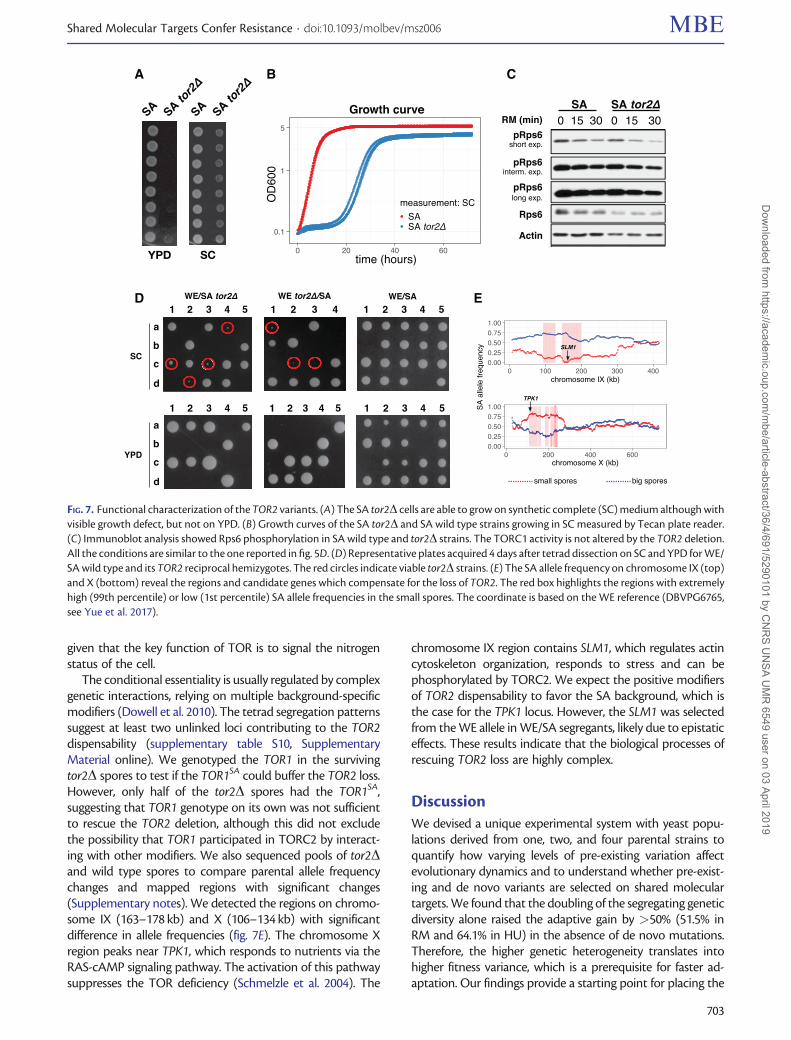
TOR2 Is a Conditionally Essential GeneTOR2 has a unique role in forming TORC2, which is insensi-tive to RM (Loewith et al. 2002) and essential for the growthof the laboratory strain S288C (Winzeler et al. 1999; Liu et al.2015). As expected, TOR2 could not be deleted in WE, NA, orWA. However, we were surprisingly able to delete TOR2 in theSA haploid. The tor2D SA strain can grow on synthetic com-plete medium (SC), although with severe growth defects, butnot on YPD (fig. 7A and B). TORC1 activity of tor2D SAremained unaltered upon the RM treatment (fig. 7C), indi-cating that the SA background is able to compensate theTOR2 loss and does not use TOR2 in TORC1 at all. We dis-sected �900 spores from WE/SA TOR2 reciprocal hemizy-gous deletions (tor2D/TOR2), as well as WE/SA wild type onboth YPD and SC medium. On SC, the spore viability is 83.5%for the wild type and 55.3% for the tor2D/TOR2 cross.Therefore, TOR2 is essential in a fraction of the recombinedWE/SA offspring. By tracking the deletion marker, we esti-mated that 18.5% of the tor2D recombinants survived on SC(supplementary table S9, Supplementary Material online) de-spite growth defects (fig. 7D), whereas no tor2D spores cansurvive on YPD. Therefore, TOR2 is conditionally essential,depending on both genetic backgrounds and growth condi-tions. We do not have an explicit answer for why the tor2Dcells can grow on SC but not on YPD. A plausible explanationis the different amounts and types of nitrogen in SC and YPD,
Li et al. . doi:10.1093/molbev/msz006 MBE
702
Dow
nloaded from https://academ
ic.oup.com/m
be/article-abstract/36/4/691/5290101 by CN
RS U
NSA U
MR
6549 user on 03 April 2019
given that the key function of TOR is to signal the nitrogenstatus of the cell.
The conditional essentiality is usually regulated by complexgenetic interactions, relying on multiple background-specificmodifiers (Dowell et al. 2010). The tetrad segregation patternssuggest at least two unlinked loci contributing to the TOR2dispensability (supplementary table S10, SupplementaryMaterial online). We genotyped the TOR1 in the survivingtor2D spores to test if the TOR1SA could buffer the TOR2 loss.However, only half of the tor2D spores had the TOR1SA,suggesting that TOR1 genotype on its own was not sufficientto rescue the TOR2 deletion, although this did not excludethe possibility that TOR1 participated in TORC2 by interact-ing with other modifiers. We also sequenced pools of tor2Dand wild type spores to compare parental allele frequencychanges and mapped regions with significant changes(Supplementary notes). We detected the regions on chromo-some IX (163–178 kb) and X (106–134 kb) with significantdifference in allele frequencies (fig. 7E). The chromosome Xregion peaks near TPK1, which responds to nutrients via theRAS-cAMP signaling pathway. The activation of this pathwaysuppresses the TOR deficiency (Schmelzle et al. 2004). The
chromosome IX region contains SLM1, which regulates actincytoskeleton organization, responds to stress and can bephosphorylated by TORC2. We expect the positive modifiersof TOR2 dispensability to favor the SA background, which isthe case for the TPK1 locus. However, the SLM1 was selectedfrom the WE allele in WE/SA segregants, likely due to epistaticeffects. These results indicate that the biological processes ofrescuing TOR2 loss are highly complex.
DiscussionWe devised a unique experimental system with yeast popu-lations derived from one, two, and four parental strains toquantify how varying levels of pre-existing variation affectevolutionary dynamics and to understand whether pre-exist-ing and de novo variants are selected on shared moleculartargets. We found that the doubling of the segregating geneticdiversity alone raised the adaptive gain by >50% (51.5% inRM and 64.1% in HU) in the absence of de novo mutations.Therefore, the higher genetic heterogeneity translates intohigher fitness variance, which is a prerequisite for faster ad-aptation. Our findings provide a starting point for placing the
A
D E
B C
FIG. 7. Functional characterization of the TOR2 variants. (A) The SA tor2D cells are able to grow on synthetic complete (SC) medium although withvisible growth defect, but not on YPD. (B) Growth curves of the SA tor2D and SA wild type strains growing in SC measured by Tecan plate reader.(C) Immunoblot analysis showed Rps6 phosphorylation in SA wild type and tor2D strains. The TORC1 activity is not altered by the TOR2 deletion.All the conditions are similar to the one reported in fig. 5D. (D) Representative plates acquired 4 days after tetrad dissection on SC and YPD for WE/SA wild type and its TOR2 reciprocal hemizygotes. The red circles indicate viable tor2D strains. (E) The SA allele frequency on chromosome IX (top)and X (bottom) reveal the regions and candidate genes which compensate for the loss of TOR2. The red box highlights the regions with extremelyhigh (99th percentile) or low (1st percentile) SA allele frequencies in the small spores. The coordinate is based on the WE reference (DBVPG6765,see Yue et al. 2017).
Shared Molecular Targets Confer Resistance . doi:10.1093/molbev/msz006 MBE
703
Dow
nloaded from https://academ
ic.oup.com/m
be/article-abstract/36/4/691/5290101 by CN
RS U
NSA U
MR
6549 user on 03 April 2019
evolutionary theory of pre-existing variation on a sound em-pirical basis.
Frequency dynamics of pre-existing variants in the four-parent populations revealed QTLs driving the early adapta-tion. The notably high number of QTLs (13 in RM and 9 inHU) vastly exceeded the single one mapped in the two-parent populations (CTF8 in RM). The explanation to suchclear difference is partially a matter of new alleles being avail-able in the four-parent populations. For example, the largesteffect QTLs (RNR4, TOR1, and TOR2) are driven by the WEand SA alleles that are absent in the two-parent populations.However, there are other QTLs corresponding to the WA andNA alleles but were only observed in the four-parent popu-lations, highlighting the dependence of complex epistaticinteractions on higher genetic heterogeneity (Burke et al.2010).
Towards the later phase of our selection experiment,highly resistant clones emerged and rose to high frequencyin both HU and RM. Nevertheless, the genetic origin andmake-up of these clones differ dramatically between thesetwo selection regimes. Pre-existing variants appeared to driveHU adaptation all the way to the end, implying that beneficialde novo mutations are either too rare or less fit than the bulkdynamics driven by the pre-existing beneficial alleles (i.e., thenine QTLs), which in fact is evident from the higher fitness ofthe final four-parent populations evolved in HU than that ofthe two-parent and NA populations acquiring RNR muta-tions (fig. 1C). Understanding the mechanisms behind requirefurther work, which could be tested experimentally by lineagetracing or competition experiments. It could also be partiallyexplained by negative or sign epistasis weakening the effectsof beneficial de novo alleles (Khan et al. 2011). An additionalexplanation is that the RNR driver mutations appear to bestrongly background-dependent. This is manifested by thetwo batches of experimental evolution in HU, revealingthat RNR mutations are much easier to acquire in the back-ground of homozygous NA or heterozygous NA�WA thanthat of homozygous SA, WE, or WA. Also, we cannot rule outthe adaptive variants other than point mutations, such asstructural rearrangements, but these are difficult to detectusing short-read sequencing in bulk. In contrast, the mid tolate adaptation to RM was consistently driven by clones withde novo mutations in TOR1, TOR2, and FPR1 that emergedand overtook the other competing bulk subpopulations. Thisis consistently true in all genetic contexts and at all levels ofpre-existing variation. We also frequently observed that thehomozygous mutations acquired by the second hit of LOH tobe more adapted than their heterozygous counterparts. LOHis commonly observed in many cancer types, which usuallyinactivate the function of tumor suppressor genes (Rylandet al. 2015). These indicate an important role of LOH in pro-moting clonal evolution and thus influencing the dynamics ofcancer development and treatment (Ford et al. 2015;V�azquez-Garc�ıa et al. 2017).
Our work provides the first example of shared selectiontargets between pre-existing and de novo variants. The con-vergent selection on both pre-existing and de novo variants ofTOR1 and TOR2 is particularly intriguing. First, strong loss-of-
function de novo variants often play an outsized role in ad-aptation to a single constrained selective pressure. However,such mutations are not likely to prevail in natural populationsthat experience changing environments, because purifyingselection acts to remove deleterious variants (Bamshad andWooding 2003). Second, many pre-existing variants from thenatural population may not show up as de novo mutationsbecause the underlying mutation events are too rare. Moreinterestingly, we found that the de novo and pre-existingvariants confer RM resistance via distinct mechanisms: abol-ishing drug binding by de novo variants (Loewith and Hall2011) and altering the TORC1 activity by pre-existing variants.This mechanistic distinction has been supported by the im-munoblotting of the TOR1/2 reciprocal hemizygotes and thefact that a driver mutation in the drug-binding domain cancompletely rescue the nearly extinct weak TOR2SA allele withlow TORC1 activity (supplementary fig. S10, SupplementaryMaterial online). This distinction suggests that the drug-binding domain is under consistent purifying selection,whereas TORC1 activity is under no or sub-population spe-cific selection. Moreover, the TOR2 de novo mutation is muchrarer (only one single instance among all the isogenic, two-parent, and four-parent populations) despite the fact that itsdrug-binding domain has a similar target size as TOR1 andthat TOR1 and TOR2 are thought to be functionally redun-dant in RM resistance (Loewith and Hall 2011). The mostlikely explanation for this drastic difference is the strongerselection constraint on TOR2, which reflects its unique andessential role in forming the TORC2 complex.
The pre-existing WE and SA variants of the two TORparalogs show opposite effects on RM resistance, reflectinglineage-specific functional divergence following the TOR geneduplication. Domestication to industrial niches with distinctsubstrates of fermentation (grape-wine and sake) (Giudiciand Zambonelli 1992; Sasaki et al. 2014) may be one of theexplanations for this functional divergence with drug resis-tance as a side-effect caused by the TOR pleiotropy. Finally,recent studies have implicated intratumoral heterogeneity asa significant driver of drug resistance, bearing big challenges tochemotherapy (Saunders et al. 2012). Both the acceleration ofadaptation by higher pre-existing variation, and the sharedtargets between pre-existing and de novo variants observedin this study have important implications in our understand-ing of drug resistance evolution and treatment development(McGranahan and Swanton 2017).
Materials and Methods
Experimental Evolution and Genome SequencingAll the strains used in this study are listed in supplementarytable S11, Supplementary Material online. We previously gen-erated two F12 populations (four-parent populations—F12_1 and F12_2) via the independent intercrosses of fourdiverged parental strains: DBVPG6044 (West Africa, “WA”),DBVPG6765 (Wine European, “WE”), Y12 (Sake, “SA”), andYPS128 (North America, “NA”) (Cubillos et al. 2013). Theexperimental evolution was initiated from random subsam-ples of F12_1 and F12_2 with population size of 107–108 cells.
Li et al. . doi:10.1093/molbev/msz006 MBE
704
Dow
nloaded from https://academ
ic.oup.com/m
be/article-abstract/36/4/691/5290101 by CN
RS U
NSA U
MR
6549 user on 03 April 2019
In parallel, experimental evolution was also initiated fromisogenic parental populations of similar size. Cells were evenlyspread on YPD agar plates (2% peptone, 1% yeast extract, 2%glucose, 2% agar) with HU (10 mg/ml) or RM (0.025 lg/ml),and incubated at 23�C (of note, we used 23�C instead of 30�Cto avoid selection against WA alleles given this background isvery sensitive to high temperature). Every 2–3 days, all thecells were collected from each plate and resuspended in 1 mlof distilled water. Ten percent of the cell suspension wasplated to a new plate, whereas the remaining 90% werekept in 25% glycerol at –80�C. The selection experimentlasted for 32 days and an overview of the timeline and pop-ulations is reported in supplementary tables S1 and S2,Supplementary Material online. For each drug, there arefour independently evolving replicates derived from F12_1and F12_2 respectively, as well as five or two replicates foreach of the parental isogenic populations in HU or RM, re-spectively. An additional 15 clones (with three replicateseach) from the two-parent populations with different levelsof HU tolerance evolved in HU similarly as described above.We also propagated two replicates derived from F12_1 andF12_2 respectively using drug-free YPD as the control.Procedures were identical to those used for generating andevolving the previously published two-parent population(V�azquez-Garc�ıa et al. 2017). DNA was extracted from pop-ulations of T0, T1, T2, T4, T8, and the last time point (T14 orT15) using “Yeast MasterPure” kit (Epicentre, USA). All sam-ples were sequenced using paired-end sequencing on IlluminaHiSeq 2000/2500 (with Illumina TruSeq SBS v4 chemistry) atthe Wellcome Trust Sanger Institute (Cambridge, UnitedKingdom).
Sequence Alignment, Genotype Calling of Pre-existingVariants and Detection of De Novo MutationsThe sequencing reads were aligned to the S. cerevisiae S288Creference genome (Release R64-1-1). Sequence alignment wascarried out with Stampy v1.0.23 (Lunter and Goodson 2011)and local realignment using BWA v0.7.12 (Li and Durbin2009). We used SAMtools v1.2 (Li 2011) to count read num-bers covering each segregating site (Cubillos et al. 2013) andestimated the parental allele frequency accordingly. We per-formed de novo mutation calling for each sequenced sampleusing three different algorithms: GATK 2.1-5-gf3daab0(DePristo et al. 2011), Platypus v0.7.9.1 (Rimmer et al. 2014),and SAMtools v1.2 (Li 2011). We then filtered these calls bysubtracting all variation called from the parental samples toremove pre-existing variants, required each variant to be on alocus with >10 reads in total and >6 reads reporting thevariant allele, and to pass default filters of the algorithms. ForPlatypus, we included allele bias flagged calls as the sequencedsamples are pools and therefore can have a range of variantallele fractions. We then intersected the calls and filtered outthose variants called by only one variant caller. For the con-firmed driver mutations at the end time point, we furtherexamined their frequency across all previous time points.Finally, we used Ensembl Variant Effect Predictor (VEP) toannotate the mutations (McLaren et al. 2016).
Estimating Allele FrequenciesWe define the allele frequency xj
i at locus i of an allele j in thecross, for example, we define xWA
i to refer to the frequency ofthe WA allele at locus i (and so on forj 2 fWA; NA; WE; SAg). The allele frequency at locus iis normalized, such that xWA
i ¼ 1�P
j2fNA; WE; SAgxji. Given
the number of reads nji mapping to each allele and the total
number of reads at each segregating locus, we estimated theallele frequency using the filterHD algorithm (Fischer et al.2014). filterHD fits a jump-diffusion process to the data wherethe diffusion component models the persistence of allele fre-quencies along the genome, reflecting linkage disequilibriumof nearby loci. Conversely, the jump component allows sud-den changes in the allele frequency, which reflects the geno-type state of large clones in populations that became clonalduring the experiment.
Estimating Copy Number VariationThe per-base sequencing depth was calculated by SAMtoolsv1.2 (Li 2011), which were further used to calculate the me-dian sequencing depth (x) for each chromosome.
Mapping QTLsGiven our allele frequency estimates, we used a 10-kb slidingwindow with a 2-kb step size to localize QTLs. For each het-erogeneous population, we compared the allele frequencychange in a window i between time point t and T0 (e.g.,Dxj
iðtÞ ¼ xjiðtÞ � xj
ið0Þ, j ¼ fWA; NA; WE; SAg). Ifthere is selection on pre-existing variants, we expect a steadyincrease of favored parental allele frequency in regions underselection as selection proceeds. Therefore, for each early trans-fer, we calculated the z-score of allele frequency changes com-pared with T0 in each population: zDx ¼ ðDxj
i � lDxÞ=rDx.Here, lDx and rDx are the mean and standard deviation ofDxj
i in all the four-parent populations evolved in the drug at acertain time point. The z-score square reflects the allele fre-quency deviation from T0. Given the fact that we observeddominant clones at the later phase of our experiment, weonly used the early phase to map QTLs: T0—T4 for HU andT0—T2 for RM. This timing cut-off is determined by thepatterns of allele frequency distribution (supplementary fig.S7, Supplementary Material online). Without dominantclone(s), the allele frequency distribution of the four parentallineages should follow a normal distribution with mean of�0.25. When dominant clones emerge and deplete the ge-netic heterogeneity of the population, the distribution pat-tern should change dramatically, resulting strong allelefrequency deviation from 0.25. We searched for regionswith z-score square higher than 99% or 95% quantile foreach early time point. If the examined regions pass thesecut-offs across T1—T2 for RM and across T1—T4 for HU,but not in the control (drug-free condition), they are assumedto be QTLs (fig. 4A and supplementary fig. S9 and table S5,Supplementary Material online). We excluded regions locatednear chromosome ends, which are prone to false positivesdue to the rich repetitive sequence content. Using thismethod, we also reanalyzed the data from our previoustwo-parent population experiment to make sure that the
Shared Molecular Targets Confer Resistance . doi:10.1093/molbev/msz006 MBE
705
Dow
nloaded from https://academ
ic.oup.com/m
be/article-abstract/36/4/691/5290101 by CN
RS U
NSA U
MR
6549 user on 03 April 2019
contrasting numbers of QTLs identified from the four-parentand two-parent populations are not due to methodologyartifact. QTLs could be either maintained until later timepoints or be hijacked by the spread of clones with beneficialde novo mutations. We define whether a QTL is maintainedby counting the replicates in which the strong allele keepsincreasing or the weak allele keeps decreasing until T4, T8 andthe end. If the number of such replicates is more than six(eight replicates in total), we defined the QTL as maintaineduntil the later time points (supplementary fig. S8 and tables S5and S6, Supplementary Material online).
Growth PhenotypingQuantitative MeasurementFor phenotyping, we sampled the bulk from the isogenic,two-parent and four-parent populations at each serial trans-fer of the experimental evolution (supplementary table S1,Supplementary Material online), thousands of randomly iso-lated clones from initial and final populations (supplementarytable S2, Supplementary Material online), as well as strainswith gene deletion (supplementary table S11, SupplementaryMaterial online). Using a high-resolution large-scale scanningplatform, Scan-o-matic, we monitored growth in a 1536-col-ony design on solid agar plate (Zackrisson et al. 2016). TheScan-o-matic program uses the data from the images takenby the high-quality desktop scanners to calculate the popu-lation size and generate growth curves for the colonies. All thescripts are available on GitHub (https://github.com/Scan-o-Matic/scanomatic; last accessed February 3, 2019).Downstream analysis of doubling time acquired by Scan-o-matic was performed using R and scripts are available onGitHub (see Data availability). The scanners monitored thecolonies growth on synthetic complete (SC) medium (0.14%YNB, 0.5% ammonium sulfate, 0.077% Complete SupplementMixture [CSM, ForMedium], 2% (w/v) glucose and pH buff-ered to 5.8 with 1% (w/v) succinic acid) with drugs (10 mg/mlHU, 0.025 lg/ml RM), and without drug as control at 30�C.We used SC medium rather than YPD because (1) YPD doesnot allow transmissive scanning due to light scattering; (2) SCmedium is more homogeneous than YPD across the plate; (3)YPD medium has limited buffering capacity, which is a majorissue in a colony-based agar screen because of the interactionof neighboring colonies through the acidic metabolites se-creted as they expand. Such interactions lead to largeposition-dependent biases that are difficult to account for.The SC medium is buffered to pH 5.8, dramatically reducingacidity gradients across the plate due to secreted metabolites.Therefore, these conditions are optimized for phenotypingand the noise due to variation in temperature and mediumcomposition between the experimental evolution and phe-notyping condition is negligible (Warringer et al. 2011). Thenitrogen-limited medium used to test the TOR variants con-tains a single nitrogen source present at 30 mg nitrogen/l (Ibstedt et al. 2015). Experiments were run for 3 days andscans were continuously performed every 20 min. After qual-ity control filtering, the measurement of doubling time wasextracted for downstream analysis in R (R version 3.4.1). Allcustom R scripts used for making the plots are available via
the GitHub project repository (see Data availability). Multipletechnical replicates (n) were applied during phenotyping:n� 8 for each sample in drug condition; n� 2 in drug-freecondition; n� 96 for the samples phenotyped in nitrogen-limited conditions. We reported the error of technical repli-cates by listing the standard deviation (SD) in supplementarytable S12, Supplementary Material online.
We also used the Tecan Infinite 200 PRO plate reader tomeasure growth curves in small scale. We precultured thecells overnight and diluted the saturated culture 100 timesinto fresh medium. We measured OD600 every 15 min for atleast 3 days in drugs and control. The raw OD600 values werecorrected and then used to generate growth curves. Doublingtime and yield were extracted using the online tool“PRECOG” (Fernandez-Ricaud et al. 2016). Of note, Scan-o-matic is the predominant phenotyping method in this studyand we notified explicitly in the figure legend if Tecan platereader was used for phenotyping.
Qualitative MeasurementWe performed serial dilution and spotting of the cells tovisually assess adaptation at the population level (supplemen-tary fig. S1, Supplementary Material online) as well as thegrowth phenotypes of gene deletions (supplementary fig.S5, Supplementary Material online). Cells were preculturedin YPD overnight to saturation. Then 5ml of the culture wastaken for spotting assay in the condition of interest. Therewere a total of six 1:10 dilutions from left to right on the plate.We also conducted spotting assay for 48 isolates drawn fromthe SA population evolved in RM (SA_RM_2_T15) in heatcondition (40 �C). For these isolates, we precultured cells inYPD overnight. Then 5ml cells of 1,000-fold dilution fromsaturation were taken to put on YPD and incubated at40 �C. The plates were scanned after two days.
Statistical AnalysisThe Mann–Whitney U test was performed in R using thewilcox.test () function, with two-sided alternative hypothesis.Unless otherwise stated, the doubling time mentioned in thetext corresponds to the mean value of indicated samples.
Data AvailabilityThe source data files and custom scripts are provided in theGitHub project repository via the following link: https://github.com/lj1221/four_parent_experimental_evolution_2017, last accessed February 3, 2019.
More details of the 1002 Yeast Genome Project are avail-able via the link: http://1002genomes.u-strasbg.fr/, lastaccessed February 3, 2019.
Sequence data is deposited to NCBI SRA database withBioProject accession number PRJEB4645.
Additional details of materials and methods are includedin the Supplementary notes.
Supplementary MaterialSupplementary data are available at Molecular Biology andEvolution online.
Li et al. . doi:10.1093/molbev/msz006 MBE
706
Dow
nloaded from https://academ
ic.oup.com/m
be/article-abstract/36/4/691/5290101 by CN
RS U
NSA U
MR
6549 user on 03 April 2019
AcknowledgmentsWe thank Johan Hallin for critical reading of the manuscript.This research is supported by ATIP-Avenir (CNRS/INSERM),Fondation ARC (grant number SFI20111203947), FP7-PEOPLE-2012-CIG (grant number 322035), the FrenchNational Research Agency (grant number ANR-13-BSV6-0006-01), Canc�eropole PACA (AAP emergence), andDuPont Young Professor Award to G.L., by the WellcomeTrust to I.V.-G. (grant number WT097678) and to V.M. (grantnumber WT098051), by the Swedish Research Council (grantnumbers 325-2014-6547 and 621- 2014-4605) to J.W. J.L. issupported by Fondation ARC pour la Recherche sur le Cancer(grant number PDF20140601375). J.-X.Y. is supported byFondation ARC pour la Recherche sur le Cancer(PDF20150602803). B.B. was supported by La Ligue Contrele Cancer (grant number GB-MA-CD-11287) and Fondationpour la Recherche M�edicale (FDT20170437209). We also ac-knowledge CytoMed, the IRCAN Flow Cytometry Facility andthe Genomics Core Facility. The materials of CytoMed weresupported by the Conseil G�en�eral 06, the FEDER, theMinistere de l’Enseignement Sup�erieur, the R�egionProvence Alpes-Cote d’Azur, and the INSERM.
ReferencesBamshad M, Wooding SP. 2003. Signatures of natural selection in the
human genome. Nat Rev Genet. 4(2):99.Barrett RDH, Schluter D. 2008. Adaptation from standing genetic vari-
ation. Trends Ecol Evol. 23(1):38–44.Barrick JE, Yu DS, Yoon SH, Jeong H, Oh TK, Schneider D, Lenski RE, Kim
JF. 2009. Genome evolution and adaptation in a long-term experi-ment with Escherichia coli. Nature 461(7268):1243–1247.
Berg JJ, Coop G. 2015. A coalescent model for a sweep of a uniquestanding variant. Genetics 201(2):707–725.
Burke MK, Dunham JP, Shahrestani P, Thornton KR, Rose MR, Long AD.2010. Genome-wide analysis of a long-term evolution experimentwith Drosophila. Nature 467(7315):587–590.
Burke MK, Liti G, Long AD. 2014. Standing genetic variation drives re-peatable experimental evolution in outcrossing populations ofSaccharomyces cerevisiae. Mol Biol Evol. 31(12):3228–3239.
Cafferkey R, Young PR, McLaughlin MM, Bergsma DJ, Koltin Y, SatheGM, Faucette L, Eng WK, Johnson RK, Livi GP. 1993. Dominantmissense mutations in a novel yeast protein related to mammalianphosphatidylinositol 3-kinase and VPS34 abrogate rapamycin cyto-toxicity. Mol Cell Biol. 13(10):6012–6023.
Cubillos FA, Louis EJ, Liti G. 2009. Generation of a large set of geneticallytractable haploid and diploid Saccharomyces strains. FEMS Yeast Res.9(8):1217–1225.
Cubillos FA, Parts L, Salinas F, Bergstrom A, Scovacricchi E, Zia A,Illingworth CJR, Mustonen V, Ibstedt S, Warringer J, et al. 2013.High-resolution mapping of complex traits with a four-parent ad-vanced intercross yeast population. Genetics 195(3):1141–1155.
DePristo MA, Banks E, Poplin R, Garimella KV, Maguire JR, Hartl C,Philippakis AA, Angel G, del Rivas MA, Hanna M, et al. 2011. Aframework for variation discovery and genotyping using next-generation DNA sequencing data. Nat Genet. 43(5):491–498.
Dowell RD, Ryan O, Jansen A, Cheung D, Agarwala S, Danford T,Bernstein DA, Rolfe PA, Heisler LE, Chin B, et al. 2010. Genotypeto phenotype: a complex problem. Science 328(5977):469.
Fay JC, Benavides JA. 2005. Evidence for domesticated and wild popula-tions of Saccharomyces cerevisiae. PLoS Genet 1(1):e5.
Fernandez-Ricaud L, Kourtchenko O, Zackrisson M, Warringer J,Blomberg A. 2016. PRECOG: a tool for automated extraction and
visualization of fitness components in microbial growth phenomics.BMC Bioinformatics 17:249.
Fischer A, V�azquez-Garc�ıa I, Illingworth CJR, Mustonen V. 2014. High-definition reconstruction of clonal composition in cancer. Cell Rep.7(5):1740–1752.
Ford CB, Funt JM, Abbey D, Issi L, Guiducci C, Martinez DA, Delorey T, LiB, yu White TC, Cuomo C, et al. 2015. The evolution of drug resis-tance in clinical isolates of Candida albicans. eLife 4:e00662.
Gerrish PJ, Lenski RE. 1998. The fate of competing beneficial mutations inan asexual population. Genetica 102–103:127–144.
Giudici P, Zambonelli C. 1992. Biometric and genetic study on acetic acidproduction for breeding of wine yeast. Am J Enol Vitic. 43:370–374.
Gjuvsland AB, Zorgo E, Samy JK, Stenberg S, Demirsoy IH, Roque F,Maciaszczyk-Dziubinska E, Migocka M, Alonso-Perez E, ZackrissonM, et al. 2016. Disentangling genetic and epigenetic determinants ofultrafast adaptation. Mol Syst Biol. 12(12):892.
Gonz�alez A, Shimobayashi M, Eisenberg T, Merle DA, Pendl T, Hall MN,Moustafa T. 2015. TORC1 promotes phosphorylation of ribosomalprotein S6 via the AGC kinase Ypk3 in Saccharomyces cerevisiae.PLoS One 10(3): e0120250.
Heitman J, Movva NR, Hall MN. 1991. Targets for cell cycle arrest by theimmunosuppressant rapamycin in yeast. Science 253(5022):905–909.
Helliwell SB, Wagner P, Kunz J, Deuter-Reinhard M, Henriquez R, HallMN. 1994. TOR1 and TOR2 are structurally and functionally similarbut not identical phosphatidylinositol kinase homologues in yeast.Mol Biol Cell. 5(1):105–118.
Hermisson J, Pennings PS. 2005. Soft sweeps. Genetics 169(4):2335–2352.Herron MD, Doebeli M. 2013. Parallel evolutionary dynamics of adaptive
diversification in Escherichia coli. PLoS Biol. 11(2): e1001490.Ibstedt S, Stenberg S, Bag�es S, Gjuvsland AB, Salinas F, Kourtchenko O,
Samy JKA, Blomberg A, Omholt SW, Liti G, et al. 2015. Concertedevolution of life stage performances signals recent selection on yeastnitrogen use. Mol Biol Evol. 32(1):153–161.
Khan AI, Dinh DM, Schneider D, Lenski RE, Cooper TF. 2011. Negativeepistasis between beneficial mutations in an evolving bacterial pop-ulation. Science 332(6034):1193–1196.
Kosheleva K, Desai MM. 2018. Recombination alters the dynamics ofadaptation on standing variation in laboratory yeast populations.Mol Biol Evol. 35(1):180–201.
Kvitek DJ, Sherlock G. 2013. Whole genome, whole population sequenc-ing reveals that loss of signaling networks is the major adaptivestrategy in a constant environment. PLoS Genet. 9(11): e1003972.
Lang GI, Rice DP, Hickman MJ, Sodergren E, Weinstock GM, Botstein D,Desai MM. 2013. Pervasive genetic hitchhiking and clonal interfer-ence in forty evolving yeast populations. Nature 500(7464):571–574.
Levy SF, Blundell JR, Venkataram S, Petrov DA, Fisher DS, Sherlock G.2015. Quantitative evolutionary dynamics using high-resolution lin-eage tracking. Nature 519(7542):181–186.
Li H. 2011. A statistical framework for SNP calling, mutation discovery,association mapping and population genetical parameter estimationfrom sequencing data. Bioinformatics 27(21):2987–2993.
Li H, Durbin R. 2009. Fast and accurate short read alignment withBurrows-Wheeler transform. Bioinformatics 25:1754–1760.
Liu G, Yong MYJ, Yurieva M, Srinivasan KG, Liu J, Lim JSY, Poidinger M,Wright GD, Zolezzi F, Choi H, et al. 2015. Gene essentiality is a quan-titative property linked to cellular evolvability. Cell 163(6):1388–1399.
Loewith R, Hall MN. 2011. Target of rapamycin (TOR) in nutrient sig-naling and growth control. Genetics 189(4):1177–1201.
Loewith R, Jacinto E, Wullschleger S, Lorberg A, Crespo JL, Bonenfant D,Oppliger W, Jenoe P, Hall MN. 2002. Two TOR complexes, only oneof which is rapamycin sensitive, have distinct roles in cell growthcontrol. Mol Cell 10(3):457–468.
Long A, Liti G, Luptak A, Tenaillon O. 2015. Elucidating the moleculararchitecture of adaptation via evolve and resequence experiments.Nat Rev Genet. 16(10):567–582.
Lunter G, Goodson M. 2011. Stampy: a statistical algorithm for sensitiveand fast mapping of Illumina sequence reads. Genome Res.21(6):936–939.
Shared Molecular Targets Confer Resistance . doi:10.1093/molbev/msz006 MBE
707
Dow
nloaded from https://academ
ic.oup.com/m
be/article-abstract/36/4/691/5290101 by CN
RS U
NSA U
MR
6549 user on 03 April 2019
Mason DL, Mallampalli MP, Huyer G, Michaelis S. 2003. A region within alumenal loop of Saccharomyces cerevisiae Ycf1p directs proteolyticprocessing and substrate specificity. Eukaryot Cell 2(3):588–598.
McGranahan N, Swanton C. 2017. Clonal heterogeneity and tumor evo-lution: past, present, and the future. Cell 168(4):613–628.
McLaren W, Gil L, Hunt SE, Riat HS, Ritchie GRS, Thormann A, Flicek P,Cunningham F. 2016. The ensembl variant effect predictor. GenomeBiol. 17:122.
Palmer AC, Kishony R. 2013. Understanding, predicting and manipulat-ing the genotypic evolution of antibiotic resistance. Nat Rev Genet.14(4):243–248.
Parts L, Cubillos FA, Warringer J, Jain K, Salinas F, Bumpstead SJ, Molin M,Zia A, Simpson JT, Quail MA, et al. 2011. Revealing the geneticstructure of a trait by sequencing a population under selection.Genome Res. 21(7):1131–1138.
Payen C, Sunshine AB, Ong GT, Pogachar JL, Zhao W, Dunham MJ. 2016.High-throughput identification of adaptive mutations in experimen-tally evolved yeast populations. PLoS Genet. 12(10): e1006339.
Peter J, Chiara MD, Friedrich A, Yue J-X, Pflieger D, Bergstrom A, SigwaltA, Barre B, Freel K, Llored A, et al. 2018. Genome evolution across1,011 Saccharomyces cerevisiae isolates. Nature 556(7701):339–344.
Powers RW, Kaeberlein M, Caldwell SD, Kennedy BK, Fields S. 2006.Extension of chronological life span in yeast by decreased TOR path-way signaling. Genes Dev. 20(2):174–184.
Rimmer A, Phan H, Mathieson I, Iqbal Z, Twigg SRF, Consortium W,Wilkie AOM, McVean G, Lunter G. 2014. Integrating mapping-, as-sembly- and haplotype-based approaches for calling variants in clin-ical sequencing applications. Nat Genet. 46(8):912–918.
Ryland GL, Doyle MA, Goode D, Boyle SE, Choong DYH, Rowley SM, Li J,Australian Ovarian Cancer Study Group, Bowtell DDL, Tothill RW.2015. Loss of heterozygosity: what is it good for? BMC Med Genomics8:45.
Sasaki K, Tsuge Y, Sasaki D, Hasunuma T, Sakamoto T, Sakihama Y,Ogino C, Kondo A. 2014. Optimized membrane process to increasehemicellulosic ethanol production from pretreated rice straw byrecombinant xylose-fermenting Saccharomyces cerevisiae. BioresourTechnol. 169:380–386.
Saunders NA, Simpson F, Thompson EW, Hill MM, Endo -Munoz L,Leggatt G, Minchin RF, Guminski A. 2012. Role of intratumouralheterogeneity in cancer drug resistance: molecular and clinical per-spectives. EMBO Mol Med. 4(8):675–684.
Schmelzle T, Beck T, Martin DE, Hall MN. 2004. Activation of the RAS/cyclic AMP pathway suppresses a TOR deficiency in yeast. Mol CellBiol. 24(1):338–351.
Sheng Z, Pettersson ME, Honaker CF, Siegel PB, Carlborg €O. 2015.Standing genetic variation as a major contributor to adaptation inthe Virginia chicken lines selection experiment. Genome Biol. 16:219.
Stan R, McLaughlin MM, Cafferkey R, Johnson RK, Rosenberg M, Livi GP.1994. Interaction between FKBP12-rapamycin and TOR involves aconserved serine residue. J Biol Chem. 269(51):32027–32030.
Teot�onio H, Chelo IM, Bradi�c M, Rose MR, Long AD. 2009. Experimentalevolution reveals natural selection on standing genetic variation. NatGenet. 41(2):251–257.
Turner NC, Reis-Filho JS. 2012. Genetic heterogeneity and cancer drugresistance. Lancet Oncol. 13(4): e178–e185.
V�azquez-Garc�ıa I, Salinas F, Li J, Fischer A, Barr�e B, Hallin J, Bergstrom A,Alonso-Perez E, Warringer J, Mustonen V, et al. 2017. Clonal hetero-geneity influences the fate of new adaptive mutations. Cell Rep.21(3):732–744.
Venkataram S, Dunn B, Li Y, Agarwala A, Chang J, Ebel ER, Geiler-Samerotte K, H�erissant L, Blundell JR, Levy SF, et al. 2016.Development of a comprehensive genotype-to-fitness map ofadaptation-driving mutations in yeast. Cell 166(6):1585–1596.e22.
Warringer J, Liti G, Blomberg A. 2017. Yeast reciprocal hemizygosity toconfirm the causality of a quantitative trait loci-associated gene. ColdSpring Harb Protoc. 2017(8): pdb.prot089078.
Warringer J, Zorgo E, Cubillos FA, Zia A, Gjuvsland A, Simpson JT,Forsmark A, Durbin R, Omholt SW, Louis EJ, et al. 2011. Trait vari-ation in yeast is defined by population history. PLoS Genet. 7(6):e1002111.
Winzeler EA, Shoemaker DD, Astromoff A, Liang H, Anderson K, AndreB, Bangham R, Benito R, Boeke JD, Bussey H, et al. 1999. Functionalcharacterization of the S. cerevisiae genome by gene deletion andparallel analysis. Science 285(5429):901–906.
Yue J-X, Li J, Aigrain L, Hallin J, Persson K, Oliver K, Bergstrom A,Coupland P, Warringer J, Lagomarsino MC, et al. 2017. Contrastingevolutionary genome dynamics between domesticated and wildyeasts. Nat Genet. 49(6):913–924.
Zackrisson M, Hallin J, Ottosson L-G, Dahl P, Fernandez-Parada E,L€andstrom E, Fernandez-Ricaud L, Kaferle P, Skyman A, StenbergS, et al. 2016. Scan-o-matic: high-resolution microbial phenomics at amassive scale. G3 GenesGenomesGenetics 6(9):3003–3014.
Li et al. . doi:10.1093/molbev/msz006 MBE
708
Dow
nloaded from https://academ
ic.oup.com/m
be/article-abstract/36/4/691/5290101 by CN
RS U
NSA U
MR
6549 user on 03 April 2019
![Splicing isoform-specific functional genomic in cancer cells · 2018. 12. 14. · morpholinos, peptide nucleic acid (PNA), locked nucleic acid (LNA)] confer resistance to various](https://static.fdocuments.in/doc/165x107/614a7e2a12c9616cbc697388/splicing-isoform-specific-functional-genomic-in-cancer-cells-2018-12-14-morpholinos.jpg)