Shared mobility - Current practices and guiding principles - US Department of Transport
120
-
Upload
ghislain-delabie -
Category
Travel
-
view
90 -
download
0
Transcript of Shared mobility - Current practices and guiding principles - US Department of Transport
Cover photographs courtesy of Booz Allen Hamilton Inc.
Notice
This document is disseminated under the sponsorship of the U.S. Department of Transportation in the interest of information exchange. The U.S. Government assumes no liability for the use of the information contained in this document.
The U.S. Government does not endorse products or manufacturers. Trademarks or manufacturers' names appear in this report only because they are considered essential to the objective of the document.
The contents of this report reflect the views of the authors, who are responsible for the facts and accuracy of the data presented herein. The contents do not necessarily reflect the official policy of the U.S. Department of Transportation.
This report does not constitute a standard, specification, or regulation.
Quality Assurance Statement
The Federal Highway Administration (FHWA) provides high-quality information to serve Government, industry, and the public in a manner that promotes public understanding. Standards and policies are used to ensure and maximize the quality, objectivity, utility, and integrity of its information. FHWA periodically reviews quality issues and adjusts its programs and processes to ensure continuous quality improvement.

Shared Mobility Primer| i
Technical Report Documentation Page 1. Report No.FHWA-HOP-16-022
2. Government Accession No. 3. Recipient’s Catalog No.
4. Title and SubtitleShared Mobility: Current Practices and Guiding Principles
5. Report DateApril 2016 6. Performing OrganizationCode
7. Author(s)Susan Shaheen (UC Berkeley), Adam Cohen (UC Berkeley), Ismail Zohdy (Booz Allen Hamilton)
8. Performing OrganizationReport No.
9. Performing Organization Name and AddressBooz Allen Hamilton Inc. 20 M St. SE, Suite 1000 Washington, DC 20003
10. Work Unit No. (TRAIS)11. Contract or Grant No.DTFH61-12-D-00047
12. Sponsoring Agency Name and AddressU.S. Department of Transportation Federal Highway Administration 1200 New Jersey Avenue, SE Washington, DC 20590
13. Type of Report and PeriodCovered October 2014 – March 2016 14. Sponsoring Agency CodeHOTM
15. Supplementary NotesThe Contracting Officer’s Technical Representative (COTR) was Wayne Berman and Technical Support was Allen Greenberg. 16. AbstractThis primer provides an introduction and background to shared mobility; discusses the government’s role; reviews success stories; examines challenges, lessons learned, and proposed solutions; and concludes with guiding principles for public agencies. The primer provides an overview of current practices in this emerging field, and it also looks toward the future in the evolution and development of shared mobility. 17. Key WordsShared Mobility, Guiding Principles, Transportation Policy, Planning, Operations, Carsharing, Bikesharing, Ridesharing, Ridesourcing
18. Distribution StatementNo restrictions
19. Security Classif. (of this report)Unclassified
20. Security Classif. (of this page)Unclassified
21. No. ofPages 120
22. Price
Form DOT F 1700.7 (8-72) Reproduction of completed page authorized

Shared Mobility Primer| ii

Shared Mobility Primer| iii
SI* (MODERN METRIC) CONVERSION FACTORS
APPROXIMATE CONVERSIONS TO SI UNITS SYMBOL WHEN YOU KNOW MULTIPLY BY TO FIND SYMBOL
LENGTH in Inches 25.4 millimeters mm ft Feet 0.305 meters m yd Yards 0.914 meters m mi Miles 1.61 kilometers km
AREA in2 square inches 645.2 square millimeters mm2 ft2 square feet 0.093 square meters m2 yd2 square yard 0.836 square meters m2 ac Acres 0.405 hectares ha mi2 square miles 2.59 square kilometers km2
VOLUME fl oz fluid ounces 29.57 milliliters mL gal gallons 3.785 liters L ft3 cubic feet 0.028 cubic meters m3 yd3 cubic yards 0.765 cubic meters m3
NOTE: volumes greater than 1000 L shall be shown in m3 MASS
oz ounces 28.35 grams g lb pounds 0.454 kilograms kg T short tons (2000 lb) 0.907 megagrams
(or "metric ton") Mg (or "t")
TEMPERATURE (exact degrees) oF Fahrenheit 5 (F-32)/9
or (F-32)/1.8 Celsius oC
ILLUMINATION fc foot-candles 10.76 lux lx fl foot-Lamberts 3.426 candela/m2 cd/m2
FORCE and PRESSURE or STRESS lbf poundforce 4.45 newtons N lbf/in2 poundforce per square inch 6.89 kilopascals kPa
Shared Mobility Primer| iv
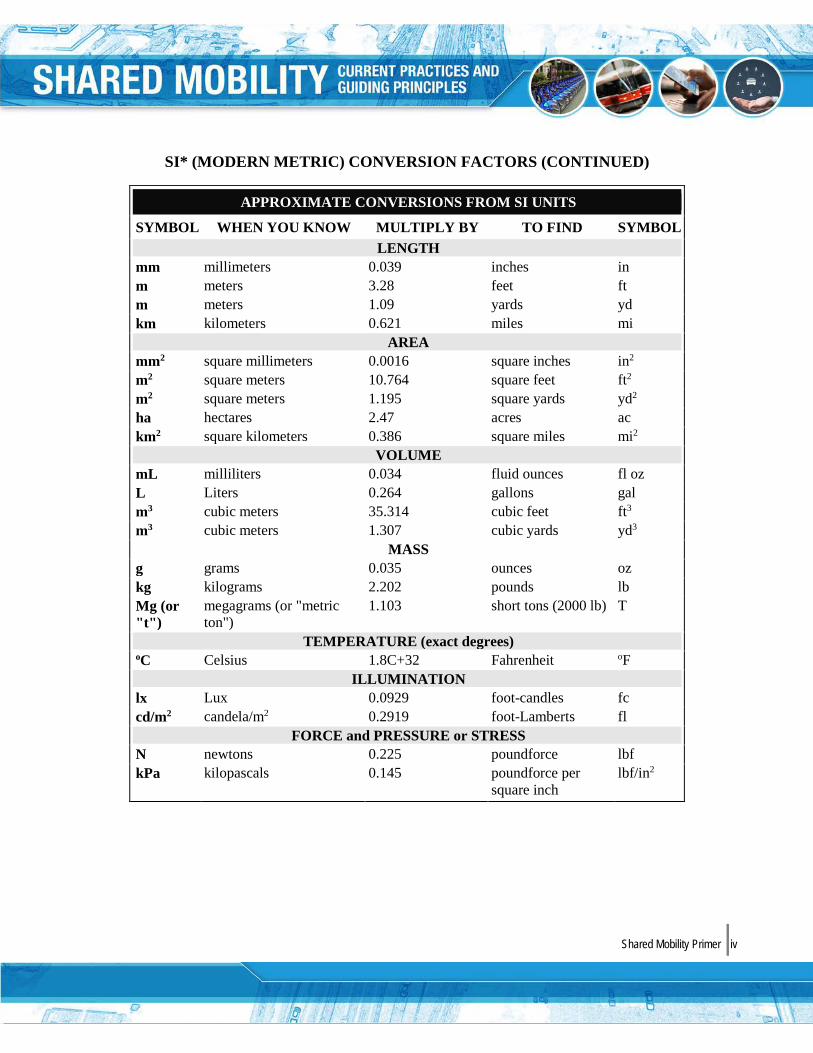
SI* (MODERN METRIC) CONVERSION FACTORS (CONTINUED)
APPROXIMATE CONVERSIONS FROM SI UNITS
SYMBOL WHEN YOU KNOW MULTIPLY BY TO FIND SYMBOL LENGTH
mm millimeters 0.039 inches in m meters 3.28 feet ft m meters 1.09 yards yd km kilometers 0.621 miles mi
AREA mm2 square millimeters 0.0016 square inches in2 m2 square meters 10.764 square feet ft2 m2 square meters 1.195 square yards yd2 ha hectares 2.47 acres ac km2 square kilometers 0.386 square miles mi2
VOLUME mL milliliters 0.034 fluid ounces fl oz L Liters 0.264 gallons gal m3 cubic meters 35.314 cubic feet ft3 m3 cubic meters 1.307 cubic yards yd3
MASS g grams 0.035 ounces oz kg kilograms 2.202 pounds lb Mg (or "t")
megagrams (or "metric ton")
1.103 short tons (2000 lb) T
TEMPERATURE (exact degrees) oC Celsius 1.8C+32 Fahrenheit oF
ILLUMINATION lx Lux 0.0929 foot-candles fc cd/m2 candela/m2 0.2919 foot-Lamberts fl
FORCE and PRESSURE or STRESS N newtons 0.225 poundforce lbf kPa kilopascals 0.145 poundforce per
square inch lbf/in2
Shared Mobility Primer| v
Table of Contents EXECUTIVE SUMMARY ........................................................................................................ IX
CHAPTER 1. INTRODUCTION ................................................................................................. 1 Background ................................................................................................................................ 1 How to Use This Document ...................................................................................................... 3 Shared Mobility Primer Overview ............................................................................................. 3 Key Terms Used in the Primer .................................................................................................. 4 References .................................................................................................................................. 5
CHAPTER 2. OVERVIEW OF SHARED MOBILITY SERVICES ....................................... 7 Introduction ................................................................................................................................ 7
Labor and Consumer Trends ............................................................................................... 7 Technological Trends .......................................................................................................... 8
Shared Mobility Service Options............................................................................................... 9 Membership-Based Self-Service Models .......................................................................... 11 Peer-to-Peer (P2P) Service Models ................................................................................... 13 Non-Membership Self-Service Models ............................................................................. 15 For-Hire Service Models ................................................................................................... 18 Mass Transit Services ........................................................................................................ 21
References ................................................................................................................................ 22
CHAPTER 3. SHARED MOBILITY IMPACTS: CURRENT UNDERSTANDING .......... 23 Carsharing ................................................................................................................................ 23 Bikesharing .............................................................................................................................. 25 Ridesharing .............................................................................................................................. 27
Shared Mobility Primer| vi
Ridesourcing ............................................................................................................................ 27 References ................................................................................................................................ 28
CHAPTER 4. THE ROLE OF PUBLIC AGENCIES IN SHARED MOBILITY ................ 31 Health, Safety, and Consumer Protection ................................................................................ 32 Taxation ................................................................................................................................... 35 Insurance .................................................................................................................................. 38
Carsharing .......................................................................................................................... 39 Peer-to-Peer (P2P) Carsharing ........................................................................................... 39 Bikesharing ........................................................................................................................ 40 Ridesharing ........................................................................................................................ 40 For-Hire Driver Laws ........................................................................................................ 41
Parking and Rights-of-Way ..................................................................................................... 43 Carsharing .......................................................................................................................... 44 Public Bikesharing ............................................................................................................. 46 High-Tech Company Shuttles............................................................................................ 46
Signage and Advertising .......................................................................................................... 47 Multimodal Integration ............................................................................................................ 47
Planning Processes ................................................................................................................... 51
Data Sharing, Privacy, and Standardization ............................................................................ 52 Accessibility and Equity Issues ............................................................................................... 53
Low-Income Access .......................................................................................................... 53 Older Adult Mobility ......................................................................................................... 54
Shared Mobility Primer| vii
Disability Access ............................................................................................................... 54
Conclusion ............................................................................................................................... 55 References ................................................................................................................................ 56
CHAPTER 5. LESSONS LEARNED AND CHALLENGES IN THE FUTURE ................. 61
Consistent Public and Private Sector Standards and Definitions ............................................ 62
Developing Metrics, Modeling, Planning Platforms, and Methodologies to Assess the Economic and Travel Impacts of Shared Mobility .................................................................. 63 Recognizing Shared Mobility as a Key Component of Transportation Policy and Planning . 65
Encouraging Multimodal Integration ...................................................................................... 67 Ensuring Accessibility to and Equity of Shared Modes for All Transportation Users ............ 68
Insurance Regulations, Availability, and Affordability ........................................................... 72 Balancing Data Sharing with Privacy ...................................................................................... 73 Conclusion ............................................................................................................................... 74 References ................................................................................................................................ 75
CHAPTER 6. GUIDING PRINCIPLES FOR PUBLIC AGENCIES .................................... 77
APPENDIX A: TABLES ............................................................................................................. 79
APPENDIX B: GLOSSARY ..................................................................................................... 101
ACKNOWLEDGMENTS ......................................................................................................... 105

Shared Mobility Primer| viii
List of Figures and Tables
Figure 1. Core, Incumbent, and Innovative Services .............................................................................. 10
Figure 2. Shared Mobility Service Models ............................................................................................. 10
Figure 3: Helmet Kiosk for the Pronto Cycle Share System in Seattle .................................................. 32
Figure 4. Driver Insurance Periods Impacting Ridesourcing/TNC Operations ...................................... 43
Figure 5. Portland’s Carsharing Option Zone......................................................................................... 47
Figure 6. car2go Bicycle Racks .............................................................................................................. 49
Figure 7. Shift in Personal Driving as Result of Public Bikesharing Use ............................................... 95
Table 1. Total and Component Costs of Highly Taxed One-Hour Carsharing Reservations................. 37
Table 2. Examples of Shared Mobility Multimodal Integration Efforts ................................................ 50
Table 3. Impacts of Roundtrip Carsharing ............................................................................................. 79
Table 4. Demographics of the North American Roundtrip Carsharing Member (N is the sample size) 83
Table 5. Aggregate Shift in Public Transit and Non-Motorized Modes Due to Roundtrip Carsharing Use .......................................................................................................................................................... 84
Table 6. Public Bikesharing Impacts (limited to the survey respondents during the data collection period) ..................................................................................................................................................... 85
Table 7. Race of Capital Bikeshare Annual Members and Casual Users ............................................... 90
Table 8. Annual/Seasonal/30-Day Bikesharing Member Demographics of Cities Surveyed in Canada and U.S. ................................................................................................................................................... 91
Table 9. Public Bikesharing Member Demographics of Mexico City ................................................... 93
Table 10. Ridesourcing Demographics of Survey Respondents in San Francisco ................................. 96
Table 11. Respondent Modal Preference if Ridesourcing (uberX/Lyft/Sidecar) Were Not Available .. 98
Table 12. Ridesourcing and Taxi Trips Travel Times in San Francisco ................................................ 99

Shared Mobility Primer| ix
EXECUTIVE SUMMARY
Shared mobilitythe shared use of a vehicle, bicycle, or other modeis an innovative transportation strategy that enables users to gain short-term access to transportation modes on an as-needed basis. The term shared mobility includes various forms of carsharing, bikesharing, ridesharing (carpooling and vanpooling), and on-demand ride services. It can also include alternative transit services, such as paratransit, shuttles, and private transit services (called microtransit), which can supplement fixed-route bus and rail services. With diverse options for mobility on the rise, smartphone apps that aggregate these options and optimize routes for travelers are also proliferating. In addition to these innovative travel modes, new ways of transporting and delivering goods are also emerging. These courier network services have the potential to change the nature of the package and food delivery industry, as well as the broader transportation network. Shared mobility is having a transformative impact on many global cities by enhancing transportation accessibility, while simultaneously reducing driving and personal vehicle ownership.
In the context of carsharing and bikesharing, vehicles and bicycles are typically unattended and concentrated in a network of locations where information and communication technology (ICT) and other technological innovations facilitate the transaction of vehicle or bicycle rental. Typically, carsharing and bikesharing operators are responsible for the costs of maintenance, storage, parking, and insurance and fuel (if applicable). With classic ridesharing (carpooling and vanpooling) and on-demand ride services, such as ridesourcing (e.g., Lyft and uberX) or “transportation network companies” or “ride-hailing” and app-enabled taxi services (e.g., Curb, Flywheel), many providers also employ ICT to facilitate the matching of riders and drivers for trips.
A number of environmental, social, and transportation-related benefits have been reported from the use of shared mobility modes. Several studies have documented reduced vehicle use, ownership, and vehicle miles/kilometers traveled. Cost savings and convenience are frequently cited as popular reasons for shifting to a shared mode. Shared mobility can also extend the catchment area of public transit, potentially helping to bridge gaps in existing transportation networks and encouraging multimodality by addressing the first-and-last-mile issue related to public transit access. Shared mobility can also provide economic benefits in the form of cost savings, increased economic activity near public transit stations and multimodal hubs, and increased access by creating connections with origin points not previously accessible via traditional public transportation.
This Shared Mobility Primer provides an introduction and background to shared mobility; discusses the government’s role; reviews success stories; examines challenges, lessons learned, and proposed solutions; and concludes with guiding principles for public agencies. The primer aims to provide an overview of this emerging field and current understanding—as in the years to come, shared mobility will continue to evolve and develop. In light of this evolution, ongoing tracking and longitudinal analysis are recommended to support sound planning and policymaking in the future.

Shared Mobility Primer| ii
Shared Mobility Primer| 1
CHAPTER 1. INTRODUCTION
BACKGROUND
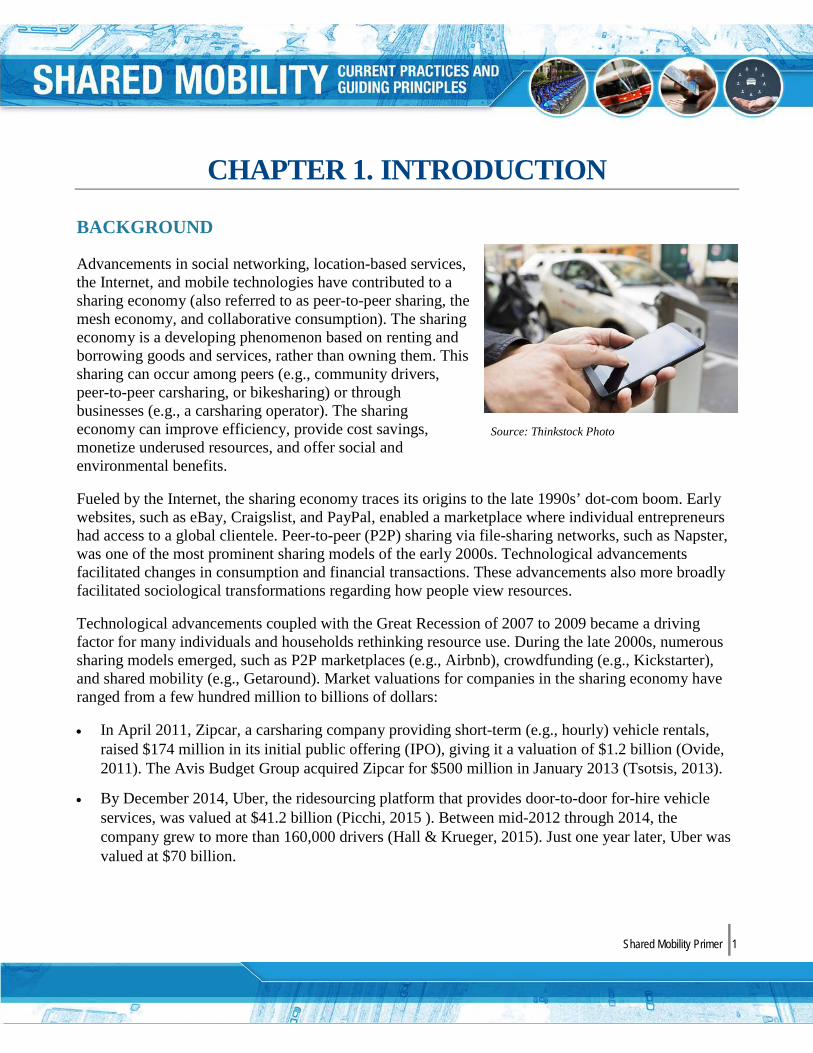
Advancements in social networking, location-based services, the Internet, and mobile technologies have contributed to a sharing economy (also referred to as peer-to-peer sharing, the mesh economy, and collaborative consumption). The sharing economy is a developing phenomenon based on renting and borrowing goods and services, rather than owning them. This sharing can occur among peers (e.g., community drivers, peer-to-peer carsharing, or bikesharing) or through businesses (e.g., a carsharing operator). The sharing economy can improve efficiency, provide cost savings, monetize underused resources, and offer social and environmental benefits.
Fueled by the Internet, the sharing economy traces its origins to the late 1990s’ dot-com boom. Early websites, such as eBay, Craigslist, and PayPal, enabled a marketplace where individual entrepreneurs had access to a global clientele. Peer-to-peer (P2P) sharing via file-sharing networks, such as Napster, was one of the most prominent sharing models of the early 2000s. Technological advancements facilitated changes in consumption and financial transactions. These advancements also more broadly facilitated sociological transformations regarding how people view resources.
Technological advancements coupled with the Great Recession of 2007 to 2009 became a driving factor for many individuals and households rethinking resource use. During the late 2000s, numerous sharing models emerged, such as P2P marketplaces (e.g., Airbnb), crowdfunding (e.g., Kickstarter), and shared mobility (e.g., Getaround). Market valuations for companies in the sharing economy have ranged from a few hundred million to billions of dollars:
• In April 2011, Zipcar, a carsharing company providing short-term (e.g., hourly) vehicle rentals,raised $174 million in its initial public offering (IPO), giving it a valuation of $1.2 billion (Ovide,2011). The Avis Budget Group acquired Zipcar for $500 million in January 2013 (Tsotsis, 2013).
• By December 2014, Uber, the ridesourcing platform that provides door-to-door for-hire vehicleservices, was valued at $41.2 billion (Picchi, 2015 ). Between mid-2012 through 2014, thecompany grew to more than 160,000 drivers (Hall & Krueger, 2015). Just one year later, Uber wasvalued at $70 billion.
Source: Thinkstock Photo
Shared Mobility Primer| 2
• As of March 2015, Airbnb, a website to list, find, and rent lodging, was valued at $20 billion (Saitto, 2015). An average of 425,000 people rent a room from Airbnb every night worldwide (Stein, 2015).
Shared mobility, the shared use of a motor vehicle, bicycle, or other low-speed transportation mode, is one facet of the sharing economy. Shared mobility enables users to obtain short-term access to transportation as needed, rather than requiring ownership. Shared mobility includes carsharing, personal vehicle sharing (i.e., P2P carsharing and fractional ownership), bikesharing, scooter sharing, ridesharing, and on-demand ride services. Alternative transit services, such as shuttle services, paratransit, and microtransit, supplement fixed-route bus and rail services. Shared mobility also includes ridesourcing (sometimes referred to as transportation network companies or TNCs), such as Lyft and Uber; ridesplitting (e.g., UberPOOL and Lyft Line) in which passengers split a fare and ride; and e-Hail (app-enabled taxis). Finally, courier network services (CNS) or flexible good delivery are included in this taxonomy. CNS provide for-hire delivery services for monetary compensation via an online application or platform to connect couriers using their personal vehicles, bicycles, or scooters with freight (e.g., food, packages).
In North America, the first carsharing and bikesharing programs launched in 1994. Shared mobility services have grown rapidly since then. Some benchmarking data include:
• As of July 2015, there were 20 active carsharing programs in Canada, 22 in the United States, one in Mexico, and one in Braziltotaling approximately 1,530,190 carsharing members sharing 25,574 vehicles in the Americas. These numbers include roundtrip carsharing and one-way carsharing operators; they do not include P2P carsharing (Shaheen & Cohen, unpublished data).
• As of October 2015, there were 30,750 bikes at 3,200 stations across 87 IT-based public bikesharing programs in the United States serving three user groups—members (users with an annual or monthly membership); casual users (short-term bikesharing users with 1- to 30-day passes); and occasional members (users with a key-fob to pay for a short-term pass) (Meddin, unpublished data).
• As of July 2011, there were an estimated 638 ridematching services in North America, based on an extensive Internet search. This tally includes both online (most have an Internet-based component) and offline carpooling and vanpooling programs. Those located in sparsely populated rural areas, which appeared to have very low use, were excluded. Institutions that have their own ridematching website but employ a common platform were each counted separately. Of the total, 401 were located in the United States and 261 were in Canada (24 programs span both countries) (Chan & Shaheen, 2011).
In recent years, shared mobility has developed rapidly due to advances in technology and evolving social and economic perspectives toward transportation, car ownership, and urban lifestyles.
Shared Mobility Primer| 3
Economic, environmental, and social forces have pushed shared mobility from the fringe to the mainstream, and its role in urban mobility has become a popular topic of discussion.
Recognizing this growing transportation phenomenon, the Federal Highway Administration (FHWA) is pleased to present Shared Mobility: Current Practices and Guiding Principles. Development of this primer was made possible by 23 specialists and practitioners that conducted an expert review of this primer and participated in a one-day workshop in June 2015. The workshop brought together “thought leaders” from across North America to discuss shared mobility and how to help public agencies develop supportive policies and programs. It is important to note, however, that this is a rapidly evolving field, which requires ongoing tracking and evaluation. This guide presents current understanding at the time of this writing.
HOW TO USE THIS DOCUMENT
This Shared Mobility Primer will be of value to individuals, public agencies, and communities who want to know more about shared mobility and to communities interested in incorporating shared mobility into their transportation networks. This primer is a practical guide with resources, information, and tools for local governments and public agencies seeking to implement emerging services or to manage existing shared mobility services.
The following are some suggestions for the primer’s use:
• Access shared mobility resources. Review findings from numerous sources highlightingchallenges, opportunities, lessons learned, and best practices deploying shared mobility acrossNorth America. What are key guiding principles for implementing shared mobility? Appendix Aincludes tables with key data that can aid in policy development, and Appendix B contains aglossary of terms. Use this primer for strategic transportation planning. How might sharedmobility impact congestion, air quality, emissions, and parking? How could shared mobilityenhance accessibility and mobility?
• Reference this primer to aid public policy development. What are the risks and opportunitiespresented by shared mobility and how can opportunities be leveraged and risks be managed?
SHARED MOBILITY PRIMER OVERVIEW
As noted above, this primer presents an overview of current practices, lessons learned, and guiding principles for public agencies to advance shared mobility in transportation planning and programs. The primer is organized into the following chapters:
• Chapter 1: Introduction. This chapter provides an introduction to and overview of the primer.

Shared Mobility Primer| 4
• Chapter 2: Overview of Shared Mobility Services. This chapter synthesizes existing literature onthe definitions and types of shared mobility services available, at present.
• Chapter 3: Shared Mobility Impacts: Current Understanding. This chapter reviews NorthAmerican shared mobility impact studies including: carsharing, bikesharing, ridesharing, andridesourcing.
• Chapter 4: The Role of Public Agencies in Shared Mobility. This chapter presents commonareas in which local and regional governments and public agencies have an impact on sharedmobility. Topics include health, safety, and consumer protection; taxation; insurance; parking andrights-of-way; signage and advertising; multimodal integration; planning processes; data sharing,data privacy, and standards; and accessibility.
• Chapter 5: Lessons Learned and Challenges in the Future. This chapter reviews commonchallenges, success stories, best practices, and recommendations for shared mobility. Topicsinclude public and private sector definitions; the government’s role in the sharing economy; sharedmobility as a component of transportation policy and planning; multimodal integration; developingmetrics and models for measuring environmental and economic impacts; accessibility and equityissues; consumer protection; insurance; and data sharing and privacy.
• Chapter 6: Guiding Principles for Public Agencies. This chapter concludes the primer anddiscusses guiding principles for public agencies seeking to incorporate shared mobility into theirtransportation networks.
KEY TERMS USED IN THE PRIMER
The following key terms are used throughout the primer. A complete glossary is provided at the end of the document.
Alternative Transit Services: Alternative transit services is a broad category that encompasses shuttles (shared vehicles that connect passengers to transit or employment centers), paratransit, and private sector transit solutions commonly referred to as microtransit.
Bikesharing: In bikesharing systems, users access bicycles on an as-needed basis for one-way (point-to-point) mobility and/or roundtrips. Station-based bikesharing kiosks are typically unattended, concentrated in urban settings, and offer one-way station-based service (bicycles can be returned to any kiosk). Free-floating bikesharing offers users the
ability to check out a bicycle and return it to any location within a predefined geographic region. Bikesharing provides a variety of pickup and drop-off locations. The majority of bikesharing operators cover the costs of bicycle maintenance, storage, and parking. Generally, trips of less than 30 minutes
Shared Mobility Primer| 5
are included within the membership fees. Users join the bikesharing organization on an annual, monthly, daily, or per-trip basis.
Carsharing: With carsharing, individuals have temporary access to a vehicle without the costs and responsibilities of ownership. Individuals typically access vehicles by joining an organization that maintains a fleet of cars and light trucks deployed in lots located within neighborhoods, public transit stations, employment centers, and colleges and universities.
Typically, the carsharing operator provides insurance, gasoline, parking, and maintenance. Generally, participants pay a fee each time they use a vehicle.
Courier Network Services (CNS): CNS are also referred to as flexible goods delivery. They provide for-hire delivery services for monetary compensation via an online application or platform (such as a website or smartphone app) to connect couriers using their personal vehicles, bicycles, or scooters with freight (e.g., packages, food). Although
the business models in this realm are evolving, two general models appear to have emerged—P2P delivery services and paired on-demand passenger ride and courier services.
Microtransit: This is a privately owned and operated shared transportation system that can have fixed routes and schedules, as well as flexible routes and on-demand scheduling. The vehicles generally include vans and buses.
Ridesourcing: Ridesourcing companies (also known as transportation network companies (TNCs) and ride-hailing) provide prearranged and on-demand transportation services for compensation, which connect drivers of personal vehicles with passengers. Smartphone mobile applications facilitate booking, ratings (for both drivers and passengers), and
electronic payment. Ridesourcing also includes “ridesplitting,” in which customers can choose to split a ride and fare in a ridesourcing vehicle (where available).
Scooter Sharing: With scooter sharing, users gain the benefits of a private scooter and/or neighborhood electric vehicle (NEV) without the costs and responsibilities of ownership. Individuals typically access scooters and NEVs by joining an organization that maintains a fleet of them at various locations. Typically, the operator provides power/charging or
fuel, parking, and maintenance. Generally, participants pay a fee each time they use a scooter/NEV. Trips can be roundtrip, one-way, or both.
Shared Mobility: This term refers to the shared use of a motor vehicle, bicycle, or other low-speed mode.
REFERENCES
Chan, N., & Shaheen, S. (2011). Ridesharing in North America: Past, Present, and Future. Transport Reviews, 1-20.
Shared Mobility Primer| 6
Hall, J., & Krueger, A. (2015). An Analysis of the Labor Market for Uber’s Driver-Partners in the United States. 1-27.
Ovide, S. (2011, April 14). Zipcar IPO Soars 66% Out of the Gate. Retrieved from The Wall Street Journal: http://blogs.wsj.com/deals/2011/04/14/zipcar-ipo-soars-66-out-of-the-gate/
Picchi, A. (2015 , January 22). Uber raises $1.6 billion to speed expansion. Retrieved from CBS News: http://www.cbsnews.com/news/uber-raises-1-6-billion-to-speed-expansion/
Saitto, S. (2015, March 1). Airbnb Said to Be Raising Funding at $20 Billion Valuation. Retrieved from Bloomberg: http://www.bloomberg.com/news/articles/2015-03-01/airbnb-said-to-be-raising-funding-at-20-billion-valuation
Stein, J. (2015, February 9). Some French Guy Has My Car. Time, pp. 33-40.
Tsotsis, A. (2013, January 2). Car Rental Company Avis To Buy Zipcar For $500 Million. Retrieved from Tech Crunch: http://techcrunch.com/2013/01/02/avis-to-buy-zipcar-for-500-million/
Shared Mobility Primer| 7
CHAPTER 2. OVERVIEW OF SHARED MOBILITY SERVICES
INTRODUCTION
Shared mobility is having a transformative impact on many cities by enhancing transportation accessibility, increasing multimodality, reducing vehicle ownership and vehicle miles traveled (VMT) in some cases, and providing new ways to access goods and services. Several trends are impacting the growth and mainstreaming of shared mobility, as highlighted below.
Labor and Consumer Trends
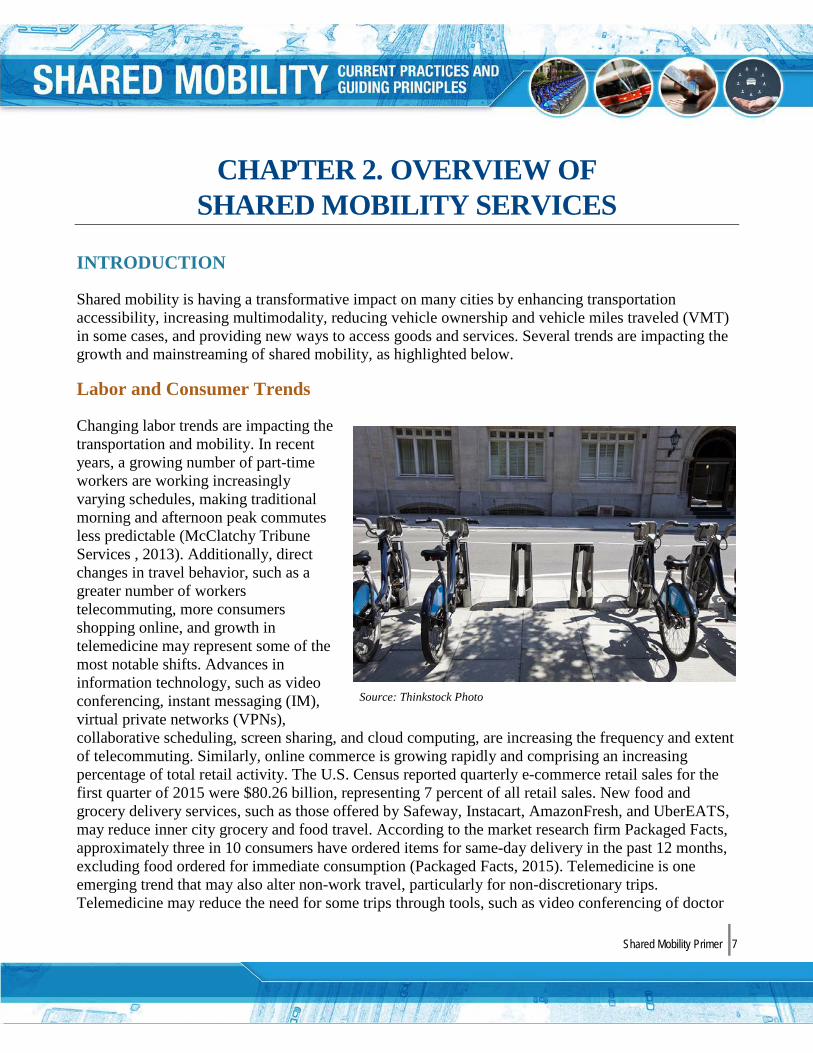
Changing labor trends are impacting the transportation and mobility. In recent years, a growing number of part-time workers are working increasingly varying schedules, making traditional morning and afternoon peak commutes less predictable (McClatchy Tribune Services , 2013). Additionally, direct changes in travel behavior, such as a greater number of workers telecommuting, more consumers shopping online, and growth in telemedicine may represent some of the most notable shifts. Advances in information technology, such as video conferencing, instant messaging (IM), virtual private networks (VPNs), collaborative scheduling, screen sharing, and cloud computing, are increasing the frequency and extent of telecommuting. Similarly, online commerce is growing rapidly and comprising an increasing percentage of total retail activity. The U.S. Census reported quarterly e-commerce retail sales for the first quarter of 2015 were $80.26 billion, representing 7 percent of all retail sales. New food and grocery delivery services, such as those offered by Safeway, Instacart, AmazonFresh, and UberEATS, may reduce inner city grocery and food travel. According to the market research firm Packaged Facts, approximately three in 10 consumers have ordered items for same-day delivery in the past 12 months, excluding food ordered for immediate consumption (Packaged Facts, 2015). Telemedicine is one emerging trend that may also alter non-work travel, particularly for non-discretionary trips. Telemedicine may reduce the need for some trips through tools, such as video conferencing of doctor
Source: Thinkstock Photo
Shared Mobility Primer| 8
visits with patients, e-transmission of diagnostic images, remote monitoring of patient vital signs, online continued medical education, nursing call centers, and web-based applications.
Additionally, the increased use of for-hire vehicle services (e.g., taxis, ridesourcing, and microtransit) and a greater reliance on just-in-time delivery platforms, such as CNS and direct business to consumer (B2C) delivery (e.g., Amazon and Ebay), are also impacting travel behavior. Together these servicescoupled with real-time information and mobile technologiescontinue to encourage last-minute planning and on-demand or instant modal and delivery selections.
Technological Trends
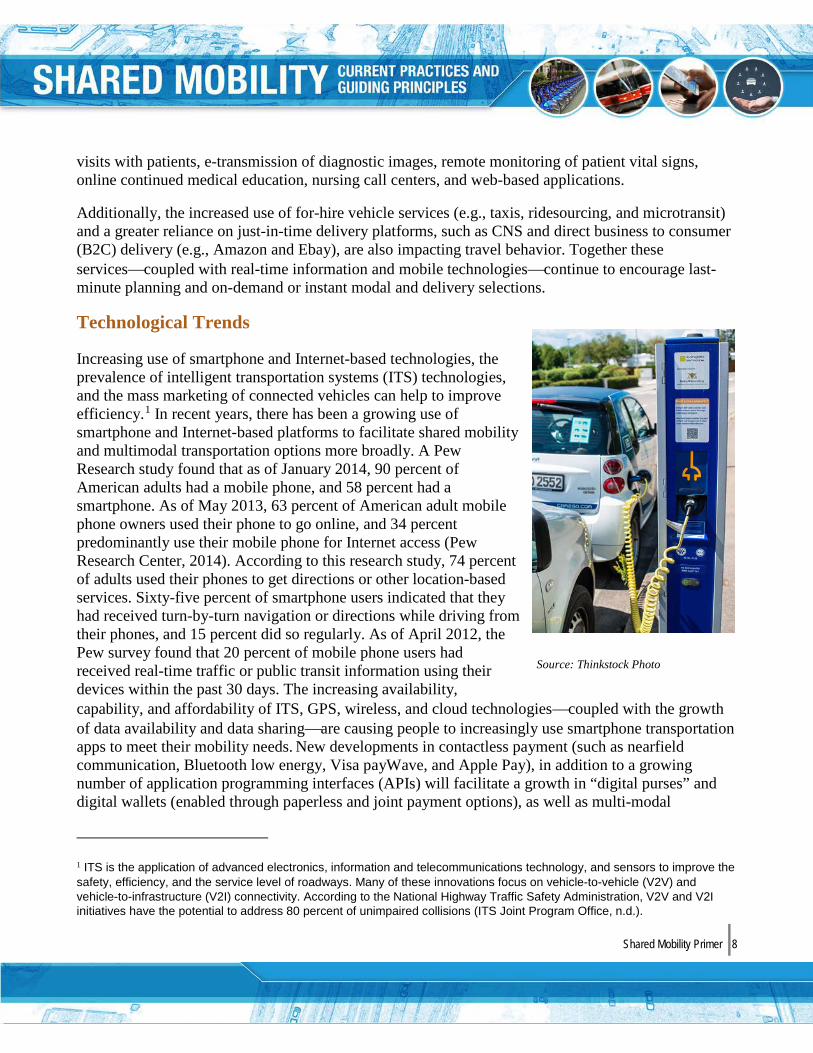
Increasing use of smartphone and Internet-based technologies, the prevalence of intelligent transportation systems (ITS) technologies, and the mass marketing of connected vehicles can help to improve efficiency.1 In recent years, there has been a growing use of smartphone and Internet-based platforms to facilitate shared mobility and multimodal transportation options more broadly. A Pew Research study found that as of January 2014, 90 percent of American adults had a mobile phone, and 58 percent had a smartphone. As of May 2013, 63 percent of American adult mobile phone owners used their phone to go online, and 34 percent predominantly use their mobile phone for Internet access (Pew Research Center, 2014). According to this research study, 74 percent of adults used their phones to get directions or other location-based services. Sixty-five percent of smartphone users indicated that they had received turn-by-turn navigation or directions while driving from their phones, and 15 percent did so regularly. As of April 2012, the Pew survey found that 20 percent of mobile phone users had received real-time traffic or public transit information using their devices within the past 30 days. The increasing availability, capability, and affordability of ITS, GPS, wireless, and cloud technologiescoupled with the growth of data availability and data sharingare causing people to increasingly use smartphone transportation apps to meet their mobility needs. New developments in contactless payment (such as nearfield communication, Bluetooth low energy, Visa payWave, and Apple Pay), in addition to a growing number of application programming interfaces (APIs) will facilitate a growth in “digital purses” and digital wallets (enabled through paperless and joint payment options), as well as multi-modal
1 ITS is the application of advanced electronics, information and telecommunications technology, and sensors to improve the safety, efficiency, and the service level of roadways. Many of these innovations focus on vehicle-to-vehicle (V2V) and vehicle-to-infrastructure (V2I) connectivity. According to the National Highway Traffic Safety Administration, V2V and V2I initiatives have the potential to address 80 percent of unimpaired collisions (ITS Joint Program Office, n.d.).
Source: Thinkstock Photo
Shared Mobility Primer| 9
aggregators, trip planners, and booking systems. Additionally, the use of incentivization (e.g., offering points, discounts, or lotteries) and gamification (e.g., use of game design elements in a non-game context) are other key factors driving end-user growth of smartphone transportation applications. The increasing availability of real-time information (e.g., congestion, parking, and public transportation) will continue to impact both mobility choices and routing. Collectively, these tools are leading to the advent of “smart mobility consumers”travelers who can combine information from multiple sources and make smarter, more informed travel decisions.
These technologies are coming at a time when the existing infrastructure is often at or beyond its capacity. Congestion, parking shortages, and frustration with existing for-hire vehicle services are causing travelers to search for innovative technologies and services to address these mobility challenges. Many of these technologies are being used both independently and in conjunction with ITS to achieve travel time savings (e.g., by using high occupancy vehicle lanes) and financial savings (e.g., by providing real-time information about low-cost transportation options).
SHARED MOBILITY SERVICE OPTIONS
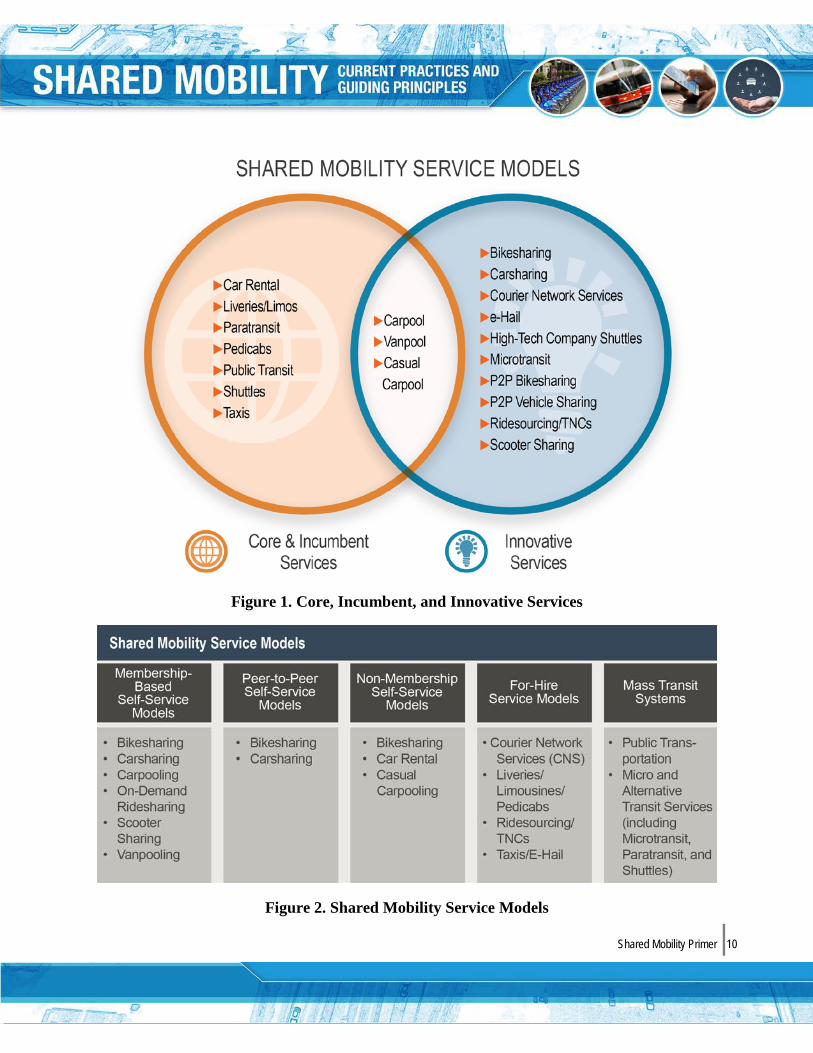
Shared mobility has become a ubiquitous part of the urban transportation network, encompassing a variety of modes ranging from public transportation, taxis, and shuttles to carsharing, bikesharing, and on-demand ride and delivery services. Fundamentally, these services can be categorized into five groupings: 1) membership-based self-service models, 2) P2P self-service models, 3) non-membership self-service models, 4) for-hire service models, and 5) mass transit systems. Some distinguish among the shared services between sequential (use by one user and then another, e.g., bikesharing and carsharing) and concurrent models (shared by many at one time, e.g., microtransit, carpooling, ridesplitting) (Transportation Research Board, 2015). This chapter synthesizes existing literature on the definitions and types of shared mobility services available, as of December 2015.
Shared mobility includes various service models and transportation modes to meet the diverse needs of users. This section shows incumbent and innovative services (Figure 1) and defines the five service models and the modes offered within each (Figure 2). Broadly, there are two ways to view shared mobility in the larger ecosystem of surface transportation modal options. Shared mobility can be viewed as emerging or innovative in contrast to existing core and incumbent services (see Figure 1). It can also be understood in the context of their underlying service models (see Figure 2). For example, shared mobility services may be membership-based, non-membership-based, P2P, or for-hire. Figure 1 and Figure 2 provide a list of incumbent and innovative services and a typology of these categories and their included modes, respectively.
Shared Mobility Primer| 10
Figure 1. Core, Incumbent, and Innovative Services
Figure 2. Shared Mobility Service Models
Shared Mobility Primer| 11
Membership-Based Self-Service Models
Membership-based self-service models contain five common characteristics: 1) an organized group of participants; 2) one or more shared vehicles, bicycles, scooters, or other low-speed mode; 3) either a decentralized network of pods or stations used for departure and arrival for roundtrip or station-based one-way services or a free-floating decentralized vehicle network with flexible departure and arrival locations typically within the confines of a fixed geographic boundary; 4) short-term access typically in increments of one hour or less; and 5) self-service access.
These models can include roundtrip services (motor vehicle, bicycle, or other low-speed mode is returned to its origin); one-way stationed-based (vehicle, bicycle, or low-speed mode is returned to different designated station location); and one-way free-floating (motor vehicle, bicycle, or low-speed mode can be returned anywhere within a geographic area). In addition to one-way and roundtrip service models, membership-based self-service models can be deployed as either “open systems” available to the public or “closed community systems” with limited access to predefined groups, such as members of a university community, residents of an apartment complex, or employees of a particular employer or office park. See descriptions of the range of innovative shared modes included in membership-based self-service models below.
Bikesharing
• IT-based public bikesharing first launched inNorth America in 2007 in Tulsa, OK. This wasfollowed by the launch of SmartBike inWashington, DC, in 2008 and numerous othersystems shortly thereafter throughout Canadaand the United States. Bikesharingexperienced near exponential growth in NorthAmerica in 2011.
• Bikesharing users access bicycles on an as-needed basis. Trips can be point-to-point,roundtrip, or both, allowing the bikes to beused for one-way transport and for multimodalconnectivity (first-and-last mile trips, many-mile trips, or both). Station-based bikesharingkiosks are typically unattended, concentratedin urban settings, and offer one-way station-based services (bicycles can be returned toany docking location). Free-floatingbikesharing offers users the ability to checkout a bicycle and return it to any location withina predefined geographic region.
Bikesharing provides a variety of pickup and drop-off locations, enabling an on-demand, very low emission form of mobility.
• The majority of bikesharing operators cover thecosts of bicycle maintenance, storage, and parking. Generally, trips of less than 30 minutes are included within the membership fees. Users can access bikesharing as members (e.g., typically on an annual, seasonal, or monthly basis) or as casual users (e.g., generally daily or per-trip basis). Bikesharing users can pick up a bike at any dock by using their credit card, membership card, key, and/or mobile phone (a new feature with BCycle and RideScout added in October 2015). They can return the bike to any dock (or the same dock in a roundtrip service) where there is room and end their session.
Shared Mobility Primer| 12
Bikesharing (Continued)
• In addition to the public bikesharing systems that are available to the public at large, closed-campus systems are increasingly being deployed at university and office campuses. These closed-campus systems are available only to the particular campus community they serve.
• In addition to these innovations, electric bikesharing (also known as e-bikesharing) is emerging. Electric bicycles (e-bikes) have an electric motor that reduces the effort required by the rider. Such bicycles can enable individuals to use the system who may otherwise have physical difficulties pedaling traditional bicycles or others who may be in dress clothing and want to avoid perspiring. E-bikes can also extend travel distances and enable bikesharing in areas of steep terrain and varied topography.
•
• In June 2015, the City of Seattle applied for a multi-million dollar grant to expand the city’s Pronto bikesharing program to include some e-bikes. Similarly, in September 2015, Canadian-based Bewegen launched e-bikesharing in Birmingham, Alabama. The system includes an estimated 400 bikes and 100 e-bikes across 40 docking stations (Staff, 2015).
• A 2012 survey of 20 U.S. public bikesharing programs found the average cost of daily passes was $7.77, with all programs offering the first 30 minutes free of charge. Twelve programs offered monthly memberships, averaging $28.09 per month. Eighteen of the programs offered annual or seasonal memberships, costing an average of $62.46 (Shaheen S. , Martin, Chan, Cohen, & Pogodzinski, 2014).
Carsharing
• Carsharing launched in Canada in 1994, and this was followed by numerous programs throughout the United States starting in 1998. Individuals gain the benefits of private vehicle use without the costs and responsibilities of ownership.
• Individuals typically access vehicles by joining an organization that maintains a fleet of cars and light trucks deployed in lots located within neighborhoods, public transit stations, employment centers, and colleges/universities and sometimes also using on-street parking. Typically, the carsharing operator provides insurance, gasoline, parking, and maintenance. Generally, participants pay a fee each time they use a vehicle.
• Service models can include roundtrip carsharing (vehicle returned to its origin), one-way stationed-based (vehicle returned to different designated carsharing location), and one-way free-floating (vehicle returned anywhere within a geo-fenced area).
• A 2005 survey of American roundtrip carsharing operators found that the average cost to drive 50 miles for two hours in a carsharing vehicle was about $24, which rose to about $28 for four hours, $31 for six hours, and $34 for eight hours (Shaheen, Cohen, & Roberts, 2006).
Shared Mobility Primer| 13
Scooter Sharing
• As of September 2015, there were two scootersharing systems in the United States: ScootNetworks in San Francisco, California andScootaway in Columbia, South Carolina. Bothof these systems offer one-way and roundtripshort-term scooter sharing, which includesinsurance and helmets. Scootaway scootersrun on gasoline, which is included within theprice of the rental.
• Scooter users have two pricing options: 1) $4per every half-hour of use with no monthly fee;or 2) $19 per month and usage billed at $2 perhour. Scoot has also recently introduced 10four-wheeled, two-seater “Twizy” vehicles intoits fleet from Renault (branded as Nissan in theU.S.), priced at $8 per half-hour of use (Scoot,unpublished data, 2015). Scootaway, located inSouth Carolina, bills at a flat rate of $3 per half-hour of use (Scootaway, unpublished data).
Vanpooling
• Vanpools are typically comprised of 7 to 15people commuting on a regular basis using avan or similarly-sized vehicle. Vanpoolsnormally have a coordinator and an alternativecoordinator.
• Vanpool participants share the cost of the vanand operating expenses and may share theresponsibility of driving. A vanpool could costbetween $100 and $300 per person per month,although this varies considerably depending ongas prices, local market conditions, andgovernment subsidies (Martin, unpublisheddata).
Peer-to-Peer (P2P) Service Models
Carsharing and bikesharing have also given rise to peer-to-peer (P2P) systems that enable vehicle and bicycle owners to rent their vehicles and bicycles when they are not in use. In P2P service models, companies broker transactions among car, bicycle, or other mobility owners and renters by providing the organizational resources needed to make the exchange possible (i.e., online platform, customer support, driver and motor vehicle safety certification, auto insurance, and technology). P2P services differ from membership-based self-service carsharing or bikesharing in that the operator owns the private vehicles or bicycles being shared.
Similar to carsharing and bikesharing, P2P services also have their own niche markets. Spinlister (previously known as Liquid) is one P2P bicycle sharing system in North America. Another company, Bitlock, sells keyless Bluetooth bicycle locks that can be used for personal use or for P2P sharing. Getaround and Turo (formerly RelayRides) are examples of P2P carsharing operators providing service in metropolitan markets. Another service, FlightCar, provides vehicle owners with free parking
Shared Mobility Primer| 14
at major airports in exchange for renting their vehicles to inbound visitors. In return, the vehicle owner receives a commission based on the number of miles the vehicle is driven.
As of January 2015, there were three common deployments of P2P mobility sharing: 1) P2P carsharing in urban neighborhoods (where privately owned vehicles are made available for carsharing in urban settings); 2) P2P airport-based carsharing (where outbound airport travelers can park and make their vehicles available for inbound airport passenger short-term rental); and 3) P2P bikesharing in urban neighborhoods (where privately-owned bicycles are made available for bikesharing use). There are four types of personal vehicle sharing ownership models: 1) Fractional Ownership Models; 2) Hybrid P2P-Traditional Models; 3) P2P Access Model (typically called P2P carsharing); and 4) P2P Marketplace.
Fractional Ownership
• Individuals sub-lease or subscribe to access amotor vehicle or low-speed mode owned by athird party. These individuals have “rights” tothe shared service in exchange for taking on aportion of the expense. This could be facilitatedthrough a dealership and a partnership with acarsharing operator, where the car ispurchased and managed by the carsharingoperator. This enables access to vehicles thatindividuals might otherwise be unable to afford(e.g., higher-end models) and results in incomesharing when the vehicle is rented to non-owners.
• At present, fractional ownership companies inthe United States include Curvy Road, GothamDream Cars, and CoachShare. In December2014, Audi launched its “Audi Unite” fractionalownership model in Stockholm, Sweden. Audi Unite offers multi-party leases with pricingbased on the model, yearly mileage (2,000 or3,000 km or ~1,240 to 1,860 miles), and thenumber of drivers sharing the vehicle thatranges from two to five. For example, an AudiUnite A3 sedan can be leased among fivedrivers for approximately 1,800 kronors permonth (~$208 USD per driver per month) for2,000 annual km (~1,240 miles) on a 24-monthlease. Each Audi Unite user is given aBluetooth key fob and a smartphone app thatallows co-owners to schedule vehicle use.
Hybrid Peer-to-Peer (P2P) Traditional Model
• Individuals access vehicles or low-speedmodes by joining an organization that maintainsits own fleet, but it also includes private autos orlow-speed modes throughout a network oflocations. Insurance is typically provided by theorganization during the access period for bothroundtrip carsharing and P2P vehicles.
• Members access vehicles or the other low-speed modes through a direct key exchange ora combination transfer from the owner or viaoperator-installed technology that enables“unattended access.” Pricing in this modelworks similar to roundtrip carsharing.
Shared Mobility Primer| 15
Peer-to-Peer (P2P) Access Model
• This model is frequently called P2P carsharing.It employs privately-owned vehicles or low-speed modes made temporarily available forshared use by an individual or members of aP2P company. Insurance is generally providedby the P2P organization during the accessperiod. In exchange for providing the service,operators keep a portion of the usage fee.
• Members can access vehicles or low-speedmodes through a direct key exchange or acombination transfer from the owner or viaoperator-installed technology that enables“unattended access.”
• The P2P carsharing operator generally takes aportion of the rental amount in return forfacilitating the exchange and providing third-party insurance. For example, Turo (formerlyRelayRides) takes a 25 percent commissionfrom the owner along with 10 percent from therenter. Getaround takes 40 percent from theowner for its services. With FlightCar, the carowner is paid $.05 to $.20 per mile, with anaverage payment of $20 to $30. There are noparking fees at the airport, and the vehicle iswashed and vacuumed when the owner picks itup upon return. There also is a flat-rate monthlyprogram in which the driver can net a total of$250 or greater.
• As of May 2015, there were eight active P2Poperators in North America, with two moreplanned to start in the near future.
Peer-to-Peer (P2P) Marketplace
• P2P marketplace enables direct exchanges among individuals via the Internet. Terms are generallydecided among parties of a transaction, and disputes are subject to private resolution.
Non-Membership Self-Service Models Non-membership self-service models include rental cars and carpooling. See below for a description of
these services.

Shared Mobility Primer| 16
Bikesharing
• As previously mentioned, users can access bikesharing as members (e.g., typically on an annual, seasonal, or monthly basis) or as casual users or non-members (e.g., generally daily or a per-trip basis). Casual users do not have bikesharing accounts, and typically the bikesharing operator does not retain information on casual users after billing for their usage is complete. As of the 2012 season, casual users accounted for 85.5 percent of all bikesharing users (Shaheen S. , Martin, Chan, Cohen, & Pogodzinski, 2014).
• A 2012 survey of 20 U.S. public bikesharing programs found the average cost for a daily pass was $7.77, and all the programs offered the first 30 minutes of riding free (Shaheen S. , Martin, Chan, Cohen, & Pogodzinski, 2014).
Car Rental
• This is a non-membership-based service or company that rents cars or light trucks typically by the day or week. Traditional rental car services include storefronts requiring an in-person transaction with a rental car attendant. However, rental cars are increasingly employing “virtual storefronts,” allowing unattended vehicle access similar to carsharing.
• Historically, rental cars have focused on three different service models: 1) airport-based rental services located at air terminals (e.g., Hertz, Avis, National, and others); 2) neighborhood-based rental services (e.g., Enterprise); and 3) truck-based rental services (e.g., U-Haul, Ryder, and Penske).
• Car rentals are generally priced on a daily or weekly basis, often with differing rate structures for leisure and commercial use. In addition to base rental rates, most car rental companies offer ancillary and a la carte charges for a variety of products and services, such as car seat and GPS rentals and increased insurance coverage.

Shared Mobility Primer| 17
Carpooling
• This is a formal or informal arrangement wherecommuters share a vehicle for trips from eithera common origin, destination, or both, reducingthe number of vehicles on the road. Over theyears, carpooling has expanded to include anumber of other forms. Casual carpooling or“slugging” is a term used to describe informalcarpooling among strangers, which has oftenbeen referred to as a hybrid between commutercarpooling and hitchhiking. With slugging,passengers generally line up in “slug lines” andare picked up by unfamiliar drivers who arecommonly motivated to pick up passengers totake advantage of high-occupancy vehicle(HOV) lanes, lower tolls, and similar benefits.
• In addition, the growth of the Internet andmobile technology has enabled onlineridesharing marketplaces, such as CarmaCarpooling, where users can arrange ad hocrides typically on-demand or with minimaladvance notice through a personal mobiledevice. Carpooling can include a smalldonation to the driver to reimburse costs (e.g.,gas, tolls, parking), but it cannot result infinancial gain without bringing about insuranceand other regulatory challenges (Chan &Shaheen, 2011).
• Many public agencies distinguish carpoolingfrom for-hire service models by permittingcarpool passengers to reimburse carpooldrivers up to the Internal Revenue Service(IRS) standard mileage rate. In 2015, the IRSstandard mileage rate was $0.57 per mile forbusiness purposes, which is often used as ametric for suggesting carpooling cost sharingcaps. Because the driver is not making a wage,carpool drivers are not required to carrycommercial insurance coverage.
Shared Mobility Primer| 18
For-Hire Service Models
For-hire service models include pedicabs (a for-hire tricycle with a passenger compartment), ridesourcing, taxis, limousines, or liveries that carry passengers for a fare (either predetermined by distance or time traveled or dynamically priced based on a meter or similar technology). The fundamental basis of for-hire vehicle services involves a
passenger hiring a driver for either a one-way or a roundtrip ride. For-hire vehicle services can be pre-arranged through a reservation or booked on-demand through street-hail, phone dispatch, or e-Hail using the Internet or a smartphone application. See below for a description of these models.
Courier Network Services (CNS)
• CNS (also referred to as flexible goodsdelivery) provide for-hire delivery services forcompensation using an online-enabledapplication or platform (such as a website orsmartphone app) to connect delivery driversusing their personal vehicles with freight. Theseservices can include: 1) P2P delivery servicesand 2) paired on-demand passenger ride andcourier services.
• For example, Postmates and Instacart are twoP2P delivery services. Postmates couriersoperate on bikes, scooters, or cars deliveringgroceries, takeout, or goods from anyrestaurant or store in a city. Postmates chargesa delivery fee in addition to a 9 percent servicefee based on the cost of the goods beingdelivered. Instacart offers a similar service, butit is limited to grocery delivery and charges adelivery fee of between $4 and $10, dependingon the time given to complete the delivery.
Pedicabs
• A pedicab is a for-hire service with a peddlerthat transports passengers on a cyclecontaining three or more wheels with apassenger compartment.
• Pedicab pricing can vary widely based on thepricing model and market served. For example,New York City Pedicab Company chargesbetween $3 and $7, per minute, per pedicab(New York City Pedicab Company, 2015). InCharleston, Bike Taxi charges $5 per personper every 10 minutes (Bike Taxi, 2015).
Shared Mobility Primer| 19
Pedicabs
Ridesourcing
• Ridesourcing services launched in SanFrancisco, CA, in the summer of 2012 andhave rapidly spread across the United Statesand globe since then, meeting both support andresistance. They provide prearranged and on-demand transportation services forcompensation, connecting drivers of personalvehicles with passengers. Smartphone mobileapplications are used for booking, ratings(drivers and passengers), and electronicpayment.
• In the San Francisco Bay area, uberX charges$3.20 as a base fare (including a “Safe Ridesfee”), $0.26 per minute, and $1.30 per mileduring non-surge times. In the same area, Lyftcharges a base fare of $3.80 (including a “Trustand Safety fee”), $0.27 per minute, and $1.35per mile. The prices mentioned are during non-peak times; prices usually go up during periodsof high demand to incentivize more drivers totake ride requests (surge pricing).
• Recently, ridesourcing companies havereleased new apps that enable riders to shareand split the costs of a fare (or what we call“ridesplitting”). Lyft Line and uberPOOL(launched [as beta] in August 2014) attempt togroup passengers with coinciding routes intocarpools. Recently, UberPOOL has beentesting “Smart Routes,” where users can get adiscounted fare starting at $1 off the normalUberPOOL price in return for walking to a majorarterial street, allowing drivers to make fewerturns and complete ride requests faster (deLooper, 2015). Furthermore, in November2014, Lyft released Driver Destination, whichenables drivers to pick up passengers alongtheir personal trip routes, for instance, whenthey are traveling to and from work. Thisproduct can facilitate more carpooling, highervehicle occupancies, and reduced travel costsand provide first-mile and last-mile connectivityto public transit along those routes.
Shared Mobility Primer| 20
Taxis
• This is a type of for-hire vehicle service with a driver used by a single passenger or multiple passengers. Taxi services may be either pre-arranged or on-demand. Taxis can be reserved or dispatched through street hailing, a phone operator, or an “e-Hail” Internet or phone application maintained either by the taxi company or a third-party provider.
• Since late-2014, there has been a rise in the application of e-Hail services in taxi fleets, particularly in major metropolitan areas using predominantly third-party dispatch apps, such as Flywheel and iTaxi. Increasingly, taxi and limousine regulatory agencies are developing e-Hail pilot programs and mandating e-Hail services.
• In late 2012, the New York City Taxi and Limousine Commission approved an e-Hail pilot program permitting app developers to test their mobile taxi booking, dispatch, and payment systems in the city. In Washington, DC, the DC Taxicab Commission has mandated that all district taxicabs use the Universal DC TaxiApp. In Los Angeles, the Board of Taxicab Commissioners approved a mandate that required that the city’s taxis use e-Hail mobile apps by August 20, 2015 or pay a $200 daily fine. Similar policies are under consideration in New York and Chicago.
• Taxi fares can vary depending on local regulations and whether cabs can negotiate a rate, use a meter, or both. Many taxi authorities employ a metered fare, which typically includes an initial charge (generally $1 to $5) and a per mile or time rate (e.g., $0.50 per mile or $0.50 per minute when the vehicle is stopped). Local surcharges and fees may apply or be passed on to the passenger if permitted by the taxi authority, such as tolls and local fees (e.g., New York’s Taxi and Limousine Commission’s $0.30 per ride Taxi Improvement Surcharge used to help fund wheelchair-accessible taxicabs).
Limousines and Liveries
• This is a limousine or luxury sedan offering pre-arranged transportation services driven by a for-hire driver or chauffeur.
• Similar to other for-hire vehicle service models, pricing for limousines and liveries can also vary widely. Generally, in most markets, these services are charged by the hour, starting around $50 per hour (and up). Additional service charges may apply.
Shared Mobility Primer| 21
Mass Transit Services
Mass transit systems include public transportation and alternative transit services. A description of these services is provided below.
Public Transportation
• Public transportation includes any mass transportation vehicle that charges set fares, operates on fixedroutes, and is available to the public. Common public transportation systems include buses, subways,ferries, light and heavy rail, and high speed rail.
Alternative Transit Services
• Alternative transit services comprise a broadcategory encompassing shuttles (sharedvehicles that connect passengers to publictransit or employment centers), paratransit, andprivate sector transit solutions commonlyreferred to as microtransit. Shuttles can includeclassic first-and-last-mile connections betweenpublic transit and employment centers as wellas high-tech company shuttles (often, but notnecessarily, free to company employees andoffering WiFi connection).
• Many alternative transit services can includefixed route or flexible route services, as well asfixed schedules or on-demand service. Theseservices can include free shuttles (generallysubsidized by transportation demandmanagement agencies or private employers)and paid services, such as microtransit costs,which typically range between $3 and $7 perride.
• In its most agile form (flexible routing,scheduling, or both), microtransit andparatransit can be bundled under the category“flexible transit services.” Flexible transitservices include one or more of the followingcharacteristics: 1) route deviation (vehicles candeviate within a zone to serve demand-responsive requests); 2) point deviation(vehicles providing demand-responsive serviceserve a limited number of stops without a fixedroute between spots); 3) demand-responsiveconnections (vehicles operate in a demand-responsive geographic zone with one or morefixed-route connections); 4) request stops(passengers can request unscheduled stopsalong a predefined route); 5) flexible-routesegments (demand-responsive service isavailable within segments of a fixed route); and6) zone route (vehicles operate in a demand-responsive mode along a route corridor withdeparture and arrival times at one or more endpoints) (Koffman, 2004).
Shared Mobility Primer| 22
REFERENCES
Bike Taxi. (2015, December 7). Retrieved from Bike Taxi: http://www.biketaxi.net/
Chan, N., & Shaheen, S. (2011). Ridesharing in North America: Past, Present, and Future. Transport Reviews, 1-20.
de Looper, C. (2015, August 24). Uber Testing Bus-Like ‘Smart Routes. Retrieved from Tech Times: http://www.techtimes.com/articles/79084/20150824/uber-testing-bus-smart-routes.htm
Koffman, D. (2004). TCRP Synthesis 53: Operational Experiences with Flexible Transit Services. Washington, DC: Transportation Research Board of the National Academies
McClatchy Tribune Services. (2013, September 10). Part-time job growth rapidly outpacing full-time opportunities, statistics show. Retrieved from The Times-Picayune: http://www.nola.com/business/index.ssf/2013/09/part-time_job_growth_rapidly_o.html
NYC Pedicab Co. (2016, March 7). Central Park Pedicab Tours FAQs. Retrieved from NYC Pedicab Co.: http://www.centralparkpedicabs.com/p/faqs.html
Packaged Facts. (2015, September 21). Packaged Facts: 30% of U.S. Consumers Order Online for Same Day Delivery. Retrieved from PRN Newswire: http://www.prnewswire.com/news-releases/packaged-facts-30-of-us-consumers-order-online-for-same-day-delivery-300145756.html
Pew Research Center. (2014, October). Mobile Technology Fact Sheet. Retrieved from Pew Research Center: http://www.pewinternet.org/fact-sheets/mobile-technology-fact-sheet/
Shaheen, S. A., Cohen, A. P., & Roberts, J. D. (2006). Carsharing in North America: Market Growth, Current Developments, and Future Potential. In Transportation Research Record: Journal of the Transportation Research Board (pp. 116-124). Washington, D.C.: Transportation Research Board of the National Academies.
Shaheen, S., Martin, E., Chan, N., Cohen, A., & Pogodzinski, M. (2014). Public Bikesharing in North America During A Period of Rapid Expansion: Understanding Business Models, Industry Trends and User Impacts. San Jose: Mineta Transportation Institute.
Staff, B. (2015, April 20). Birmingham, Alabama, planning e-bike share system. Retrieved from Bicycle Retailer: http://www.bicycleretailer.com/north-america/2015/04/20/birmingham-alabama-planning-e-bike-share-system#.VdTpWJedpn0
Transportation Research Board. (2015). Between Public and Private Mobility Examining the Rise of Technology-Enabled Transportation Services. Retrieved from the Transportation Research Board: http://onlinepubs.trb.org/onlinepubs/sr/sr319.pdf
Shared Mobility Primer| 23
CHAPTER 3. SHARED MOBILITY IMPACTS: CURRENT UNDERSTANDING
An increasing body of empirical evidence indicates that shared modes can provide numerous transportation, land use, environmental, and social benefits. While impact studies on roundtrip carsharing and public bikesharing are fairly extensive, the impacts of newer service models and emerging modes, such as one-way carsharing, P2P models, scooter sharing, on-demand ride services (such as ridesharing and ridesourcing), and CNS are less studied and understood. This chapter explores the current understanding of the impacts associated with several shared modes.
CARSHARING
Table 1 in the appendix to this primer summarizes more than a dozen North American roundtrip carsharing studies. These include both third-party and
operator-led evaluations. One of the most notable effects of roundtrip neighborhood carsharing is reduced vehicle ownership due to either sales or deferred purchases. Most of this shift in auto ownership is from single households becoming carless, followed by two-car households becoming one-car households. Numerous studies have examined the effect of carsharing on overall vehicle numbers and show reductions ranging from 4.6 to 20 personal vehicles per carsharing vehicle. Differences can be attributed to a range of methodological approaches (e.g., postponed purchases and sold vehicles).
The most current studies and member survey results released by U.S. and Canadian carsharing organizations show that up to 32 percent of carsharing members sold their personal vehicles, and between 25 percent and 71 percent of members avoided an auto purchase because of carsharing. A 2008 research study documented that 25 percent of members sold a vehicle and 25 percent of members postponed a vehicle purchase due to carsharing across a sample of approximately 9,500 participants (Martin & Shaheen, 2010). Of the participants, more than 80 percent had a bachelor’s degree and 54 percent had incomes exceeding $50,000 USD. Forty percent of respondents were between 18 and 30 years old, and 55 percent were between 31 and 60. See the Appendix A, Table 2 for a more comprehensive breakdown of carsharing member demographics. Variation can be attributed to a stated-intention bias, location-specific differences, and business model. Carsharing has also been shown to save its members an estimated $154 to $435 annually for U.S. members and $392 to $492 CAD for Canadian members.
Source: Thinkstock Photo
Shared Mobility Primer| 24
Additionally, reductions in auto ownership are commonly associated with increased public transit ridership, walking, and bicycling modal shifts, as well as reduced parking demand and VMT or vehicle kilometers traveled (VKT). Twelve percent to 54 percent of carsharing participants in North America walk more often. Studies differ on whether or not carsharing increases or decreases public transit ridership. Studies of six individual locations across North American found that between 13.5 percent and 54 percent of carsharing participants take public transit more frequently. However, one study of approximately 9,500 participants across North America found a slight shift away from public transit ridership (Martin & Shaheen, 2010). (See Appendix A, Table 3.)
In the United States, the average carsharing member’s VMT/VKT is reduced by 7.6 percent to 79.8 percent. The large variation is likely attributable to differences in location, member use, and survey design. Martin and Shaheen (2010) found that VMT/VKT is reduced by 27 percent (observed impact, based on vehicles sold) to 43 percent (full impact, based on vehicles sold and postponed purchases combined) due to the before-and-after mean driving distance. Along with reduced VMT/VKT and vehicle ownership, low-emission fleets also contribute to lower greenhouse gas (GHG) emissions. This same study found a mean observed impact decline of 0.58 metric tons of GHG per year per household (impacts due to vehicles sold) and a full impact reduction of 0.84 metric tons of GHG per year per household (impacts due to sold and postponed vehicle purchases) or an average reduction of GHG emissions of 34 percent to 41 percent per year per household (Martin & Shaheen, 2010). Several global carsharing programs offer additional GHG reductions through partnerships with carbon-offset companies. Moreover, many members report an increase in environmental awareness after joining carsharing. Carsharing can also provide other beneficial societal impacts, such as the increased mobility afforded by one-way service models and access to vehicles for college students and low-income households.
Carsharing succeeds because it either provides consumers with better mobility or sufficient mobility at a reduced cost. The latter effect drives most of the emission and fuel-use reductions with travel substitutions replacing private vehicle use. Carsharing fundamentally changes the cost structure of driving from a fixed cost to a variable cost. Carsharing involves substituting “driving with driving” (i.e., a private auto with fixed costs versus a shared vehicle with variable costs), the magnitude of these changes must be measured to assess the fundamental carsharing impact. This is challenging given that we do not know who will join carsharing until after they have enrolled. Among the carsharing member population, we need to know: 1) how individuals traveled before and the modal behaviors they changed due to carsharing and 2) how individuals would have traveled in the absence of carsharing (e.g., postponed vehicle purchase). These effects are nearly impossible to measure without some form of member survey, as the best way to understand these shifts is to identify what happened.
From survey stated response data, researchers can generate an understanding of an individual’s travel lifestyle before enrollment, including miles/kilometers driven in personal vehicles, which is often challenging to gauge. In addition, the shifts due to carsharing are different for different people. Many individuals will invariably drive marginally more, and many do so as a result of carsharing. Others will drive substantially less, as they alter their engagement with the private auto to one of necessity rather

Shared Mobility Primer| 25
than convenience. Measuring this effect through surveys is necessary because only the member can truly assess how the carsharing system has changed his/her life. For some, the system’s impact is inconsequential, and observed behavioral changes are the result of other unseen dynamics of which carsharing is merely a witness. For others, the system plays a central role in facilitating a lifestyle change that reduces aggregate fuel consumption and emissions. Although imperfect, the member survey is a key instrument for obtaining a before-and-after measure of carsharing impacts.
It is important to note that the application of data from national and regional travel surveys to the evaluation of shared mobility impacts is currently less feasible for a number of reasons. First, these surveys are generally snapshots of activity over large areas that may or may not have a robust range of shared mobility services. They generally lack longitudinal structure, which spans the period before and after a person begins using a system. Second, the subsample of people using shared mobility services within large surveys, such as the National Household Travel Survey (NHTS), is small, and the time between such surveys can be largespanning years. People are rarely re-sampled in subsequent surveys. Because of these factors, use of national and regional surveys to evaluate the household-level change in behavior is limited.
Finally, activity data can only tell us how an individual used a particular shared mode in contrast to their total transportation behavior. For this reason, despite advances in technology that improve approaches to travel behavior measurement, surveys play (and likely will continue to play) a fundamental role in assessing causes of change and providing critical inputs to its measurement. A similar discussion is relevant to impact analyses of the other shared modes discussed in this primer.
BIKESHARING
Like carsharing, bikesharing offers a number of environmental, social, and transportation-related benefits. It provides a low-carbon option for the first-and-last mile of a short-distance trip, providing a link for trips between home and public transit and/or transit stations and the workplace that are too far to walk, as well as a many-mile alternative.
Potential bikesharing benefits include: 1) increased mobility; 2) cost savings from modal shifts; 3) low implementation and operational costs (e.g., in contrast to shuttle services); 4) reduced traffic congestion; 5) reduced fuel use; 6) increased use of public transit and alternative modes (e.g., rail, buses, taxis, carsharing, ridesharing); 7) increased health benefits; 8) greater environmental awareness; and 9) economic development. The ultimate goal of public bikesharing is to expand and integrate cycling into transportation systems so that it can more readily become a daily transportation mode (for commuting, personal trips, and recreation).
Although before-and-after studies documenting public bikesharing benefits are limited, a few programs have conducted user surveys to record program impacts. Table 4 in the Appendix presents a summary of these surveys, showing trips, distance traveled, and estimated carbon dioxide (CO2) reductions. The emission-reduction estimates vary substantially across studies due to different assumptions about user
Shared Mobility Primer| 26
behavior, trip distribution, and trip substitution. Key assumptions that influence CO2 reduction estimates pertain to public bikesharing trips that displace automobile trips.
Although casual users (typically bikesharing users with passes for seven days or less) account for the majority of bikesharing riders, very limited studies of casual users have been conducted. Many bikesharing programs do not collect and retain information on casual users after the billing process is complete. As such, collecting demographic data and understanding casual user behavior remains a key challenge. One study conducted by Virginia Tech urban planning students documented key demographics of Capital Bikeshare casual users. Between September and October 2011, they completed an intercept survey at five Capital Bikeshare kiosks. The survey found that Capital Bikeshare casual user demographics closely mirrored its annual membership, serving predominantly Caucasian riders (Borecki, et al., 2012). Seventy-eight percent of casual users and 80 percent of annual members were white, compared to just 34 percent of the district’s population in the Washington, DC 2010 census. Table 5 in Appendix A compares intercept survey data of Capital Bikeshare’s casual users with their annual membership and census data. The survey also found that women were more likely to be casual users—52 percent, compared to just 33 percent who were annual members. Age and educational attainment were fairly comparable between annual members and casual users surveyed (Borecki, et al., 2012).
In 2012, the Transportation Sustainability Research Center at the University of California, Berkeley completed a study of long-term (annual and seasonal) bikesharing members in four areas—Minneapolis-Saint Paul, Montreal, Toronto, and Washington, DC. This was followed in 2013 by a second study of annual and seasonal bikesharing members in five cities—Mexico City, Minneapolis-Saint Paul, Montreal, Salt Lake City, and Toronto (Shaheen, et al., 2014). These studies found that compared to the general population, bikesharing members tend to be wealthier, more educated, younger, more Caucasian, and more male. See Appendix A, Tables 6 and 7, which depict member demographics in the United States, Canada, and Mexico City.
At the most basic level, both studies found the availability of bikesharing increased the frequency in which a bicycle was used by annual, season, and 30-day members. Furthermore, the majority of users in Canada and Mexico use bikesharing at least one to three times per week. Across the cities, 50 percent of members also drive less frequently due to bikesharing (see Appendix A, Figure 1). The results of both studies show an interesting split across cities. Respondents in small/medium-sized cities were more likely to use bikesharing in conjunction with public transit. In larger cities, both studies showed that bikesharing caused respondents to ride public transportation less. Importantly, the patterns are not a reflection of the different countries involved in the studies. Rather, there is an emerging distinction of impact arising from the type of cities in which bikesharing is deployed (i.e., larger, dense cities versus smaller, less dense cities). For instance, users employ bikesharing more for commuting purposes in larger cities and more for recreational purposes in smaller cities.
Both Minneapolis-Saint Paul, MN and Salt Lake City, UT are smaller cities with more limited light rail in contrast to the denser networks in Montreal and Toronto. Mexico City is similarly dense.
Shared Mobility Primer| 27
Respondents in both Minneapolis-Saint Paul and Salt Lake City did not experience any change in bus use. In total, 67 percent of respondents in Minneapolis-Saint Paul and 87 percent of respondents in Salt Lake City indicated that bikesharing had no impact on their bus use. In terms of reduced bus use, 18 percent of respondents in Minneapolis-Saint Paul reported using the bus less often, while only 4 percent in Salt Lake City reported a similar change. In Minneapolis-Saint Paul, 16 percent noted increasing bus use, and 8 percent reported increasing bus use in Salt Lake City. Salt Lake City is the only city to report a net increase in bus use as a result of bikesharing. In Minneapolis-Saint Paul and Salt Lake City, bikesharing is reported to have increased rail use. In Montreal and Toronto, by contrast, 7 percent to 8 percent increased rail use, while 50 percent to 60 percent decreased rail use. In Mexico City, more people are decreasing rail use (17 percent) than increasing it (13 percent), but the difference is less. The primary reasons for this shift away from rail in Montreal, Toronto, and Mexico City are that bikesharing enables users to get to their destination more quickly and can be less expensive. Twenty-five percent, 48 percent, and 28 percent of respondents in these respective cities reported using rail less because bikesharing offered a lower cost and quicker transportation alternative. Forty percent of Salt Lake City respondents stated they took the train less because bikesharing was faster, and 50 percent of Minneapolis-St. Paul respondents said they used bikesharing because they wanted exercise.
Finally, in addition to studies that have demonstrated reduced CO2 emissions and a modal shift toward bicycle use, evaluations indicate an increased public awareness of bikesharing as a viable transportation mode. A 2008 study found that 89 percent of Vélib’ bikesharing users said the program made it easier to travel through Paris (Vélib’, 2012). Fifty-nine percent of Nice Ride Minnesota bikesharing users said that they liked the convenience of bikesharing most about their program (SurveyGizmo, 2010). In 2011, Denver BCycle achieved a 30-percent increase in riders and a 97-percent increase in the number of rides taken over the previous year (Denver BCycle, 2011). These studies suggest that public bikesharing programs have a positive impact on bicycling as a transportation mode.
RIDESHARING
At present, there are few published studies on the impacts of ridesharing (carpooling and vanpooling). Empirical evidence indicates that ridesharing can provide transportation, infrastructure, and environmental benefits, although the exact magnitude of these impacts is not well understood. Individually, ridesharing participants benefit from shared travel costs, travel-time savings from high occupancy vehicle lanes, reduced commute stress, and often preferential parking and other incentives.
RIDESOURCING
Recent innovations in technology are enabling on-demand ridematching services and ridesourcing (also known as TNCs or ride-hailing) services where drivers and passengers can link-up using smartphone applications. In many cases, passengers can compensate drivers for fuel, parking, and other trip expenditures through these applications, including
Shared Mobility Primer| 28
the driver’s time with ridesourcing applications. Public policy continues to evolve as on-demand ride services, such as uberX and Lyft, gain popularity.
At present, there are few published studies on the impacts of on-demand ride services. A recent study of ridesourcing in the San Francisco Bay area found that survey respondents were generally younger than the overall population, although this may be influenced by the sampling method. Respondents were relatively well educated. Eighty-four percent of customers had a bachelor’s degree or higher, and survey respondents matched the income profile of San Franciscans fairly closely, with the exception that households making less than $30,000 were underrepresented as illustrated in Table 8 in Appendix A (Rayle et al., 2016).
The trip survey found that uberX provided the majority (53 percent) of rides, while other Uber services (black car, SUV) represented another 8 percent. Lyft provided 30 percent of trips, and the remainder were other services, which is consistent with anecdotal information on the market share of each service. Of all responses, 67 percent were social/leisure (bar, restaurant, concert, visit friends/family). Only 16 percent were work, 4 percent were to or from the airport, and 10 percent were to another destination (e.g., doctor’s appointment, volunteer). Forty-seven percent of trips began somewhere other than home or work (e.g., a restaurant, bar, gym), and 40 percent were home-based. Thirty-nine percent and 24 percent of survey respondents in the Bay Area stated they would have taken a taxi or a bus, respectively, if the uberX or Lyft were unavailable (see Table 9). Four percent of respondents named a specific public transit station as their origin or destination, and almost half (48 percent of trips) occurred on Friday or Saturday. Ridesourcing trips with a destination in San Francisco averaged 3.1 miles (4.9 km) in length compared to taxi trips averaging 3.7 miles (5.9 km). Finally, the study found that wait times tended to be substantially shorter than taxi hail and dispatch wait times. This study did not examine e-Hail taxi services, as they were not widely deployed at the time of the survey. There has been a dramatic rise in the city since then. As of October 2014, 80 percent of San Francisco taxis (1,450 taxis) were reportedly using the e-Hail app Flywheel, which brought taxi wait times closely in line with those of ridesourcing (Sachin Kansal, unpublished data). See Table 10 in Appendix A for more information on this comparison of ridesourcing and taxi trips travel times.
As noted earlier, the research on shared mobility impacts is somewhat limited and still evolving. Several modes have yet to be examined. Both emerging and existing services require further investigation, particularly at the city and regional level.
REFERENCES
Borecki, N., Buck, D., Chung, P., Happ, P., Kushner, N., Maher, T., Buehler, R. (2012). Virginia TechCapital Bikeshare Study. Blacksburg: Virginia Tech.
Denver BCycle. (2011). 2011 Season Results. https://denver.bcycle.com/docs/librariesprovider34/default-document-library/annual-reports/dbs-2011-annual-report.pdf?sfvrsn=2

Shared Mobility Primer| 29
Martin, E., & Shaheen, S. (2010). Greenhouse Gas Emission Impacts of Carsharing in North America. San Jose: Mineta Transportation Institute.
Rayle, L., Dai, D., Chan, N., Cervero, R., and Shaheen, S. (2016). “Just A Better Taxi? A Survey-Based Comparison of Taxis, Transit, and Ridesourcing Services in San Francisco,” Transport Policy, Volume 45, pp. 168-178.
Shaheen, S., Martin, E., Chan, N., Cohen, A., and Pogodzinski, M. (2014). Public Bikesharing in North America During A Period of Rapid Expansion: Understanding Business Models, Industry Trends and User Impacts. San Jose: Mineta Transportation Institute.
SurveyGizmo. (2010). Nice Ride Subscriber Survey: Survey Report. https://appv3.sgizmo.com/ reportsview/?key=102593-416326-6d13ea0276ea0822c9f59f4411b 6c779
Velib’. (2012, December 20). Un service qui plait plus que jamais!. Retrieved from JCDecaux: http://www.jcdecaux.com/fr/Presse/Communiques/2012/Ve-lib-un-service-qui-plai-t-plus-que-jamais-!
Shared Mobility Primer| 30
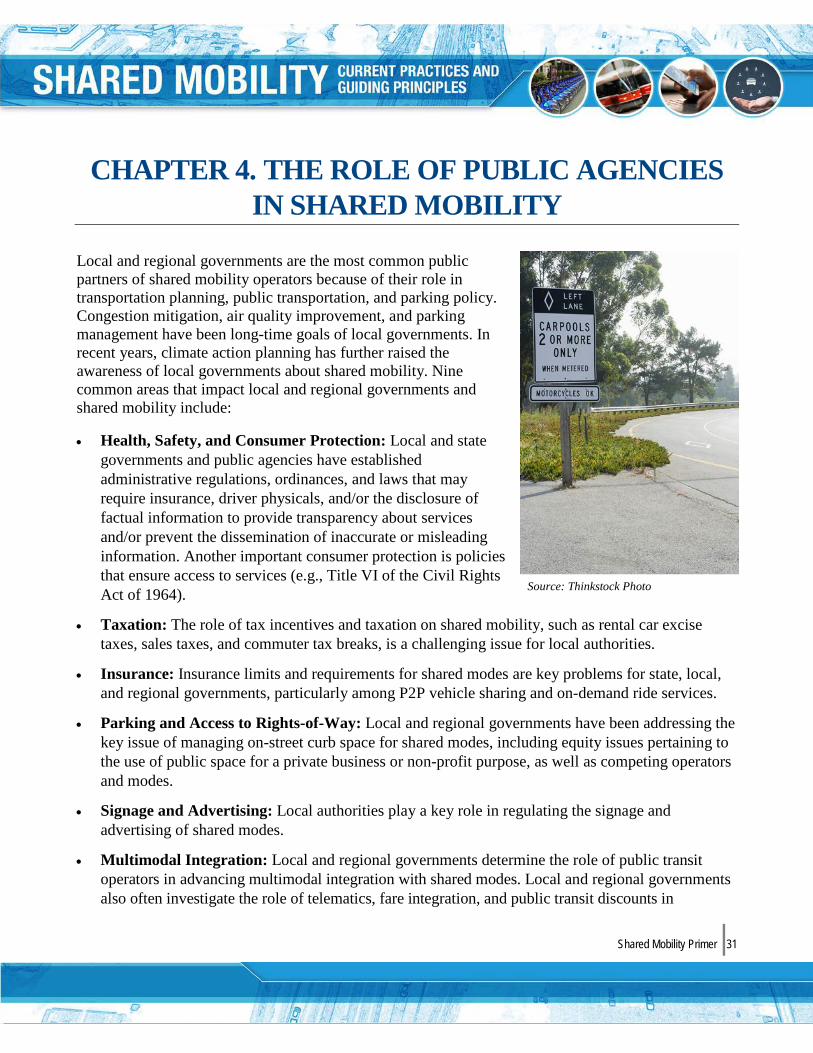
Shared Mobility Primer| 31
CHAPTER 4. THE ROLE OF PUBLIC AGENCIES IN SHARED MOBILITY
Local and regional governments are the most common public partners of shared mobility operators because of their role in transportation planning, public transportation, and parking policy. Congestion mitigation, air quality improvement, and parking management have been long-time goals of local governments. In recent years, climate action planning has further raised the awareness of local governments about shared mobility. Nine common areas that impact local and regional governments and shared mobility include:
• Health, Safety, and Consumer Protection: Local and state governments and public agencies have established administrative regulations, ordinances, and laws that may require insurance, driver physicals, and/or the disclosure of factual information to provide transparency about services and/or prevent the dissemination of inaccurate or misleading information. Another important consumer protection is policies that ensure access to services (e.g., Title VI of the Civil Rights Act of 1964).
• Taxation: The role of tax incentives and taxation on shared mobility, such as rental car excise taxes, sales taxes, and commuter tax breaks, is a challenging issue for local authorities.
• Insurance: Insurance limits and requirements for shared modes are key problems for state, local, and regional governments, particularly among P2P vehicle sharing and on-demand ride services.
• Parking and Access to Rights-of-Way: Local and regional governments have been addressing the key issue of managing on-street curb space for shared modes, including equity issues pertaining to the use of public space for a private business or non-profit purpose, as well as competing operators and modes.
• Signage and Advertising: Local authorities play a key role in regulating the signage and advertising of shared modes.
• Multimodal Integration: Local and regional governments determine the role of public transit operators in advancing multimodal integration with shared modes. Local and regional governments also often investigate the role of telematics, fare integration, and public transit discounts in
Source: Thinkstock Photo

Shared Mobility Primer| 32
mitigating obstacles, such as technological barriers, lack of integration within existing transportation systems, skepticism regarding multimodality, and age-dependent travel limitations.
• Planning Processes: Public agencies and local governments have multiple goals regarding incorporating shared mobility into municipal and regional planning processes, such as land use and transportation plans. These processes often require data to assist public agencies and local governments in planning and forecasting the impacts of shared mobility on public infrastructure.
• Data Sharing, Privacy, and Standardization: It is critical for local and regional governments to develop best practices that identify data standards and balance data sharing (open data) and privacy among individuals, companies, and public agencies.
• Accessibility and Equity Issues: Local governments and public agencies are impacted by reporting trends in shared mobility as they relate to accessibility, including how public agencies and shared mobility service providers define, measure, and address equity.
Key opportunities and challenges for government include increased competition among operators and modes, determining the legality of new service models, defining innovative service models, and developing policies that address these issues. The following sections provide examples of supportive and unsupportive policies, success stories, opportunities, and challenges that highlight the role of government in shared mobility.
HEALTH, SAFETY, AND CONSUMER PROTECTION
Public agencies and local and state governments have established recommended guidelines, administrative regulations, ordinances, and laws that both impact and regulate shared mobility service providers. Health and safety includes laws and ordinances meant to protect the safety and welfare of shared mobility users. In addition to health and safety laws, consumer protection laws defend consumer interests and ensure fair trade practices, open competition, and the accuracy of information in the marketplace. Broadly speaking, the purpose of consumer protection laws is to prevent fraudulent or unfair business practices. Some key examples of health, safety, and consumer protection laws impacting shared mobility include the following.
• Helmet Laws requiring bikesharing users to wear helmets while riding impact shared mobility. For example, King County Washington’s Board of Health maintains a bicycle helmet law that requires
Source: Susan Shaheen
Figure 3: Helmet Kiosk for the Pronto Cycle Share System in
Seattle
Shared Mobility Primer| 33
all cyclists regardless of age to wear a helmet. The law has been in effect since August 2003 and includes the City of Seattle. Pronto Cycle Share in Seattle has maintained compliance with the helmet law by allowing users to pick up helmets from boxes adjacent to kiosks. The provision of helmets that can be borrowed on the honor system was believed to be operationally easier to implement than a helmet dispensing mechanism.
• Insurance Laws mandating minimum insurance levels for P2P carsharing impact shared mobility. This can include requirements for P2P vehicle operators to carry and provide insurance for drivers, as well as protections for P2P vehicle owners prohibiting the loss of personal vehicle coverage, if they sub-lease their vehicle for P2P rental use. For example, in June 2011, the Oregon legislature passed personal vehicle sharing legislation known as HB3149, which requires that a vehicle owner’s insurance policy include personal injury protection and uninsured motorist coverage (Auto Rental News, 2012). Additionally, the law requires that a P2P carsharing program provide insurance coverage for each of the vehicles in its fleets. The law states that if a vehicle owner is named as a defendant in a civil action when the owner is not driving the vehicle, P2P carsharing programs “shall have the duty to defend and indemnify the vehicle’s registered owner” (Auto Rental News, 2012). Finally, HB3149 prohibits the use of commercial vehicles in a personal vehicle sharing program. Other laws may protect shared mobility operators from vicarious liability (i.e., legal doctrine that imposes liability upon one person for the actions of another). Shared mobility operators, namely carsharing providers, have successfully argued that carsharing operators should be exempt from vicarious liability under the Graves Amendment for protections that have been traditionally afforded to car rental companies.
• For-Hire Driver Laws requiring driver physicals and minimum insurance for taxis, liveries, and ridesourcing impact shared mobility services. For example, many public utilities, taxi, and limousine commissions have regulated the business practices of for-hire vehicle services using permits, medallions, certificates, and operator licenses. Historically, these for-hire vehicle consumer protection laws have sought to protect public safety, regulate fares, regulate the number and service quality of operators, and ensure disabled access. In recent years, a number of public agencies have implemented ordinances and laws for ridesourcing. For example, the City of Austin recently ratified a municipal ordinance regulating ridesourcing, which includes a number of provisions such as establishing minimum insurance requirements, requiring driver training, and limiting the number of consecutive hours a driver can work, and prohibitions against refusing to pick up passengers or charging more for disabled passengers (City of Austin, 2014). See below for more details on the City of Austin’s TNC Ordinance.

Shared Mobility Primer| 34
Austin’s Comprehensive Transportation Network Companies Ordinance
In October 2014, the City Council in Austin, Texas approved one of the most comprehensive ordinances defining and regulating TNCs as “an organization whether a corporation, partnership, sole proprietor, or other form, which provides on-demand transportation services for compensation using an online-enabled application (app) or platform to connect passengers with drivers.” The municipal ordinance requires that TNCs enter into an agreement with the city that includes the following provisions:
Insurance Provisions: • Provide primary commercial automobile liability insurance coverage with a minimum combined single
limit of $1 million for each occurrence of bodily injury and property damage for accidents involving TNC vehicles in transit (defined as the time beginning when a driver accepts a trip and ending when a rider departs the vehicle). The insurance must name the City of Austin as an additional insured;
• During the time period when a TNC driver has logged into an app and indicated their availability to drive, the TNC will provide insurance coverage of at least $30,000 for death and personal injury per a person; $60,000 for death or personal injury per an incident; and $25,000 for property damage. This insurance can be provided by either the driver, the company, or any combination of both;
• TNCs are required to submit data to the city on insurance claims and the effectiveness of coverage limits annually; and
• TNCs must notify their drivers that there may be a gap in coverage beginning when a driver logs into the app.
Public Safety Provisions: • TNCs must establish a driver’s training program and implement a zero tolerance policy for drug and
alcohol use among drivers; • The TNC app must display a picture of the driver, a description or picture of the vehicle, and license
plate number; • TNCs must conduct background checks of drivers. In December 2015, Austin’s City Council amended
its ordinance to require fingerprinting as part of its background checks. The fingerprinting establishes four benchmarks for TNCs to achieve compliance by February 2017;
• Drivers must be at least 21 years of age; and • Drivers are prohibited from driving more than 12 hours in any 24-hour period, may not accept any rides
outside of the online application, and must make reasonable accommodations for service animals.
Consumer Protections: • Passengers must receive an estimated trip cost and a receipt with the total amount paid after the
completion of a trip; • Passengers must be able to consent to dynamic pricing on apps; and • Dynamic pricing is prohibited during periods of market disruptions.
Access Provisions:
Shared Mobility Primer| 35
Austin’s Comprehensive Transportation Network Companies Ordinance
• Drivers are prohibited from refusing to accept disabled passengers or charging higher fees of disabled passengers; and
• TNCs must conduct outreach with low-income communities and organizations with ADA compliant vehicles.
Update: In May 2016, Austin residents will be voting on an updated TNC ordinance by referendum. If approved, the referendum would repeal the fingerprinting requirements approved by Austin’s city council in December 2015.
Source: City of Austin, 2014; Harrington, 2016
• Pricing Regulations mandating that consumers receive an estimated service cost and receipt for services also impact shared mobility. Regulations can include the payment method (e.g., acceptance of credit/debit cards); disclosures related to special discounts and surge pricing; and in some cases, prohibitions against special types of pricing (e.g., surge pricing during market disruptions like natural disasters).
• Access Laws protecting access for special needs populations and protected classes impacts shared mobility services. This can include provisions mandating the Americans with Disabilities Act (ADA) access and prohibitions against discrimination against protected classes including race, color, religion, national origin, age, sex, pregnancy, citizenship, familial status, disability status, and veteran status. Many of these laws not only prohibit discrimination against the end user but also shared mobility employees.
TAXATION
Unclear definitions and service models among shared mobility services, such as carsharing, ridesourcing, taxis, and rental cars, have led to confusion among state and local governments about taxing these mobility services. Rental car taxes have been particularly popular among politicians because the taxes were believed to target visitors, not voters. Taxes commonly applied to shared mobility services include rental car excise taxes, sales taxes, convention center surcharges, and transaction fees. As of 2009, there were a total of 115 car rental excise taxes that had been enacted in 43 states and the District of Columbia, many of which were being applied to carsharing (Bieszczat, 2011).
A DePaul University study by Bieszczat et al. (2011) compared carsharing reservation prices in 12 of 13 major metropolitan markets with 50 or more carsharing vehicles to assess the overall impact of carsharing taxes. The study documented the extensive impact of carsharing taxes on end-user pricing and found that carsharing is being taxed between 1.7 to 2.2 times the rate of general goods and services. Using population-based weighted averages, Bieszczat et al. found that one-hour carsharing
Shared Mobility Primer| 36
reservations were taxed at 17.93 percent and 24-hour reservations were taxed at 14.08 percent compared to 8.06 percent for general goods and services, at the time of the study. In one example, carsharing taxes in Hartford, CT increased the end-user price by 21.5 percent, compared to only 10.5 percent for a 24-hour reservation. For the first hour, the original $8 user fee increased to $9.72 after $0.48 was added for the 6-percent state sales tax, $0.24 was added for a 3-percent state motor vehicle rental surcharge, and a $1-per-day state motor vehicle rental surcharge was included. Table 1, from Bieszczat et al., presents the total and component costs of a one-hour carsharing reservation in their sampled locations that applied the highest tax rates to carsharing.

Shared Mobility Primer| 37
Table 1. Total and Component Costs of Highly Taxed One-Hour Carsharing Reservations
City Total Cost
Base Rate
Tax Effective Tax Rate
Applicable Taxes
Hoboken, New Jersey
$14.63 $9.00 $5.63 62.56% 7% sales tax (state)
$5 fee per auto rental (state)
Pittsburgh, Pennsylvania
$14.09 $9.25 $4.84 52.32% 7% sales tax (state & county) 2% auto rental tax (state)
$2 fee per auto rental (county)
$2 fee per auto rental (state)
Tempe, Arizona $11.40 $8.00 $3.40 42.50% 9.3% sales tax on rentals (state, county & city) 3.25% rental surcharge (county), minimum $2.50
Philadelphia, Pennsylvania
$10.14 $7.25 $2.89 39.86% 8% sales tax (state & county) 2% vehicle rental tax (state) 2% vehicle rental tax (county)
$2 fee per day per rental (state)
Miami, Florida $9.65 $7.00 $2.65 37.86% 7% sales tax (state & county)
$2 per day auto rental surcharge (state)
Albuquerque, New Mexico
$10.96 $8.00 $2.96 37% 7% sales tax (state, county & city) 5% auto rental tax (state)
$2 per day auto rental surcharge (state)
Colorado Springs, Colorado
$10.83 $8.00 $2.83 35.38% 7.4% sales tax (state, county & city) 3% auto rental tax (county & city)
$2 per day auto rental fee (state)
Fayetteville, Arkansas
$9.80 $8.00 $1.80 22.5% 9.25% sales tax (state, county & city) 10% auto rental tax (state)
3.25% auto rental tax (local)
Hartford, Connecticut
$9.72 $8.00 $1.73 21.5% 6% sales tax (state)
3% auto rental tax (state)
$1 per day tourism surcharge (state)
New York, New York
$13.19 $11.00 $2.19 19.91% 8.875% sales tax (state, city) 6% auto rental tax (state)
5% auto rental tax (metro commuter district)
Seattle, Washington
$12.52 $10.50 $2.02 19.24% 9.5% sales tax (state, county, local) 9.7% auto rental tax (state/local)
Source: Reprinted from Bieszczat et al., 2011
Below are a few examples of supportive tax policies in shared mobility. The figure excludes a former policy in Washington State, which exempted carsharing from rental and excise taxes (Bieszczat, 2011). In 2007, this exemption was repealed, and the state’s Department of Revenue imposed a 9.7-percent car rental tax on carsharing. Despite legislative efforts at developing a definition for carsharing to

Shared Mobility Primer| 38
exempt it from rental car taxes, the proposed bill failed to gain traction (Bieszczat, 2011). Similar legislative efforts in Illinois that attempted to exempt carsharing from the state’s rental car taxes also failed to achieve the votes required to advance from committee to the legislative floor (Bieszczat, 2011).
Examples of Supportive Tax Policies in Shared Mobility
Supportive Carsharing Tax Policies:
• In 1999, Multnomah County was one of the first jurisdictions to amend its code to exempt carsharing from a 17-percent car rental tax.
• In 2005, Boston revised its policy to apply a $10 convention center financing surcharge on the first carsharing reservation per an annual membership. Previously, the city had imposed the $10 surcharge on every vehicle rental transaction.
• In 2005, Chicago eliminated the eight percent “Personal Property Lease Transaction Tax” on carsharing rentals less than 24 hours in duration. The city defined carsharing as a membership-based organization providing self-service access to vehicles with inclusive insurance and no written agreement required per rental period.
Source: Bieszczat, 2011
Additionally, taxation of ridesourcing has emerged as a key issue in numerous international jurisdictions. Services, such as Uber, have been the target of tax probes in Belgium and India, for example, because these users pay through a Netherlands-based shell corporation, Uber BV, and avoid paying local taxes (Phys.org, 2014). In March 2015, India’s Finance Ministry amended its 2015 to 2016 tax rules establishing an “aggregator model” characterization to tax e-commerce services, such as Uber and Trip Advisor (Srivastava & Surabhi, 2015). Domestically, taxation policies for taxi services, limousines, and ridesourcing are not clearly defined. Questions over whether or not drivers should declare and pay taxes, how much, and what taxes to pay have not been clearly answered by local and state jurisdictions. In Georgia, proposed legislation would have established a legislative study committee to look at methods for taxing for-hire vehicle services; however, this failed to obtain the required number of votes for approval. At the federal level, drivers are required to report wages from W2s (if employees), from 1099s (if independent contractors), and all other income as miscellaneous income as part of a driver’s federal income taxes.
INSURANCE
This section discusses insurance for carsharing, P2P carsharing, bikesharing, ridesharing, and for-hire vehicle services.
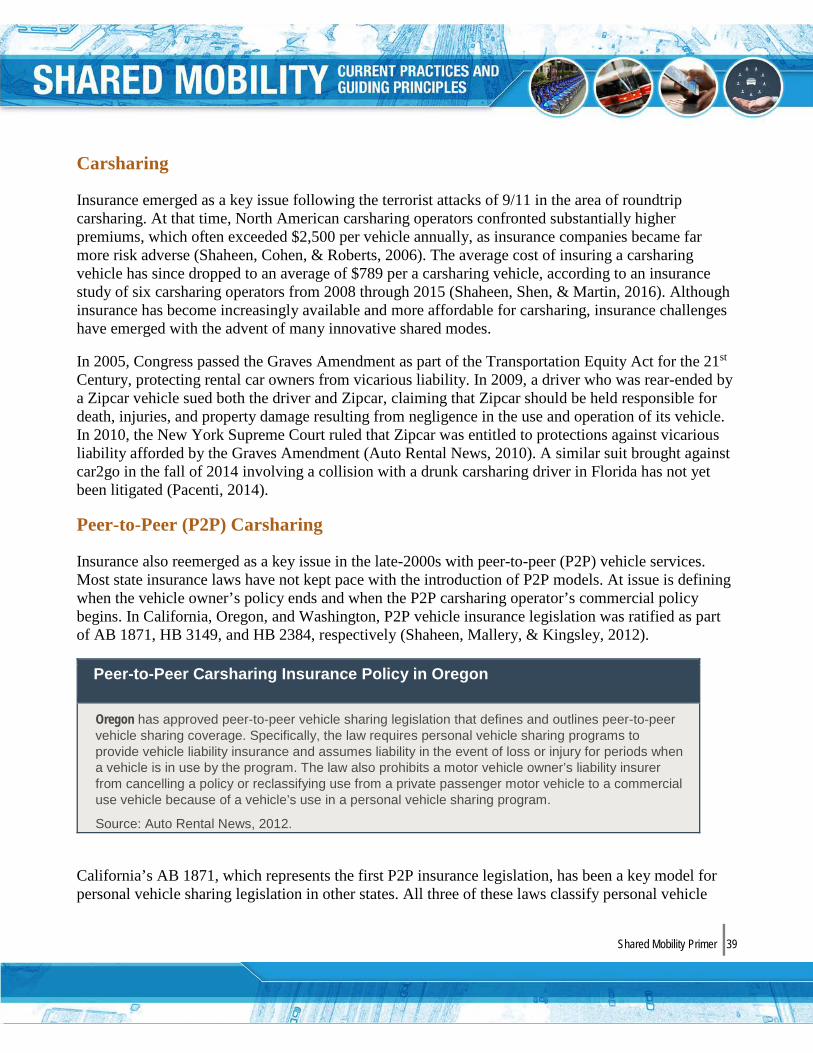
Shared Mobility Primer| 39
Carsharing
Insurance emerged as a key issue following the terrorist attacks of 9/11 in the area of roundtrip carsharing. At that time, North American carsharing operators confronted substantially higher premiums, which often exceeded $2,500 per vehicle annually, as insurance companies became far more risk adverse (Shaheen, Cohen, & Roberts, 2006). The average cost of insuring a carsharing vehicle has since dropped to an average of $789 per a carsharing vehicle, according to an insurance study of six carsharing operators from 2008 through 2015 (Shaheen, Shen, & Martin, 2016). Although insurance has become increasingly available and more affordable for carsharing, insurance challenges have emerged with the advent of many innovative shared modes.
In 2005, Congress passed the Graves Amendment as part of the Transportation Equity Act for the 21st Century, protecting rental car owners from vicarious liability. In 2009, a driver who was rear-ended by a Zipcar vehicle sued both the driver and Zipcar, claiming that Zipcar should be held responsible for death, injuries, and property damage resulting from negligence in the use and operation of its vehicle. In 2010, the New York Supreme Court ruled that Zipcar was entitled to protections against vicarious liability afforded by the Graves Amendment (Auto Rental News, 2010). A similar suit brought against car2go in the fall of 2014 involving a collision with a drunk carsharing driver in Florida has not yet been litigated (Pacenti, 2014).
Peer-to-Peer (P2P) Carsharing
Insurance also reemerged as a key issue in the late-2000s with peer-to-peer (P2P) vehicle services. Most state insurance laws have not kept pace with the introduction of P2P models. At issue is defining when the vehicle owner’s policy ends and when the P2P carsharing operator’s commercial policy begins. In California, Oregon, and Washington, P2P vehicle insurance legislation was ratified as part of AB 1871, HB 3149, and HB 2384, respectively (Shaheen, Mallery, & Kingsley, 2012).
Peer-to-Peer Carsharing Insurance Policy in Oregon
Oregon has approved peer-to-peer vehicle sharing legislation that defines and outlines peer-to-peer vehicle sharing coverage. Specifically, the law requires personal vehicle sharing programs to provide vehicle liability insurance and assumes liability in the event of loss or injury for periods when a vehicle is in use by the program. The law also prohibits a motor vehicle owner’s liability insurer from cancelling a policy or reclassifying use from a private passenger motor vehicle to a commercial use vehicle because of a vehicle’s use in a personal vehicle sharing program.
Source: Auto Rental News, 2012.
California’s AB 1871, which represents the first P2P insurance legislation, has been a key model for personal vehicle sharing legislation in other states. All three of these laws classify personal vehicle
Shared Mobility Primer| 40
sharing as non-commercial use and limit “the circumstances under which the vehicle owner’s automobile liability insurance can be subject to liability” to prevent cancellation of primary automobile insurance policies (AB 1871, 2010). Personal vehicle sharing programs assume liability when the vehicle is rented in a shared capacity, and the owner’s insurance policy resumes coverage once it is returned (Shaheen, Mallery, & Kingsley, 2012). In turn, vehicle owners are indemnified for any loss or injury that occurs through shared use not resulting from their negligence. Time of use, along with initial and final locations of vehicle usage must be clearly delineated through “verifiable electronic records identifying” when it is being used as part of a personal vehicle sharing program (AB 1871, 2010). This prevents premium spikes for primary insurance policies resulting from unverified shared use. Vehicle owners who share their autos in states lacking personal vehicle sharing legislation risk non-renewal of primary insurance policies, as well as premium spikes resulting from increased use (Shaheen, Mallery, & Kingsley, 2012).
Bikesharing
In addition to carsharing and P2P carsharing insurance, owners and operators of bikesharing programs can be sued if one of their bicycles is involved in a serious collision resulting in injuries, fatalities, or property damage. Like carsharing, bikesharing owners and operators can manage risk and limit their liability by signing waivers or indemnification clauses, keeping equipment well maintained, and educating users about bicycle and roadway safety. Unlike rental cars (and now carsharing), bikesharing programs do not have statutory protections against vicarious liability. Also unlike rental cars, bikesharing users do not have the ability to purchase insurance at the time of a mobility transaction. As such, the user and the bikesharing operator may be held responsible for the conduct and damages associated with their program’s equipment. In the case of user liability, home owner and rental policies would often cover this. General commercial liability insurance can protect bikesharing operators from public and product liability risks that may include bodily injury or property damage caused by direct or indirect actions of the insured. Liability insurance is designed to offer protection against third-party insurance claims (e.g., someone who suffers a loss either from using a bikesharing system or a loss of a non-user resulting from the use of a bikesharing bicycle). Generally, unless self-insured by a sponsor or local government entity, most North American bikesharing programs carry some form of liability coverage. Although most bikesharing operators maintain insurance to protect against litigation, most policies do not protect riders against medical bills and lost wages associated with bicycle collisions (Glover, 2013).
Ridesharing
Ridesharing programs, which include carpooling and vanpooling, can present a variety of risk scenarios depending on the program operation. Typically, employer-based vanpool programs are operated using one of three models: 1) employer owns the vehicle and operates the program; 2) employees own and operate the program with or without employer subsidies; or 3) a third-party contractor owns the vehicles and administers the vanpool program (Business Insurance, 2008).

Shared Mobility Primer| 41
Employer liability can be a key concern, if the vehicle is involved in a commuting collision. Many employers prohibit the use of carpool/vanpool vehicles during the workday for non-commute trips to limit this liability. Employers are further reducing their auto liability by outsourcing their carpool/vanpool programs to third-party contractors, such as vRide and Zimride. Employers and third-party contractors also reduce their exposure through vehicle maintenance and driver screening processes that can include physical exams and background checks. In California, statutory provisions protect employers from worker compensation claims involving vanpool collisions, if the vanpool is sponsored or mandated by a governmental agency. This can include mandates to comply with GHG emission reductions, local trip reduction mandates, and spare the air days (Business Insurance, 2008).
For-Hire Driver Laws
Safety and insurance risks related to for-hire vehicle services have long been a topic of discussion. A comprehensive study of taxicab crashes in New York City completed in 2006 found that taxi drivers were involved in at-fault crashes 30 percent less than the general public when compared on a VMT/VKT basis. However, the study also noted that when crashes did occur, the bodily injuries of those involved were much higher than the accident severity associated with drivers of non-commercial vehicles (Schaller Consulting, 2006). Many insurance companies charge premiums based both on driver experience and safe operations (Fraker, 2014). However, a review of safety-related incidents suggests that established screening methods contain gaps that may negatively impact driver and passenger safety. Driver safety from theft and violent crime also represents an insurance risk to for-hire vehicle services. For-hire services that employ a social networking component (i.e., rating systems) may mitigate some of this risk to the extent that social networking profiles can be verified for a person.
Insurance re-emerged as a prominent issue in shared mobility policy with the advent of ridesourcing services, such as uberX and Lyft. In the fall of 2012, the California Public Utilities Commission (CPUC) issued cease and desist letters to Lyft and Tickengo for violating regulatory provisions pertaining to “charter carriers.” In the summer of 2013, the CPUC developed the term transportation network company or TNC, which was defined as a company that “provide[s] prearranged transportation services for compensation using an online-enabled application or platform (such as smartphone apps) to connect drivers using their personal vehicles with passengers.” CPUC granted ridesourcing interim approval to operate while they reviewed public policies and insurance requirements surrounding for-hire vehicle services.
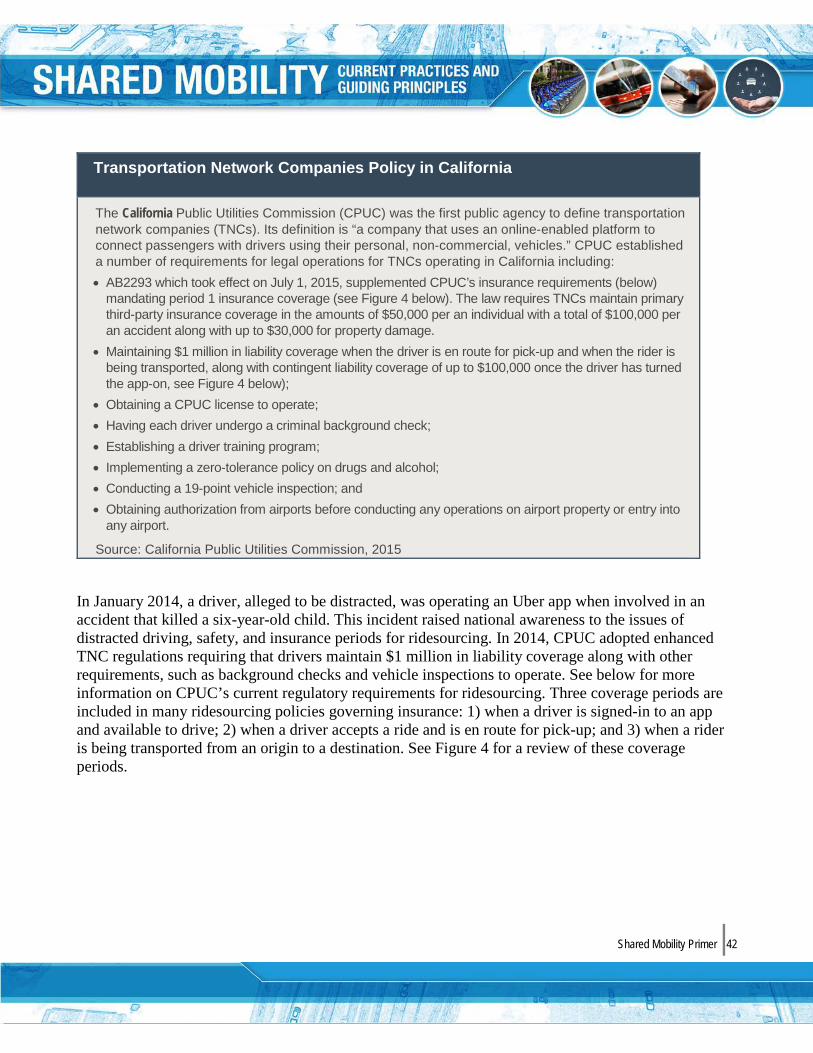
Shared Mobility Primer| 42
Transportation Network Companies Policy in California
The California Public Utilities Commission (CPUC) was the first public agency to define transportation network companies (TNCs). Its definition is “a company that uses an online-enabled platform to connect passengers with drivers using their personal, non-commercial, vehicles.” CPUC established a number of requirements for legal operations for TNCs operating in California including: • AB2293 which took effect on July 1, 2015, supplemented CPUC’s insurance requirements (below)
mandating period 1 insurance coverage (see Figure 4 below). The law requires TNCs maintain primary third-party insurance coverage in the amounts of $50,000 per an individual with a total of $100,000 per an accident along with up to $30,000 for property damage.
• Maintaining $1 million in liability coverage when the driver is en route for pick-up and when the rider isbeing transported, along with contingent liability coverage of up to $100,000 once the driver has turned the app-on, see Figure 4 below);
• Obtaining a CPUC license to operate;• Having each driver undergo a criminal background check;• Establishing a driver training program;• Implementing a zero-tolerance policy on drugs and alcohol;• Conducting a 19-point vehicle inspection; and• Obtaining authorization from airports before conducting any operations on airport property or entry into
any airport.
Source: California Public Utilities Commission, 2015
In January 2014, a driver, alleged to be distracted, was operating an Uber app when involved in an accident that killed a six-year-old child. This incident raised national awareness to the issues of distracted driving, safety, and insurance periods for ridesourcing. In 2014, CPUC adopted enhanced TNC regulations requiring that drivers maintain $1 million in liability coverage along with other requirements, such as background checks and vehicle inspections to operate. See below for more information on CPUC’s current regulatory requirements for ridesourcing. Three coverage periods are included in many ridesourcing policies governing insurance: 1) when a driver is signed-in to an app and available to drive; 2) when a driver accepts a ride and is en route for pick-up; and 3) when a rider is being transported from an origin to a destination. See Figure 4 for a review of these coverage periods.
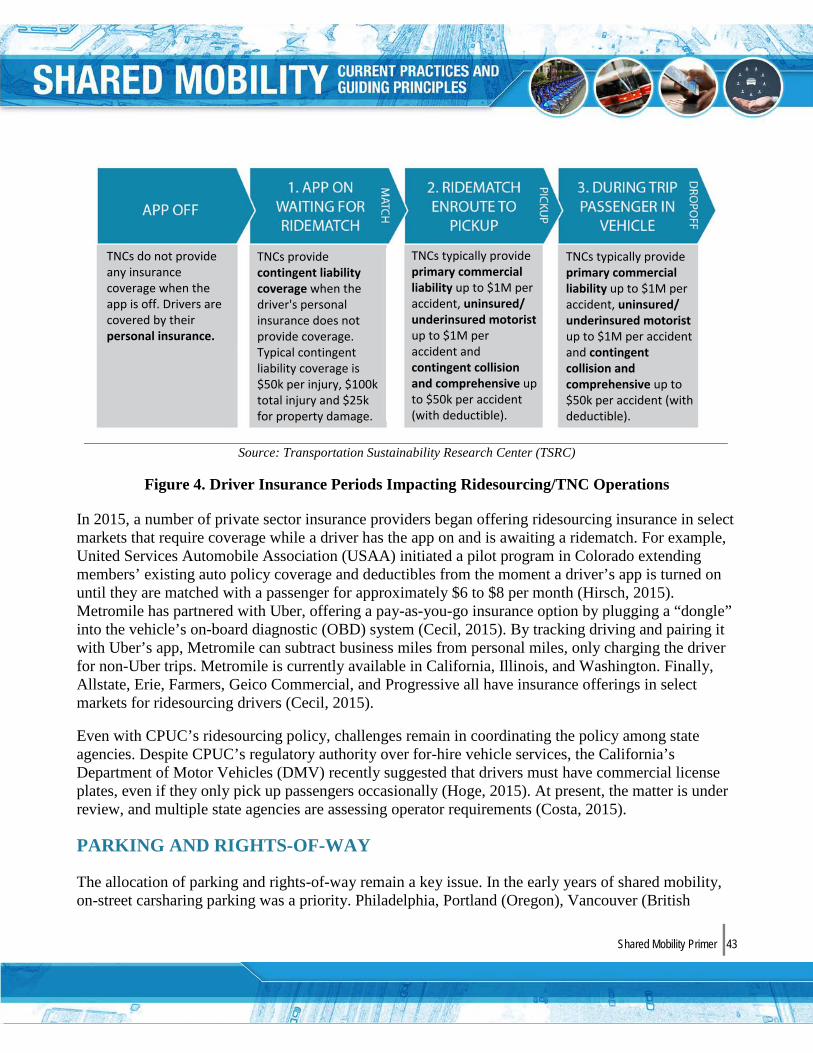
Shared Mobility Primer| 43
Source: Transportation Sustainability Research Center (TSRC)
Figure 4. Driver Insurance Periods Impacting Ridesourcing/TNC Operations
In 2015, a number of private sector insurance providers began offering ridesourcing insurance in select markets that require coverage while a driver has the app on and is awaiting a ridematch. For example, United Services Automobile Association (USAA) initiated a pilot program in Colorado extending members’ existing auto policy coverage and deductibles from the moment a driver’s app is turned on until they are matched with a passenger for approximately $6 to $8 per month (Hirsch, 2015). Metromile has partnered with Uber, offering a pay-as-you-go insurance option by plugging a “dongle” into the vehicle’s on-board diagnostic (OBD) system (Cecil, 2015). By tracking driving and pairing it with Uber’s app, Metromile can subtract business miles from personal miles, only charging the driver for non-Uber trips. Metromile is currently available in California, Illinois, and Washington. Finally, Allstate, Erie, Farmers, Geico Commercial, and Progressive all have insurance offerings in select markets for ridesourcing drivers (Cecil, 2015).
Even with CPUC’s ridesourcing policy, challenges remain in coordinating the policy among state agencies. Despite CPUC’s regulatory authority over for-hire vehicle services, the California’s Department of Motor Vehicles (DMV) recently suggested that drivers must have commercial license plates, even if they only pick up passengers occasionally (Hoge, 2015). At present, the matter is under review, and multiple state agencies are assessing operator requirements (Costa, 2015).
PARKING AND RIGHTS-OF-WAY
The allocation of parking and rights-of-way remain a key issue. In the early years of shared mobility, on-street carsharing parking was a priority. Philadelphia, Portland (Oregon), Vancouver (British
TNCs do not provide any insurance coverage when the app is off. Drivers are covered by their personal insurance.
TNCs provide contingent liability coverage when the driver's personal insurance does not provide coverage. Typical contingent liability coverage is $50k per injury, $100k total injury and $25k for property damage.
TNCs typically provide primary commercial liability up to $1M per accident, uninsured/underinsured motorist up to $1M per accident and contingent collision and comprehensive up to $50k per accident (with deductible).
TNCs typically provide primary commercial liability up to $1M per accident, uninsured/underinsured motorist up to $1M per accident and contingent collision and comprehensive up to $50k per accident (with deductible).
Shared Mobility Primer| 44
Columbia), and the State of California represent some of the early pioneers of policies related to parking and rights-of-way. Increased competition among operators and modes for on-street and public space, coupled with the expansion of shared mobility into innovative service models, such as carsharing, public bikesharing, and high-tech company shuttles, has created the need for new policies to address a different set of challenges.
Carsharing
In roundtrip carsharing, there are numerous examples of parking policies. For instance, Portland, OR, developed the “Option Zone,” which is a carsharing parking space designated by an orange pole and attached bicycle rack that can be mounted to parking meter heads and curbs. Philadelphia, PA, developed its own on-street parking policy for carsharing, initially granting on-street parking to non-profit operators only. Philadelphia was the first jurisdiction to distinguish between for-profit and non-profit carsharing operators. Vancouver, British Columbia, developed one of the earliest universal parking permits, dedicating a permit for carsharing vehicles (in contrast to a parking spot). The universal permit enabled carsharing members to park a carsharing vehicle in all 19 of the city’s parking zones. Although designed for roundtrip carsharing, Vancouver’s policy set the stage for similar universal parking permit policies enabling free-floating one-way carsharing. Finally, California has amended its vehicle code under AB 2154 to allow local governments to designate on-street parking for carsharing and ridesharing vehicle use. Previously, the designation of on-street parking for these functions had been prohibited by the state’s motor vehicle code.
Option Zones and Parking Auctions in Portland, Oregon
Portland has been well known for developing one of the first on-street carsharing parking policies in the early-2000s, which incorporated “Option Zones”–orange poles with bicycle racks that could be mounted to parking meter heads to raise awareness of carsharing and encourage multi-modal connections. In January 2013, the City of Portland revised its carsharing parking policy and established an auction process for carsharing parking. Each year, the Portland Bureau of Transportation creates a list of on-street metered parking spaces available for lease to carsharing operators. The Bureau of Transportation manages the auction process where carsharing operators can bid on parking spaces. The minimum bid is calculated by adding the sum of lost meter revenue and the installation, maintenance, and administrative costs associated with leasing the parking space for carsharing use. Carsharing operators outside the metered district may apply for on-street parking after receiving approval by adjacent property owners. The city has also recognized the importance of use.
Source: Shaheen, Cohen, & Roberts, 2006
Recent public policy amendments and pilot projects have attempted to address competition among operators and to provide flexibility for free-floating one-way service models. A pilot project currently
Shared Mobility Primer| 45
underway in San Francisco established a policy for allocating up to 450 parking spaces among multiple roundtrip and P2P carsharing providers.
Roundtrip Carsharing in San Francisco, California
The San Francisco Municipal Transportation Agency (SFMTA) maintains an on-street carsharing parking program. City CarShare, Zipcar, and Getaround all participate in the SFMTA on-street carsharing parking program that designates up to 450 parking spaces for carsharing vehicles. To qualify, SFMTA requires that the following requirements are met: • Carsharing operator maintains a citywide network of at least 10 vehicles;• Vehicles are available 24 hours a day, seven days a week using a virtual storefront (no staff required),
or available during the hours a vehicle is parked in a garage;• Automobile insurance is provided for each member for the duration of the rental;• Vehicles are only made available for rental in hourly increments or less;• Vehicles are made available for at least 75% of any given month;• Conduct a new member outreach campaign and provide a summary of outreach activities to SFMTA;• Provide quarterly reports on the number of members in the city by zip code, vehicle locations, trip data,
and operational metrics to SFMTA; and• Survey carsharing members to gauge changes in travel patterns at the beginning and end of the pilot
program.
Each organization that participates in the program is eligible for 150 parking spaces (0.05 percent of the city’s total on-street parking). The SFMTA Board of Directors allocates locations through an application process that includes an engineering review, community outreach, and approval. Monthly pricing per space varies from $50 to $225, based on three demand zones established by SFMTA. Operators must pay a one-time installation fee of $400. Each approved carsharing vehicle receives a special parking permit that exempts it from street sweeping, time limits, and other restrictions.
Source: SFMTA, 2013
An 18-month parking pilot similar to the San Francisco’s pilot commenced in Boston in September 2015. In Seattle, the city council has expanded a prior pilot program permitting up to four carsharing operators to compete for on-street parking. Unlike San Francisco’s policy, Seattle’s policy permits carsharing vehicles to “float,” allowing parking for one-way service models. A number of other areas, such as Washington, DC; Austin, TX; and Columbus, OH, have implemented similar policies allowing for free-floating carsharing parking (Segraves, 2014) (City of Austin, 2009) (Rouan, 2014).
Shared Mobility Primer| 46
Free-Floating One-Way Carsharing Parking in Seattle, Washington
Free-floating one-way carsharing created a number of new parking and operational challenges. In December 2012, the Seattle City Council approved a one-year pilot program with car2go that enabled its vehicles to “float” around the city. Car2go paid the city $1,330 per vehicle per year for administrative costs, on-street parking, and residential parking zone permits for 350 vehicles. Car2go is required to provide the city with data on how much parking was used and to pay any additional parking fees accrued to the city at the end of each year. In December 2014, Seattle revised its carsharing policy to permit up to four carsharing operators to each apply for 500 vehicle permits (or 750 vehicle permits, if the operator agreed to cover the entire city). The permits costs $1,703 per vehicle per year and are estimated to raise $2.2 million in revenue in 2015 and $3.4 million in 2016.
Source: City of Seattle, 2015
Public Bikesharing
In North America, the majority of public bikesharing kiosks are located on public land (typically on-street in a former parking space or on curbs). Generally, stations are placed on public rights-of-way either through a municipal request for proposal (RFP) process granting use of the land in cases of public agency program operation, sponsorship, or operator request through informal agreements, real estate licenses to use, easements, or memoranda of understanding/agreement (Shaheen S. A., Martin, Cohen, & Finson, 2012).
High-Tech Company Shuttles
In addition to on-street parking, loading zones have also become a public policy concern for some jurisdictions. In San Francisco, SFMTA was having difficulty with high-tech company shuttles interfering with its bus options. In January 2014, SFMTA announced a program enabling these shuttle services to pay for access to loading zones, if certain guidelines are followed, such as yielding to public buses and pulling to the front of the loading zone to make room for other vehicles (San Francisco Muncipal Transportation Agency, 2014). State law limits the fee to the cost of operating the program. In October 2015, the cost was $3.67 per shuttle, per each stop made (San Francisco Municipal Transportation Agency, 2015).

Shared Mobility Primer| 47
SIGNAGE AND ADVERTISING
Local authorities play a key role in setting policies associated with the signage and advertising of shared modes. This role can range from permitting street and curbside markings, signs, street fixtures, and wayfinding signs and regulating private sector signage and advertising. For example, in the early-2000s, the City of Portland established “Option Zones,” tall orange poles where a bike rack could be attached to parking meter heads to denote carsharing availability (see Figure 5). Other jurisdictions have established curb and street markings to identify carsharing parking and high-tech company shuttle pick-up and drop-off locations.
In addition to providing signage and street fixtures to identify shared modes, local governments and public agencies have also been instrumental in regulating advertising on public bikesharing hubs. With bikesharing in particular, operating costs are typically funded through a combination of user fees, advertising, and sponsorships (including naming rights, which can include exclusive equipment branding). In a 2012 study of bikesharing, sponsorships and advertising ranked as two of the top three funding and revenue sources for operators (Shaheen S. A., Martin, Cohen, & Finson, 2012). At its start, Washington, DC, faced a number of challenges in siting its bikesharing stations in light of sponsor advertising. The city had an ordinance that prohibited advertising on District-owned property, and special legislation had to be enacted to allow bikesharing advertising on public bus shelters (Kaplan, 2010). Amending local ordinances to permit advertising can assist shared mobility operators, including bikesharing programs, in maximizing cost recovery through various advertising mediums.
MULTIMODAL INTEGRATION
Public transit agencies can play a notable role in advancing multimodal integration with shared modes. Public transit agencies can provide policy guidance and technical assistance with information technology, joint marketing, fare integration, and public transit discounts. These policies can play a critical role in mitigating obstacles, such as technological barriers
and lack of integration within existing transportation systems, and in addressing skepticism regarding multimodality.
Source: Reprinted from Millard-Ball et al., 2005
Figure 5. Portland’s Carsharing Option Zone
Shared Mobility Primer| 48
Historically, most shared modes, such as carsharing and bikesharing, successfully co-located shared services on site or adjacent to public transportation. While many airports have adopted ridesourcing regulations in the U.S., many have not yet done so. Ridesourcing vehicles often are prohibited from operating at airport locations either adjacent to or alongside taxi services. In October 2014, the San Francisco International Airport (SFO) amended its ground transportation regulations to permit three large ridesourcing service providers to operate on site (Soper, 2014). In February 2015, SFO authorities again amended their regulations to permit e-Hail taxi services to operate at the airport (Soper, 2015). In March 2015, Orange County California’s John Wayne International Airport also amended its policy to permit ridesourcing to pick up and drop off airport passengers (Fleischman, 2015).
While co-locating shared modes at or near public transportation is a common practice, fare and information integration remain notable challenges. Chicago’s joint fare card between the Chicago Transit Authority and IGO (now Enterprise CarShare) represented the first integrated shared mobility-public transportation fare card in North America. More recent innovations include fare integration between HOURCAR and Metro Transit in the Twin Cities and a partnership between BCycle and RideScout and its mobile payment subsidiary GlobeSherpa. See Table 2 for more information on these and other recent developments.
Shifts in technological trends may speed the transition to integration. As of 2014, it was estimated that more than 90 percent of public transit fare payments were made by “closed loop” fare cards administered by public transit agencies (Shaheen & Christensen, 2015). It is forecast that by 2023, public transit agency administered fare cards will account for less than 10 percent of public transportation fare payments, and the remaining 90 percent of fare payments will be split between bank cards and mobile payment systems (Shaheen & Christensen, 2015). Emerging technologies, such as Bluetooth low energy and near field communications, coupled with smartphone apps and mobile payments, may provide consumers with the ability to access and pay for shared mobility services and public transportation using a single electronic device, such as a mobile phone (Bender, 2013). While both real-time and open data are becoming increasingly available, incorporating public transportation trip planning with private sector modes, notably shared modes, remains a challenge in many jurisdictions. The lack of available real-time data and access to APIs2, as well as reluctance of the public and private sector to collaborate, can provide institutional challenges to digital multimodal integration.
2 APIs are a web programming practice that allows open sharing of content and data among data providers and applications.
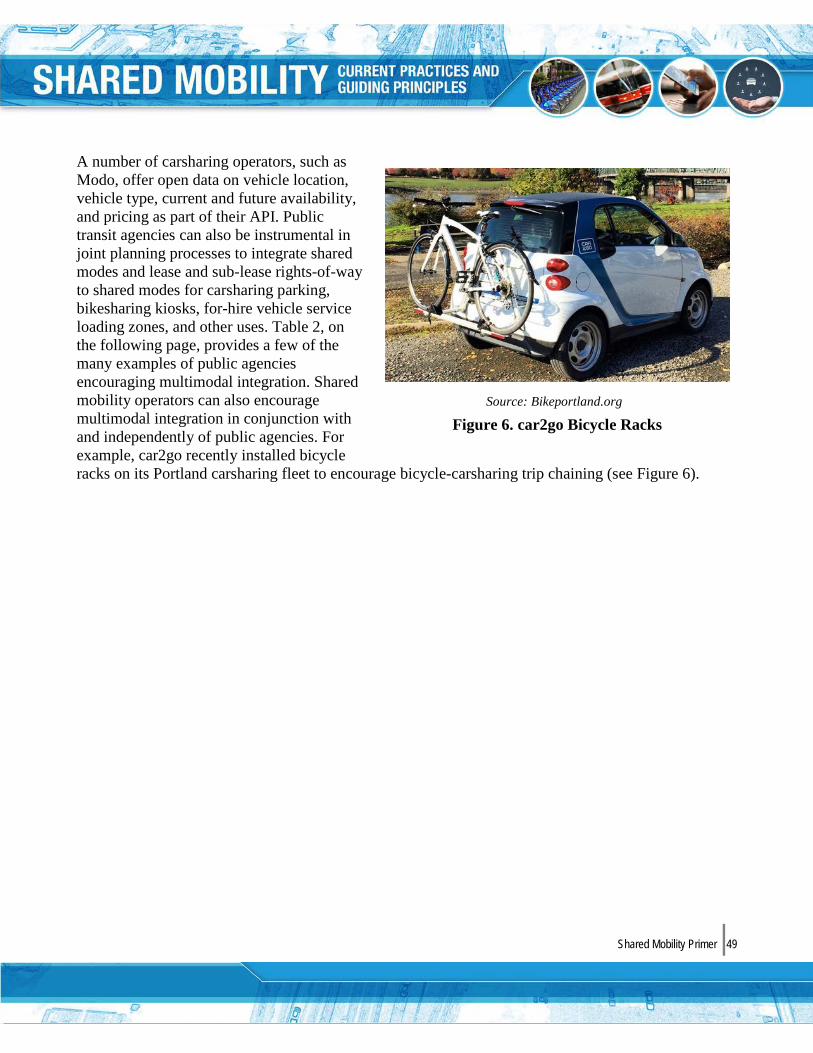
Shared Mobility Primer| 49
A number of carsharing operators, such as Modo, offer open data on vehicle location, vehicle type, current and future availability, and pricing as part of their API. Public transit agencies can also be instrumental in joint planning processes to integrate shared modes and lease and sub-lease rights-of-way to shared modes for carsharing parking, bikesharing kiosks, for-hire vehicle service loading zones, and other uses. Table 2, on the following page, provides a few of the many examples of public agencies encouraging multimodal integration. Shared mobility operators can also encourage multimodal integration in conjunction with and independently of public agencies. For example, car2go recently installed bicycle racks on its Portland carsharing fleet to encourage bicycle-carsharing trip chaining (see Figure 6).
Source: Bikeportland.org
Figure 6. car2go Bicycle Racks

Shared Mobility Primer| 50
Table 2. Examples of Shared Mobility Multimodal Integration Efforts
EXAMPLE DESCRIPTION
Arlington County’s Transit Development Planning with Capital Bikeshare
In October 2011, Arlington County began a planning process with Capital Bikeshare to complete a long-term transit development plan to encourage multimodal integration with Capital Bikeshare. Finalized in November 2012, the county’s transit development plan (TDP) establishes a strategic blueprint on how to more effectively integrate bikesharing and public transportation in Arlington County. Currently being implemented, the TDP has a planning horizon through 2018 (Bike Arlington, 2012 ).
BCycle and RideScout Demonstration
In October 2015, BCycle and RideScout conducted a demonstration allowing users to unlock and pay for a bikesharing bicycle using the multimodal mobility aggregator app RideScout (Marich, 2015).
Bikesharing at Caltrain Stations in the San Francisco Bay Area
Many public bikesharing operators co-locate bikesharing kiosks at public transit hubs. Bay Area Bike Share is taking a regional approach and has located bicycles at seven stations along the Caltrain corridor, spanning nearly 50 miles (80 km) from San Francisco to San Jose (Bay Area Bike Share, 2015).
Carsharing Bike Racks In November 2014, car2go announced that it was installing bike racks on its vehicles as part of a pilot program in Portland, OR (Andersen, 2014).
Carsharing Parking at Washington Metropolitan Area Transit Authority (WMATA) Facilities
Numerous public transit authorities, such as WMATA, have offered carsharing parking at rail stations and park-and-ride lots. WMATA began offering carsharing parking at its facilities in 2001. In May 2015, Enterprise CarShare was selected through a RFP process to provide carsharing service at 45 metro stations (Zauzmer, 2015).
Chicago’s Joint Transit Card
In 2009, the Chicago Transit Authority (CTA) launched the first joint fare card in North America. The card enabled a single payment and access system for CTA buses and trains, pace buses, and IGO carsharing vehicles (Center for Neighborhood Technology, 2013).
Dallas Area Rapid Transit (DART) Partnership with Uber
In April 2015, DART announced a partnership that enables public transit riders to connect to Uber through the “events and offers” section of DART’s GoPass mobile ticketing application (DART, 2015). A similar partnership also exists between Uber and Atlanta’s Metropolitan Atlanta Rapid Transit Authority (Jaffe, 2015).
Hourcar and Metro Transit Fare Integration in the Twin Cities
In September 2015, HOURCAR and Metro Transit announced a partnership allowing carsharing members to use their Go-To transit cards to access HOURCAR vehicles. The new partnership will make it more convenient for users to seamlessly connect between public transportation and carsharing (Harlow, 2015).
Kitsap Transit’s Scoot Carsharing Program
In Kitsap County, WA, the county transportation authority established SCOOT Car-Sharing, offering six vehicles. Scoot is the first public transportation operator in the United States to establish and operate its own carsharing program (Kitsap County Transit, 2013).
Loading Zones for Ridesourcing at San Jose International Airport
In October 2014, San Jose International Airport amended its commercial ground transportation rules and regulations to incorporate ridesourcing to provide for-hire vehicle services, such as UberX and Lyft, with legal access to airport loading zones (City of San Jose, 2014).
Option Zones in Portland, Oregon
Portland’s option zones identified carsharing with a tall orange pole with a bike rack to encourage links between bicycling and carsharing. The poles attach to meter heads and could be easily removed or relocated. Option zones are typically co-located in close proximity to public transit (Shaheen, Cohen, & Roberts, 2006).
Shared Mobility Primer| 51
PLANNING PROCESSES
Local and regional governments have multiple goals in incorporating shared mobility into their transportation networks. These goals may include mitigating en-route and parking congestion, reducing VMT/VKT and vehicle ownership, improving air quality, achieving climate action targets, and providing vehicle access to underserved populations (e.g., low-income communities). Incorporating shared mobility into municipal and regional planning processes, such as land use and transportation plans, may require data to assist in forecasting the impact of shared mobility on public infrastructure. Integrating shared planning into municipal general plans and sketch planning tools can help to identify opportunities and gaps within the transportation system. Sketch planning can be used to estimate the general order-of-magnitude impacts of bikesharing, carsharing, ridesourcing, and other shared modes. Some states have ratified legislation that requires transportation land-use coordination to meet air quality and climate mitigation initiatives, such as California’s SB 375 (the Sustainable Communities and Climate Protection Act of 2008). Additionally, planning processes offer public agencies and local governments opportunities to solicit feedback from residents, businesses, actual and prospective users, and others impacted by shared mobility.
Public involvement is important when incorporating shared mobility into the urban environment. Public involvement can reduce opposition to shared mobility services (e.g., when converting parking spaces to carsharing or bikesharing uses) and can address concerns of impacted stakeholders (e.g., storefronts adjacent to a bikesharing kiosk or taxi drivers affected by ridesourcing). The particular method of public involvement should reflect the unique institutions and policy procedures established in each jurisdiction. Some examples of public involvement could include endorsement by neighborhood councils; a public comment, hearing, and approval process; or an appointed/elected body to develop, comment, or approve public policies. Some jurisdictions have provided city councils, public transit agencies, public utilities commissions, and parking authorities with varying degrees of authority over shared mobility. Public involvement, through regular meetings and public comment periods, has been important in exercising such authority. For example, when Washington, DC initiated its carsharing parking policy in 2005, the district adopted a policy where new carsharing parking spaces were requested by Advisory Neighborhood Councils and approved by the District’s Department of Transportation (DDOT) (Shaheen, Rodier, Murray , Cohen, & Martin, 2010). In New York City, the Department of Transportation (DOT) held 159 public presentations and demonstrations, coupled with an additional 230 meetings with elected officials, property owners, and other stakeholders to solicit public input on the design and operation of the city’s bikesharing program (New York City Department of Transportation, n.d.). As part of its outreach effort, the DOT established an online portal for the public to make station suggestions and to support already suggested kiosk locations. Finally, more than 250 organizations, community groups, and elected officials participated in 14 planning workshops for the planning and design of the Citi Bike system (New York City Department of Transportation, n.d.).
Shared Mobility Primer| 52
DATA SHARING, PRIVACY, AND STANDARDIZATION
Public and private partnerships to standardize data, share data, and protect sensitive data can be key to understanding shared mobility’s impact on the transportation network and encourage innovation. Shared mobility operators typically track several important data points—the origin and destination of shared services (e.g., the pickup and return location for a carsharing or bikesharing vehicle or ridesourcing passenger), travel time, and trip duration. A number of shared mobility service providers have shared data with public agencies either voluntarily or as part of a regulatory mandate. For example, as part of Washington, DC’s carsharing parking initiative adopted in 2005, carsharing operators seeking on-street parking are required to provide the DDOT with quarterly data to assess the impacts of their parking program. In 2012, City CarShare voluntarily shared data with the SFMTA during the city’s SFpark pilot to assist planners and policymakers with the development of the carsharing parking policy.
In addition to this data sharing with public agencies, a number of shared mobility service providers make data publicly available for download. Bay Area Bike Share, Capital Bikeshare, and Citi Bike are a few of the operators that provide some of the most expansive publicly available data including information on trip origin and destination (location and time); rider type (e.g., the type of user pass); home zip code for annual members; the bicycle number; weather information; and bicycle/dock availability at each station. Real-time data on service availability are becoming increasingly available. Operators are making these data available on their websites and apps for users and non-users to locate services, such as available bikesharing bikes, open docks, and idle carsharing vehicles. In addition to providing these data on operator websites, the use of APIs is increasingly creating an open data infrastructure with third parties, such as aggregator and trip planning websites and smartphone apps. Uber has established an API that allows third-party app integration with other services including OpenTable, Trip Advisor, and United Airlines. In January 2015, uberX announced that it would share anonymized trip data with the City of Boston on a quarterly basis as part of the company’s new national data-sharing policy (Badger, 2015 ).
In addition to data sharing, data privacy and security remain key concerns among many shared mobility consumers. Shared mobility operators maintain highly sensitive data on their users, employees, and independent contractors, such as personally identifiable information, trip information, and financial information. In 2013, a Citi Bike software glitch mistakenly exposed sensitive personal and financial information, including credit card numbers of nearly 1,200 bikesharing users (Mann, 2013). From 2014 to 2015, a series of privacy scandals involving Uber raised awareness of data sensitivity and the importance of privacy and security among shared mobility service providers (Canedo, 2014) (Covert, 2015). In 2014, two former Uber employees leaked to the media that its corporate employees had wide access to track drivers and customers using an internal company tool known as “God View” (Canedo, 2014). In February 2015, Uber announced that a hacker had obtained names and driver’s license numbers of approximately 50,000 current and former drivers in a data breach that occurred in May 2014. Uber took responsive measures including notifying the impacted drivers and providing affected individuals with a one-year free membership in a credit monitoring

Shared Mobility Primer| 53
service (Covert, 2015). The company views data security very seriously and has since implemented measures to ensure tighter data security, along with others in the shared mobility industry.
Finally, data standardization is critical to ensuring compatibility for a variety of uses and platforms. In November 2015, the North American Bikeshare Association announced the adoption of an open data standard, pledging to make real-time data feeds available in a standardized format so these data can be readily incorporated into smartphone applications (Fried, 2015). More industry-wide standards, either through trade associations or governmental regulation, could aid in the development of clear and consistent data formats, data sharing protocols, and privacy protections to ensure open data, interoperability, and comparability across a wide array of platforms.
ACCESSIBILITY AND EQUITY ISSUES
Some of the key challenges pertaining to accessibility issues are the varying requirements and what local governments, public agencies, and shared mobility providers measure. Title VI of the Civil Rights Act of 1964 states that: “No person … shall, on the grounds of race, color, or national origin, be excluded from participation in, be denied benefits of, or be subjected to discrimination under any program or activity receiving Federal financial assistance.” Over the years, this definition has been expanded to include additional protected classes, such as religion, age, gender, pregnancy, citizenship, familial status, disability, and veteran status. In addition to these groups, equity issues may involve a number of other groups, such as low-income individuals and neighborhoods. Title VI was amended in 1987, extending non-discrimination requirements for recipients of federal aid to all of their programs and activities, not just programs and activities funded with federal funds. Because many shared mobility operators receive either direct monetary and non-monetary support from federally funded agencies (e.g., free or reduced cost parking from public transit agencies), the non-discrimination requirements could extend to shared mobility operators receiving such support.
As previously discussed in Chapter 3, multiple North American studies of carsharing and bikesharing users have shown that carsharing members and both long-term and short-term bikesharing users are more likely to be Caucasian, male, between the ages of 20 and 35, and well educated compared to the general population (Shaheen S. , Martin, Chan, Cohen, & Pogodzinski, 2014) (Dill, Mathez, Nathan, & Howland, 2014). In many cases, shared mobility has previously struggled to gain traction among all populations within urban service areas despite the findings of several studies that suggest that shared mobility can often enhance the mobility of disadvantaged communities through improved job access and cheaper, faster, and more available mobility.
Low-Income Access
Access to credit and debit cards by low-income users has been and continues to be a challenge for bikesharing use. In Washington, DC, Capital Bikeshare has partnered with financial institutions that

Shared Mobility Primer| 54
allow users to establish accounts, obtain debit cards, and receive promotional gift cards to offset the cost of a bikesharing membership.
Capital Bikeshare’s Bank on DC Program
A common concern among bikesharing operators and local governments is low-income access to bikesharing and the requirement to have a debit or credit card for use. In Washington, D.C., Capital Bikeshare partnered with United Bank and District Government Employees Federal Credit Union (DGEFCU) to allow users to open up a bank account and obtain a debit card. New account holders receive a $25 gift card good toward the cost of annual Capital Bikeshare membership.
Source: Capital Bikeshare, 2015
In Boston, as part of a grant to expand the city’s Hubway bikesharing system, city council members have asked city staff to create a written plan for the expansion of the system into underserved areas. In the San Francisco Bay Area, City CarShare provides a formal low-income carsharing program that includes subsidies for membership and usage fees for low- to moderate-income users. To apply for the subsidy, prospective users must be referred by one of six project partners that serve low- and moderate-income residents and clients (City CarShare, 2015).
Older Adult Mobility
City CarShare is also one of the few shared mobility providers offering services geared directly toward older adults through its partnership with NextVillage, a San Francisco-based non-profit working to enhance the mobility of older adults. NextVillage pays for a complimentary one-year carsharing membership for volunteers who donate 12 hours on a quarterly basis to drive senior citizens to appointments and errands (City CarShare, 2014).
Disability Access
Disability access is a challenge impacting shared modes. In October 2014, the Austin City Council adopted an ordinance regulating ridesourcing, which among other things mandated that ridesourcing drivers cannot refuse service or charge higher fees to disabled passengers. In Berkeley, CA, non-profit City CarShare introduced the nation’s first wheelchair accessible carsharing vehicles in 2008, known as AccessMobile. City CarShare has expanded the program to include wheelchair-accessible vans in San Francisco. In 2015, Buffalo CarShare (now Zipcar) became the second carsharing operator with a wheelchair-accessible van, after acquiring it from City CarShare (Susan Shaheen, unpublished data, 2015).
Local governments, public transportation agencies, and shared mobility providers can safeguard Title VI compliance by ensuring service access to a wide range of demographic populations (including but

Shared Mobility Primer| 55
not limited to minorities and low-income users) and incorporating special needs and underserved populations into planning processes.
Americans with Disabilities Act (ADA) Protections for Ridesourcing in Austin, Texas
In October 2014, the City of Austin approved an ordinance regulating ridesourcing. The ordinance specifically prohibits drivers from refusing to accept or charge higher fees to disabled passengers. Additionally, the ordinance mandates that ridesourcing must conduct outreach with low-income communities and organizations and have ADA compliant vehicles available.
Source: City of Austin, 2014
CONCLUSION
Local and regional governments play a number of roles that can impact shared mobility servicesranging from transportation policy, planning, network operations, congestion mitigation, parking management, and compliance with air quality and climate action standards. Areas that involve public policy and shared mobility include:
• Health, Safety, and Consumer Protection
• Taxation
• Insurance
• Parking and Access to Rights-of-Way
• Signage and Advertising
• Multimodal Integration
• Planning Processes
• Data Sharing, Data Privacy, andStandardization
• Accessibility and Equity.
Shared Mobility Primer| 56
Public-private partnerships with local governments, public transit agencies, developers, employers, universities, and transportation management associations are crucial to the growth and success of shared mobility. Public-private partnerships can include an array of assistance ranging from financial and marketing support to providing rights-of-way and integrating shared mobility into planning processes, local ordinances, and public transit. As such, public-private partnerships can play a key role in addressing a number of policy challenges that could help to evolve shared mobility to maximize its social and environmental benefits.
REFERENCES
AB 1871, Reg. Sess. (CA. 2010)
Andersen, M. (2014, November 12). bikeportland.org. Retrieved February 9, 2015, from http://bikeportland.org/2014/11/12/car2gos-new-bike-racks-passed-portland-test-113344
Auto Rental News. (2010, June 16). Zipcar Granted Graves Protection. Auto Rental News.
Auto Rental News. (2012, January 11). Legislation OKs Peer-to-Peer Car Sharing in Oregon. Retrieved from Auto Rental News: http://www.autorentalnews.com/channel/fleet-insurance/news/story/2012/01/peer-to-peer-car-sharing-now-legal-in-oregon.aspx
Badger, E. (2015 , January 13). Uber offers cities an olive branch: your valuable trip data. The Washington Post.
Bay Area Bike Share. (2015, February 9). Retrieved February 9, 2015, from http://www.bayareabikeshare.com/
Bender, A. (2013, September 10). PayPal taps Bluetooth for contactless payments. Retrieved March 7, 2015, from http://www.techworld.com.au/article/526008/paypal_taps_bluetooth_contactless_payments/
Bieszczat, A. (2011). The Taxation of Carsharing: Is Public Policy Consistent with the Public Benefits of Carsharing? . Chaddick Institute for Metropolitan Development (p. 23). Chicago: DePaul University.
Bike Arlington. (2012 , November). Arlington Bikeshare Transit Development Plan (TDP). Retrieved March 7, 2015, from http://www.bikearlington.com/pages/bikesharing/arlington-bikeshare-transit-development-plan/
Business Insurance. (2008, August 31). Vanpools cut costs, increase some risks. Commuting aid adds to liability exposures.
California Public Utilities Commission. (2015, April 28). Transportation Network Companies. Retrieved from California Public Utilities Commission: http://www.cpuc.ca.gov/PUC/Enforcement/TNC/

Shared Mobility Primer| 57
Canedo, N. (2014, November 19). Uber executive in New York allegedly used company's 'God View' tool to track journalist. Syracuse Post-Standard.
Capital Bikeshare. (2015). Bank on DC. Retrieved from Capital Bikeshare: https://www.capitalbikeshare.com/bankondc
Cecil, A. (2015, April 8). Uber, Lyft, and other rideshare drivers now have insurance options. Retrieved from Policy Genius: https://www.policygenius.com/blog/uber-lyft-and-other-rideshare-drivers-now-have-insurance-options/
Center for Neighborhood Technology. (2013, August 14). Retrieved February 9, 2015, from http://www.cnt.org/sites/default/files/publications/CNT_35Years.pdf
City CarShare. (2014, July 15). A Unique Partnership to Promote Elderly Independence . Retrieved March 7, 2015, from https://citycarshare.org/newsletters/july-2014-a-unique-partnership-and-more-referral-credits/
City CarShare. (2015). CommunityShare. Retrieved March 7, 2015, from https://citycarshare.org/plans-pricing/other-plans/communityshare/
City of Austin. (2009, November 17). Agreement for Pilot Car Share Program. Retrieved March 7, 2015, from http://www.austintexas.gov/edims/document.cfm?id=145020
City of Austin. (2014). AN ORDINANCE DEFINING TRANSPORTATION NETWORK COMPANIES . Retrieved from City of Austin: http://www.austintexas.gov/edims/document.cfm?id=219353
City of San Jose. (2014, October 10). San Jose International Airport Commercial Ground Transportation Rules and Regulations. Retrieved March 7, 2015, from http://www.flysanjose.com/fl/business/gt_permits/gt_rules.pdf
City of Seattle. (2015, January 13). SDOT Free-Floating Car Sharing Code Revision ORD.
Costa, J. (2015, February 2). DMV Threatens Uber, Lyft Operations; California Legislators Address Archaic Interpretation of Old Law. Retrieved February 26, 2015, from http://www.turlockcitynews.com/news/item/4592-dmv-threatens-uber-lyft-operations-california-legislators-address-archaic-interpretation-of-old-law
Covert, J. (2015, February 27). Uber says it got hacked - over nine months ago. The New York Post.
Dill, J., Mathez, A., Nathan, M., & Howland, S. (2014). Who Uses Peer-to-Peer Carsharing? An Early Exploration. 94th Annual Meeting of the Transportation Research Board (p. 20). Washington D.C.: Transportation Research Board.
Fraker, G. (2014). Issues of Risk Related to Shared Mobility. get2kno.
Fleischman, J. (2015, March 4). John Wayne Airport to Open to Uber, Lyft. Retrieved March 7, 2015, from http://www.breitbart.com/california/2015/03/04/john-wayne-airport-to-open-to-uber-lyft/

Shared Mobility Primer| 58
Fried, B. (2015, November 25). Bike-Share Open Data Standard Clears the Way for Better Trip Planning Apps. Retrieved from Streets Blog NYC: http://www.streetsblog.org/2015/11/25/bike-share-open-data-standard-clears-the-way-for-better-trip-planning-apps/
Glover, M. (2013, July 2). Citi Bike Floods Streets With Thousands of Uninsured Cyclists. The Observer.
Harrington, K. (2016, February 27). Ballot Language Set for May 7 TNC Rules Vote. Retrieved from Building ATX: http://buildingatx.com/2016/02/ballot-language-set-for-may-7-tnc-rules-vote/
Harlow, T. (2015, September 7). Go-To cards can now be used for both transit and car sharing. Retrieved from StarTribune: http://www.startribune.com/go-to-cards-can-now-be-used-for-both-transit-and-car-sharing/325183601/
Hirsch, R. (2015, January 27). USAA Piloting Ridesharing Insurance Coverage for Colorado Members. Retrieved from USAA: https://communities.usaa.com/t5/Press-Releases/USAA-Piloting-Ridesharing-Insurance-Coverage-for-Colorado/ba-p/56583
Hoge, P. (2015, January 22). California DMV says Uber, Lyft cars must have commercial plates. San Francisco Business Times.
Jaffe, E. (2015, August 3). Uber and Public Transit Are Trying to Get Along. Retrieved from CityLab: http://www.citylab.com/cityfixer/2015/08/uber-and-public-transit-are-trying-to-get-along/400283/?utm_source=SFTwitter
Kaplan, M. D. (2010, November 14). smartplanet.com. Retrieved February 9, 2015, from http://www.smartplanet.com/blog/pure-genius/dc-unveils-countrys-largest-bike-share-program/
Kitsap County Transit. (2013, December 11). Retrieved February 9, 2015, from http://www.kitsaptransit.com/scoot
Mann, T. (2013, July 23). The Wall Street Journal. Citi Bike Accidentally Exposes Customer Credit Card Information.
Marich, M. (2015, October 13). BCycle and RideScout Demonstrate First Use of Smart Phone and Apple Watch to Locate, Unlock and Pay for Bike Share Bike. Retrieved from Ridescout: http://ridescout.com/2015/10/13/bcycle-bcycle-and-ridescout-demonstrate-first-use-of-smart-phone-and-apple-watch-to-locate-unlock-and-pay-for-bike-share-bike/Millard-Ball, A., Murray, G., Ter Schure, J., and Fox, C. (2005). Car-Sharing: Where and How It Succeeds. Retrieved December, 15, 2015, from http://onlinepubs.trb.org/onlinepubs/tcrp/tcrp_rpt_108.pdf
New York City Department of Transportation. (n.d.). NYC Bikeshare Designed By New Yorkers. Retrieved February 27, 2015, from http://www.nyc.gov/html/dot/downloads/pdf/bike-share-outreach-report.pdf
Shared Mobility Primer| 59
Pacenti, J. (2014, September 30). Suit Tests Cars2Go Immunity After Car Crash Kills Bar-Hopping Young Woman. Daily Business Review.
Phys.org. (2014, December 16). Uber targeted by Belgium tax probe. Retrieved March 7, 2015, from http://phys.org/news/2014-12-uber-belgium-tax-probe.html
Rouan, R. (2014, November 9). Car2Go’s 2nd year brings on new rules. The Columbus Dispatch.
San Francisco Municipal Transportation Agency. (2015, October 19). SFMTA Proposes New Shuttle Rules. Retrieved December 15, 2016, from https://www.sfmta.com/about-sfmta/blog/sfmta-proposes-new-shuttle-rules
San Francisco Muncipal Transportation Agency. (2014, January 6). Mayor Lee and SFMTA Announce Agreement with Commuter Shuttle Providers to Benefit Muni and Overall Transportation Network. Retrieved February 26, 2015, from http://sfmta.com/news/press-releases/mayor-lee-and-sfmta-announce-agreement-commuter-shuttle-providers-benefit-muni
San Francisco Municipal Transportation Agency. (2013, July). Car Sharing Policy and Pilot Project. Retrieved from SFMTA: https://www.sfmta.com/sites/default/files/projects/SFMTA%20Car%20Sharing%20Policy_MTAB_20130716.pdf
Schaller Consulting. (2006). Taxicab and Livery Crashes in New York City 2004 . New York City.
Segraves, M. (2014, January 13). Car Share Users Guaranteed Free Parking on D.C. Streets. Retrieved March 7, 2015, from http://www.nbcwashington.com/news/local/Car-Share-Users-Guaranteed-Free-Parking-on-DC-Streets-240003911.html
Shaheen, S., & Christensen, M. (2015). Shared-Use Mobility: What Does the Future Hold? Emerging and Innovative Public Transport and Technologies Committee (AP020) (p. 7). Washington D.C. : Transportation Research Board.
Shaheen, S. A., Cohen, A. P., & Roberts, J. D. (2006). Carsharing in North America: Market Growth, Current Developments, and Future Potential. In Transportation Research Record: Journal of the Transportation Research Board (pp. 116-124). Washington, D.C.: Transportation Research Board of the National Academies.
Shaheen, S. A., Mallery, M., & Kingsley, K. (2012). Personal Vehicle Sharing Services in North America. Research in Transportation Business & Management, Vol. 3, pp. 71-81.
Shaheen, S., Martin, E., Chan, N., Cohen, A., & Pogodzinski, M. (2014). Public Bikesharing in North America During A Period of Rapid Expansion: Understanding Business Models, Industry Trends and User Impacts. San Jose: Mineta Transportation Institute
Shaheen, S. A., Martin, E. W., Cohen, A. P., & Finson, R. S. (2012). Public Bikesharing in North America: Early Operator and User Understanding. San José: Mineta Transportation Institute.

Shared Mobility Primer| 60
Shaheen, S., Rodier, C., Murray , G., Cohen, A., & Martin, E. (2010). Carsharing and Public Parking Policies: Assessing Benefits, Costs, and Best Practices in North America. San Jose: Mineta Transportation Institute.
Shaheen, S., Shen, D., & Martin, E. (2016). Understanding Carsharing Risk and Insurance Claims in the United States. In Transportation Research Record: Journal of the Transportation Research Board (forthcoming). Washington, D.C.: Transportation Research Board of the National Academies.
Soper, T. (2014, October 20) uberX, Lyft approved to pick up and drop off passengers at SFO. Retrieved from http://www.geekwire.com/2014/lyft-approved-pick-drop-passengers-sfo/
Soper, T. (2015, February 18). Flywheel partners with taxi company to create ‘FlywheelTaxi,’ reaches deal with SFO. Retrieved from http://www.geekwire.com/2015/flywheel-partners-taxi-company-flywheeltaxi-reaches-deal-sfo/
Srivastava, S., & Surabhi. (2015, March 2). E-commerce business with ‘aggregator models’ now to be taxable; Uber, TripAdvisor to be taxed. The Financial Express. Retrieved from http://www.financialexpress.com/article/industry/companies/e-commerce-business-with-aggregator-models-now-to-be-taxable-uber-tripadvisor-to-be-taxed/49294/
Zauzmer, J. (2015, May 15). Zipcar loses out to Enterprise on contract to park at Metro stations. Retrieved from The Washington Post: https://www.washingtonpost.com/news/dr-gridlock/wp/2015/05/15/zipcar-loses-out-to-enterprise-on-contract-to-park-at-metro-stations/
Shared Mobility Primer| 61
CHAPTER 5. LESSONS LEARNED AND CHALLENGES IN THE FUTURE
Shared mobility is changing the perceptions of transportation in the United States and worldwide, spawning new business models and influencing individual transportation choices and behavior. These changes are dynamic and evolving. We can expect innovations in shared mobility to continue to shape and change options for years to come. As with all new disruptive technologies and business models, there are challenges to shared mobility’s expansion and scaling. This chapter explores these challenges, along with success stories, lessons learned, and proposed solutions.
Some of the prominent shared mobility challenges discussed in this chapter include:
1. Recognizing the need for consistent public and private sector standards and definitions across a suite of sharedmobility service models that guide public policy and distinguish between types of services forusers
2. Developing metrics, modeling, planning platforms, and methodologies to measure theeconomic and travel impact of shared mobility such as VMT/VKT, person miles traveled,commute travel time, etc., such that local, state, and federal public agencies can incorporate itas an integral component of land use and transportation planning
3. Recognizing shared mobility as a key component of transportation policy and planning
4. Encouraging multimodal integration
5. Addressing potential accessibility issues as the systems expand and evolve to be inclusive ofall segments of society
6. Understanding insurance issues pertaining to regulation, availability, and affordability across awide array of existing and emerging shared business and service models
7. Balancing data sharing (open data) and privacy for individual users and companies providingthe services.
Source: Thinkstock Photo
Shared Mobility Primer| 62
CONSISTENT PUBLIC AND PRIVATE SECTOR STANDARDS AND DEFINITIONS
Legal definitions of different shared mobility services are essential for mainstreaming such services. Once resolved, they will enable public agencies to clarify policies related to insurance, taxation, rights-of-way, parking, and zoning. In addition to legal issues, there are also challenges related to poor public knowledge and understanding. Consumers are often unaware of the true costs of their travel behavior and as a result may perceive pay-as-you-go transportation costs that are common with shared mobility and unbundled transportation services (e.g., hourly and daily parking charges, per trip fares, and hourly usage rates) as more expensive over the longer term than more traditional transportation-related purchases (e.g., entailing household automobile purchase costs, hidden parking charges bundled with housing costs, and annual insurance premiums), when the opposite is commonly the case. Infrequent costs, such as vehicle purchases, insurance, license fees, smog checks, and maintenance, are often overlooked as consumers make mobility choices. Personal unfamiliarity with shared mobility services, confusion in terminology use among the media, and international discrepancies also contribute to user uncertainty. For example, the term “carsharing” in the United Kingdom refers to the American ridesharing or carpooling model. Car club (often referring to American Automobile Association (AAA) in the United States) is typically used to describe carsharing in Great Britain.
While a number of definitions of shared mobility have been developed to address a variety of public policy issues, there remains no commonly used federal definitions of these services. This results in various definitions across the country, often contributing to confusion over service features and public policies. Further, the blurring of lines between core transportation services and shared mobility can create additional misunderstanding where definitions may need to be developed or revised. For example, the California Public Utilities Commission (CPUC) coined the term transportation network companies and developed the following definition: Transportation Network Companies provide prearranged transportation services for compensation using an online-enabled application or platform (such as smartphone apps) to connect drivers using their personal vehicles with passengers.
This definition captured the market in late-2012/early-2013 when it was developed, but changes in the marketplace exemplify how quickly regulations can become outmoded. For example, the Flywheel app (e-Hail taxi) enables customers to prearrange transportation services (via a taxi) using an online-enabled application to connect drivers with passengers. The result is the driver can conceivably offer taxi and ridesourcing services depending on the regulatory definition being applied. This can become problematic for a variety of reasons, such as taxation and insurance. For example, many jurisdictions apply taxes, fees, and surcharges to taxi fares, but unclear regulatory frameworks have created equally unclear guidance regarding the taxation of app-based for-hire vehicle services.

Shared Mobility Primer| 63
Examples of How Public Agencies May Take Action:
• Develop a Standard Definition for Shared Mobility Modes: The lack of formal definitions can besubstantial barriers to finding partners, encouraging public-private partnerships, and recruitingearly adopters. Public agencies and industry associations can work together to develop clear,concise, and uniform definitions of shared modes.
• Define Models Around Service Characteristics, Not Technologies: Public agencies and private-sector industry associations can address this challenge by working together to develop commondefinitions of service models that are based on service characteristics (rather than technologicalcharacteristics, e.g., apps) of the services being provided.
Sample of Shared Mobility Legislative Definitions
Cambridge, Massachusetts defines a carsharing organization “as a membership-based entity with a distributed fleet of Carsharing Vehicles that charges a use-based fee related to a specific vehicle.” Cambridge further defines a carsharing vehicle as “a private passenger motor vehicle that is made available to multiple authorized users primarily for hourly or other short-term use through a self-service fully automated reservation system, but not by means of a separate written agreement that is entered into each time a vehicle is transferred to a customer. A Carsharing Vehicle may be owned, maintained or administered by a Carsharing Organization or other entity.”
California Public Utility Commission (CPUC) defines transportation network companies (TNCs) as “providing prearranged transportation services for compensation using an online-enabled application or platform (such as smartphone apps) to connect drivers using their personal vehicles with passengers.”
DEVELOPING METRICS, MODELING, PLANNING PLATFORMS, AND METHODOLOGIES TO ASSESS THE ECONOMIC AND TRAVEL IMPACTS OF SHARED MOBILITY
Developing data metrics, models, planning platforms, and formal methodologies to measure the travel and economic impacts of shared mobility is essential for transportation planners and policymakers. Developing these tools will enable public agencies to forecast the economic and travel behavior impacts of shared modes and guide public policy development related to urban and spatial planning, rights-of-way, parking, and zoning. Two key areas that metrics, models, methodologies, and planning platforms can assist with are measuring economic impacts and travel behavior impacts.
Tracking and forecasting the economic impacts of shared mobility is important because of its potential impact on auto sales, fleet savings for governments, monetary savings to individuals and households, and broader industry growth (e.g., annual revenues by industry sector and employment figures).
Shared Mobility Primer| 64
Incorporating shared mobility into Gross Domestic Product (GDP) measures is one way to track and forecast the economic impacts of shared mobility.
GDP was adopted as the global standard for measuring national- and industry-level economic activity at the Bretton Woods Conference in 1944. Fundamentally, GDP is an aggregate measure of the total value of all goods and services produced by a nation within a given year. Gross domestic productivity is undoubtedly increasing, but the nation’s GDP may be underestimated by failing to account for shared products and services exchanged through the Internet and the sharing economy.
How do we capture the productivity gains from new technologies? When an individual makes a vehicle available for rent using a P2P service or a homeowner makes a room available for rent on Airbnb or Craigslist, the economic activity from these transactions are rarely captured by federal agencies, which results in an underestimation in national GDP and sector productivity measures.
How do we capture the productivity gains associated with ultra-low cost and free products and services? The rise of free and freemium service models likely also leads to an underestimation of productivity measures. In the 1980s, people purchased and developed film to take pictures and placed global calls using a landline. Today, people take digital photos, electronically share them, and communicate globally through instant messaging and video chat. These efficiency gains have undoubtedly made Americans more productive, but this is largely unmeasurable because of cashless products and services.
Similarly, because shared mobility is not incorporated into the NHTS, policymakers have very little data on the origins, destinations, and travel patterns of shared mobility consumers. The result is a growing segment of the nation using these services without any way to measure the travel and economic impacts of this sector. As such, it becomes extremely difficult to quantify the impacts of innovative services including shared mobility.
The growth of mega regions coupled with emerging social and technological changes are altering how people travel. Numerous shared modes, such as carsharing, bikesharing, and on-demand ride services, have grown in recent years. Despite this growth, traditional transportation planning methods are unable to accurately capture modal share and the impacts of shared mobility on the broader transportation network. Early four-step planning models have matured into more advanced activity-based modeling. Although planning agencies have embraced activity-based modeling as being more representative of the transportation environment, existing activity-based modeling almost always fails to incorporate shared mobility. Metrics, modeling, planning platforms, and methodologies are needed to help cities, public agencies, and regional governments understand the impacts of shared mobility and better scale and deliver these services in a variety of land-use settings.
An Example of How Public Agencies May Take Action:
• Incorporating Shared Mobility into Activity-Based Models: Developing activity-based planningmodels that incorporate shared mobility can aid public agencies in understanding and responding
Shared Mobility Primer| 65
to the impacts of shared modes. Furthermore, incorporating shared modes into activity-based models can help public agencies and local governments reduce capital and operational expenditures and harness the beneficial transportation and environmental impacts often associated with shared modes.
RECOGNIZING SHARED MOBILITY AS A KEY COMPONENT OF TRANSPORTATION POLICY AND PLANNING
Transportation policy and planning is a complex process that is affected by federal, state, and local legislation, along with multiple stakeholders and public agencies. At the federal level, Title 23 of the Code of Federal Regulations provides guidance for metropolitan transportation planning and identifies eight factors that must be considered as part of the planning process: 1) supporting economic vitality; 2) increasing transportation system safety; 3) increasing transportation system security; 4) increasingaccessibility and mobility; 5) protecting and enhancing the environment; 6) enhancing the integration and connectivity of the transportation system; 7) promoting efficient system management and operation; and 8) emphasizing the preservation of the existing transportation system. Furthermore, regions designated as air quality non-attainment areas have additional planning guidance focused on reducing criteria pollutants to achieve attainment across a wide array of air quality metrics.
Shared mobility modes, such as carsharing, bikesharing, ridesharing, and other services, have not been widely incorporated into local and regional planning processes. Because of the private sector’s involvement in shared mobility, planning frameworks, such as general plans, often fail to incorporate shared mobility even though some jurisdictions have issued RFPs for shared mobility services.
Many non-profits have begun to incorporate shared mobility into private sector planning processes. For example, the U.S. Green Building Council (USGBC), a private non-profit that promotes sustainability in the design and construction of buildings, has incorporated shared mobility into their Leadership in Energy and Environmental Design (LEED) certification program. LEED gives project-level certification credits for the incorporation of carsharing, bikesharing, and ridesharing services into a development project. This can include integrating measures, such as inclusionary carsharing parking, into a building’s design. Incorporating shared mobility into both public and private sector planning processes and programs is key to integrating it into the transportation network and recognizing it as one of a number of potential transportation options available.
Examples of How Public Agencies May Take Action:
• Developer and Zoning Regulations: Local governments may recognize and incorporate sharedmobility into transportation policy and planning through local ordinances, such as: 1) parkingreduction (i.e., downsizing the number of required parking spaces in new developments thatincorporate shared mobility for localities that otherwise insist on maintaining such requirements);2) incentivizing parking substitution (i.e., substituting general-use parking for shared mobilityparking stalls, such as carsharing parking, bikesharing kiosks, ridesourcing loading zones, etc.);
Shared Mobility Primer| 66
and 3) allowing greater floor-to-area ratios (i.e., developers can build more densely on sites that incorporate shared mobility).
• Public Rights-of-Way: Local governments may recognize and incorporate shared mobility into transportation policy and planning through the allocation of public rights-of-way, such as: 1) provisions for on-street parking or loading zones dedicated to shared mobility; 2) provisions for off-street parking (e.g., carsharing, ridesourcing waiting zones); 3) free or reduced cost parking spaces, parking permits, for-hire vehicle permits, and loading zone permits for shared mobility; 4) universal parking permits (i.e., carsharing vehicles can be returned to any on-street location); and 5) formalized processes for allocating public rights-of-way.
• Incorporating Shared Mobility into Local Planning Models, Plans, and Processes: Incorporating shared mobility into local transportation models, circulation schemes, general plans, and planning processes is another way local governments can include shared modes in transportation policy and planning.
City of Evanston’s Carsharing Parking Reduction Zoning Regulation: A Case Study
The City of Evanston, a north Chicago suburb maintains a carsharing parking reduction clause in its zoning code for the inclusion of carsharing at development sites. Specifically, the code permits a reduction in the minimum number of required parking spaces for projects that require at least five off-street parking stalls and provide at least one on-site carsharing parking space. Developers are permitted a reduction of one space for projects requiring five to 10 parking spaces. For projects entailing more than 10 off-street parking spaces, a parking reduction of 10 percent is permitted for the inclusion of carsharing. To be eligible, the developer must present a long-term lease with the carsharing operator and a description of carsharing services provided. Additionally, the property owner/developer must record with their deed a document that stipulates: In the event that carsharing services are no longer provided, the property owner will be required “to increase the amount of off-street parking by the reduction granted or be assessed a fee equal to that assessed a project that reduced on-street metered parking by that number of spaces in that location.”
Shared Mobility Primer| 67
Case Study of San Francisco’s High-Tech Company Shuttle Pilot Program
In January 2014, the San Francisco Municipal Transportation Agency (SFMTA) announced an 18-month pilot to enable participating high-tech company shuttles to share use of a limited number of pre-approved Muni (public) bus zones. As part of the pilot program: • Eight percent (200 of 2,500) of Muni bus stops are shared by Muni and private shuttle operators;• SFMTA charges the shuttle operator (or employer) $3.67 per shuttle, per each stop made. The fee is
meant to cover the costs associated with the administration and program enforcement;• Private shuttle providers must comply with agreed-upon guidelines, which include yielding to Muni
buses and pulling to the front of bus zones to maximize boarding zone capacity;• Each shuttle is issued placards to aid in program enforcement; and• Shuttle providers must agree to share data with SFMTA to support transportation network
management, planning, and enforcement.
(San Francisco Municipal Agency, 2015)
ENCOURAGING MULTIMODAL INTEGRATION
Multimodal integrationthe seamless connectivity among different transportation modesis recognized as a best practice to support sustainability and encourage public transit ridership. This entails integration of mass transportation modes with one another and with first-and-last-mile services, such as taxis; walking; cycling; and the shared modes of carsharing, bikesharing, ridesharing, ridesourcing, and microtransit. Achieving multimodal integration requires three key components—infrastructure integration, information integration, and fare integration.
Infrastructure integration involves the physical and operational connection of modes. In the context of shared mobility, this could include co-locating carsharing and bikesharing with public transportation stops. Information integration is the incorporation of information systems to provide one-stop information sources for service features, such as routing, time tables, and fares. At its most basic level, information integration includes multimodal trip planners. More advanced information integration may include real-time information services, such as modal connection information (e.g., NextBus). Finally, fare integration involves the development of a single fare payment method across multiple modes.

Shared Mobility Primer| 68
Future Trends Impacting Multi-Modal Fare Integration
In recent years, information integration has also become fairly prevalent. Open source data are increasingly allowing mobility consumers to go online or download an app to plan multi-modal journeys, compare costs, and obtain a wide-array of real-time information services, such as vehicle/bicycle availability and public transit delays. Fare integration continues to remain a key challenge. For example, HOURCAR and Metro Transit in the Twin Cities have a partnership that allows carsharing members to use their Go-To transit cards to access HOURCAR vehicles. Emerging mobile payment technologies, such as Apple Pay, Visa’s PayWave; MasterCard’s PayPass; American Express’ ExpressPay; and peer-to-peer cryptocurrencies, such as “Bitcoins,” may be able to bridge the multi-modal fare gap alleviating the need for a wallet full of mobility fare, membership cards, and key fobs. Many of these solutions provide contactless digital wallet services without the need to physically swipe or insert a credit or debit card at the point-of-sale. Bitcoin, a peer-to-peer digital currency, enables users to engage in monetary transactions without a central intermediary. In the future, strong inter-agency and public-private partnerships will likely be key to achieving full multi-modal integration.
ENSURING ACCESSIBILITY TO AND EQUITY OF SHARED MODES FOR ALL TRANSPORTATION USERS
Shared mobility options that provide first-and-last-mile solutions can greatly improve quality of life for low-income households, which are generally disproportionately dependent on public transit. Offering convenient, accessible, and affordable shared mobility options may make it easier to meet the mobility and accessibility needs of low-income and other disadvantaged communities. Because many shared mobility services are provided by the private sector, ensuring service access in low-income and minority neighborhoods and ADA compliance for disabled access can be a key concern. (See below for a case study on the challenges of ADA mobility in New York City.) As discussed in Chapter 4, other innovative programs, such as Capital Bikeshare’s Bank on DC program, aim to develop partnerships between shared mobility providers and banks to provide debit card access in addition to credit card access, which is currently required for bikesharing use (Capital Bikeshare, 2015).
It is important that the public and private sector work together to ensure that all people have access to shared mobility regardless of race, color, or national origin (Title VI requirements defined by the Civil Rights Act of 1964) and disability, age, or income. Everyone should have access to services, the opportunity to participate in decisions regarding the placement of these services, and the right to participate in a host of related public policy decisions. Public agencies should ensure policies protect against “unjustified disparate impact discrimination” or policies and practices that appear to be neutral but in effect are discriminatory against protected classes. Public agencies should work toward achieving the following key accessibility and social equity goals with respect to shared mobility:

Shared Mobility Primer| 69
• Encourage fair placement and access to shared mobility across all socio-economic levels andminority neighborhoods
• Foster the participation of individuals affected by shared mobility services in transportationplanning and decision-making processes
• Encourage access of shared mobility services to minority, disabled, and low-income populations
• Develop policies that bridge the digital divide, either by making digital services more accessibleand affordable to low-income populations or by offering viable alternatives for digital-only or app-exclusive services.
Public agencies should also ensure that other vulnerable populations outside of statutory protected classes have access to shared mobility. Vulnerable populations may include:
• Senior citizens
• Populations without access to private automobiles
• Single-parent households
• Populations with housing costs in excess of one-third of household income
• Adult populations without a high school diploma
• Populations that do not speak English.
All of these groups may face mobility challenges for a variety of reasons.
Challenges of Americans with Disabilities Act (ADA) Mobility in New York City
In July 2008, New York’s Taxi and Limousine Commission began a two-year pilot program to assess demand for wheelchair-accessible taxicabs (Taxi and Limousine Commission, n.d.). Its report, published in 2010 includes statistics on the state of ADA compliance in New York City. Key findings include:
Subway: In New York City, the Metropolitan Transit Authority (MTA) operates 230 miles (370 km) of rail service with 490 stations. As of 2010, only 16 percent (78 of 490) of stations were fully wheelchair accessible and offered features to assist customers with visual, auditory, and mobility impairments in compliance with the ADA. Because the majority of subway stations are not wheelchair accessible, many wheelchair users in New York City are simply unable to use the subway system

Shared Mobility Primer| 70
Challenges of Americans with Disabilities Act (ADA) Mobility in New York City
Bus: MTA also operates 6,000 buses on 300 bus routes throughout New York City. As of 2010, MTA’s entire bus fleet was wheelchair accessible, and the majority of the fleet was equipped with a kneeling feature (that lowers the bus for easier access and egress) to assist customers with impaired mobility. Approximately 94 percent of the city is within ½ mile (.8 km) of a MTA bus stop.
Flexible Transit Service: MTA operates a flexible transit service, known as Access-A-Ride. As of 2010, MTA’s Access-A-Ride service provided 7.3 million rides to 142,000 users. However, as of 2010, only 72 percent of the Access-A-Ride vehicles were wheelchair accessible. The remaining 28 percent of the fleet was comprised of Crown Victoria sedans.
Taxis: As of 2010, 1.8 percent (240 of 13,237) of the taxis in New York City were wheelchair accessible or approximately 1 out of 55 taxicabs. In 2004, the city’s Taxi and Limousine Commission began issuing reduced-cost medallions for wheelchair accessible taxis to encourage ADA-available taxicabs.
For-Hire Livery Services: As of 2010, only six of the 36,000 for-hire livery vehicles in New York City were wheelchair accessible.
Examples of How Public Agencies May Take Action:
• Employ Multilingual Marketing Materials: Multilingual marketing, apps, and websites are one waythat public agencies and shared mobility providers can meet the mobility needs of individuals andhouseholds with language barriers. Shared mobility operators can also form funding, joint-marketing, risk sharing, and other partnerships with public and private stakeholders. Additionalresearch can aid public-private partnerships in identifying areas where new services indisadvantaged communities can be most successful.
• Explore Policies to Mainstream Services: The public and private sectors may work together todevelop policies and programs that mainstream shared mobility to special needs populations.Examples many include incentives, tax credits, pilot programs, discounts, etc.
• Develop Strategies that Address the Digital Divide: The public and private sectors may worktogether to develop mechanisms for addressing the digital divide. For example, the use of kiosksand screens to aid in routing and to display travel information may be one mechanism for ensuringpopulations without smartphones still have access to key travel information.
Shared Mobility Primer| 71
Case Study of How Paratransit, Microtransit, and Ridesourcing Can Be Applied to Meet the Accessibility Needs of Special Populations
Paratransit services have historically played a critical role in bridging mobility gaps for disabled populations. Innovative mobility services, such as Bridj, a shuttle operator that uses real-time information to generate shuttle routes, and a variety of for-hire vehicle services, may be able to serve special needs populations. For example, Lift Hero in San Francisco allows users to hail for-hire vehicle services with specially trained medical professionals, and Shuddle also in San Francisco provides paratransit services for children through the use of licensed childcare providers (Wagstaff, 2014). UberX, a ridesourcing company, has launched services that allow users to request a wheelchair accessible vehicle. UberASSIST is another service with specially trained drivers that aid riders into and out of vehicles and manage wheelchairs, walkers, and scooters. Taxis also provide these services.
A Study of Equity Issues by the San Francisco County Transportation Authority (SFCTA)
SFCTA recently conducted an equity analysis that identified three key disparities in San Francisco County: • Banking: SFCTA found that 5.7 percent of San Francisco households are unbanked and 13.6 percent
of households are underbanked. • Technology: The SFCTA study identified that less than half of low-income Californians have a
smartphone; and • Information and Access: The SFCTA study found that low-income ridesourcing users are
underrepresented in San Francisco.
Source: Shaheen, Christensen, & Tierney, 2015
City CarShare’s Programs for Special Needs Populations: A Case Study
San Francisco-based non-profit City CarShare offers a number of innovative programs meant to enhance transportation access to special needs populations. Founded in 2001, City CarShare is the nation’s largest non-profit carsharing program with over 60 percent of its fleet located in designated low- to moderate-income neighborhoods. In 2008, City CarShare partnered with the City of Berkeley to create AccessMobile, the nation’s first wheelchair accessible carsharing vehicle.
In addition to AccessMobile, the operator’s CommunityShare program offers subsidized membership fees and driving costs for low- to moderate-income members referred to City CarShare by one of seven local partners. In December 2014, City CarShare announced it would expand its low-income, ADA, and electric vehicle programs in collaboration with the Contra Costa Transportation Authority, the Bay Area Climate Collaborative, and the Metropolitan Transportation Commission under a new program, called CarShare4All.
Shared Mobility Primer| 72
INSURANCE REGULATIONS, AVAILABILITY, AND AFFORDABILITY
Insurance remains a key challenge for many shared mobility operators. In the early years of carsharing, cost and insurance availability were notable challenges. As carsharing grew, insurance became more widely available and affordable. Concerns over the cost and availability of insurance partially focused on special populations, such as younger adults (college students). Allowing younger adults (ages 18 to 25) to use carsharing was critical to the development of the now very large college/university campus carsharing market.
Insurance has been a consistent challenge with the launch of innovative shared modes and service models. The advent of P2P carsharing, or short-term access to privately owned vehicles, in around 2010 brought new challenges. Early P2P vehicle sharing owners confronted the risk of canceled personal automobile insurance policies or the reclassification (and repricing) of their policies for commercial vehicle use. Three states (California, Oregon, and Washington) enacted legislation to address these challenges. As a result, all three states require commercial insurance coverage when a personal vehicle is being rented out and prohibit cancellation of (or other lesser consequences related to) personal lines of insurance for vehicle owners who sometimes make their vehicles available through a P2P carsharing service. For the vast majority of the country, however, these challenges have not been addressed by legislation, leaving P2P vehicle sharing owners susceptible to coverage cancellation or reclassification.
Case Study of California Assembly Bill 1871
California Assembly Bill (AB) 1871 prohibits private motor vehicles from being classified for insurance purposes as commercial vehicles when used in a personal vehicle sharing program. AB 1871 also limits the circumstances in which a vehicle owner’s personal automobile insurance is subject to liability and prohibits such policies from being canceled, voided, terminated, rescinded, or not renewed solely on the basis that the vehicle is made available in a personal vehicle sharing program.
Source: Gorenflo, 2010
A number of insurance challenges associated with ridesourcing and P2P carsharing remain. Personal auto insurers are often concerned that for-hire and P2P vehicle services translate to increased risk from: 1) additional VMT/VKT and/or additional drivers; 2) geographic hazards associated with urban locations because ridesourcing and P2P carsharing services are often marketed in high-traffic urban centers; 3) unfamiliar roadways (either for ridesourcing drivers or P2P renters); 4) driver distraction associated with ridesourcing apps; 5) higher vehicle occupancy translating into more people that can be injured, if a collision occurs; and 6) pressure-based risk factors associated with rushing to accept matches and pick up passengers (in the ridesourcing context) or to return a carsharing vehicle to avoid
Shared Mobility Primer| 73
additional time-based fees, although traditional car rental and carsharing include this same risk (National Association of Insurance Commissioners, 2015).
BALANCING DATA SHARING WITH PRIVACY
The lack of data on emerging travel options as part of the NHTS makes it difficult to understand the size and impact of shared mobility on the broader transportation network. This lack of understanding also makes it challenging to incorporate the services into planning processes and to identify service and accessibility gaps in the transportation network. Sharing of shared mobility data (either publicly or with public agencies), where such data do exist, is an important strategy that can be used to overcome these challenges.
Shared mobility operators typically track several important key data points—the origin and destination of shared services (e.g., the pickup and return location for a carsharing vehicle, bikesharing bicycle, or ridesourcing passenger); travel time; and trip duration. A number of shared mobility service providers have shared data with public agencies either voluntarily or as part of a regulatory mandate. Chapter 4 of this primer highlighted a few of these data-sharing efforts.
Industry-wide research cooperation, either through trade associations or through governmental regulation, can aid in the development of clear and consistent data standards, data sharing protocols, and privacy protections to ensure open data, protection of consumer and proprietary operator data, interoperability, and comparability across a wide array of platforms.
Case Study of California Assembly Bill 83 Personal Data (Proposed)
In January 2015, California State Assembly Member Gatto introduced an information practices and personal data protection bill. The bill (pending as of July 2015) requires businesses to enhance privacy standards for the storage of all personal information including: social security numbers, driver’s license numbers, financial information, medical information, and geolocation travel information. The bill provides specific protections to geophysical location information, including “any location data generated to assess the past or current location of, or travel by, an individual, including, but not limited to, geographic coordinates, street address, or WiFi positioning system.” Finally, the bill also requires that businesses take measures to identify and respond to “foreseeable” internal and external privacy risks. As of Summer 2015, the bill has failed to pass California’s Senate Judiciary Committee as amended.
Source: Gatto, 2015
Shared Mobility Primer| 74
Case Study of the City of Boston and Uber Data Sharing Agreement
In January 2015, the City of Boston entered into an agreement with Uber to share anonymized metadata including: zip code origins and destinations, distance traveled, duration time, and trip date and time. Public-private partnerships to share travel data can assist public agencies to better understand the impacts of shared mobility and assist local governments with their transportation policy and planning.
CONCLUSION
Shared mobility is a transportation strategy that planners might consider to support municipal and regional transportation and land use goals related to congestion and parking mitigation; air quality improvement and reduction of GHGs, particulate, and criteria pollutant emissions; and “smart city” and sustainable design initiatives. Although numerous challenges exist and understanding of the impacts is still limited, this chapter covered some of the best practices, lessons learned, and proposed solutions from across the United States.
Key takeaways include:
• Shared mobility is an emerging area that is continuing to evolve and change. Thus, this primer represents a starting point in this evolutionary process as typologies and definitions, public policy, and best practices will continue to develop.
• There is a need for consistent public and private sector standards and definitions.
• Metrics and models should be developed to assess the economic and travel impacts associated with shared mobility.
• It is important to recognize the role of shared mobility in transportation and incorporate it, as appropriate, into transportation policy and planning.
• Multimodal integration is a key strategy for providing seamless transportation options, including shared mobility.
• It is critical to ensure accessibility to and equity of shared modes for transportation users.
• Insurance is a key component of shared mobility and should be accessible and affordable for shared mobility consumers and operators.
• It is crucial to balance data-sharing needs with consumer protection, while at the same time recognizing proprietary considerations.
Shared Mobility Primer| 75
REFERENCES
Capital Bikeshare. (2015). Bank on DC. Retrieved from Capital Bikeshare: https://www.capitalbikeshare.com/bankondc
Gatto, M. (2015, July 15). Assembly Bill No. 83. Retrieved from California Legislative Information: http://leginfo.legislature.ca.gov/faces/billTextClient.xhtml?bill_id=201520160AB83
Gorenflo, N. (2010, September 29). California's P2P Car-sharing Bill Signed Into Law. Retrieved from Shareable: http://www.shareable.net/blog/californias-p2p-car-sharing-bill-signed-into-law
National Association of Insurance Commissioners. (2015). Transportation Network Company Insurance Principles for Legislators and Regulators. Kansas City: National Association of Insurance Commissioners.
San Francisco Municipal Transportation Agency. (2015, October 19). SFMTA Proposes New Shuttle Rules. Retrieved December 15, 2016, from https://www.sfmta.com/about-sfmta/blog/sfmta-proposes-new-shuttle-rules
Tierney, G., Shaheen, S., and Christensen, C. (2015, February 18) Crossing the Digital and Income Divide: Making Mobility Innovations Accessible to All. Agrion Smart Cities Series Workshop Summary.
Wagstaff, K. (2014, February 17). Uber for kids: Shuddle wants to shuttle your children. Retrieved from NBC News: http://www.today.com/money/uber-kids-shuddle-wants-shuttle-your-children-1D80240006

Shared Mobility Primer| 76
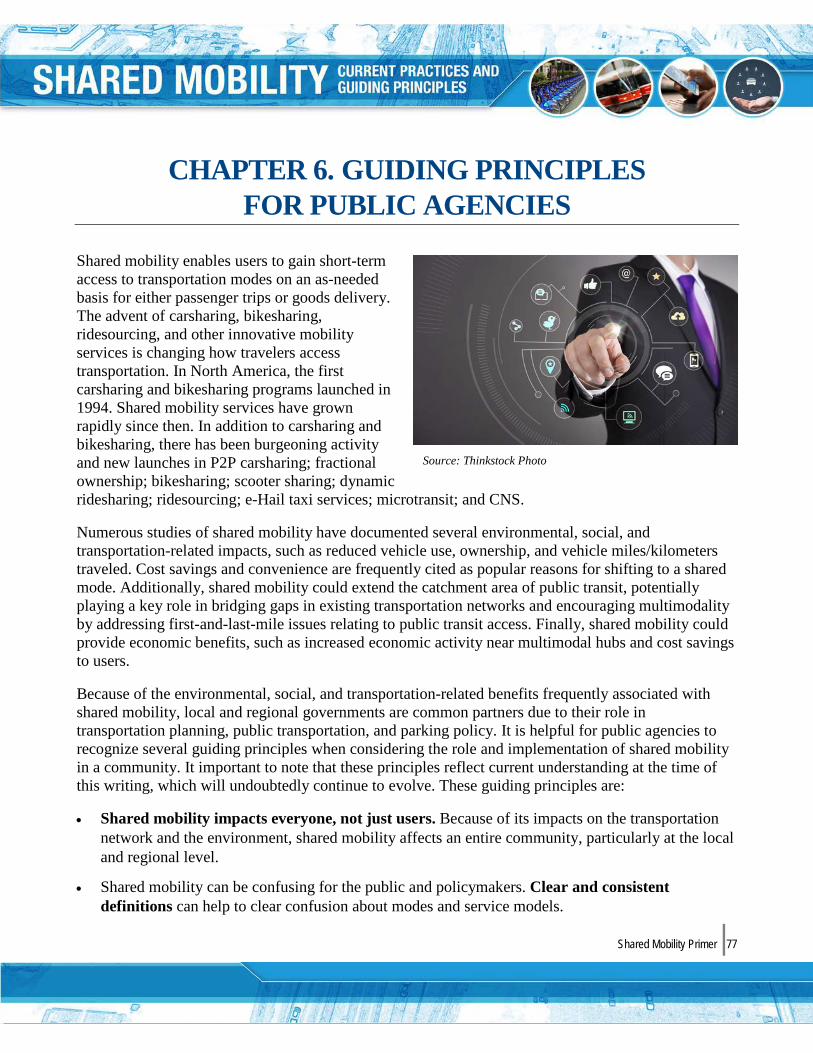
Shared Mobility Primer| 77
CHAPTER 6. GUIDING PRINCIPLES FOR PUBLIC AGENCIES
Shared mobility enables users to gain short-term access to transportation modes on an as-needed basis for either passenger trips or goods delivery. The advent of carsharing, bikesharing, ridesourcing, and other innovative mobility services is changing how travelers access transportation. In North America, the first carsharing and bikesharing programs launched in 1994. Shared mobility services have grown rapidly since then. In addition to carsharing and bikesharing, there has been burgeoning activity and new launches in P2P carsharing; fractional ownership; bikesharing; scooter sharing; dynamic ridesharing; ridesourcing; e-Hail taxi services; microtransit; and CNS.
Numerous studies of shared mobility have documented several environmental, social, and transportation-related impacts, such as reduced vehicle use, ownership, and vehicle miles/kilometers traveled. Cost savings and convenience are frequently cited as popular reasons for shifting to a shared mode. Additionally, shared mobility could extend the catchment area of public transit, potentially playing a key role in bridging gaps in existing transportation networks and encouraging multimodality by addressing first-and-last-mile issues relating to public transit access. Finally, shared mobility could provide economic benefits, such as increased economic activity near multimodal hubs and cost savings to users.
Because of the environmental, social, and transportation-related benefits frequently associated with shared mobility, local and regional governments are common partners due to their role in transportation planning, public transportation, and parking policy. It is helpful for public agencies to recognize several guiding principles when considering the role and implementation of shared mobility in a community. It important to note that these principles reflect current understanding at the time of this writing, which will undoubtedly continue to evolve. These guiding principles are:
• Shared mobility impacts everyone, not just users. Because of its impacts on the transportationnetwork and the environment, shared mobility affects an entire community, particularly at the localand regional level.
• Shared mobility can be confusing for the public and policymakers. Clear and consistentdefinitions can help to clear confusion about modes and service models.
Source: Thinkstock Photo
Shared Mobility Primer| 78
• Public agencies should embrace public and private collaboration. Public-private partnerships can lead to a stronger, more robust transportation network that contributes to access, livability, and quality of life.
• Public participation is key. It is important to inform and involve the public in planning processes and to listen to the public’s concerns in implementing shared mobility services.
• Public agencies should collect data and consider compulsory reporting requirements. Data are critical to understanding and managing the impacts of shared mobility on the transportation network. Public agencies should establish data repositories and collect data to evaluate impacts and system performance. Public agencies may consider requiring data reporting by the private sector for this purpose.
• Incorporate shared mobility into transportation planning. Transportation planners and policymakers should incorporate shared mobility into models and plans, particularly in light of their potential impacts on the transportation ecosystem and land use in the future (e.g., reduced auto ownership).
• Transportation should be accessible and equitable. People are entitled to reasonable access to transportation services. Public agencies should ensure social, interregional, and intergenerational equity to meet the basic transportation needs of travelers.
• Shared mobility continues to evolve and tracking these developments and its growth and impacts is important in managing these emerging services and developing sound policies for managing rights-of-way and public-private partnerships.
Shared mobility is having notable impacts on many cities by enhancing transportation accessibility, increasing multimodality, reducing vehicle ownership and VMT/VKT (in some circumstances), and providing new ways to access goods and services. In the future, the growth and mass marketing of automated vehicles (AVs) will likely impact all aspects of the surface transportation network. The uncertainty associated with AV impacts on user sociodemographics, VMT/VKT, modal shift, and land use make these new technologies challenging to model and understand. Although some forms of shared mobility (e.g., bikesharing) will likely remain more common in urban environments, shared AVs could result in notable growth beyond cities into suburban and rural locations. In the future, AV services could also greatly improve road safety and enhance mobility options for special needs populations, such as children, older adults, and lower-income populations. While many of the shared modes discussed in this primer could address a range of sustainability goals, more research is neededparticularly on the city and regional level and across the growing ecosystem of shared mobility services. While shared mobility holds promise for addressing a number of social and environmental goals, it is important to note that policy challenges remain in mainstreaming these strategies and ensuring public safety, adequate insurance, and fair labor practices, depending on the service model.
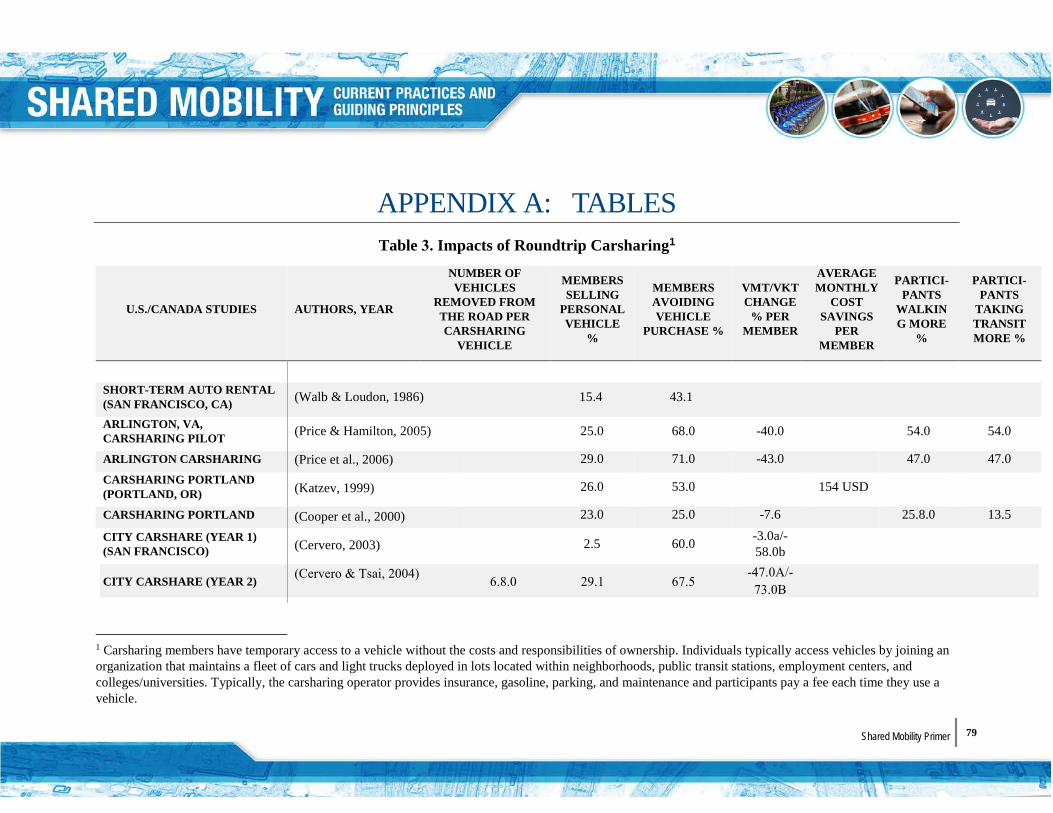
APPENDIX A: TABLES Table 3. Impacts of Roundtrip Carsharing1
U.S./CANADA STUDIES AUTHORS, YEAR
NUMBER OF VEHICLES
REMOVED FROM THE ROAD PER CARSHARING
VEHICLE
MEMBERS SELLING
PERSONAL VEHICLE
%
MEMBERS AVOIDING VEHICLE
PURCHASE %
VMT/VKT CHANGE
% PER MEMBER
AVERAGE MONTHLY
COST SAVINGS
PER MEMBER
PARTICI-PANTS
WALKING MORE
%
PARTICI-PANTS
TAKING TRANSIT MORE %
SHORT-TERM AUTO RENTAL (SAN FRANCISCO, CA) (Walb & Loudon, 1986) 15.4 43.1
ARLINGTON, VA, CARSHARING PILOT 25.0 68.0 -40.0 54.0 54.0
ARLINGTON CARSHARING 29.0 71.0 -43.0 47.0 47.0 CARSHARING PORTLAND (PORTLAND, OR) 26.0 53.0 154 USD
CARSHARING PORTLAND 23.0 25.0 -7.6 25.8.0 13.5
CITY CARSHARE (YEAR 1) (SAN FRANCISCO) 2.5 60.0 -3.0a/-
58.0b
CITY CARSHARE (YEAR 2)
(Price & Hamilton, 2005)
(Price et al., 2006)
(Katzev, 1999)
(Cooper et al., 2000)
(Cervero, 2003)
(Cervero & Tsai, 2004) 6.8.0 29.1 67.5 -47.0A/-
73.0B
1 Carsharing members have temporary access to a vehicle without the costs and responsibilities of ownership. Individuals typically access vehicles by joining an organization that maintains a fleet of cars and light trucks deployed in lots located within neighborhoods, public transit stations, employment centers, and colleges/universities. Typically, the carsharing operator provides insurance, gasoline, parking, and maintenance and participants pay a fee each time they use a vehicle.
Shared Mobility Primer 79 |

Shared Mobility Primer | 80
U.S./CANADA STUDIES AUTHORS, YEAR
NUMBER OF VEHICLES
REMOVED FROM THE ROAD PER CARSHARING
VEHICLE
MEMBERS SELLING
PERSONAL VEHICLE
%
MEMBERS AVOIDING VEHICLE
PURCHASE %
VMT/VKT CHANGE
% PER MEMBER
AVERAGE MONTHLY
COST SAVINGS
PER MEMBER
PARTICI-PANTS
WALKING MORE
%
PARTICI-PANTS
TAKING TRANSIT MORE %
CITY CARSHARE (YEAR 4) (Cervero et al., 2007) -
67.0a/24.0b
PHILLYCARSHARE (PHILADELPHIA, PA) (Lane, 2005) 10.8c 24.5 29.1 -42.0 172 USD
TCRP REPORT (NATIONAL) (Millard-Ball et al., 2005) -63.0 37.0 40.0 UC BERKELEY (U.S. AND CANADA) (Martin & Shaheen, 2010) 9.0-13.0 33.0 25.0
UC BERKELEY (U.S. AND CANADA) (Martin et al., 2010) -27.0 12.0 22.0d
ZIPCAR (NATIONAL) (Zipcar, 2005) 20.0 32.0 39.0 -79.8 435 USD 37.0 40.0 CANADIAN STUDIES
AUTOSHARE (TORONTO, CANADA) (Shaheen, et al., 2010) 6.0–8.0 15.0 25.0 392 CAD
AUTOSHARE (TORONTO) (Shaheen, et al., 2010) 8.0–10.0 COMMUNAUTO (QUEBEC, CANADA) (Benoit, 2000) 9.1 21.0–29.0 55.0–61.0
COMMUNAUTO (QUEBEC, CANADA) (Dallaire et al., 2006) 4.6c 24.0 53.0 492 CAD 12.0–13.0 26.0–34.0
aReflects existing members’ reduction in vehicle miles traveled/vehicle kilometers traveled (VMT/VKT). bReflects only trial members’ reduction in VMT/VKT. cReflects vehicles removed by members who gave up a car.
Shared Mobility Primer | 81
dReflects 13% of respondents who decreased bus usage and 9% who decreased rail usage.
References
Benoit, R. (2000). Potentiel de L’Auto-Partage Dans Le Cadre d’Une Politique de Gestion de La Demande en Transport. Forum de L'AQTR, Gaz à Effet de Serre: Transport et Développement, Kyoto: Une Opportunité d’Affaires?
Cervero, R. (2003). City CarShare: First-Year Travel Demand Impacts. Transportation Research Record, 159-166.
Cervero, R., & Tsai, Y. (2004). City CarShare in San Francisco, California: Second-Year Travel Demand and Car Ownership Impacts. Transportation Research Record, 117-127.
Cervero, R., Golub, A., & Nee, B. (2007). City Carshare: Longer-Term Travel Demand and Car Ownership Impact. Transportation Research Record, 70–80.
Cooper, G., Howe, D., & Mye , P. (2000). The Missing Link: An Evaluation of CarSharing Portland Inc. Portland, Oregon. Portland: Oregon Department of Environmental Quality.
Dallaire , Y., Lafond , N., Lanoix , C., & Viviani , M. (2006). Le projet auto + bus: Évaluation d'initiatives de mobilité combinée dans les villes canadiennes. Montreal: Tecsult Inc.
Katzev, R. (1999). Carsharing Portland: Review and Analysis of Its First Year. Portland: Department of Environmental Quality.
Lane, C. (2005). PhillyCarShare: First-Year Social and Mobility Impacts of Carsharing in Philadelphia, Pennsylvania. Transportation Research Record, 158-166.
Martin, E., & Shaheen, S. (2010). Greenhouse Gas Emission Impacts of Carsharing in North America. San Jose: Mineta Transportation Institute.
Martin, E., Shaheen, S., & Lidicker, J. (2010). Impact of Carsharing on Household Vehicle Holdings: Results from a North American Shared-Use Vehicle Survey. Transportation Research Record, 150–158.
Shared Mobility Primer | 82
Millard-Ball, A., ter Schure, J., Fox, C., Burkhardt, J., & Murray, G. (2005). Car-Sharing: Where and How It Succeeds. Washington, D.C.: Transportation Research Board.
Price, J., & Hamilton, C. (2005). Arlington Pilot Carshare Program. Arlington: Arlington County Commuter Services, Division of Transportation.
Price, J., DeMaio, P., & Hamilton, C. (2006). Arlington Carshare Program. Arlington: Arlington County Commuter Services, Division of Transportation.
Shaheen, S., Cohen, A., & Chung, M. (2010). North American Carsharing: A Ten-Year Retrospective. Transportation Research Record 09-3688, 35–44.
Walb, C., & Loudon, W. (1986). Evaluation of the Short-Term Auto Rental (STAR) Service in San Francisco, CA. Washington D.C.: Urban Mass Transportation Administration. Office of Technical Assistance.
Zipcar. (2005, July 31). Zipcar Customer Survey Shows Car-Sharing Leads to Car Shedding. Retrieved from Zipcar: http://www.zipcar.com/press/releases/press-2
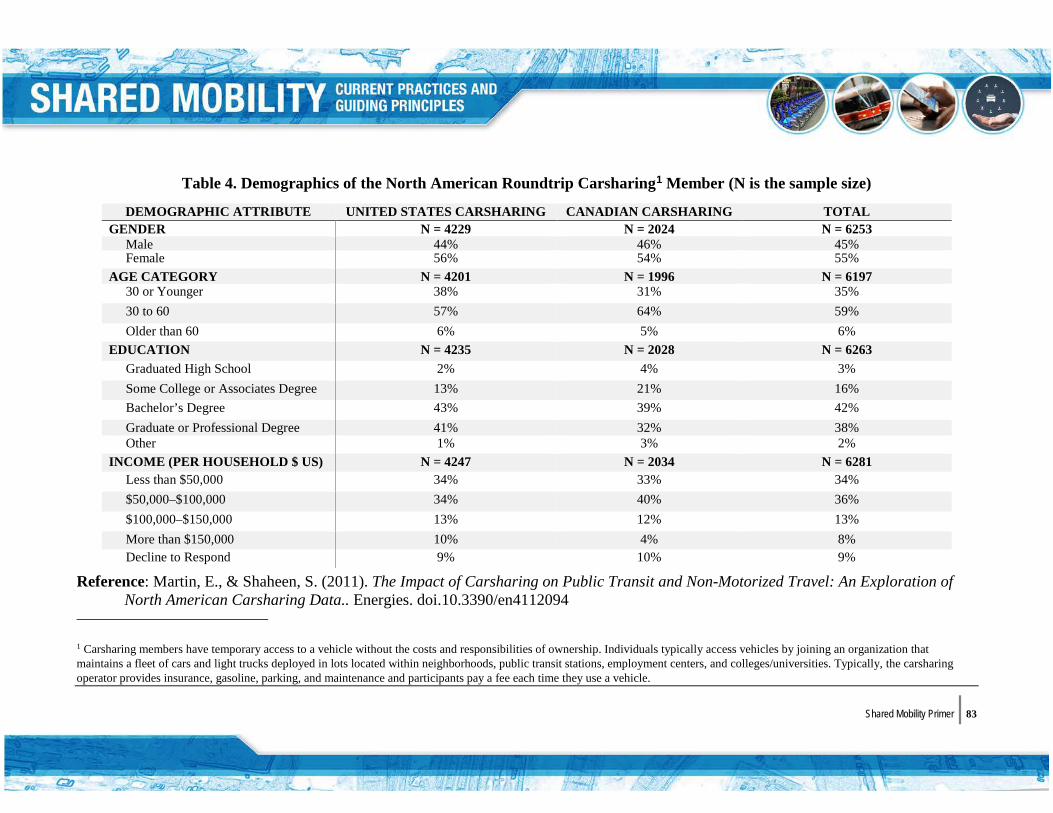
Shared Mobility Primer | 83
Table 4. Demographics of the North American Roundtrip Carsharing1 Member (N is the sample size)
DEMOGRAPHIC ATTRIBUTE UNITED STATES CARSHARING CANADIAN CARSHARING TOTAL GENDER N = 4229 N = 2024 N = 6253
Male 44% 46% 45% Female 56% 54% 55%
AGE CATEGORY N = 4201 N = 1996 N = 6197 30 or Younger 38% 31% 35% 30 to 60 57% 64% 59% Older than 60 6% 5% 6%
EDUCATION N = 4235 N = 2028 N = 6263 Graduated High School 2% 4% 3% Some College or Associates Degree 13% 21% 16% Bachelor’s Degree 43% 39% 42% Graduate or Professional Degree 41% 32% 38% Other 1% 3% 2%
INCOME (PER HOUSEHOLD $ US) N = 4247 N = 2034 N = 6281 Less than $50,000 34% 33% 34% $50,000–$100,000 34% 40% 36% $100,000–$150,000 13% 12% 13% More than $150,000 10% 4% 8% Decline to Respond 9% 10% 9%
Reference: Martin, E., & Shaheen, S. (2011). The Impact of Carsharing on Public Transit and Non-Motorized Travel: An Exploration of North American Carsharing Data.. Energies. doi.10.3390/en4112094
1 Carsharing members have temporary access to a vehicle without the costs and responsibilities of ownership. Individuals typically access vehicles by joining an organization that maintains a fleet of cars and light trucks deployed in lots located within neighborhoods, public transit stations, employment centers, and colleges/universities. Typically, the carsharing operator provides insurance, gasoline, parking, and maintenance and participants pay a fee each time they use a vehicle.
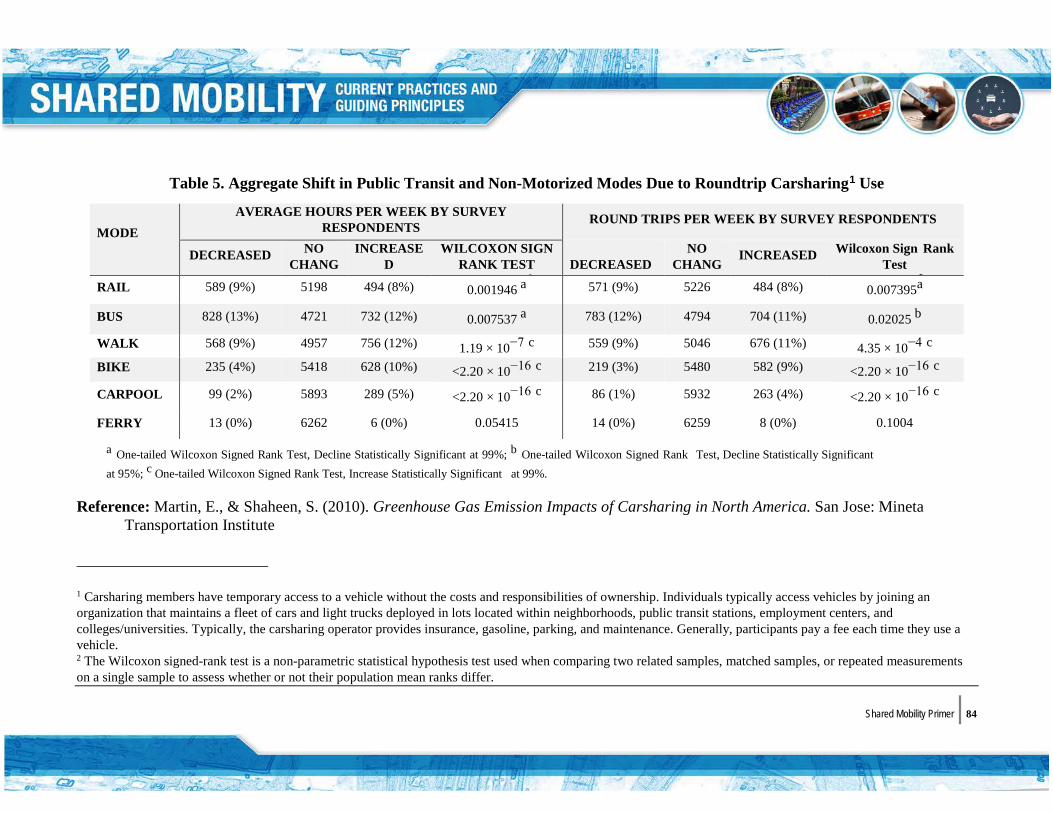
Shared Mobility Primer | 84
Table 5. Aggregate Shift in Public Transit and Non-Motorized Modes Due to Roundtrip Carsharing1 Use
MODE
AVERAGE HOURS PER WEEK BY SURVEY RESPONDENTS ROUND TRIPS PER WEEK BY SURVEY RESPONDENTS
DECREASED NO CHANG
INCREASED
WILCOXON SIGN RANK TEST
2
DECREASED
NO CHANG
INCREASED Wilcoxon Sign Rank Test
2 RAIL 589 (9%) 5198 494 (8%) 0.001946 a 571 (9%) 5226 484 (8%) 0.007395a
BUS 828 (13%) 4721 732 (12%) 0.007537 a 783 (12%) 4794 704 (11%) 0.02025 b
WALK 568 (9%) 4957 756 (12%) 1.19 × 10⁻⁷ c 559 (9%) 5046 676 (11%) 4.35 × 10⁻⁴ c BIKE 235 (4%) 5418 628 (10%) <2.20 × 10⁻¹⁶ c 219 (3%) 5480 582 (9%) <2.20 × 10⁻¹⁶ c
CARPOOL 99 (2%) 5893 289 (5%) <2.20 × 10⁻¹⁶ c 86 (1%) 5932 263 (4%) <2.20 × 10⁻¹⁶ c
FERRY 13 (0%) 6262 6 (0%) 0.05415 14 (0%) 6259 8 (0%) 0.1004
a One-tailed Wilcoxon Signed Rank Test, Decline Statistically Significant at 99%; b One-tailed Wilcoxon Signed Rank Test, Decline Statistically Significant at 95%; c One-tailed Wilcoxon Signed Rank Test, Increase Statistically Significant at 99%.
Reference: Martin, E., & Shaheen, S. (2010). Greenhouse Gas Emission Impacts of Carsharing in North America. San Jose: Mineta Transportation Institute
1 Carsharing members have temporary access to a vehicle without the costs and responsibilities of ownership. Individuals typically access vehicles by joining an organization that maintains a fleet of cars and light trucks deployed in lots located within neighborhoods, public transit stations, employment centers, and colleges/universities. Typically, the carsharing operator provides insurance, gasoline, parking, and maintenance. Generally, participants pay a fee each time they use a vehicle. 2 The Wilcoxon signed-rank test is a non-parametric statistical hypothesis test used when comparing two related samples, matched samples, or repeated measurements on a single sample to assess whether or not their population mean ranks differ.
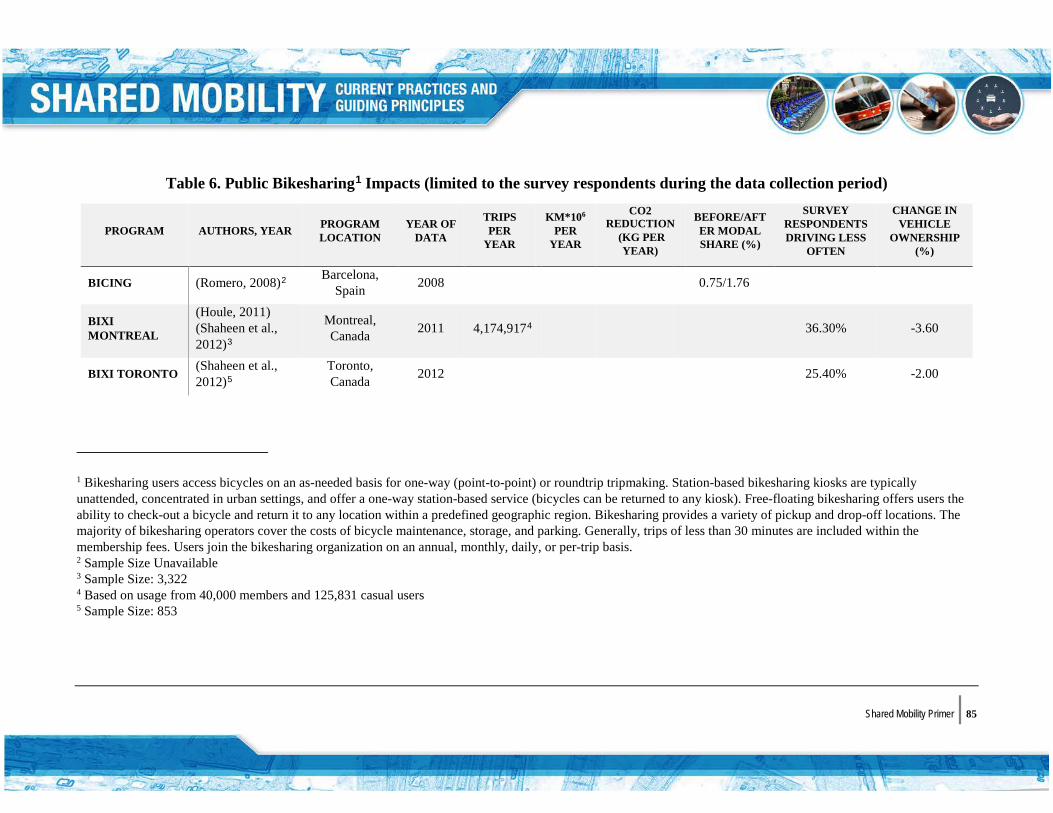
Shared Mobility Primer | 85
Table 6. Public Bikesharing1 Impacts (limited to the survey respondents during the data collection period)
PROGRAM AUTHORS, YEAR PROGRAM LOCATION
YEAR OF DATA
TRIPS PER
YEAR
KM*106
PER YEAR
CO2 REDUCTION
(KG PER YEAR)
BEFORE/AFTER MODAL SHARE (%)
SURVEY RESPONDENTS DRIVING LESS
OFTEN
CHANGE IN VEHICLE
OWNERSHIP (%)
BICING (Romero, 2008)2 Barcelona, Spain 2008 0.75/1.76
BIXI MONTREAL
(Houle, 2011) (Shaheen et al., 2012)3
Montreal, Canada 2011 4,174,9174 36.30% -3.60
BIXI TORONTO (Shaheen et al., 2012)5
Toronto, Canada 2012 25.40% -2.00
1 Bikesharing users access bicycles on an as-needed basis for one-way (point-to-point) or roundtrip tripmaking. Station-based bikesharing kiosks are typically unattended, concentrated in urban settings, and offer a one-way station-based service (bicycles can be returned to any kiosk). Free-floating bikesharing offers users the ability to check-out a bicycle and return it to any location within a predefined geographic region. Bikesharing provides a variety of pickup and drop-off locations. The majority of bikesharing operators cover the costs of bicycle maintenance, storage, and parking. Generally, trips of less than 30 minutes are included within the membership fees. Users join the bikesharing organization on an annual, monthly, daily, or per-trip basis. 2 Sample Size Unavailable 3 Sample Size: 3,322 4 Based on usage from 40,000 members and 125,831 casual users 5 Sample Size: 853
Shared Mobility Primer | 86
PROGRAM AUTHORS, YEAR PROGRAM LOCATION
YEAR OF DATA
TRIPS PER
YEAR
KM*106
PER YEAR
CO2 REDUCTION
(KG PER YEAR)
BEFORE/AFTER MODAL SHARE (%)
SURVEY RESPONDENTS DRIVING LESS
OFTEN
CHANGE IN VEHICLE
OWNERSHIP (%)
BOULDER BCYCLE
(Boulder BCycle, 2014)1 Boulder, U.S. 2014 43,143 36,560
CAPITAL BIKESHARE
(Shaheen et al., 2012)2
Washington, DC 2012 41.0% -2.10
CITI BIKE (Citi Bike, n.d.)3 New York City, NY 2014 8,231,907 22.1 3,513,051
DENVER BCYCLE
(Denver BCycle, 2014)4 Denver, U.S. 2014 377,229 1.3 674,169
HANGZHOU PUBLIC BICYCLE PROGRAM
(Hangzhou Program Manager, Unpublished Data, 2009)5
Hangzhou, China 2009 62,780,000 376.7 69,715,000
1 Based on usage from 1,561 members and 9,998 casual users 2 Sample Size: 5,248 3 Sample Size Unavailable 4 Sample comprised of 3,980 annual members and 70,332 casual users. 5 Sample Size Unavailable

Shared Mobility Primer | 87
PROGRAM AUTHORS, YEAR PROGRAM LOCATION
YEAR OF DATA
TRIPS PER
YEAR
KM*106
PER YEAR
CO2 REDUCTION
(KG PER YEAR)
BEFORE/AFTER MODAL SHARE (%)
SURVEY RESPONDENTS DRIVING LESS
OFTEN
CHANGE IN VEHICLE
OWNERSHIP (%)
HUBWAY (Hinds, 2011)1 Boston, U.S. 2011 140,000
MADISON BCYCLE
(Madison BCycle, 2014)2 Madison, U.S. 2014 104,274 352,62
0
NICE RIDE MINNESOTA
(Shaheen et al., 2012)3
Minneapolis-St. Paul, U.S. 2012 52.4% -1.90%
SAN ANTONIO BCYCLE
(San Antonio BCycle, 2013)4
San Antonio, U.S. 2013 65,560 610,23
2 93,691
VÉLIB’ (The Globe and Mail, 2009) (DeMaio, 2009)
Paris, France 2007-2009 28,470,005 1%/2.5% 28%
VELO’V* (Vogel et al., 2014) (Bührmann, 2007)
Lyon, France 2011 6,493,4276
* The number of vehicles trips replaced by this program was about 7%
1 Sample Size: 3,629 2 Sample comprised of 2,622 annual members and 18,651 casual users. 3 Sample Size: 1,238 4 Sample comprised of 556 annual members and 15,873 casual users. 5 Based on approximately 250,000 system subscribers. 6 Sample comprised of 4,363,500 trips by annual members and 2,129,927 trips by casual users. Sample comprised of approximately 50,000 annual members. Precise sample size of annual members and casual users unavailable.

Shared Mobility Primer | 88
References
Bührmann, S. (2007). New Seamless Mobility Services: Public Bicycles.
Boulder BCycle. (2014). 2014 Annual Report. https://boulder.bcycle.com/docs/librariesprovider35/default-document-library/b-cycle-annual-report-2014.pdf?sfvrsn=4
DeMaio, P. (2009). Bike-Sharing: History, Impacts, Models of Provision, and Future. Journal of Public Transportation 14-4: 41–56.
Denver BCycle. (2014). 2014 Annual Report. https://denver.bcycle.com/docs/librariesprovider34/default-document-library/annual-reports/2014-denver-bike-sharing-annual-report.pdf?sfvrsn=2
Hangzhou Program Manager, Unpublished Data, 2009
Hinds, K. (2011). In Its First Season, Boston Bike Share Exceeds Projections; Will Expand Next Spring. http://www.wnyc.org/story/283407-in-its-first-season-boston-bike-share-exceeds-projections-will-expand-next-spring/
Houle, M-H. (2011). 4 174 917 déplacements en BIXI en 2011 - BIXI atteint le seuil des 40 000 membres. http://www.newswire.ca/fr/news-releases/4-174-917-deplacements-en-bixi-en-2011---bixi-atteint-le-seuil-des-40-000-membres-509107401.html
Madison BCycle. (2014). 2014 Season Overview. https://madison.bcycle.com/docs/librariesprovider19/default-document-library/2014-annual-report-madison-bcycle.pdf?sfvrsn=0
Romero, C. (2008). SpiCycles – in Barcelona. Presented at the Final Conference of the Chamber of Commerce & Industry of Romania, Bucharest, Romania.
San Antonio Office of Environmental Policy. San Antonio Bikes. Presented at the Texas Trails and Active Transportation Conference, San Antonio, TX, February 1-3, 2012. http://www.slideshare.net/biketexas/BCycle-bike-share
Shaheen, S., Martin, E., Cohen, A., and Finson, R. (2012). Public Bikesharing in North America: Early Operator and User Understanding. Mineta Transportation Institute Report Number 11–26.
Shared Mobility Primer | 89
The Globe and Mail. (2009). Paris’s Pedal Power Sets Free Uncivilized Behaviour. http://www.theglobeandmail.com/news/world/pariss-pedal-power-sets-free-uncivilized-behaviour/article4276785/
Vogel, M., Hamon, R., Lozenguez, G., Merchez, L., Abry, P., Barnier, J., Borgnat, P., Flandrin, P., Mallon, I., and Robardet, C. (2014). From bicycle sharing system movements to users: a typology of Vélo’v cyclists in Lyon based on large-scale behavioural dataset. Journal of Transport Geography. http://liris.cnrs.fr/Documents/Liris-6880.pdf

Shared Mobility Primer | 90
Table 7. Race of Capital Bikeshare1 Annual Members and Casual Users
RACE ANNUAL MEMBERS %
CASUAL USERS* % 2010 CENSUS2
CAUCASIAN 80 78.0 34.0 ASIAN/PACIFIC ISLANDER 5.0 8.0 4.0 BLACK/AFRICAN AMERICAN 2.0 5.0 50.0 HISPANIC 3.0 4.0 9.0 NATIVE AMERICAN 0.3 0.3 0.3 OTHER/MULTI-RACIAL 4.0 3.0 3.0 PREFER NOT TO ANSWER 6.0 2.0
Note: A casual user is a short-term user with pass of 30-days or less.
Reference: Borecki, N., Buck, D., Chung, P., Happ, P., Kushner, N., Maher, T., Buehler, R. (2012). Virginia TechCapital Bikeshare Study. Blacksburg: Virginia Tech.
1 Bikesharing users access bicycles on an as-needed basis for one-way (point-to-point) or roundtrip tripmaking. Station-based bikesharing kiosks are typically unattended, concentrated in urban settings, and offer a one-way station-based service (bicycles can be returned to any kiosk). Free-floating bikesharing offers users the ability to check-out a bicycle and return it to any location within a predefined geographic region. Bikesharing provides a variety of pickup and drop-off locations. The majority of bikesharing operators cover the costs of bicycle maintenance, storage, and parking. Generally, trips of less than 30 minutes are included within the membership fees. Users join the bikesharing organization on an annual, monthly, daily, or per-trip basis. 2 The 2010 US census did not tally bicycle users. Data represent Washington D.C. only, not the metropolitan statistical area. Membership may include some users outside of the District of Columbia.
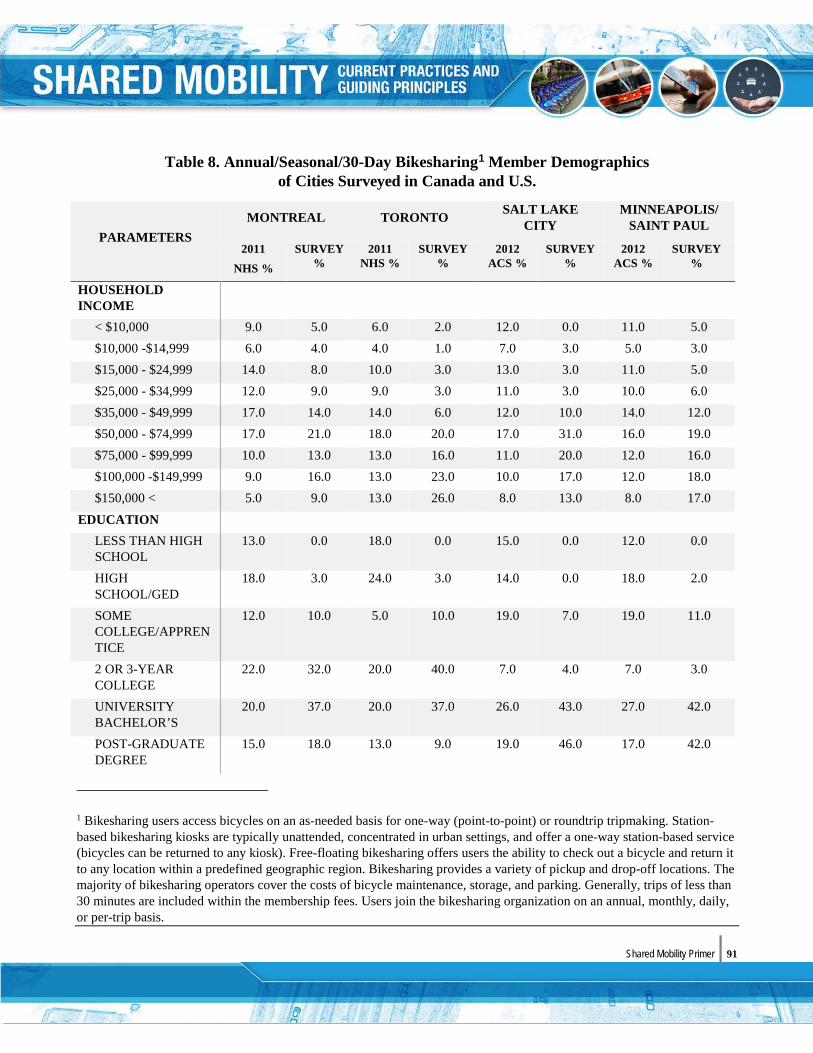
Shared Mobility Primer | 91
Table 8. Annual/Seasonal/30-Day Bikesharing1 Member Demographics of Cities Surveyed in Canada and U.S.
PARAMETERS MONTREAL TORONTO SALT LAKE
CITY MINNEAPOLIS/
SAINT PAUL
2011 NHS %
SURVEY %
2011 NHS %
SURVEY %
2012 ACS %
SURVEY %
2012 ACS %
SURVEY%
HOUSEHOLD INCOME
< $10,000 9.0 5.0 6.0 2.0 12.0 0.0 11.0 5.0 $10,000 -$14,999 6.0 4.0 4.0 1.0 7.0 3.0 5.0 3.0 $15,000 - $24,999 14.0 8.0 10.0 3.0 13.0 3.0 11.0 5.0 $25,000 - $34,999 12.0 9.0 9.0 3.0 11.0 3.0 10.0 6.0 $35,000 - $49,999 17.0 14.0 14.0 6.0 12.0 10.0 14.0 12.0 $50,000 - $74,999 17.0 21.0 18.0 20.0 17.0 31.0 16.0 19.0 $75,000 - $99,999 10.0 13.0 13.0 16.0 11.0 20.0 12.0 16.0 $100,000 -$149,999 9.0 16.0 13.0 23.0 10.0 17.0 12.0 18.0 $150,000 < 5.0 9.0 13.0 26.0 8.0 13.0 8.0 17.0
EDUCATION LESS THAN HIGH SCHOOL
13.0 0.0 18.0 0.0 15.0 0.0 12.0 0.0
HIGH SCHOOL/GED
18.0 3.0 24.0 3.0 14.0 0.0 18.0 2.0
SOME COLLEGE/APPRENTICE
12.0 10.0 5.0 10.0 19.0 7.0 19.0 11.0
2 OR 3-YEAR COLLEGE
22.0 32.0 20.0 40.0 7.0 4.0 7.0 3.0
UNIVERSITY BACHELOR’S
20.0 37.0 20.0 37.0 26.0 43.0 27.0 42.0
POST-GRADUATE DEGREE
15.0 18.0 13.0 9.0 19.0 46.0 17.0 42.0
1 Bikesharing users access bicycles on an as-needed basis for one-way (point-to-point) or roundtrip tripmaking. Station-based bikesharing kiosks are typically unattended, concentrated in urban settings, and offer a one-way station-based service (bicycles can be returned to any kiosk). Free-floating bikesharing offers users the ability to check out a bicycle and return it to any location within a predefined geographic region. Bikesharing provides a variety of pickup and drop-off locations. The majority of bikesharing operators cover the costs of bicycle maintenance, storage, and parking. Generally, trips of less than 30 minutes are included within the membership fees. Users join the bikesharing organization on an annual, monthly, daily, or per-trip basis.
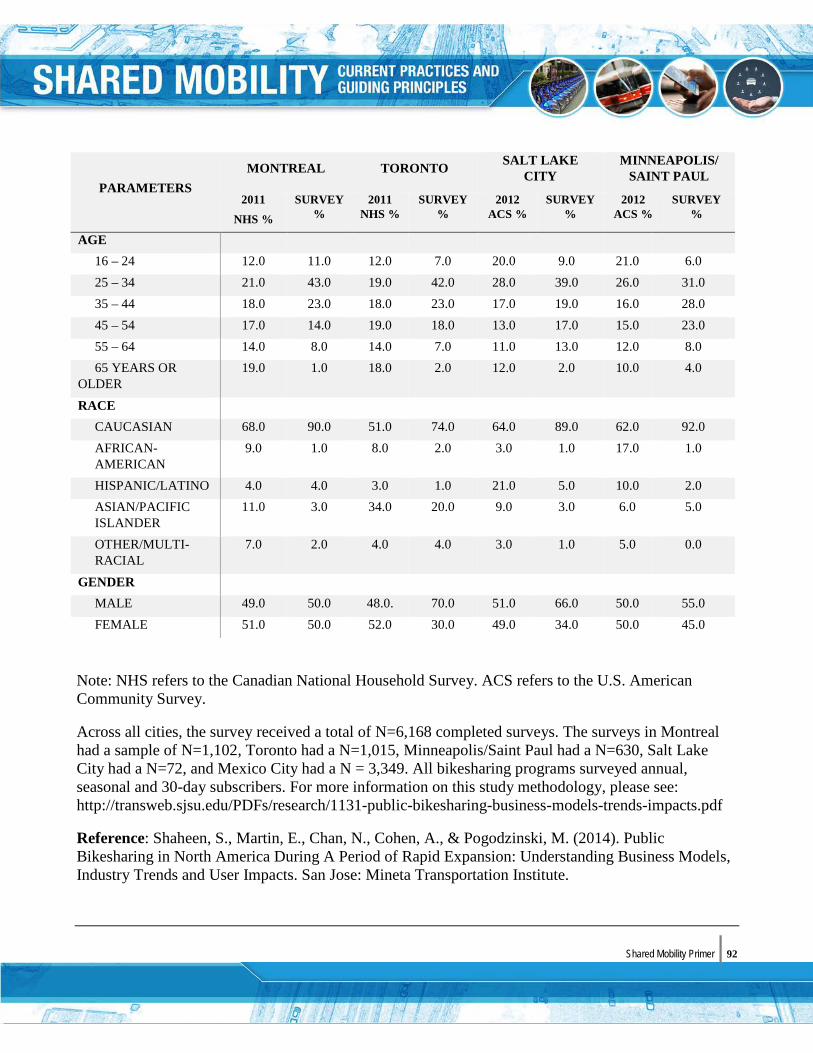
Shared Mobility Primer | 92
PARAMETERS MONTREAL TORONTO SALT LAKE
CITY MINNEAPOLIS/
SAINT PAUL
2011 NHS %
SURVEY %
2011 NHS %
SURVEY %
2012 ACS %
SURVEY %
2012 ACS %
SURVEY%
AGE 16 – 24 12.0 11.0 12.0 7.0 20.0 9.0 21.0 6.0 25 – 34 21.0 43.0 19.0 42.0 28.0 39.0 26.0 31.0 35 – 44 18.0 23.0 18.0 23.0 17.0 19.0 16.0 28.0 45 – 54 17.0 14.0 19.0 18.0 13.0 17.0 15.0 23.0 55 – 64 14.0 8.0 14.0 7.0 11.0 13.0 12.0 8.0 65 YEARS OR
OLDER 19.0 1.0 18.0 2.0 12.0 2.0 10.0 4.0
RACE CAUCASIAN 68.0 90.0 51.0 74.0 64.0 89.0 62.0 92.0 AFRICAN-AMERICAN
9.0 1.0 8.0 2.0 3.0 1.0 17.0 1.0
HISPANIC/LATINO 4.0 4.0 3.0 1.0 21.0 5.0 10.0 2.0 ASIAN/PACIFIC ISLANDER
11.0 3.0 34.0 20.0 9.0 3.0 6.0 5.0
OTHER/MULTI-RACIAL
7.0 2.0 4.0 4.0 3.0 1.0 5.0 0.0
GENDER MALE 49.0 50.0 48.0. 70.0 51.0 66.0 50.0 55.0 FEMALE 51.0 50.0 52.0 30.0 49.0 34.0 50.0 45.0
Note: NHS refers to the Canadian National Household Survey. ACS refers to the U.S. American Community Survey.
Across all cities, the survey received a total of N=6,168 completed surveys. The surveys in Montreal had a sample of N=1,102, Toronto had a N=1,015, Minneapolis/Saint Paul had a N=630, Salt Lake City had a N=72, and Mexico City had a N = 3,349. All bikesharing programs surveyed annual, seasonal and 30-day subscribers. For more information on this study methodology, please see: http://transweb.sjsu.edu/PDFs/research/1131-public-bikesharing-business-models-trends-impacts.pdf
Reference: Shaheen, S., Martin, E., Chan, N., Cohen, A., & Pogodzinski, M. (2014). Public Bikesharing in North America During A Period of Rapid Expansion: Understanding Business Models, Industry Trends and User Impacts. San Jose: Mineta Transportation Institute.
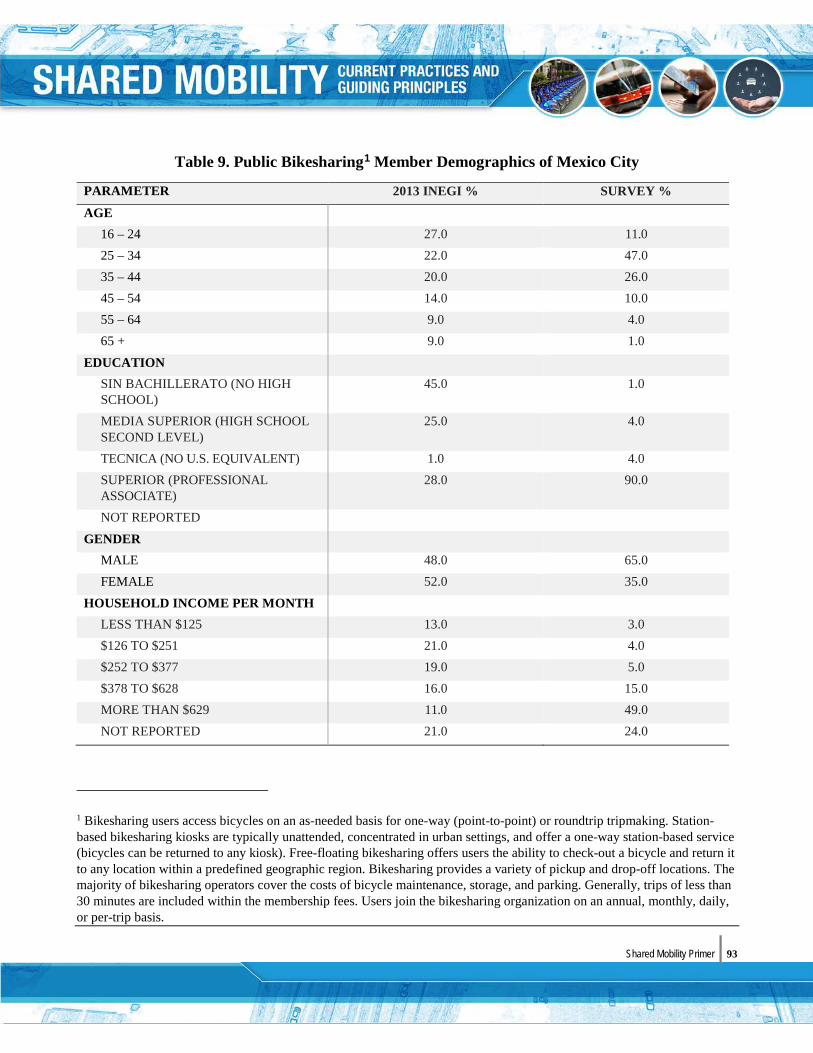
Shared Mobility Primer | 93
Table 9. Public Bikesharing1 Member Demographics of Mexico City
PARAMETER 2013 INEGI % SURVEY % AGE
16 – 24 27.0 11.0 25 – 34 22.0 47.0 35 – 44 20.0 26.0 45 – 54 14.0 10.0 55 – 64 9.0 4.0 65 + 9.0 1.0
EDUCATION SIN BACHILLERATO (NO HIGH SCHOOL)
45.0 1.0
MEDIA SUPERIOR (HIGH SCHOOL SECOND LEVEL)
25.0 4.0
TECNICA (NO U.S. EQUIVALENT) 1.0 4.0 SUPERIOR (PROFESSIONAL ASSOCIATE)
28.0 90.0
NOT REPORTED GENDER
MALE 48.0 65.0 FEMALE 52.0 35.0
HOUSEHOLD INCOME PER MONTH LESS THAN $125 13.0 3.0 $126 TO $251 21.0 4.0 $252 TO $377 19.0 5.0 $378 TO $628 16.0 15.0 MORE THAN $629 11.0 49.0 NOT REPORTED 21.0 24.0
1 Bikesharing users access bicycles on an as-needed basis for one-way (point-to-point) or roundtrip tripmaking. Station-based bikesharing kiosks are typically unattended, concentrated in urban settings, and offer a one-way station-based service (bicycles can be returned to any kiosk). Free-floating bikesharing offers users the ability to check-out a bicycle and return it to any location within a predefined geographic region. Bikesharing provides a variety of pickup and drop-off locations. The majority of bikesharing operators cover the costs of bicycle maintenance, storage, and parking. Generally, trips of less than 30 minutes are included within the membership fees. Users join the bikesharing organization on an annual, monthly, daily, or per-trip basis.

Shared Mobility Primer | 94
Note: INEGI is the Instituto Nacional de Estadística y Geografía, or the National Institute of Statistics and Geography, a Mexican governmental agency responsible for statistical and geographic information.
Reference: Shaheen, S., Martin, E., Chan, N., Cohen, A., & Pogodzinski, M. (2014). Public Bikesharing in North America During A Period of Rapid Expansion: Understanding Business Models, Industry Trends and User Impacts. San Jose: Mineta Transportation Institute.

Shared Mobility Primer | 95
Figure 7. Shift in Personal Driving as Result of Public Bikesharing1 Use
Survey Question: As a result of my use of bikesharing, I drive a personal vehicle (e.g., car, SUV, etc.) …
Reference: Shaheen, S., Martin, E., Chan, N., Cohen, A., & Pogodzinski, M. (2014). Public Bikesharing in North America During A Period of Rapid Expansion: Understanding Business Models, Industry Trends and User Impacts. San Jose: Mineta Transportation Institute.
1 Bikesharing users access bicycles on an as-needed basis for one-way (point-to-point) or roundtrip tripmaking. Station-based bikesharing kiosks are typically unattended, concentrated in urban settings, and offer a one-way station-based service (bicycles can be returned to any kiosk). Free-floating bikesharing offers users the ability to check-out a bicycle and return it to any location within a predefined geographic region. Bikesharing provides a variety of pickup and drop-off locations. The majority of bikesharing operators cover the costs of bicycle maintenance, storage, and parking. Generally, trips of less than 30 minutes are included within the membership fees. Users join the bikesharing organization on an annual, monthly, daily, or per-trip basis.

Shared Mobility Primer | 96
Table 10. Ridesourcing1 Demographics of Survey Respondents in San Francisco
AGE RIDE-SOURCING
% TAXI % a
SF % b 2013 HOUSEHOLD INCOME (USD)2
RIDE-SOURCING
% SF % b
15-24 50 16 3.0 11.0 $30K OR LESS 28 9 26.0
25-34 178 57 43.0 22.0 $30-70K 74 23 22.0
35-44 59 19 27.0 16.0 $71-100K 56 18 13.0
45-54 20 6 13.0 14.0 $100-200K 86 27 25.0
55-64 3 1 9.0 12.0 $200K+ 35 11 13.0
65-74 0 0 4.0 7.0 (DECLINE TO RESPOND)
37 12 n/a
75+ 0 0 2.0 7.0 SAMPLE 316
SAMPLE 310
GENDER RIDE-
SOURCING % TAXI
%a SF % b EDUCATION3 RIDE-
SOURCING % SF % b
FEMALE 124 40 n/a 49.0 LESS THAN A BACHELOR'S DEGREE
51 16 46.0
MALE 184 60 n/a 51.0 BACHELOR'S DEGREE 173 54 33.0
SAMPLE 308 GRADUATE DEGREE (MASTER'S/PH.D.)
87 27 21.0
OTHER DEGREE 10 3 n/a SAMPLE 321 Data Sources: a 2013 SFMTA taxi user survey
b 2012 ACS one-year estimate
This study conducted an intercept survey of ridesourcing customers in San Francisco during May and June 2014. Surveyors targeted two types of potential respondents: those who had just completed a
1 Ridesourcing services (also known as transportation network companies (TNCs) or ride-hailing) provide prearranged and on-demand transportation services for compensation, which connect drivers of personal vehicles with passengers. Smartphone mobile applications are used for booking, ratings (for both drivers and passengers), and electronic payment. There are a variety of vehicle types that can be offered by these services including: sedans, sports utility vehicles, vehicles with car seats, wheelchair accessible vehicles, and vehicles where the driver can assist older or disabled passengers. 2 Corresponding data for taxi users unavailable. 3 Corresponding data for taxi users unavailable.
Shared Mobility Primer | 97
ridesourcing trip (“intercept trips”), and those who had used ridesourcing within the last two weeks (“previous trips”). Both types responded to identical surveys.
Reference: Rayle, L., Dai, D., Chan, N., Cervero, R., and Shaheen, S. (2016). “Just A Better Taxi? A Survey-Based Comparison of Taxis, Transit, and Ridesourcing Services in San Francisco,” Transport Policy, Volume 45, pp. 168-178.

Shared Mobility Primer | 98
Table 11. Respondent Modal Preference if Ridesourcing1 (uberX/Lyft/Sidecar) Were Not Available
% RESPONDENTS DO YOU HAVE A CAR AT HOME?
Yes No
TAXI 39% 41% 35%
BUS 24% 17% 33%
RAIL (BART, STREETCAR, CALTRAIN)
9% 7% 10%
WALK 8% 9% 6%
BIKE 2% 2% 3%
DRIVE MY OWN CAR 6% 10% 0%
GET A RIDE WITH FRIEND/FAMILY
1% 1% 2%
OTHER* 11% 12% 10%
TOTAL 100% 100% 100%
SAMPLE 302 175 124
* “Other” includes several responses indicating the respondent would have used another ridesourcing service.
This study conducted an intercept survey of ridesourcing customers in San Francisco during May and June 2014. Surveyors targeted two types of potential respondents: those who had just completed a ridesourcing trip (“intercept trips”) and those who had used ridesourcing within the last two weeks (“previous trips”). Both types responded to identical surveys.
Reference: Rayle, L., Dai, D., Chan, N., Cervero, R., and Shaheen, S. (2016). “Just A Better Taxi? A Survey-Based Comparison of Taxis, Transit, and Ridesourcing Services in San Francisco,” Transport Policy, Volume 45, pp. 168-178.
1 Ridesourcing services (also known as transportation network companies (TNCs) or ride-hailing) provide prearranged and on-demand transportation services for compensation, which connect drivers of personal vehicles with passengers. Smartphone mobile applications are used for booking, ratings (for both drivers and passengers), and electronic payment. There are a variety of vehicle types that can be offered by these services including: sedans, sports utility vehicles, vehicles with car seats, wheelchair accessible vehicles, and vehicles where the driver can assist older or disabled passengers.
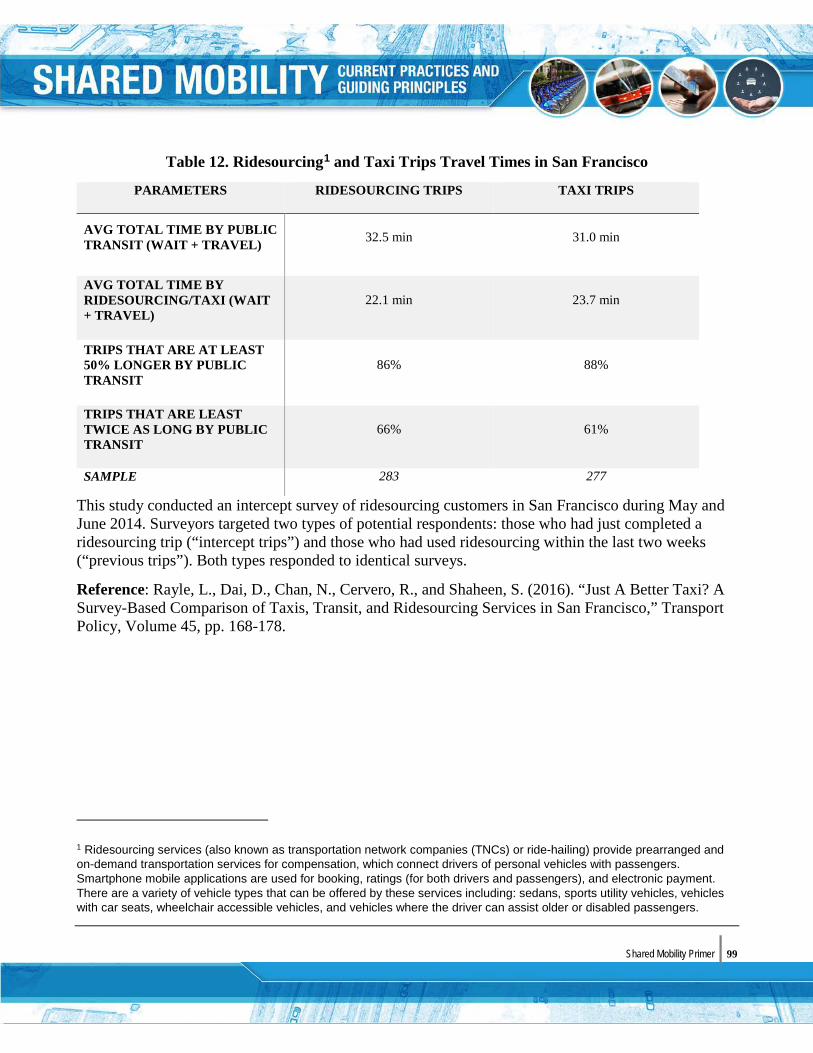
Shared Mobility Primer | 99
Table 12. Ridesourcing1 and Taxi Trips Travel Times in San Francisco
PARAMETERS RIDESOURCING TRIPS TAXI TRIPS
AVG TOTAL TIME BY PUBLIC TRANSIT (WAIT + TRAVEL) 32.5 min 31.0 min
AVG TOTAL TIME BY RIDESOURCING/TAXI (WAIT + TRAVEL)
22.1 min 23.7 min
TRIPS THAT ARE AT LEAST 50% LONGER BY PUBLIC TRANSIT
86% 88%
TRIPS THAT ARE LEAST TWICE AS LONG BY PUBLIC TRANSIT
66% 61%
SAMPLE 283 277
This study conducted an intercept survey of ridesourcing customers in San Francisco during May and June 2014. Surveyors targeted two types of potential respondents: those who had just completed a ridesourcing trip (“intercept trips”) and those who had used ridesourcing within the last two weeks (“previous trips”). Both types responded to identical surveys.
Reference: Rayle, L., Dai, D., Chan, N., Cervero, R., and Shaheen, S. (2016). “Just A Better Taxi? A Survey-Based Comparison of Taxis, Transit, and Ridesourcing Services in San Francisco,” Transport Policy, Volume 45, pp. 168-178.
1 Ridesourcing services (also known as transportation network companies (TNCs) or ride-hailing) provide prearranged and on-demand transportation services for compensation, which connect drivers of personal vehicles with passengers. Smartphone mobile applications are used for booking, ratings (for both drivers and passengers), and electronic payment. There are a variety of vehicle types that can be offered by these services including: sedans, sports utility vehicles, vehicles with car seats, wheelchair accessible vehicles, and vehicles where the driver can assist older or disabled passengers.

Shared Mobility Primer | 100
Shared Mobility Primer | 101
APPENDIX B: GLOSSARY Alternative Transit Services: Alternative transit services is a broad category that encompasses shuttles (shared vehicles that connect passengers to transit or employment centers), paratransit, and private sector transit solutions commonly referred to as microtransit. Microtransit can include fixed route or flexible route services as well as offering fixed schedules or on-demand service. In its most agile form (flexible routing, scheduling, or both), microtransit and paratransit can be bundled under the category known as flexible transit services.
Bikesharing: Users access bicycles on an as-needed basis for one-way (point-to-point) or roundtrip use. Station-based bikesharing kiosks are typically unattended, concentrated in urban settings, and offer one-way station-based access (bicycles can be returned to any kiosk). Free-floating bikesharing offers users the ability to check-out a bicycle and return it to any location within a predefined geographic region. Bikesharing provides a variety of pickup and drop-off locations. The majority of bikesharing operators cover the costs of bicycle maintenance, storage, and parking. Generally, trips of less than 30 minutes are included within the membership fees. Users join the bikesharing organization on an annual, monthly, daily, or per-trip basis.
Carpooling: A formal or informal arrangement where commuters share a vehicle for trips from either a common origin, destination, or both, reducing the number of vehicles on the road.
Car Rental: A non-membership-based service or company that rents cars or light trucks typically by the day or week. Traditional rental car services include storefronts requiring an in-person transaction with a rental car attendant. However, rental cars may also employ “virtual storefronts,” allowing unattended vehicle access similar to carsharing.
Carsharing: A program where individuals have temporary access to a vehicle without the costs and responsibilities of ownership. Individuals typically access vehicles by joining an organization that maintains a fleet of cars and light trucks deployed in lots located within neighborhoods, public transit stations, employment centers, and colleges/universities. Typically, the carsharing operator provides insurance, gasoline, parking, and maintenance. Generally, participants pay a fee each time they use a vehicle.
Closed-Campus Bikesharing: Closed-campus bikesharing systems are increasingly being deployed at university and office campuses. These closed-campus systems are available only to the particular campus community they serve.
Courier Network Services (CNS): CNS provide for-hire delivery services for monetary compensation using an online application or platform (such as a website or smartphone app) to connect delivery drivers using a personal transportation mode with a package/item or food delivery requests. These services can also be used to pair package delivery with passenger trips, where for hire-drivers can deliver both passengers and packages, either together or in separate trips.

Shared Mobility Primer | 102
E-Hail Apps: Smartphone apps that connect licensed taxi or pedicab drivers with passengers.
High-Tech Company Shuttles: Employer-sponsored shuttles that ferry employees between suburban workplace and public transit stations.
Fixed Route and Fixed Schedule Microtransit: Fixed route and fixed schedule microtransit occurs where the routing and arrival/departure times of the shared vehicles are fixed. The alignment of routes, however, can be “crowdsourced” (i.e., users can request origin-destination points on a tech-enabled platform that can inform the operators of which routes to introduce). This type of microtransit most closely mirrors public transit.
Flexible Route and On-Demand Schedule Microtransit: Users can request shared vans or buses real time through a tech-enabled application, and the vehicle will deviate from its route to somewhere within walking distance of the requester. These services can range in how dynamic they are—from routes that change over the span of a few days to fully dynamic routes that adjust in real time based on traffic and demand.
Flexible Transit Services: Flexible transit services include dial-a-ride and shuttle services (also known as paratransit) to supplement fixed-route bus and rail services. Flexible transit services include one or more of the following characteristics: 1) route deviation (vehicles can deviate within a zone to serve demand-responsive requests); 2) point deviation (vehicles providing demand-responsive service serve a limited number of stops without a fixed route between spots); 3) demand-responsive connections (vehicles operate in a demand-responsive geographic zone with one or more fixed-route connections); 4) request stops (passengers can request unscheduled stops along a predefined route); 5) flexible-route segments (demand-responsive service is available within segments of a fixed-route); and 6) zone route (vehicles operate in a demand-responsive mode along a route corridor with departure and arrival times at one or more end points).
Fractional Ownership: Carsharing where multiple individuals sublease or subscribe to a vehicle owned by a third party.
Hybrid Peer-to-Peer (P2P): Individuals access vehicles or low-speed modes by joining an organization that maintains its own fleet, but it also includes private autos or low-speed modes. Expenditures, such as insurance, are typically provided by the organization during the access period for both carsharing and P2P vehicles. Members access vehicles or other low-speed modes through a direct key or combination transfer from the owner or through operator-installed technology enabling “unattended access.”
Limousines and Liveries: A limousine or luxury sedan offering pre-arranged transportation services driven by a for-hire driver or chauffeur.
Shared Mobility Primer | 103
Microtransit: A privately owned and operated shared transportation system that can offer fixed routes and schedules, as well as flexible routes and on-demand scheduling. The vehicles generally include vans and buses.
One-Way Carsharing: A form of carsharing that enables members to pick up a vehicle at one location and drop it off at another. This is also called a point-to-point carsharing service. One-way carsharing can be station-based or free floating.
Paired On-Demand Passenger Ride and Courier Services: A CNS model in which package/item and food delivery trips can be conducted by for-hire ride services (e.g., ridesourcing or pedicabs) either in single purpose or mixed-purpose trips.
Pedicabs: A pedicab is a bicycle for-hire service with a peddler that transports passengers on a cycle containing three or more wheels with a passenger compartment.
Peer-to-Peer (P2P) Access Model: Employs privately-owned vehicles or low-speed modes made temporarily available for shared use by an individual or members of a P2P company. Expenditures, such as insurance, are generally provided by the P2P organization during the access period. In exchange for providing the service, operators keep a portion of the usage fee. Members can access vehicles or low-speed mode through a direct key or combination transfer from the owner or through operator-installed technology that enables “unattended access.”
Peer-to-Peer (P2P) Carsharing: This model employs privately-owned vehicles or low-speed modes made temporarily available for shared use by an individual or members of a P2P carsharing company. Expenditures, such as insurance, are generally provided by the P2P organization during the access period. In exchange for providing the service, operators keep a portion of the usage fee. Members can access the automobiles or low-speed modes through a direct key or combination transfer from the owner through the operator-installed technology that enables “unattended access.”
Peer-to-Peer (P2P) Marketplace: P2P marketplace enables direct exchanges between individuals via the Internet. Terms are generally decided among parties of a transaction and disputes are subject to private resolution.
Personal Vehicle Sharing (PVS): The sharing of privately-owned vehicles where companies broker transactions among car owners and renters by providing the organizational resources needed to make the exchange possible (i.e., online platform, customer support, driver and motor vehicle safety certification, auto insurance, and technology).
Public Transportation: Any mass transportation vehicle that charges set fares, operates on fixed routes, and is available to the public. Common public transportation systems include buses, subways, ferries, light and heavy rail, and high speed rail.
Shared Mobility Primer | 104
Peer-to-Peer (P2P) Bikesharing: P2P bikesharing is a system where users can rent out their private bikes to others. Spinlister (previously known as Liquid) is one P2P bicycle sharing system in North America. Another company, Bitlock, sells keyless Bluetooth bicycle locks that can be used for personal use or for P2P sharing.
Peer-to-Peer (P2P) Delivery Services: A CNS where anyone who signs up can us their private vehicle or bike to conduct a delivery.
Transportation Network Company (TNC)/Ridesourcing: Ridesourcing services (also known as transportation network companies (TNCs) or ride-hailing) provide prearranged and on-demand transportation services for compensation, which connect drivers of personal vehicles with passengers. Smartphone mobile applications are used for booking, ratings (for both drivers and passengers), and electronic payment. There are a variety of vehicle types that can be offered by these services including: sedans, sports utility vehicles, vehicles with car seats, wheelchair accessible vehicles, and vehicles where the driver can assist older or disabled passengers.
Ride-Hailing: Another term for ridesourcing services, as defined above.
Ridesplitting: A form of ridesourcing where riders with similar origins and destinations are matched to the same ridesourcing driver and vehicle in real time, and the ride and costs are split among users.
Roundtrip Carsharing: Carsharing that allows members hourly access to shared vehicles that must be returned to the same location from where they were picked up. Depending on the operator, users can choose from a variety of vehicles including: sedans, vans, sports utility vehicles, plug-in hybrid vehicles, and all-electric vehicles.
Scooter Sharing: Users gain the benefits of a private scooter without the costs and responsibilities of ownership. Individuals typically access scooters by joining an organization that maintains a fleet of scooters at various locations. Typically, the scooter operator provides gasoline, parking, and maintenance. Generally, participants pay a fee each time they use a scooter. They can be roundtrip, one-way, or both.
Slugging: A term used to describe informal or casual carpooling among strangers, which has often been described as a hybrid between commuter carpooling and hitchhiking. With slugging, passengers generally line up in “slug lines” and are picked up by unfamiliar drivers who are commonly motivated to pick up passengers to take advantage of high occupancy vehicle (HOV) lanes, lower tolls, and similar benefits.
Taxis: A type of for-hire vehicle service with a driver used by a single or multiple passengers. Taxi services may be either pre-arranged or on-demand. Taxis can be reserved or dispatched through street hailing, a phone operator, or an “e-Hail” Internet or phone application maintained either by the taxi company or a third-party provider.
Vanpooling: Consists of seven to 15 passengers who share the cost of the van and operating expenses and may share the responsibility of driving.
Shared Mobility Primer | 105
ACKNOWLEDGMENTS
FHWA would like to thank the following specialists and practitioners that provided invaluable expertise to this study as part of a one-day workshop conducted at the U.S. Department of Transportation Headquarter, Washington D.C.:
• Sandra Brecher (Montgomery County, MD) • Darren Buck (DDOT) • Matthew Daus (IATR) • Bill Dossett (North American Bikesharing Association) • Kiersten Grove (Seattle DOT) • Art Guzzetti (American Public Transportation Association) • Matthew Lesh (Noblis) • Sean Mackin (Denver Public-Works Transport) • Douglas Noble (ITE) • Timothy Papandreou (SFMTA) • Alan Woodland (Carsharing Association)

Shared Mobility Primer | 106

U.S. Department of Transportation Federal Highway Administration
Office of Operations (HOP)
1200 New Jersey Avenue, SE Washington, DC 20590
www.ops.fhwa.dot.gov
Toll-Free “Help Line” 866-367-7487
Pub. # FHWA-HOP-16-022 April 2016