Shaping great - Husqvarna Group · and lines of business in which Husqvarna Group operates, the...
128
Fairway cutting area Fairway cutting area Fairway cutting area Stay-out zone Stay-out zone ANNUAL REPORT 2019 Shaping great experiences
Transcript of Shaping great - Husqvarna Group · and lines of business in which Husqvarna Group operates, the...

Fairway cutting area
Fairway cutting area
Fairway cutting area
Stay-out zone
Stay-out zone
HU
SQVA
RN
A G
RO
UP
AN
NU
AL R
EP
OR
T 2019
ANNUAL REPORT 2019
Shaping great experiencesHead offi ce
Husqvarna AB (publ) / Mailing address: Box 7454, SE-103 92 Stockholm, SwedenVisiting address: Regeringsgatan 28 / Telephone: +46 8 738 90 00 / www.husqvarnagroup.com
Registered offi ceHusqvarna AB (publ) Jönköping / Mailing address: SE-561 82 Huskvarna, Sweden
Visiting address: Drottninggatan 2 / Telephone: +46 36 14 65 00

Contact
Johan AnderssonInvestor [email protected]+46 8 738 90 00
Åsa LarssonMedia [email protected]+46 8 738 90 80
Market data, statistics and market shares are estimates made by Husqvarna Group.
Factors affecting forward-looking statementsThis report contains forward-looking statements in the sense referred to in the American Private Securities Litigation Reform Act of 1995. Such statements comprice, among other things, fi nancial goals, goals of future business and fi nancial plans. These statements are based on present expectations and are subject to risks and uncertainties that may give rise to major deviations of the result due to several aspects. These aspects include, among other things: consumer demand and market conditions in the geographical areas and lines of business in which Husqvarna Group operates, the effects of currency fl uctuations, downward pressure on prices due to competition, a material reduction of sales by important distributors, any success in developing new products and in market-ing, outcome of any product responsibility litigation, progress when it comes to reach the goals set for productivity and effi cient use of capital, successful identifi cation of growth opportunities and acquistion objects, and to integrate these into the existing business and successful achievement of goals to make the supply chain more effi cient.
PRODUCTION: Husqvarna AB (publ) and Hallvarsson & Halvarsson.
PRINT: Larsson Offsettryck AB, Linköping 2020.
CHAPTER 01 / 08
Shaping great experiences We make a great difference to people who shape green spaces
and urban environments through our leadership in sustainable,
user-centered solutions. With a passion for innovation, we
create performance, pride and improved results for customers
around the world.
Cover image:
In 2019, the Husqvarna EPOS™ technology was launched, a satellite-based solution for professional robotic mowing with virtual boundaries.
The formal Annual Report, including the Directors’ Report and the fi nancial statements for the Group and the Parent Company, is provided on pages 41–110.
To learn more about Husqvarna Group’s sustainability initiatives, see the Sustainovate Progress report 2019.

CONTENTS
INTRODUCTION02 Husqvarna Group at a glance04 CEO statement
MARKET AND TRENDS08 Megatrends10 Market overview
STRATEGY 14 Next phase18 Targets20 Business model
DIVISIONS24 Overview26 Husqvarna Division28 Gardena Division30 Construction Divison
SUSTAINOVATE34 Integrating sustainability36 Strategic milestones
38 Sustainovate 2025
BOARD OF DIRECTORS’ REPORT41 Board of Directors’ Report50 Risk management55 Corporate Governance Report61 Internal control over financial
reporting62 Board of Directors and auditors64 Group Management
FINANCIAL STATEMENTS66 Financial statements – Group70 Notes – Group
98 Financial statements – Parent Company
102 Notes – Parent Company110 Declaration by the Board of Directors
and the President & CEO112 Auditor’s report
OTHER INFORMATION115 Allocation of the Consumer
Brands Division117 Definitions118 Five-year review119 Quarterly data120 The share122 Heritage124 2020 Annual General Meeting125 Contact
Contact
Johan AnderssonInvestor [email protected]+46 8 738 90 00
Åsa LarssonMedia [email protected]+46 8 738 90 80
Market data, statistics and market shares are estimates made by Husqvarna Group.
Factors affecting forward-looking statementsThis report contains forward-looking statements in the sense referred to in the American Private Securities Litigation Reform Act of 1995. Such statements comprice, among other things, fi nancial goals, goals of future business and fi nancial plans. These statements are based on present expectations and are subject to risks and uncertainties that may give rise to major deviations of the result due to several aspects. These aspects include, among other things: consumer demand and market conditions in the geographical areas and lines of business in which Husqvarna Group operates, the effects of currency fl uctuations, downward pressure on prices due to competition, a material reduction of sales by important distributors, any success in developing new products and in market-ing, outcome of any product responsibility litigation, progress when it comes to reach the goals set for productivity and effi cient use of capital, successful identifi cation of growth opportunities and acquistion objects, and to integrate these into the existing business and successful achievement of goals to make the supply chain more effi cient.
PRODUCTION: Husqvarna AB (publ) and Hallvarsson & Halvarsson.
PRINT: Larsson Offsettryck AB, Linköping 2020.
CHAPTER 01 / 08
Shaping great experiences We make a great difference to people who shape green spaces
and urban environments through our leadership in sustainable,
user-centered solutions. With a passion for innovation, we
create performance, pride and improved results for customers
around the world.
Cover image:
In 2019, the Husqvarna EPOS™ technology was launched, a satellite-based solution for professional robotic mowing with virtual boundaries.
The formal Annual Report, including the Directors’ Report and the fi nancial statements for the Group and the Parent Company, is provided on pages 41–110.
To learn more about Husqvarna Group’s sustainability initiatives, see the Sustainovate Progress report 2019.

Passion for innovationHusqvarna Group is a leading global producer of outdoor power products for forest, park and garden care, watering products and cutting and surface preparation equipment for the construction business. With a passion for innovation, we create performance, pride and improved results for customers.
2019 IN FIGURES (2018 IN BRACKETS)
Important events in 2019
• Introduced Husqvarna EPOS™ (Exact Positioning Operating System) satellite-based technology that enables robotic mowing with virtual boundaries.
• Presented updated strategy and financial targets at a Capital Markets Day.
• Strong growth in digital applications Gardena Smart System, Automower® Connect and Husqvarna Fleet Services™. In total, over 300,000 connected devices are now being managed on the digital services platforms.
• Strengthened the customer offering in surface preparation by acquiring a con-crete power trowel business.
New President & CEO
Henric Andersson has been appointed President & CEO effective as of April 2, 2020. Henric is currently President of the Construction Division and has been a member of Group Management since 2012 and worked in the Group for the last 22 years. He was born in 1973 and has a Master of Science degree in Industrial Engineering & Management from Linköping Institute of Technology.
42.3Net sales, SEKbn
(41.1)
3.9Operating income
excluding items affecting comparability, SEKbn
(3.2)
9.3Operating margin
excluding items affecting comparability, %
(7.9)
EuropeShare of Group
net sales
51%
North America Share of Group
net sales
36%
Rest of the world Share of Group
net sales
13%
Sales distributionGlobal presence in attractive markets with steady underlying growth.
Intro
du
ction
— H
usqvarna Group at a glance
2 / Annual Report 2019 / Husqvarna Group
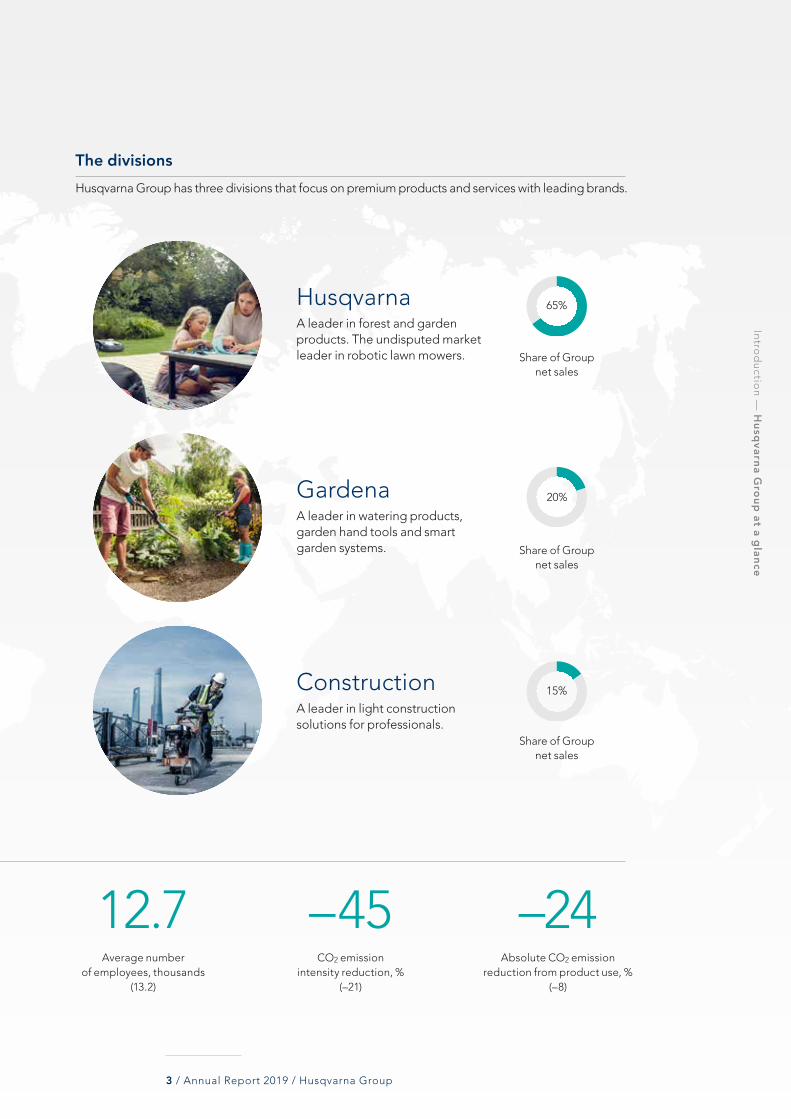
HusqvarnaA leader in forest and garden products. The undisputed market leader in robotic lawn mowers.
The divisionsHusqvarna Group has three divisions that focus on premium products and services with leading brands.
GardenaA leader in watering products, garden hand tools and smart garden systems.
ConstructionA leader in light construction solutions for professionals.
12.7Average number
of employees, thousands (13.2)
–45CO2 emission
intensity reduction, % (–21)
–24Absolute CO2 emission
reduction from product use, % (–8)
Share of Group net sales
65%
Share of Group net sales
20%
Share of Group net sales
15%
Intro
du
ction
— H
usqvarna Group at a glance
3 / Annual Report 2019 / Husqvarna Group
Ready for the next phase of our growth journeyOver the past few years, we have successfully developed and strengthened the company’s competitiveness by making substantial changes to our business focusing on profitability and growth. I can say that Husqvarna Group is now well-positioned, focused and ready to take the next step in our journey toward industry-leading growth and profitability.
Our transformation journey in recent years has involved major investments in new technologies, customer focus and sustainability, which in combination with efficiency improvements across the organization, have created the conditions for us to become a market and technology leader in our industry. We have clearly strengthened our technological capacity and capability in such areas as robotics, the Internet of Things (IoT) and software development. In total, we have added approximately 300 employees in these fields of expertise alone. In recent years, we have successfully balanced investments in strategic growth areas with efficiency programs in our existing operations.
Equally important was the decision to concentrate our efforts on clearly defined end-customer segments and our core brands, Husqvarna and Gardena. A direct consequence of this decision was the dissolvement and discontinuation of business in our financially underper-forming Consumer Brands Division in 2018. This allowed us to shift our focus to growth opportunities in the Husqvarna, Gardena and Construction divisions. This restructuring led us to exit unprofitable product seg-ments in 2019 and other low margin business will be exited in 2020. We have accordingly adapted our man-ufacturing capacity to the lower volumes. I can confirm that these measures were successful and that they con-tributed to our improved results during the year.
Positive earnings trend in 2019Group net sales increased 3% 1 to SEK 42,277m during the year. The vast majority of the Group’s offerings are directed to the forest and garden market, which pre-sented a few challenges during the year. Following strong sales growth in the first quarter, the second quar-ter – which is the seasonally most important – started on a cautious note in Europe. During the second half-year, we experienced weaker demand in the US. We man-aged the temporary market challenges effectively and sales increased during the year. This also confirms the importance of strong brands, a customer-focused offer-ing and investments in growth segments.
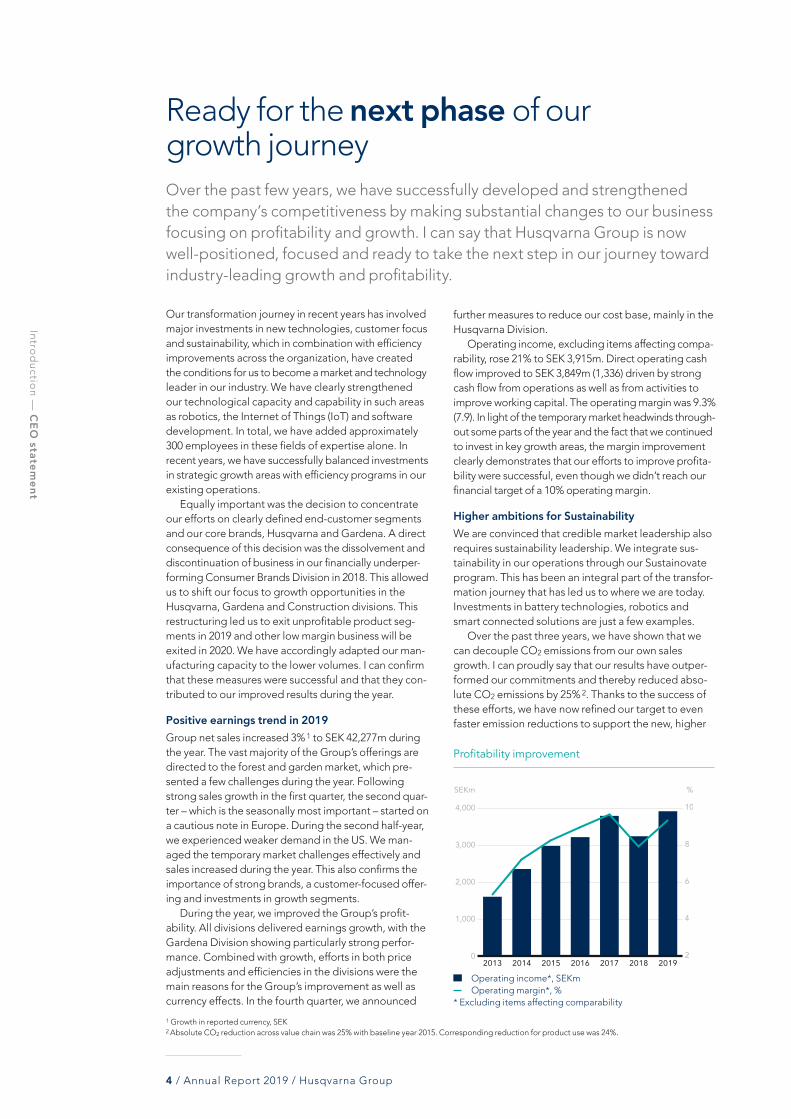
During the year, we improved the Group’s profit-ability. All divisions delivered earnings growth, with the Gardena Division showing particularly strong perfor-mance. Combined with growth, efforts in both price adjustments and efficiencies in the divisions were the main reasons for the Group’s improvement as well as currency effects. In the fourth quarter, we announced
1 Growth in reported currency, SEK2 Absolute CO2 reduction across value chain was 25% with baseline year 2015. Corresponding reduction for product use was 24%.
further measures to reduce our cost base, mainly in the Husqvarna Division.
Operating income, excluding items affecting compa-rability, rose 21% to SEK 3,915m. Direct operating cash flow improved to SEK 3,849m (1,336) driven by strong cash flow from operations as well as from activities to improve working capital. The operating margin was 9.3% (7.9). In light of the temporary market headwinds through-out some parts of the year and the fact that we continued to invest in key growth areas, the margin improvement clearly demonstrates that our efforts to improve profita-bility were successful, even though we didn’t reach our financial target of a 10% operating margin.
Higher ambitions for SustainabilityWe are convinced that credible market leadership also requires sustainability leadership. We integrate sus-tainability in our operations through our Sustainovate program. This has been an integral part of the transfor-mation journey that has led us to where we are today. Investments in battery technologies, robotics and smart connected solutions are just a few examples.
Over the past three years, we have shown that we can decouple CO2 emissions from our own sales growth. I can proudly say that our results have outper-formed our commitments and thereby reduced abso-lute CO2 emissions by 25% 2. Thanks to the success of these efforts, we have now refined our target to even faster emission reductions to support the new, higher
0
1,000
2,000
3,000
4,000
2019201820172016201520142013
SEKm %
2
4
6
8
10
Operating income*, SEKm Operating margin*, %
* Excluding items affecting comparability
Profitability improvementIn
trod
uctio
n —
CEO
statement
4 / Annual Report 2019 / Husqvarna Group
ambitions of the Science-based targets Initiative to limit the global temperature increase to 1.5°C.
The Group’s sustainability ambitions extend beyond reducing greenhouse gas emissions. In connection with the review of our Sustainovate strategy in the autumn, we also set ambitious targets in areas related to a circular economy and for how we can make it easier for people to make sustainable choices – for our users as well as internally within the Group.
Shaping great experiences – the next phaseThe world is changing faster than ever. The strategy for the next phase of Husqvarna Group’s development clearly reflects that we are ready to embrace the mega-trends that are shaping our world – from technology development and climate change to changing customer values. The key elements of our strategy are a focus on customer experience, services and solutions, robotics and battery technologies, and the continuous develop-ment of our core offering. Dedicated efforts in these areas will provide the conditions for delivering growth corresponding to 2 percentage points above the market in general, which is the Group’s new growth target. At the same time, we will build on our culture of continuous cost optimization and strategic growth initiatives, alongside improved profitability in line with our new operating margin target of at least 10%.
New services to enhance customer experienceWe have established a clear end-customer focus where we develop offerings and services based on prioritized customer segments. Passion for innovation is a key ele-ment of Husqvarna Group’s culture and we see it as a basic requirement for market leadership. Innovation is not just isolated to software, hardware and connected products. The combined development of new business models and services is just as important. The aim is to strengthen the customer experience throughout the entire lifecycle of a product while also moving closer to our end-users. In this respect, we can benefit from the fact that we already have more than 300,000 connected products and users.
Leading in robotics and battery technologiesOur ambition is to continue leading the development of robotic lawn mowers and battery-powered products and ecosystems. We are focused on leveraging the potential in the fast-growing consumer market for robotic lawn mowers, in both established markets such as Europe and in newer markets such as North America, which is the largest lawn and garden market in the world. We are the market leader with a strong and differentiated offering of robotic lawn mowers and software. During the year, we had a highly successful launch of the world’s first all-wheel-drive (AWD) robotic lawn mower, which provides superior cutting results for even the most complex lawns.
We are also making a strategically important invest-ment in the professional customer market segment. Our latest innovation, EPOS™, enables robotic lawn mowers to work within virtual, and therefore flexible, boundaries. EPOS™ offers significant value for professional custom-ers managing commercial lawns and gardens, urban parks, sports fields and other green spaces.
A strong core offeringHusqvarna Group has a strong and profitable core offering in the Husqvarna, Gardena and Construction divisions. Some examples are our leading market posi-tion in chainsaws, watering solutions and concrete cut-ting equipment. We will continue developing our brands through go-to market concepts, continue with innova-tion and a focus on aftermarket services to create an even better user experience. Success in our core busi-ness creates conditions for increased profitability, and for financing strategic growth initiatives in new areas.
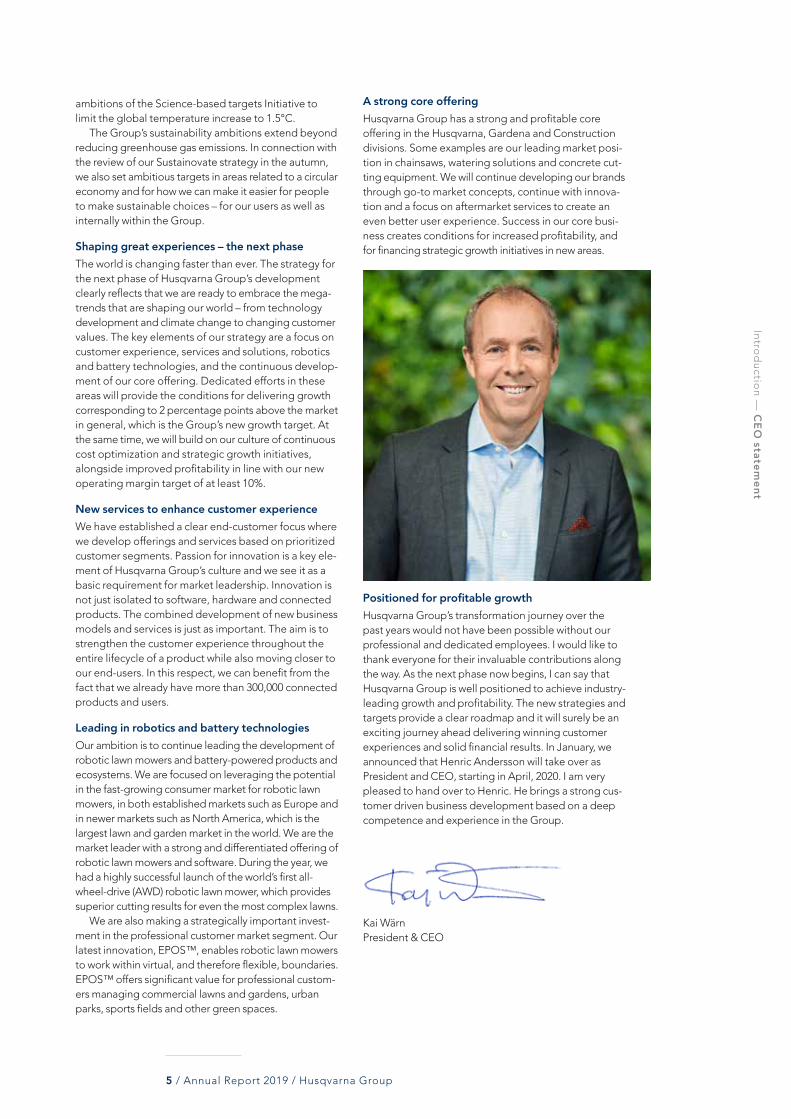
Positioned for profitable growthHusqvarna Group’s transformation journey over the past years would not have been possible without our professional and dedicated employees. I would like to thank everyone for their invaluable contributions along the way. As the next phase now begins, I can say that Husqvarna Group is well positioned to achieve industry-leading growth and profitability. The new strategies and targets provide a clear roadmap and it will surely be an exciting journey ahead delivering winning customer experiences and solid financial results. In January, we announced that Henric Andersson will take over as President and CEO, starting in April, 2020. I am very pleased to hand over to Henric. He brings a strong cus-tomer driven business development based on a deep competence and experience in the Group.
Kai WärnPresident & CEO
Intro
du
ction
— C
EO statem
ent
5 / Annual Report 2019 / Husqvarna Group

CHAPTER 02 / 08
Market and trends
6 / Annual Report 2019 / Husqvarna Group

CHAPTER 02 / 08
Market and trends
As a leading global supplier of forest, lawn and garden care as well as
construction products, the Group is impacted by several megatrends that
present both opportunities and challenges. The market has a steady growth
rate and includes several attractive high-growth segments.
7 / Annual Report 2019 / Husqvarna Group

Global trends are shaping the marketA globalized and technology-driven world, demographic shifts and humankind’s impact on the environment and resources. These megatrends set the direction of how society and markets are evolving. Adopting an outside-in perspective helps ensure that the Group’s strategy remains relevant and sustainable.
Speed of technologyDigitalization and rapid development of new technolo-gies are impacting all parts of the society and companies in all industries. Digitalization opens opportunities for new solutions and business models. At the same time, it requires the Group to adjust to rapidly evolving con-sumer expectations.
Digitalization and new technology are transforming the way products and services are developed, produced, distributed, supported and shared. For example, new battery technologies are making batteries a viable alter-native for energy storage in a wide range of industries.
HUSQVARNA GROUP’S APPROACH
In 2019, Husqvarna Group invested SEK 1.7bn in research and development, a large part of which related to prioritized technology fields, such as software devel-opment, battery and robotic technology and energy efficiency. The purpose is to strengthen the company’s leading position, not the least within robotic lawn mowers, battery-powered products and smart garden-ing systems. This also allows for opportunities to create unique user experiences through connectivity, reduce the Group’s impact on the environment and use of resources and to develop new functionality and services.
Digitalization is an important tool for achieving effi-ciency gains in the Group’s supply chain. One example is the use of automation and artificial intelligence in production, which improves quality, resource use and productivity.
Climate change and resource scarcity Raised awareness levels of the urgency of addressing climate change is influencing society at all levels—from more stringent regulation on energy consumption, to raised priorities in investment and purchasing decisions.
Increasingly, investors seek investment opportunities that contribute to solving the climate challenge and expect their investment universe to address both their short and long-term climate risks. Companies are prior-itizing equipment investments that support the transi-tion to renewable energy sources, or that have a lower climate impact. Consumers, in turn, are demanding more sustainable products.
HUSQVARNA GROUP’S APPROACH
Husqvarna Group has a responsibility to address its climate risks and has an opportunity to take a leading role by supporting the transition to a low-carbon energy mix.
The Group has demonstrated that it can reduce CO2 and build its business at the same time, thereby decou-pling CO2 emissions from the Group’s growth strategy. With Sustainovate 2025 – the updated sustainability approach – the level of ambition has been raised fur-ther. The Group’s CO2 target is to decrease absolute emissions 35 percent by 2025 across the value chain, compared to 2015 emissions levels.
The Group is addressing other sustainability issues through innovative solutions as well. Gardena Division, for example, has launched products to help consumers reduce water consumption.
Marke
t and
tren
ds —
Megatrends
8 / Annual Report 2019 / Husqvarna Group

Urbanization and new customer groupsSome 70 percent of the world’s population is expected to live in cities by 2050, compared with 55 percent in 20181.
The rapid economic growth of the past 25 years has meant that an increasing share of the world population is experiencing better economic prosperity. By 2030, global middle-class spending is projected to triple. In Europe and North America, people over 55 years will account for a larger share of the population than those under 18.
HUSQVARNA GROUP’S APPROACH
Husqvarna Group is continuously developing its prod-uct offering to make it more specialized, quiet and energy efficient, which makes it well suited to an urban lifestyle. The Gardena City Gardening product line is one example of a range of products that specifically addresses the needs of urban customers.
A growing middle class with increased purchasing power offers greater market potential in emerging markets. The Group is meeting these changing market demands by expanding in those markets. These are important growth markets, for instance for the Con-struction Division, which aims to benefit from the potential increase in construction investments in the ever-more urbanized regions of Asia.
The Group has a continued strong focus on robotic lawn mowers, which are well suited to meet the needs of an aging population, given the robots’ ability to facilitate and carry out tasks that can be a burden for older users.
1 (UN) World Urbanization Prospects: The 2018 revision.
Shifting consumer values and purchasing behaviorConsumers’ purchasing decisions are increasingly guided by sustainability, ethics, individualism and expression as well as whether a product or service is smart and connected or easy and affordable. Their curi-osity about sharing rather than owning products could potentially grow the market for new business models.
Digitalization has also entailed a shift in power toward consumers. People are better informed and can easily obtain information about product functionality online. The structure of the retail trade is undergoing rapid change and global e-commerce is forecast to report strong growth in the future.
HUSQVARNA GROUP’S APPROACH
The Group currently has more than 300,000 connected products. The Group aims to strengthen the user expe-rience and develop closer ties between end-users and the company for instance by developing new services and utilizing connectivity. The Group is also exploring new business models linked to the sharing economy. Husqvarna Tools For You is one example where consum-ers use a smart phone app to lease battery powered garden tools and pay for the time they use them.
Husqvarna Group is also striving to increase its online presence. The purpose is to strengthen commu-nication and interaction with end-users and to increase the sale of products, spare parts, accessories and value-added services.
Marke
t and
tren
ds —
Megatrends
9 / Annual Report 2019 / Husqvarna Group
Attractive markets with favorable growth opportunitiesHusqvarna Group is active in attractive markets that historically have shown a steady growth rate of around 2 to 3 percent annually. The Group sees good growth opportunities in areas where new technologies enjoy increasing acceptance, including robotic lawn mowers, battery-powered and connected products.
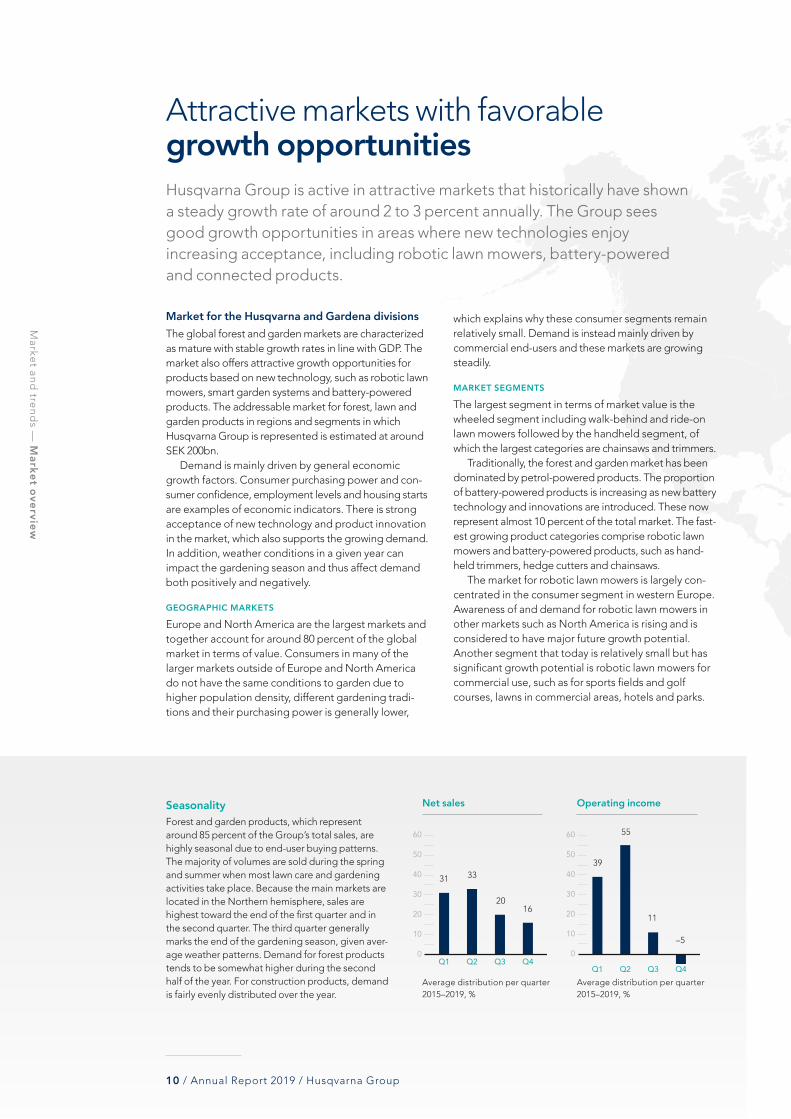
Seasonality Forest and garden products, which represent around 85 percent of the Group’s total sales, are highly seasonal due to end-user buying patterns. The majority of volumes are sold during the spring and summer when most lawn care and gardening activities take place. Because the main markets are located in the Northern hemisphere, sales are highest toward the end of the first quarter and in the second quarter. The third quarter generally marks the end of the gardening season, given aver-age weather patterns. Demand for forest products tends to be somewhat higher during the second half of the year. For construction products, demand is fairly evenly distributed over the year.
Net sales
0
10
20
30
40
50
60
Q4Q3Q2Q10
10
20
30
40
50
60
Q4Q3Q2Q1
Operating income
Market for the Husqvarna and Gardena divisions The global forest and garden markets are characterized as mature with stable growth rates in line with GDP. The market also offers attractive growth opportunities for products based on new technology, such as robotic lawn mowers, smart garden systems and battery-powered products. The addressable market for forest, lawn and garden products in regions and segments in which Husqvarna Group is represented is estimated at around SEK 200bn.
Demand is mainly driven by general economic growth factors. Consumer purchasing power and con-sumer confidence, employment levels and housing starts are examples of economic indicators. There is strong acceptance of new technology and product innovation in the market, which also supports the growing demand. In addition, weather conditions in a given year can impact the gardening season and thus affect demand both positively and negatively.
GEOGRAPHIC MARKETS
Europe and North America are the largest markets and together account for around 80 percent of the global market in terms of value. Consumers in many of the larger markets outside of Europe and North America do not have the same conditions to garden due to higher population density, different gardening tradi-tions and their purchasing power is generally lower,
which explains why these consumer segments remain relatively small. Demand is instead mainly driven by commercial end-users and these markets are growing steadily.
MARKET SEGMENTS
The largest segment in terms of market value is the wheeled segment including walk-behind and ride-on lawn mowers followed by the handheld segment, of which the largest categories are chainsaws and trimmers.
Traditionally, the forest and garden market has been dominated by petrol-powered products. The proportion of battery-powered products is increasing as new battery technology and innovations are introduced. These now represent almost 10 percent of the total market. The fast-est growing product categories comprise robotic lawn mowers and battery-powered products, such as hand-held trimmers, hedge cutters and chainsaws.
The market for robotic lawn mowers is largely con-centrated in the consumer segment in western Europe. Awareness of and demand for robotic lawn mowers in other markets such as North America is rising and is considered to have major future growth potential. Another segment that today is relatively small but has significant growth potential is robotic lawn mowers for commercial use, such as for sports fields and golf courses, lawns in commercial areas, hotels and parks.
Average distribution per quarter 2015–2019, %
33
55
31
39
20
1116
–5
Average distribution per quarter 2015–2019, %
Marke
t and
tren
ds —
Market overview
10 / Annual Report 2019 / Husqvarna Group
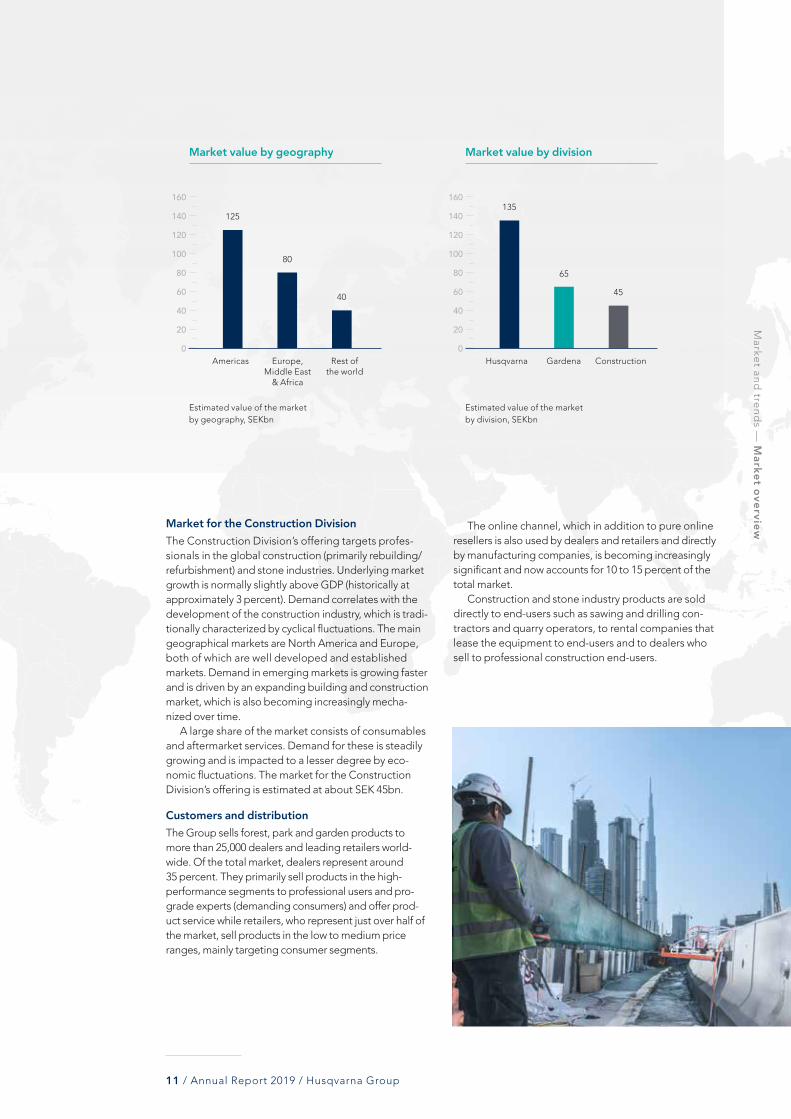
Estimated value of the market by geography, SEKbn
Estimated value of the market by division, SEKbn
Americas HusqvarnaEurope, Middle East
& Africa
GardenaRest of the world
Construction
Market value by geography Market value by division
Market for the Construction Division The Construction Division’s offering targets profes-sionals in the global construction (primarily rebuilding/refurbishment) and stone industries. Underlying market growth is normally slightly above GDP (historically at approximately 3 percent). Demand correlates with the development of the construction industry, which is tradi-tionally characterized by cyclical fluctuations. The main geographical markets are North America and Europe, both of which are well developed and established markets. Demand in emerging markets is growing faster and is driven by an expanding building and construction market, which is also becoming increasingly mecha-nized over time.
A large share of the market consists of consumables and aftermarket services. Demand for these is steadily growing and is impacted to a lesser degree by eco-nomic fluctuations. The market for the Construction Division’s offering is estimated at about SEK 45bn.
Customers and distribution The Group sells forest, park and garden products to more than 25,000 dealers and leading retailers world-wide. Of the total market, dealers represent around 35 percent. They primarily sell products in the high- performance segments to professional users and pro-grade experts (demanding consumers) and offer prod-uct service while retailers, who represent just over half of the market, sell products in the low to medium price ranges, mainly targeting consumer segments.
The online channel, which in addition to pure online resellers is also used by dealers and retailers and directly by manufacturing companies, is becoming increasingly significant and now accounts for 10 to 15 percent of the total market.
Construction and stone industry products are sold directly to end-users such as sawing and drilling con-tractors and quarry operators, to rental companies that lease the equipment to end-users and to dealers who sell to professional construction end-users.
0
20
40
60
80
100
120
140
160
0
20
40
60
80
100
120
140
160
125135
80
65
40 45
Marke
t and
tren
ds —
Market overview
11 / Annual Report 2019 / Husqvarna Group
CHAPTER 03 / 08
Strategy
12 / Annual Report 2019 / Husqvarna Group

In 2019, Husqvarna Group presented an updated strategy aimed
at reaching industry-leading growth and profitability. The main
elements of the strategy are a focus on the customer experience,
services and solutions, robotics and battery technology as well as
continually developing the core offering.
13 / Annual Report 2019 / Husqvarna Group

Megatrends
· Speed of technology
· Climate change and resource scarcity
· Urbanization and new customer groups
· Shifting consumer values and purchasing behaviors
Shaping great experiences – the next phaseShaping great experiences is Husqvarna Group’s vision – to make a real difference for its customers through leadership in sustainable user-centered solutions. This vision is an important driver behind the next phase of the Group’s strategy for profitable growth.
Ready for profitable growthHusqvarna Group is well positioned in attractive markets with steady underlying growth. This is supplemented by a strong presence in a number of high-growth market segments, such as robotic lawn mowers, battery-pow-ered products, smart connected solutions for garden care and growing segments in the light construction industry. Since 2013, Husqvarna Group’s strategy has focused on measures to improve profitability and drive growth. This has been combined with restructuring activities and major investments to strengthen the Group’s market and technical leadership. The key components have been:
FOCUSING ON STRONG BRANDS
• In 2019, the main brands Husqvarna and Gardena accounted for approximately 85 percent of sales compared with approximately 65 percent in 2013.
FOCUSING ON CORE PRODUCTS & HIGH-GROWTH PRODUCT SEGMENTS
• Core products and product segments, also including robotic and battery-powered products along with services and spare parts, accounted for 82 percent of sales in 2019 compared with 67 percent in 2013.
FINANCING STRATEGIC GROWTH INITIATIVES THROUGH STRONG EFFICIENCY PROGRAMS
• Since 2016, strategic growth initiatives totaling around SEK 1.5bn have been fully financed through efficiency programs in Husqvarna Group’s operations.
SIGNIFICANT STRENGTHENING OF CAPABILITIES IN NEW AREAS
• To achieve its ambition of technology leadership in the industry, Husqvarna Group has, over the past years, recruited about 300 new team members in areas such as software development, electronics and the Internet of Things (IoT).
The work carried out has provided Husqvarna Group with a stable foundation and the right conditions for the next phase in its efforts to generate industry-leading growth and profitability.
Strate
gy —
Next phase
14 / Annual Report 2019 / Husqvarna Group

* Market growth historically at 2–3%Operational & commercial excellence
ProfitabilityTarget: EBIT margin >10%
GrowthTarget: Net sales growth +2 percentage
points above market growth*
Capital efficiencyTarget: Average net working
capital /net sales ≤25%
Sustainovate– integrating sustainability in operations
4 Robotics &
battery
2 Services & solutions
3 A winning
core
1 Customer experience
Husqvarna Group’s strategy – the next phaseHusqvarna Group wants to make a real difference for people who shape green spaces and create great out-door environments and help them achieve excellent results. Creating an outstanding customer experience is a prerequisite for reaching the target of industry-leading growth and profitability. The Group is striving to enhance
growth and profitability by leveraging the strengths in the business and by combining industry-changing inno-vation and new services with the Group’s market-leading position in high-growth segments. The strategy has four main components and is supported by a strong focus on operational and commercial excellence.
Strate
gy —
Next phase
15 / Annual Report 2019 / Husqvarna Group

1. Customer experienceHusqvarna Group’s vision – shaping great experiences – clearly signals the Group’s focus on creating an out-standing customer experience. Customer experience is a crucial factor in creating a premium product experi-ence and in driving customer loyalty. Customer experi-ence encompasses more than just the products. It is about creating value throughout the entire product lifecycle – from before a purchase decision, through the use phase and to the future purchase of a new product.
Each division has identified its key customer groups. By creating a close relationship with these groups, Husqvarna Group can continuously improve its insight into what is important to users in everyday situations and develop solutions that match these needs. This creates a distinct customer-driven development of products and services and opportunities for revenue creation through new business models.
2. Services & solutions Services and solutions provide new opportunities for Husqvarna Group to drive growth and profitability. It is also a logical consequence of the strategy to create an outstanding customer experience throughout a prod-ucts lifecycle. By expanding its offering with business models in services and solutions, Husqvarna Group aims to move closer to end-users and their experiences, and simultaneously grow the aftermarket business.
Part of this involves expanding in an already-estab-lished base of aftermarket business including spare parts and accessories. Another area is establishing completely new business models. Here, Husqvarna Group can benefit from its large and growing base of connected products and users. Access to data on the use and status of products can help to create new smart service offerings. One example is Husqvarna Fleet Services™, which offers professional customers an overview of where machines are located, how much they have been used, when they need servicing and tracking CO2 emissions. By using this information, cus-tomers can optimize their operations for enhanced growth and profitability and extend the product life cycle.
3. A winning coreHusqvarna Group is powered by strong brands, which is a success factor for the Group. The strong brand equity and focus on high-performance products under the Husqvarna and Gardena brands enable a premium
offering, higher margins and increased investment in new product development. One key component of Husqvarna Group’s strategy looking ahead is to con-tinue to develop and strengthen market positions in the core offering, for instance, in chainsaws, watering solutions and power cutters, through both product innovation and marketing. This creates opportunities to enhance growth and profitability. A strong and prof-itable product portfolio in the core offering is also a prerequisite for financing investments in new areas.
4. Robotics & batteryRobotic and battery-powered products are important components in Husqvarna Group’s growth strategy. The market growth for these products and smart gar-den services is significantly higher than for the market as a whole and the future potential is substantial.
Husqvarna Group is the undisputed global market leader in the fast-growing consumer segment for robotic lawn mowers. The Group will expand based on its leading position through a high pace of innovation and continued geographical expansion. Another cen-tral part of the strategy is to broaden the offering and develop the market segment for professional users, a segment with large potential. Products and software systems developed for professional use and a dedi-cated go-to-market organization are important ele-ments in this work. One example of innovation leader-ship that creates opportunities in the professional seg-ment is EPOS™, Husqvarna’s new technology for robotic lawn mowers with virtual, and therefore flexible, boundaries.
Husqvarna Group is also expanding its leading posi-tion in battery-powered products for the Group’s appli-cation areas, both for consumers and professional cus-tomers. Husqvarna Group has a clear ecosystem approach with its smart gardening systems and bat-tery-powered products. Most of the Group’s products are driven by the same battery family and controlled in the same applications. This creates benefits and greater flexibility for Husqvarna Group and for its cus-tomers. To ensure a continued high pace of innovation, Husqvarna Group has a function dedicated to battery technology as well as strategic partnerships with selected key players in the field.
Operational & commercial excellenceHusqvarna Group’s ambition is to achieve higher growth and profitability than the industry as a whole.
Strate
gy —
Next phase
16 / Annual Report 2019 / Husqvarna Group

One prerequisite for this is a continued focus on effi-ciency throughout the value chain – from purchasing and production to distribution, marketing and cus-tomer care. This is important as a large share of the Group’s operations is in the global and seasonal mar-ket for forest and garden products, which places high demands on a flexible supply chain.
Operational efficiency and continuous cost reduc-tions are also tools to finance growth investments in new areas. Husqvarna Group is working methodically and purposefully with this to succeed.
The Group operates with strong, focused and empowered divisions with the resources needed to drive business toward their desired goals. Each division targets its unique group of end-users and builds on the factors needed to succeed in their market segment. As a result, Group functions are small and tasked with sup-porting the divisions to ensure synergies, for example, in e-commerce, business architecture and tools and methods to strengthen efficiency and productivity.
SUSTAINOVATE – SUSTAINABILITY A PREREQUISITE FOR MARKET LEADERSHIP
Being credible as market leader, requires a forward think-ing, outside-in approach. Addressing the impact the Group has on people and the environment will strongly influence the position as market leader. Being part of the shift to a low-carbon economy is also a responsibility to future generations that the Group takes seriously.
Sustainovate – the Group’s approach to integrating sustainability into the business – therefore plays a vital role in the strategy. The Group is now launching the second phase of Sustainovate to 2025. While Sustaino-vate to 2020 focused on integrating sustainability deeper into the business across five areas, Sustaino-vate 2025 addresses three opportunities for change: transformation to low-carbon economy, pioneering ways to deliver great value to customers through circu-lar economy solutions, and inspiring and engaging cus-tomers and employees in these efforts. Read more about Sustainovate on page 32.
EPOS™ – Virtual boundaries. Endless opportunities. Husqvarna EPOS™ (Exact Positioning Operating System) is a pioneering technology for a
new series of professional Automower® robotic mowers. The satellite-based technology means you can use the mowers within virtual boundaries.
This simple and flexible solution is perfect for commercial areas, golf courses, city parks and other spaces where needs and conditions change.
Navigation satellites
Mobile app
Stay-out zone
Virtual boundary
Chargingstation
Reference station
Sate
llite
sign
als
Satellite signals
Correction data
Strate
gy —
Next phase
17 / Annual Report 2019 / Husqvarna Group
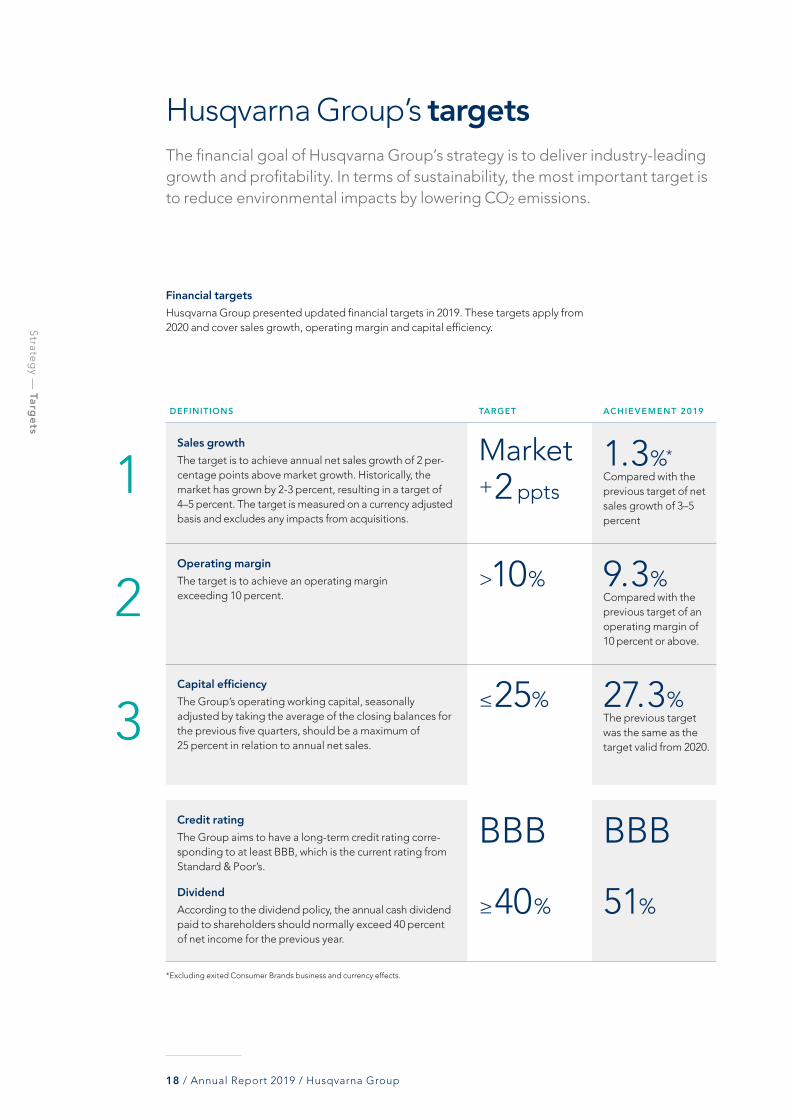
Financial targetsHusqvarna Group presented updated financial targets in 2019. These targets apply from 2020 and cover sales growth, operating margin and capital efficiency.
DEFINITIONS TARGET ACHIEVEMENT 2019
Sales growthThe target is to achieve annual net sales growth of 2 per-centage points above market growth. Historically, the market has grown by 2-3 percent, resulting in a target of 4–5 percent. The target is measured on a currency adjusted basis and excludes any impacts from acquisitions.
Market +2 ppts
1.3%* Compared with the previous target of net sales growth of 3–5 percent
Operating margin The target is to achieve an operating margin exceeding 10 percent.
>10% 9.3% Compared with the previous target of an operating margin of 10 percent or above.
Capital efficiencyThe Group’s operating working capital, seasonally adjusted by taking the average of the closing balances for the previous five quarters, should be a maximum of 25 percent in relation to annual net sales.
≤25% 27.3% The previous target was the same as the target valid from 2020.
Credit ratingThe Group aims to have a long-term credit rating corre-sponding to at least BBB, which is the current rating from Standard & Poor’s.
DividendAccording to the dividend policy, the annual cash dividend paid to shareholders should normally exceed 40 percent of net income for the previous year.
BBB
≥40%
BBB
51%
Husqvarna Group’s targetsThe financial goal of Husqvarna Group’s strategy is to deliver industry-leading growth and profitability. In terms of sustainability, the most important target is to reduce environmental impacts by lowering CO2 emissions.
1
2
3
*Excluding exited Consumer Brands business and currency effects.
Strate
gy —
Targets
18 / Annual Report 2019 / Husqvarna Group

Sustainovate targets Husqvarna Group’s approach to sustainability is built on five challenges where the Group can make the greatest difference and create economic, social and environmental value for key stakeholders. Sustainovate includes Group-wide targets to drive company performance to 2020 compared to 2015, unless otherwise indicated. Below is the Group’s progress.
DEFINIT IONS 2020 TARGETS 2019 PROGRESS AGAINST TARGET
Carbon ChallengeDecouple business growth from CO2 emissions.
10%CO2 emission intensity reduction across the value chain.
33%absolute CO2 emission reduc-tion from product use by 2035.
45%CO2 emission intensity reduction across the value chain.
24%absolute CO2 emission reduction from product use.
Team ChallengeBe the best place to work.
+9A Team Survey Net Promoter Score (NPS) equal to or higher than the peer group (+9).
+8Net Promoter Score In 2019 the peer group’s NPS was +9.
Supplier ChallengeInspire and build a sustainable supplier base.
70% of the purchasing spend from strategic suppliers audited and approved on their sustainability performance.
51% of the purchasing spend derived from audited and approved suppliers.
Safety ChallengeLead the industry in safety across the value chain.
35% reduction in new product incidents (compared with 2016).
40% reduction in injury rate in operations.
77% reduction in new product incidents.
31%reduction in injury rate in operations.
Community ChallengeBuild a platform for teams to engage in local communities.
• Establish a Group-wide framework to align objectives and measure positive impact of emergency response and community work.
Strate
gy —
Targets
19 / Annual Report 2019 / Husqvarna Group
ASSETS
• Leading brands Husqvarna and Gardena
• Around 13,000 employees
• 25,000 dealers and retailers
• R&D of SEK 1.7bn
• Equity of SEK 17.3bn
• Presence in 140 countries
• 30 factories
• 170 strategic suppliers
• More than 2,200 patents
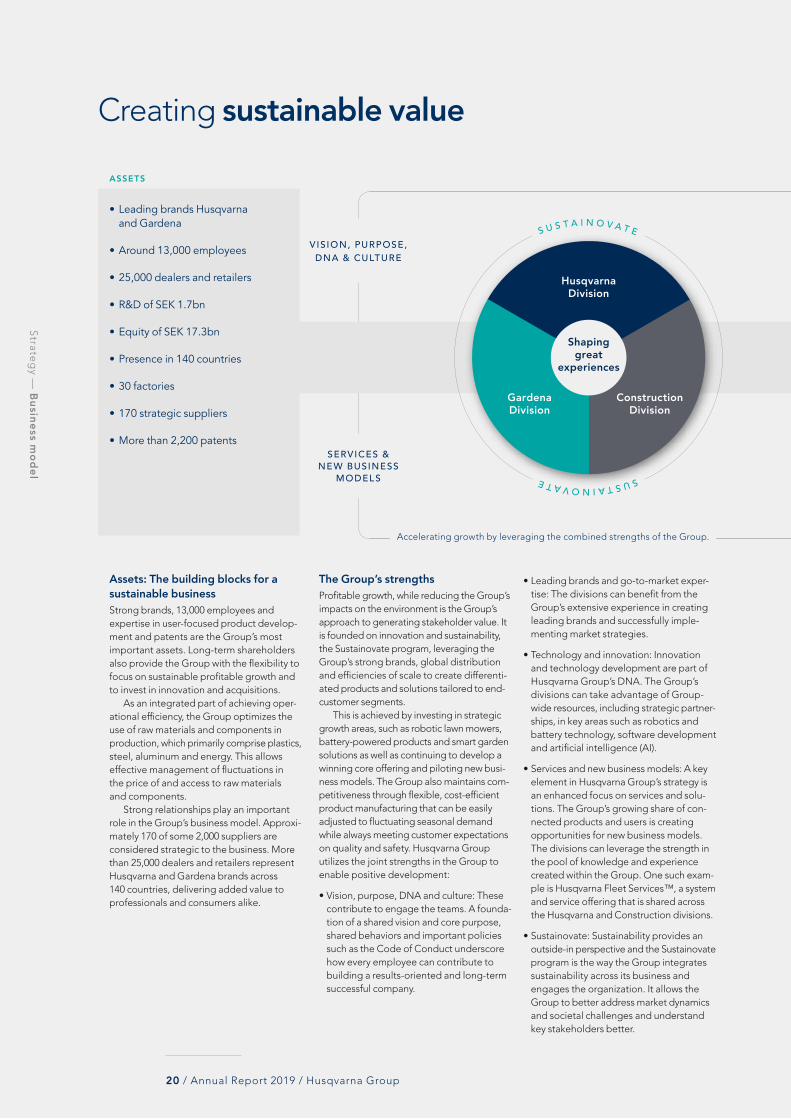
Assets: The building blocks for a sustainable business Strong brands, 13,000 employees and expertise in user-focused product develop-ment and patents are the Group’s most important assets. Long-term shareholders also provide the Group with the flexibility to focus on sustainable profitable growth and to invest in innovation and acquisitions.
As an integrated part of achieving oper-ational efficiency, the Group optimizes the use of raw materials and components in production, which primarily comprise plastics, steel, aluminum and energy. This allows effective management of fluctuations in the price of and access to raw materials and components.
Strong relationships play an important role in the Group’s business model. Approxi-mately 170 of some 2,000 suppliers are considered strategic to the business. More than 25,000 dealers and retailers represent Husqvarna and Gardena brands across 140 countries, delivering added value to professionals and consumers alike.
The Group’s strengths Profitable growth, while reducing the Group’s impacts on the environment is the Group’s approach to generating stakeholder value. It is founded on innovation and sustainability, the Sustainovate program, leveraging the Group’s strong brands, global distribution and efficiencies of scale to create differenti-ated products and solutions tailored to end-customer segments.
This is achieved by investing in strategic growth areas, such as robotic lawn mowers, battery-powered products and smart garden solutions as well as continuing to develop a winning core offering and piloting new busi-ness models. The Group also maintains com-petitiveness through flexible, cost-efficient product manufacturing that can be easily adjusted to fluctuating seasonal demand while always meeting customer expectations on quality and safety. Husqvarna Group utilizes the joint strengths in the Group to enable positive development:
• Vision, purpose, DNA and culture: These contribute to engage the teams. A founda-tion of a shared vision and core purpose, shared behaviors and important policies such as the Code of Conduct underscore how every employee can contribute to building a results-oriented and long-term successful company.
• Leading brands and go-to-market exper-tise: The divisions can benefit from the Group’s extensive experience in creating leading brands and successfully imple-menting market strategies.
• Technology and innovation: Innovation and technology development are part of Husqvarna Group’s DNA. The Group’s divisions can take advantage of Group-wide resources, including strategic partner-ships, in key areas such as robotics and battery technology, software development and artificial intelligence (AI).
• Services and new business models: A key element in Husqvarna Group’s strategy is an enhanced focus on services and solu-tions. The Group’s growing share of con-nected products and users is creating opportunities for new business models. The divisions can leverage the strength in the pool of knowledge and experience created within the Group. One such exam-ple is Husqvarna Fleet Services™, a system and service offering that is shared across the Husqvarna and Construction divisions.
• Sustainovate: Sustainability provides an outside-in perspective and the Sustainovate program is the way the Group integrates sustainability across its business and engages the organization. It allows the Group to better address market dynamics and societal challenges and understand key stake holders better.
Creating sustainable value
Shaping great
experiences
HusqvarnaDivision
GardenaDivision
ConstructionDivision
Accelerating growth by leveraging the combined strengths of the Group.
SERVICES & NEW BUSINESS
MODEL S
VIS ION, PURPOSE, DNA & CULTURE
SUSTAINOVATE
S U S T A I N O V A T E
Strate
gy —
Business m
odel
20 / Annual Report 2019 / Husqvarna Group

VALUE CREATEDOUTCOME
Customers, retailers & dealers• Safe, efficient, durable and reliable
products and services• Knowledge building• Channel of choice• Lasting partnerships
Investors• Long-term financial performance• Dividend
Employees• Fair wages• Good working conditions• Employment security• Attractive positions with development
opportunities
Society• Taxes paid• Jobs• Community involvement• Contributions to a low-carbon economy
• Forest, garden, watering and light construction products and services
• >300,000 connected products
• SEK 42.3bn of net sales
• SEK 3.9bn of operating income, excluding items affecting compa-rability
• SEK 5.8bn in employee salaries
• 44,000 tonnes of waste, 53 percent less than 2015
• 5 million tonnes of CO2 emissions, 25 percent less than 2015
• 77 percent reduction in product safety incidents since 2016
Outcome: Sustainable profitable growth Through innovation, energy-efficient opera-tions and engaged and dedicated teams, the Group is growing its business while reducing, in relative terms, CO2 emissions and waste across the value chain. Products in a wide range of categories are tailored to customers’ demands for efficiency, quality, durability and safety across markets, resulting in great customer experiences.
Value created for key stakeholder groups The focus on profitable growth provides opportunities for efficient and innovative products and services that generate eco-nomic, environmental and societal value. Key stakeholder groups such as customers, investors, employees and society stand to benefit from this approach. It also generates income that is reinvested in the company through research and development of new innovative products and services as well as other market leadership activities.
Creating sustainable value
The Group’s business model is built on a strategy that aims to achieve industry-leading growth and profitability by focusing on customer experience, services and solutions, battery and robotic technology and a winning core offering. Husqvarna Group believes focused sustainability initiatives are crucial for long-term market leadership and value creation.
TECHNOLOGY & INNOVATION
STRONG BR ANDS & GO -
TO - MARKET E XPERTISE
Strate
gy —
Business m
odel
21 / Annual Report 2019 / Husqvarna Group

CHAPTER 04 / 08
Husqvarna Group’s divisions
22 / Annual Report 2019 / Husqvarna Group

CHAPTER 04 / 08
Husqvarna Group’s divisions
Husqvarna Group operates on the principle of having
strong, focused and empowered divisions with all of the
functions needed to achieve their goals.
23 / Annual Report 2019 / Husqvarna Group

Three strong, focused and empowered divisions
Gardena The garden care segment leader
Husqvarna Global leader in forest and garden products
Construction The preferred construction industry choice
Share of Group operating income*
Share of Group net sales
62%65%
Share of Group operating income*
Share of Group net sales
22%20%
Share of Group operating income*
Share of Group net sales
21%15%
* Excluding items affecting comparability. The divisions’ share of Group operating income adds up to more than 100 percent due to Group Common Costs.
Divisio
ns —
Overview
24 / Annual Report 2019 / Husqvarna Group

END-CUSTOMERS MARKET POSITIONS/PRODUCTS DISTRIBUTION CHANNELS MAIN COMPETITORS
• Pro-grade experts
• Tree professionals
• Green space professionals
• Global leader in robotic lawn mowers for both consumers and professionals
• Global no. 2 in handheld prod-ucts such as chainsaws, brush cut-ters, trimmers and leaf blowers
• Leading positions within wheeled products such as front riders and zero-turn mowers
• Professional fleet management services
• Dealers for professionals and high-end consumers
• Retail channels
• Online
• STIHL Group
• John Deere
• Honda
• Toro
• Stanley Black & Decker
• MTD
• Yamabiko Corporation
END-CUSTOMERS MARKET POSITIONS/PRODUCTS DISTRIBUTION CHANNELS MAIN COMPETITORS
• The passionate gardener
• No. 1 in Europe for consumer watering management: garden hoses, reels and sprayers; sprinklers, sprinkler systems and water pumps
• Leader in robotic lawn mowers sold through retail, trimmers, hedge cutters and shrub shears
• Garden tools such as secateurs, loppers, axes, digging tools and winter tools
• Leader in smart garden systems – Gardena Smart System
• Retail-centric, multi-channel
• Bosch Group
• Fiskars
• Hozelock
• Kärcher
• Stiga
• TTI
• Positec
END-CUSTOMERS MARKET POSITIONS/PRODUCTS DISTRIBUTION CHANNELS MAIN COMPETITORS
Contractors and professionals in:
• Concrete sawing and drilling
• Concrete surfaces and floors
• Light demolition
• Stone
• Leading position in power cutters
• Light compaction and concrete placement equipment
• Floor grinding machines
• Dust and slurry solutions
• Diamond tools for construction and stone industries
• Floor and masonry saws
• Demolition robots
• Construction dealers and retailers
• Rental companies
• Direct sales
• Stone processing industry
• Hilti
• STIHL
• Tyrolit
• Ehwa
• Shinhan
• Skystone
Divisio
ns —
Overview
25 / Annual Report 2019 / Husqvarna Group

Global leader in forest and garden productsHusqvarna Division offers products for forestry, tree care, landscaping and other commercial lawn and garden services as well as for consumer segments including home and landowners. Heritage products include professional chainsaws and robotic lawn mowers.
BrandsThe division’s core brand is Husqvarna, which accounts for the majority of sales. The Husqvarna brand is distin-guished by innovative products and solutions that pro-mote productivity, safety and sustainability. Tree care and forestry are the DNA of the Husqvarna brand and robotic lawn mowers another core pillar of its market and technological leadership. The Husqvarna brand is primarily sold through more than 25,000 independent dealers worldwide, primarily in Europe and North America, but also in the faster growing emerging markets. Other brands include Zenoah (mainly Japan), Klippo (Nordics) and RedMax (North America).
From 2019, the division also includes the North American operations of the former Consumer Brands Division that was dissolved in 2018.
Products and solutionsThe Husqvarna Division strives to be the preferred partner among its target groups, including the pro-grade experts, green space professionals and tree pro-fessionals segments, with innovative products and first-class customer service and technical support.
Husqvarna is the undisputed global leader in robotic lawn mowers. High-performance battery- powered products are also an important part of the division’s product offering along with digital services such as the Husqvarna Fleet Service™ system and Automower® Connect. In addition, the division has strong market positions in handheld products, including chainsaws, trimmers, blowers as well as lawn mowing equipment.
Market and customer segmentsIn 2019, the division adjusted its organization around three fundamentally different target groups with the formation of three customer solution units – pro-grade experts, tree professionals and green space profes-sionals – and three market clusters – Europe & Pacific, emerging markets and North America. This refined setup will provide greater customer centricity and further enhance the division’s relevant offering of solutions and services as well as its go-to-market execution.
SustainabilityThe Husqvarna Division works to enhance energy effi-ciency and the shift to low-carbon alternatives through research and development, service, innovation and digitalization. This has generated growth of battery-powered products, which facilitate use of renewable energy. The division cooperates with cities and munici-palities on a variety of projects to enhance parks and accessibility to green spaces. For example, the Husqvarna Living City conference has become an important annual event to promote green landscaping and develop more sustainable solutions for professional green space maintenance. The division also has ambitious objectives to shift to low-carbon energy in its manufacturing operations, for example, by sourcing 90 percent of its electricity from renewable sources by 2020.
Growth opportunitiesSignificant market opportunities remain in new seg-ments for green space professionals, such as profes-sional robotic applications, as well as in regional mar-kets such as emerging markets and North America. Expanding Husqvarna’s leading position in residential and professional robotic lawn mowers and fully capital-izing on this growing market is a cornerstone for the division’s growth and success. Other product categories with good growth potential include battery-powered products such as trimmers, blowers and chainsaws for both professionals and consumers.
0
600
1,200
1,800
2,400
3,000
19181716150
2
4
6
8
10SEKm %
Europe, 42% North America, 44% Rest of the world, 14%
Operating income and margin
Net sales by region
Operating income* (SEKm) Operating margin* (%)
* Excluding items affecting comparability.
Divisio
ns —
Husqvarna
26 / Annual Report 2019 / Husqvarna Group

INTERVIEW WITH
Sascha Menges – President Husqvarna Division
How did Husqvarna Division improve results in 2019?Growth in key areas such as robotic lawn mowers and battery powered solutions, parts & accessories as well as exiting unprofitable product categories and closing one main production facility contributed to our improvements during the year. We still have work ahead of us, but it is satisfying that achievements and initiatives like these helped us to improve and put us back on our profitable growth trajectory.
What key trends shaped the year?Consumer demand for battery-powered and autonomous products continued to grow, which is reflected in our pro-battery and robotics leadership. We doubled our North American robotic lawn mower busi-ness and we continue to lead the market, which still has huge growth potential.General market demand however started slowly in Europe and we experienced softer demand in North America in the second half of the year.
What were the important 2019 product launches?We continued to prove our innovation leadership. With our new chainsaw, Husqvarna 550 XP® MKII, we launched a new cutting system that offers superior cutting capacity and was greatly received around the world. Our new Husqvarna Automower® 435X, an AI-enabled robotic mower with all wheel drive (AWD), also redefined the category and successfully reinforced our robotics leadership position.
Tell us about some of the division’s exciting innovations.In 2019, we unveiled EPOS™, a break-through satellite-based technology that allows the more flexible and robust instal-lation of robotic mowers with virtual boun-daries for professional green space mana-gement.
We also showcased HUGSI – the Husqvarna Urban Green Space Index – a new AI-powered solution to enable munici-palities to better monitor urban green space development.
What progress was made with Sustainovate?Sustainability is increasingly being integra-ted in our business model and operations.
Our Sustainovate targets in particular lift our product development ambitions to help our customers reduce their impacts. Examples include a new CO2 calculator for our digital Husqvarna Fleet Service™ sys-tem that helps green space professionals track their carbon footprint development.
What are the key challenges and opportunities going forward?We are well positioned to continue our profitable growth trajectory, with strong brands, market positions and innovation. Our refined strategy and organizational setup will ensure we continue to deliver a relevant offering of customer-centric solu-tions and services that deliver superior customer experience.
Priorities for growth· Customer centric solutions and services· Innovation in core segments· Robotics leadership· Pro battery leadership· Accessibility and go-to-market
Divisio
ns —
Husqvarna
27 / Annual Report 2019 / Husqvarna Group

The garden care segment leaderGardena is the number one watering brand and a leading brand of high-quality garden tools and solutions in Europe. All in all, it is represented in more than 80 countries around the world.
Brands Gardena enjoys strong brand awareness in the Euro-pean garden care segments and the brand is associ-ated with high-quality and market-leading innovation. Gardena is the preferred brand for millions of home and garden owners thanks to its complete product range that includes everything a passionate gardener requires – from watering and lawn care systems to gar-dening tools.
From 2019, the division also includes the European operations of the former Consumer Brands Division that was dissolved in 2018 – Flymo, an iconic brand for lawn care and electric products in the UK, Universal, which offers accessories, and McCulloch, which offers robotic lawn mowers and handheld forestry and gar-den equipment.
ProductsGardena offers the broadest range of gardening prod-ucts in its markets and in several European countries. It leads the market in watering, hand tools and electric gardening tools. Much of its success has come from systems such as the Original Gardena System in water-ing products (garden hoses, connectors, nozzles, sprin-klers) and the Gardena Combisystem for hand tools and high-quality cutting tools such as secateurs and loppers.
Recent additions include Gardena City Gardening for smaller gardens and balconies and the Gardena Smart System, which includes leading solutions for gar-den automation – to extend the smart home outdoors.
Market and consumer segmentsGardena products and services are designed with the passionate gardener in mind. These users take pride in creating green spaces and truly enjoy the different activities gardening involves. They also like to have some of the work automated so they can focus on the more fun and creative parts of gardening. For this rea-son, they demand user-friendly, high-quality and relia-ble products as well as digital solutions to provide and share inspiration.
The division offers comprehensive digital customer support that includes automated watering and mowing as well as garden planning applications. Developing high-quality services and leveraging them to further strengthen the consumer brand experience is impor-tant to the division’s future success.
SustainabilityGardena’s consumers have strong connections to nature and want to enhance their environments. The division actively promotes the most sustainable options and help consumers see opportunities to reduce their CO2 impact and use less water. The same commitment to Sustainovate is reflected across the value chain – from its aim to source 100 percent renewable energy in its global operations to its product offering. Gardena currently sources all of its electricity for the manufacturing sites in Europe from renewable sources. The Gardena product range offers only electric and battery-powered products, such as robotic mowers, lawn mowers, hedge- and grass trimmers. Since 2018 Gardena engages in a continued partnership with UNICEF to support water, sanitation and hygiene development projects worldwide.
Growth opportunitiesGardena is driving a growth strategy. There are signi-ficant opportunities to expand within and beyond Gardena’s core markets in Central Europe, for example, in Southern Europe, the UK and Asia. Gardena is tapping into new distribution channels such as e- commerce and maintains a high proportion of investment in inno-vation to develop new products in adjacent product categories.
0
150
300
450
600
750
900
19181716150
2
4
6
8
10
12SEKm %
Europe, 93% North America, 2% Rest of the world, 5%
Operating income and margin
Net sales by region
Operating income* (SEKm) Operating margin* (%)
* Excluding items affecting comparability.
Divisio
ns —
Gardena
28 / Annual Report 2019 / Husqvarna Group
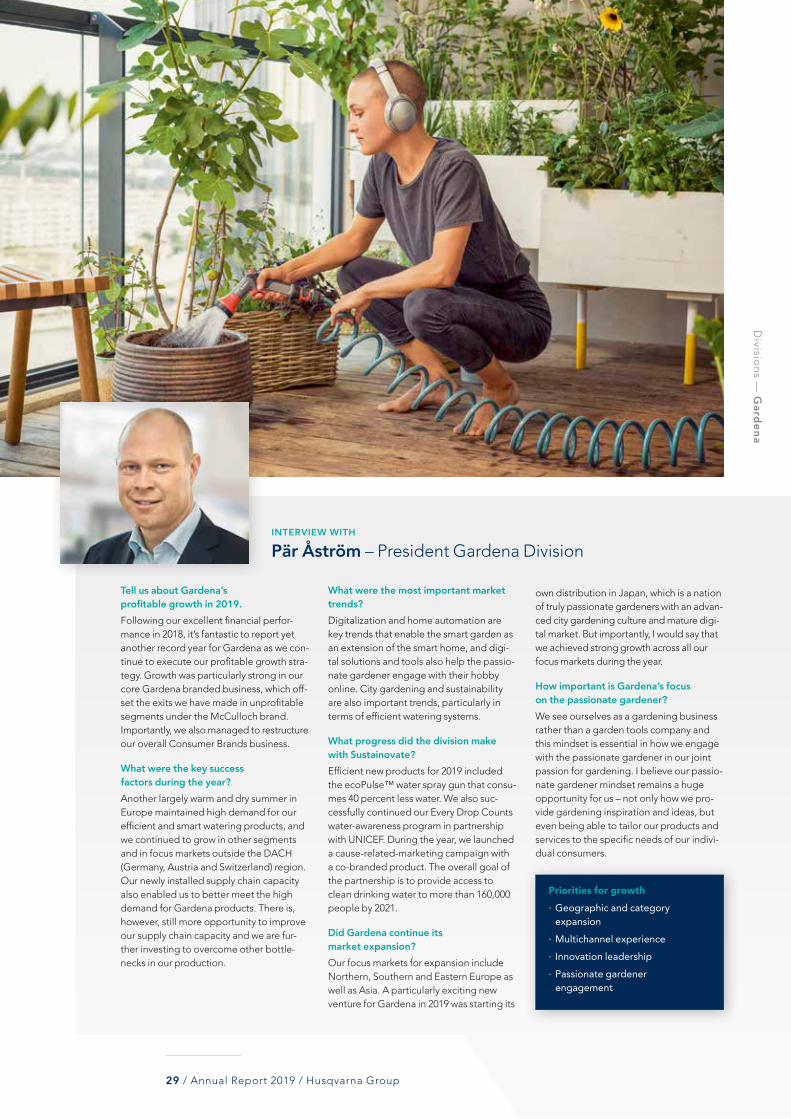
INTERVIEW WITH
Pär Åström – President Gardena Division
Tell us about Gardena’s profitable growth in 2019.Following our excellent financial perfor-mance in 2018, it’s fantastic to report yet another record year for Gardena as we con-tinue to execute our profitable growth stra-tegy. Growth was particularly strong in our core Gardena branded business, which off-set the exits we have made in unprofitable segments under the McCulloch brand. Importantly, we also managed to restructure our overall Consumer Brands business.
What were the key success factors during the year?Another largely warm and dry summer in Europe maintained high demand for our efficient and smart watering products, and we continued to grow in other segments and in focus markets outside the DACH (Germany, Austria and Switzerland) region. Our newly installed supply chain capacity also enabled us to better meet the high demand for Gardena products. There is, however, still more opportunity to improve our supply chain capacity and we are fur-ther investing to overcome other bottle-necks in our production.
What were the most important market trends?Digitalization and home automation are key trends that enable the smart garden as an extension of the smart home, and digi-tal solutions and tools also help the passio-nate gardener engage with their hobby online. City gardening and sustainability are also important trends, particularly in terms of efficient watering systems.
What progress did the division make with Sustainovate?Efficient new products for 2019 included the ecoPulse™ water spray gun that consu-mes 40 percent less water. We also suc-cessfully continued our Every Drop Counts water-awareness program in partnership with UNICEF. During the year, we launched a cause-related-marketing campaign with a co-branded product. The overall goal of the partnership is to provide access to clean drinking water to more than 160,000 people by 2021.
Did Gardena continue its market expansion?Our focus markets for expansion include Northern, Southern and Eastern Europe as well as Asia. A particularly exciting new venture for Gardena in 2019 was starting its
own distribution in Japan, which is a nation of truly passionate gardeners with an advan-ced city gardening culture and mature digi-tal market. But importantly, I would say that we achieved strong growth across all our focus markets during the year.
How important is Gardena’s focus on the passionate gardener?We see ourselves as a gardening business rather than a garden tools company and this mindset is essential in how we engage with the passionate gardener in our joint passion for gardening. I believe our passio-nate gardener mindset remains a huge opportunity for us – not only how we pro-vide gardening inspiration and ideas, but even being able to tailor our products and services to the specific needs of our indivi-dual consumers.
Priorities for growth· Geographic and category expansion· Multichannel experience· Innovation leadership· Passionate gardener engagement
Divisio
ns —
Gardena
29 / Annual Report 2019 / Husqvarna Group
The preferred construction industry choiceThe Construction Division is a global leader in machinery and diamond tools for the light construction and stone industries with a strong focus on innovation and customer support leadership.
BrandsHusqvarna is the division’s primary brand, with the broadest range of light construction equipment, diamond tools and services for concrete sawing and drilling, concrete surfaces and floors and light remote demolition. The Husqvarna brand is complemented by three industry leading specialist brands:• HTC is the global floor finishing innovator and expert
that offers a complete range of floor grinding solutions.
• Pullman Ermator is the leading specialist in dust and slurry management solutions for construction applications.
• Diamant Boart is a world leader in diamond tools for the stone industry.
Products and solutionsThe Construction Division offers solutions used exclu-sively by construction professionals who demand high-level performance, reliability and superior support. The division develops, manufactures and sells the most efficient and powerful solutions on the market for saw-ing, drilling and demolishing concrete, steel and other hard materials, as well as compaction, concrete consol-idation and floor finishing. Significant ongoing invest-ments in innovation are being made to deliver maxi-mum customer value through the widest, most innova-tive and powerful solution offering on the market.
Market and customer segmentsThe Construction Division has a strong market presence in most of its targeted product categories with leading positions in power cutters, floor grinding machines, dust and slurry management solutions, floor, wall and wire saws and related diamond tools as well as multi-wire diamond tools for the natural stone industry.
The division’s global network of sales companies, distributors, dealers, service centers and manufacturing plants is focused on customer need in the rapidly chang-ing construction industry. The Construction Division has an excellent sales and service support network and products and solutions are distributed globally through innovative sales processes and tools.
SustainabilityThe Construction Division is working actively to contin-uously reduce its environmental impact and increase the safe use of its products. The greatest CO2 and safety impacts occur during product use. Reducing CO2 impact involves product electri fi cation and improved energy efficiency. Solutions that promote worker safety and enable better management of dust and slurry also deliver considerable benefits at construction sites.
Growth opportunitiesFollowing consecutive growth since 2010, the Construc-tion Division is continuing to grow organically with new customers, products, services and markets as well as through targeted complementary acquisitions. In recent years, the division has created a second core business area through the acquisitions of the Light Compaction and Concrete Equipment business from Atlas Copco (February 2018), HTC (May 2017), Pullman Ermator (January 2017) and DTS (May 2016). This was further expanded during the year through the acquisition of Wacker Neuson’s concrete power trowel business (October 2019).
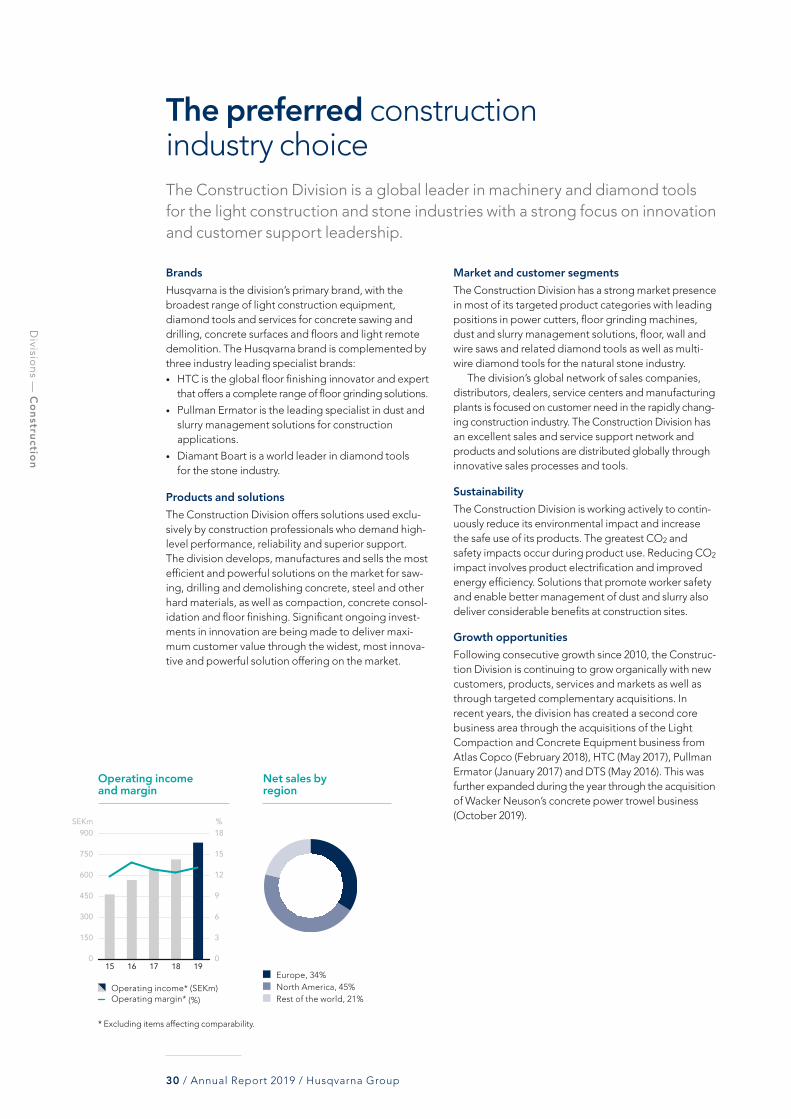
0
150
300
450
600
750
900
19181716150
3
6
9
12
15
18SEKm %
Operating income and margin
Net sales by region
Operating income* (SEKm) Operating margin* (%)
Europe, 34% North America, 45% Rest of the world, 21%
* Excluding items affecting comparability.
Divisio
ns —
Construction
30 / Annual Report 2019 / Husqvarna Group

Did the division continue to grow during the year? I am pleased to report that 2019 was our ninth consecutive year of growth. In parti-cular, our construction business achieved good growth in Europe, Asia Pacific and in emerging markets, but with slower growth in North America. Trade tariffs affected our business during the year, although we managed to offset these by increasing pricing and optimizing our supply chain.
What key products were launched in 2019? We launched our first fully battery powered product – an energy efficient, low-noise power cutter that uses the proven Husqvarna battery system for maximum customer flex-ibility. Our recent acquisitions are also ena-bling us to innovate integrated solutions, such as building on our competence from Pullman Ermator to launch a new power cutter with integrated dust collection.
How are your recent acquisitions being integrated into the division? Our integration work is generally progres-sing quicker than planned and is enabling us to create something new – not just in terms of consolidating operations to deve-lop economies of scale, but the creation of our new concrete surfaces and floors
growth platform. Our acquisition of Wacker Neuson’s power trowel business during the year filled an important gap in our product range for ride-on concrete power trowels. Importantly, our recent acquisitions have brought in top talent, contributing to our excellent team with remarkable capabilities.
Tell us about how services are enhancing the division’s offering. Crucially, I think our services help us gain better customer insight and greater custo-mer loyalty, ultimately creating additional customer value and new profit streams. During the year, we fully launched our Fleet Services™ system, which promotes more efficient fleet use by installing sensors on equipment to remotely monitor their utili-zation, plan maintenance and much more. We also launched a downloadable diamond tool selector app to help our customers rapidly find the best process and diamond tools for any specific job.
What progress did the division make with Sustainovate?Of course, the K 535i power cutter, our first fully battery-powered product, is significant. We plan to accelerate our efforts to launch new battery products that can complement or replace corded or petrol-powered equip-ment. Another highlight is the installation of
a 2 MW wind turbine at our Belgian plant, which will contribute to our operational energy needs with clean electricity as of 2020.
What are the key challenges and opportunities going forward? The fact that we continued to grow in 2019 despite tariffs and other headwinds is tes-tament to our comprehensive market offe-ring, engaged team members and the fact that customers are increasingly using dia-mond tools to grind and polish concrete floors as a floor finish. Emerging markets present growth opportunities for our busi-ness and we intend to continue to position ourselves as the premium option as they mature. In addition, we have a proven pro-cess and track record to identify and suc-cessfully integrate acquisitions.
INTERVIEW WITH
Henric Andersson – President Construction Division
Priorities for growth· Enhance customer value through best-in-class services and after market· Customer experience excellence· No.1 in battery-powered solutions· Accelerate growth in emerging markets· Growth through acquisitions
Divisio
ns —
Construction
31 / Annual Report 2019 / Husqvarna Group

CHAPTER 05 / 08
Sustainable solutions fit for the future
32 / Annual Report 2019 / Husqvarna Group

The need for sustainable solutions has never been greater or more
pressing. Building on the creativity of its teams, the Group is pioneering
pathways for step-change efficiency and smarter resource use. By
placing Sustainovate at the heart of the company, the Group is shaping
a company that is built to last.
33 / Annual Report 2019 / Husqvarna Group

Husqvarna Group embraces innovation that brings people and nature closer together. Sustainovate 2020, the Group’s approach to integrating sustainability deeper into its business, is built on five key challenges. The purpose is to reduce impacts and enhance the Group’s ability to positively affect people’s lives and the environment.
Integrating sustainability across the Group
Sustainovate includes Group-wide targets to drive sus-tainability performance over a five-year timeframe. This goal-based approach has focused attention on long-term value creation and is critical for market leadership. As the Group shifts to battery-driven solutions and embraces new business models the Group is equip-ping for business transformation. It has also acted to improve its CO2 impacts in the supply chain and is enlisting the systems thinking of the CDP Supply Chain
program to better capture insights on the scale of sup-pliers’ CO2 emissions. A better understanding of these impacts remains an important challenge to tackle.
With four years of the five-year window completed, the benefits of this approach are showing and the Group is positioned to achieve most of its targets.
Sustainovate targets compare performance to 2015 unless otherwise stated.
AMBITION TARGET PROGRESS* HIGHLIGHTS NEXT STEPS
Efforts to build an attractive, behavior-led workplace should never stop. By providing a platform for employees to make a differ-ence and offering opportu-nities for people of all back-grounds to maximize their talents, the Group aims to be the employer of choice.
9Net Promoter Score (NPS) is equal to or exceeds the peer group.
+8 additional effort needed
• 91 percent (approx. 12,000 employees) responded to the 2019 Team Survey
• Since 2015 some 142 man-agers have taken part in leadership training, 56 of them in 2019
• Defined our Group Employee Value Proposition (EVP).
• EVP roll-out Group-wide
• Diversity and Inclusion strategy and action plan
• Develop and execute Group Leadership Behavior and Capability model.
AMBITION TARGET PROGRESS HIGHLIGHTS NEXT STEPS
Husqvarna Group seeks to deploy innovation, energy-efficiency and new products to grow the business while reducing emissions across the value chain – from product design and devel-opment to suppliers, manufacturing, logistics and smarter product use.
10%CO2 intensity reduction across the value chain.
45% on track
• In motorized products, 28 percent of the business is represented by battery- powered, robotic and electrical products— up from 11 percent in 2015
• 58 percent of electricity used in operations derives from renewable sources
• More than half of the R&D spend of SEK 1,720 m was directed to battery and robotic technologies
• Exited low-margin petrol-powered product seg-ments in North America.
• Increase sales of low- carbon products
• Explore possibilities to source or install re newable energy
• Engage suppliers to measure and reduce CO2 emissions
• Launch revamped Science-based target to align with 1.5°C.33%
Absolute CO2 reduc-tion from product use by 2035.
24%
Team challenge Be the best place to work
Carbon challenge Decouple business growth from CO2 emissions
Our science-based target
Su
staino
vate —
Integrating sustainability
34 / Annual Report 2019 / Husqvarna Group

Community challenge Build a platform for teams to engage in local communities
Safety challenge Lead the industry in safety across the value chain
Supplier challenge Inspire and build a sustainable supplier base
AMBITION HIGHLIGHTS NEXT STEPS
By connecting people with nature, the Group aims to protect biodiversity, pro-mote healthier lifestyles and create more resilient communities.
• Matched Ulm community donations, providing 200,000 Euros for helping 100,000 people gain access to clean water
• In 2019, held the Living City global confer-ence in Gothenburg, Sweden and nine local events around the world to raise awareness on the role of parks
• Since 2015, convened 30 regional Husqvarna Loves parks meetings and four international conferences
• Durban and Rio de Janiero listed as Husqvarna Group’s newly launched HUGSI 2019 Index of the world’s greenest cities.
• Action plan for Group-wide emergency relief program.
AMBITION TARGET PROGRESS HIGHLIGHTS NEXT STEPS
The Group’s strong focus on safety and ergonomics in products and on occupa-tional, health and safety (OHS) will improve safety across the value chain.
40%Reduction in the Total Recordable Incident Rate (TRIR) in operations.
31% additional effort needed
Workplace safety• Implemented an ISO 45001-
based OHS management system
• Launched new OHS policy
• 135 OHS audits performed.
Product safety• A decrease in volume of
products historically involved in incidents
• Sales of protective equipment worldwide represented 1.3 percent of global sales compared to 0.2 percent in 2015.
Workplace safety • Implement Group-wide OHS
incident management system
• Increase preventative action reporting and risk observations
• Involve more people in internal audits to promote best practice.
Product safety• Launch products with new
safety features
• Accelerate innovation initiatives for improved product safety.
35%Less recordable inci-dents related to the new products com-pared to 2016.
77% on track
AMBITION TARGET PROGRESS HIGHLIGHTS NEXT STEPS
By evaluating strategic suppliers’ environmental, human rights and safety performance and ethical standards, the Group aims to motivate suppliers to improve and to prioritize those with high sustainability performance.
70%Of purchasing spend from strategic suppliers audited and approved based on their sustainability performance.
51% on track
• Since 2015, 144 supplier sustainability audits con-ducted in Asia, Europe and Americas
• 131 strategic suppliers audited and approved
• No zero-tolerance issues were uncovered in supplier audits
• Updated the Supplier Code of Business Ethics.
• Complete current audit program and define action plan for responsible sourc-ing to 2025
• Define action plan to improve transparency on minerals of concern
• Train commodity managers on Supplier Code of Business Ethics.
35 / Annual Report 2019 / Husqvarna Group
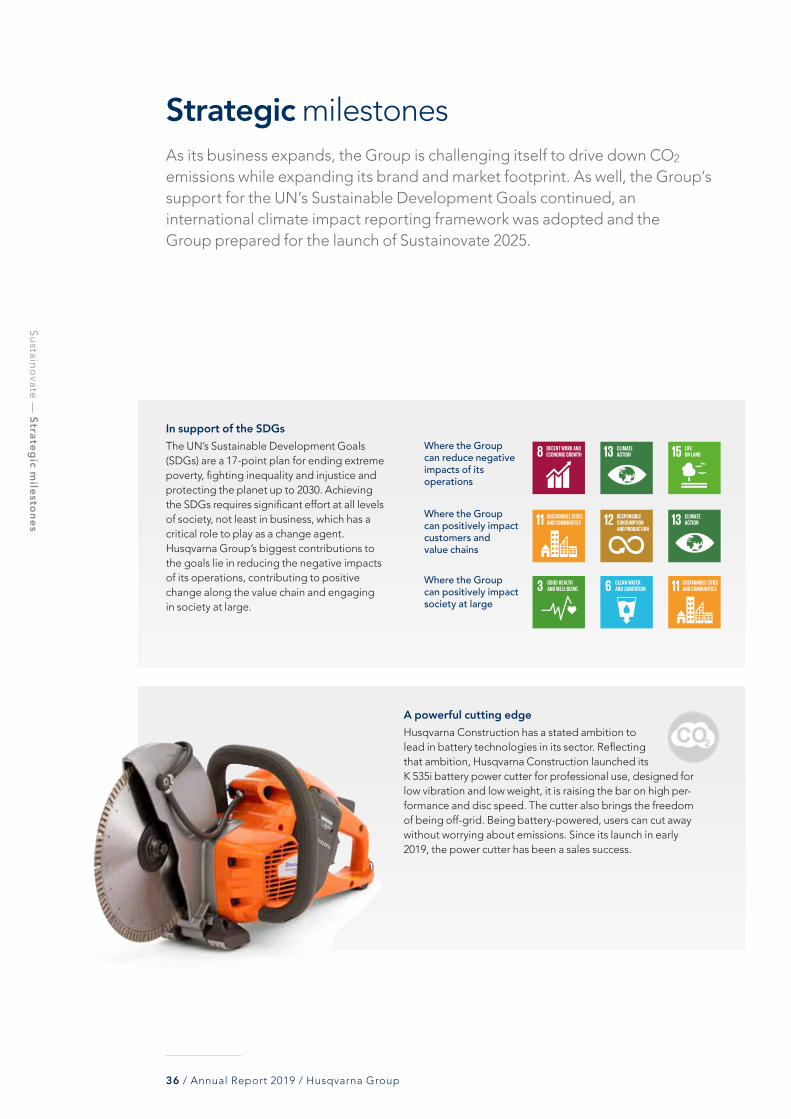
Where the Group can positively impact society at large
Where the Group can positively impact customers and value chains
Where the Group can reduce negative impacts of its operations
Strategic milestonesAs its business expands, the Group is challenging itself to drive down CO2 emissions while expanding its brand and market footprint. As well, the Group’s support for the UN’s Sustainable Development Goals continued, an international climate impact reporting framework was adopted and the Group prepared for the launch of Sustainovate 2025.
A powerful cutting edgeHusqvarna Construction has a stated ambition to lead in battery technologies in its sector. Reflecting that ambition, Husqvarna Construction launched its K 535i battery power cutter for professional use, designed for low vibration and low weight, it is raising the bar on high per-formance and disc speed. The cutter also brings the freedom of being off-grid. Being battery-powered, users can cut away without worrying about emissions. Since its launch in early 2019, the power cutter has been a sales success.
In support of the SDGsThe UN’s Sustainable Development Goals (SDGs) are a 17-point plan for ending extreme poverty, fighting inequality and injustice and protecting the planet up to 2030. Achieving the SDGs requires significant effort at all levels of society, not least in business, which has a critical role to play as a change agent. Husqvarna Group’s biggest contributions to the goals lie in reducing the negative impacts of its operations, contributing to positive change along the value chain and engaging in society at large.
Su
staino
vate —
Strategic milestones
36 / Annual Report 2019 / Husqvarna Group
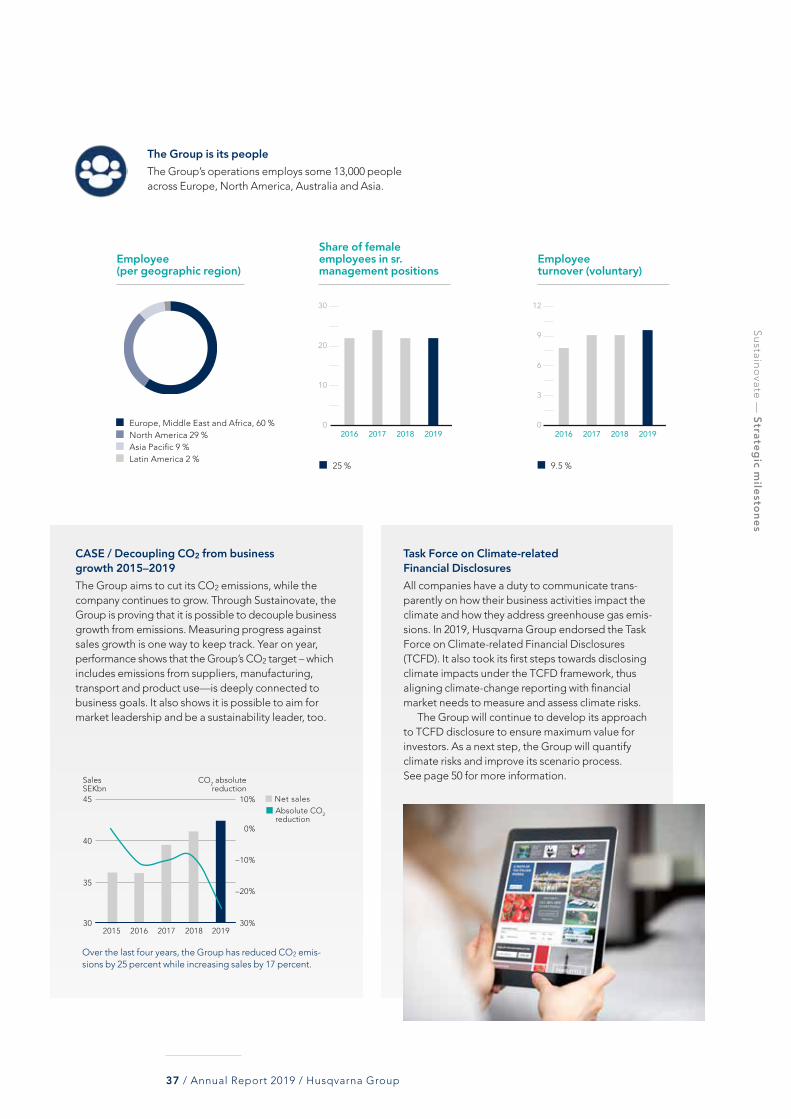
CASE / Decoupling CO2 from business growth 2015–2019The Group aims to cut its CO2 emissions, while the company continues to grow. Through Sustainovate, the Group is proving that it is possible to decouple business growth from emissions. Measuring progress against sales growth is one way to keep track. Year on year, performance shows that the Group’s CO2 target – which includes emissions from suppliers, manufacturing, transport and product use—is deeply connected to business goals. It also shows it is possible to aim for market leadership and be a sustainability leader, too.
Task Force on Climate-related Financial DisclosuresAll companies have a duty to communicate trans-parently on how their business activities impact the climate and how they address greenhouse gas emis-sions. In 2019, Husqvarna Group endorsed the Task Force on Climate-related Financial Disclosures (TCFD). It also took its first steps towards disclosing climate impacts under the TCFD framework, thus aligning climate-change reporting with financial market needs to measure and assess climate risks.
The Group will continue to develop its approach to TCFD disclosure to ensure maximum value for investors. As a next step, the Group will quantify climate risks and improve its scenario process. See page 50 for more information.
The Group is its peopleThe Group’s operations employs some 13,000 people across Europe, North America, Australia and Asia.
Share of female employees in sr. management positions
Employee turnover (voluntary)
Employee (per geographic region)
Europe, Middle East and Africa, 60 % North America 29 % Asia Pacific 9 % Latin America 2 %
25 % 9.5 %
0
3
6
9
12
20192018201720160
10
20
30
2019201820172016
30
35
40
45
30%
10%
0%
–10%
–20%
2018 2019201720162015
CO2 absolutereduction
SalesSEKbn
Net salesAbsolute CO2 reduction
Over the last four years, the Group has reduced CO2 emis-sions by 25 percent while increasing sales by 17 percent.
Su
staino
vate —
Strategic milestones
37 / Annual Report 2019 / Husqvarna Group

SUSTAINOVATE 2025 /
Solutions fit for the future
2025
In 2019, the Group set the course for its Sustainovate journey beyond 2020. It began with an inclusive materi-ality mapping and analysis of how the Group sees soci-ety evolving to 2030. In-depth research was done in key areas relating to climate change, resource scarcity and sustainability risks. The outcome was three Opportuni-ties to deliver value in an era of transformation. Approved by the Board this year, rollout of Sustaino-vate 2025 will begin in 2020.
While targets to 2020 focused on integrating sustaina-bility deeper into the business across five areas, Sustain-ovate 2025 addresses three opportunities for change. These include transformation to a low-carbon economy, pioneering ways to deliver great value to customers through circular economy solutions, and inspiring and engaging customers and employees in Group efforts.
Sustainovate’s overall ambition is to trigger creativ-ity, energy and pride across the company. Its aims high-light opportunities that leadership in sustainability
brings and have strongly influenced the 2025 business strategy. This further underlines how the sustainability agenda is business-critical for the Group.
Ambitious targets for 2025 Sustainovate’s three aspirations explain the difference the Group intends to make within Carbon, Circular and People. The three targets show if and when these aspi-rations have been achieved.
The new target of a 35 percent CO2 reduction across the value chain is an absolute reduction target rather than a carbon-intensity reduction, which was how the 2020 target was defined. The baseline year continues to be 2015. It is in line with the latest science and reflects what needs to be done to limit a global temperature increase to 1.5°C. 2020 is the starting point for Circular and People goals.
Husqvarna Group aims to challenge itself and inspire others to transform its industry. Through the creativity of its teams, the Group is pioneering solutions for step-change efficiency and smarter use of resources. By placing Sustainovate at the heart of its business, Husqvarna Group is shaping a company that is built to last.
Su
staino
vate —
Sustainovate 2025
38 / Annual Report 2019 / Husqvarna Group

CarbonDrive the transition to low-carbon solutions. In every aspect of the product life cycle, the Group is transitioning to low-carbon solutions in ways that benefit customers and deliver value to the bottom line. But the transition the world needs is to a zero-carbon economy. Battery technology and robotics have a significant role in delivering this. Through cooperation with supp-liers, leaner manufacturing and smarter product design, the Group is preventing hundreds of thousands of tons of CO2 from entering our atmosphere and is doing its part to tackle the grea-test challenge of our time.
Reduce CO2emissions by
–35%across the value chain
CircularRethink and redesign for a resource-smart customer experience. The Group is rethinking business models and the way it enhances the customer experience. It is reevaluating how customers get their jobs done more effectively through solutions and services, like sharing. The Group is making smarter use of the materials that comprise its products and is finding ways to reduce the use of natural materials and plastic. It is also extending product life cycles through reuse, resale, repair, and easy recycling for less waste. In short, a circular approach is looping the customer’s ‘end-to-end’ journey and bringing resource-lean innovation to the heart of how the Group delivers value.
Launch
50circular
innovations
PeopleInspire actions that make a lasting difference. Husqvarna Group wants to be a company that others look to for leadership and there is no better way to build trust than to make a difference together. This rests on bringing out the passion, drive and curiosity of both customers and teams. The Group is scaling up impact by inspiring customers to opt for the most sustainable choice, and triggering their imagination on the difference that they can make. The Group will inspire its teams by partnering with others and giving them the tools to be agents of change.
Empower
5Mcustomers and
colleagues to make sustainable choices
Su
staino
vate —
Sustainovate 2025
39 / Annual Report 2019 / Husqvarna Group
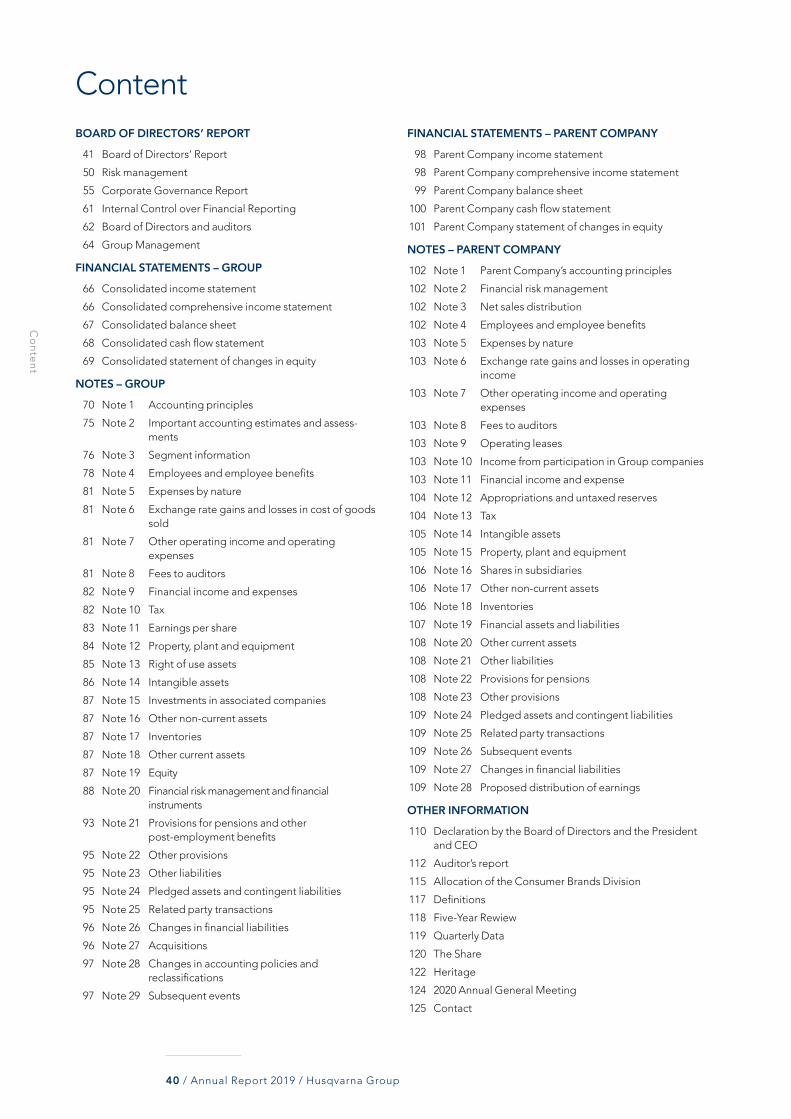
40 / Annual Report 2019 / Husqvarna Group
Co
nte
nt
BOARD OF DIRECTORS’ REPORT
41 Board of Directors’ Report
50 Risk management
55 Corporate Governance Report
61 Internal Control over Financial Reporting
62 Board of Directors and auditors
64 Group Management
FINANCIAL STATEMENTS – GROUP
66 Consolidated income statement
66 Consolidated comprehensive income statement
67 Consolidated balance sheet
68 Consolidated cash flow statement
69 Consolidated statement of changes in equity
NOTES – GROUP
70 Note 1 Accounting principles
75 Note 2 Important accounting estimates and assess-ments
76 Note 3 Segment information
78 Note 4 Employees and employee benefits
81 Note 5 Expenses by nature
81 Note 6 Exchange rate gains and losses in cost of goods sold
81 Note 7 Other operating income and operating expenses
81 Note 8 Fees to auditors
82 Note 9 Financial income and expenses
82 Note 10 Tax
83 Note 11 Earnings per share
84 Note 12 Property, plant and equipment
85 Note 13 Right of use assets
86 Note 14 Intangible assets
87 Note 15 Investments in associated companies
87 Note 16 Other non-current assets
87 Note 17 Inventories
87 Note 18 Other current assets
87 Note 19 Equity
88 Note 20 Financial risk management and financial instruments
93 Note 21 Provisions for pensions and other post-employment benefits
95 Note 22 Other provisions
95 Note 23 Other liabilities
95 Note 24 Pledged assets and contingent liabilities
95 Note 25 Related party transactions
96 Note 26 Changes in financial liabilities
96 Note 27 Acquisitions
97 Note 28 Changes in accounting policies and reclassifications
97 Note 29 Subsequent events
FINANCIAL STATEMENTS – PARENT COMPANY
98 Parent Company income statement
98 Parent Company comprehensive income statement
99 Parent Company balance sheet
100 Parent Company cash flow statement
101 Parent Company statement of changes in equity
NOTES – PARENT COMPANY
102 Note 1 Parent Company’s accounting principles
102 Note 2 Financial risk management
102 Note 3 Net sales distribution
102 Note 4 Employees and employee benefits
103 Note 5 Expenses by nature
103 Note 6 Exchange rate gains and losses in operating income
103 Note 7 Other operating income and operating expenses
103 Note 8 Fees to auditors
103 Note 9 Operating leases
103 Note 10 Income from participation in Group companies
103 Note 11 Financial income and expense
104 Note 12 Appropriations and untaxed reserves
104 Note 13 Tax
105 Note 14 Intangible assets
105 Note 15 Property, plant and equipment
106 Note 16 Shares in subsidiaries
106 Note 17 Other non-current assets
106 Note 18 Inventories
107 Note 19 Financial assets and liabilities
108 Note 20 Other current assets
108 Note 21 Other liabilities
108 Note 22 Provisions for pensions
108 Note 23 Other provisions
109 Note 24 Pledged assets and contingent liabilities
109 Note 25 Related party transactions
109 Note 26 Subsequent events
109 Note 27 Changes in financial liabilities
109 Note 28 Proposed distribution of earnings
OTHER INFORMATION
110 Declaration by the Board of Directors and the President and CEO
112 Auditor’s report
115 Allocation of the Consumer Brands Division
117 Definitions
118 Five-Year Rewiew
119 Quarterly Data
120 The Share
122 Heritage
124 2020 Annual General Meeting
125 Contact
Content

41 / Annual Report 2019 / Husqvarna Group
Board of Directors’ ReportThe Board of Directors (Board) and the President and CEO (the CEO) of Husqvarna AB (publ), corporate registration number 556000-5331, with its registered office in Jönköping, Sweden, hereby submit the Annual Report and consolidated financial statements for the 2019 financial year.
• Net sales increased by 3% to SEK 42,277m (41,085). Adjusted for changes in exchange rates* net sales decreased by 2%. Net sales increased by 1%, adjusted for the exited Consumer Brands business and changes in exchange rates*.
• Net sales, adjusted for changes in exchange rates* decreased by 4% in the Husqvarna Division, was flat in the Gardena Divi-sion and increased by 5% in the Construction Division.
• Operating income amounted to SEK 3,690m (2,070), and to SEK 3,915m (3,241), excluding items affecting comparability*.
• The higher operating income was primarily a result of price increases, restructuring and efficiency savings and was partly offset by continued investments in strategic growth initiatives as well as higher costs related to trade tariffs and raw materials.
• Operating margin, excluding items affecting comparability*, amounted to 9.3% (7.9).
• Net income amounted to SEK 2,528m (1,213).• Earnings per share amounted to SEK 4.42 (2.12) after dilution.• Operating cash flow* amounted to SEK 2,676m (–248).• Net working capital to sales amounted to 27.3% (25.9).• The net debt/equity ratio was 0.65 (0.62).• The Board proposes a dividend for 2019 of SEK 2.25 (2.25) per
share to the AGM.
Net sales and operating margin
0
10,000
20,000
30,000
40,000
50,000
20192018201720162015
SEKm %
0
3
6
9
12
15
Net sales, SEKm Operating margin, excluding items affecting comparability*, %
Key figures
SEKm 2019 2018 2017 1 2016 2015Net sales 42,277 41,085 39,394 35,982 36,170
Gross margin, % 29.6 25.6 29.1 30.8 28.1
EBITDA* 5,779 4,000 5,105 4,382 3,980
EBITDA margin, % 13.7 9.7 13.0 12.2 11.0
Items affecting comparability * 2 –225 –1,171 – – –153
Operating income 3,690 2,070 3,790 3,218 2,827
Operating income, excl. items affecting comparability * 3,915 3,241 3,790 3,218 2,980
Operating margin, % 8.7 5.0 9.6 8.9 7.8
Operating margin, excl. items affecting comparability *, % 9.3 7.9 9.6 8.9 8.2
Income after financial items 3,122 1,561 3,290 2,796 2,483
Net income 2,528 1,213 2,660 2,104 1,888
Earnings per share after dilution, SEK 4.42 2.12 4.62 3.66 3.28
Dividend per share, SEK 3 2.25 2.25 2.25 1.95 1.65
Return on capital employed, % 12.9 7.6 14.7 13.7 12.4
Return on equity, % 14.7 7.3 17.4 15.2 14.6
Net debt/equity ratio 0.65 0.62 0.46 0.48 0.49
Operating cash flow * 4 2,676 –248 1,847 1,666 1,732
Average number of employees 12,708 13,206 13,252 12,704 13,572
1 Restatement of 2017 due to IFRS 15 transition, reclassification of certain exchange rate effects, and reclassification of certain sales between segments. 2 Items affecting comparability* are provided on page 43.3 2019 as proposed by the Board.4 Cash flows related hedging of financing have been moved from operations to financing activities (SEK –64m for 2015). The equivalent amount has affected the operating cash flow. * Alternative Performance Measure, refer to “Definitions”.
Bo
ard R
ep
ort —
Board of D
irectors' Report
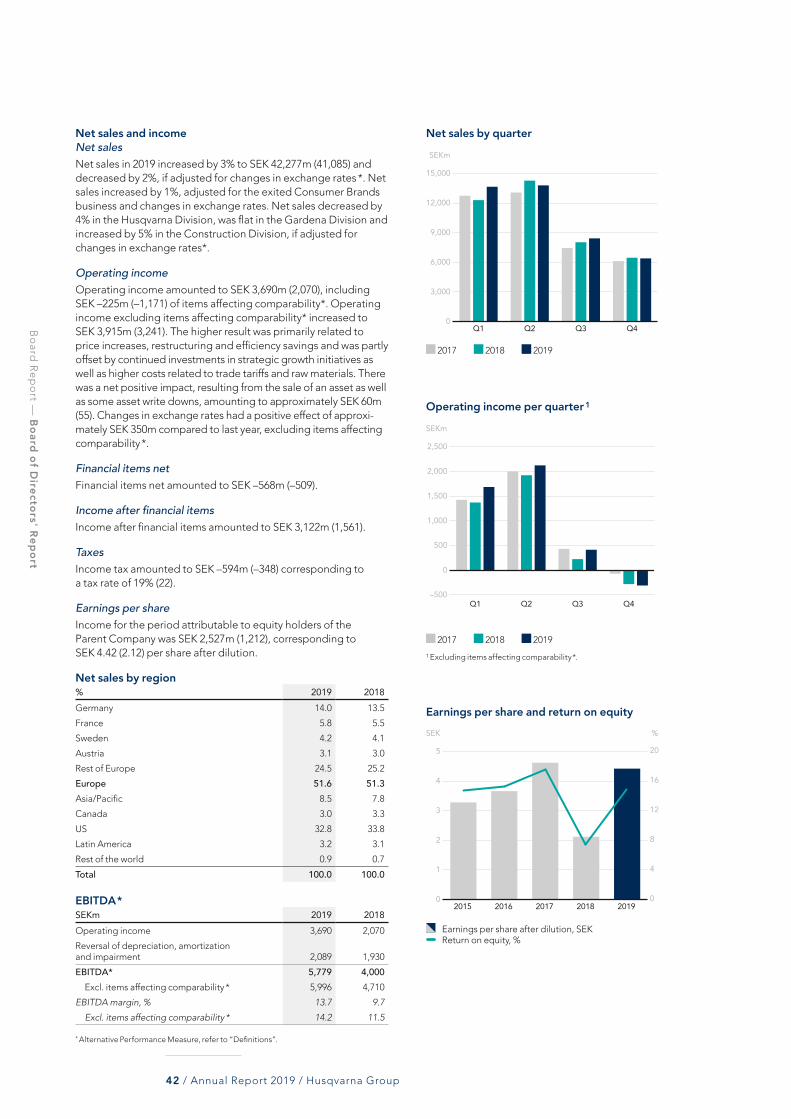
42 / Annual Report 2019 / Husqvarna Group
Net sales and incomeNet salesNet sales in 2019 increased by 3% to SEK 42,277m (41,085) and decreased by 2%, if adjusted for changes in exchange rates *. Net sales increased by 1%, adjusted for the exited Consumer Brands business and changes in exchange rates. Net sales decreased by 4% in the Husqvarna Division, was flat in the Gardena Division and increased by 5% in the Construction Division, if adjusted for changes in exchange rates*.
Operating incomeOperating income amounted to SEK 3,690m (2,070), including SEK –225m (–1,171) of items affecting comparability*. Operating income excluding items affecting comparability* increased to SEK 3,915m (3,241). The higher result was primarily related to price increases, restructuring and efficiency savings and was partly offset by continued investments in strategic growth initiatives as well as higher costs related to trade tariffs and raw materials. There was a net positive impact, resulting from the sale of an asset as well as some asset write downs, amounting to approximately SEK 60m (55). Changes in exchange rates had a positive effect of approxi-mately SEK 350m compared to last year, excluding items affecting comparability *.
Financial items netFinancial items net amounted to SEK –568m (–509).
Income after financial itemsIncome after financial items amounted to SEK 3,122m (1,561).
TaxesIncome tax amounted to SEK –594m (–348) corresponding to a tax rate of 19% (22).
Earnings per shareIncome for the period attributable to equity holders of the P arent Company was SEK 2,527m (1,212), corresponding to SEK 4.42 (2.12) per share after dilution.
Net sales by region% 2019 2018Germany 14.0 13.5
France 5.8 5.5
Sweden 4.2 4.1
Austria 3.1 3.0
Rest of Europe 24.5 25.2
Europe 51.6 51.3Asia/Pacific 8.5 7.8
Canada 3.0 3.3
US 32.8 33.8
Latin America 3.2 3.1
Rest of the world 0.9 0.7
Total 100.0 100.0
EBITDA*SEKm 2019 2018Operating income 3,690 2,070
Reversal of depreciation, amortization and impairment 2,089 1,930
EBITDA* 5,779 4,000 Excl. items affecting comparability * 5,996 4,710
EBITDA margin, % 13.7 9.7
Excl. items affecting comparability * 14.2 11.5
0
3,000
6,000
9,000
12,000
15,000
Q4Q3Q2Q1
SEKm
2017 2018 2019
Net sales by quarter
–500
0
500
1,000
1,500
2,000
2,500
Q4Q3Q2Q1
SEKm
2017 2018 2019
1 Excluding items affecting comparability *.
Operating income per quarter 1
0
1
2
3
4
5
20192018201720162015
SEK %
0
4
8
12
16
20
Earnings per share after dilution, SEK Return on equity, %
Earnings per share and return on equity
* Alternative Performance Measure, refer to “Definitions”.
Bo
ard R
ep
ort —
Board of D
irectors' Report

43 / Annual Report 2019 / Husqvarna Group
Items affecting comparability *
SEKm 2019 2018 2017 2016 2015Restructuring related expenses –225 –1,171 – – –153
Total –225 –1,171 – – –153
Restructuring related expenses
SEKm 2019 2018Restructuring provisions –213 –382
Impairment of non-current assets –8 –461
Write down of inventory –4 –328
Total items affecting comparability * –225 –1,171
Classification in the income statement
SEKm 2019 2018Cost of goods sold –117 –1,077
Selling expenses –57 –48
Administrative expenses –51 –46
Total items affecting comparability* –225 –1,171
Operating cash flow*Operating cash flow* increased to SEK 2,676m (–248). The increase was related to higher operating income and positive effects from changes in inventories and trade receivables and was partly offset by changes in payables
SEKm 2019 2018Cash flow from operations, excluding changes in operating assets and liabilities 4,476 3,196
Cash flow from operating assets and liabilities 432 –1,209
Cash flow from operations 4,908 1,987Cash flow from investments in property, plant and equipment and intangible assets –2,232 –2,235
Operating cash flow* 2,676 –248
Capital expenditure and Research & Development (R&D)Capital expenditure in 2019 amounted to SEK 2,232m (2,235), corresponding to 5.3% (5.4) of net sales. Investments in property, plant and equipment amounted to SEK 1,577m (1,542) and investments in intangible assets, exclusive goodwill, totalled SEK 655m (693), of which SEK 521m (493) was related to product development and SEK 133m (199) to IT and software.
R&D expenses, which are included in cost of goods sold, amounted to SEK 1,720m (1,581), of which SEK 351m (265) was amortization of capitalized product development (intangible assets). The total R&D expenses thus corresponded to 4.1% (3.8) of net sales.
–400
0
400
800
1,200
1,600
2,000
2,400
2,800
20192018201720162015
SEKm %
–1
0
1
2
3
4
5
6
7
Operating cash flow, SEKm Operating cash flow/net sales, %
Operating cash flow*
0
400
800
1,200
1,600
2,000
2,400
20192018201720162015
SEKm %
0
1
2
3
4
5
6
Capital expenditure, SEKm Capital expenditure/net sales, %
Capital expenditure
* Alternative Performance Measure, refer to “Definitions”.
Bo
ard R
ep
ort —
Board of D
irectors' Report

44 / Annual Report 2019 / Husqvarna Group
Financial positionOperating working capital*Operating working capital* at year-end amounted to SEK 10,379m (10,058). Inventories decreased to SEK 10,858m (11,067), trade receivables amounted to SEK 3,620m (3,613) and trade pay-ables amounted to SEK 4,099m (4,622).
Change in operating working capital*
SEKmDecember 31, 2018 10,058Changes in exchange rates 377
Changes in working capital –56
December 31, 2019 10,379
EquityGroup equity as of December 31, 2019, excluding non-controlling interests, increased to SEK 17,281m (16,007), corresponding to SEK 30.2 (28.0) per share after dilution.
Net debt*Net debt* amounted to SEK 11,315m (9,875). The net pension liability increased to SEK 2,427m (1,943), other interest-bearing liabilities increased to SEK 11,786m (10,013) and liquid funds and other interest-bearing assets increased to SEK 2,898m (2,081).
The net debt/equity ratio rose to 0.65 (0.62) and the equity/assets ratio was 41% (41). For more information about the Group’s funding, see note 20.
SEKm 2019 2018Net pension liability 2,427 1,943
Other interest-bearing liabilities 11,786 10,013
Less: Liquid funds and other interest-bearing assets –2,898 –2,081
Net debt * 11,315 9,875Net debt/equity ratio 0.65 0.62
Equity/assets ratio, % 41 41
Net debt/EBITDA 1.9 1.8
0.0
0.2
0.4
0.6
0.8
1.0
20192018201720162015
%Times
0
10
20
30
40
50
Net debt/equity ratio Equity/assets ratio, %
Net Debt/Equity and Equity/Assets ratio
* Alternative Performance Measure, refer to “Definitions”.
0,0
0,5
1,0
1,5
2,0
2,5
20192018201720162015
%Times
Net debt/EBITDA 1 ,SEKm
Net debt/EBITDA 1
1 Excluding items affecting comparability *.
Bo
ard R
ep
ort —
Board of D
irectors' Report

45 / Annual Report 2019 / Husqvarna Group
Performance by business segmentHusqvarna Division Net sales in the Husqvarna Division increased by 1% or decreased by 4% adjusted for changes in exchange rates*. Net sales was flat when adjusted for exited Consumer Brands business.
Operating income increased to SEK 2,260m (1,228). Operating income, excluding items affecting comparability*, increased to SEK 2,427m (2,106) and the operating margin was 8.8% (7.8). Price increases, restructuring and efficiency savings contributed posi-tively and was partly offset by higher costs for tariffs and raw materials as well as strategic growth initiatives. Items affecting comparability* amounted to SEK –167m (–878). Changes in exchange rates had a positive effect of approximately SEK 210m compared with last year, excluding items affecting comparability *.
Husqvarna
SEKm 2019 2018Change,
%Net sales 27,506 27,156 1
Currency adjusted change *, % –4 –2 –
Operating income 2,260 1,228 84
Excl. items affecting comparability * 2,427 2,106 15
Operating margin, % 8.2 4.5 –
Excl. items affecting comparability * 8.8 7.8 –
Gardena DivisionNet sales in the Gardena Division increased by 3% or was unchanged if adjusted for changes in exchange rates*. Net sales increased by 3% when adjusted for exited Consumer Brands business.
Operating income increased to SEK 847m (425). Operating income, excluding items affecting comparability*, increased 30% to SEK 847m (651) and the operating margin was 10.2% (8.0), excluding items affecting comparability*. Price increases, mix improvements as well as restructuring and efficiency savings had a positive impact. Items affecting comparability* amounted to SEK 0m (–226). Changes in exchange rates had a positive effect of approximately SEK 25m compared with last year, excluding items affecting comparability*.
Gardena
SEKm 2019 2018Change,
%Net sales 8,343 8,118 3
Currency adjusted change *, % 0 8 –
Operating income 847 425 99
Excl. items affecting comparability * 847 651 30
Operating margin, % 10.2 5.2 –
Excl. items affecting comparability * 10.2 8.0 –
0
5,000
10,000
15,000
20,000
25,000
30,000
20192018201720162015
SEKm
Net sales, SEKm
Net sales, Husqvarna
0
2,000
4,000
6,000
8,000
10,000
20192018201720162015
SEKm
Net sales, SEKm
Net sales, Gardena
0
600
1,200
1,800
2,400
3,000
20192018201720162015
SEKm %
0
4
8
12
16
20
Operating income 1, SEKm Operating margin 1, %
Operating income and margin, Husqvarna
0
170
340
510
680
850
20192018201720162015
SEKm %
0
4
8
12
16
20
Operating income 1, SEKm Operating margin 1, %
Operating income and margin, Gardena
1 Excluding items affecting comparability *.* Alternative Performance Measure, refer to “Definitions”.
1 Excluding items affecting comparability *.* Alternative Performance Measure, refer to “Definitions”.
Bo
ard R
ep
ort —
Board of D
irectors' Report

46 / Annual Report 2019 / Husqvarna Group
Construction DivisionNet sales in the Construction Division increased by 10% or by 5% if adjusted for changes in exchange rates*.
Operating income increased to SEK 779m (672). Operating income, excluding items affecting comparability*, increased to SEK 836m (716) and the operating margin was 13.2% (12.4), excluding items affecting comparability*. Higher sales volumes and price increases contributed positively. Items affecting compa-rability* amounted to SEK –57m (–44). Changes in exchange rates had a positive effect of approximately SEK 115m compared with last year, excluding items affecting comparability*.
Construction
SEKm 2019 2018Change,
%Net sales 6,340 5,762 10
Currency adjusted change*, % 5 12 –
Operating income 779 672 16
Excl. items affecting comparability* 836 716 17
Operating margin, % 12.3 11.7 –
Excl. items affecting comparability* 13.2 12.4 –
Restructuring of the Consumer Brands DivisionAs communicated in press releases in 2018, Husqvarna Group is exiting certain low-margin petrol-powered product segments in the underperforming former Consumer Brands Division and instead focusing on its strengths in premium offerings under the core brands of Husqvarna and Gardena.
Restructuring measures were implemented 2018–2019 with a total cost of some SEK 1.2 billion before tax, of which some SEK 400m refers to cash items. In 2018, and in the first quarter of 2019 a total of SEK 1,171m and SEK 42m respectively was reported as restructuring related expenses and charged to the Group’s income statement. The restructuring measures has resulted in annual savings of around SEK 250m with full effect from 2020. The lower business volume will also reduce the net working capital need in the Group by up to SEK 1 billion over the coming years. In 2019 the Group exited net sales of SEK 1.4 billion.
Additional restructuring initiativesIn November 2019 additional restructuring initiatives were launched. The initiatives are expected to deliver annual cost sav-ings of SEK 150m, of which the majority will be realized in 2020 and the remainder in 2021. Restructuring costs for the initiatives are expected to amount to about SEK 200m, whereof SEK 183m were charged to the result in the fourth quarter of 2019. In 2020, the group plan to exit about SEK 2.2 billion of low gross margin business that previously was within the Consumer Brands Divi-sion.
Financial targets presented at the Capital Markets Day A Capital Markets Day was held on September 17, 2019. Financial targets was presented and as from 2020 the Group’s three financial targets are:• Annual net sales growth of 4–5%, defined as 2 percentage
points above market growth (historically 2–3%).• An operating margin above 10%. • Operating working capital in relation to net sales of a maximum
of 25%.
Group management changesPavel Hajman, Senior Vice President Operations Development, assumed the additional role as CIO (Chief Information Officer) effective October 11, 2019. Pavel replaces Hillevi Agranius, who left Husqvarna Group on October 11, 2019 for an external oppor-tunity.
Acquisition of power trowel businessIn 2019, Husqvarna Group’s Construction Division has acquired the Concrete Power Trowel business from Wacker Neuson Group. The acquisition included all the product, R&D and manufacturing assets relating to walk-behind and ride-on concrete power trowels. Sales in the power trowel segment (acquired assets) in 2018 amounted to about SEK 150m.
Subsequent eventsAppointment of new President and CEOThe Board of Husqvarna AB has appointed Henric Andersson to succeed Kai Wärn as the President and CEO of the Husqvarna Group effective as of April 2, 2020, following the closing of the 2020 AGM. Henric Andersson is currently President of the Con-struction Division of Husqvarna Group and has been a member of Group Management team since 2012. He was born in 1973 and has a Master of Science degree in Industrial Engineering & Man-agement from Linköping Institute of Technology, Sweden.
0
2,000
4,000
6,000
8,000
20192018201720162015
SEKm
Net sales, SEKm
Net sales, Construction
0
200
400
600
800
1,000
20192018201720162015
SEKm %
0
3
6
9
12
15
Operating income 1, SEKm Operating margin 1, %
Operating income and margin, Construction
1 Excluding items affecting comparability*.* Alternative Performance Measure, refer to “Definitions”.
Bo
ard R
ep
ort —
Board of D
irectors' Report

47 / Annual Report 2019 / Husqvarna Group
Parent CompanyNet sales for 2019 for the Parent Company, Husqvarna AB, amounted to SEK 17,838m (17,185), of which SEK 13,983m (13,612) referred to sales to Group companies and SEK 3,855m (3,573) to external customers.
Income after financial items increased to SEK 8,512m (–415), mainly due to Group internal transactions. Income for the period increased to SEK 8,530m (55). For more information, refer to note 10 in the Parent Company. Investments in property, plant and equipment and intangible assets amounted to SEK 1,215m (1,303). Cash and cash equivalents amounted to SEK 650m (165) at the end of the year. Undistributed earnings in the Parent Com-pany amounted to SEK 27,351m (20,334).
The Husqvarna share At year-end 2019, the share capital in Husqvarna AB amounted to SEK 1,153m (1,153), comprising of 112,015,629 A-shares (112,437,551) and 464,328,149 B-shares (463,906,227).
For further information on the change in the number of shares during the year, see note 19. Each A-share carries one vote and each B-share carries 1/10th of a vote. All shares enjoy equal rights in terms of the Company’s assets and earnings. There are no restrictions on the transfer of shares, voting rights or the right to participate in the Annual General Meeting (AGM).
The Company is not aware of any agreements between share-holders that may limit the right to transfer shares. In addition, there are no stipulations in the Articles of Association regarding appointment or dismissal of Board members or agreements between the Company and Board members or employees that require remuneration if such persons leave their posts, or if employment is terminated, as a result of a public bid to acquire shares in the Company.
As of December 31, 2019, the largest shareholders were Investor AB, with 33.1% (33.0) of the votes, and L E Lundberg-företagen, with 25.1% (25.1) of the votes. No other shareholder held more than 10% of the votes. Market capitalization amounted to SEK 43bn (38) at the end of 2019. For more information on major shareholders, see section “The share”.
Authorization for new share issue and equity swaps of B-Shares The 2019 AGM resolved to authorize the Board to decide on one or more occasions, until the next AGM, to have the Company enter into one or more share swap agreements with third parties on terms consistent with market practice. The purpose is to secure the Company’s obligations due to adopted incentive programs.
The participants in the Group’s long-term incentive programs have been granted share awards and when the conditions of the performance period for each program ends, shares are trans-ferred to them in accordance with the conditions of the programs and made without consideration.
The participants in the Husqvarna LTI 2016 program were granted matching and performance share awards in 2016 and 529,252 B-shares were transferred to the participants in May 2019 when the vesting period ended.
At year-end 2019, Husqvarna AB had equity-swap agreements whereby a third-party bank had acquired 4,141,164 B-shares to cover obligations under Husqvarna long-term incentive programs.The Company did not own any own shares at the end of 2019.
In addition, the 2019 AGM authorized the Board to resolve to issue not more than 57.6 million B-shares, representing 10% of the total number of shares in issue, to facilitate acquisitions where the consideration will be paid with own shares. No such issuance was made in 2019.
Legal matters and complianceCompanies within Husqvarna Group are involved in commercial, product liability, regulatory and other disputes in the ordinary course of business. Such disputes can involve claims for compen-satory damages, fines and penalties, property damage or personal injury compensation and occasionally also punitive damages. For certain types of claims (primarily product liability litigation), the Group has self-insurance, up to certain limits, as well as external “excess” coverage. The Group continuously monitors and evalu-ates pending claims and disputes, and acts when deemed neces-sary. The Company believes that these activities help to minimize such risks. It is difficult to predict the outcome of each dispute, but based on its present knowledge, the Group estimates that none of the disputes in which it is currently involved will have a material adverse effect on the consolidated financial position or result.
Husqvarna Group is committed to a culture of compliance. Honesty and fairness have always characterized the Group´s way of doing business and the highest standards of integrity are expected of every employee in every country where the Group does business. Such commitment is reflected in the Code of Con-duct that was adopted in 2008 and substantially revised in 2018.
In 2019 over 3,600 Group employees participated in either online or live Code of Conduct training which was also offered to all new hires. Additionally, employees who become aware of any non-compliance or other unethical conduct are expected to report such matters to the internal compliance function. Such reports may be made directly to a manager, via a dedicated com-pliance email or anonymously via a 24-hour toll-free call-in center or online at husqvarnagroup.ethicspoint.com.
Husqvarna Group requires that all of its suppliers, agents, distributors and other business partners (“Third-Parties”) comply with the business and workplace standards as defined in the Code of Conduct. In 2019, the Group further strengthened its compliance focus through several new policies and programs, including a new Third-Party Due Diligence Policy, further safe-guarding that the Group is only doing business with reputable and compliant Third-Parties. Husqvarna AB also become a mem-ber of Transparency International Sweden’s Corporate Supporters Forum in 2019 which is committed to the education, awareness and prevention of corruption among its corporate members.
SustainabilityIn accordance with the Swedish Annual Accounts Act chapter 6, §11, Husqvarna Group has chosen to establish the statutory sus-tainability report as a report separated from the Annual Report. The sustainability report (Sustainovate Progress report 2019) has been submitted to the auditor at the same time as the Annual Report and is available on www.husqvarnagroup.com.
The sustainability report presents “Sustainovate”, which is Husqvarna Group’s approach to integrate sustainability into the business. The report is framed around five challenges that are most relevant to the Group’s ability to create economic, social and environmental value for its stakeholders. According to the Swedish Annual Accounts Act chapter 6, §12, Husqvarna Group is required to report on certain sustainability and corporate respon-sibility related issues which are presented in the Sustainovate Progress report 2019. A table describing policies and procedures, sustainability risks, management systems and monitoring pro-cesses of material issues relating to the environment, human rights, social and personnel and anti-corruption is available on page 43 in the report.
Task Force on Climate-Related Financial Disclosures (TCFD)The Husqvarna Group supports the recommendations of the Task Force on Climate-Related Financial Disclosures (TCFD), which are
Bo
ard R
ep
ort —
Board of D
irectors' Report
48 / Annual Report 2019 / Husqvarna Group
intended to ensure that investors and other stakeholders are ade-quately informed about the risks posed to companies by climate change. In line with the TCFD recommendations, the Group has included in this 2019 Annual Report certain information regarding the Governance and Risk Management of such topics. See Risk Management section on page 50.
Environmental permits In 2019, Husqvarna Group operated 30 production facilities, of which 20 were in Europe, four in the US, three in China, one in Brazil, Japan and Australia. All facilities have the environmental permits required for current operations.
Husqvarna Group included in CSR indexesHusqvarna Group is a member of the FTSE4Good Index Series and a member of the STOXX Global ESG Leaders index. These indexes are designed to facilitate investments in companies that meet globally recognized corporate responsibility standards in environmental care, social care and corporate governance.
Employees The average number of employees in 2019 was 12,708 (13,206), of which 2,117 (2,069) were employed in Sweden. At year-end, the total number of employees was 13,083 (14,076). Of the total aver-age number of employees in 2019, 8,582 (8,693) were men and 4,126 (4,513) were women.
Salaries and remuneration in 2019 amounted to SEK 5,833m (5,712), of which SEK 1,311m (1,263) refers to Sweden. For more information on employees, see note 4.
Annual General Meeting 2020The AGM of Husqvarna AB (publ) will be held in Jönköping, Sweden on April 2, 2020.
Notification and proposals to the AGM The notification to attend the 2020 AGM has been available on the Group’s website, www.husqvarnagroup.com, since February 28, 2020. The full proposal to the AGM will be available on the Group’s website at the latest by March 12, 2020.
Proposed distribution of earnings The Board proposes a dividend for 2019 of SEK 2.25 per share (2.25) corresponding to a total dividend payment of SEK 1,287m (1,286) based on the number of outstanding shares at the end of 2019. It is also proposed that the dividend be paid in two install-ments to better match the Group’s cash flow profile, with one pay-ment of SEK 0.75 per share in April and the remaining SEK 1.50 per share in October. The proposed record dates are April 6, 2020, for the first payment and October 6, 2020, for the second payment.
SEKtThe following profits are at the disposal of the AGM:
Share premium reserve 2,605,747
Retained earnings 16,215,401
Net income 8,530,250
Total 27,351,398
SEKtThe Board proposes the following allocation of available profits:
Dividend to the shareholders of SEK 2.25 per share 1 1,287,456
To be carried forward 26,063,942
Total 27,351,398
1 Calculated on the number of outstanding shares as of December 31, 2019.
The Board is of the opinion that the dividend proposed above is justifiable on both the Company and the Group level with regard to the demands on the Company and Group equity imposed by the type, scope and risks of the business and with regard to the Company and the Group’s financial strength, liquidity and overall position.
Principles for remuneration to Group Management and remuneration to the Board For the CEO and other members of Group Management, the principles for remuneration approved by the 2019 AGM currently apply. The principles are subject for review and the Board will pro-pose that the updated principles set out below should be approved by the 2020 AGM for the period up to and including the 2021 AGM.
The Board proposes that the following remuneration guide-lines, for the CEO and other members of Group Management, should be approved by the 2020 AGM.
These guidelines do not apply to any remuneration otherwise decided or directly approved by the AGM or other general meeting.
The overarching ambition of the Group’s strategy is market leadership, of which long-term profitable growth and being the innovation leader are important aspects. Built on a strategy for market leadership, the Group’s business model is designed for profitable growth, bringing the best forestry, lawn and garden and construction solutions to the market by maximizing assets and minimizing waste and carbon dioxide from operations. Further information on the Group’s strategy and financial targets can be found on the Group’s website, www.husqvarnagroup.com.
A prerequisite for the successful implementation of the Com-pany’s business strategy and safeguarding of its long-term inter-ests, including its sustainability, is that the Company is able to recruit and retain qualified personnel. To this end, it is necessary that the Company offers competitive remuneration.
The guidelines set forth in this section shall apply to remuner-ation and other employment conditions of Group Management. The guidelines shall apply to contracts of employment entered into after the 2020 AGM and also to amendments made thereaf-ter to contracts of employment which are in force.
Remuneration to members of Group Management shall be on market terms and based on the position held, individual perfor-mance and Group performance, and shall be on a competitive basis in the country of employment. The overall remuneration package for Group Management is comprised of fixed cash sal-ary, variable cash remuneration in the form of short-term incen-tives based on annual performance targets, long-term incentives, pension and other benefits. In addition, there are conditions on notice of termination and severance pay.
Additionally, the general meeting may – irrespective of these guidelines – resolve on, among other things, share-related or share price-related remuneration.
Husqvarna Group shall aim to offer a competitive total remu-neration level with a primary focus on “pay for performance”. For more information on principles for remuneration to Group Man-agement and remuneration to the Board, refer to note 4.
Fixed cash salary Fixed salary shall constitute the basis for total remuneration and may amount to not more than 70% of the total remuneration. The salary shall be related to the relevant market and shall reflect the degree of impact, contribution and knowledge involved in the position. The salary levels shall be reviewed regularly (normally annually) in order to ensure continued competitiveness and reward performance.
Bo
ard R
ep
ort —
Board of D
irectors' Report
49 / Annual Report 2019 / Husqvarna Group
Variable cash remuneration (Short-term Incentive, ”STI”) The satisfaction of criteria for awarding variable cash remunera-tion shall be measured over a period of one year. The variable cash remuneration may amount to not more than 150% of the fixed salary and not more than 50% of the total remuneration. The Board decides whether the maximum levels shall be utilized or if a lower level shall be used. The level of STI is set by the Board based on size of position, taking into account degree of impact, contribution and knowledge involved in the position but also country of employment.
The STI shall be based on the financial result for the Group and/or for the business unit for which the member of Group Manage-ment is responsible. The variable remuneration shall be based on predetermined and measurable criterias, such as operating income, net sales growth, operating working capital and cost efficiency pro-grams. Each criteria/target has a defined minimum/entry level, which must be exceeded for variable remuneration to be paid, and a maximum/stretch level. The criteria are designed so as to contrib-ute to the Company’s business strategy and long-term interests, including its sustainability. To which extent the criteria for awarding variable remuneration has been satisfied shall be evaluated/deter-mined when the measurement period has ended. The People & Sustainability Committee (formerly the “remuneration committee”, see page 58) is responsible for the evaluation and it shall be based on the latest financial information made public by the Company.
Long-term incentiveThe Board will annually evaluate if a long-term incentive program should be offered and be proposed to the AGM. The award level of such long-term incentive program may amount to not more than 120% of the fixed salary when the program is launched and not more than 50% of the total remuneration.
Pension and other benefits Pension and disability benefits shall be designed to reflect regula-tions and practice in the country of employment. Pension plans shall be defined contribution plans and the employer contribu-tion, including contributions for disability pension/insurance, may amount to not more than 40% of the fixed cash salary and not more than 30% of the total remuneration.
Other benefits may include, for example, life and health care insurance, housing allowance and company cars. Costs relating to such benefits may amount to not more than 20% of the fixed cash salary and not more than 15% of the total remuneration. For employments governed by mandatory rules, pension and other benefits may be duly adjusted for compliance with mandatory rules or established local practice, taking into account, to the extent possible, the overall purpose of these guidelines.
Group Management members who are expatriates may receive additional remuneration and benefits to the extent rea-sonable in light of the special circumstances associated with the expatriate arrangement, taking into account, to the extent possi-ble, the overall purpose of these guidelines. Such remuneration and benefits may not in total exceed 80% of the fixed cash salary.
Termination of employment The notice period may not exceed twelve months if notice of ter-mination of employment is made by the Company. Fixed cash sal-ary during the period of notice and severance pay may together not exceed an amount equivalent to fixed salary for two years. The period of notice may not exceed six months without any right to severance pay when termination is made by the executive. Members of Group Management shall be obliged not to com-pete with the Company during the notice period. Based on the circumstances in each case, a non-compete obligation with con-
tinued severance pay may be applied also after the end of the notice period. Non-compete obligation shall not apply for more than 24 months from the end of the notice period and the sever-ance pay during such non-compete period may not exceed an amount equivalent to the fixed salary.
Additionally remuneration may be paid for non-compete undertakings to compensate for loss of income and shall only be paid in so far as the previously employed Group Management member is not entitled to severance pay. The remuneration shall amount to not more than 60% of the fixed salary at the time of ter-mination of employment, unless otherwise provided by manda-tory collective agreement provisions, and be paid during the time the non-compete undertaking applies, however not for more than 24 months following termination of employment.
Salary and employment conditions for employees In the preparation of the Board’s proposal for these remuneration guidelines, salary and employment conditions for employees of the Company have been taken into account by including informa-tion on the employees’ total income, the components of the remuneration and increase and growth rate over time, in the People & Sustainability Committee’s and the Board’s basis of decision when evaluating whether the guidelines and the limitations set out herein are reasonable. The development of the gap between the remuneration to executives and remuneration to other employees will be disclosed in the remuneration report.
The decision-making process to determine, review and implement the guidelines The Board has established a People & Sustainability Committee. The Committee’s tasks include preparing the Board’s decision to propose guidelines for Group Management remuneration. The Board shall prepare a proposal for new guidelines at least every fourth year and submit it to the general meeting. The guidelines shall be in force until new guidelines are adopted by the general meeting. The People & Sustainability Committee shall also moni-tor and evaluate programs for variable remuneration for Group Management, the application of the guidelines for Group Man-agement remuneration as well as the current remuneration struc-tures and compensation levels in the Company.
The members of the People & Sustainability Committee are inde-pendent of the Company and its Group Management. The CEO and other members of Group Management do not participate in the Board’s processing of and resolutions regarding remuneration-related matters in so far as they are affected by such matters.
Derogation from the guidelines The Board may temporarily resolve to derogate from the guide-lines, in whole or in part, if in a specific case there is special cause for the derogation and a derogation is necessary to serve the Com-pany’s long-term interests, including its sustainability, or to ensure the Company’s financial viability. As set out above, the People & Sustainability Committee’s tasks include preparing the Board’s res-olutions in remuneration-related matters. This includes any resolu-tions to derogate from the guidelines. Any derogation from the guidelines must not cause any of the remuneration elements to exceed two times the maximum level specified in these guidelines.
Remuneration to the Board 2019Remuneration to AGM-elected Board members is resolved by the AGM based on proposals from the Nomination Committee. The 2019 AGM resolved on fees of SEK 6,290t. No consulting fees were paid to Board members and no Board fees are paid to Board members who are also employed by the Group. For more infor-mation concerning remuneration, see note 4.
Bo
ard R
ep
ort —
Board of D
irectors' Report

50 / Annual Report 2019 / Husqvarna Group
Risk managementAll business operations involve risk. Therefore, the goal of risk management is not to eliminate risk, but rather to optimize an organization’s risk portfolio to best secure its business goals. The Husqvarna Group has therefore implemented controls and governance processes to identify and prioritize all material risks that may affect its operations, and to limit, control and proactively manage these risks.
Task Force on Climate-Related Financial Disclosures (TCFD)In 2016, the Task Force on Climate-Related Financial Disclosures (TCFD) issued a set of recommendations on how companies should improve disclosures relating to risks and opportunities posed by climate change, including disclosures relating to gover-nance, strategy, risk management, metrics and targets. In 2019, the Husqvarna Group formally endorsed the recommendations of TCFD and began work to implement those recommendations in its annual reporting process. As part of this, the Group engaged senior management and subject-matter experts to ensure that these risks are identified and managed as an inte-grated part of the overall risk management efforts. The Group has also formalized oversight responsibilities for climate-related risks including at the Board and Group Management levels. Beyond improving transparency via public disclosures, these efforts have also spurred further efforts by Group Management to develop plans for addressing risks related to climate change and, where possible, to take advantage of potential business opportunities.
In order to ensure an integrated approach, the Group has decided to make TCFD disclosures part of the overall Risk Man-agement section and, where applicable, elsewhere in this Annual Report. To facilitate ease of reference, the Group has indi-cated below those specific disclosures which are particularly relevant to TCFD with the symbol “>”.
At present, the majority of TCFD related disclosures are “qualitative” in nature. As work on these topics matures, the Group aims to provide more “quantitative” disclosures, including potential financial impacts based on various future scenarios and, possibly, more specific targets and metrics.
Responsibilities and accountability The Board is ultimately responsible for ensuring effective risk man-agement. The Board has delegated this responsibility, in part, to the CEO, who must act in accordance with the Board´s guidelines and instructions. Presidents of divisions and Senior Vice Presidents of the Group functions, in turn, are responsible for risk manage-ment implementation within their respective divisions and areas of responsibility. The Group also has a dedicated risk management function that:• oversees the Group’s overall Enterprise Risk Management
program, • secures appropriate insurance coverage for insurable risks, and• assesses and facilitates the prioritization of the Group’s risks. Management of financial risks, including currency exchange rate exposure, is primarily the responsibility of Group Treasury.
Integration in core business processes – The process for identifying, assessing and managing risk is an integral part of the core business processes, including periodic strategy updates, the annual budget process and project management. Risk management is integrated in the annual budget process in order to capture events and cir-
cumstances with potential for material financial impact. This means integrating these risks into annual financial targets, raising attention to management and contributing to a proactive response. Risk management conducted as part of periodic strategy updates (both Group and divisional) helps capture events and circum-stances that could significantly hinder longer term strategic priori-ties and goals. Risk Management in more day-to-day work is guided by a comprehensive set of Group Policies and related pro-cedures. The Group has several specialist functions, i.e., Internal Audit, Compliance & Integrity, Security, Internal Control, Quality and Sustainability that oversee effectiveness of risks management activities within their respective competency areas.
Changing market strategic risks For more information on mega trends with related opportunities and risks affecting strategy execution in the mid-term, see page 8. (Financial and operational risks are addressed separately below.)
Business operational risks The following sections highlight certain operational risks the Group face across the entire value chain that are deemed material for the Group within the next one to five year period unless otherwise indicated.
A. Product and Service Development: Time to Market – Husqvarna Group, as any company, is subject to the risk that its competitors can develop and offer alternative products at a better cost-to-performance ratio. Product life cycles are becoming shorter, requiring more efficient product develop-ment processes. Certain Group products require longer develop-ment lead times, thus requiring a deep understanding of the end-customers’ needs.
Product compliance – Husqvarna Group is subject to a vast array of laws, regulations and industry standards where the Group has a presence. These are applicable to Group products in terms of design, operation, chemical content, noise, safety and (in the case of petrol products) exhaust emissions. Any failure to comply with such product standards could harm end-customers and result in significant costs, e.g., as a result of “stop sale” orders, product recalls, fines, and damage the Group’s reputation. Prod-uct standards are often subject to interpretation and frequently change, typically becoming stricter. When appropriate, the Group supplements its existing governance structures with dedi-cated cross-divisional project teams to pro-actively mitigate risks associated with major regulatory challenges and/or legislative changes, with regular reporting to Group Management.
Servitization – Many industries are experiencing a shift in customer preference from buying of physical products to purchasing services (e.g., in the form of monthly fees, leases or uptime). This shift is sometimes referred to as “Servitization.” The Group strives to keep pace with this shift by offering more “service” oriented solu-
Bo
ard R
ep
ort —
Risk managem
ent

51 / Annual Report 2019 / Husqvarna Group
tions such as rental and financing options. However, the Group still is heavily reliant on traditional business models of selling products to generate revenue and there is a risk that competitors may be able to develop service offerings more quickly or more effectively.
> Future CO2 emissions regulation – The Group anticipates more stringent emissions regulations. The Group has increased its per-centage of low-emission products with “robotics and bat-tery-powered products” as one of four stated strategic priorities. Steps taken include a significant expansion of internal resources dedicated to robotics and battery products and a significant increase in related R&D spend. This focus reduces the Group’s vulnerability to stricter emissions legislation. An analysis was con-ducted in 2019 to better understand required CO2 reductions from the Group’s product portfolio, using a 2035 horizon. This analysis confirmed that the Group is on the right path to transition to a low-carbon economy in line with the latest climate science to meet the goals of the Paris Agreement.
> Shift from Petrol to Battery Products – Many traditional market segments are affected by the “ petrol-to-battery” shift, meaning that products historically powered by petrol engines are now being offered with battery driven motors instead. This trend has acceler-ated over recent years as batteries have become more powerful, more reliable and less expensive. Accordingly, it has been a strate-gic priority of the Group for many years to heavily invest in battery technology and new battery products. While the Group has, for the most part, achieved a leading position in battery products within relevant market segments there is increased competition in these segments by new entrants, e.g., power-hand tool players, many of which have significant scale in designing, manufacturing or sourc-ing battery-powered indoor products such as cordless drills, which can then be applied to outdoor products as well.
B. Sourcing: Component supply and quality – A shortfall in deliveries or quali-ty-related issues from a supplier may have negative conse-quences for production and for deliveries of finished products. This risk is exacerbated where the Group relies on a few (or even single) suppliers to deliver key materials or components. The Group’s purchasing organization works closely with suppliers in order to manage deliveries, and monitors the suppliers’ financial stability, quality-assurance systems and flexibility of production.
>Electronic Components – Electronic components, including bat-teries and related parts, are becoming increasingly common and important for the Group’s products and services. At the same time, worldwide demand for such components – especially bat-tery cells – is increasing dramatically. As for all direct material supply, availability is dependent on suppliers and if they have sup-ply interruptions or lack of capacity, it may have an adverse effect on the Group’s production and deliveries. To address these risks, the Group has begun to shift resources (including, e.g., site visits for risk evaluation) from its own production sites, which are often deemed highly-protected, to those of major suppliers.
Compliance Issues – A broad supplier base, especially in less developed countries, potentially increases the risk that products or components are not produced sustainably. The Group and its suppliers must share the same high standards for the environment, labor and human-rights as in Group policies and procedures and as stated in the Supplier Code of Conduct. The Group is mitigat-ing these risks through an increased number of supplier audits.
Prices for raw materials and components – The Group’s opera-tions and its performance are affected by fluctuations in the prices of raw materials and components. The most important raw mate-rials are steel, aluminum and various types of plastic. These prices can fluctuate considerably in the course of a year, as a result of changes in world prices for raw materials or the ability of suppliers to deliver them. Total consumption is linked to production vol-ume and production mix. The Group does not use financial instru-ments to hedge prices of raw materials, but endeavors to manage risks through bilateral agreements with suppliers.
In 2019, the Husqvarna Group purchased materials, components and finished products amounting to SEK 19,419m (19,194).
Cost structure, Group2019 2018
% of net sales SEKm
% of net sales SEKm
Cost of goods sold:
Raw materials, components and finished products 45.9 19,419 46.7 19,194
Factory overhead, R&D, tools 14.5 6,121 14.5 5,983
Direct wages 3.7 1,561 4.0 1,631
Restructuring 0.3 117 2.6 1,077
Other 6.0 2,530 6.6 2,698
Total cost of goods sold 70.4 29,748 74.4 30,583Gross operating income 29.6 12,529 25.6 10,502Selling expense 16.4 6,928 15.6 6,425
Administrative expense 4.7 2,000 4.8 1,968
Restructuring 0.3 108 0.2 94
Other –0.5 –197 0.0 –55
Operating margin/income 8.7 3,690 5.0 2,070
C. Manufacturing: Footprint – The Group maintains a relatively large manufacturing base with corresponding fixed costs, and is subject to risks from fluctuations in demand resulting from economical, seasonal and weather variations, as well as the availability and applicable lead times of key components. Handheld products such as chainsaws and trimmers, for which the Group also manufactures engines, as well as watering products, feature a higher proportion of special-ized components that are produced in-house. Any material decline in overall sales volumes can therefore have a significant negative impact on factory absorption and in turn the profitability.
> Natural Disasters – The Group’s and suppliers’ facilities are sub-ject to disruption for a variety of reasons, including, but not lim-ited to, work stoppages, water scarcity, fire, earthquake, flooding, or other natural disasters. Such disruption may interrupt Husqvarna Group’s ability to manufacture certain products. Any significant dis-ruption could negatively impact the Group’s sales and earnings. The Group works proactively to reduce these exposures by avoid-ing operations in flood zones, proactive maintenance, installation of sprinklers and establishing business continuity plans.
Saw chain manufacturing ramp up – The Group continues to ramp up production capacity of its own saw chain facility, located in Huskvarna, Sweden. This is a significant industrial undertaking, and may require additional unplanned investments, or finetuning of manufacturing equipment parameters that could take longer than planned to achieve the desired volumes, quality and product cost.
Fluctuations in Staffing Demands – In light of seasonal variations in the Group’s operations, the number of temporary employees increases in preparation for the peak production season, and
Bo
ard R
ep
ort —
Risk managem
ent

52 / Annual Report 2019 / Husqvarna Group
decreases at the end of the production season. The production season for most lawn-care products is during the first and second quarters, whereas chainsaws and other handheld products have a production peak in the third quarter. The Husqvarna Group relies on temporary labor for seasonal production, which poses risks in terms of awareness of safety and production routines and avail-ability of such temporary labor. Sick leave and issues related to wellness can also negatively impact the productivity of the Group.
D. Transportation: Tariffs and Trade Disputes – Group operations involve the move-ment of products, components and raw materials across national boundaries. Such goods may be subject to import and export duties or similar tariffs. Normally, the costs of such tariffs are taken into account in product pricing. However, abrupt changes to – or unclarity regarding – such tariffs expose the Group to risks. In some cases, it may be difficult to pass on such higher product costs, or may take a significant period of time to do so. Likewise, competitors may have a different supply-chain structure, and be able to produce similar goods that are free from such tariffs. In either case, the Group may be forced to absorb such extra tariff costs, thereby lowering the gross margin on products sold. The risk for disruptive changes in the tariff landscape have been exac-erbated by recent geopolitical factors, such as the decision by the United Kingdom to exit the European Union, as well as recent tar-iffs imposed by the United States against China and other coun-tries, and associated risks of “trade wars”. Such trade wars could not only result in significant increases in Husqvarna Group’s over-all tariff rates, with the associated consequences noted above, but could also have larger macro-economic effects on the overall global economy and the markets where the Group produces and sells products. Whenever and wherever possible the Group strives to adjust its supply chain and manufacturing footprint to minimize the impact from such tariffs.
>CO2 impact of logistics suppliers – The Group relies on air, road, rail and ship transport, some of which are carbon intensive. The Group forsees higher costs and levies for fossil-fuel based trans-port, especially air freight. Increased local production in North America and Europe helps to reduce transport dependency.
E. Customer Interaction: Customer Preferences – The Group’s strategy is based on product innovation, utilization of strong brands and global distribution to create differentiated product and solution offerings for the differ-ent end-customer segments. Long-term profitability depends on the ability to successfully develop, manufacture and market new products and solutions that meet customers’ performance needs and price requirements. Digitalization has opened up significant opportunities to improve customer interaction and to customize advice and support. The Group work with the major digital solu-tion providers to ensure the products are integrated with digital platforms preferred by our customers.
Digitalization also increases the risk that traditional business models are disrupted by new market entrants, who may have new product (or service) offerings and/or more effective go-to-market strategies.
Retail Channel – Consumer products are sold mainly through large retail chains. This market is highly consolidated in North America and the UK, while in the rest of Europe, market consoli-dation is by and large still ongoing. The Group’s retail customers, such as large Do it Yourself (DIY) chains, are becoming larger and fewer in number, which gives them greater bargaining power. Several also source products that are then marketed under their
own brands. This provides Husqvarna Group with an opportunity to display its products in more retail outlets in a wider geographi-cal area. However, it also entails risks. Most obviously, the failure to build or maintain strong supply relationships with DIY retailers can have significant negative effects on volumes and in turn prof-itability. Conversely, successfully maintaining such customer rela-tionships can lead to a greater dependence on fewer customers, with higher levels of trade receivables and credit risks related to these customers. Moreover, any decline in the relative market suc-cess of a retailer with whom the Group has a strong relationship can have a disproportionately negative effect on the Group. The Group is taking a number of measures to reduce sales channels risks, including setting annual credit limits for customers.
Dealer channel – Professional products are sold mainly through local independent dealers or in some cases directly to end-cus-tomers, which means that these customers purchase smaller vol-umes and generally are not as significant for the Group on an indi-vidual basis. Cost to serve the dealers are relatively higher than that to retail accounts but the level of risk related to receivables and credit is lower.
Online – Internet commerce is increasing and becoming of increas-ing importance to the Group, partly as the result of increased online sales activities of trade partners in both the dealer and retail channel but also from growing direct sales with major online resellers. This brings new risks and uncertainties, including new buying patterns and challenges to ensuring adequate pre- and post-sales support for products sold online. The challenge is to ensure that relevant products are offered to all customer segments in all relevant purchasing channels. The failure to build or maintain strong supply relationships with key online resellers can have sig-nificant negative effects on volumes and profitability.
F. Customer Use: Product Safety – The Group is exposed to product liability in the event that products are alleged to have caused damage to per-sons or property. The Group is insured to a large degree against such claims, partly through insurance in its own captive subsidiar-ies, and partly through external insurers. However, there is no guarantee that such insurance coverage is in force or sufficient in a specific case, or that claims regarding product liability may not have an adverse effect on the company’s earnings and financial position. In addition, such insurances do not cover the costs for warranty repair, recall exposure or any adverse effect on brand value. External insurance is subject to availability and pricing, which may vary over time. The Group has established a commit-tee on product safety (COPS), the tasks of which include monitor-ing product safety issues.
>Weather/climate – Demand for the Group’s products is depen-dent on weather. Unexpected or unusual weather conditions in core markets can affect sales either adversely or positively. Dry weather can reduce demand for products such as lawn mowers and tractors, but can also stimulate demand for watering prod-ucts. However, excessive dry weather or droughts may result in regulatory actions, such as water-bans, that have a negative effect on the sale of watering products. Demand for chainsaws normally increases after storms and during cold winters. Husqvarna Group strives for flexible production and supplier structure that can be adjusted at short notice to meet actual demand without the bur-den of excess safety stock within inventory. Reducing lead times and improving responsiveness heightens the Group’s agility and helps get the right products to the market by matching not only the season but current weather conditions.
Bo
ard R
ep
ort —
Risk managem
ent

53 / Annual Report 2019 / Husqvarna Group
G. End of Life/Product Recycling:>Future regulation on product takeback – The Group participates in recycling schemes for electrical equipment and batteries in markets in North America and Europe. Regulation on recycling will likely expand to other markets, as the focus on waste and resource efficiency grows. Future regulation on product takeback may increase costs for premiums for disposal and product rede-sign for recyclability. With the circular economy as a growing imperative, the Group is exploring opportunities to contribute further by increasing use of recycled plastics in products and increasing recyclability of the products.
Other risk areas across the value chain
Risks related to information systems, personal data and cyber-crimeThe Group heavily relies on its IT systems to operate its business. Disruptions or faults in critical IT systems may have a direct impact on operations such as production and logistics. Cyber security risks are increasing in society in general, especially due to cyber-criminals who can use a variety of means, ranging from sophisticated virus attacks to simple email fraud. Any of these criminal activities, if successful, could have an adverse impact on the Group’s operations, financial condition or reputation. The Group works continuously to keep systems protected and in addi-tion, is also investing in enhanced disaster recovery, confidential or data storage capabilities and cyber-security expertise as well as information security awareness and training. In parallel with such efforts and in connection with the EU’s General Data Protection Regulation, the Group continuously works to protect individual’s rights in connection with any personal data processed by the Group.
Integrity and compliance risksIn 2019, the Group’s Chief Compliance Officer conducted a Global Risk Assessment which identified several potential compli-ance risks, including the following:
Anti-Corruption/Bribery – Husqvarna’s Code of Conduct has a strict prohibition on corruption and bribery, and the Group’s employees are trained on how to ensure that this does not hap-pen. However, there is always a risk that third-parties (agents, dis-tributors and suppliers) might engage in misconduct without the Group’s knowledge. To combat this, the Group has recently adopted a Third-Party Due Diligence Policy, which requires a pro-actively confirmation of the good standing of certain catego-ries of third-party vendors and partners before engaging in busi-ness with them. This policy also guards against other forms of non-compliance (e.g. labor policies, and trade compliance).
Competition Law/Anti-trust – Husqvarna is committed to continued and focused employee training on Competition law standards.
International Trade Compliance/Sanctions – A Group Export Controls and Trade Sanctions Policy has been adopted to further support the existing Trade Sanctions Process. An additional Sanc-tions review protocol will also be incorporated into the Third-Party Due Diligence program described above.
The Group maintains several reporting channels for concerns of misconduct, including an “AlertLine” managed by an indepen-dent third-party. All such reports are investigated and reported under the direction of the Group’s Chief Compliance Officer. A comprehensive Code of Conduct, revised Group policies, guide-lines and a strong corporate culture provide a foundation for a sound business environment. The Group also provides employee training on the Code of Conduct and related Policies both through online and live training courses.
Environmental, health, safety risks and human rights>Risks related to human rights, health, safety and the environment can arise in the entire supply chain, both at suppliers and at the Group’s production facilities. These risks can be followed by repu-tational impact for well-known brands owned by the Group. The Group applies the precautionary principle and takes action to pre-vent or mitigate injury or harm to human health or the environment.
Risks related to acquisitions, restructurings and organizational changesThe Group may undertake acquisitions, divestitures or organiza-tional changes from time to time, all of which involve risks. For example, restructuring and organizational changes involve the risk of creating higher costs or lower revenues than anticipated and losing key personnel, or that estimated savings are below announced targets. In the case of acquisitions, sales may be adversely affected, the costs of integration may be higher than anticipated, and synergy effects may be lower than expected. In case of acquisitions or cessation of operations, environmental risk assessments are always conducted by qualified experts. The Group aims to mitigate these risks by, among other things, thorough pre-transaction due diligence as well as having clear post-transaction planning, whereby clear roles and responsibilities are established for post-closing hand-over and integration matters.
Certain risks in the Construction DivisionThe construction market is less weather sensitive than the forest and garden market. On the other hand, it is more subject to finan-cial cycles and changes in the political environment. Such cyclicality can have a significant impact on the capital intense equipment and the rental channel overall, as exemplified by developments during the 2008–2009 financial crisis. However, the specific sub-markets addressed by the Construction Division tend to have smaller cyclical amplitudes than the overall construction industry. This is largely because of the high relative share of consumables (diamond tools) and the fact that the Division’s products are often used in renovation projects, which are relatively more stable com-pared to new construction work.
Financial risks The following sections highlight financial risk areas that are relevant to Husqvarna Group.
GeneralThe Group’s financial risks are managed on the basis of the Group’s financial and credit policies, which are annually updated and approved by the Board. Management of financial risks is based largely on the use of financial instruments and is mainly centralized in Group Treasury, which operates in accordance with specified risk mandates and limits. For more information on accounting principles and financial risk management and risk exposure, see notes 1 and 20.
Bo
ard R
ep
ort —
Risk managem
ent

54 / Annual Report 2019 / Husqvarna Group
1 Excluding hedge effects. SEK –225m refer to effect of transactions and SEK 35m to translation effects.2 Excluding hedge effects. SEK 400m refer to effect of transactions and SEK 100m to translation effects.3 Excluding hedge effects. SEK 590m refer to effect of transactions and SEK 175m to translation effects. All other refer to the other currencies including USD and EUR.
Effect on operating income Effect on operating income Effect on income for the period
– SEK | USD + – SEK | EUR + – SEK | ALL +
SEKm–190¹
SEKm+500²
SEKm+765³
STEEL ALUMINUM PLASTICS
SEKm±160
SEKm±45
SEKm±150
INTEREST
SEKm±25
Financing risksFinancing risks refer to possible delays, increased costs or cancel-lations related to financing of the Group’s capital requirements and refinancing of outstanding debt. Risks are reduced by main-taining an evenly distributed maturity profile of loans, access to credit facilities and ensuring that short-term borrowings do not exceed current liquidity.
Interest rate riskInterest rate risk refers to the adverse effects of changes in market interest rates on the Group’s net income. The main factor deter-mining this risk is the interest fixing period. The interest rate risk is managed by changing the interest from fixed to floating or vice versa by using derivatives such as interest rate swaps.
Foreign exchange riskAs Husqvarna Group sells its products in more than 100 countries, has production in approximately 10 countries and likewise sources raw materials and components from various countries across the globe, the Group is exposed to exchange rate fluctua-tions. These fluctuations affect the Group’s earnings in terms of translation of income statements in foreign subsidiaries, i.e. trans-lation exposure, as well as in the sale of products on the export market and purchases of materials in foreign currencies, i.e. trans-action exposure, and also in terms of the translation of balance sheet items such as trade receivables and trade payables.
Changes in exchange rates also affect Group equity. Assets and liabilities of foreign subsidiaries are affected by changes in exchange rates, generating translation differences that impact equity. In order to limit negative effects on Group results and equity resulting from transaction exposure and translation differences, part of the Group’s transaction exposure and net investments in for-eign operations is hedged using foreign exchange derivatives.
Credit risksCredit risk refers to the risk that a counterparty will default on its contractual obligations resulting in financial loss to the Group.
The Group’s credit risks are managed on the basis of standard-ized credit ratings, credit limits, active monitoring of credits and routines for follow-up of trade receivables. The need for reserves for doubtful trade receivables is monitored continuously. Major credit limits are approved annually by the Board. The Group also utilizes credit insurance to reduce credit risk in trade receivables.
The Group´s financial assets are used primarily for the repay-ment of loans. Liquid funds are placed in highly liquid interest- bearing instruments issued by institutions with a credit rating of at least A–, according to Standard & Poor’s or similar agencies.
Tax risksThe Husqvarna Group operates in many countries and undertakes a great number of cross-border transactions. The operations are subject to complex national and international tax rules that change over time.
The Husqvarna Group, like many multinational companies, employs a centralized transfer pricing model based on the Group’s operating model with central Group functions and global divisions. The Group is seeing a change in the regulatory environ-ment in which there is a higher risk that Taxing authorities may challenge such models, which could result in an increase in tax exposure both historically and going forward.
Restrictions on tax deductibility of interest expenses on intra-group loans apply in Sweden. Interest is only deductible provided that the interest beneficiary is resident within the EES, or within a country with which Sweden has concluded a tax treaty, or the ben-eficiary is taxed at an income tax rate of at least 10%. However, if the debt is entirely, or almost entirely, created with the purpose to obtain a substantial tax benefit the deduction is denied. At the moment it is not clear how these exceptions will apply. For this reason, Husqvarna Group has made provisions to reflect potential exposure related to these restrictions.
Pension commitmentsHusqvarna Group’s commitment for pensions and other post- employment benefits amounted to SEK 2,427m (1,943) at year-end 2019. The Group manages pension funds amounting to SEK 3,013m (2,543). At year-end 2019, 39% (37) of these funds were placed in shares, 52% (51) in interest-bearing securities and 9% (12) in other investments.
Changes in value of the assets and liabilities depend primarily on trends for share prices and interest rates. Factors affecting the pension obligation include changes in the assumptions, such as discount rate, life expectancy and expected salary increases. In the interest of effective control and cost-efficient management of the Group’s pension assets, management is centralized in Group Treasury and conducted in accordance with the pension fund policy adopted by the Board. For more information on pension commitments, see note 21.
±10%Currency
±10%Raw materials
±1%Interest rates
Sensitivity analysis
Bo
ard R
ep
ort —
Risk managem
ent
55 / Annual Report 2019 / Husqvarna Group
Corporate Governance ReportAs required by the Swedish Annual Accounts Act and the Swedish Code of Corporate Governance (the “Swedish Code”), this Corporate Governance Report describes the organizational bodies, rules, and other governance structures by which Husqvarna Group is controlled and operated. The Group’s external auditors have reviewed this report and their opinion has been included in the Auditor’s Report.
Good corporate governance is a fundamental prerequisite not only to meet our obligations as a public company, but also to create value for shareholders in an efficient, responsible and sustainable manner. The Husqvarna Group’s corporate governance structures are defined in part by external laws (e.g., the Swedish Companies Act), in part by self-regulatory standards (e.g., the Swedish Code and the Nasdaq Stockholm Rulebook for Issuers) and in part by internal rules (e.g., the Company’s Articles of Association, Code of Conduct, and Group policies). While not mandatory, Husq-varna Group has elected to comply with all aspects of the Swed-ish Code, without exception.
Husqvarna has no deviations from the Swedish Code to report for the 2019 financial year. Nor has Husqvarna been subject to any rulings by Nasdaq Stockholm’s Disciplinary Committee or deci-sions on breaches of sound practices in the stock market by the Swedish Securities Council. For more information, go to: husqvarnagroup.com/en/corporate-governance/.
The highest corporate decision-making body in the Company is the Shareholders’ General Meeting, which is normally held once per year in the form of the Annual General Meeting (“AGM”), but can also be in the form of an Extraordinary General Meeting under certain circumstances. The 2020 AGM will take place at 4 p.m. on Thursday, April 2, 2020 at the Elmia Congress Center, Elmiavägen 15 in Jönköping, Sweden. The Company pre-pares the AGM agenda with input from its shareholders, who have the right to propose matters for consideration at the AGM.
ShareholdersHusqvarna AB’s shares have been traded on Nasdaq Stockholm since June 2006. At year-end 2019, the share capital amounted to SEK 1,153m, represented by 112,015,629 A-shares and 464,328,149 B-shares, each with a par value of SEK 2. A-shares carry one vote and B-shares carry one tenth of a vote. As per the Articles of Association, holders of A-shares are entitled to request conversion of A-shares into B-shares on a 1:1 basis. During 2019, 421,922 A-shares were converted to an equivalent number of B-shares.
As of December 31, 2019, the number of shareholders was 63,897, whereof foreign shareholders held approximately 29.7% of the outstanding share capital. Investor AB was the single largest shareholder with a holding of 16.8% of the share capital and 33.1% of the votes. L E Lundbergföretagen was the second largest share-holder with a holding of 7.6% of the capital and 25.1% of the votes. For further information on the Husqvarna AB shares and shareholders, see section “The share”.
Nomination CommitteeIn accordance with the Swedish Code, Husqvarna AB is required to have a Nomination Committee, the primary responsibilities of which are to consider and submit to the AGM proposals and rec-ommendations regarding: • The Chair of the AGM;• The number of Board members;• The nominees for election to the Board;• The Chair of the Board;• Remuneration to Board members, including the Chair, and
remuneration for Board members’ work on Board committees;• Selection of external auditors (when applicable);• Remuneration to external auditors; and• Changes to the process regarding the composition and tasks of
the Nomination Committee (if applicable).
The AGM determines the process for establishing the Nomination Committee and its members. At Husqvarna AB’s 2013 AGM it was decided that the following process would apply until a subsequent AGM resolves otherwise: • The Company shall have a Nomination Committee consisting
of five members.• The members shall consist of one representative of each of the
four largest shareholders in the Company in terms of voting rights held as of the last banking day of August, with the fifth member being the Chair of the Board.
• In the event that any of the four largest shareholders elect not to nominate a representative to the Nomination Committee, the right to appoint such a representative passes to the fifth largest shareholder and so on.
• The Company’s Board Secretary shall serve as secretary of the Nomination Committee.
These rules established at the 2013 AGM have not been changed by any subsequent AGM and therefore continue to apply.
The formation of the Nomination Committee for the 2020 AGM was announced on September 11, 2019. The members of the Nomination Committee (and corresponding appointing shareholders) for the 2020 AGM are:
Member Appointing shareholderPetra Hedengran (Chair) Investor AB
Claes Boustedt L E Lundbergföretagen AB
Ricard Wennerklint If Skadeförsäkring AB
Henrik Didner Didner & Gerge Fonder AB
Tom Johnstone 1 –
1 Board Chair of Husqvarna AB
Bo
ard R
ep
ort —
Corporate G
overnance Report
56 / Annual Report 2019 / Husqvarna Group
The determination of the four largest shareholders for purposes of nominating representatives to the Nomination Committee was based on known holdings of voting rights as of August 30, 2019. Nomination Committee members do not receive compensation from Husqvarna AB for their work on the Nomination Committee.
As noted above, one of the chief duties of the Nomination Committee is to make recommendations regarding the size and composition of the Board. Normally, the starting point for such recommendations is a survey conducted each year by the Chair of the Board to assess the Board’s work, composition, qualifications, experience and efficiency. The results of this survey are shared and discussed with the Nomination Committee.
Based on survey results and, if deemed appropriate, subse-quent discussions and interviews, the Nomination Committee determines whether the existing Board should be strengthened with additional expertise or if there are any other reasons to make changes to the composition of the Board. In making such deter-minations and (if applicable) evaluating potential new candidates for the Board, the Nomination Committee takes into consider-ation the objective to achieve a gender balance in the Board.
The Nomination Committee has applied rule 4.1 of the Swed-ish Code as its diversity policy. In addition, the Nomination Com-mittee takes into consideration the need to ensure that the inde-pendence requirements of the Swedish Code are met. These requirements stipulate that at least the majority of Board mem-bers must be independent from the Company’s management, and that at least two (from such majority) are also independent of the Company’s largest shareholders. The Nomination Committee also takes into account any proposals made to the Nomination Committee about the composition of the Board that may have been suggested by other shareholders. Shareholders who wish to submit proposals to the Nomination Committee may do so by sending an email to [email protected]. While there is no formal cut-off date for proposals, it was recom-mended in the September 11, 2019 notice of the formation of the Nomination Committee that such proposals from shareholders be received by the Company no later than February 6, 2020.
For the 2020 AGM, the Nomination Committee announced its required proposals along with the notice of the AGM, which was published on the Company’s website on February 28, 2020. The Nomination Committee will present and explain its work and pro-posals at the AGM.
The Annual General Meeting GeneralThe AGM is the highest decision-making body of the Company. In accordance with the Swedish Companies Act, the AGM of Husq-varna AB must be convened annually on a date not later than six months after the close of the preceding financial year, and is nor-mally held in March or April.
According to Husqvarna AB’s Articles of Association, the AGM must be held in Jönköping or Stockholm, Sweden, although it has traditionally been held in Jönköping. The notice of the AGM (specifying its date, location, agenda, etc.) shall be made public at least four weeks and not more than six weeks prior to the AGM. The notice is published in the Swedish daily newspaper, Svenska Dagbladet and the Swedish Official Gazette (Post- och Inrikes Tidningar). It is also announced in a press release and on the Company’s website at www.husqvarnagroup.com. For the 2020 AGM, the notice was published by press release on February 28, 2020 and in Svenska Dagbladet and the Swedish Official Gazette (Post- och Inrikes Tidningar) on March 3, 2020.
Shareholders who are listed in the share registry on the record day (i.e., Friday, March 27, 2020) and wish to be represented at the AGM must register to do so with the Company by no later than Friday, March 27, 2020. Shareholders who are individuals may attend the AGM in person or by proxy. Shareholders attending the meeting by proxy, including all corporate shareholders, must submit a valid power of attorney as well as other required docu-mentation in due time before the AGM. This, together with infor-mation provided by Euroclear Sweden AB, allows the Company to compile a book of shareholders eligible to vote at the AGM. Following this compilation, voting certificates are sent to all shareholders attending the meeting or their designated repre-sentatives. Voting certificates are proof of voting rights and also serve as an entrance card to the AGM.
AGM agenda items & written documentationThe agenda for the AGM is reviewed and approved by the Board and consists of matters that are statutorily required, as well as other matters. Matters typically include: • Election of Chair of the AGM 1;• Adoption of statutory financial documentation;• Discharge of liability for the Board members and CEO;• Disposition of the Company’s profit;• Number of elected Board members 1;• Remuneration to Board members, committee members and
external auditors 1; • Election of external auditor 1;• Election of Chair of the Board 1;• Election of Board members 1; • Principles of remuneration for Group Management;• Adoption of long-term incentive programs (if applicable);• Repurchase and transfer of the Company’s own shares
(if applicable);• Authorization to resolve on the issuance of new shares
(if applicable); and• Such other matters as may be deemed necessary and
appropriate by the Board. 1 Indicates agenda items for which the Nomination Committee makes a proposal.
Shareholders may also, prior to the publication of the notice to attend the AGM, propose matters to be put on the AGM agenda.
At the AGM, the Chair of the Board presents a report on the Board’s work during the preceding year, the CEO gives an over-view of the Company’s business and current priorities, and the auditors present their report and review of the Company’s finances. If required, the Chair of the People & Sustainability Committee (formerly the “Remuneration Committee”) 2 reports on remuneration to Group’s executive management (herein, “Group Management”) and, if it is to be decided by the AGM, the Company’s long-term incentive programs. Shareholders may also direct questions to the Chair of the Board, the CEO, the Nomina-tion Committee, the Chair of the People & Sustainability Commit-tee, the external auditors or any other Board member. Written documentation is presented at the AGM, normally both in English and Swedish. This documentation may be downloaded from the Company’s website and is also sent to shareholders upon request. 2 This Committee is intended to be a “remuneration committee”, within the mean-
ing of Section 9 of the Swedish Code, see also “People & Sustainability Committee”, on page 58.
Bo
ard R
ep
ort —
Corporate G
overnance Report

57 / Annual Report 2019 / Husqvarna Group
Such documentation includes:• The agenda for the AGM;• Proposals from the Board and the Nomination Committee;• The Board´s report on the People & Sustainability Committee’s
evaluation of programs of variable remuneration for Group Management, the application of the principles of remuneration for Group Management and applicable remuneration structures and levels in the Company;
• The Nomination Committee’s explanatory statement regarding the proposal for appointment of Board members; and
• The Board’s report in relation to the proposed dividend and the proposal on the acquisition of the Company’s own shares (if applicable).
The AGM is held in Swedish, but simultaneous translation into English is available. The minutes recorded at the AGM are nor-mally published within a few days of the AGM. A press release including the decisions made by the AGM is published immedi-ately after the AGM.
The 2019 AGM The 2019 AGM was held on April 9, 2019 in Jönköping, Sweden with 736 shareholders attending in person or by proxy, represent-ing 58% of the total number of shares and 78% of the total num-ber of votes. Also attending were the Board, the external auditors and members of Group Management. The AGM approved the following resolutions: • To adopt the income statements and balance sheets for 2018.• To declare a dividend of SEK 2.25 per share in total, to be paid
in two separate payments of SEK 0.75 per share to be paid on April 16, 2019, and SEK 1.50 per share to be paid on October 16, 2019.
• To discharge the Board and the CEO from liability for the finan-cial year 2018.
• To establish the size of the Board at eight (8) elected members (including the CEO).
• To elect Tom Johnstone, Ulla Litzén, Katarina Martinson, Bertrand Neuschwander, Daniel Nodhäll, Lars Pettersson, Christine Robins and Kai Wärn as Directors of the Board.
• To appoint Tom Johnstone as Chair of the Board.• To set Board remuneration at SEK 6,290t in total, of which SEK
2,000t to the Chair of the Board and SEK 580t to each of the Board members elected by the AGM and not employed by the Company. Furthermore, to pay additional remuneration of SEK 240t to the Chair of the Audit Committee and SEK 135t to each of the other two members of the Audit Committee, as well as SEK 140t to the Chair of the People & Sustainability Committee and SEK 80t to each of the other two members.
• To approve the Nomination Committee’s proposal of election of auditors and to pay auditor’s fees on the basis of approved invoices.
• To set principles of remuneration to Husqvarna Group Manage-ment, based on fixed salary, variable salary, long-term incen-tives, pensions and other benefits.
• To establish a performance-based long-term incentive program for 2019, LTI 2019, to be offered to 100 senior managers, whereby, subject to the fulfilment of certain performance targets and other conditions during a three-year vesting period, the par-ticipants would have the right to receive certain B-shares.
• To authorize the Board, during the period up until the next AGM, to direct the Company to enter one or more equity swap agreements with a third party (e.g., a bank) for purposes of hedging the obligations of the Company, under the LTI 2019
and any previously resolved programs. • To authorize the Board to approve the issue of not more than
57,634,377 new B-shares against payment in kind on one or more occasions during the period up to the 2020 AGM.
The 2020 AGM The 2020 AGM of Husqvarna AB will be held at 4 p.m. on Thursday, April 2, 2020 at the Elmia Congress Center, Elmiavägen 15 in Jönköping, Sweden. For more information regarding the 2020 AGM, see section “Annual General Meeting 2020”.
The Board of DirectorsAccording to Husqvarna AB’s Articles of Association, the Board shall be comprised of no less than five and no more than ten Board members. The Articles of Association do not contain any specific provisions concerning the appointment and dismissal of directors (or the method by which the Articles of Association themselves may be amended), meaning that the rules otherwise stated in the Swedish Companies Act apply. There are currently eight Board members elected by the AGM (see section “Board of Directors and auditors”). In addition to the Board members elected by the AGM, Swedish trade unions have the statutory right to appoint two ordinary Board members with voting rights, as well as two non-voting deputies.
In accordance with the Swedish Code, the principle tasks of the Board include:• Establishing the overall goals and strategy of the Company; • Appointing, evaluating and, if necessary, dismissing the CEO; • Defining appropriate guidelines to govern the Company’s con-
duct in society, with the aim of ensuring its long-term value cre-ation capability;
• Ensuring that there is an appropriate system for follow-up and control of the Company’s operations and the risks to the Com-pany that are associated with its operations;
• Ensuring that there is a satisfactory process for monitoring the Company’s compliance with laws and other regulations rele-vant to the Company’s operations, as well as the application of internal guidelines; and
• Ensuring that the Company’s external communications are characterized by openness and that they are accurate, reliable and relevant.
The Board has adopted Rules of Procedure for its internal activities, which include rules regarding the number of Board meetings, matters to be handled at regular Board meetings and the duties of the Chair of the Board. These Rules of Procedure are updated and adopted by the Board each year at the “Statutory Board Meeting” which is normally held immediately after the AGM. The Chair shall also ensure that the Board evaluates the CEO on a reg-ular basis, at least once a year.
The Board has also issued written instructions specifying when and how information required to enable the Board to evaluate the Company and the Group’s financial position shall be reported to the Board, as well as the distribution of duties between the Board and the CEO. The Board has established an Audit Committee and a People & Sustainability Committee, which discharge certain monitoring and oversight responsibilities on behalf of the Board, as more fully described below.
The Chair of the Board ensures that the Board’s work and proce-dures are evaluated and discussed with Board members annually, and are brought to the attention of the Nomination Committee with the aim of developing the Board’s working methods and effi-ciency. In 2019, such evaluation was conducted principally through a combination of individual interviews and a detailed
Bo
ard R
ep
ort —
Corporate G
overnance Report

58 / Annual Report 2019 / Husqvarna Group
Board questionnaire. The results of such evaluation were pre-sented to, and discussed with, the Nomination Committee as well as to the full Board. The Board members elected by the 2019 AGM fulfil the independence criteria set out by the Swedish Code, which requires that a majority be independent of the Com-pany’s management, and that at least two of those be indepen-dent as to the Company’s largest shareholders.
Fees to Board MembersFees to Board members, including fees for committee work, are set by the shareholders at the AGM. For information on fees to the Board in 2019, see note 4.
Board Meetings According to the Board’s Rules of Procedure, the Board shall hold at least four ordinary meetings and one statutory meeting per cal-endar year. In 2019, the Board held ten meetings, of which three were by telephone, three were held in Stockholm, Sweden, two were held in Huskvarna, Sweden, one was per capsulam (i.e., by unanimous written consent) and one was held in Aycliffe, UK.
At Board meetings, the Company’s CFO and General Counsel are also present. The General Counsel serves as the Board’s sec-retary and records the minutes of the Board meetings. Other members of Group Management or other senior managers of the Company may also be asked to attend and report on significant matters.
When relevant and at least quarterly, Group Management presents forecasts and key performance indicators, providing the Board with an overview of the financial development and expec-tations of the Company. The Company’s budget is reviewed and approved once a year, generally in the fall. The Board also reviews the Company’s significant litigation matters, follows up on the Company’s compliance and risk management work, and monitors the Company’s progress regarding its sustainability agenda. The Board maintains an active oversight role in the Group’s Enterprise Risk Management program, as more fully described in the “Risk Management” section of this Annual Report. In addition, the Company’s external auditors meet with the Board once a year, without participation of any member of Group Management.
The Audit CommitteeIn accordance with the Swedish Companies Act, the Board annu-ally appoints an Audit Committee whose primary responsibilities are to (a) monitor the Company’s financial reporting, (b) oversee the effectiveness of the Company’s internal control, internal audit function and risk management as they relate to financial report-ing, (c) review and supervise the Company’s external auditors’ impartiality and independence, and (d) when applicable, assist in the preparation of proposals for the AGM’s election of auditors. The Audit Committee may also exercise any other powers and carry out any other responsibilities delegated to it by the Board from time to time. The Board has adopted a charter for the Audit Committee, which is periodically updated and approved by the Board.
The Board determines the composition of the Audit Commit-tee, which shall have at least two members, none of whom may be employed by the Company. At least one of the members of the Audit Committee must have auditing or accounting competence. The Board appoints the Committee members annually at the Statutory Board Meeting or when a Committee member needs to be replaced.
The Audit Committee members appointed in April 2019 were Ulla Litzén (Chair), Daniel Nodhäll and Katarina Martinson, who were the same members as the previous year. Audit Committee meetings are also attended by the Company’s internal auditor, by
the General Counsel, who keeps the minutes of the meetings, the Company’s CFO, and the external auditors. Other members of Group Management are present to report on matters as relevant. The Audit Committee regularly reports on its findings and recom-mendations to the full Board. Minutes of all Audit Committee meetings are also distributed to the full Board.
In 2019, the Audit Committee held seven meetings, which ful-fils its own charter rule that it shall meet at least four times per year. The Audit Committee meetings follow an adopted agenda plan, which includes a review of open issues, a treasury and tax update, and an internal audit update. The Audit Committee also reviews the Company’s Interim Reports and Boards’ Report before they are submitted to the Board. The Committee meets frequently with the Company’s external auditors who deliver reports on the audit. It also reviews the Company’s compliance work and litigation activities quarterly.
The People & Sustainability Committee (formerly the Remuneration Committee)The responsibilities of the Committee are to oversee:A. management remuneration and talent management, andB. the Company’s Sustainability efforts.
This Committee is intended to be and act as the Company’s “remuneration committee”, within the meaning of the Swedish Code. The Committee shall consist of as many members as the Board shall determine, but in no event less than three members. The Board shall appoint the Committee members annually, at the Statutory Board Meeting, or when a Committee member needs to be replaced. Each Committee member shall satisfy applicable independence and other requirements of law and other regulations applicable to the Company from time to time. The Board shall appoint the Committee’s Chair. The Committee’s Secretary shall be the Company’s Senior Vice President People & Organization.
The Committee’s Chair, in consultation with the Committee members, shall determine the schedule and frequency of the Committee meetings, provided that, the Committee shall meet at least twice per calendar year. The Committee may, at its discre-tion, include in its meetings members of the Company’s manage-ment (normally the CEO), the Company’s external or internal audi-tors, any other personnel employed or retained by the Company or any other person whose presence the Committee believes to be necessary or appropriate. Notwithstanding the foregoing, the CEO or any other member of Group Management may not be present during voting or deliberations concerning his or her com-pensation or assessment.The Committee shall report to the entire Board of the Company after each of its meetings and as otherwise requested by the Chair of the Board and shall make available to the Board the minutes of its meetings by the Secretary.
With respect to Management Compensation & Talent Man-agement, the Committee is assigned to perform the following general tasks: • to prepare the Board’s decisions on principles for remuneration
and other terms of employment for the CEO and for other members of Group Management, including such Remuneration Guidelines and Remuneration Reports, as are required by appli-cable law (including the EU’s Shareholders Rights Directive);
• to monitor and evaluate programs for variable remuneration, both ongoing and those that have ended during the year, for Group Management;
• to monitor and evaluate the application of the principles for remu-neration that the AGM is legally obliged to establish, as well as the current remuneration structures and levels in the Company; and
• to evaluate future talents for Group Management positions and monitor succession planning.
Bo
ard R
ep
ort —
Corporate G
overnance Report

59 / Annual Report 2019 / Husqvarna Group
With respect to Sustainability, the Committee is assigned to perform the following general tasks:• To periodically review the Group’s overall efforts within the field
of Sustainability, including without limitation, approving (or rec-ommending to the full Board for approval) any Sustainability related targets or changes to existing targets.
• To actively track progress towards the Group’s previously estab-lished Sustainability targets.
• To review and comment on the Group’s annual “Sustainovate Progress Report”, prior to submission to the full Board for approval.
• To otherwise monitor the Group’s overall Sustainability work, including a review of any material information in the press that may reflect either positively or negatively on the public percep-tion of the Group’s commitment to sustainability.The above tasks shall be supported by the Group’s Head of
Sustainability (currently within Operations Development), who
shall normally report to the Committee (or the full Board) at least twice per year. The Committee members appointed in April 2019 were Lars Pettersson (Chair), Tom Johnstone and Bertrand Neuschwander. For more information on remuneration to Group Management, see note 4.
In 2019, the Committee held three meetings, which fulfils the charter criteria that it shall meet at least twice a year.
External AuditorsAt the 2019 AGM, in accordance with the proposal of the Nomi-nation Committee, Ernst & Young AB was elected as auditor for the period from the 2019 AGM up until the end of the 2020 AGM. The auditor-in-charge is Hamish Mabon.
As per the decision taken at the 2019 AGM, the auditor’s fee until the 2020 AGM shall be paid on the basis of approved invoices. For more information, see note 8.
Group Management Structure
Kai Wärn, President and CEO*
Husqvarna DivisionSascha Menges
Gardena DivisionPär Åström
Construction DivisionHenric Andersson*
Group Management & Divisional StructureHusqvarna Group has a brand-driven organizational structure, with three separate reporting divisions: The Husqvarna Division, the Gardena Division, and the Construction Division. Group Man-agement is now a 10 member team comprised of (a) the CEO, (b) the three divisional presidents, and (c) the heads of seven Group Functions, in each case, as shown above (two of which functions are currently headed by the same individual).
Group Management, together, makes decisions on: • the Group’s strategic and business development,• allocations of responsibilities as between the Group functions
and the respective divisions,• enhancing Group synergies, • internal financial and business follow-up, • external financial reporting for Board approval, • Group governance, • Group staffing plans, • issue resolution, • budgets,
• external affairs, • Board reporting, • progress on Sustainability efforts, • risk management and mitigation (see “Risk Management”
section of this Annual Report), and• Group policies and guidelines.
Group Management meets in person on a quarterly basis, with a telephone meeting in each month in which there is no physical meeting.
Clear roles and responsibilities apply for each of the Group functions as well as for the divisions. A Group governance struc-ture has been implemented to ensure that decisions are made as close to operations as possible. Clear guidance has been pro-vided to identify the level on which different types of decisions should be made. Changes to the governance structure (including applicable roles and responsibilities) can only be made by the decision of Group Management.
Innovation & TechnologyAnders Johanson
Operations DevelopmentPavel Hajman
Global Information ServicesPavel Hajman
Business DevelopmentPer Ericson
Finance, IR & CommunicationGlen Instone
Legal AffairsBrian Belanger
People & OrganizationLeigh Dagberg
* Henric Andersson will replace Kai Wärn as President and CEO as from April 2, 2020.
Bo
ard R
ep
ort —
Corporate G
overnance Report

60 / Annual Report 2019 / Husqvarna Group
The CEOThe CEO is appointed by the Board and is responsible for the ongoing management of the Company in accordance with the Board’s guidelines and instructions. These instructions include responsibility for financial reporting, preparation of information for decisions and ensuring that commitments, agreements and other legal documents are in compliance with applicable laws and the Group Code of Conduct. The CEO also ensures compli-ance with the goals, policies and strategic plans approved by the Board, and updates the Board on the same when necessary. The CEO appoints all members of Group Management, with input from the Board Chair.
The Divisional PresidentsEach of the three divisions has its own President, who in turn reports to the Group CEO. Each of such division Presidents is responsible for the income statement and balance sheet for his/her respective division. However, all decisions made by a division are subject to the Group’s overall strategic goals and policies. For more information about Husqvarna Group’s divisions, please see section “Divisions”.
The Group Function HeadsGroup Management includes the heads of the seven “Group Functions” as described below. These functions are designed to support the divisions with forward-looking initiatives and/or to continue to capture certain Group synergies where appropriate following the recent shift to increased divisional autonomy.
1. Innovation and Technology. This function, which is headed by Anders Johanson, is leading the Group’s Innovation Strategy, with focus on the future of Robotics and Data Driven Services. This function scouts new opportunities and innovates early concepts in close cooperation with the start-up community and leading academic centers. It also drives applied research in selected digital areas with leading universities. The function’s organization is comprised of three sub-groups focusing on (a) Accelerated Innovation and Venturing, (b) Applied Digital Inno-vation, and (c) Technology and IP Intelligence, respectively. It also houses the Group’s Artificial Intelligence Lab.
2. Business Development. This function, which is headed by Per Ericson, is primarily responsible for leading the work on the Group’s long-term strategy, as well as M&A activities. The func-tion’s organization is comprised of five sub-groups focusing on (a) Business Intelligence, (b) Strategy Planning & Projects, (c) Mergers & Acquisitions, (d) Venture Capital investments, and (e) Licensing, respectively.
3. Operations Development. This function, which is headed by Pavel Hajman, is primarily responsible for securing Group wide synergies where appropriate, accelerating certain key priority areas, and securing business assurance. The function’s organiza-tion includes sub-groups focusing on (a) Business Assurance (Sustainability, EHS, Product Compliance and Quality), (b) Digital Commerce acceleration and Customer Experience, (c) Robot-ics & Battery Acceleration, and (d) a Program Office, which includes Sourcing coordination, Efficiency programs and Change management.
4. Global Information Services (IT). This function, which is also headed by Pavel Hajman, is primarily responsible for oversee-ing the Group’s IT strategy, systems & infrastructure and opera-tional support. It provides IT services and solutions including IT security, and also supports and collaborates with the IT person-nel housed within the divisions. The function’s organization is comprised of three delivery focused groups, aligned to the
three divisions, and three governing groups, each with a desig-nated focus area, in Enterprise Architecture, Infrastructure & Security and Common Systems & PMO, respectively.
5. Finance, IR & Communication. This function, which is headed by the Group’s CFO, Glen Instone, has primary responsibility for the Group’s financial controlling and reporting. It also coor-dinates and collaborates with finance personnel housed within the divisions. The function’s organization is comprised of a number of sub-groups including (a) Treasury, (b) Internal Con-trol, (c) Tax, (d) Business Control, (e) Group Accounting, (f) Inter-nal Audit and (g) Real Estate. It also houses the Group’s Investor Relations and Communication (internal and external) function.
6. Legal Affairs. This function, which is headed by the Group’s Gen-eral Counsel, Brian Belanger, is responsible for providing all rele-vant legal support to the Group and the divisions. It also houses the Group’s Risk Management function, the Data Privacy Office, and the Compliance & Integrity function. In order to secure inde-pendence, all members of the Legal Affairs team, including those sitting with the divisions, report to the Group’s General Counsel.
7. People & Organization (HR). This function, which is headed by Leigh Dagberg, has primary responsible for overseeing the Group’s HR initiatives, including the recruitment, advancement and retention of personnel. It also takes the lead on the Group’s compensation & benefits and talent management, and coordi-nates on a dotted-line basis with HR personnel located within the divisions.
Note regarding Governance of Climate-Related Risks (TCFD)Please refer to the “Risk Management” section of this Annual Report, for a description of (a) the Board’s oversight of climate -related risks and opportunities, and (b) Group Management role in assessing and managing risks and opportunities, as contem-plated by the recommendations of the Task Force on Climate- Related Financial Disclosures (TCFD).
External informationHusqvarna Group employs a series of procedures, controls, and systems to ensure the Group is able to provide the market with timely and accurate information, to the extent required by appli-cable law and good corporate practice, including the disclosure requirements of the EU’s Market Abuse Regulation (MAR) and Nasdaq Stockholm’s Rule Book for Issuers. The Board has dele-gated to the CEO, and an internal disclosure committee, com-prised of the Group’s CFO, General Counsel and head of Busi-ness Development, the day-to-day responsibility for assessing whether insider information exists (within the meaning of the MAR), and for ensuring that such information is promptly dis-closed or, in exceptional circumstances, to delay such disclosure where necessary to protect the interests of the Company, and permitted by applicable law.
Financial information is regularly issued in the form of: • Interim reports, published as press releases;• Annual Reports;• Press releases concerning news and important issues;• Presentations and telephone conferences for financial analysts,
investors and media on the day of publication of the interim and year-end reports, and in connection with the publication of other important information; and
• Presentations for financial analysts and investors in connection with capital market days and road shows, etc.
All reports, presentations and press releases are published on the Group’s website at www.husqvarnagroup.com.
Bo
ard R
ep
ort —
Corporate G
overnance Report

61 / Annual Report 2019 / Husqvarna Group
Internal Control over Financial ReportingThe Board is responsible for the Company’s internal controls according to the Swedish Companies Act, Swedish Annual Accounts Act and the Swedish Code. The purpose of this report is to provide shareholders and other interested parties with an under-standing of how internal control is organized within Husqvarna Group. It is limited to internal control over financial reporting.
This description of the Group’s internal control activities is based on the COSO framework (The Committee of Sponsoring Organizations of the Treadway Commission). The COSO framework comprises five key components that jointly facilitate achieving the objective of reliable financial reporting.
Control environmentThe foundation to establish good internal control is a framework of governing documents such as policies, instructions, guidelines and manuals that are embedded in the organizations vision and strategy. The Husqvarna Group Code of Conduct sets the impor-tance of integrity and ethical values governing interactions with employees, business partners and other stakeholders. The Group’s governance policies provide the framework that defines the organizational structure, responsibilities and authorities. The Board is ultimately responsible for establishing an effective inter-nal control system, including that the Company has procedures to ensure that (i) approved policies for financial reporting and inter-nal controls are applied, (ii) the Company’s financial reports are produced in accordance with applicable legislation, accounting standards and other requirements for listed companies, and (iii) there is an appropriate system for follow-up and control of the Company’s financial reporting. The Board has established Rules of Procedure and clear instructions for its work, which also cover the activities of the Audit Committee. The overall duty of the Audit Committee is to support the Board’s supervision of the audit and reporting processes, and to ensure the quality of such processes. The activities of the Audit Committee during the year are described on page 58.
Responsibility for maintaining an effective control environment as well as the ongoing work on risk management and internal control over financial reporting is delegated to the CEO by the Board. This responsibility, in turn, is further delegated to managers within their specific areas at various levels in the Company. Responsibility and authority are defined in instructions to the CEO, regarding the right to sign for the Company, as well as within various internal policies, instructions and guidelines.
Risk assessmentRisks relating to financial reporting are evaluated and monitored by the Board through the Audit Committee. A risk assessment is performed by management once a year and presented to the Audit Committee covering profit and loss and balance sheet items in the financial reporting and related areas and processes. The purpose of the risk assessment is to identify, which risks could result in a material misstatement in financial reporting, and to direct internal control activities to manage those risks in a proac-tive manner.
Control activitiesControl activities are integrated in processes for accounting and financial reporting. The prerequisite to ensure reliable financial reporting from all entities are uniform accounting principles which are stipulated in the Husqvarna Accounting Manual. For key financial processes, the Group has established Minimum Internal
Control Requirements (MICR) for its reporting units to enhance Husqvarna’s internal control environment. Husqvarna Group has a dedicated internal control function. The objective of Group Inter-nal Control is to provide support for Group Management and the management of the divisions, enabling them to continuously improve internal control relating to financial reporting.
Information and communicationThe Husqvarna Group has a central document management sys-tem, which contains the governing documents, and is open to all employees. The governing documents relating to financial reporting such as the Husqvarna Accounting Manual are subject to regular reviews and updates. Changes in accounting proce-dures are communicated and explained in newsletters from the Group’s accounting function. Furthermore, to ensure the correct implementation of such changes, the Group has established internal forums with participation from key stakeholders in the area of financial reporting.
Monitoring activitiesOngoing responsibility for monitoring and follow-up of financial reporting is performed by the Group Finance function. Country Officers are appointed by the Husqvarna Group in each country where the Group has at least one active subsidiary. The duties of such Country Officers include safeguarding the interests of share-holders as well as to ensure compliance with laws and regulations. Country Officers’ responsibilities also include ensuring that the entities’ internal controls and financial reporting comply with Group policies, instructions and guidelines.
Group Management performs monthly reviews of the results for the Group and the divisions, as well as updated forecasts, stra-tegic plans and ongoing business activities. Identified internal control deficiencies are communicated in a timely manner to operational management responsible for taking corrective action, and to the Board, as appropriate. Considerations made in the quarterly closings are reported to the Audit Committee before the financial reports are presented to the financial market.
The Group Internal Audit function supports the development and improvement of internal control over financial reporting. Group Internal Audit was established by the Audit Committee as part of their monitoring role and as such the function has a solid reporting line to the Audit Committee. An annual internal audit plan based on an independent risk assessment is approved by the Audit Committee. Based on this audit plan, Group Internal Audit performs independent and objective audits to evaluate and improve the effectiveness of Husqvarna Group’s governance, risk management and internal control processes. The results of these audits are presented to the respective stakeholders including the Group CFO, the CEO, and the Audit Committee. The findings of the internal audits are reported to the Audit Committee together with the status of the progress to improve the internal control activities.
Bo
ard R
ep
ort —
Internal Control

62 / Annual Report 2019 / Husqvarna Group
NameFunction
Born
Tom Johnstone, CBEChair of the Board
1955
Ulla LitzénBoard member
1956
Katarina MartinsonBoard member
1981
Bertrand NeuschwanderBoard member
1962
Daniel NodhällBoard member
1978
Lars PetterssonBoard member
1954
Christine RobinsBoard member
1966
Kai WärnBoard member (and President & CEO)
1959
CV M. A., University of Glasgow, Scotland, Hon. Doc. in B.A., University of South Carolina, US. Hon. Doc. in Science, Cranfield University, UK. Member of the People & Sustainability Committee.
B. Sc., Stockholm School of Economics, Sweden and an MBA, Massachusetts Institute of Technology, US. Chair of the Audit Committee.
M. Sc., Stockholm School of Economics, Sweden. Portfolio management for the Lundberg Family. Member of the Audit Committee.
Graduate engineer, Institut National Agronomique de P aris-Grignon, France, with an MBA from INSEAD. Member of the People & Sustainability Committee.
M. Sc., Stockholm School of Economics, Sweden. Managing Director, Head of Listed Core Investments at Investor AB. Member of the Audit Committee.
M. Sc. in Applied Physics, Material Sciences, Uppsala University, Sweden. Hon. Doc. at Uppsala University. Chair of the People & Sustainability Committee.
BBA in Marketing and Finance, University of Wisconsin, Madison, US and an MBA at Marquette University, Milwaukee, WI, US.
M. Sc. in Mechanical Engineering, KTH Royal Institute of Technology, Stockholm, Sweden. President & CEO of Husqvarna AB.
Other major assignments
Board Chair of Combient AB and of the British-Swedish Chamber of Commerce. Vice Board Chair of Wärtsilä Corporation. Board member of Investor AB, Northvolt AB and Volvo Cars.
Board member of AB Electrolux, Epiroc AB, NCC AB and Ratos AB.
Board Chair of Indutrade AB. Board member of L E Lundberg-företagen AB, Fastighets AB L E Lundberg, Förvaltnings AB Lunden, L E Lundberg Kapital-förvaltning AB, Fidelio AB and AniCura AB.
Board member of Serge Ferrari Group SA.
Board member of SAAB AB. Board Chair of KP-Komponenter A/S. Board member of Festo AG, AB Industrivärden, Indutrade AB and L E Lundberg företagen AB.
Board member of AB Electrolux.
Previous positions
President & CEO of AB SKF 2003–2014. Executive Vice President of AB SKF 1999–2003. President Automotive Division, AB SKF 1995–2003. Senior management positions within AB SKF since 1987.
President of W Capital Management AB 2001–2005. Senior management positions and member of the Management Group, Investor AB 1996–2001. Managing Director, responsible for Core Holdings 1999–2000. President of Investor Scandinavia AB 1996–1998.
Analyst at Handelsbanken Capital Markets 2008, Vice President at Strategas Research Partners LLC, New York, US 2006–2008, investment research at ISI, International Strategy & Investment Group, New York, US 2005– 2006.
Chief Operating Officer, Groupe SEB, France 2014-2019, Senior Executive Vice President for Business Units, Brands, Innovation & Strategy, Groupe SEB 2012–2014, Senior Executive Vice President for Business Units Brands & Innovation, Groupe SEB 2010–2012, CEO, Devanlay/Lacoste 2004–2009, Chair and Chief Executive Officer, Aubert Group 2001– 2004.
Analyst focused on the engineering sector at Investor AB since 2002.
President & CEO of AB Sandvik 2002–2011 and various positions within AB Sandvik 1978–2002.
President & CEO of Char-Broil LLC, Columbus, GA, US 2014–2019. President & CEO of BodyMedia, Pittsburgh, PA, US 2009–2014. President & CEO of Philips Oral Healthcare, Seattle, WA, US 2005–2009. Marketing and Finance positions within S.C. Johnson company 1988– 2005.
Operations partner at IK Investment Partners Norden AB 2011–2013. President & CEO of Seco Tools AB 2004–2010. Various positions within ABB 1985–2004.
Holdings in Husqvarna December 31, 2019
990 A-shares, 14,800 B-shares, and 384,024 call options 1.
10,000 B-shares 113,478 A-shares 378,737 B-shares
7,500 B-shares 10,000 B-shares 5,000 B-shares American Depositary Receipts (ADR) B 1,866
385,149 B-shares (Own) 100,000 B-shares (Legal person)
Nationality / Elected UK / 2006 SE / 2010 SE / 2012 FR / 2016 SE / 2013 SE / 2014 US / 2017 SE / 2014
Total fees 2019, KSEK 2,080 820 715 660 715 720 580 –
Board meeting attendance
10/10 10/10 10/10 10/10 9/10 10/10 9/10 10/10
People & Sustainability Committee attendance
3/3 – – 1/3 – 3/3 – –
Audit Committeeattendance
– 7/7 6/7 – 7/7 – – –
Independence toHusqvarna Group
Yes Yes Yes Yes Yes Yes Yes No
Independence to major shareholders
No Yes No Yes No No Yes Yes
AuditorsErnst & Young AB, Hamish Mabon, Authorized Public Accountant. Born 1965. Other audit assignments include: Skanska AB, Svenska Cellu-losa Aktiebolaget SCA, Essity AB and SEB. Holdings in Husqvarna: 0 shares.
Soili JohanssonEmployee representative Born 1962. Representative of the Federation of Salaried Employees in Industry and Services. Holdings in Husqvarna: 225 A-shares, 750 B-shares.
Carita SvärdEmployee representative Born 1968. Representative of the Swedish Confederation of Trade Unions. Holdings in Husqvarna: 0 shares.
Board of Directors and auditors
1 Consisting of (a) 192,012 call options issued by Investor AB entitling to purchase Husqvarna B-shares, and (b) 192,012 call options issued by L E Lundbergföretagen AB entitling to purchase Husqvarna B-shares.
Board of Directors and auditors
Bo
ard R
ep
ort —
Board of D
irectors and auditors
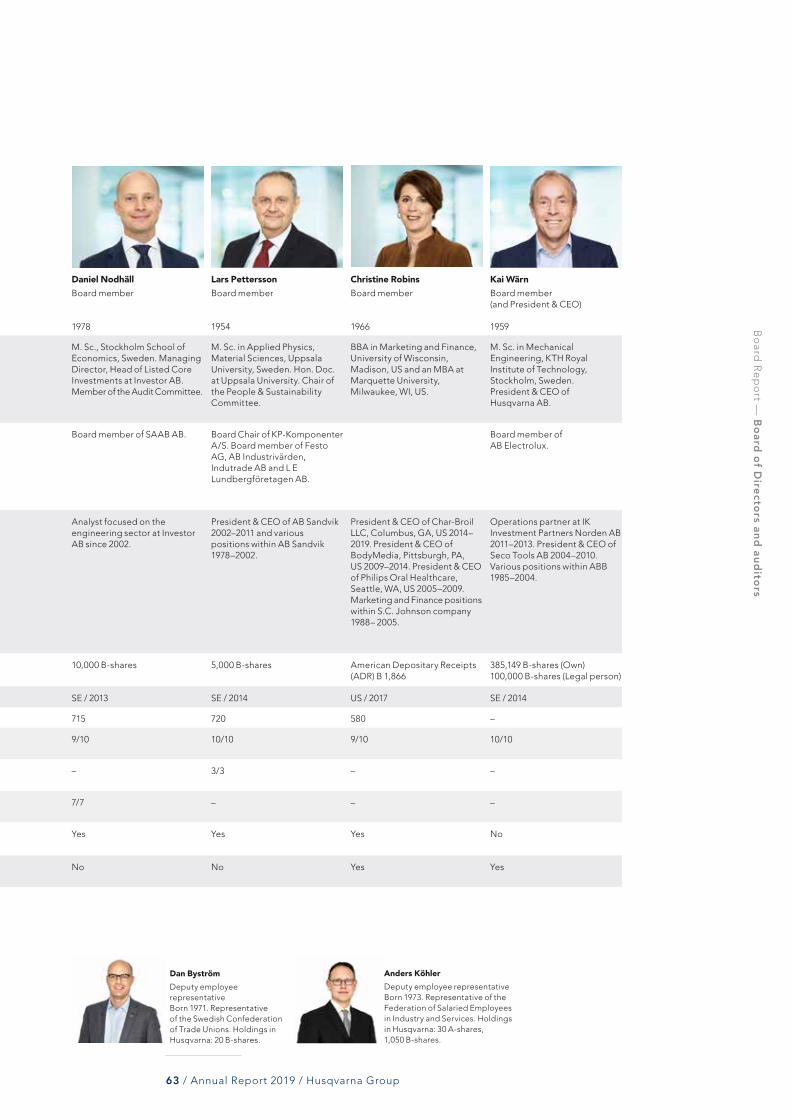
63 / Annual Report 2019 / Husqvarna Group
Anders KöhlerDeputy employee representative Born 1973. Representative of the Federation of Salaried Employees in Industry and Services. Holdings in Husqvarna: 30 A-shares, 1,050 B-shares.
Dan Byström Deputy employee representative Born 1971. Representative of the Swedish Confederation of Trade Unions. Holdings in Husqvarna: 20 B-shares.
NameFunction
Born
Tom Johnstone, CBEChair of the Board
1955
Ulla LitzénBoard member
1956
Katarina MartinsonBoard member
1981
Bertrand NeuschwanderBoard member
1962
Daniel NodhällBoard member
1978
Lars PetterssonBoard member
1954
Christine RobinsBoard member
1966
Kai WärnBoard member (and President & CEO)
1959
CV M. A., University of Glasgow, Scotland, Hon. Doc. in B.A., University of South Carolina, US. Hon. Doc. in Science, Cranfield University, UK. Member of the People & Sustainability Committee.
B. Sc., Stockholm School of Economics, Sweden and an MBA, Massachusetts Institute of Technology, US. Chair of the Audit Committee.
M. Sc., Stockholm School of Economics, Sweden. Portfolio management for the Lundberg Family. Member of the Audit Committee.
Graduate engineer, Institut National Agronomique de P aris-Grignon, France, with an MBA from INSEAD. Member of the People & Sustainability Committee.
M. Sc., Stockholm School of Economics, Sweden. Managing Director, Head of Listed Core Investments at Investor AB. Member of the Audit Committee.
M. Sc. in Applied Physics, Material Sciences, Uppsala University, Sweden. Hon. Doc. at Uppsala University. Chair of the People & Sustainability Committee.
BBA in Marketing and Finance, University of Wisconsin, Madison, US and an MBA at Marquette University, Milwaukee, WI, US.
M. Sc. in Mechanical Engineering, KTH Royal Institute of Technology, Stockholm, Sweden. President & CEO of Husqvarna AB.
Other major assignments
Board Chair of Combient AB and of the British-Swedish Chamber of Commerce. Vice Board Chair of Wärtsilä Corporation. Board member of Investor AB, Northvolt AB and Volvo Cars.
Board member of AB Electrolux, Epiroc AB, NCC AB and Ratos AB.
Board Chair of Indutrade AB. Board member of L E Lundberg-företagen AB, Fastighets AB L E Lundberg, Förvaltnings AB Lunden, L E Lundberg Kapital-förvaltning AB, Fidelio AB and AniCura AB.
Board member of Serge Ferrari Group SA.
Board member of SAAB AB. Board Chair of KP-Komponenter A/S. Board member of Festo AG, AB Industrivärden, Indutrade AB and L E Lundberg företagen AB.
Board member of AB Electrolux.
Previous positions
President & CEO of AB SKF 2003–2014. Executive Vice President of AB SKF 1999–2003. President Automotive Division, AB SKF 1995–2003. Senior management positions within AB SKF since 1987.
President of W Capital Management AB 2001–2005. Senior management positions and member of the Management Group, Investor AB 1996–2001. Managing Director, responsible for Core Holdings 1999–2000. President of Investor Scandinavia AB 1996–1998.
Analyst at Handelsbanken Capital Markets 2008, Vice President at Strategas Research Partners LLC, New York, US 2006–2008, investment research at ISI, International Strategy & Investment Group, New York, US 2005– 2006.
Chief Operating Officer, Groupe SEB, France 2014-2019, Senior Executive Vice President for Business Units, Brands, Innovation & Strategy, Groupe SEB 2012–2014, Senior Executive Vice President for Business Units Brands & Innovation, Groupe SEB 2010–2012, CEO, Devanlay/Lacoste 2004–2009, Chair and Chief Executive Officer, Aubert Group 2001– 2004.
Analyst focused on the engineering sector at Investor AB since 2002.
President & CEO of AB Sandvik 2002–2011 and various positions within AB Sandvik 1978–2002.
President & CEO of Char-Broil LLC, Columbus, GA, US 2014–2019. President & CEO of BodyMedia, Pittsburgh, PA, US 2009–2014. President & CEO of Philips Oral Healthcare, Seattle, WA, US 2005–2009. Marketing and Finance positions within S.C. Johnson company 1988– 2005.
Operations partner at IK Investment Partners Norden AB 2011–2013. President & CEO of Seco Tools AB 2004–2010. Various positions within ABB 1985–2004.
Holdings in Husqvarna December 31, 2019
990 A-shares, 14,800 B-shares, and 384,024 call options 1.
10,000 B-shares 113,478 A-shares 378,737 B-shares
7,500 B-shares 10,000 B-shares 5,000 B-shares American Depositary Receipts (ADR) B 1,866
385,149 B-shares (Own) 100,000 B-shares (Legal person)
Nationality / Elected UK / 2006 SE / 2010 SE / 2012 FR / 2016 SE / 2013 SE / 2014 US / 2017 SE / 2014
Total fees 2019, KSEK 2,080 820 715 660 715 720 580 –
Board meeting attendance
10/10 10/10 10/10 10/10 9/10 10/10 9/10 10/10
People & Sustainability Committee attendance
3/3 – – 1/3 – 3/3 – –
Audit Committeeattendance
– 7/7 6/7 – 7/7 – – –
Independence toHusqvarna Group
Yes Yes Yes Yes Yes Yes Yes No
Independence to major shareholders
No Yes No Yes No No Yes Yes
Bo
ard R
ep
ort —
Board of D
irectors and auditors

64 / Annual Report 2019 / Husqvarna Group
NameFunction
Kai Wärn 1
President & CEO
Glen InstoneSenior Vice President, Finance, IR & Commu-nication and Chief Financial Officer
Henric Andersson 1
President, Construction Division
Brian BelangerSenior Vice President, Legal Affairs, General Counsel and Secretary to the Board
Leigh Dagberg Senior Vice President, People & Organization
Per EricsonSenior Vice President, Business Development
Pavel HajmanSenior Vice President, Operations Develop-ment, Global Informa-tion Services and CIO
Anders JohansonSenior Vice President, Innovation and Technology and CTO
Sascha MengesPresident, Husqvarna Division
Pär ÅströmPresident, Gardena Division
Born 1959 1977 1973 1969 1970 1963 1965 1969 1971 1972
CV M. Sc. in Mechanical Engineering, KTH Royal Institute of Technology, Stockholm, Sweden. Employed 2013. Board member of AB Electrolux. Member of Group Management since 2013.
B.A. (Hons) in Accounting & Finance, University of Teesside, UK. Chartered Institute of Management Accountants (CIMA).Employed 2002. Member of Group Man-agement since 2018.
M. Sc. in Industrial Engineering & Management, Linköping Institute of Technology, Sweden. Employed 1997. Member of Group Management since 2012.
J.D./LLM, Duke University School of Law. Employed 2006. Member of Group Management since 2015.
M. Sc. in Organizational Behaviour, University of London, UK. B.A. in History, University of California, Berkeley, US. Employed 2013. Member of Group Management since 2018.
Forest Engineer, Swedish University of Agricultural Sciences, Sweden. Studies in Change Management in Organization and Social Systems, Interna-tional Association for Organisational and Social Development (IOD), Belgium. Employed 2011. Member of Group Management since 2011.
M. Sc. in Industrial Engineering and Management, Linköping Institute of Technology, Sweden. Employed 2014. Member of Group Management since 2014.
M. Sc. Chemical Engineering and an MBA, Chalmers University of Technol-ogy, Gothenburg, Sweden. Employed 2015. Part time adjunct professor, industrial product development, KTH Royal Institute of Technology, Stockholm, Sweden. Board member Etac Group. Member of Group Management since 2015.
M. Sc. in Ind. Engineering & Management, Swiss Federal Institute of Technology, Zurich, Switzerland. MBA, INSEAD, France. Employed 2004. Member of Group Management since 2011.
M. Sc. in Industrial Engineering & Management, KTH Royal Institute of Technology, Stockholm, Sweden. Employed 2013. Member of Group Management since 2015.
Previous positions
Operations partner at IK Investment Partners Norden AB 2011–2013. President & CEO of Seco Tools AB 2004–2010. Various positions at ABB 1985–2004.
Various positions in Husqvarna Group; Vice President Global Sales & Service, Husqvarna Division 2016–2018, VP & CFO Husqvarna Division 2014–2017, VP & CFO EMEA, 2013–2014, VP & CFO Manufacturing, Logistics and Sourcing 2011–2013, VP & CFO Global Supply Chain 2009–2011.
Various positions in Husqvarna Group; Senior Vice President, Technology Office, 2014–2015. Executive Vice President, Head of Product Management & Development 2012–2015. Vice President Construction Equipment 2008–2011. Vice President Commercial Lawn & Garden and President, Husqvarna Turf Care 2004–2008. Various positions in product and business management, Husqvarna 1997–2004.
Vice President Legal Affairs Husqvarna Asia/Pacific Region, Husqvarna Group 2009–2012, with temporary additional assignments as Acting General Counsel Husqvarna Americas, Husqvarna Group 2013 and acting Head of Asia/Pacific Sales Region 2014. Associate General Counsel, Husqvarna Americas, Husqvarna Group 2006–2009, Partner, Cohen & Grigsby, P.C. 2000–2006.
Vice President and Head of People & Organization, Husqvarna Group 2018. Vice President T alent Management, Husqvarna Group 2013–2018. Manager, PwC Consulting 2012–2013. Partner and Consultant, MindShift 2002–2012. Head of Research & Consulting, Manager, Universum 1997–2000. Research Specialist and Product Developer, Information Express 1992–1996.
Various positions in Husqvarna Group; SVP Group People & Organization 2011–2018, acting SVP Group Communications, Brand & Marketing 2017–2018. Executive Vice President Human Resources, Haldex 2006–2011. Various positions with increasing responsibility, Stora Enso 1987–2006, most recently as Executive Vice President Corporate Human Resources & Business Excellence.
President, Husqvarna Division 2014–2018. Executive Vice President, Head of Asia/Pacific, Husqvarna Group 2014. President Assa Abloy AHG Greater China 2013–2014. Various positions in Seco Tools, President Asia/Pacific, Senior Vice President Group Business Development, Regional Director CEE, 1990–2013.
Partner and Global Practice Leader Technology and Innovation Manage-ment, Arthur D. Little 2000–2006; 2008–2015. Director Strategic Product and Technology Planning, Gambro 2008. Director Business office and head of Business Consulting, Volvo IT 2006–2007. Various positions within Nobel Biocare 1996–2000.
President Gardena Division 2014–2018. Executive Vice President, Head of Manufacturing & Logistics, Husqvarna Group 2011–2014. Vari-ous positions in Supply Chain Management and Operations, Husqvarna Group 2007–2011. Vice President Supply Chain Management, Gardena AG 2004–2007. Associate Principal Management Consulting, McKinsey & Company, Inc 1996–2004.
Senior Vice President Business Development, Husqvarna Group 2013–2018. Principal, A.T. Kearney Management Consultants 2007–2013. A.T. Kearney and Occam Associates Management Consulting 1998–2007.
Holdings in Husqvarna
December 31, 2019
385,149 B-shares (Own) and 100,000 B-shares (Legal person)
25,599 B-shares 56,065 B-shares 43,370 B-shares 12,992 B-shares 92,635 B-shares 101,343 B-shares 17,761 B-shares 111,026 B-shares 61,838 B-shares
Group Management
1 Henric Andersson will replace Kai Wärn as President and CEO as from April 2, 2020.
Bo
ard R
ep
ort —
Group M
anagement

65 / Annual Report 2019 / Husqvarna Group
NameFunction
Kai Wärn 1
President & CEO
Glen InstoneSenior Vice President, Finance, IR & Commu-nication and Chief Financial Officer
Henric Andersson 1
President, Construction Division
Brian BelangerSenior Vice President, Legal Affairs, General Counsel and Secretary to the Board
Leigh Dagberg Senior Vice President, People & Organization
Per EricsonSenior Vice President, Business Development
Pavel HajmanSenior Vice President, Operations Develop-ment, Global Informa-tion Services and CIO
Anders JohansonSenior Vice President, Innovation and Technology and CTO
Sascha MengesPresident, Husqvarna Division
Pär ÅströmPresident, Gardena Division
Born 1959 1977 1973 1969 1970 1963 1965 1969 1971 1972
CV M. Sc. in Mechanical Engineering, KTH Royal Institute of Technology, Stockholm, Sweden. Employed 2013. Board member of AB Electrolux. Member of Group Management since 2013.
B.A. (Hons) in Accounting & Finance, University of Teesside, UK. Chartered Institute of Management Accountants (CIMA).Employed 2002. Member of Group Man-agement since 2018.
M. Sc. in Industrial Engineering & Management, Linköping Institute of Technology, Sweden. Employed 1997. Member of Group Management since 2012.
J.D./LLM, Duke University School of Law. Employed 2006. Member of Group Management since 2015.
M. Sc. in Organizational Behaviour, University of London, UK. B.A. in History, University of California, Berkeley, US. Employed 2013. Member of Group Management since 2018.
Forest Engineer, Swedish University of Agricultural Sciences, Sweden. Studies in Change Management in Organization and Social Systems, Interna-tional Association for Organisational and Social Development (IOD), Belgium. Employed 2011. Member of Group Management since 2011.
M. Sc. in Industrial Engineering and Management, Linköping Institute of Technology, Sweden. Employed 2014. Member of Group Management since 2014.
M. Sc. Chemical Engineering and an MBA, Chalmers University of Technol-ogy, Gothenburg, Sweden. Employed 2015. Part time adjunct professor, industrial product development, KTH Royal Institute of Technology, Stockholm, Sweden. Board member Etac Group. Member of Group Management since 2015.
M. Sc. in Ind. Engineering & Management, Swiss Federal Institute of Technology, Zurich, Switzerland. MBA, INSEAD, France. Employed 2004. Member of Group Management since 2011.
M. Sc. in Industrial Engineering & Management, KTH Royal Institute of Technology, Stockholm, Sweden. Employed 2013. Member of Group Management since 2015.
Previous positions
Operations partner at IK Investment Partners Norden AB 2011–2013. President & CEO of Seco Tools AB 2004–2010. Various positions at ABB 1985–2004.
Various positions in Husqvarna Group; Vice President Global Sales & Service, Husqvarna Division 2016–2018, VP & CFO Husqvarna Division 2014–2017, VP & CFO EMEA, 2013–2014, VP & CFO Manufacturing, Logistics and Sourcing 2011–2013, VP & CFO Global Supply Chain 2009–2011.
Various positions in Husqvarna Group; Senior Vice President, Technology Office, 2014–2015. Executive Vice President, Head of Product Management & Development 2012–2015. Vice President Construction Equipment 2008–2011. Vice President Commercial Lawn & Garden and President, Husqvarna Turf Care 2004–2008. Various positions in product and business management, Husqvarna 1997–2004.
Vice President Legal Affairs Husqvarna Asia/Pacific Region, Husqvarna Group 2009–2012, with temporary additional assignments as Acting General Counsel Husqvarna Americas, Husqvarna Group 2013 and acting Head of Asia/Pacific Sales Region 2014. Associate General Counsel, Husqvarna Americas, Husqvarna Group 2006–2009, Partner, Cohen & Grigsby, P.C. 2000–2006.
Vice President and Head of People & Organization, Husqvarna Group 2018. Vice President T alent Management, Husqvarna Group 2013–2018. Manager, PwC Consulting 2012–2013. Partner and Consultant, MindShift 2002–2012. Head of Research & Consulting, Manager, Universum 1997–2000. Research Specialist and Product Developer, Information Express 1992–1996.
Various positions in Husqvarna Group; SVP Group People & Organization 2011–2018, acting SVP Group Communications, Brand & Marketing 2017–2018. Executive Vice President Human Resources, Haldex 2006–2011. Various positions with increasing responsibility, Stora Enso 1987–2006, most recently as Executive Vice President Corporate Human Resources & Business Excellence.
President, Husqvarna Division 2014–2018. Executive Vice President, Head of Asia/Pacific, Husqvarna Group 2014. President Assa Abloy AHG Greater China 2013–2014. Various positions in Seco Tools, President Asia/Pacific, Senior Vice President Group Business Development, Regional Director CEE, 1990–2013.
Partner and Global Practice Leader Technology and Innovation Manage-ment, Arthur D. Little 2000–2006; 2008–2015. Director Strategic Product and Technology Planning, Gambro 2008. Director Business office and head of Business Consulting, Volvo IT 2006–2007. Various positions within Nobel Biocare 1996–2000.
President Gardena Division 2014–2018. Executive Vice President, Head of Manufacturing & Logistics, Husqvarna Group 2011–2014. Vari-ous positions in Supply Chain Management and Operations, Husqvarna Group 2007–2011. Vice President Supply Chain Management, Gardena AG 2004–2007. Associate Principal Management Consulting, McKinsey & Company, Inc 1996–2004.
Senior Vice President Business Development, Husqvarna Group 2013–2018. Principal, A.T. Kearney Management Consultants 2007–2013. A.T. Kearney and Occam Associates Management Consulting 1998–2007.
Holdings in Husqvarna
December 31, 2019
385,149 B-shares (Own) and 100,000 B-shares (Legal person)
25,599 B-shares 56,065 B-shares 43,370 B-shares 12,992 B-shares 92,635 B-shares 101,343 B-shares 17,761 B-shares 111,026 B-shares 61,838 B-shares
Bo
ard R
ep
ort —
Group M
anagement
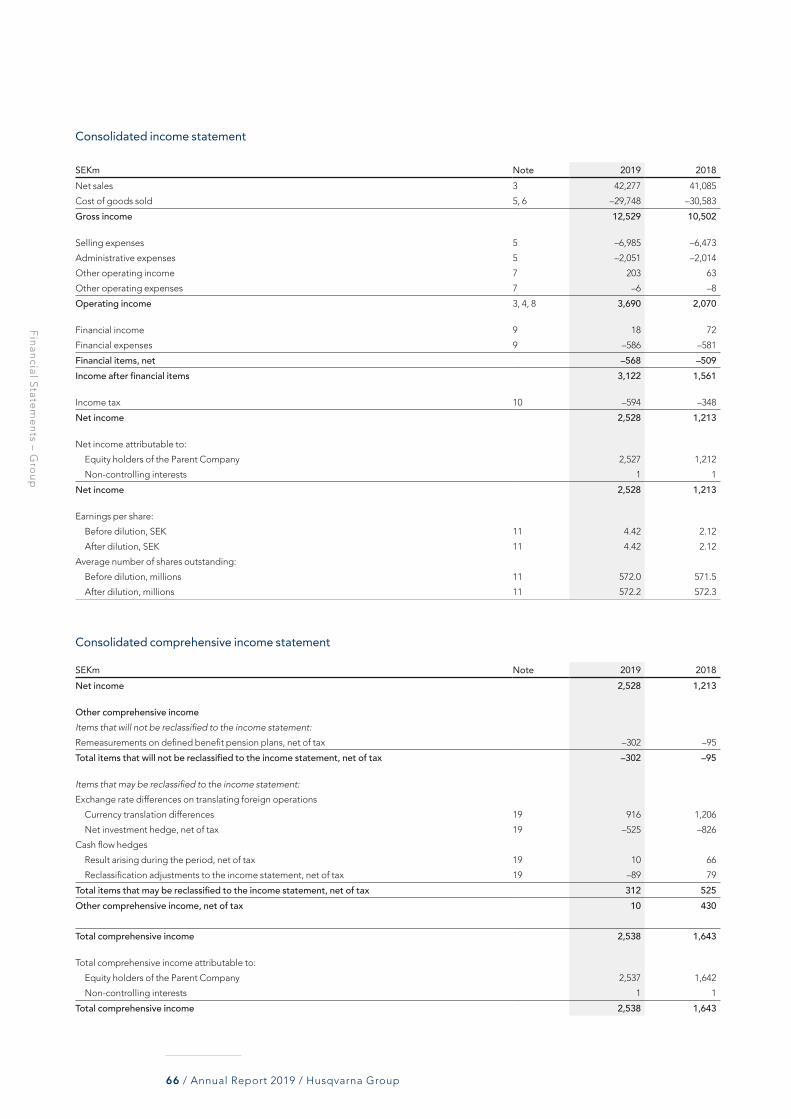
Fin
ancial S
tatem
en
ts – Gro
up
66 / Annual Report 2019 / Husqvarna Group
Consolidated income statement
SEKm Note 2019 2018Net sales 3 42,277 41,085
Cost of goods sold 5, 6 –29,748 –30,583
Gross income 12,529 10,502
Selling expenses 5 –6,985 –6,473
Administrative expenses 5 –2,051 –2,014
Other operating income 7 203 63
Other operating expenses 7 –6 –8
Operating income 3, 4, 8 3,690 2,070
Financial income 9 18 72
Financial expenses 9 –586 –581
Financial items, net –568 –509Income after financial items 3,122 1,561
Income tax 10 –594 –348
Net income 2,528 1,213
Net income attributable to:
Equity holders of the Parent Company 2,527 1,212
Non-controlling interests 1 1
Net income 2,528 1,213
Earnings per share:
Before dilution, SEK 11 4.42 2.12
After dilution, SEK 11 4.42 2.12
Average number of shares outstanding:
Before dilution, millions 11 572.0 571.5
After dilution, millions 11 572.2 572.3
Consolidated comprehensive income statement
SEKm Note 2019 2018Net income 2,528 1,213
Other comprehensive incomeItems that will not be reclassified to the income statement:
Remeasurements on defined benefit pension plans, net of tax –302 –95
Total items that will not be reclassified to the income statement, net of tax –302 –95
Items that may be reclassified to the income statement:
Exchange rate differences on translating foreign operations
Currency translation differences 19 916 1,206
Net investment hedge, net of tax 19 –525 –826
Cash flow hedges
Result arising during the period, net of tax 19 10 66
Reclassification adjustments to the income statement, net of tax 19 –89 79
Total items that may be reclassified to the income statement, net of tax 312 525Other comprehensive income, net of tax 10 430
Total comprehensive income 2,538 1,643
Total comprehensive income attributable to:
Equity holders of the Parent Company 2,537 1,642
Non-controlling interests 1 1
Total comprehensive income 2,538 1,643
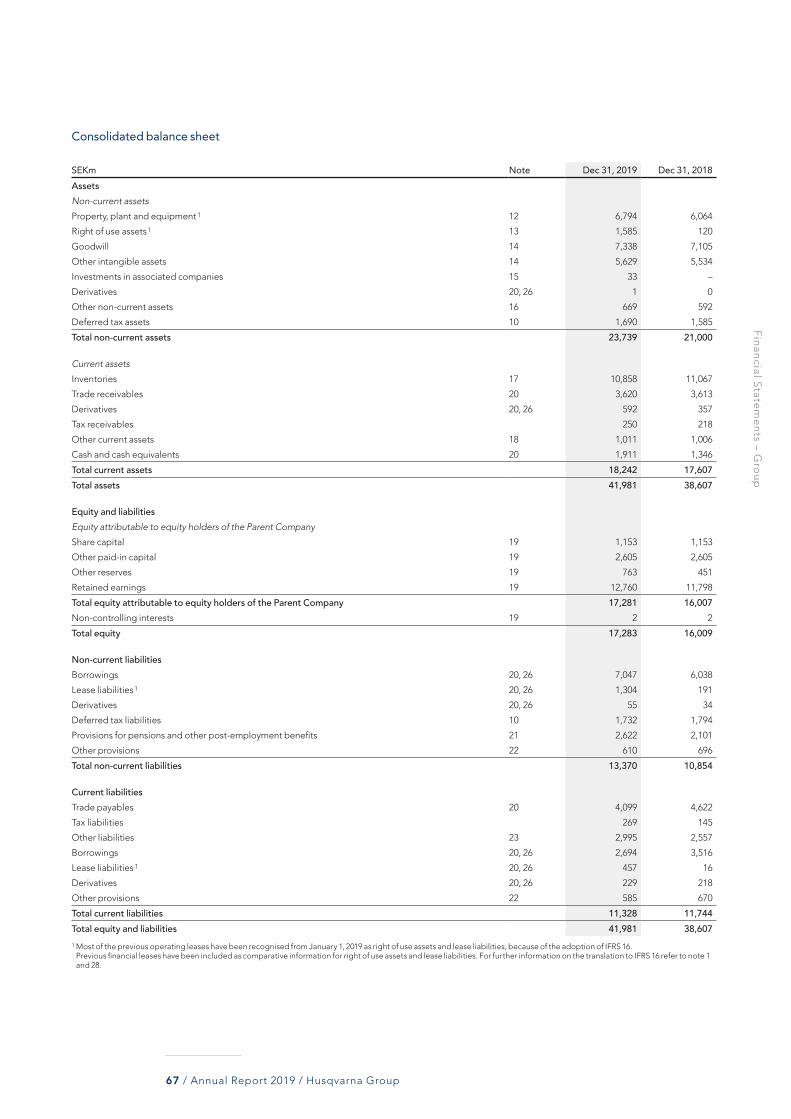
Fin
ancial S
tatem
en
ts – Gro
up
67 / Annual Report 2019 / Husqvarna Group
Consolidated balance sheet
SEKm Note Dec 31, 2019 Dec 31, 2018AssetsNon-current assets
Property, plant and equipment 1 12 6,794 6,064
Right of use assets 1 13 1,585 120
Goodwill 14 7,338 7,105
Other intangible assets 14 5,629 5,534
Investments in associated companies 15 33 –
Derivatives 20, 26 1 0
Other non-current assets 16 669 592
Deferred tax assets 10 1,690 1,585
Total non-current assets 23,739 21,000
Current assets
Inventories 17 10,858 11,067
Trade receivables 20 3,620 3,613
Derivatives 20, 26 592 357
Tax receivables 250 218
Other current assets 18 1,011 1,006
Cash and cash equivalents 20 1,911 1,346
Total current assets 18,242 17,607Total assets 41,981 38,607
Equity and liabilitiesEquity attributable to equity holders of the Parent Company
Share capital 19 1,153 1,153
Other paid-in capital 19 2,605 2,605
Other reserves 19 763 451
Retained earnings 19 12,760 11,798
Total equity attributable to equity holders of the Parent Company 17,281 16,007Non-controlling interests 19 2 2
Total equity 17,283 16,009
Non-current liabilitiesBorrowings 20, 26 7,047 6,038
Lease liabilities 1 20, 26 1,304 191
Derivatives 20, 26 55 34
Deferred tax liabilities 10 1,732 1,794
Provisions for pensions and other post-employment benefits 21 2,622 2,101
Other provisions 22 610 696
Total non-current liabilities 13,370 10,854
Current liabilitiesTrade payables 20 4,099 4,622
Tax liabilities 269 145
Other liabilities 23 2,995 2,557
Borrowings 20, 26 2,694 3,516
Lease liabilities 1 20, 26 457 16
Derivatives 20, 26 229 218
Other provisions 22 585 670
Total current liabilities 11,328 11,744Total equity and liabilities 41,981 38,6071 Most of the previous operating leases have been recognised from January 1, 2019 as right of use assets and lease liabilities, because of the adoption of IFRS 16.
Previous financial leases have been included as comparative information for right of use assets and lease liabilities. For further information on the translation to IFRS 16 refer to note 1 and 28.

Fin
ancial S
tatem
en
ts – Gro
up
68 / Annual Report 2019 / Husqvarna Group
Consolidated cash flow statement
SEKm Note 2019 2018Cash flow from operationsOperating income 3,690 2,070
Non cash items
Depreciation/amortization and impairment 5, 12, 13, 14 2,089 1,930
Other non cash items 270 676
Cash items
Paid restructuring costs –272 –62
Net financial items, received/paid –490 –448
Taxes paid –811 –970
Cash flow from operations, excluding change in operating assets and liabilities 4,476 3,196
Change in operating assets and liabilitiesChange in inventories 627 –1,366
Change in trade receivables 114 –69
Change in trade payables –656 296
Change in other operating assets/liabilities 347 –70
Cash flow from operating assets and liabilities 432 –1,209Cash flow from operations 4,908 1,987
InvestmentsAcquisitions and divestments of subsidiaries/operations and divestments of property, plant and equipment 1 27 349 –237
Investments in property, plant and equipment 12 –1,577 –1,542
Investments in intangible assets 14 –655 –693
Investments and divestments of financial assets –56 0
Cash flow from investments –1,939 –2,472Cash flow from operations and investments 2,969 –485
FinancingProceeds from borrowings 26 3,577 4,875
Repayment of borrowings 26 –3,466 –2,950
Repayment of lease liabilities 26 –447 –
Net investment hedge 26 –1,017 –1,053
Change in other interest-bearing net debt excluding liquid funds 26 194 332
Dividend paid to shareholders –1,287 –1,286
Dividend paid to non-controlling interests –1 –6
Cash flow from financing –2,447 –88
Total cash flow 522 –573
Cash and cash equivalents at the beginning of the year 1,346 1,872
Exchange rate differences referring to cash and cash equivalents 43 47
Cash and cash equivalents at year-end 1,911 1,346
1 Whereof net cash flow from investments in subsidiaries and operations SEKm –41 (–294).
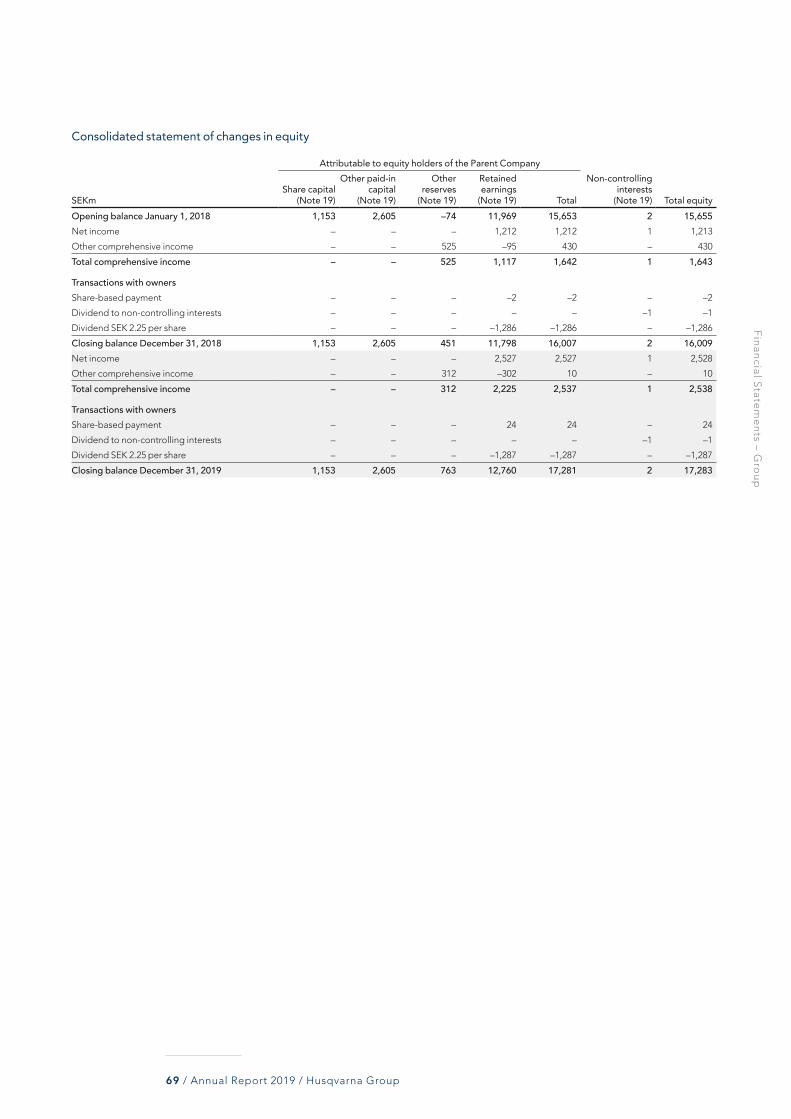
Fin
ancial S
tatem
en
ts – Gro
up
69 / Annual Report 2019 / Husqvarna Group
Consolidated statement of changes in equity
Attributable to equity holders of the Parent Company
SEKmShare capital
(Note 19)
Other paid-in capital
(Note 19)
Other reserves
(Note 19)
Retained earnings
(Note 19) Total
Non-controlling interests
(Note 19) Total equityOpening balance January 1, 2018 1,153 2,605 –74 11,969 15,653 2 15,655Net income – – – 1,212 1,212 1 1,213
Other comprehensive income – – 525 –95 430 – 430
Total comprehensive income – – 525 1,117 1,642 1 1,643
Transactions with ownersShare-based payment – – – –2 –2 – –2
Dividend to non-controlling interests – – – – – –1 –1
Dividend SEK 2.25 per share – – – –1,286 –1,286 – –1,286
Closing balance December 31, 2018 1,153 2,605 451 11,798 16,007 2 16,009Net income – – – 2,527 2,527 1 2,528
Other comprehensive income – – 312 –302 10 – 10
Total comprehensive income – – 312 2,225 2,537 1 2,538
Transactions with ownersShare-based payment – – – 24 24 – 24
Dividend to non-controlling interests – – – – – –1 –1
Dividend SEK 2.25 per share – – – –1,287 –1,287 – –1,287
Closing balance December 31, 2019 1,153 2,605 763 12,760 17,281 2 17,283

No
tes – G
rou
p
70 / Annual Report 2019 / Husqvarna Group
Note 1 Accounting principles
BASIS OF PREPARATIONThe consolidated financial statements of Husqvarna AB (publ) have been prepared in accordance with International Financial Reporting Standards (IFRS) and IFRIC interpretations as adopted by the European Union. Entities within Husqvarna Group apply uniform accounting prin-ciples. The policies set out below have been consistently applied to all years presented, unless otherwise stated. In addition, Swedish Annual Accounts Act and RFR 1, Supplementary Rules for Groups, have been applied. The consolidated financial statements have been prepared under the historical cost convention except for financial assets and lia-bilities carried at fair value through profit or loss (derivative instruments) and financial assets at fair value through other comprehensive income (trade receivables not sold but part of factoring programmes).
The preparation of financial statements in conformity with IFRS requires the use of certain critical accounting estimates. It also requires management to exercise its judgement in the process of applying the Group’s accounting policies. The areas involving a higher degree of judgement or complexity, or areas where assumptions and estimates are significant to the consolidated financial statements are disclosed in note 2.
CHANGES IN ACCOUNTING PRINCIPLES AND DISCLOSURES New standards adopted by Husqvarna Group 2019 The following new standards are adopted by Husqvarna Group as of January 1, 2019:
IFRS 16 “Leases” replaces IAS 17 “Leases” and is effective for annual periods beginning on or after January 1, 2019. The new standard have resulted in most leases being recognized in the balance sheet, as the distinction between operating and finance leases is removed. Under the new standard, an asset (the right to use the leased asset) and a finan-cial liability (the obligation to make lease payments) is recognized, with exceptions for short-term leases and low-value assets which is expensed on a straight line basis. The standard affects the accounting for the Group’s operating leases (mainly buildings, cars and forklifts).
Husqvarna Group adopts IFRS 16 “Leases” retrospectively from Jan-uary 1, 2019 with the cumulative effect of initially applying the new stan-dard recognized on January 1, 2019. Comparatives for the 2018 financial year have not been restated as according to the transition requirements. On adoption of IFRS 16 the Group has recognized lease liabilities in rela-tion to leases which have previously been classified as operating leases under IAS 17. For further information on the transition to IFRS 16 and restatement, refer to note 28.
IFRIC 23 “Uncertainty over income tax treatments” clarifies how to recognize and measure deferred and current income tax assets and lia-bilities where there is uncertainty over a tax treatment. An uncertain tax treatment is any tax treatment applied by an entity where there is uncer-tainty over whether that treatment will be accepted by the tax authority. The interpretation is effective for annual periods beginning on or after January 1, 2019. Uncertain tax liabilities that have previously been pre-sented as deferred tax are reclassified to current tax, normally as a cur-rent liability. Husqvarna Group adopts IFRIC 23 “Uncertainty over income tax treatments” retrospectively from January 1, 2019 with the cumulative effect of initially applying the new standard recognized on January 1, 2019. Comparatives for the 2018 financial year have not been restated as according to the transition requirements. For further information on transition to IFRIC 23 and restatement, refer to note 28.
There are no other IFRS or IFRIC interpretations that are not yet effective and are expected to have a material impact on the Group.
ACCOUNTING AND VALUATION PRINCIPLESPrinciples applied for consolidationSubsidiariesThe financial statements include Husqvarna AB and all companies (sub-sidiaries) which the Parent Company controls. Husqvarna Group con-trols an entity when the Group is exposed to, or has rights to variable returns from its involvement with the entity and has the ability to affect those returns through the power over the entity. The Group generally controls a company by a shareholding of more than 50% of the voting rights referring to all shares and participations. Subsidiaries are fully consolidated from the date on which control is transferred to the Group. They are deconsolidated from the date control ceases.
Husqvarna Group applies the acquisition method to account for busi-ness combinations, whereby the assets, liabilities and contingent liabili-ties in a subsidiary on the date of acquisition are valued at fair value to determine the acquisition value to the Group. The valuation includes evaluation of any contingent consideration which is recognized at fair value at the acquisition date. All subsequent changes in the contingent consideration are recognized in the income statement. Transaction costs related to the business combination are expensed as they are incurred. If the consideration paid for the business combination exceeds the fair value of the identifiable assets, liabilities and contin gent liabili-ties, the difference is recognized as goodwill. If the fair value of the acquired net assets exceeds the consideration paid for the business combination, as in a bargain purchase, the difference is recognized directly in the income statement. The consolidated income statement for the Group includes the income statements for the Parent Company and its directly and indirectly owned subsidiaries after:• elimination of intercompany transactions, balances and unrealized
intercompany profits in stock, and • depreciation and amortization of acquired surplus values
At year-end 2019, the Group comprised of 140 operating units, and 96 legal entities.
Transactions with non-controlling interestsTransactions with non-controlling interests that do not result in loss of control are accounted for as equity transactions, that is, as transactions with the equity holders. Acquisitions from non-controlling interests result in an adjustment to equity, corresponding to the difference between the consideration paid and the carrying value of the non- controlling interest. Gains or losses on disposals to non-controlling interests are reported in equity. Disposals to non-controlling interests which result in loss of control are recorded as gains and losses in the income statement.
Foreign currency translationsForeign currency transactions are translated into the functional cur-rency using the exchange rates prevailing at the dates of the transac-tions. The financial statements are presented in Swedish kronor, SEK, which is the Parent Company’s functional currency and the presentation currency of Husqvarna Group.
Exchange rate gains or losses that occur from transactions in other currency than the functional currency and in translation of monetary assets or liabilities to the exchange rate at closing date are reported in the income statement. An exception to this accounting treatment is if the transaction qualifies as cash flow hedges or hedge of net invest-ments of which the unrealized exchange gains or losses are recognized in other comprehensive income.
Exchange rate gains and losses that relate to borrowing costs or liquid assets are accounted for in the income statement within the finance net. Other foreign exchange rate differences are accounted for in the operating income.
The income statements and balance sheets for all Group companies with functional currency other than the presentation currency of

No
tes – G
rou
p
71 / Annual Report 2019 / Husqvarna Group
Husqvarna Group is translated to the Group’s currency. Assets and lia-bilities for each balance sheet presented are translated at the closing rate. Income and expenses for each income statement are translated at average rates for each month respectively.
All currency translation differences that occur from the translation are accounted for in other comprehensive income. When a foreign operation is divested, currency translation differences that were recorded in equity are recognized in the income statement as part of the gain or loss on sale.
Goodwill and fair value adjustments arising on the acquisition of a foreign entity are treated as assets and liabilities of the foreign entity and translated at the closing rate.
Segment reportingHusqvarna Group’s operating segments are reported in a manner con-sistent with the internal reporting provided to the President and CEO (Husqvarna Group’s Chief operating decision maker) as a basis for eval-uating the performance and for decisions on how to allocate resources to the segments. Husqvarna Group comprises three segments (divisions): Husqvarna, Gardena and Construction. For a more detailed description of the segments, see note 3.
Property, plant and equipmentProperty, plant and equipment are reported at historical cost less accumulated depreciation, adjusted for any impairment charges. Historical cost includes expenditure that is directly attributable to the acquisition of the assets. Subsequent costs are included in the asset’s carrying amount only when it is probable that future economic bene-fits associated with the item will flow to the Group and the cost of the item can be measured reliably. The carrying amount of any component accounted for as a separate asset is derecognized when replaced. All other repairs and maintenance costs are charged to the income state-ment during the period in which they are incurred. Land is not depre-ciated as it is considered to have an unlimited useful life. Depreciation is based on the following estimated useful lives:
Buildings and land improvements 10–50 yearsMachinery and technical installations 3–15 yearsOther equipment 3–10 years
The Group assesses the estimated useful lives as well as whether there is any indication that any of the Company’s property, plant and equip-ment are impaired at the end of each reporting period.
Borrowing costsBorrowing costs directly attributable to the acquisition, construction or production of qualifying assets are added to the costs of those assets. Qualifying assets are assets that take a substantial period of time to get ready for their intended use or sale. All other borrowing costs are recog-nized as an expense in the period in which they are incurred.
Intangible assets GoodwillGoodwill arises from the acquisition of subsidiaries and represents the excess between the purchase price and the net fair value of the identifi-able assets, liabilities and contingent liabilities of the acquiree. Goodwill is reported as an intangible asset with indefinite useful life and mea-sured at cost less accumulated impairment losses.
For the purpose of impairment testing, goodwill acquired in a busi-ness combination is allocated to each of the cash generating units that is expected to benefit from the synergies of the combination.
The value of goodwill is continuously monitored, and is tested annu-ally for impairment or more regularly if there is an indication that the asset might be impaired. Any impairment is recognized immediately as an expense and is not subsequently reversed.
BrandsBrands that have been acquired separately are shown at historical cost. Brands that have been acquired through business combination are recognized at fair value at the acquisition date. All brands with finite useful lives are amortized on a straight-line basis during the useful life, estimated at 10 years. Brands are carried at cost less accumulated amortization and accumulated impairment. The brand Gardena is reported as an intangible asset with indefinite useful life. No other brands are identified as having indefinite useful lives.
Product development expensesHusqvarna Group capitalizes development expenses for new products provided that the level of certainty as to their future economic benefits and useful lives are high. An intangible asset is only recognized to the degree that the product is sellable on existing markets and that resources exist to complete the development. Only expenditure, which is directly attributable to the new product’s development, is recog-nized. Capitalized development costs are amortized over their useful lives, ranging between 3–5 years. The assets are tested for impairment annually or when there is an indication that the intangible asset may be impaired.
Other intangible assetsOther intangible assets include computer software, patents, licenses and customer relations. Computer software, patents and licenses are recognized at acquisition cost and are amortized on a straight-line basis over their estimated useful lives. Computer software has an esti-mated useful life of 3–6 years and patents and licenses have a useful life of 10–13 years. Customer relations are capitalized at fair value in connection with business combinations. The values of these customer relationships are amortized over their useful lives of 5–12 years.
AssociatesAssociates are all companies over which Husqvarna Group has signifi-cant influence but not control. The Group generally has significant influ-ence over a company by a shareholding between 20% and 50% of the voting rights. Husqvarna Group applies the equity method to account for investments in associates. Under the equity method of accounting, the investments are initially recognized at cost and adjusted thereafter to recognize the Group’s share of the post-acquisition profits or losses of the investee in profit or loss, and the Group’s share of movements in other comprehensive income of the investee in other comprehensive income. Dividends received or receivable from associates are recog-nized as a reduction in the carrying amount of the investment.
Impairment of non-financial assetsAssets that have an indefinite useful life (goodwill and the brand Gardena) or intangible assets not ready for use are not subject to amortization but tested annually for impairment, or more often if there is an indication of impairment. Assets that are subject to amortization are reviewed for impairment whenever events or changes in circumstances indicate that the carrying amount may not be recoverable. If there is an indication of impairment the Group estimates the recoverable amount of the asset. The recoverable amount is the higher of an asset’s fair value less cost to sell and value in use. An impairment loss is recognized by the amount by which the net book value of an asset exceeds its recoverable amount. For the purposes of assessing impairment, assets are grouped in cash generating units, which are the smallest identifiable group of assets generating cash inflows that are substantially independent of the cash inflows from other assets or group of assets. The Group’s cash generating units are the four segments (divisions); Husqvarna, Gardena, Consumer Brands and Construction. Refer to note 2 and note 14 regarding impair-ment of intangible assets with indefinite useful life.
Financial instrumentsRecognition and measurement of financial instrumentsRegular purchases and sales of financial assets are recognized on trade date, the date on which Husqvarna Group commits to purchase or sell the asset. At initial recognition, the Group measures a financial asset at its fair value plus, in the case of a financial asset not at fair value through profit or loss, transaction costs that are directly attributable to the acquisition of the financial asset. Transaction costs of financial assets carried at fair value through profit or loss are expensed in profit or loss.
Financial assets are derecognized when the right to receive cash flows from the investments has expired or has been transferred and when the Group has transferred substantially all of the risks and rewards of ownership. Financial liabilities are derecognized when the obligation is satisfied, cancelled or has expired.
Financial assets and liabilities at fair value through profit or loss are carried to fair value. All changes to fair value are reported in the income statement when they arise.

No
tes – G
rou
p
72 / Annual Report 2019 / Husqvarna Group
Offsetting financial instrumentsFinancial assets and liabilities are offset and the net amount reported in the balance sheet when there is a legally enforceable right to offset the recognized amounts and there is an intention to settle on a net basis or realize the asset and settle the liability simultaneously. Husqvarna Group has entered into master netting arrangements for certain financial derivatives. When the criteria for offsetting are fulfilled the derivatives are netted in the balance sheet.
Financial assets Classification and subsequent measurementHusqvarna Group classifies its financial assets in the following measurement categories: • Fair value through profit or loss (FVPL)• Fair value through other comprehensive income (FVOCI)• Amortized cost
Financial assets are included in current assets with the exception of maturities greater than 12 months after the end of the reporting period. These are classified as non-current assets.
Debt instrumentsDebt instruments are those financial instruments that meet the defini-tion of a financial liability from the issuer’s perspective, such as for example trade receivables.
Classification and subsequent measurement of debt instruments depend on the Group’s business model for managing the asset and the cash flow characteristics of the asset. There are two measurement cate-gories into which the Group classifies its debt instruments; Amortized cost and Fair value through other comprehensive income.
Amortized costFinancial assets that are held for collection of contractual cash flows and where those cash flows represent solely payments of principal and inter-est are measured at amortized cost. Any expected credit loss allowance recognized (see section “Impairment and expected loss” below) will adjust the carrying amount of these assets. Interest income from these financial assets is included in the income statement using the effective interest rate method. Assets recorded at amortized cost include finan-cial non-current assets, trade receivables, other receivables, short-term investments and cash and cash equivalents.
Fair value through other comprehensive income (FVOCI) Financial assets that are held for collection of contractual cash flows and for selling the assets, where the assets’ cash flows represent solely pay-ments of principal and interest, are measured at fair value through other comprehensive income (FVOCI). Movements in the carrying amount are reported in other comprehensive income, expect for the recognition of impairment gains or losses, interest revenue and foreign exchange gains and losses which are recognized in profit or loss. When the finan-cial asset is derecognized, the cumulative gain or loss previously recog-nized in other comprehensive income is reclassified from equity to profit or loss. Assets recorded at fair value through other comprehen-sive income include trade receivables, where part of the portfolio is sold off in factoring agreements.
Husqvarna Group reclassifies debt investments only when its busi-ness model for managing those assets changes.
Impairment and expected loss Husqvarna Group assesses on a forward-looking basis the expected credit losses (ECL) associated with its debt instrument assets carried at amortized cost and FVOCI. The Group recognizes a loss allowance for such losses at each reporting date. The measurement of ECL reflects an unbiased and probability-weighted amount that is determined by eval-uating a range of possible outcomes, the time value of money; and rea-sonable and supportable forward looking information that is available without undue cost or effort at the reporting date about past events, current condition and forecasts of future economic conditions.
For trade receivables, the Group applies the simplified approach in IFRS 9, which requires expected lifetime losses to be recognized from initial recognition of the receivables. Expected credit losses are esti-mated by grouping trade receivables based on shared credit risk characteristics, days past due.
Financial liabilities Classification and subsequent measurementAll of the Groups financial liabilities (excluding derivatives which are addressed in separate section below) are classified as subsequently measured at amortized cost. Liabilities measured at amortized cost include borrowings, financial lease liabilities, trade payables and other liabilities. Financial liabilities due within 12 months are classified as short-term liabilities, while those due after 12 months are classified as long-term liabilities.
Accounting of derivative financial instruments and hedging activitiesDerivatives are initially recognized at fair value on the date on which the derivative contract is entered into and are subsequently re-measured at their fair value. The method of recognizing the resulting gain or loss depends on whether the derivative is designated as a hedging instru-ment, and if so, the nature of the item being hedged. Husqvarna Group designates certain derivatives as either hedges of highly probable fore-cast transactions (cash flow hedges) or hedges of net investments in a for-eign operation (net investment hedge). When hedging net investments in foreign operations and forecasted cash flows from sales and purchases, the hedged risk is defined as the risk of changes in the spot rate.
Husqvarna Group documents at the inception of the transaction the relationship between the hedging instruments and hedged items, as well as risk-management objectives and strategy for undertaking vari-ous hedging transactions. The Group also documents its assessment, both at the hedging inception and on an ongoing basis, of whether the derivatives that are used in hedging transactions are highly effective in offsetting changes in fair values or cash flows of hedged items.
The full fair value of a hedging derivative is classified as non-current asset or liability when the remaining hedged item is more than 12 months and as current asset or liability if the maturity is shorter than 12 months.
Cash flow hedgeThe effective portion of change in the fair value of derivatives that are designated and qualify as cash flow hedges is recognized in other com-prehensive income. The gain or loss relating to the ineffective portion is recognized immediately in the income statement as operating income.
Amounts accumulated in equity are reclassified to the income state-ment in the periods when the hedged item will affect profit or loss (for instance when the forecast sale which is hedged takes place). However, when the forecast transaction that is hedged results in the recognition of a non-financial item (for example, inventory), the gains and losses pre-viously deferred in equity are transferred from equity and included in the initial measurement of the value of the asset or liability. The deferred amounts are ultimately recognized in cost of goods sold in the case of inventory.
The gain or loss relating to the effective portion of interest rate swaps hedging variable rate borrowings is recognized in other comprehensive income. The gain or loss relating to the ineffective portion is recognized in the income statement within financial items.
When a hedging instrument expires or is sold, or when a hedge no longer meets the criteria for hedge accounting, any cumulative gain or loss existing in equity at the time remains in equity and is recognized when the forecast transaction is ultimately recognized in the income statement. When a forecast transaction is no longer expected to occur, the cumulative gain or loss that was reported in equity is immediately transferred to the income statement.
Net investment hedgeHedges of net investments in foreign operations are accounted for simi-larly to cash flow hedges. Any gain or loss on the hedging instrument relating to the effective portion of the hedge is recognized in other comprehensive income. The gain or loss relating to the ineffective por-tion is recognized in the income statement. Gains and losses accumu-lated in equity are included in the income statement when the foreign operation is partially disposed of or sold.
Liquid fundsLiquid funds consist of cash on hand, bank deposits, other short-term highly liquid investments and fair value derivative assets.

No
tes – G
rou
p
73 / Annual Report 2019 / Husqvarna Group
InventoriesInventories and work in progress are valued at the lower of cost and net realizable value. The value of inventories is determined by using the weighted average cost formula. Net realizable value is defined as the estimated selling price in the ordinary course of business less the esti-mated costs of completion and the estimated costs necessary to exe-cute the sale at market value. Gains and losses previously deferred in equity on hedged forecast transactions are also included in the initial measurement cost of the inventory. The cost of finished goods and work in progress comprises raw material, direct labour, other direct cost and other related production overheads. Borrowing costs are not included in inventory. Appropriate provisions have been made for obsolescence.
Current and deferred taxThe tax expense for the period consists of both current and deferred tax. Tax is recognized in the income statement, except to the extent that it relates to items recognized in other comprehensive income or directly in equity. In these cases tax is reported in other comprehensive income and equity respectively.
Current tax is calculated based on the taxable result for the year. This can differ to the income before tax reported in the income statement due to adjustment for non-taxable and non-deductible income and expenses and temporary differences. The current income tax is calcu-lated on the basis on the tax laws in the country of the Parent Company or the subsidiaries.
Management periodically review the positions taken in tax returns with respect to situations in which applicable tax regulations are subject to interpretations and establish provisions where appropriate on the basis of amounts expected to be paid to the tax authorities. Current tax also includes adjustments to income tax related to prior years.
Deferred tax is accounted for in accordance with the liability method. This means that a deferred tax asset or liability is reported on all tempo-rary differences arising between the tax basis for assets and liabilities and their net book value. Deferred tax is calculated based on the tax rates in the respective country.
Taxes incurred by Husqvarna Group are affected by appropriations and other taxable (or tax-related) transactions in the individual Group companies. They are also affected by the utilization of tax losses carried forward referring to previous years or to acquired companies. Deferred tax assets on tax losses, temporary differences and tax credits are rec-ognized to the extent it is probable that they will be utilized in the fore-seeable future.
Deferred tax is provided on temporary differences arising on invest-ments in subsidiaries except for deferred tax liabilities where the timing of the reversal of the temporary difference is controlled by the Group and it is probable that the temporary difference will not be reversed in the foreseeable future.
Deferred tax assets and deferred tax liabilities are shown net when a company or a group of companies, has a legally enforceable right to set off tax assets against tax liabilities, they refer to the same taxation author-ity and the intention is to settle the assets/liabilities with a net payment.
Pensions and other post-employment benefits Pension obligationsPensions and other post-employment benefit plans are classified as either defined contribution plans or defined benefit plans.
Under a defined contribution plan, the Group pays fixed contribu-tions into a separate entity and will have no legal obligation to pay fur-ther contributions if the fund does not hold sufficient assets to pay all employee benefits. Contributions are expensed when they are due. Prepaid contributions are recognized as an asset to the extent that a cash refund or a reduction in the future payments is available.
All other pensions and other post-employment benefit plans are defined benefit plans. Defined benefit plans define an amount of pen-sion benefit that an employee will receive on retirement, depending on factors such as age, years of service and compensation. The liability rec-ognized in the balance sheet in respect of defined benefit pension plans is the present value of the defined benefit obligation at the end of the reporting period less the fair value of plan assets. The defined bene-fit obligation is calculated annually by independent actuaries using the projected unit credit method. The present value of the defined benefit obligation is determined by discounting the estimated future cash out-flows using interest rates of high quality corporate bonds denominated in the currency in which the benefits will be paid, in most countries AA-rated corporate bond indexes matching the duration of the pension
obligation and in Sweden mortgage bonds. In countries without a deep market in such bonds, the market rate on government bonds is used.
Past service costs are recognized immediately in the operating income. Interest on the Group’s net pension plans are reported net within the Group’s finance items, and is calculated applying the dis-count rate as when calculating the net defined liability. Actuarial gains and losses arising from experience adjustments and changes in actuar-ial assumptions are charged or credited to equity in other comprehen-sive income in the period in which they arise.
Termination benefitsTermination benefits are payable when the employment is terminated by the Group before the normal retirement date, or whenever they accept voluntary redundancy in exchange for these benefits. Termina-tion benefits are recognized at the earlier of a) when the Group can no longer withdraw the offer of those benefits and b) when the entity rec-ognizes costs for a restructuring and involves the payment of termina-tion benefits.
Share-based compensation Husqvarna Group has share-based, equity settled, compensation pro-grams where the Group receives services from employees as consider-ation for equity instruments (shares and options). The cost of the granted instruments’ fair value at grant date is recognized during the vesting period.
The fair value of the instruments is the market value at grant date, adjusted for the discounted value of future dividends which employees will not receive. At the end of each reporting period, the Group revises the estimates of the number of instruments that are expected to vest. Husqvarna Group recognizes the impact of the revision to original esti-mates, if any, in the income statement, with a corresponding adjust-ment to equity.
In addition, the Group provides for employer social contributions expected to be paid in connection with the share-based compensation programs. The costs are charged to the income statement over the vesting period. The provision is periodically revalued on the basis of the fair value of the instruments at each closing date.
ProvisionsProvisions are recognized when the Group has a present legal or con-tractual obligation as a result of a past event and it is probable that an outflow of resources will be required to settle the obligation, and a reli-able estimate can be made of the amount of the obligation. The amount recognized as a provision is the best estimate of the expenditure required to settle the present obligation at the end of each reporting period. Provisions are measured at present value, when material.
Provisions for warranties are recognized at the date of sale of the products covered by the warranty and are calculated on the basis of his-torical data for similar products.
Restructuring provisions are recognized when the Group has adopted a detailed formal plan for the restructuring and has either started the implementation of the plan or communicated its main fea-tures to those affected by the restructuring.
Revenue recognitionHusqvarna Group mainly generates revenue from sales of finished products including spare parts and accessories, but also from services and license agreements.
Sale of finished products including spare parts and accessories Husqvarna Group manufactures and sells finished products, spare parts and accessories mainly to dealers and retailers but also directly to con-sumers. In customer contracts with sale of finished products there are generally two performance obligations, products and shipping ser-vices. Revenue recognition will occur at a point in time when control of the asset is transferred to the customer. The point in time where control is transferred to the customer for goods depends on the terms of deliv-ery (incoterms) used. Husqvarna Group is the principal for both the sale of the goods and the shipping service, hence the “gross” amount paid by the customer for the shipping service is recognized as revenue and the corresponding expense is recognized in cost of goods sold. A receiv able is recognized when the goods are delivered as this is the point in time that the consideration is unconditional because only the passage of time is required before the payment is due. The normal credit terms is usually 30–90 days.

No
tes – G
rou
p
74 / Annual Report 2019 / Husqvarna Group
The products are sometimes sold with volume related discounts based on the aggregated sales over a specific time period, normally 1 year. Revenue from these sales is recognized based on the price specified in the contract, net of the estimated volume discounts. Accumulated experience is used to estimate and provide for the discounts using either the expected value method or an assessment of the most likely amount. Revenue is only recognized to the extent that its highly proba-ble that a significant reversal will not occur. A contract liability is recog-nized for expected volume discount payable to customers in relation to sales made until the end of the reporting period.
The estimated volume discount is revised at each reporting date.A right of return are sometimes granted in the retail and consumer industry. A right of return can follow from legislation, statutory require-ments, business practice or be stated in the contract with the customer. Revenue is not recognized for goods expected to be returned, instead a refund liability (included in other current liabilities) and a right to the returned goods (included in other current assets) are recognized for the products expected to be returned. Accumulated experience is used to estimate such returns at the time of sale (expected value method). The Group’s obligation to provide a refund for faulty products under the standard warranty terms is recognized as a provision.
ServicesHusqvarna Group provide services such as product repairs and service/maintenance. Revenues from product repairs are recognized when the service is performed. Revenues from service/maintenance agreements are recognized on a linear basis over the contract period, unless there is evidence that some other method better measures progress towards satisfying the performance obligation.
Husqvarna Group sells some extended warranty that is separately priced. The revenue is recognized during the warranty period, which usually starts after the standard warranty period. The revenue is recog-nized on a linear basis over the contract period, unless there is evidence that some other method better measures progress toward satisfying the performance obligation. Warranty during the standard warranty terms is recognized as a provision.
License agreementsHusqvarna Group licenses brand names to other companies. The license provides the licensee a right to access intellectual property throughout the license period. The most common license types for Husqvarna Group is sales- or usage-based royalties where the revenue is recognized when the underlying sales or usage occur.
Interest incomeInterest income is recognized on a time-proportion basis using the effective interest method.
Dividend incomeDividends are recognized when it is determined that payments will be received.
Government grantsGovernment grants relate to financial grants from governments, public authorities and similar local, national, or international bodies. These are recognized when there is a reasonable assurance that Husqvarna Group will comply with the conditions attached to them and that the grants will be received. Government grants relating to assets are included in the balance sheet as prepaid income and recognized as income over the useful life of the assets. Government grants relating to expenses are recognized in the income statement as a deduction of such related expenses.
Leasing (Applicable until December, 31 2018)The accounting principles for Leasing which are applicable until December 31, 2018 are available in the Annual Report of 2018, which can be found at www.husqvarnagroup.com.
Leasing (Applicable from January, 1 2019)Husqvarna Group mainly lease assets within the categories: “Land and buildings” (warehouses, office space and factories), “Forklifts and machinery” and “Cars and other vehicles”. The lease contracts contain a wide range of different terms and conditions. The lease agreements do not impose any covenants.
The Groups lease contracts for buildings typically range from 3 –10 years non-cancellable lease term at inception, depending on the type of property. Forklifts leases within the Group usually have a non-cancel-lable lease term of 5 years, and cars 3 years, at inception. Extension and termination options are included in a number of the lease contracts. These terms are used to maximise operational flexibility in terms of managing contracts. The majority of extension and termination options held are exercisable only by the Group and not by the respective lessor. Extension and termination options are only included in the lease term if reasonably certain to be utilised. Extension/termination options for some of these assets might be used at a later date.
Leases are recognised as a right-of-use asset and a corresponding lease liability at the date at which the leased asset is available for use by the Group. Lease liabilities due within 12 months are classified as short-term liabilities, while those due after 12 months are classified as long-term liabilities. Each lease payment is allocated between amortisation of the lease liability and interest. The interest component is charged to the income statement over the lease period so as to produce a constant periodic rate of interest on the remaining balance of the lease liability for each period. The right-of-use asset is depreciated over the shorter period of the asset’s useful life and the lease term on a straight-line basis.
Assets and liabilities arising from a lease are initially measured on a present value basis. Lease liabilities include the net present value of the following lease payments:• Fixed payments, less lease incentives receivable• Variable lease payments based on an index or a rate• Amounts expected to be payable by the Group under residual value
guarantees• The exercise price of a purchase option if the Group is reasonably cer-
tain to exercise that option, and• Payment of penalties for terminating the lease, if the lease term
reflects the Group exercising that termination option.
The lease payments are discounted using the incremental borrowing rate as the interest rate implicit in the lease contracts cannot be readily determined. The incremental borrowing rate is calculated per country and for different durations.
Right-of-use assets are measured at cost comprising the following:• The amount of initial measurement of lease liability• Any lease payments made at or before the commencement date
less any lease incentives received • Any initial direct costs, and• Restoration cost.
Payments associated with short-term leases and leases of low-value are recognized on a straight line basis as an expense in the income state-ment. Shortterm leases are leases with a lease term of 12 months or less. Low-value assets are assets with a value of SEK 50t or less when in new condition. Service payments is included as part of the lease liability for “Forklifts and machinery” and “Cars and other vehicles”, and excluded for “Land and buildings”.
Dividend distributionDividend distribution to the Parent Company’s shareholders is recog-nized as a liability in the Group’s financial statements in the period in which the dividends are approved by the Parent Company’s share-holders.
Cash flowThe cash flow statement has been prepared according to the indirect method.

No
tes – G
rou
p
75 / Annual Report 2019 / Husqvarna Group
Note 2 Important accounting estimates and assessments
In order to prepare these financial statements, management needs to make estimates and assessments and therefore use certain assump-tions concerning the future. Management makes estimates and assess-ments based on past experience and assumptions that are believed to be reasonable and realistic under the circumstances. The use of such estimates and assessments has an impact on the income statement as well as the balance sheet and on the disclosures presented, such as con-tingent liabilities. Actual results could differ from these estimates under different assumptions or circumstances. Summarized below are those accounting principles that require subjective judgement from manage-ment in making assumptions or estimates regarding the effects of mat-ters that are inherently uncertain.
Impairment test of intangible assets with indefinite useful lifeIntangible assets that have an indefinite useful life (goodwill and the brand Gardena) are tested annually for impairment, or more often if there is an indication of impairment. When testing for impairment, the Group estimates the recoverable amount of the asset. An impairment loss is recognized by the amount by which the net book value of an asset exceeds its recoverable amount. The recoverable amount for a cash generating unit is determined on the basis of value in use estimated by using the discounted cash flow method based on expected future results. Key assumptions for forecasting are expected growth, margin and discount rates. For further information refer to note 14.
InventoryHusqvarna Group’s inventory is accounted for to the lowest of the acquisition value in accordance with the weighted average cost for-mula, and the net realizable value. The net realizable value is adjusted for the estimated write-down for older articles, physically damaged goods, excess inventory and sales costs. The Group’s large seasonality in stockpiling and sales together with weather-dependent products increase the difficulty to estimate the value of inventory. To minimize these difficulties, Husqvarna Group is constantly working with stream-lining the production chain, keeping the inventory levels on a reason-ably low level and focus on the inventory valuation to ensure that it is accurate in accordance with the circumstances on the closing date.
TaxHusqvarna Group estimates income tax for each of the taxing jurisdic-tions in which the Group operates as well as any deferred taxes based on temporary differences. Deferred tax assets, which primarily relate to tax loss carry forwards and temporary differences, are recognized if future taxable income is expected to allow for the recovery of those tax assets. Changes in assumptions in the projection of future taxable income as well as changes in tax rates may result in significant differ-ences in the valuation of deferred taxes. For further information regard-ing tax refer to note 10. Provisions for potential tax exposure are based on management’s best estimate.
Provisions for pensions and other post-employment benefitsThe present value of the Group’s net pension obligations depends on a number of factors that are determined on an actuarial basis using a number of assumptions. Assumptions used calculating the net pension liability comprise of for example; discount rate, inflation, mortality, future salary increases etc. Any changes in these assumptions will impact the carrying amount of the net pension liability. Sensitivity analysis of the effect from a change in the main assumptions and poten-tial risks affecting the liabilities are included in note 21.
Share-based compensationHusqvarna Group has share-based, equity settled, compensation pro-grams where the Group receives services from employees as consider-ation for equity instruments. The share-based compensation includes matching shares awards and performance based share awards. In order to receive those, the employee is required to stay employed three years
after the grant date and to maintain the original investment. The number of performance based share awards that vest further depend on the ful-filment of certain levels of increase of the Company´s value creation as determined by the Board of Directors. These levels are “Entry”, “Target” and “Stretch”. “Entry” constitutes a minimum level which must be exceeded in order for the performance based share awards to vest and give right to Class B-shares. At the end of each reporting period, the Group revises the estimates of the number of instruments that are expected to vest. The number of performance based shares that are expected to vest is based on management´s best estimate. For further information refer to note 4.
Warranty provisionProvision for warranty comprises all potential expenses for repairing or replacing products sold. Provisions are made when the products are sold and are normally limited to two years. The provision is estimated for each group of products and based on historical information and managements best estimate. For further information refer to note 22.
Provision for restructuringProvision for restructuring represents the expected payments to be incurred in the coming years as a consequence of Husqvarna Group’s decision to close some factories, rationalize production and reduce personnel. The amounts are based on the Group management’s best estimates and are adjusted when changes to these estimates are known. Provision for reduction of personnel is calculated on individ-ual basis except for most Blue Collar workers where negotiations are made collectively and are based on management’s best estimate of the amount expected to be paid out. For further information refer to note 22.
Claims reservesHusqvarna Group maintains third-party insurance coverage and is insured through wholly-owned insurance subsidiaries (captives) in regards to a variety of exposures and risks, such as property damage, business interruption and product liability claims. Claims reserves in the captives, mainly for product liability claims, are calculated on the basis of a combination of case reserves and reserves for claims incurred but not reported. Actuarial calculations are undertaken to assess the ade-quacy of the reserves based on historical loss development experience, benchmark reporting and payment patterns. These actuarial calcula-tions are based on several assumptions and changes in these assump-tions may result in significant differences in the valuation of the reserves. For further information refer to note 22.
Contingent liabilitiesThe Group is involved in various disputes arising from time to time in its ordinary course of business. Husqvarna Group estimates that none of the disputes in which the Group is presently involved in or that have been settled recently have had, or may have, a material effect on Group’s financial position or profitability. However, the outcome of complicated disputes is also difficult to foresee, and it cannot be ruled out that the disadvantageous outcome of a dispute may result in a sig-nificantly adverse impact on the Group’s results of operations and finan-cial position. For further information refer to note 24.

No
tes – G
rou
p
76 / Annual Report 2019 / Husqvarna Group
Note 3 Segment information
As of January 1, 2019, Husqvarna Group´s segment reporting comprise three divisions; Husqvarna, Gardena and Construction. The change is due to the restructuring of the former Consumer Brands Division that has been dissolved into the Husqvarna and Gardena divisions. The North American part of former Consumer Brands is included in the Husqvarna Division and the European part is included in the Gardena Division. A restatement of the segment reporting to the new structure is included in this report in section “ Allocation of the Consumer Brands Division”. The divisions form the basis for the Group’s internal reporting reviewed by the President and CEO (the Group’s chief operating deci-sion maker) in order to assess performance and make decisions on resource allocation.
The divisions are responsible for the operating income (excluding items affecting comparability) and the net assets used in their opera-tions which are also the financial measures used when the President and CEO makes his assessment of the performance of the segments. Net financial income/expense, tax, net debt and equity are undistributed items not reported per division.
The divisions consist of both separate legal units and of units divided between divisions. This means that one unit can be part of more than
one division and, if so, costs and net assets are allocated between the relevant divisions. Operating costs, not included in the divisions, are shown under Group common costs, which mainly include costs for the Group’s corporate functions. No sale of finished products is made between the divisions.
Segment reporting is based on the same accounting principles as for the Group. The divisions are responsible for the management of opera-tional assets and their performance is measured at this level, while Group Treasury is responsible for financing at Group and country level. Consequently, liquid funds, interest-bearing receivables and liabilities, equity and tax items are not allocated to the divisions. Group common includes services such as Holding, Treasury and Risk Management.
All divisions include production, development, logistics, marketing and sales. The Husqvarna and Gardena divisions sell forest, park and garden products to retailers and dealers. Forest, park and garden prod-ucts comprise six product categories; wheeled, robotics, handheld, watering, digital solutions and accessories. The Construction Division sells machines and diamond tools for the construction and stone indus-tries. Group common includes royalty income from licensing of intellec-tual property such as brands to customers.
2019
SEKm Husqvarna Gardena ConstructionGroup
common 1Un distributed
items 2 The GroupNet sales, finished goods 27,367 8,267 6,273 – – 41,907
Net sales, services, license agreements and other 139 76 67 88 – 370
Net sales (external) 27,506 8,343 6,340 88 – 42,277
Operating income 2,260 847 779 –196 – 3,690
Whereof items affecting comparability 3 167 – 57 1 – 225
Operating income adjusted for items affecting comparability 3 2,427 847 836 –195 – 3,915
Financial income – – – – 18 18
Financial expenses – – – – –586 –586
Income after financial items 2,260 847 779 –196 –568 3,122
Total assets 20,080 9,835 6,988 10 5,068 41,981
Liabilities 4,709 2,102 1,155 323 16,409 24,698
Total equity – – – – 17,283 17,283
Total equity and liabilities 4,709 2,102 1,155 323 33,692 41,981
Cash flow from operations 4 2,513 980 699 –192 – 4,000
Depreciation/amortization and impairment 3 1,316 417 340 8 – 2,081
Investments in property, plant and equipment –1,053 –368 –156 0 – –1,577
Investments in intangible assets –437 –103 –115 0 – –655
2,339 926 768 –184 – 3,849
Change in other operating assets and liabilities 5 – – – – 128 128
Acquired and divested assets/subsidiaries – – – – 349 349
Investments in financial assets – – – – –56 –56
Net financial items, received/paid – – – – –490 –490
Taxes paid – – – – –811 –811
Cash flow from operations and investments 2,339 926 768 –184 –880 2,9691 Group common include common Group services such as Holding, Treasury and Risk Management, and income from license agreements.2 Undistributed items consist of liquid funds and other interest-bearing assets, interest-bearing liabilities, equity and tax items.3 Husqvarna Group assess the performance of the segments based on operating income, excluding items affecting comparability. 2019 includes items affecting comparability refer-
ring to restructuring related expenses, amounting to SEK 225m. Impairment in the Group, excluding items affecting comparability, amount to SEK 16m whereof SEK –1m refer to the Husqvarna Division, SEK 15m to Gardena, SEK 2m to Construction and SEK 0m to Group common.
4 Cash flow from operations per division is calculated excluding depreciation/amortization and impairment, capital gains and losses, other non-cash items, paid restructuring expenses, net financial items, taxes paid and change in other operating assets/liabilities.
5 Change in other operating assets/liabilities also include other non cash items, paid restructuring costs, and capital gains and losses.

No
tes – G
rou
p
77 / Annual Report 2019 / Husqvarna Group
Geographic informationThe table below shows sales per geographical market, regardless of where the goods are produced. Assets are reported where the asset is located.
External sales Non-current assets 1
SEKm 2019 2018 2019 2018Germany 5,915 5,563 7,015 6,510
France 2,467 2,254 60 8
Sweden 1,755 1,670 6,320 5,725
Austria 1,313 1,224 38 10
Rest of Europe 10,365 10,355 1,602 1,248
Asia/Pacific 3,604 3,207 1,396 1,038
Canada 1,249 1,373 173 137
US 13,875 13,886 4,685 4,115
Latin America 1,368 1,263 44 32
Rest of the World 366 290 13 0
Total 42,277 41,085 21,346 18,8231 Non-current assets include property, plant and equipment, goodwill, other intangible
assets and as of 2019 right of use assets.
Net sales per product category
SEKm 2019 2018Forest, park and garden products 35,849 35,274
Construction products 6,340 5,762
Other 88 49
Total 42,277 41,085
Information on major customersHusqvarna Group has no individual customer, which accounts for 10% or more of the Group’s total net sales.
2018
SEKm Husqvarna 1 Gardena 1 ConstructionGroup
common 2Un distributed
items 3 The GroupNet sales, finished goods 27,032 8,086 5,679 – – 40,797
Net sales, services, license agreements and other 124 32 83 49 – 288
Net sales (external) 27,156 8,118 5,762 49 – 41,085
Operating income 1,228 425 672 –255 – 2,070
Whereof items affecting comparability 4 878 226 44 23 – 1,171
Operating income adjusted for items affecting comparability 4 2,106 651 716 –232 – 3,241
Financial income – – – – 72 72
Financial expenses – – – – –581 –581
Income after financial items 1,228 425 672 –255 –509 1,561
Total assets 18,701 9,398 6,451 14 4,043 38,607
Liabilities 5,320 1,762 1,085 381 14,050 22,598
Total equity – – – – 16,009 16,009
Total equity and liabilities 5,320 1,762 1,085 381 30,059 38,607
Cash flow from operations 5 1,289 630 417 –234 – 2,102
Depreciation/amortization and impairment 4 913 297 248 11 – 1,469
Investments in property, plant and equipment –1,071 –309 –160 –2 – –1,542
Investments in intangible assets –466 –134 –84 –9 – –693
665 484 421 –234 – 1,336
Change in other operating assets and liabilities 6 – – – – –166 –166
Acquired and divested assets/subsidiaries – – – – –237 –237
Investments in financial assets – – – – 0 0
Net financial items, received/paid – – – – –448 –448
Taxes paid – – – – –970 –970
Cash flow from operations and investments 665 484 421 –234 –1,821 –4851 Restated figures due to alloctaion of the Consumer Brands Division.2 Group common include common group services such as Holding, Treasury and Risk Management, and income from license agreements.3 Undistributed items consist of liquid funds and other interest-bearing assets, interest-bearing liabilities, equity and tax items.4 Husqvarna Group assess the performance of the segments based on operating income, excluding items affecting comparability. 2018 includes items affecting comparability refer-
ring to restructuring related expenses, amounting to SEK 1,171m. Impairment in the Group, excluding items affecting comparability, amount to SEK 14m whereof SEK 11m refer to the Husqvarna Division, SEK 1m to Gardena, SEK 2m to Construction and SEK 0m to Group common.
5 Cash flow from operations per division is calculated excluding depreciation/amortization and impairment, capital gains and losses, other non-cash items, paid restructuring expenses, net financial items, taxes paid and change in other operating assets/liabilities.
6 Change in other operating assets/liabilities also include other non cash items, paid restructuring costs, and capital gains and losses.
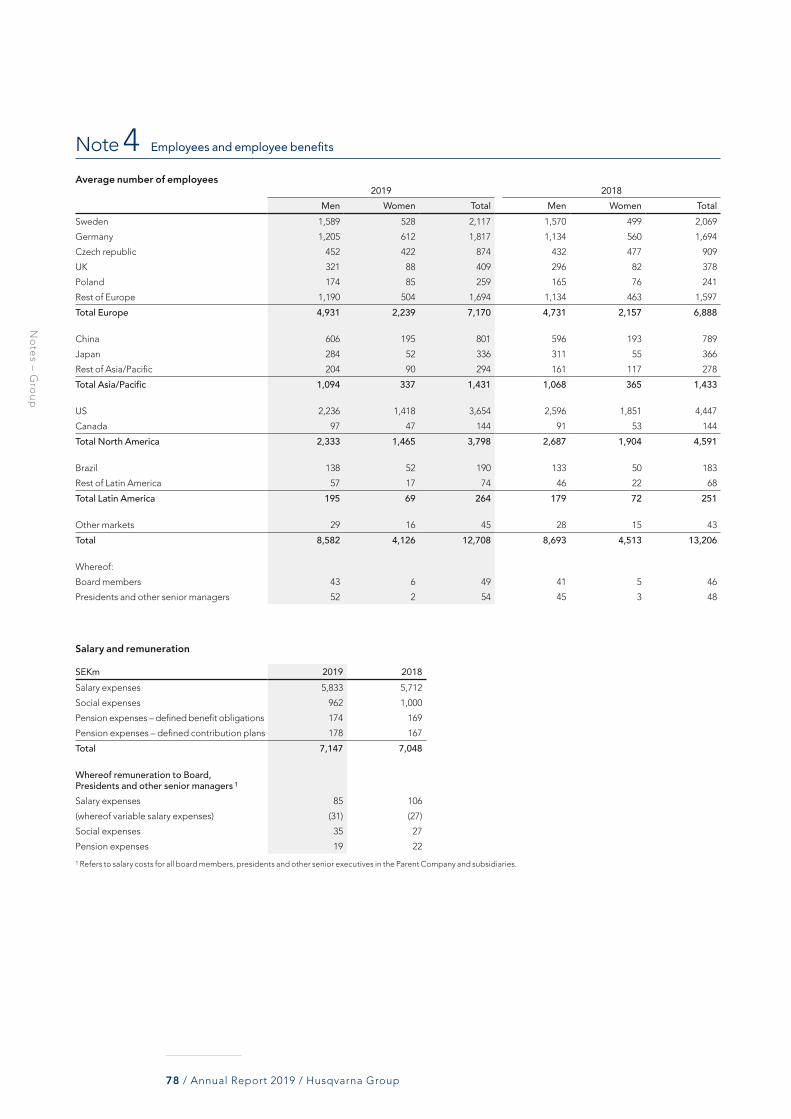
No
tes – G
rou
p
78 / Annual Report 2019 / Husqvarna Group
Note 4 Employees and employee benefits
Average number of employees2019 2018
Men Women Total Men Women TotalSweden 1,589 528 2,117 1,570 499 2,069
Germany 1,205 612 1,817 1,134 560 1,694
Czech republic 452 422 874 432 477 909
UK 321 88 409 296 82 378
Poland 174 85 259 165 76 241
Rest of Europe 1,190 504 1,694 1,134 463 1,597
Total Europe 4,931 2,239 7,170 4,731 2,157 6,888
China 606 195 801 596 193 789
Japan 284 52 336 311 55 366
Rest of Asia/Pacific 204 90 294 161 117 278
Total Asia/Pacific 1,094 337 1,431 1,068 365 1,433
US 2,236 1,418 3,654 2,596 1,851 4,447
Canada 97 47 144 91 53 144
Total North America 2,333 1,465 3,798 2,687 1,904 4,591
Brazil 138 52 190 133 50 183
Rest of Latin America 57 17 74 46 22 68
Total Latin America 195 69 264 179 72 251
Other markets 29 16 45 28 15 43
Total 8,582 4,126 12,708 8,693 4,513 13,206
Whereof:
Board members 43 6 49 41 5 46
Presidents and other senior managers 52 2 54 45 3 48
Salary and remuneration
SEKm 2019 2018Salary expenses 5,833 5,712
Social expenses 962 1,000
Pension expenses – defined benefit obligations 174 169
Pension expenses – defined contribution plans 178 167
Total 7,147 7,048
Whereof remuneration to Board, Presidents and other senior managers 1
Salary expenses 85 106
(whereof variable salary expenses) (31) (27)
Social expenses 35 27
Pension expenses 19 22
1 Refers to salary costs for all board members, presidents and other senior executives in the Parent Company and subsidiaries.
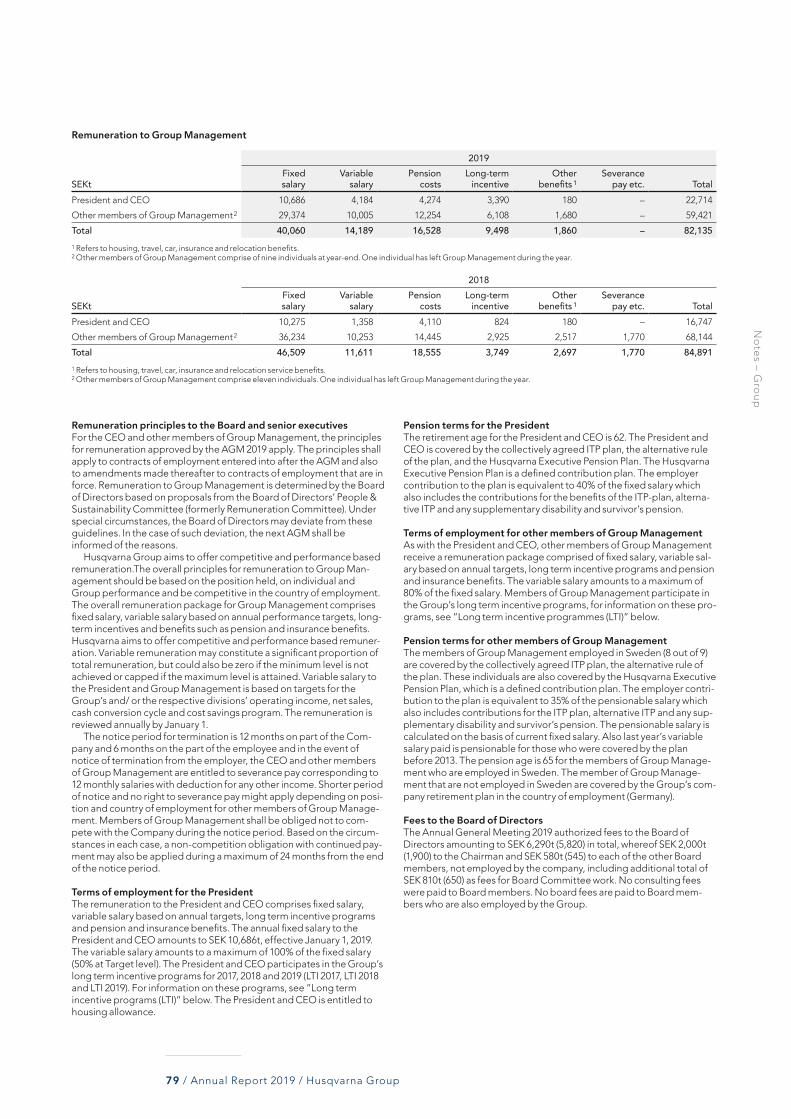
No
tes – G
rou
p
79 / Annual Report 2019 / Husqvarna Group
Remuneration to Group Management
2019
SEKtFixed salary
Variable salary
Pension costs
Long-term incentive
Other benefits 1
Severance pay etc. Total
President and CEO 10,686 4,184 4,274 3,390 180 – 22,714
Other members of Group Management 2 29,374 10,005 12,254 6,108 1,680 – 59,421
Total 40,060 14,189 16,528 9,498 1,860 – 82,1351 Refers to housing, travel, car, insurance and relocation benefits.2 Other members of Group Management comprise of nine individuals at year-end. One individual has left Group Management during the year.
2018
SEKtFixed salary
Variable salary
Pension costs
Long-term incentive
Other benefits 1
Severance pay etc. Total
President and CEO 10,275 1,358 4,110 824 180 – 16,747
Other members of Group Management 2 36,234 10,253 14,445 2,925 2,517 1,770 68,144
Total 46,509 11,611 18,555 3,749 2,697 1,770 84,8911 Refers to housing, travel, car, insurance and relocation service benefits.2 Other members of Group Management comprise eleven individuals. One individual has left Group Management during the year.
Remuneration principles to the Board and senior executivesFor the CEO and other members of Group Management, the principles for remuneration approved by the AGM 2019 apply. The principles shall apply to contracts of employment entered into after the AGM and also to amendments made thereafter to contracts of employment that are in force. Remuneration to Group Management is determined by the Board of Directors based on proposals from the Board of Directors’ People & Sustainability Committee (formerly Remuneration Committee). Under special circumstances, the Board of Directors may deviate from these guidelines. In the case of such deviation, the next AGM shall be informed of the reasons.
Husqvarna Group aims to offer competitive and performance based remuneration.The overall principles for remuneration to Group Man-agement should be based on the position held, on individual and Group performance and be competitive in the country of employment. The overall remuneration package for Group Management comprises fixed salary, variable salary based on annual performance targets, long-term incentives and benefits such as pension and insurance benefits. Husqvarna aims to offer competitive and performance based remuner-ation. Variable remuneration may constitute a significant proportion of total remuneration, but could also be zero if the minimum level is not achieved or capped if the maximum level is attained. Variable salary to the President and Group Management is based on targets for the Group’s and/ or the respective divisions’ operating income, net sales, cash conversion cycle and cost savings program. The remuneration is reviewed annually by January 1.
The notice period for termination is 12 months on part of the Com-pany and 6 months on the part of the employee and in the event of notice of termination from the employer, the CEO and other members of Group Management are entitled to severance pay corresponding to 12 monthly salaries with deduction for any other income. Shorter period of notice and no right to severance pay might apply depending on posi-tion and country of employment for other members of Group Manage-ment. Members of Group Management shall be obliged not to com-pete with the Company during the notice period. Based on the circum-stances in each case, a non-competition obligation with continued pay-ment may also be applied during a maximum of 24 months from the end of the notice period.
Terms of employment for the President The remuneration to the President and CEO comprises fixed salary, variable salary based on annual targets, long term incentive programs and pension and insurance benefits. The annual fixed salary to the President and CEO amounts to SEK 10,686t, effective January 1, 2019. The variable salary amounts to a maximum of 100% of the fixed salary (50% at Target level). The President and CEO participates in the Group’s long term incentive programs for 2017, 2018 and 2019 (LTI 2017, LTI 2018 and LTI 2019). For information on these programs, see ”Long term incentive programs (LTI)” below. The President and CEO is entitled to housing allowance.
Pension terms for the PresidentThe retirement age for the President and CEO is 62. The President and CEO is covered by the collectively agreed ITP plan, the alternative rule of the plan, and the Husqvarna Executive Pension Plan. The Husqvarna Executive Pension Plan is a defined contribution plan. The employer contribution to the plan is equivalent to 40% of the fixed salary which also includes the contributions for the benefits of the ITP-plan, alterna-tive ITP and any supplementary disability and survivor’s pension.
Terms of employment for other members of Group Management As with the President and CEO, other members of Group Management receive a remuneration package comprised of fixed salary, variable sal-ary based on annual targets, long term incentive programs and pension and insurance benefits. The variable salary amounts to a maximum of 80% of the fixed salary. Members of Group Management participate in the Group’s long term incentive programs, for information on these pro-grams, see ”Long term incentive programmes (LTI)” below.
Pension terms for other members of Group ManagementThe members of Group Management employed in Sweden (8 out of 9) are covered by the collectively agreed ITP plan, the alternative rule of the plan. These individuals are also covered by the Husqvarna Executive Pension Plan, which is a defined contribution plan. The employer contri-bution to the plan is equivalent to 35% of the pensionable salary which also includes contributions for the ITP plan, alternative ITP and any sup-plementary disability and survivor’s pension. The pensionable salary is calculated on the basis of current fixed salary. Also last year’s variable salary paid is pensionable for those who were covered by the plan before 2013. The pension age is 65 for the members of Group Manage-ment who are employed in Sweden. The member of Group Manage-ment that are not employed in Sweden are covered by the Group’s com-pany retirement plan in the country of employment (Germany).
Fees to the Board of Directors The Annual General Meeting 2019 authorized fees to the Board of Directors amounting to SEK 6,290t (5,820) in total, whereof SEK 2,000t (1,900) to the Chairman and SEK 580t (545) to each of the other Board members, not employed by the company, including additional total of SEK 810t (650) as fees for Board Committee work. No consulting fees were paid to Board members. No board fees are paid to Board mem-bers who are also employed by the Group.

No
tes – G
rou
p
80 / Annual Report 2019 / Husqvarna Group
Fees to the Board of Directors
2019 2018
SEKt Fee
Fee for Board com-mitte work Total fee Total fee
Tom Johnstone 2,000 80 2,080 2,020
Ulla Litzén 580 240 820 745
Katarina Martinson 580 135 715 650
Bertrand Neuschwander 580 80 660 605
Daniel Nodhäll 580 135 715 650
Lars Pettersson 580 140 720 605
Christine Robins 580 – 580 545
Kai Wärn – – – –
Soili Johansson – – – –
Carita Svärd – – – –
Anders Köhler 1 – – – –
Dan Byström 1 – – – –
Total 5,480 810 6,290 5,820
1 Deputy
Board members are expected to engage themselves financially by acquiring Husqvarna shares, corresponding to approximately one year’s board fee, within a period of five years. There are no agreements in place governing severance pay to Board member not employed by the Company.
Long term incentive programmes (LTI)The purpose of the long term incentive programmes is to influence and reward performance long term, align shareholders’ and managements’ interest, attract and retain key employees and to some extent provide variable remuneration instead of fixed salary. The Board of Directors will annually evaluate if a long-term incentive program (e.g. share-based or share-price based) should be proposed to the AGM. There are three on-going programes that are under vest; LTI 2017, LTI 2018 and LTI 2019.
LTI 2017, LTI 2018 and LTI 2019The Annual General Meetings 2017, 2018 and 2019 authorized the implementation of the incentive programmes LTI 2017, LTI 2018 and LTI 2019, which comprise a maximum of 80 (LTI 2017)/ 100 (LTI 2018 and LTI 2019) participants. The vesting period for the programs is three years and the programs comprise of performance share awards. LTI 2017 also includes matching share awards. For LTI 2017, members of Group Man-agement had to buy shares corresponing to 10% of his/her annual fixed salary (15% applies for the CEO), in order to participate in LTI 2017 while the purchase of shares (equivalent to 5–10% of its fixed annual salary) was voluntary for non-Group Management members. For each share which the employee participates with within the framework of the LTI 2017 program, the Company will grant one matching share award.
The grant of performance based share awards is linked to the partici-pant’s annual target salary (fixed salary plus variable salary at target level). In order to receive matching shares and performance based shares, the employee must stay employed three years after grant date and maintain the original investment.
The number of performance based share awards that vest and give right to Husqvarna Class B-shares further depend on the fulfilment of certain targets, determined by the Board of Directors, for operating margin (weight 40%), net sales (weight 30%) and capital efficiency (weight 30%) during the calendar years 2017–2019 regarding LTI 2017, 2018–2020for LTI 2018 and 2019–2021 for LTI 2019.There are three per-formance levels set, with a linear progression of the number of perfor-mance based share awards from Entry to Stretch/maximum level for each program. Final result shall be the average of the three calendar years for each performance measure. The Entry level must have been reached in order for the performance based share awards to vest. The performance levels corresponds to the following number of B-shares:
Performance level LTI 2017 LTI 2018 and LTI 2019Entry 0 shares 10% of target salary / share price 1
Target25% (CEO 30%) of target salary/ share price 1
33% (CEO 40%) of target salary/ share price 1
Stretch50% (CEO 60%) of target salary/ share price 1
66% (CEO 80%) of target salary/ share price 1
1 SEK 74.93 for LTI 2017, SEK 86.00 for LTI 2018 and SEK 74.56 for LTI 2019 corresponds to the average closing price for Husqvarna B-shares on Nasdaq Stockholm during the month of February 2017 (LTI 2017), 2018 (LTI 2018) and 2019 (LTI 2019).
The value of the programmes is calculated based on the fair value of the share on grant date, as was SEK 82.90 for LTI 2017, SEK 76.70 for LTI 2018 and SEK 80.70 for LTI 2019, adjusted for expected dividend.
Each program comprises a maximum of the following number of shares 1,449,104 in LTI 2018 and 2,025,550 in LTI 2019.
LTI 2017 resultThe performance period for LTI 2017 ended December 31, 2019. The fol-lowing table shows the targets determind by the Board of Directors and the actual result, the average of the three calendar years 2017–2019 for each performance measure.
Target levelPerformance measure Weight Entry Target Stretch ResultOperating margin 40% 10.0% 10.4% 10.6% 8.9%
Net sales 30% 2.50% 3.75% 5.00% 5.05%
Capital efficiency 30% 25.5% 25.0% 24.6% 26.2%
Total result in percent of number of shares at maximum level Stretch 30.0%
The following table shows the number of matching and performance based shares to be awarded to participants by 25 May 2020, based on the result reported above and provided that the participant is still employed at that time and has maintained the personal investment in shares.
Share awards LTI 2017
ParticipantsMatching
shares 1Performance
shares TotalPresident and CEO 16,889 35,432 52,321
Other members of Group Management 26,363 63,986 90,349
Other participants 56,667 182,984 239,651
Total 99,919 282,402 382,3211 Those participants in LTI 2017 who were located outside of Sweden at the time of grant of the share awards and whose salary was paid in a currency other than the Swedish krona will be covered by a certain “currency adjustment” to their personal investment in shares. This means that if the value of the Swedish krona (relative to such other cur-rency) increases or decreases by more than 10% during the 3 year vesting period (i.e., the exchange rate at the date of grant of share awards compared with the exchange rate on the date the program is fully vested in May 2020), then the number of matching shares to which such participant is entitled will be decreased or increased, respectively, to account for such relative change. This currency adjustment provision is expected to have a marginal effect on the total cost of the LTI 2017.
Outstanding share awardsThe table below outlines the number of granted share awards, for-feited, exercised and outstanding share awards:
2019 2018Share awards LTI 2019 LTI 2018 LTI 2017 LTI 2018 LTI 2017 LTI 2016At Jan 1 – 1,559,525 1,165,904 – 1,426,028 1,839,311
Granted 2,099,569 – – 1,775,483 – –
Forfeited –74,019 –110,421 –124,633 –215,958 –260,124 –1,292,628
Exercised – – – – – –
At Dec 31 2,025,550 1,449,104 1,041,271 1,559,525 1,165,904 546,683
The LTI programmes are expensed during the three years vesting period in line with the expected target fulfilment. During 2019, SEK 32m (5) has been charged to the income statement, whereof SEK 10m (3) refers to cost for employer social contributions. The total provision for employer social contributions in the balance sheet amounted to SEK 11m (12).

No
tes – G
rou
p
81 / Annual Report 2019 / Husqvarna Group
Note 5 Expenses by nature
SEKm 2019 2018Costs for supplies and raw materials 19,419 19,194
Employee benefit expenses 7,147 7,048
Amortization/depreciation and impairment 2,089 1,930
Other 9,933 10,898
Total 38,588 39,070
Of the above costs, SEK 1,720m (1,581) refers to research and develop-ment.
Amortization/depreciation and impairment for the year are reported on the following lines in the income statement:
Property, plant and equipment
Intangible assets
Right of use assets
SEKm 2019 2018 2019 2018 2019 2018Cost of goods sold 915 1,284 548 449 96 –
Selling expenses 63 63 – – 298 –
Administrative expenses 42 43 74 91 53 –
Total 1,020 1,390 622 540 447 –
Impairment for property, plant and equipment was recorded within cost of goods sold by SEK 10m (442) and within administrative expenses by SEK 2m (2).
Impairment for intangible assets is recognized within cost of goods sold by SEK 27m (31).
Note 6 Exchange rate gains and losses in cost of goods sold
SEKm 2019 2018Exchange rate gains and losses in cost of goods sold –17 –245
Total –17 –245
Cost of goods sold includes SEK 11m (83) of foreign exchange hedging result previously reported in other comprehensive income.
Information related to the accounting of cash flow hedges is pre-sented in note 1.
Note 7 Other operating income and operating expenses
SEKm 2019 2018Other operating incomeGain on divestment/liquidation of:
Property, plant and equipment 203 25
Operations/subsidiaries – 38
Total 203 63
Other operating expensesLoss on divestment/liquidation of:
Property, plant and equipment –6 –8
Total –6 –8
Note 8 Fees to auditors
SEKm 2019 2018EYAudit fees for the annual audit engagement 22 22
Audit fees not included in the annual audit engagement 2 2
Tax advice 1 2
Other services 1 0
Total fees to EY 26 26
Audit fees to other auditors 1 1
Total fees to auditors 27 27

No
tes – G
rou
p
82 / Annual Report 2019 / Husqvarna Group
Note 9 Financial income and expenses
SEKm 2019 2018Financial incomeInterest income on deposits measured at amortized cost 17 20
Exchange rate differences
– on borrowings – –286
– on derivatives held for trading – 330
Other financial income 1 8
Total financial income 18 72
Financial expensesInterest expenses
– on borrowings –119 –164
– on cashflow hedges, interest rate derivatives –24 –33
– on derivatives held for trading –269 –270
– on lease liabilities 1 –49 –
– net on pension assets/liabilities –38 –31
Exchange rate differences
– on borrowings –162 –
– on derivatives held for trading 132 –
Other financial expenses –57 –83
Total financial expenses –586 –581Financial income and expenses, net –568 –5091 Due to the adoption of “IFRS 16 Leases“ 1 January 2019, interest expense on lease liabil-
ities is recorded under financial expenses.
Note 10 Tax
SEKm 2019 2018Current tax on income for the period –463 –635
Deferred tax –131 287
Total –594 –348
Theoretical and actual tax rates
2019 2018Tax, % Result Tax, % Result
Income before taxes – 3,122 – 1,561
Theoretical tax rate –21.8 –681 –21.1 –329
Non-taxable items 2.5 77 5.3 83
Items not deductible for tax purposes –1.6 –50 –3.6 –57
Change in valuation of deferred tax 3.0 95 –1.1 –17
Utilization of previously unrecognized tax losses 0.1 4 0.3 5
Effect of tax rate change –0.1 –4 –0.1 –2
Withholding tax –0.5 –17 –1.6 –25
Other –0.6 –18 –0.4 –6
Actual tax rate –19.0 –594 –22.3 –348
The theoretical tax rate for the Group is calculated on the basis of the weighted total income before tax per country, multiplied by the local statutory tax rate.
Tax loss carry-forwardsAs of December 31, 2019, the Group has tax loss carry-forwards of SEK 1,004m (1,483), whereof SEK 146m (185) has not been included in computation of deferred tax assets. The tax loss carry-forwards will expire as follows (gross amounts):
SEKm 2019 2018Within a year 0 0
1–5 year 64 82
> 5 year 287 535
Without time limit 653 866
Total 1,004 1,483
Changes in deferred taxes
SEKm
Opening balance,
Jan 1, 2019Reclassi-fication
Recognized in income statement
Recognized in comprehen-sive income
statement
Exchange rate
differences
Acquired and divested assets /
subsidiaries
Closing balance,
Dec 31, 2019Non-current assets –1,410 – –245 – –25 – –1,680
Inventories 252 – –60 – 6 – 198
Current receivables 63 – –4 – 0 – 59
Provision for pensions and similar commitments 358 – 95 86 4 – 543
Other provisions 223 – –51 – 8 – 180
Financial and operating liabilities 50 – 1 166 10 – 227
Other items 1 153 –110 77 – –25 – 95
Tax losses carried forward 269 – 57 – 10 – 336
Deferred tax assets and liabilities, net –42 –110 –130 252 –12 – –421 The opening balance includes SEK –167m related to IFRIC 23 restatement, for further information refer to note 28.

No
tes – G
rou
p
83 / Annual Report 2019 / Husqvarna Group
SEKm
Opening balance,
Jan 1, 2018
Recognized in income
statement
Recognized in comprehensive
income statement
Exchange rate differences
Acquired and divested assets /
subsidiariesClosing balance,
Dec 31, 2018Non-current assets –1,518 170 – –62 – –1,410
Inventories 164 90 – –2 – 252
Current receivables 96 –31 – –2 – 63
Provision for pensions and similar commit-ments 355 –34 26 11 – 358
Other provisions 128 90 – 5 – 223
Financial and operating liabilities 104 –252 192 6 – 50
Other items –291 272 – 5 – –14
Tax losses carried forward 268 –18 – 19 – 269
Deferred tax assets and liabilities, net –694 287 218 –20 – –209
Tax items recognized in Other comprehensive income amounts to SEK 86m (26) for items related to remeasurements on defined benefit pension plans, SEK 23m (-41) for cash flow hedges and SEK 143m (233) for net investment hedge.
Deferred tax assets and liabilities
Assets Liabilities NetSEKm 2019 2018 2019 2018 2019 2018Non-current assets 117 220 1,797 1,630 –1,680 –1,410
Inventories 326 395 128 143 198 252
Current receivables 83 76 24 17 59 59
Provisions for pensions and similar commitments 543 358 0 0 543 358
Other provisions 236 280 56 57 180 223
Financial and operating liabilities 227 107 0 57 227 50
Other items 176 161 81 171 95 –10
Tax losses carried forward 336 269 – – 336 269
Deferred tax assets and liabilities 2,044 1,866 2,086 2,075 –42 –209
Set-off of tax –354 –281 –354 –281 – –
Deferred tax assets and liabilities, net 1 1,690 1,585 1,732 1,794 –42 –2091 Deferred tax assets amounted to SEK 1,690m (1,585), whereof SEK 187m (298) is expected to be utilized within 12 months. Deferred tax liabilities amounted to SEK 1,732m (1,795),
whereof SEK 31m (20) are due within 12 months.
No deferred tax liability is recognised on temporary differences relating to the distributable earnings of subsidiaries as the parent company is able to control the timing of the reversal of these temporary differences and it is probable that they will not reverse in the foreseeable future.
Note 11 Earnings per share
BasicBasic earnings per share is calculated by dividing the profit attributable to equity holders of the Parent Company by the weighted average num-ber of ordinary shares in issue during the year excluding ordinary shares purchased by the Company and held in a third party swap agreement.
2019 2018Profit attributable to equity holders of the Parent Company (SEKm) 2,527 1,212
Weighted average numbers of ordinary shares outstanding (millions) 572.0 571.5
Earnings per share before dilution (SEK) 4.42 2.12
DilutedDiluted earnings per share is calculated by adjusting the weighted aver-age numbers of ordinary shares outstanding to assume conversion of all dilutive potential ordinary shares. The Group’s long term incentive plan contains share savings program which have a dilutive potential.
2019 2018Profit attributable to equity holders of the Parent Company (SEKm) 2,527 1,212
Weighted average numbers of ordinary shares outstanding (millions) 572.0 571.5
Adjusted for:
– share savings program (millions) 0.2 0.8
Diluted weighted average numbers of ordinary shares outstanding (millions) 572.2 572.3
Earnings per share after dilution (SEK) 4.42 2.12

No
tes – G
rou
p
84 / Annual Report 2019 / Husqvarna Group
Note 12 Property, plant and equipment
SEKmLand and land improvements
Buildings and leasehold
improvements
Machinery and technical
installationsOther
equipment
Construction in progress
and advances Total2019Opening accumulated acquisition value 403 3,589 12,591 2,227 1,387 20,197
Acquired companies – – – – – –
Investments 12 54 514 223 774 1,577
Sold, scrapped –11 –426 –1,288 –706 –9 –2,440
Reclassification 20 196 860 –158 –918 –
Exchange rate differences 13 135 412 74 35 669
Closing accumulated acquisition value 437 3,548 13,089 1,660 1,269 20,003
Opening accumulated depreciation and impairment 119 2,154 9,963 1,868 29 14,133
Depreciation 1 13 130 722 144 – 1,009
Impairment 1 – – 12 – – 12
Sold, scrapped –4 –406 –1,286 –708 – –2,404
Reclassification – 20 68 –59 –29 –
Exchange rate differences 4 87 299 67 2 459
Closing accumulated depreciation and impairment 132 1,985 9,778 1,312 2 13,209Closing balance, December 31, 2019 305 1,563 3,311 348 1,267 6,794
2018Opening accumulated acquisition value 389 3,765 11,460 2,003 1,026 18,643
Acquired companies – 20 8 8 2 38
Investments – 57 279 122 1,084 1,542
Sold, scrapped –7 –68 –436 –68 –8 –587
Reclassification – 39 650 53 –746 –4
Exchange rate differences 21 203 630 109 29 992
Closing accumulated acquisition value 403 4,016 12,591 2,227 1,387 20,624Reclassified to right-of-use assets 2 – –427 – – – –427
Closing accumulated acquisition value after reclassification 403 3,589 12,591 2,227 1,387 20,197
Opening accumulated depreciation and impairment 106 2,126 8,932 1,673 – 12,837
Depreciation 1 12 136 647 151 – 946
Impairment 1 0 116 289 11 28 444
Sold, scrapped –4 –39 –418 –66 – –527
Reclassification – – –1 1 – –
Exchange rate differences 5 122 514 98 1 740
Closing accumulated depreciation and impairment 119 2,461 9,963 1,868 29 14,440
Reclassified to right-of-use assets 2 – –307 – – – –307
Closing accumulated depreciation after reclassification 119 2,154 9,963 1,868 29 14,133Closing balance, December 31, 2018 284 1,555 2,628 359 1,358 6,184
Reclassified to right-of-use assets, net 2 – –120 – – – –120
Closing balance after reclassification 284 1,435 2,628 359 1,358 6,0641 For information of where in the income statement the depreciation and impairment is reported, see note 5.2 Previous finance leases which were included in tangible fixed assets 2018 are in 2019 reported as comparative information for right of use assets. For further information on the
transition to IFRS 16 refer to note 28.

No
tes – G
rou
p
85 / Annual Report 2019 / Husqvarna Group
Note 13 Right of use assets
SEKmLand and buildings
Forklifts and machinery
Cars and other vehicles Other Total
2019Opening accumulated acquisition value 1 1,330 90 177 25 1,622
New leases 157 17 107 – 281
Modifications Remeasurements 69 – 1 1 72
Depreciation –296 –40 –108 –3 –447
Impairment – – – – –
Reclassification – – – – –
Exchange rate difference 46 4 6 2 58
Closing balance, December 31, 2019 1,306 71 183 25 1,5851 In the previous year, the group only recognised lease assets and lease liabilities in relation to leases that were classified as “finance leases” under IAS 17 Leases. The assets were
presented in property, plant and equipment and the liabilities as part of the Group’s borrowings. For adjustments recognised on adoption of IFRS 16 on 1 January 2019, please refer to note 28.
The total cash outflow for leases in 2019 was SEK 447m. As per December 31 2019, the Group had extension options amounting to approximately SEK 45m.
During the year the Group have had a net gain arising from a sale and leaseback transaction of SEK 195m. The total cash flow effect from the transaction is SEK 282m and the leaseback agreement extends over the coming 3.75 years.

No
tes – G
rou
p
86 / Annual Report 2019 / Husqvarna Group
Note 14 Intangible assets
SEKm Goodwill BrandsProduct
development Other Total2019Opening accumulated acquisition value 8,002 3,798 3,569 2,461 17,830
Acquired companies – – – – –
Investments 1 30 – 521 134 685
Sold, scrapped –5 – –88 –12 –104
Reclassifications – – – 6 6
Exchange rate differences 242 72 40 25 380
Closing accumulated acquisition value 8,269 3,870 4,042 2,615 18,796
Opening accumulated amortization and impairment 897 376 2,521 1,397 5,191
Amortization – 17 336 241 594
Impairment – – 27 – 27
Sold, scrapped –5 – –88 –9 –102
Exchange rate differences 39 13 52 15 120
Closing accumulated amortizations and impairment 932 406 2,848 1,644 5,830Closing balance, December 31, 2019 7,338 3,464 1,194 971 12,967
2018Opening accumulated acquisition value 7,457 3,647 2,926 2,185 16,215
Acquired companies 115 – 84 31 230
Investments – – 493 200 693
Sold, scrapped – – –8 –2 –10
Reclassification 0 0 0 5 5
Exchange rate differences 430 151 74 42 697
Closing accumulated acquisition value 8,002 3,798 3,569 2,461 17,830
Opening accumulated amortizations and impairment 822 345 2,162 1,129 4,458
Depreciation – 24 265 220 509
Impairment – – 31 – 31
Sold, scrapped – – –8 –2 –10
Exchange rate differences 75 7 71 50 203
Closing accumulated depreciation and impairment 897 376 2,521 1,397 5,191Closing balance, December 31, 2018 7,105 3,422 1,048 1,064 12,6391 Investments in Goodwill are included in the line “Acquisitions and divestments of subsidiaries/operations and divestments of property, plant and equipment”
in the consolidated cash flow statement.
For information of where in the income statement the depreciation and impairment is reported, see note 5.
The values of intangible assets with indefinite life are tested for impair-ment annually, or more frequently if impairment indicators are identified. An impairment loss is recognized with the amount by which the assets’ net carrying amount exceeds its recoverable amount. The recoverable amount of a cash generating unit is determined based on estimates of value in use. Value in use is measured as expected future discounted cash flow before tax.
Future discounted cash flows before tax are based on by Group Man-agement, approved five-year forecasts for each cash generating unit. Key assumptions for forecasting are the expected growth, margins and dis-count rates. Cash flows beyond the five year forecast have been extrapo-lated using an estimated growth rate of 2% (2) for all cash generating units.
Forecasted margin is partly based on previous results and partly on the expected market development. The pre-tax discount rate is based on the risk-free interest, market premium, beta value, capital structure and tax rate. External sources have been used as much as possible when determining these parameters, but the discount rate is still largely dependent on management’s own assumptions. A common discount rate is used for all cash generating units since Group Treasury is centrally responsible for the handling of financing and capital structure. A pre-tax discount rate of 11% (11) has been used for 2019.
The impairment test have been performed on the three divisions that will continue post January 1, 2020 because the Consumer Brands Division have been disolved as of January 1, 2019 and because the impairment test is based on future discounted cash flows. For allocation of the Con-sumer Brands Division, refer to the section ”Allocation of the Consumer Brands Division”.
During 2019, value in use has exceeded the net book value for all cash- generating units, and accordingly, no impairment has been recognized.
Intangible assets with indefinite useful lives per cash generating unit (division):
SEKm 2019 2018Husqvarna 3,674 3,560
Gardena 1 4,789 4,695
Construction 2,214 2,154
Total Group 10,677 10,4091 Whereof SEK 3,369m (3,304) relates to the net book value of the Gardena brand, which
Husqvarna Group has assigned indefinite useful life. This is because the brand has a strong position among consumers and Husqvarna Group intends to maintain and fur-ther develop the brand.
The following two sensitivity analysis have been made of the estimated value in use:• 10% higher discount rate • 10% decreased cash flow
None of these adjusted assumptions would result in an impairment loss of intangible assets with indefinite useful lives, in any of the cash gener-ating units.
Under the current business environment, management do not believe that any reasonably possible change in discount rate or in any of the other key assumptions on which the cash generating units’ recover-

No
tes – G
rou
p
87 / Annual Report 2019 / Husqvarna Group
able amounts are based upon would result in the net book value amount exceeding the recoverable amount.
During 2019, impairment of approximately SEK 27m was done regarding Product and Development within the dissolved Consumer Brand division as well as a Battery-project within Husqvarna and Gardena division.
Note 15 Investments in associated companies
SEKm 2019 2018Aggregate carrying amount of individually immaterial associates 33 –
Aggregate carrying amounts of the Group's share of: – –
Profit from continuing operations – –
Post-tax profit or loss from discontinued operations – –
Other comprehensive income – –
Total comprehensive income 33 –
Note 16 Other non-current assets
SEKm 2019 2018Long-term holdings in securities 395 381
Net pension assets 195 158
Other long-term receivables 79 53
Total 669 592
Pension assets refer to pensionplans with a net surplus of SEK 195m (158). For further information refer to note 21.
Note 17 Inventories
SEKm 2019 2018Finished products 7,835 8,111
Supplies including raw materials 2,601 2,592
Work in progress 422 364
Total 10,858 11,067
The cost of inventories recognized as expense and included in cost of goods sold amounted to SEK 25,174 m (25,050).
Write down of inventories expensed during the year amount to SEK 102m (392), which is included in cost of goods sold. Write down reversed during the year amount to SEK 255m ( 55)
Inventories valued to net realizable value amounted to SEK 478m (421).
Note 18 Other current assets
SEKm 2019 2018Value added tax 382 372
Miscellaneous short-term receivables 203 206
Prepaid rents and leases 19 18
Prepaid insurance premiums 21 20
Prepaid supplies 51 68
Other prepaid expenses 335 322
Total 1,011 1,006
Note 19 Equity
Share capitalThe share capital in Husqvarna AB consists of class A-shares and class B-shares. A class A-share entitles the holder to one vote and a class B-share to one-tenth of a vote. All shares entitle the holder to the same proportion of assets and earnings, and carry equal rights in terms of dividends.
Other paid-in capitalOther paid-in capital consists of share-premium reserve following the rights issue in 2009.
Other reserves The translation reserve includes all exchange-rate differences that arise from the translation of the financial statements of foreign operations that have compiled their reports in a currency other than that in which the consolidated financial statements are presented (SEK). The transla-tion reserve also include net investments hedges.
The hedging reserve includes the effective portion of the accumu-lated net change in the fair value, related to the hedged risk, of cash-flow hedging instruments attributable to hedged items that have not yet occured.
Retained earningsRetained earnings consist not only of accrued profits but also of the change in pension liability attributable to remeasurements of defined-benefit plans recognized in ”Total other comprehensive income”. Regarding changes in actuarial assumptions, see also note 21. The proposed dividend for 2019 is SEK 2.25 (2.25).
Non-controlling interestsNon-controlling interests refer to the share of equity that belongs to external interests without a controlling influence in certain subsidiaries within the Group.
Share capital
SEKmOn December 31, 2019, the share capital comprised:
112,015,629 Class A-shares, par value SEK 2 224
464,328,149 Class B-shares, par value SEK 2 929
Total 1,153
On December 31, 2018, the share capital comprised:
112,437,551 Class A-shares, par value SEK 2 225
463,906,227 Class B-shares, par value SEK 2 928
Total 1,153
Number of sharesTreasury
sharesOutstanding
shares TotalShares, December 31, 2018Class A-shares – 112,437,551 112,437,551
Class B-shares 4,670,416 459,235,811 463,906,227
Long term incentive program 2016Class A-shares – – –
Class B-shares –529,252 529,252 –
Conversion of sharesClass A-shares – –421,922 –421,922
Class B-shares – 421,922 421,922
Shares, December 31, 2019Class A-shares – 112,015,629 112,015,629
Class B-shares 4,141,164 460,186,985 464,328,149

No
tes – G
rou
p
88 / Annual Report 2019 / Husqvarna Group
Other reserves
SEKmCash flow
hedges
Currency translation
reserveNet investment
hedgeTotal other
reservesOpening balance, January 1, 2019 69 1,176 –794 451Result arising during the year 12 – –668 –656
Tax on result arising during the year –2 – 143 141
Reclassification adjustments to the income statement –108 – – –108
Tax on reclassification adjustments to the income statement 19 – – 19
Currency translation difference – 916 – 916
Closing balance, December 31, 2019 –10 2,092 –1,319 763
SEKmCash flow
hedges
Currency translation
reserveNet investment
hedgeTotal other
reservesOpening balance, January 1, 2018 –76 –30 32 –74Result arising during the year 85 – –1,058 –973
Tax on result arising during the year –19 – 232 213
Reclassification adjustments to the income statement 95 – – 95
Tax on reclassification adjustments to the income statement –16 – – –16
Currency translation difference – 1,206 – 1,206
Closing balance, December 31, 2018 69 1,176 –794 451
Note 20 Financial risk management and financial instruments
FINANCIAL RISK MANAGEMENTFinancial risk management for Husqvarna Group entities is undertaken in accordance with the Group Financial Policy. Described below are the principles of financial risk management applicable to Husqvarna Group. Husqvarna Group is exposed to a number of risks relating to financial instruments including, for example, liquid funds, trade receivables and other receivables, trade payables and other liabilities, borrowings, and derivative instruments. The primary risks associated with these instru-ments are:• Financing risks in relation to the Group’s capital requirements.• Interest rate risks on liquid funds and borrowings.• Foreign exchange risks on export and import flows plus earnings and
net investments in foreign operations.• Commodity price risks affecting expenditure on raw materials and
components for goods produced. • Credit risks relating to financial and commercial activities.
The Board of Directors of Husqvarna Group has adopted a Group Financial Policy, as well as a Group Credit Policy to regulate the man-agement and control of these risks. These risks are to be managed according to the limitations stated in the Financial Policy. The Financial Policy also describes the management of risks relating to pension fund assets. The purpose of the policy is to have enough funding available to minimize the Group's cost of capital and to achieve an effective man-agement of the Group's financial risks.
The management of financial risks has largely been centralized to Husqvarna Group Treasury, where measurement and control of financial risks are performed on a daily basis by a separate risk control function. Furthermore, Husqvarna Group’s policies include guidelines for manag-ing operating risk relating to financial instruments, e.g. through the clear assignment of responsibilities and the allocation of powers of attorney.
FINANCING RISKFinancing risk refers to the risk that the financing of the Group’s capital requirements and the refinancing of existing loans could become more difficult or more costly. This risk can be decreased by ensuring that maturities are evenly distributed over time, and that total short-term borrowings do not exceed available liquidity. Disregarding seasonal variations, net debt shall be long-term, according to the Financial Policy. The Group’s goals for long-term borrowings include an average time to maturity of at least two years, and an even distribution of maturities. A maximum of SEK 3.0bn in borrowings, originally long-term, is
normally allowed to mature in the next 12-month period. When Husqvarna Group assesses its refinancing risk, the maturity profile is adjusted for available unutilized committed credit facilities.
In addition, seasonality in the cash flow is an important factor in the assessment of the financing risk. Consequently, Husqvarna Group always takes into account the fact that financial planning must include future seasonal fluctuations.
The average adjusted time to maturity for the Group’s financing was 2.6 years (3.4) at the end of 2019.
Capital structure Husqvarna Group’s ambition is to have a capital structure where sea-sonally adjusted net debt in proportion to earnings before interest, tax, depreciations and amortizations (EBITDA) is not to exceed 2.5 in the long-term. This ambition for the captial structure may be adjusted in the event of changes to the macroeconomic situation, or allowed to deviate for a shorter period of time due to for example acquisitions. Dividend shall normally exceed 40% of income for the year.
SEKm 2019 2018Net pension liabilities 2,427 1,943
Other interest-bearing liabilities 1 11,786 10,013
Less: liquid funds and other interest-bearing assets –2,898 –2,081
Net debt 11,315 9,875
Net debt, excluding net pension liabilities 8,888 7,932
EBITDA 5,779 4,000
Net debt/EBITDA 2.00 2.16
Total equity 17,283 16,009
Total assets 41,981 38,607
Equity/assets ratio 41% 41%
1 Lease liabilities of SEK 1,761m is included within other interest-bearing liabilities, the lease liabilities have increased with SEK 1,502m because of the adoption of IFRS 16. For further information refer to note 1 and 28.

No
tes – G
rou
p
89 / Annual Report 2019 / Husqvarna Group
Liquid fundsLiquid funds consist of cash and cash equivalent and other short-term deposits including derivative assets at fair market value. Husqvarna Group’s goal is that the level of liquid funds, including unutilized com-mitted credit facilities, shall equal at least 2.5% of rolling 12-month sales. At year-end, this ratio was 17.8 % (16.3 ). In addition, the Group shall have sufficient liquid resources to finance the expected seasonal build-up in working capital during the next 12 months.
BorrowingsThe financing of Husqvarna Group is managed centrally by Group Treasury in order to ensure efficiency and risk control. Debt is primarily raised at Parent Company level and transferred to subsidiaries as internal loans or capital injections. In this process, various derivatives are used to convert the funds to the required currency. Financing is also undertaken locally, mostly in countries in which there are legal restrictions preventing financing through Group companies. The major part of the Group’s financing is currently conducted through
a Swedish Medium Term Note (MTN) program, other bond financing and bilateral loan agreements. In addition, the Group has an unuti-lized SEK 5bn committed revolving credit facility maturing in 2021. The facility is unutilized as of December 31, 2019. Due to the nature of its business, the Group has major seasonal variations in its funding needs. These variations have during 2019 been managed mainly by utilizing the Group’s commercial paper (CP) program and short-term bank loans.
At year-end 2019, the Group’s total interest-bearing liabilities, excluding pension liability, amounted to SEK 11,786m (10,013), of which SEK 7,047m (6,038) referred to long-term loans. During the year, the group issued bonds totalling SEK 1.0bn with five years maturity.
Husqvarna Group has, as mentioned, substantial seasonal variation in its borrowings. The seasonal peak of the indebtedness normally implies additional borrowings of SEK 2.5–3.5bn in excess of year-end borrowings, taking dividend into account.
Husqvarna Group has not breached any conditions in external loan agreements during the year.
Future undiscounted cashflows of loans and other financial liabilities as of December 31, 2019 1
SEKm 2020 2021 2022 2023 2024 >2025 TotalLease liabilities –435 –342 –234 –167 –117 –253 –1,548
Bonds, bank loans and other loans –2,753 –1,234 –1,301 –1,558 –1,771 –410 –9,027
Derivative liabilities, interest rate 2 –12 –11 –12 –10 –15 – –60
Derivative liabilities, foreign exchange 2 –250 – – – – – –250
Trade payables –4,099 – – – – – –4,099
Total financial liabilities –7,549 –1,587 –1,547 –1,735 –1,903 –663 –14,9841 Please note that the table includes the forecast future nominal interest payment and, thus, does not correspond to the net book value in the balance sheet.2 For more detailed information on derivative contracts, see table under “Credit risk in financial activities” in this note.
Borrowings
2019 2018
SEKmTotal
borrowingsFacility
amountTotal
borrowingsFacility
amountMedium Term Note Program 5,445 8,000 4,946 8,000
Other bond loans 93 – 89 –
Committed revolving credit facility – 5,000 – 5,000
Committed credit facility 1,192 – 1,000 –
Long-term bank loans 300 – 686 –
Lease liabilities 1 1,761 – 207 –
Commercial papers 2,100 7,000 925 7,000
Other short-term loans 611 – 1,908 –
Derivative liabilities 284 – 252 –
Total 11,786 20,000 10,013 20,0001 Most of the previous operating leases have been recognised from January 1, 2019 as
right of use assets and lease liabilities, because of the adoption of IFRS 16. Previous finance leases have been included as comparative information for right of use assets and lease liabilities. For further information on the transition to IFRS 16 refer to note 1 and 28.
Market programsHusqvarna Group has a MTN program, denominated in SEK, to issue long-term debt in the domestic capital market. The total amount of the program is SEK 8.0bn. In addition, Husqvarna Group has a Swedish CP program. The total amount of the program is SEK 7.0bn. The table Borrowings shows outstanding amounts under these two programs.
The currency composition of Husqvarna Group’s borrowings is dependent upon the currency distribution of the Group’s assets. Currency derivatives are used to obtain the preferred currency distribution.
Net debt – currency composition
2019 2018
SEKm
Net debt excl. currency
swaps
Net debt incl. currency
swaps
Net debt excl. currency
swaps
Net debt incl. currency
swapsUSD 1,201 10,635 550 9,646
SEK 9,357 –4,679 9,136 –3,439
EUR 1,561 3,535 1,041 2,602
JPY 207 439 –48 146
CZK –55 396 –35 341
GBP –184 307 –173 282
RUB –26 101 –34 41
CNY –343 –44 –304 –25
CHF 42 2 –22 14
Other –445 623 –236 267
Total 11,315 11,315 9,875 9,875
INTEREST RATE RISKInterest rate risk refers to the adverse effects of changes in market inter-est rates on the Group’s net income. The main factor determining this risk is the interest-fixing period.
Interest rate risk in liquid fundsThe holding periods of investments are mainly short-term. The majority of investments are undertaken with maturities of between 0 and 3 months. The fixed interest term for these current investments was 18 days (20) at the end of 2019. A downward shift in the yield curve of one percentage point would reduce the Group’s interest income by approximately SEK 19m (13) and the Group’s equity by SEK 15m (10).
Interest-rate risk in borrowingsThe Financial Policy states that the benchmark for the long-term loan portfolio is an average fixed interest term of 6 months. Group Treasury can choose to deviate from this benchmark on the basis of a risk man-date established by the Board of Directors. However, the maximum average fixed interest term is 3 years. Derivatives, such as interest rate swap agreements, are used to manage the interest rate risk by changing

No
tes – G
rou
p
90 / Annual Report 2019 / Husqvarna Group
the interest from fixed to floating or vice versa. The average fixed interest term for the non-seasonal debt was 1.7 (3.0) years at year-end. On the basis of volumes and interest fixings at the end of 2019, a one-percent-age point shift in interest rates would impact the Group’s interest expenses by approximately SEK +/– 25m (6) before tax. Interest rates with different maturities and different currencies may not change uni-formly. This calculation is based on a parallel shift of all yield curves simultaneously by one percentage point. The Group has seasonal debt for which the interest risk is not calculated due to its short-term nature. As per December 31, 2019 the average interest rate in the total loan portfolio was 3.6 % (5.0). At year-end, Husqvarna Group had out-standing interest rate derivatives with a nominal amount of SEK 5,296m (5,270) hedging the interest rate risk.
FOREIGN EXCHANGE RISKForeign exchange risk refers to the adverse effects of changes in foreign currency exchange rates on Husqvarna Group’s income and equity. In order to manage such effects, the Group covers these risks within the framework of the Financial Policy. The Group’s overall cur-rency exposure is managed centrally. The major currencies to which Husqvarna Group is exposed are EUR, USD, CAD and AUD.
Transaction exposure from commercial flowsThe Financial Policy stipulates hedging of forecasted sales and pur-chases in foreign currencies, taken into consideration the price fixing periods and the competitive environment. Normally, 75–100% of the invoiced and forecasted flows are hedged up to and including 6 months, while forecasted flows for 7–12 months are hedged between 50–75%. Group subsidiaries primarily cover their risks in commercial currency flows through Group Treasury. Group Treasury assumes the currency risks and covers such risks externally by utilizing currency derivatives.
The table below shows the forecasted transaction flows (imports and exports) for 2020, hedges at year-end 2019 and comparative amounts for the previous year.
Commercial flows
2019 2018Currency SEKm
2020 Fore-casted flows
Total hedge amount
2019 Fore-casted flows
Total hedge amount
EUR 4,101 –3,211 4,988 –3,488
CAD 991 –676 1,246 –887
AUD 590 –432 575 –377
RUB 559 –397 457 –334
NOK 552 –380 575 –420
CHF 537 –482 492 –418
Other 290 –61 –56 59
DKK 522 –380 508 –375
USD –2,233 1,619 –3,255 2,471
SEK –5,909 4,400 –5,530 3,769
The hedging effect on operating income amounted to SEK –83m (–204) during 2019. At year-end, the unrealized exchange rate result on for-ward contracts, all maturing in 2020, amounted to SEK 10m (140).
Translation exposure on consolidation of entities outside SwedenChanges in exchange rates also affect the Group’s income when trans-lating income statements of foreign subsidiaries into SEK. Husqvarna Group does not hedge such exposures. The translation exposure aris-ing from income statements of foreign subsidiaries is included in the sensitivity analysis below.
Exposure from net investments in foreign operationsThe net assets and liabilities in foreign subsidiaries constitute a net investment in foreign operations, which generates a translation differ-ence in connection with consolidation. In order to limit negative effects on Group equity resulting from translation differences, part of the Group’s net investments in foreign operations is hedged with foreign exchange derivatives. A decline in value of a net investment is offset by exchange rate gains on foreign exchange derivative contracts. The rela-tionship between the net investment and derivative is reviewed and adjusted monthly.
Foreign exchange sensitivity from transaction and translation exposureHusqvarna Group is particularly exposed to changes in the exchange rates of EUR and USD. Furthermore, the Group has exposures against a number of other currencies. Using a static calculation and disregarding any effects from hedges, a 10% increase or decrease in the value of all currencies against SEK would affect the Group’s result before financial items and tax by approximately SEK +/– 765m (570) for one year. A 10% increase of USD would affect the Group’s result with SEK –190m (–385) and a corresponding decrease of EUR with SEK 500m (550). This assumes the same distribution of earnings and costs as in 2019 and does not include any dynamic effects, such as changes in competitive-ness or consumer behaviour arising from such changes in exchange rates. It is also worth noting that, due to the seasonality in Husqvarna Group’s sales, these flows and results are not distributed evenly throughout the calendar year. For more information on risks related to currency exposure, see Risk Management section.
HEDGE ACCOUNTINGHusqvarna Group applies hedge accounting for hedging of interest rate risk, forecasted commercial cash flows and, when applicable, hedg-ing of net investments in foreign operations. The hedge relationships are expected to be highly effective and no material sources of hedge ineffectiveness are expected to occur.
Hedge accounting of interest rate riskThe total market value for hedges of interest rate risk amounted to SEK –59m as of December 31, 2019 of which SEK –36m is reported in the hedge reserve. Assuming an unchanged market interest rate, the effects on income after financial items for 2020 would be SEK –1m for Q1, SEK 2m for Q2, SEK 8m for Q3 and SEK 2m for Q4. During the year no ineffectiveness has occurred in the hedging of interest rate risk.
The table “Future undiscounted cashflows of loans and other finan-cial liabilities as of December 31, 2019” shows the future cashflows of the interest rate hedges. The cashflows during 2020, assuming unchanged market interest rates, would be SEK –19m for Q1, SEK 3m for Q2, SEK 2m for Q3 and SEK 2m for Q4.
Hedge accounting of foreign exchange riskThe total market value for hedges of commercial flows amounted to SEK 2m as of December 31, 2019 of which SEK 23m is reported in the hedge reserve. Assuming an unchanged exchange rate, the effects on income after financial items for 2020 would be SEK 2m for Q1, SEK 11m for Q2, SEK 8m for Q3 and SEK 2m for Q4.
As of December 31, 2019, USD 1,625m of net investments in foreign operations were hedged. The total market value of derivatives for net investment hedging amounted to SEK 407m of which SEK 458m is reported in the hedge reserve. During the year no ineffectiveness has occurred in the hedging of currency risk.
Derivatives designated as hedging instruments
2019SEKm
Nominal amount Maturity
Average hedge
rateNet investment hedgesDerivatives in net investments hedges of foreign operations 15,179 2020 9.57
Cash flow hedgesDerivatives in cash flow hedge of foreign currency risk 16,674 2020 n.a
– of which USD exposure against SEK 2,058 2020 9.40
– of which EUR exposure against SEK 7,844 2020 10.69
Derivatives in cash flow hedge of interest rate risk 3,796 2020–2024 0.74

No
tes – G
rou
p
91 / Annual Report 2019 / Husqvarna Group
COMMODITY PRICE RISKCommodity price risk is the risk of increase in the cost of direct and indi-rect materials should underlying commodity prices rise on the global markets. Husqvarna Group is exposed to fluctuations in commodity prices through agreements with suppliers, whereby the price is linked to the raw material price on the world market. This exposure can be divided into direct commodity exposure, which refers to pure commod-ity exposure, and indirect commodity exposure, which is defined as exposure arising from only a portion of a component. Commodity price risk is managed through contracts with the suppliers rather than through the use of derivatives. A 10% rise or fall in the price of steel used in Husqvarna Group’s products will affect the Group’s results before financial items and tax by approximately SEK +/– 160m (200), everything else being equal. The same effect on the price of aluminium would impact the results by SEK +/– 45 (50) and a 10% change in the price of plastics would give an effect on results of SEK +/– 150m (110).
CREDIT RISKA financial asset is in default when the counterparty fails to pay its con-tractual obligations. Financial assets are written off when there is no reasonable expectation of recovery. Husqvarna Group identifies credit risk in trade receivables, financial activities and non current assets.
Credit risk in trade receivablesHusqvarna Group sells to a substantial number of customers including dealers, retailers and professional users. Sales are made on the basis of normal delivery and payment terms. Customer financing solutions are normally arranged by third parties. The Credit Policy of the Group ensures that the management process for customer credits includes customer rating, credit limits, decision levels and management of bad debts. The Board of Directors decides on customer credit limits exceeding SEK 100m. Husqvarna Group uses an external provider for classification of the creditworthiness of its customers. The classification has different levels, from low risk to high risk. In the table below, trade receivables have been divided into three different intervals.
SEKm 2019 2018Low to moderate risk 2,197 2,119
Medium risk to elevated risk 1,230 1,294
High risk 193 200
Total 3,620 3,613
As of December 31, 2019 net trade receivables, after provisions for bad debt, amounted to SEK 3,620m (3,613), which consequently equals the maximum exposure to losses in trade receivables. Hence, the book value equals the fair market value of the receivables. The size of the credit portfolio is, however, directly dependent upon the seasonal pat-tern of Husqvarna Group’s sales. This means that credit exposure is sig-nificantly higher during the first six months of each calendar year. A pro-vision for bad debt, based on a probablity of default, is recorded at inception of the trade receivables and adjusted during the lifetime of the receivable. The amount of the provision is the difference between the asset’s carrying amount and the present value of estimated future cash flows, discounted at the effective interest rate. Provisions for bad debt at the end of the financial year 2019 amounted to SEK 223m (187), of which SEK 206m (171) refer to invoices due. For trade receivables recorded through other comprehensive income fair value changes and provisions have been immaterial during 2019.
Trade receivables past dueTrade receivables that were past due, but not yet impaired amounted to SEK 664m (869) as of December 31, 2019.
Aging analyses for past due trade receivables
Past due but not impaired, SEKm 2019 2018Up to 1 month 180 293
1 to 3 months 151 248
>3 months 333 328
Total 664 869
Provisions for trade receivables
SEKm 2019 2018Opening balance, January 1 187 152
Transition adjustment IFRS 9 – 16
Adjusted opening balance, January 1 187 168New provisions 77 60
Reversed unused provisions –6 –27
Impairment of trade receivables –40 –14
Currency exchange rate differences 5 0
Closing balance, December 31 223 187
Husqvarna Group’s result has been impacted by an impairment of a trade receivable in the Netherlands amounting to SEK 25m. The situa-tion regarding past due receivables has improved somewhat since pre-vious year-end, taking the total volume of outstanding trade receiv-ables into account. The fair value of collateral held for trade receivables due for payment was SEK 28m (26). A global credit insurance program is in place in a number of countries. As of December 31, 2019 total cover-age amounts to SEK 4,490m.
A plan for repayment is normally designed for customers with past due receivables at the same time as the account is placed under special surveillance. At a later stage, unpaid products may be repossessed or other securities be enforced.
Concentration of credit risk in trade receivables
2019 2018Concentration of credit risk
Number of customers
% of total portfolio
Number of customers
% of total portfolio
Exposure <SEK 15mNot
available 88%Not
available 82%
Exposure SEK 15–100m 12 8% 11 11%
Exposure >SEK 100m 1 4% 1 7%
Husqvarna Group has substantial exposure towards a limited number of large customers, primarily in the US.
Impact of hedging intruments on the financial statement
2019SEKm
Nominal amount
Carrying amount
Line item in the financial
statement
Change in fair value used for
measuring ineffectiveness for the period
Cash flow hedge reserve
Foreign exchange forward contracts 8,373 127 Current assets –54 122
Foreign exchange forward contracts 8,301 103 Current liabilities –34 99
Interest rate swap agreements 3,796 54Non Current
liabilities –14 36
Forecasted cash flows from sales/purchases 16,674 n.a n.a n.a n.a
Forecasted interest cash flows from floating rate borrowings –60 n.a n.a n.a n.a

No
tes – G
rou
p
92 / Annual Report 2019 / Husqvarna Group
Credit risk in financial activitiesExposure to credit risk arises from the investment of liquid funds and through counterparty risks related to derivatives. In order to limit expo-sure to credit risk, a counterparty list has been created specifying the maximum approved exposure for each counterparty. Investments in liq-uid funds are mainly made in interest-bearing instruments with high liquidity and involve issuers with a long-term credit rating of at least A-, as defined by Standard & Poor’s or similar institutions. The average time to maturity for the liquid funds was 18 days (20) at the end of 2019. A sub-stantial part of the exposure arises from derivatives transactions.
The table below shows the gross volume of outstanding foreign exchange derivative contracts.
2019 2018Maturity, SEKm 2020 2021– 2019 2020-Amount sold –42,539 –332 –44,334 –395
Amount purchased 42,815 333 44,600 400
Net settled derivatives (NDF) –25 – 0 0
Net 251 1 266 5
Credit risk in other non-current assetsHusqvarna Group’s long term holdings in securities consist of US government bonds. The credit risk is recognized as immaterial due to the high creditworthiness of the issuer.
FAIR VALUE ESTIMATIONBelow is a description of financial instruments carried at fair value, based on the classification in the fair value hierarchy. The different levels have been defined as follows:• quoted prices (unadjusted) in active markets for identical assets or lia-
bilities (Level 1);• inputs other than quoted prices included within Level 1 that are
observable, either directly (i.e. as prices) or indirectly (i.e. derived from prices) (Level 2); and
• inputs that are not based on observable market data (Level 3).
The Group´s financial instruments carried at fair value are derivatives. Derivatives belong to Level 2 as future cash flows have been discounted using current quoted market interest rates and exchange rates for simi-lar instruments.
To determine the fair value of the Group’s borrowings, the prevailing market rates for the respective periods have been used and the Group’s credit risk has been taken into account. Changes in credit spreads have been disregarded when determining fair value of financial leases. For short-term financial instruments such as trade receivables and other receivables, other short-term investments, cash and cash equivalents, trade payables and other liabilities, and short term borrowings the fair value equals their carrying amount as the impact of discounting is not significant. Fair value of long-term borrowings are based on discounted cash flows using a rate based on the borrowing rate, and are within Level 2 in the fair value hierarchy.
2019 2018
SEKmCarrying amount
Fair value
Carrying amount
Fair value
Financial assetsFinancial assets at fair value through profit or loss
– of which derivatives where hedge accounting is not applied 58 58 115 115
– of which currency derivatives where hedge accounting for cash flow hedges is applied 127 127 177 177
– of which interest derivatives where hedge accounting for cash flow hedges is applied 1 1 – –
– of which currency derivatives related to net investments in foreign operations where hedge accounting is applied 407 407 65 65
Financial assets at fair value through other comprehensive income
Trade receivables 1 322 322 555 555
Financial assets measured at amortized cost
Other non-current assets 474 474 434 434
Trade receivables 3,298 3,298 3,058 3,058
Other receivables 203 203 206 206
Cash and cash equivalents 1,911 1,911 1,346 1,346
Total financial assets 6,801 6,801 5,956 5,956
Financial liabilitiesFinancial liabilities at fair value through profit or loss
– of which derivatives where hedge accounting is not applied 126 126 78 78
– of which currency derivatives where hedge accounting for cash flow hedges is applied 103 103 66 66
– of which interest derivatives where hedge accounting for cash flow hedges is applied 55 55 33 33
– of which currency derivatives related to net investments in foreign operations where hedge accounting is applied – – 75 75
Financial liabilities measured at amortized cost
Trade payables 4,099 4,099 4,622 4,622
Other liabilities 229 229 172 172
Financial leases 2 – – 207 215
Borrowings 9,741 9,660 9,554 9,557
Total financial liabilities 14,353 14,272 14,807 14,8181 Trade receivables not sold but part of factoring programmes. 2 Financial leases is discontinued as a result of the adoption of IRFS 16 January 1, 2019. For further information on the transition to IFRS 16 refer to note 1 and 28.
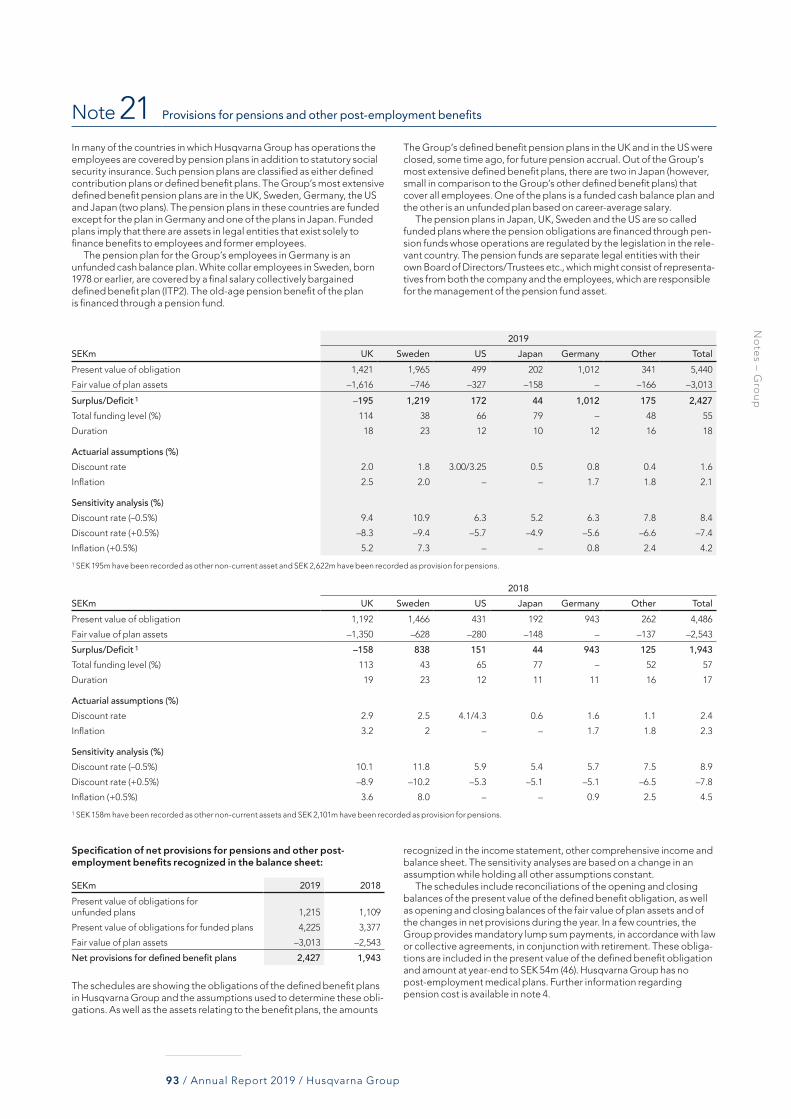
No
tes – G
rou
p
93 / Annual Report 2019 / Husqvarna Group
Note 21 Provisions for pensions and other post-employment benefits
In many of the countries in which Husqvarna Group has operations the employees are covered by pension plans in addition to statutory social security insurance. Such pension plans are classified as either defined contribution plans or defined benefit plans. The Group’s most extensive defined benefit pension plans are in the UK, Sweden, Germany, the US and Japan (two plans). The pension plans in these countries are funded except for the plan in Germany and one of the plans in Japan. Funded plans imply that there are assets in legal entities that exist solely to finance benefits to employees and former employees.
The pension plan for the Group’s employees in Germany is an unfunded cash balance plan. White collar employees in Sweden, born 1978 or earlier, are covered by a final salary collectively bargained defined benefit plan (ITP2). The old-age pension benefit of the plan is financed through a pension fund.
The Group’s defined benefit pension plans in the UK and in the US were closed, some time ago, for future pension accrual. Out of the Group’s most extensive defined benefit plans, there are two in Japan (however, small in comparison to the Group’s other defined benefit plans) that cover all employees. One of the plans is a funded cash balance plan and the other is an unfunded plan based on career-average salary.
The pension plans in Japan, UK, Sweden and the US are so called funded plans where the pension obligations are financed through pen-sion funds whose operations are regulated by the legislation in the rele-vant country. The pension funds are separate legal entities with their own Board of Directors/Trustees etc., which might consist of representa-tives from both the company and the employees, which are responsible for the management of the pension fund asset.
2019SEKm UK Sweden US Japan Germany Other TotalPresent value of obligation 1,421 1,965 499 202 1,012 341 5,440
Fair value of plan assets –1,616 –746 –327 –158 – –166 –3,013
Surplus/Deficit 1 –195 1,219 172 44 1,012 175 2,427Total funding level (%) 114 38 66 79 – 48 55
Duration 18 23 12 10 12 16 18
Actuarial assumptions (%)Discount rate 2.0 1.8 3.00/3.25 0.5 0.8 0.4 1.6
Inflation 2.5 2.0 – – 1.7 1.8 2.1
Sensitivity analysis (%)Discount rate (–0.5%) 9.4 10.9 6.3 5.2 6.3 7.8 8.4
Discount rate (+0.5%) –8.3 –9.4 –5.7 –4.9 –5.6 –6.6 –7.4
Inflation (+0.5%) 5.2 7.3 – – 0.8 2.4 4.2
1 SEK 195m have been recorded as other non-current asset and SEK 2,622m have been recorded as provision for pensions.
2018SEKm UK Sweden US Japan Germany Other TotalPresent value of obligation 1,192 1,466 431 192 943 262 4,486
Fair value of plan assets –1,350 –628 –280 –148 – –137 –2,543
Surplus/Deficit 1 –158 838 151 44 943 125 1,943Total funding level (%) 113 43 65 77 – 52 57
Duration 19 23 12 11 11 16 17
Actuarial assumptions (%)Discount rate 2.9 2.5 4.1/4.3 0.6 1.6 1.1 2.4
Inflation 3.2 2 – – 1.7 1.8 2.3
Sensitivity analysis (%)Discount rate (–0.5%) 10.1 11.8 5.9 5.4 5.7 7.5 8.9
Discount rate (+0.5%) –8.9 –10.2 –5.3 –5.1 –5.1 –6.5 –7.8
Inflation (+0.5%) 3.6 8.0 – – 0.9 2.5 4.5
1 SEK 158m have been recorded as other non-current assets and SEK 2,101m have been recorded as provision for pensions.
Specification of net provisions for pensions and other post- employment benefits recognized in the balance sheet:
SEKm 2019 2018Present value of obligations for unfunded plans 1,215 1,109
Present value of obligations for funded plans 4,225 3,377
Fair value of plan assets –3,013 –2,543
Net provisions for defined benefit plans 2,427 1,943
The schedules are showing the obligations of the defined benefit plans in Husqvarna Group and the assumptions used to determine these obli-gations. As well as the assets relating to the benefit plans, the amounts
recognized in the income statement, other comprehensive income and balance sheet. The sensitivity analyses are based on a change in an assumption while holding all other assumptions constant.
The schedules include reconciliations of the opening and closing balances of the present value of the defined benefit obligation, as well as opening and closing balances of the fair value of plan assets and of the changes in net provisions during the year. In a few countries, the Group provides mandatory lump sum payments, in accordance with law or collective agreements, in conjunction with retirement. These obliga-tions are included in the present value of the defined benefit obligation and amount at year-end to SEK 54m (46). Husqvarna Group has no post-employment medical plans. Further information regarding pension cost is available in note 4.

No
tes – G
rou
p
94 / Annual Report 2019 / Husqvarna Group
The movement in the present value of the net defined benefit obligation
2019 2018
SEKmPresent value of obligation
Fair value of plan assets Total
Present value of obligation
Fair value of plan assets Total
Opening balance, January 1 4,486 –2,543 1,943 4,253 –2,555 1,698Current service cost 175 7 182 151 4 155
Past service costs and gains/losses on settlements 3 – 3 18 – 18
Interest expenses 107 –72 35 95 –64 31
4,771 –2,608 2,163 4,517 –2,615 1,902
Remeasurements:Return on plan assets – –310 –310 – 121 121
Actuarial gains and losses due to changes in demographic assumptions –25 – –25 –11 – –11
Experience assumptions 36 – 36 67 – 67
Actuarial gains and losses due to changes in financial assumptions 670 – 670 –56 – –56
681 –310 371 0 121 121
Exchange rate differences on foreign plans 173 –135 38 149 –86 63
Divestments and transfers 0 0 0 –2 3 1
Contributions:– Employers –84 –61 –145 –84 –60 –144
– Plan participants 6 –6 – 5 –5 –
Payments from plans:– Benefit payments –107 107 – –99 99 –
– Settlements – – – – – –
Closing balance, December 31 5,440 –3,013 2,427 4,486 –2,543 1,943
Plan assets comprise of the following 1:
2019 2018SEKm % SEKm %
Equity instruments– Equities 1,172 38.9 961 36.7
Interest-bearing securities– Government bonds 159 5.3 35 1.3
– Corporate bonds 438 14.5 393 15.0
– Index-linked bonds 512 17.0 443 16.9
– Interest rate funds 442 14.7 464 17.8
Properties 49 1.6 40 1.5
Liquid funds 12 0.4 10 0.4
Assets held by insurance company 229 7.6 197 10.4
Total 3,013 100.0 2,543 100.01 Approximately 98% (98) of total plan assets refers to listed assets.
None of the assets above refers to shares in the Parent Company or real estates occupied by the Group.
For the funded defined benefit pension plans (Sweden, UK and US represent around 89% of total pension assets) the Group’s strategy is a combination of matching the assets with the liabilities and trying to achieve as high return as possible within the investment guidelines. This is partly done by investing in longer duration bonds designed to match the development of the debt and also by investing in corporate bonds, index-linked bonds and shares with the purpose of achieving a high return in various market conditions long term. As the maturity of the pension commitments decreases and/or the value of the assets reaches
a satisfactory level in relation to the debt, the Group will gradually reduce the investment risk by shifting into assets with lower volatility.
Husqvarna Group is through its defined benefit obligations exposed to a number of risks, of which the following have the greatest impact on the Group’s pension liability:
Discount rateThe discount rate reflects the estimated timing of benefit payments and is used for measuring the present value of the obligation. A fluctuation in the discount rate will have a material effect on the pension obligation but will also impact the interest income and expense reported in the finance net. To determine the discount rate, AA-rated corporate bonds indexes matching the duration of the pension obligations are applied in most countries. When valuing Swedish pension liabilities Husqvarna Group uses mortgage bonds when determining discount rate.
Inflation riskMost of the obligations are linked to inflation and an increase in inflation leads to higher debt. The return of the majority of the plan assets has a low correlation with inflation, while the holdings of index-linked bonds are protected against a rise in inflation and thus compensates for the increase in the deficit that would occur otherwise.
Longevity riskSince most of the pension obligations mean that those covered by the plan will receive benefits for life, higher life expectancy assumptions have a significant impact on the pension liabilities.
The company expects to make contributions of approximately SEK 158m (141) to the plans during 2020.
The weighted average duration of the defined benefit obligation 18 years (17).

No
tes – G
rou
p
95 / Annual Report 2019 / Husqvarna Group
Note 22 Other provisions
SEKmProvisions for restructuring
Warranty commit-
ments Claims Other TotalOpening balance, January 1, 2019 388 329 328 321 1,366Provisions made 213 450 – 63 726
Provisions used –272 –466 –36 –154 –928
Unused amounts reversed –2 –4 –10 2 –14
Exchange rate differences –23 16 15 37 45
Closing balance, December 31, 2019 304 325 297 269 1,195Current provisions 293 203 – 89 585
Non-current provisions 11 122 297 180 610
RestructuringProvisions for restructuring include the payments that are expected to occur in the coming years as a result of the Group’s decision to close certain production facilities, rationalize production and reduce the number of employees. The amounts are based on the Group’s best esti-mates and are adjusted when changes to these estimates occur.
Warranty commitmentsProvisions for warranty comprise potential expenses for repairing or replacing products sold. Provisions are made when the products are sold and are normally limited to 24 months.
ClaimsProvisions for claims refer to claim reserves in the Group’s insurance companies mainly due to product liabilities but also property damage and business interruptions. The provisions are estimated based on actuarial calculations.
OtherOther provisions are in all material aspects referring to payroll related provisions.
Note 23 Other liabilities
SEKm 2019 2018Accrued holiday pay 300 278
Other accrued payroll expenses 714 606
Accrued customer rebates 778 751
Other accrued expenses 780 597
Value added tax 57 66
Personnel taxes and other taxes 137 87
Other operating liabilities 229 172
Total 2,995 2,557
Note 24 Pledged assets and contingent liabilities
Pledged assets
SEKm 2019 2018Pension obligations 1 130 121
Real estate mortgages 27 27
Total 157 1481 Refers to endowment that is pledged in favor of the recipient.
Contingent liabilities
SEKm 2019 2018On behalf of external counterpartiesGuarantees and other commitments 114 109
Total 114 109
In addition to the above contingent liabilities, guarantees for fulfillment of contractual undertakings are provided as part of Husqvarna Group’s normal course of business. There was no indication at year-end that any payment will be required in connection with any contractual guaran-tees. Furthermore, there is an obligation, in the event of dealer’s bank-ruptcy, to buy back repossessed Husqvarna Group products from cer-tain dealers financing their floorplanning with an external financing company. During 2019 goods amounting to a value of SEK 14m (13) were bought back in connection with floorplanning activities.
Husqarna Group is involved commercial, product liability and other disputes in the ordinary course of business. Such disputes involve claims for compensatory damages, property damages or personal injury compensation and occasionally also punitive damages. The com-pany is self-insured to a certain extent, and is also insured against excessive liability losses for certain claims. Husqvarna Group continu-ously monitors and evaluates pending claims and disputes, and take action when deemed necessary. The Company believes that these activities help to minimize the risk. Due to complexity of these disputes, it is difficult to predict a favorable outcome of each claim and an adverse outcome affecting the consolidated financial position and result could occur.
Note 25 Related party transactions
Sales to related parties are carried out on market-based terms. See the Parent Company’s directly owned subsidiaries in the Parent Company’s note 16, Shares in subsidiaries. Information about the Board of Directors and Group Management and compensation to those are reported in note 4, Employees and employee benefits. No unusual transactions of any significance have occurred between Husqvarna Group and the Board of Directors or Group Management.
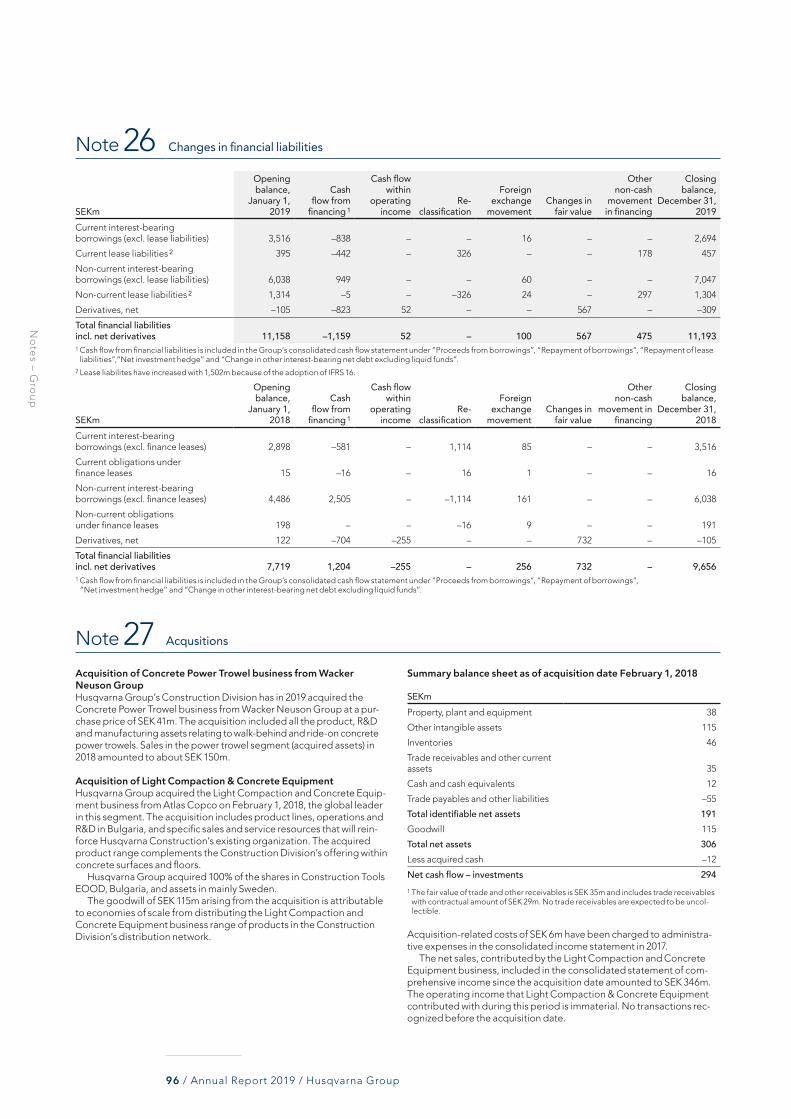
No
tes – G
rou
p
96 / Annual Report 2019 / Husqvarna Group
Note 26 Changes in financial liabilities
SEKm
Opening balance,
January 1, 2019
Cash flow from
financing 1
Cash flow within
operating income
Re -classification
Foreign exchange
movementChanges in
fair value
Other non-cash
movement in financing
Closing balance,
December 31, 2019
Current interest-bearing borrowings (excl. lease liabilities) 3,516 –838 – – 16 – – 2,694
Current lease liabilities 2 395 –442 – 326 – – 178 457
Non-current interest-bearing borrowings (excl. lease liabilities) 6,038 949 – – 60 – – 7,047
Non-current lease liabilities 2 1,314 –5 – –326 24 – 297 1,304
Derivatives, net –105 –823 52 – – 567 – –309
Total financial liabilities incl. net derivatives 11,158 –1,159 52 – 100 567 475 11,1931 Cash flow from financial liabilities is included in the Group’s consolidated cash flow statement under “Proceeds from borrowings”, “Repayment of borrowings”, “Repayment of lease
liabilities”,“Net investment hedge” and “Change in other interest-bearing net debt excluding liquid funds”.2 Lease liabilites have increased with 1,502m because of the adoption of IFRS 16.
SEKm
Opening balance,
January 1, 2018
Cash flow from
financing 1
Cash flow within
operating income
Re -classification
Foreign exchange
movementChanges in
fair value
Other non-cash
movement in financing
Closing balance,
December 31, 2018
Current interest-bearing borrowings (excl. finance leases) 2,898 –581 – 1,114 85 – – 3,516
Current obligations under finance leases 15 –16 – 16 1 – – 16
Non-current interest-bearing borrowings (excl. finance leases) 4,486 2,505 – –1,114 161 – – 6,038
Non-current obligations under finance leases 198 – – –16 9 – – 191
Derivatives, net 122 –704 –255 – – 732 – –105
Total financial liabilities incl. net derivatives 7,719 1,204 –255 – 256 732 – 9,6561 Cash flow from financial liabilities is included in the Group’s consolidated cash flow statement under “Proceeds from borrowings”, “Repayment of borrowings”,
“Net investment hedge” and “Change in other interest-bearing net debt excluding liquid funds”.
Note 27 Acqusitions
Acquisition of Concrete Power Trowel business from Wacker Neuson Group Husqvarna Group’s Construction Division has in 2019 acquired the Concrete Power Trowel business from Wacker Neuson Group at a pur-chase price of SEK 41m. The acquisition included all the product, R&D and manufacturing assets relating to walk-behind and ride-on concrete power trowels. Sales in the power trowel segment (acquired assets) in 2018 amounted to about SEK 150m.
Acquisition of Light Compaction & Concrete Equipment Husqvarna Group acquired the Light Compaction and Concrete Equip-ment business from Atlas Copco on February 1, 2018, the global leader in this segment. The acquisition includes product lines, operations and R&D in Bulgaria, and specific sales and service resources that will rein-force Husqvarna Construction’s existing organization. The acquired product range complements the Construction Division’s offering within concrete surfaces and floors.
Husqvarna Group acquired 100% of the shares in Construction Tools EOOD, Bulgaria, and assets in mainly Sweden.
The goodwill of SEK 115m arising from the acquisition is attributable to economies of scale from distributing the Light Compaction and Concrete Equipment business range of products in the Construction Division’s distribution network.
Summary balance sheet as of acquisition date February 1, 2018
SEKmProperty, plant and equipment 38
Other intangible assets 115
Inventories 46
Trade receivables and other current assets 35
Cash and cash equivalents 12
Trade payables and other liabilities –55
Total identifiable net assets 191Goodwill 115
Total net assets 306Less acquired cash –12
Net cash flow – investments 2941 The fair value of trade and other receivables is SEK 35m and includes trade receivables
with contractual amount of SEK 29m. No trade receivables are expected to be uncol-lectible.
Acquisition-related costs of SEK 6m have been charged to administra-tive expenses in the consolidated income statement in 2017.
The net sales, contributed by the Light Compaction and Concrete Equipment business, included in the consolidated statement of com-prehensive income since the acquisition date amounted to SEK 346m. The operating income that Light Compaction & Concrete Equipment contributed with during this period is immaterial. No transactions rec-ognized before the acquisition date.

No
tes – G
rou
p
97 / Annual Report 2019 / Husqvarna Group
Note 28 Changes in accounting policies and reclassifications
This note explains the impact of the adoption of IFRS 16 “Leases”, and IFRIC 23 “Uncertainty over income tax treatments”.
a) IFRS 16 “Leases” transitionHusqvarna Group applies IFRS 16 “Leases” from January 1, 2019. IFRS 16 replaces IAS 17 “Leases”. IFRS 16 resulted in most leases being recognized in the balance sheet, as the distinction between operating and finance leases is removed. Under the new standard, an asset (for the right to use the leased asset) and a financial liability (the obligation to make lease payments) is recognized, with exceptions for short-term leases and low-value assets. The standard affects the accounting for the Group’s operating leases (mainly buildings, cars and forklifts).
Husqvarna Group adopts IFRS 16 “Leases” retrospectively from January 1, 2019 with the cumulative effect of initially applying the new standard recognized on January 1, 2019. Comparatives for the 2018 financial year have not been restated. On adoption of IFRS 16 the Group recognized lease liabilities in relation to leases which have previously been classified as operating leases under IAS 17. These liabilities are measured at the present value of the remaining lease payments, dis-counted using the incremental borrowing rate as at January 1, 2019. The weighted average discount rate was 2.2% as at January 1, 2019. The lease liability recognized as of January 1, 2019 increased by SEK 1,502m as a result of the adoption of IFRS16. The Group had non-cancellable operating lease commitments of SEK 1,586m as at December 31, 2018, SEK 1,484m when discounted. The difference can be explained by the exceptions for short-term leases and low-value assets and the use of extension options as according to IFRS 16.
The Group has used the practical expedient permitted by the standard to exclude initial direct cost for the measurement of the right of use asset at the date of initial application, and the use of hindsight in determining the lease term where the contract contains options to extend or terminate the lease. The right of use assets have been mea-sured at an amount equal to the lease liability at transition. Non-current assets increased by SEK 1,502m on January 1, 2019 due to recognized right of use assets. The total effect in the income statement is not significant, there is a slight shift in the income statement, where operating income increase and the financial items decrease.
b) IFRIC 23 “Uncertainty over income tax treatments”Husqvarna Group applies IFRIC 23 “Uncertainty over income tax treat-ments” from January 1, 2019. IFRIC 23 is a new interpretation of uncertain income tax treatments within the scope of IAS 12 Income taxes. IFRIC 23 clarifies how to recognize and measure deferred and current income tax assets and liabilities where there is uncertainty over a tax treatment. An uncertain tax treatment is any tax treatment applied by an entity where there is uncertainty over whether that treatment will be accepted by the tax authority.
Husqvarna Group adopts IFRIC 23 “Uncertainty over income tax treatments” retrospectively from January 1, 2019 with the cumulative effect of initially applying the new standard recognized on January 1, 2019. Comparatives for the 2018 financial year have not been restated. Uncertain tax liabilities of SEK 167m that has previously been recognized as deferred tax liabilities has been reclassified to current tax liabilities as at January 1, 2019, as a result of the adoption of IFRIC 23.
The following table shows the adjustments for each individual line item.
Consolidated balance sheet
SEKmDec 31,
2018 a) IFRS 16 b) IFRIC 23Jan 1, 2019
restatedAssetsProperty, plant and equipment 6,064 – – 6,064
Right of use assets 120 1,502 – 1,622
Goodwill 7,105 – – 7,105
Other intangible assets 5,534 – – 5,534
Derivatives 0 – – 0
Other non-current assets 592 – – 592
Deferred tax assets 1,585 – – 1,585
Total non-current assets 21,000 1,502 – 22,502Total current assets 17,607 – – 17,607Total assets 38,607 1,502 – 40,109
Equity and liabilitiesTotal equity 16,009 – – 16,009Borrowings 6,038 – – 6,038
Lease liabilities 191 1,123 – 1,314
Derivatives 34 – – 34
Deferred tax liabilities 1,794 – –167 1,627
Provisions for pensions and other post- employment benefits 2,101 – – 2,101
Other provisions 696 – – 696
Total non-current liabilities 10,854 1,123 –167 11,810Trade payables 4,622 – – 4,622
Tax liabilities 145 – 167 312
Other liabilities 2,557 – – 2,557
Borrowings 3,516 – – 3,516
Lease liabilities 16 379 – 395
Derivatives 218 – – 218
Other provisions 670 – – 670
Total current liabilities 11,744 379 167 12,290Total equity and liabilities 38,607 1,502 – 40,109
Note 29 Subsequent events
No significant events have occurred subsequent to December 31, 2019 that would have a material impact on the Husqvarna Group’s financial statements.

Fin
ancial S
tatem
en
ts – Pare
nt C
om
pan
y
98 / Annual Report 2019 / Husqvarna Group
Parent Company income statementSEKm Note 2019 2018Net sales 3 17,838 17,185
Cost of goods sold 5, 6 –13,626 –14,109
Gross income 4,212 3,076
Selling expenses 5 –1,449 –1,334
Administrative expenses 5 –1,308 –1,192
Other operating income and operating expenses 7 9 0
Operating income 4, 8, 9 1,464 550
Income from financial itemsIncome from participation in Group companies 10 8,213 553
Financial income 11 157 94
Financial expenses 11 –1,322 –1,612
Income after financial items 8,512 –415
Appropriations 12 110 337
Income before taxes 8,622 –78
Income tax 13 –92 133
Net Income 8,530 55
Parent Company comprehensive income statementSEKm 2019 2018Net Income 8,530 55
Other comprehensive incomeItems that may be reclassified to the income statement:
Cash flow hedges
Result arising during the period, net of tax 38 18
Reclassification adjustments to the income statement, net of tax –40 72
Other comprehensive income, net of tax –2 90Total comprehensive income 8,528 145

Fin
ancial S
tatem
en
ts – Pare
nt C
om
pan
y
99 / Annual Report 2019 / Husqvarna Group
Parent Company balance sheetSEKm Note Dec 31, 2019 Dec 31, 2018AssetsNon-current assets
Intangible assets 14 1,949 2,028
Property, plant and equipment 15 2,346 2,034
Financial assets
Shares in subsidiaries 16 33,782 29,436
Derivatives 19 1 1
Other non-current assets 17, 19 65 65
Deferred tax assets 13 83 170
Total non-current assets 38,226 33,734
Current assets
Inventories 18 2,171 2,127
Receivables
Trade receivables 19 455 472
Receivables from Group companies 19 5,699 6,834
Derivatives 19 678 386
Other receivables 19, 20 110 110
Tax receivables 91 150
Prepaid expenses and accrued income 20 133 193
Cash and cash equivalents 19 650 165
Total current assets 9,987 10,437Total assets 48,213 44,171
Equity and liabilitiesRestricted equity
Share capital 1,153 1,153
Revaluation reserve 3 3
Statutory reserves 18 18
Reserve related to R&D expenses 1,276 1,029
Non-restricted equity
Share-premium reserve 2,605 2,605
Fair value reserve 18 21
Profit or loss brought forward 16,198 17,652
Net Income 8,530 55
Total equity 29,801 22,536
Untaxed reserves 12 794 794
Provisions
Provisions for pensions and other post-employment benefits 22 1 48
Other provisions 23 100 111
Total provisions 101 159
Non-current liabilities
Borrowings 19, 27 6,826 5,776
Derivatives 19 55 34
Total non-current liabilities 6,881 5,810
Current liabilities
Borrowings 19, 27 2,576 3,415
Liabilities to Group companies 19 5,754 9,085
Trade payables 19 1,226 1,356
Derivatives 19 264 368
Other liabilities 21 816 648
Total current liabilities 10,636 14,872Total equity and liabilities 48,213 44,171
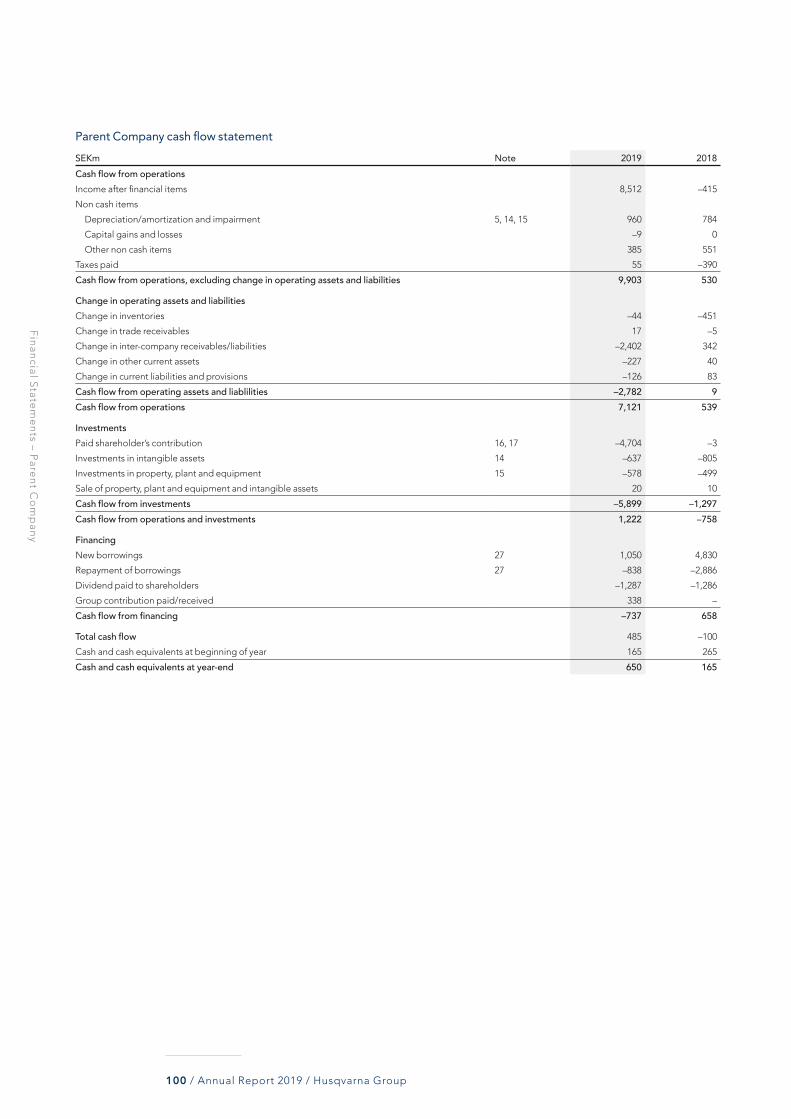
Fin
ancial S
tatem
en
ts – Pare
nt C
om
pan
y
100 / Annual Report 2019 / Husqvarna Group
Parent Company cash flow statementSEKm Note 2019 2018Cash flow from operationsIncome after financial items 8,512 –415
Non cash items
Depreciation/amortization and impairment 5, 14, 15 960 784
Capital gains and losses –9 0
Other non cash items 385 551
Taxes paid 55 –390
Cash flow from operations, excluding change in operating assets and liabilities 9,903 530
Change in operating assets and liabilitiesChange in inventories –44 –451
Change in trade receivables 17 –5
Change in inter-company receivables/liabilities –2,402 342
Change in other current assets –227 40
Change in current liabilities and provisions –126 83
Cash flow from operating assets and liablilities –2,782 9Cash flow from operations 7,121 539
InvestmentsPaid shareholder’s contribution 16, 17 –4,704 –3
Investments in intangible assets 14 –637 –805
Investments in property, plant and equipment 15 –578 –499
Sale of property, plant and equipment and intangible assets 20 10
Cash flow from investments –5,899 –1,297Cash flow from operations and investments 1,222 –758
FinancingNew borrowings 27 1,050 4,830
Repayment of borrowings 27 –838 –2,886
Dividend paid to shareholders –1,287 –1,286
Group contribution paid/received 338 –
Cash flow from financing –737 658
Total cash flow 485 –100
Cash and cash equivalents at beginning of year 165 265
Cash and cash equivalents at year-end 650 165
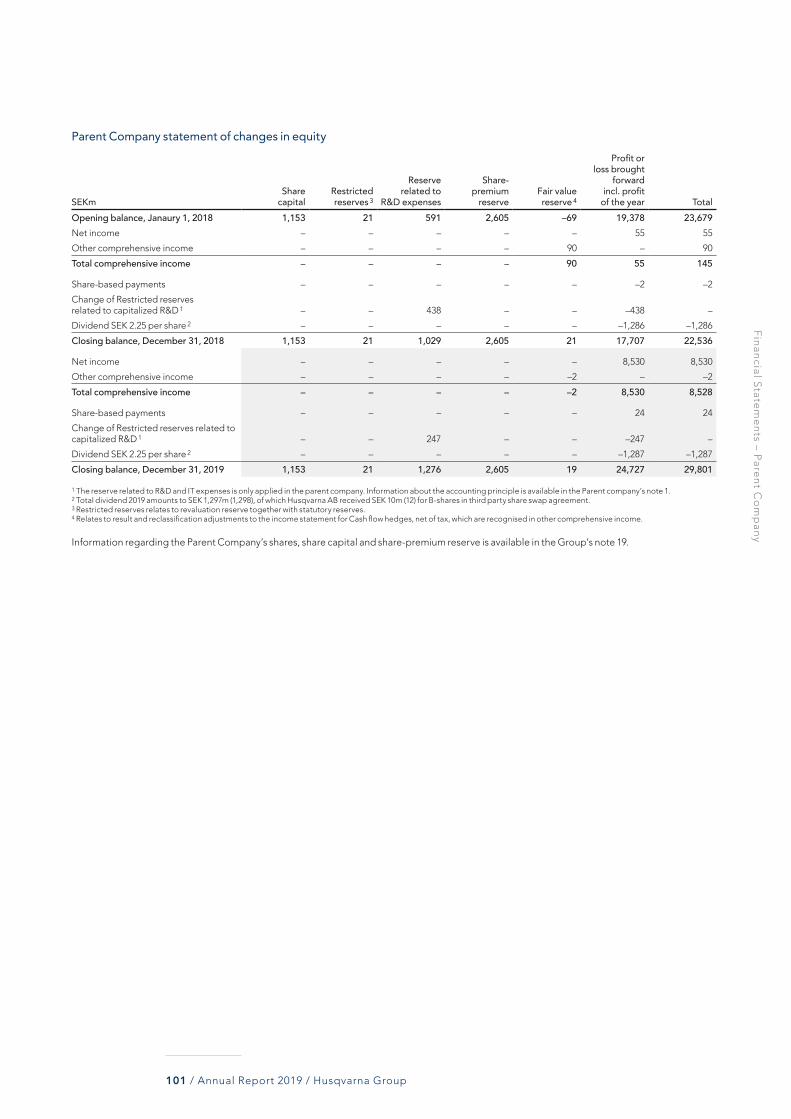
Fin
ancial S
tatem
en
ts – Pare
nt C
om
pan
y
101 / Annual Report 2019 / Husqvarna Group
Parent Company statement of changes in equity
SEKmShare
capitalRestricted reserves 3
Reserve related to
R&D expenses
Share- premium
reserveFair value reserve 4
Profit or loss brought
forward incl. profit of the year Total
Opening balance, Janaury 1, 2018 1,153 21 591 2,605 –69 19,378 23,679Net income – – – – – 55 55
Other comprehensive income – – – – 90 – 90
Total comprehensive income – – – – 90 55 145
Share-based payments – – – – – –2 –2
Change of Restricted reserves related to capitalized R&D 1 – – 438 – – –438 –
Dividend SEK 2.25 per share 2 – – – – – –1,286 –1,286
Closing balance, December 31, 2018 1,153 21 1,029 2,605 21 17,707 22,536
Net income – – – – – 8,530 8,530
Other comprehensive income – – – – –2 – –2
Total comprehensive income – – – – –2 8,530 8,528
Share-based payments – – – – – 24 24
Change of Restricted reserves related to capitalized R&D 1 – – 247 – – –247 –
Dividend SEK 2.25 per share 2 – – – – – –1,287 –1,287
Closing balance, December 31, 2019 1,153 21 1,276 2,605 19 24,727 29,801
1 The reserve related to R&D and IT expenses is only applied in the parent company. Information about the accounting principle is available in the Parent company’s note 1. 2 Total dividend 2019 amounts to SEK 1,297m (1,298), of which Husqvarna AB received SEK 10m (12) for B-shares in third party share swap agreement. 3 Restricted reserves relates to revaluation reserve together with statutory reserves. 4 Relates to result and reclassification adjustments to the income statement for Cash flow hedges, net of tax, which are recognised in other comprehensive income.
Information regarding the Parent Company’s shares, share capital and share-premium reserve is available in the Group’s note 19.

No
tes – P
aren
t Co
mp
any
102 / Annual Report 2019 / Husqvarna Group
Note 1 Parent Company’s Accounting principles
Husqvarna AB’s (publ) Annual Report has been prepared in accordance with the Swedish Annual Accounts Act and the Swedish Financial Reporting Board’s standard RFR 2. The Parent Company follows the International Financial Reporting Standards (IFRS) adopted by EU, to the extent possible within the framework for the Swedish Annual Accounts Act and Swedish Safe-guarding of Pension Commitments Act (Tryggandelagen), and considering the relationship between account-ing and taxation. The Parent Company is following the same principles as described in the Group note 1, with the below exceptions.
SegmentsInformation is reported in accordance with the Swedish Annual Accounts Act and contains disclosures of net sales divided by geography and per product category.
Intangible assetsThe Parent company amortize all brands on a straight-line basis during the useful life, which according to group policy is estimated at 10 years.
Property, plant and equipmentThe Parent Company uses methods for depreciations described in the section “Property, plant and equipment” in the Group’s note 1 with some exception, which is described below.
The Parent Company accounts for tax depreciation in accordance with the Swedish tax law as appropriations in the Income statement. These depreciations are accounted for in addition to the depreciation described in the section “Property, plant and equipment” in the Group’s note 1 and are reported as untaxed reserves in the Balance sheet.
Shares in subsidiariesShares in subsidiaries are reported at cost deducted for impairment. Expenses and potential additional purchase price, related to an acquisi-tion are included in the acquisition value of the investment. Investments are tested annually for impairment or if there is an indication of that the book value of the investment is higher than the recoverable amount. Dividends are reported as income.
PensionsHusqvarna Group applies IAS 19 Employee Benefits for pension assets and liabilities. The Parent Company applies the Swedish Safe-guarding of Pension Commitments Act (Tryggandelagen).
Group contributions Husqvarna AB applies the alternative rule in RFR 2, and accounts for both group contribution received and paid as appropriations in the income statement.
Contingent liabilitiesThe Parent Company has signed guarantees in favor of subsidiaries which in accordance with IFRS are classified as a financial guarantee. However, the Parent Company applies RFR 2 and recognizes these guarantees as contingent liabilities.
LeasingThe Parent Company applies RFR 2 and recognizes all leasing as a linear cost over the lease period.
Reserve related to R&D expensesThe parent company capitalizes R&D and IT in the balance sheet. From 2016 and forward, a restricted reserve is presented for internally gener-ated R&D and IT, where an amount equal to this year’s capitalization reduced with amortization is transfered from free reserves to restricted reserves. The restricted reserve dissolves in line with the amortizations.
Note 2 Financial risk management
Husqvarna Group applies common risk management for all units. Group Treasury is part of the Parent Company and the description of financial risk management available in the Group’s note 20 is in all material aspects applicable also for the Parent Company.
Note 3 Net sales distribution
Net sales are distributed on the following geographic markets
SEKm 2019 2018Europe 12,798 13,001
North America 2,408 1,924
Rest of the World 2,632 2,260
Total 1 17,838 17,1851 Net sales amounted to SEK 17,838m (17,185), of which SEK 13,983m (13,612) referred to
sales to Group companies and 3,855 m (3,573) to external customers.
Net sales distribution per product category
SEKm 2019 2018Forest-, park- and garden products 14,572 14,516
Construction products 3,179 2,621
Other 87 48
Total 17,838 17,185
Note 4 Employees and employee benefits
Average number of employees2019 2018
Men Women Total Men Women TotalBoard, President and CEO and Group Management 13 6 19 13 7 20
Sweden 1,608 538 2,146 1,502 477 1,979
Total 1,621 544 2,165 1,515 484 1,999
Salary and remunerationSEKm 2019 2018
Salaries and remunerations
(whereof bonuses)Social
expensesPension
expenses
Salaries and remunerations
(whereof bonuses)Social
expensesPension
expensesBoard, President and CEO and Group Management 86 (0) 29 15 45 (0) 23 15
Other employees 1,249 406 119 1,215 420 155
Total 1,335 435 134 1,260 443 170
For further information regarding remunerations to the Board of Directors, President and CEO and the Group Management together with the Group’s long term incentive program see the Group’s note 4.

No
tes – P
aren
t Co
mp
any
103 / Annual Report 2019 / Husqvarna Group
Note 5 Expenses by nature
SEKm 2019 2018Costs for supplies and raw materials 9,638 9,484
Remuneration to employees 1,904 1,873
Amortization/depreciation and impairment 960 784
Other 3,881 4,494
Total 16,383 16,635
Note 6 Exchange rate gains and losses in operating income
SEKm 2019 2018Exchange rate gains and losses in operating income1 –56 –213
Total –56 –2131 Included in selling expenses within operating income.
Operating income includes SEK 49m (–74) of foreign exchange hedging result previously reported in other comprehensive income. Information related to the accounting of fair value in financial instruments is pre-sented in the Group’s note 1.
Note 7 Other operating income and operating expenses
SEKm 2019 2018Other operating income
Gain on sale of :
– Property, plant and equipment 9 0
– Operations and shares – 0
Total 9 0
Other operating expensesLoss on sale of:
– Property, plant and equipment 0 0
Total 0 0
Note 8 Fees to auditors
SEKm 2019 2018EYAudit fees for the annual audit engagement 6 6
Audit fees not included in the annual audit engagement 0 –
Tax advices 1 1
Other services 0 0
Total fees to EY 7 7
Note 9 Operating leases
There are no material contingent expenses or restrictions among the Parent Company’s operating leases. Expenses for rental payments for facilities, machinery etc. (minimum lease payments) amounted to SEK 85m (84) in 2019.
Future minimum lease payments are allocated as follows:
SEKm 2019 2018Within 1 year 84 56
1–5 years 148 116
> 5 years 23 0
Total 255 172
Note 10 Income from participation in Group companies
SEKm 2019 2018Dividends 8,289 770
Profit/Loss on sales of shares in Group 282 –
Impairment –358 –217
Total 8,213 553
Note 11 Financial income and expense
SEKm 2019 2018Financial incomeInterest income– from subsidiaries 57 32
– from others 100 62
whereof Interest income
– on deposits 59 38
– on derivatives held for trading 98 56
Exchange rate differences– on borrowings – –
– on derivatives held for trading 2 – –
Total financial income 157 94
Financial expensesInterest expense– to subsidiaries –55 –41
– to others –586 –505
whereof Interest expense
– on borrowings –159 –165
– on cashflow hedges, interest derivatives –24 –33
– on derivatives held for trading 1 –458 –348
Exchange rate differences– on borrowings –81 –258
– on derivatives held for trading 2 –585 –788
Other financial expenses –15 –20
Total financial expenses –1,322 –1,612Financial income and expenses, net –1,165 –1,5181 Interest expense on derivatives held for trading includes interest expense on
derivatives for hedging net investments SEK –410m (–327).2 Currency exchange rate difference on derivatives held for trading includes cur-
rency exhange rate differences on derivatives for hedging net investments SEK –669m (–1,059).
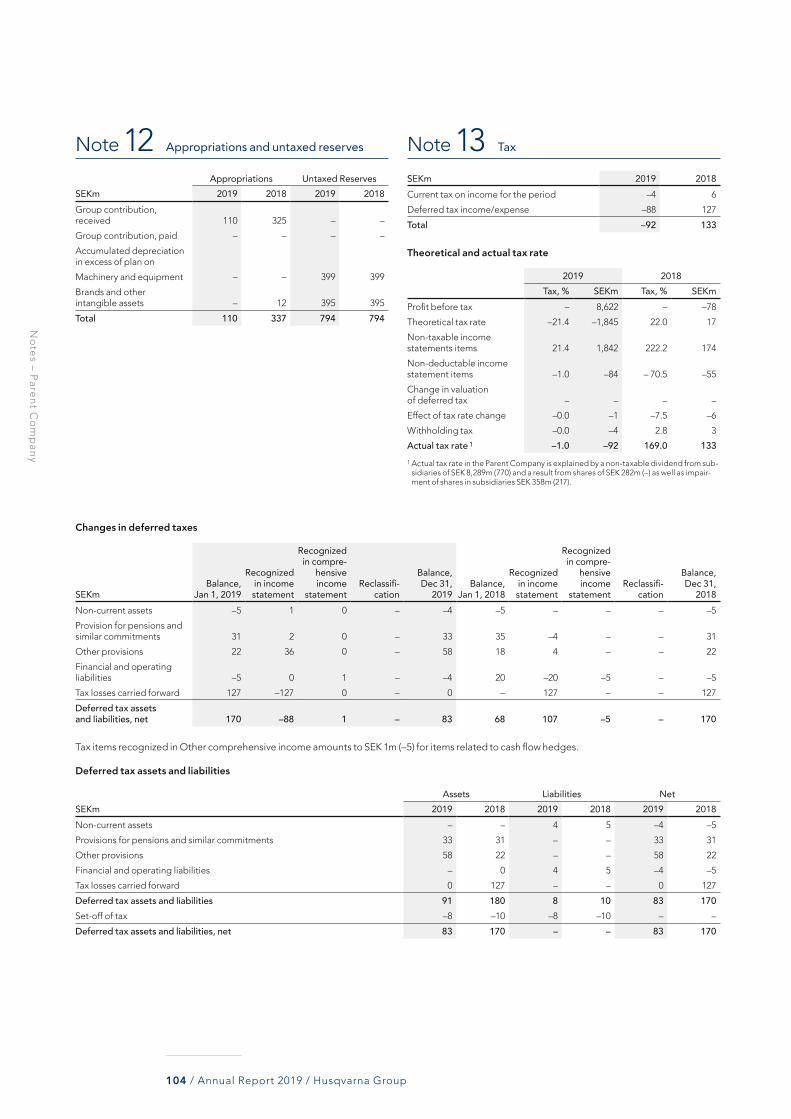
No
tes – P
aren
t Co
mp
any
104 / Annual Report 2019 / Husqvarna Group
Note 12 Appropriations and untaxed reserves
Appropriations Untaxed ReservesSEKm 2019 2018 2019 2018Group contribution, received 110 325 – –
Group contribution, paid – – – –
Accumulated depreciation in excess of plan on
Machinery and equipment – – 399 399
Brands and other intangible assets – 12 395 395
Total 110 337 794 794
Note 13 Tax
SEKm 2019 2018Current tax on income for the period –4 6
Deferred tax income/expense –88 127
Total –92 133
Theoretical and actual tax rate
2019 2018Tax, % SEKm Tax, % SEKm
Profit before tax – 8,622 – –78
Theoretical tax rate –21.4 –1,845 22.0 17
Non-taxable income statements items 21.4 1,842 222.2 174
Non-deductable income statement items –1.0 –84 – 70.5 –55
Change in valuation of deferred tax – – – –
Effect of tax rate change –0.0 –1 –7.5 –6
Withholding tax –0.0 –4 2.8 3
Actual tax rate 1 –1.0 –92 169.0 1331 Actual tax rate in the Parent Company is explained by a non-taxable dividend from sub-
sidiaries of SEK 8,289m (770) and a result from shares of SEK 282m (–) as well as impair-ment of shares in subsidiaries SEK 358m (217).
Changes in deferred taxes
SEKmBalance,
Jan 1, 2019
Recognized in income statement
Recognized in compre-
hensive income
statementReclassifi-
cation
Balance, Dec 31,
2019Balance,
Jan 1, 2018
Recognized in income statement
Recognized in compre-
hensive income
statementReclassifi-
cation
Balance, Dec 31,
2018Non-current assets –5 1 0 – –4 –5 – – – –5
Provision for pensions and similar commitments 31 2 0 – 33 35 –4 – – 31
Other provisions 22 36 0 – 58 18 4 – – 22
Financial and operating liabilities –5 0 1 – –4 20 –20 –5 – –5
Tax losses carried forward 127 –127 0 – 0 – 127 – – 127
Deferred tax assets and liabilities, net 170 –88 1 – 83 68 107 –5 – 170
Tax items recognized in Other comprehensive income amounts to SEK 1m (–5) for items related to cash flow hedges.
Deferred tax assets and liabilities
Assets Liabilities NetSEKm 2019 2018 2019 2018 2019 2018Non-current assets – – 4 5 –4 –5
Provisions for pensions and similar commitments 33 31 – – 33 31
Other provisions 58 22 – – 58 22
Financial and operating liabilities – 0 4 5 –4 –5
Tax losses carried forward 0 127 – – 0 127
Deferred tax assets and liabilities 91 180 8 10 83 170Set-off of tax –8 –10 –8 –10 – –
Deferred tax assets and liabilities, net 83 170 – – 83 170
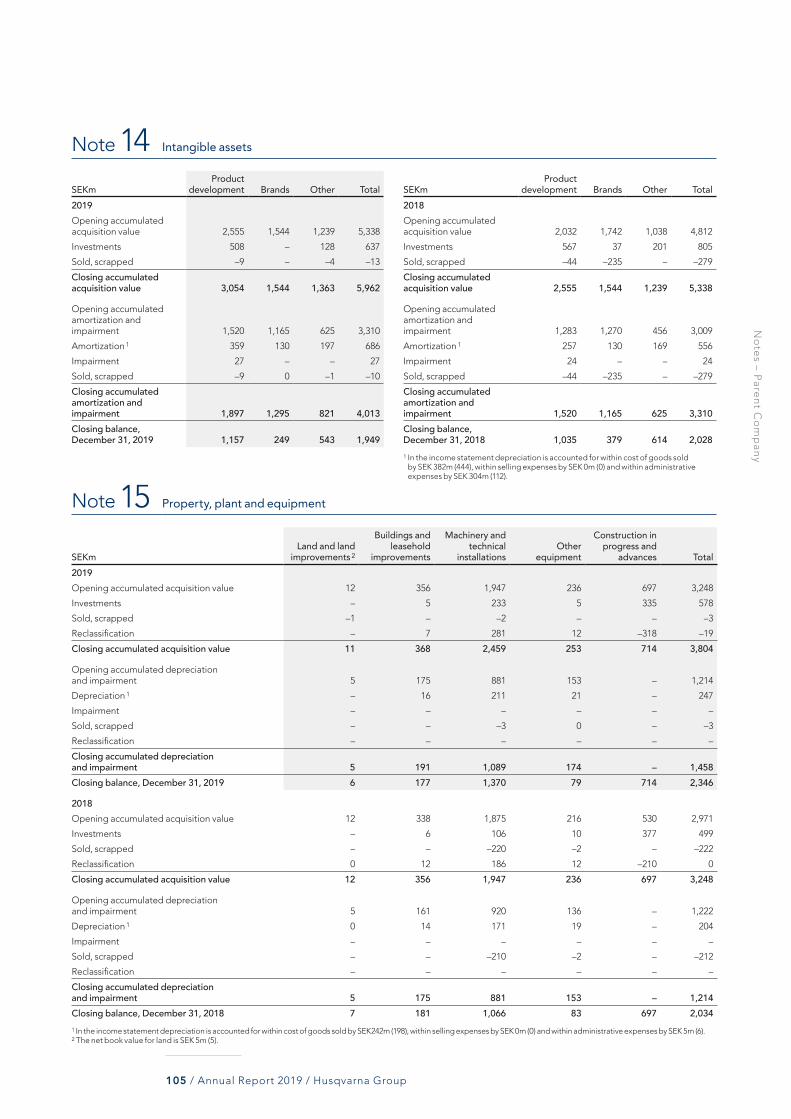
No
tes – P
aren
t Co
mp
any
105 / Annual Report 2019 / Husqvarna Group
Note 14 Intangible assets
SEKmProduct
development Brands Other Total2019Opening accumulated acquisition value 2,555 1,544 1,239 5,338
Investments 508 – 128 637
Sold, scrapped –9 – –4 –13
Closing accumulated acquisition value 3,054 1,544 1,363 5,962
Opening accumulated amortization and impairment 1,520 1,165 625 3,310
Amortization 1 359 130 197 686
Impairment 27 – – 27
Sold, scrapped –9 0 –1 –10
Closing accumulated amortization and impairment 1,897 1,295 821 4,013Closing balance, December 31, 2019 1,157 249 543 1,949
SEKmProduct
development Brands Other Total2018Opening accumulated acquisition value 2,032 1,742 1,038 4,812
Investments 567 37 201 805
Sold, scrapped –44 –235 – –279
Closing accumulated acquisition value 2,555 1,544 1,239 5,338
Opening accumulated amortization and impairment 1,283 1,270 456 3,009
Amortization 1 257 130 169 556
Impairment 24 – – 24
Sold, scrapped –44 –235 – –279
Closing accumulated amortization and impairment 1,520 1,165 625 3,310Closing balance, December 31, 2018 1,035 379 614 2,0281 In the income statement depreciation is accounted for within cost of goods sold
by SEK 382m (444), within selling expenses by SEK 0m (0) and within administrative expenses by SEK 304m (112).
Note 15 Property, plant and equipment
SEKmLand and land
improvements 2
Buildings and leasehold
improvements
Machinery and technical
installationsOther
equipment
Construction in progress and
advances Total2019Opening accumulated acquisition value 12 356 1,947 236 697 3,248
Investments – 5 233 5 335 578
Sold, scrapped –1 – –2 – – –3
Reclassification – 7 281 12 –318 –19
Closing accumulated acquisition value 11 368 2,459 253 714 3,804
Opening accumulated depreciation and impairment 5 175 881 153 – 1,214
Depreciation 1 – 16 211 21 – 247
Impairment – – – – – –
Sold, scrapped – – –3 0 – –3
Reclassification – – – – – –
Closing accumulated depreciation and impairment 5 191 1,089 174 – 1,458Closing balance, December 31, 2019 6 177 1,370 79 714 2,346
2018Opening accumulated acquisition value 12 338 1,875 216 530 2,971
Investments – 6 106 10 377 499
Sold, scrapped – – –220 –2 – –222
Reclassification 0 12 186 12 –210 0
Closing accumulated acquisition value 12 356 1,947 236 697 3,248
Opening accumulated depreciation and impairment 5 161 920 136 – 1,222
Depreciation 1 0 14 171 19 – 204
Impairment – – – – – –
Sold, scrapped – – –210 –2 – –212
Reclassification – – – – – –
Closing accumulated depreciation and impairment 5 175 881 153 – 1,214Closing balance, December 31, 2018 7 181 1,066 83 697 2,0341 In the income statement depreciation is accounted for within cost of goods sold by SEK242m (198), within selling expenses by SEK 0m (0) and within administrative expenses by SEK 5m (6).2 The net book value for land is SEK 5m (5).

No
tes – P
aren
t Co
mp
any
106 / Annual Report 2019 / Husqvarna Group
Note 16 Shares in subsidiaries
Country Subsidiaries Registration number Holding, %
Net book value,
SEK m 2019Net book,
SEKm 2018
Belgium Husqvarna Belgium SA 0400.604.654 100 486 1,172
Canada Husqvarna Canada Corp. 82354277RT0001 100 271 271
Colombia Husqvarna Colombia S.A. 900.047.189-0 95 1 1
Denmark Husqvarna Danmark A/S 26205328 100 16 16
Estonia Husqvarna Eesti Osaühing 11159436 100 0 0
Ireland Husqvarna Finance Ireland Ltd 611319 100 9,816 9,816
Kenya Outdoor Power Products Husqvarna Kenya Ltd PVT-DLU8KXM 100 0 0
Latvia SIA Husqvarna Latvija 40003760065 100 3 3
Slovakia Husqvarna Slovensko s.r.o. 36437115 100 0 0
South Africa Husqvarna South Africa (Proprietary) Limited 2005.025971.07 100 19 19
Sweden Husqvarna Försäkrings AB 516406-0393 100 57 57
Sweden Husqvarna Intellectual Property Holding AB 556745-5893 100 0 0
Sweden Husqvarna Holding Aktiebolag 556037-1964 100 12,499 12,499
Sweden McCulloch Trademark Holding AB 556199-0683 100 0 0
Sweden Poulan Pro Trademark Holding AB 559170-2609 100 0 0
Sweden Gardena Flymo AB 559170-2617 100 0 0
U.S. Millhouse Insurance Company 20-4233540 100 79 79
U.S. Husqvarna U.S. Holding, Inc. 34-1946153 100 10,535 5,503
Total 33,782 29,436
During 2019 the net book value of Husqvarna Belgium SA has been impaired with SEK 358m and a capital reduction with SEK 328m.During 2019, an capital injection has been made to Husqvarna U.S Holding, Inc with SEK 5,032m. Motorsågen 1 AB has been sold externally during 2019. There is also a number of subsidiaries to the subsidiaries, a detailed specification of Group companies is available on request from Husqvarna AB, Investor Relations.
Note 17 Other non-current assets
SEKm 2019 2018Receivables Group 41 38
Other long-term receivables 24 27
Total 65 65
Note 18 Inventories
SEKm 2019 2018Supplies including raw materials 472 444
Products in progress 8 15
Finished products 1,690 1,667
Advances to suppliers 1 1
Total 2,171 2,127
Provisions for obsolescence are included in the value of the inventory and amounts to SEK 83m (77). Provision made during the year amount to SEK 111m (58) and SEK 104m (49) has been reversed. Inventories valued to net realizable value amounted to SEK 70m (68) referring to finished products and SEK 0m (0) referring to raw materials.

No
tes – P
aren
t Co
mp
any
107 / Annual Report 2019 / Husqvarna Group
Note 19 Financial assets and liabilities
Financial assets and liabilities per category
SEKmFinancial assets valued
at fair valueFinancial assets for which
hedge accounting is appliedOther
financial assets Total2019AssetsDerivatives 512 166 1 679
Receivables Group companies 1 – – 5,740 5,740
Trade receivables – – 455 455
Other receivables – – 11 11
Cash and cash equivalents – – 650 650
Total 512 166 6,857 7,535
2018AssetsDerivatives 263 124 – 387
Receivables Group companies 1 – – 6,872 6,872
Trade receivables – – 472 472
Other receivables – – 11 11
Cash and cash equivalents – – 165 165
Total 263 124 7,520 7,9071 For long-term receivables to Group companies, see note 17.
SEKmFinancial liabilities valued
at fair valueFinancial liabilities for which hedge accounting is applied Other financial liabilites Total
2019LiabilitiesBorrowings – – 9,402 9,402
Liabilities to Group companies – – 5,754 5,754
Trade payables – – 1,226 1,226
Derivatives 175 144 – 319
Total 175 144 16,382 16,701
2018LiabilitiesBorrowings – – 9,191 9,191
Liabilities to Group companies – – 9,085 9,085
Trade payables – – 1,356 1,356
Derivatives 304 98 – 402
Total 304 98 19,632 20,034
Future undiscounted cashflows of loans and other financial liabilities as of December 31, 2019 1
SEKm 2020 2021 2022 2023 2024 >2024 TotalBonds, bank loans and other loans –2,683 –1,345 –1,302 –1,558 –1,778 –604 –9,270
Liabilities to Group Companies –5,754 – – – – – –5,754
Derivative liabilities, interest rate –12 –11 –12 –10 –15 0 –60
Derivative liabilities, foreign exchange –308 –12 – – – – –320
Trade payables –1,226 – – – – – –1,226
Total financial liabilities –9,983 –1,368 –1,314 –1,568 –1,793 –604 –16,6301 Please note that the table includes the forecast future nominal interest payment and, thus, does not correspond to the net book value in the balance sheet.
DerivativesThe main part of the Group’s derivatives is held by the Parent Company. Disclosures regarding the derivatives are available in the Group’s note 20.
Trade receivablesHusqvarna AB’s trade receivables amount to SEK 455m (472) as per December 31, 2019.
Trade receivables past due but not impaired amount to SEK81m (34) as of December 31, 2019.
Aging analysis for past due, but not impaired trade receivables
SEKm 2019 2018<3 months 61 27
>3 months 20 7
Total past due but not impaired 81 34

No
tes – P
aren
t Co
mp
any
108 / Annual Report 2019 / Husqvarna Group
Provision for overdue accounts receivables
SEKm 2019 2018Opening balance, January 1 14 15
New provisions 12 5
Reversed unused provisions –4 –2
Write off accounts receivables –4 –4
Closing balance, December 31 18 14
The credit risk in financial assets is described in the Group’s note 20.
BorrowingsThe main part of the borrowings in Husqvarna Group is reported within the Parent Company. For disclosures regarding fair value and interest exposure, see the Group’s note 20.
Note 20 Other current assets
SEKm 2019 2018Value added tax 75 77
Miscellaneous short-term receivables 35 33
Prepaid rents and leases 11 7
Prepaid insurance premiums 5 3
Other prepaid expenses 117 183
Total 243 303
Note 21 Other liabilities
SEKm 2019 2018Accrued holiday pay 161 152
Other accrued payroll expenses 245 198
Accrued customer rebates 71 59
Other accrued expenses 270 178
Personnel taxes and other taxes 69 61
Total 816 648
Note 22 Provisions for pensions
Specification of the net provision for pensions
SEKm 2019 2018Present value of the funded pension obligations 751 680
Fair value of plan assets –750 –632
Surplus/deficit of the pension fund 1 48
Surplus of the pension fund, not recognized 0 0
Net provision for pensions 1 48
Specification of the change in the net provision for pensions
SEKm 2019 2018Opening balance, January 1 48 –
Costs for pensions recognized in the income statement –21 72
Benefits paid –26 –24
Closing balance, December 31 1 48
Of total net provisions, SEK 1m (48) is within the scope of the Swedish Safe-guarding of Pension Commitments Act.
Pension costs recognized in the Income statement
SEKm 2019 2018Own pensionsCurrent service costs –47 48
Benefits paid 26 24
Pension costs –21 72
Insured pensionsInsurance premiums 107 98
Total net expenses for pensions 86 170
Of total net expenses of SEK 86m (170), SEK 44m (91) is recognized in cost of goods sold, SEK 11m (20) in selling expenses and SEK 31m (59) in administration expenses. The expected payments 2020 for own pen-sions amounts to SEK 26m.
Principal actuarial assumptions at balance sheet date
% 2019 2018Discount rate 2.5 2.5
The major categories of plan assets as a percentage of total plan assets and the return on these categories
% 2019 Return 2018 ReturnEquity instruments 41 45 41 –1
Debt instruments 59 19 59 2
Total 100 19 100 1
The employees are covered by pension plans in addition to statutory social security insurance. Such pension plans are classified as either defined contribution plans or defined benefit plans. The pension plans are funded which imply that there are assets in a legal entity that exist solely to finance benefits to employees and former employees. White collar employees, born 1978 or earlier, are covered by a final salary collectively bargained defined benefit plan (ITP2). The old-age pension benefit of the plan is financed primarily through a pension fund. Employees born 1979 or later are covered by ITP 1, which is a defined contribution pension plan. More information about pensions are presented in Group notes 4 and 21.
Note 23 Other provisions
SEKmProvisions for re-structuring
Warranty commitments Other Total
Opening balance January 1, 2019 63 34 14 111
Provisions made 36 32 21 89
Provisions used –51 –35 –14 –100
Closing balance, December 31, 2019 48 31 21 100
Current provisions 38 23 15 76
Non-current provisions 10 8 6 24
Provisions for restructuringSee the Group’s note 22 for further information regarding Husqvarna Group´s restructuring programmes.
Warranty commitmentsProvisions for warranty comprises all potential expenses for repairing or replacing products sold and are normally limited to 24 months.

No
tes – P
aren
t Co
mp
any
109 / Annual Report 2019 / Husqvarna Group
Note 24 Pledged assets and contingent liabilities
Pledged assets
SEKm 2019 2018Pension obligation 1 129 121
Total 129 1211 Refers to endowment that is pledged in favor of the recipient.
Contingent liabilities
SEKm 2019 2018On behalf of Group companiesPension obligation 466 431
On behalf of external counterpartiesBank guarantee 97 93
Pension obligation 15 13
Total 578 537
As described in note 24 to the Group’s Financial Statements, the Husqvarna Group is exposed to certain contingent liabilities regarding commercial guaranties, commercial litigation, and related disputes.
Husqvarna AB, as the parent company of the Group, may be directly liable for such obligations (for example, if it is directly named in such a lawsuit) and/or may have indirect liability for the same, such as when an intra-company guarantee is in place. Please refer to the Groups note 24 for more details.
Note 25 Related party transactions
Sales to related parties are carried out on market-based terms. Informa-tion about the Board of Directors and Group Managment and compen-sation to those are reported in Group note 4, Employees and employee benefits. No unusual transactions have occurred between Husqvarna Group and the Board of Directors or Group Management. The value of those business transactions are insignificant.
Note 26 Subsequent events
No significant events have occured subsequent to the balance sheet date that would have a material impact on the Parent Company’s financial statements.
Note 27 Changes in financial liabilities
SEKmOpening balance,
January 1, 2019 Cash flows 1 ReclassificationForeign exchange
movementOther non-cash
movementClosing balance,
December 31, 2019Current interest-bearing borrowings 3,415 –839 – – – 2,576
Non-current interest-bearing borrowings 5,776 1,000 – 50 – 6,826
Total financial liabilitites 9,191 161 – 50 – 9,4021 Cash flow from financial liabilities is included in the Parent Company’s cash flow statemenet under “Proceeds from borrowings” and “Repayment of borrowings”.
SEKmOpening balance,
January 1, 2018 Cash flows 1 ReclassificationForeign exchange
movementOther non-cash
movementClosing balance,
December 31, 2018Current interest-bearing borrowings 2,812 –586 1,114 75 – 3,415
Non-current interest-bearing borrowings 4,222 2,530 –1,114 138 – 5,776
Total financial liabilitites 7,034 1,944 – 213 – 9,1911 Cash flow from financial liabilities is included in the Parent Company’s cash flow statemenet under “Proceeds from borrowings” and “Repayment of borrowings”.
Note 28 Proposed distribution of earnings
The Board of Directors proposes a dividend for 2019 of SEK 2.25 per share (2.25) corresponding to a total dividend payment of SEK 1,287m (1,286) based on the number of outstanding shares at the end of 2019. It is also proposed that the dividend will be paid in two instalments to bet-ter match the Group’s cash flow profile, with one payment of SEK 0.75 per share in April and the remaining SEK 1.50per share in October.
The proposted record dates are April 6, 2020 for the first payment and October 6, 2020 for the second payment.
SEKt 2019The following profits are at the disposal of the AGM:
Share premium reserve 2,605,747
Retained earnings 16,215,401
Net income 8,530,250
Total 27,351,398
SEKt 2019The Board proposes the following allocation of available profits:
Dividend to the shareholders of SEK 2.25 per share 1 1,287,456
To be carried forward 26,063,942
Total 27,351,3981 Calculated on the number of outstanding shares as per December 31, 2019.
The Board is of the opinion that the dividend proposed above is justifi-able on both the Company and the Group level with regard to the demands on the Company and Group equity imposed by the type, scope and risks of the business and with regard to the Company and the Group’s financial strength, liquidity and overall position.
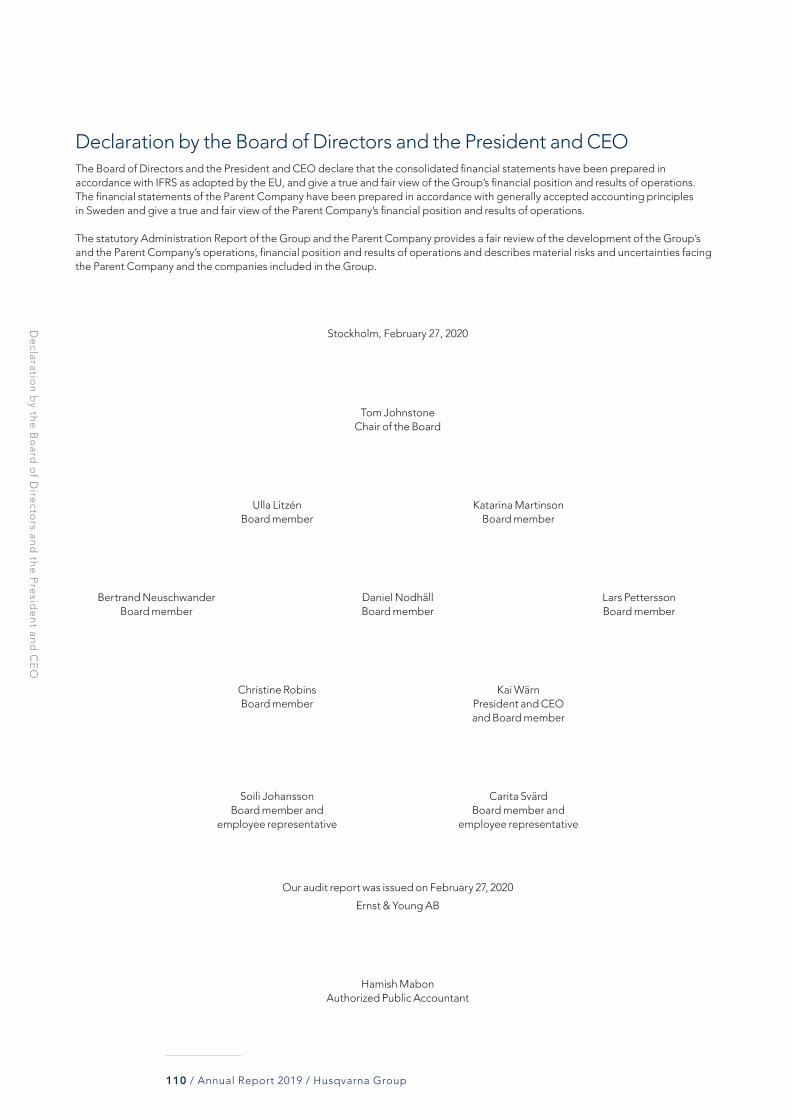
De
claration
by th
e B
oard
of D
irecto
rs and
the
Pre
side
nt an
d C
EO
110 / Annual Report 2019 / Husqvarna Group
Declaration by the Board of Directors and the President and CEOThe Board of Directors and the President and CEO declare that the consolidated financial statements have been prepared in accordance with IFRS as adopted by the EU, and give a true and fair view of the Group’s financial position and results of operations. The financial statements of the Parent Company have been prepared in accordance with generally accepted accounting principles in Sweden and give a true and fair view of the Parent Company’s financial position and results of operations.
The statutory Administration Report of the Group and the Parent Company provides a fair review of the development of the Group’s and the Parent Company’s operations, financial position and results of operations and describes material risks and uncertainties facing the Parent Company and the companies included in the Group.
Stockholm, February 27, 2020
Tom JohnstoneChair of the Board
Ulla Litzén Katarina MartinsonBoard member Board member
Bertrand Neuschwander Daniel Nodhäll Lars PetterssonBoard member Board member Board member
Christine Robins Kai WärnBoard member President and CEO
and Board member
Soili Johansson Carita SvärdBoard member and
employee representativeBoard member and
employee representative
Our audit report was issued on February 27, 2020
Ernst & Young AB
Hamish MabonAuthorized Public Accountant


Au
dito
r’s rep
ort
112 / Annual Report 2019 / Husqvarna Group
Auditor’s reportTo the general meeting of the shareholders of Husqvarna AB (publ), org nr 556000-5331
Report on the annual accounts and consolidated accountsOpinionsWe have audited the annual accounts and consolidated accounts of Husqvarna AB (publ) for the year 2019. The annual accounts and consolidated accounts of the company are included on pages 41–110 in this document.
In our opinion, the annual accounts have been prepared in accordance with the Annual Accounts Act and present fairly, in all material respects, the financial position of the parent company as of 31 December 2019 and its financial performance and cash flow for the year then ended in accordance with the Annual Accounts Act. The consolidated accounts have been prepared in accor-dance with the Annual Accounts Act and present fairly, in all mate-rial respects, the financial position of the group as of 31 Decem-ber 2019 and their financial performance and cash flow for the year then ended in accordance with International Financial Reporting Standards (IFRS), as adopted by the EU, and the Annual Accounts Act.
A corporate governance statement has been prepared. The statutory administration report and the corporate governance statement are consistent with the other parts of the annual accounts and consolidated accounts, and the corporate gover-nance statement is in accordance with the Annual Accounts Act.
We therefore recommend that the general meeting of share-holders adopts the income statement and balance sheet for the parent company and the group.
Our opinions in this report on the annual accounts and consoli-dated accounts are consistent with the content of the additional report that has been submitted to the parent company’s audit com-mittee in accordance with the Audit Regulation (537/2014) Article 11.
Basis for OpinionsWe conducted our audit in accordance with International Stan-dards on Auditing (ISA) and generally accepted auditing stan-dards in Sweden. Our responsibilities under those standards are further described in the Auditor’s Responsibilities section. We are independent of the parent company and the group in accordance with professional ethics for accountants in Sweden and have other wise fulfilled our ethical responsibilities in accordance with these requirements. This includes that, based on the best of our knowledge and belief, no prohibited services referred to in the Audit Regulation (537/2014) Article 5.1 have been provided to the audited company or, where applicable, its parent company or its controlled companies within the EU.
We believe that the audit evidence we have obtained is suffi-cient and appropriate to provide a basis for our opinions.
Key Audit MattersKey audit matters of the audit are those matters that, in our pro-fessional judgment, were of most significance in our audit of the annual accounts and consolidated accounts of the current period. These matters were addressed in the context of our audit of, and in forming our opinion thereon, the annual accounts and consoli-dated accounts as a whole, but we do not provide a separate opinion on these matters. For each matter below, our description of how our audit addressed the matter is provided in that context.
We have fulfilled the responsibilities described in the Auditor’s responsibilities for the audit of the financial statements section of our report, including in relation to these matters. Accordingly, our audit included the performance of procedures designed to
respond to our assessment of the risks of material misstatement of the financial statements. The results of our audit procedures, including the procedures performed to address the matters below, provide the basis for our audit opinion on the accompanying finan-cial statements.
Valuation and Existence of Inventory DescriptionInventory represents a significant portion of the total assets of the Group. The value of inventory, net of provisions for obsolescence, as of December 31, 2019, was 10.9 billion SEK. The Group’s inven-tory is carried at the lower of the acquisition value in accordance with the weighted average cost formula and the net realizable value. The net realizable value reflects the estimated write-down for older articles, physically damaged goods, excess inventory and selling expenses. The Group’s pronounced seasonality in sales together with weather-dependent products increase the dif-ficulty in estimating the value of inventory. We have consequently assessed that valuation and existence of inventory represents a key audit matter. Additional information regarding provisions for obsolescence as well as the portion of inventory which are carried at net realizable value after selling expenses are disclosed in group note 17 (“Inventory”).
How our audit addressed this key audit matterThe existence of inventory is addressed in all entities that hold inventory. We have attended stock counts for all material inven-tory locations. We have performed audit procedures on the acquisition value of all inventories, from components to finished goods. Our audit to determine that inventory has been carried at the lower of acquisition value and net realizable value is performed by means of reviewing inventory aging as well as inventory turn-over for each respective product grouping as well as by means of review of obsolete items. At the group level we have furthermore performed audit procedures related to the reserve for internal profits in inventory.
Impairment tests of goodwill and other assets with indefinite livesDescriptionGoodwill and other assets with indefinite useful lives amounted to 10.7 billion SEK as of December 31, 2019. Management conducts impairment tests annually as well as in cases where impairment indicators have been identified. The recoverable amount for each cash generating unit is determined as the value in use, which is computed under the discounted cash flow method based of fore-casted future results. Key assumptions in these computations are expected growth, margin and appropriate discount rates. The impairment test process is to its nature based on assumptions and judgements, not least due to it being based on estimates of the future developments in the market and other financial factors that are affected by expected future market or economic condi-tions. The underlying computations are furthermore complex. We have consequently assessed that goodwill and other assets with indefinite lives represent a key audit matter.
How our audit addressed this key audit matterAs part of our audit we have assessed and audited key parameters, the application of acknowledged valuation theory, the discount rate (referred to as WACC – ”Weighted Average Cost of Capital”) and

Au
dito
r’s rep
ort
113 / Annual Report 2019 / Husqvarna Group
other source data that has been applied by the Group. We have for instance compared parameters applied to external data sources, such as expected inflation or assessments of future market growth and have assessed the sensitivity of the Group’s valuation model. We have included valuation specialists in our audit team in order to perform this work. Specific emphasis has been placed on the sensi-tivity of the computations, including performing an independent assessment of whether there is a risk that reasonable likely events could give rise to a situation where the recoverable amount would be lower than the carrying amount. This assessment has also addressed the Group’s historical success at prognostication.
We have finally assessed the appropriateness of disclosures in Group note 14 (“Intangible assets”), in particular with regards to the disclosures provided as to key sensitivities when computing the value in use.
Income taxesDescriptionThe Group conducts its operations in a significant amount of tax jurisdictions, all of which have their own rules and legislation regarding cross-border transactions. Consequently, the Group is subject to audits by local tax authorities in each country where they conduct operations. The parent company is the key party in a so-called principal structure and thus holds a number of patents, trademarks and similar assets. From time to time entities within the Group are subject to ongoing tax proceedings that may range from tax audits to tax litigation at multiple levels of the court sys-tems. Tax liabilities, which to their nature are based on estimation, are material. Income taxes represent a key audit matter in that the underlying issues are complex, they are inherently judgmental, and the amounts involved are material.
How our audit addressed this key audit matterWe have audited the completeness and valuation of the amounts recorded as both current and deferred income taxes, including uncertain tax positions. For such matters we have as part of our audit procedures assessed communication with the tax authori-ties as well as performing an independent assessment of whether a provision is required or not. With regards to deferred tax assets we have reviewed the Group’s assessments as to whether the car-rying amount is expected to be realized by means of taxable income in the future, where tax planning opportunities may be considered. We have included tax professionals at both a corpo-rate level and for the cross-border level in order to analyze and test the assumptions made upon reaching the Group’s tax posi-tions, including – as appropriate – validation of assumptions by obtaining audit evidence. As part of our audit we have used the Group’s projections/assessments as well as applying our own understanding of each relevant tax legislation. We have – where relevant – assess the Group’s historical ability to prognosticate the outcome of income tax matters. Finally, we have assessed the appropriateness of disclosures provided in group note 2 (“Key estimates and assumptions”) as well as Group note 10 (“Tax”).
Other Information than the annual accounts and consolidated accountsThis document also contains other information than the annual accounts and consolidated accounts and is found on pages
1–40 and 115–124. The Board of Directors and the Managing Director are responsible for this other information.
Our opinion on the annual accounts and consolidated accounts does not cover this other information and we do not express any form of assurance conclusion regarding this other information.
In connection with our audit of the annual accounts and con-solidated accounts, our responsibility is to read the information identified above and consider whether the information is materi-ally inconsistent with the annual accounts and consolidated accounts. In this procedure we also take into account our knowl-edge otherwise obtained in the audit and assess whether the information otherwise appears to be materially misstated.
If we, based on the work performed concerning this informa-tion, conclude that there is a material misstatement of this other information, we are required to report that fact. We have nothing to report in this regard.
Responsibilities of the Board of Directors and the Managing DirectorThe Board of Directors and the Managing Director are responsible for the preparation of the annual accounts and consolidated accounts and that they give a fair presentation in accordance with the Annual Accounts Act and, concerning the consolidated accounts, in accordance with IFRS as adopted by the EU. The Board of Directors and the Managing Director are also responsible for such internal control as they determine is necessary to enable the preparation of annual accounts and consolidated accounts that are free from material misstatement, whether due to fraud or error.
In preparing the annual accounts and consolidated accounts, The Board of Directors and the Managing Director are responsi-ble for the assessment of the company’s and the group’s ability to continue as a going concern. They disclose, as applicable, mat-ters related to going concern and using the going concern basis of accounting. The going concern basis of accounting is however not applied if the Board of Directors and the Managing Director intends to liquidate the company, to cease operations, or has no realistic alternative but to do so.
The Audit Committee shall, without prejudice to the Board of Director’s responsibilities and tasks in general, among other things oversee the company’s financial reporting process.
Auditor’s responsibilityOur objectives are to obtain reasonable assurance about whether the annual accounts and consolidated accounts as a whole are free from material misstatement, whether due to fraud or error, and to issue an auditor’s report that includes our opinions. Rea-sonable assurance is a high level of assurance, but is not a guaran-tee that an audit conducted in accordance with ISAs and gener-ally accepted auditing standards in Sweden will always detect a material misstatement when it exists. Misstatements can arise from fraud or error and are considered material if, individually or in the aggregate, they could reasonably be expected to influence the economic decisions of users taken on the basis of these annual accounts and consolidated accounts.
As part of an audit in accordance with ISAs, we exercise profes-sional judgment and maintain professional scepticism throughout the audit. We also:• Identify and assess the risks of material misstatement of the
annual accounts and consolidated accounts, whether due to fraud or error, design and perform audit procedures responsive to those risks, and obtain audit evidence that is sufficient and appropriate to provide a basis for our opinions. The risk of not detecting a material misstatement resulting from fraud is higher than for one resulting from error, as fraud may involve collusion, forgery, intentional omissions, misrepresentations, or the override of internal control.
• Obtain an understanding of the company’s internal control rel-evant to our audit in order to design audit procedures that are appropriate in the circumstances, but not for the purpose of expressing an opinion on the effectiveness of the company’s internal control.
• Evaluate the appropriateness of accounting policies used and the reasonableness of accounting estimates and related disclo-sures made by the Board of Directors and the Managing Director.
• Conclude on the appropriateness of the Board of Directors’ and the Managing Director’s use of the going concern basis of accounting in preparing the annual accounts and consolidated accounts. We also draw a conclusion, based on the audit evi-dence obtained, as to whether any material uncertainty exists related to events or conditions that may cast significant doubt on the company’s and the group’s ability to continue as a going
Au
dito
r’s rep
ort
114 / Annual Report 2019 / Husqvarna Group
concern. If we conclude that a material uncertainty exists, we are required to draw attention in our auditor’s report to the related disclosures in the annual accounts and consolidated accounts or, if such disclosures are inadequate, to modify our opinion about the annual accounts and consolidated accounts. Our conclusions are based on the audit evidence obtained up to the date of our auditor’s report. However, future events or conditions may cause a company and a group to cease to con-tinue as a going concern.
• Evaluate the overall presentation, structure and content of the annual accounts and consolidated accounts, including the dis-closures, and whether the annual accounts and consolidated accounts represent the underlying transactions and events in a manner that achieves fair presentation.
• Obtain sufficient and appropriate audit evidence regarding the financial information of the entities or business activities within the group to express an opinion on the consolidated accounts. We are responsible for the direction, supervision and performance of the group audit. We remain solely responsible for our opinions.
We must inform the Board of Directors of, among other matters, the planned scope and timing of the audit. We must also inform of significant audit findings during our audit, including any signifi-cant deficiencies in internal control that we identified.
We must also provide the Board of Directors with a statement that we have complied with relevant ethical requirements regard-ing independence, and to communicate with them all relation-ships and other matters that may reasonably be thought to bear on our independence, and where applicable, related safeguards.
From the matters communicated with the Board of Directors, we determine those matters that were of most significance in the audit of the annual accounts and consolidated accounts, includ-ing the most important assessed risks for material misstatement, and are therefore the key audit matters. We describe these mat-ters in the auditor’s report unless law or regulation precludes dis-closure about the matter.
Report on other legal and regulatory requirementsOpinionsIn addition to our audit of the annual accounts and consolidated accounts, we have also audited the administration of the Board of Directors and the Managing Director of Husqvarna AB (publ) for the year 2019 and the proposed appropriations of the company’s profit or loss.
We recommend to the general meeting of shareholders that the profit be appropriated in accordance with the proposal in the statutory administration report and that the members of the Board of Directors and the Managing Director be discharged from liability for the financial year.
Basis for opinionsWe conducted the audit in accordance with generally accepted auditing standards in Sweden. Our responsibilities under those standards are further described in the Auditor’s Responsibilities section. We are independent of the parent company and the group in accordance with professional ethics for accountants in Sweden and have otherwise fulfilled our ethical responsibilities in accordance with these requirements.
We believe that the audit evidence we have obtained is suffi-cient and appropriate to provide a basis for our opinions.
Responsibilities of the Board of Directors and the Managing DirectorThe Board of Directors is responsible for the proposal for appro-priations of the company’s profit or loss. At the proposal of a divi-dend, this includes an assessment of whether the dividend is justi-fiable considering the requirements which the company’s and the group’s type of operations, size and risks place on the size of the parent company’s and the group’s equity, consolidation require-ments, liquidity and position in general.
The Board of Directors is responsible for the company’s orga-nization and the administration of the company’s affairs. This includes among other things continuous assessment of the com-pany’s and the group’s financial situation and ensuring that the company’s organization is designed so that the accounting, man-agement of assets and the company’s financial affairs otherwise are controlled in a reassuring manner. The Managing Director shall manage the ongoing administration according to the Board of Directors’ guidelines and instructions and among other mat-ters take measures that are necessary to fulfill the company’s accounting in accordance with law and handle the management of assets in a reassuring manner.
Auditor’s responsibilityOur objective concerning the audit of the administration, and thereby our opinion about discharge from liability, is to obtain audit evidence to assess with a reasonable degree of assurance whether any member of the Board of Directors or the Managing Director in any material respect:• has undertaken any action or been guilty of any omission which
can give rise to liability to the company, or• in any other way has acted in contravention of the Companies
Act, the Annual Accounts Act or the Articles of Association.
Our objective concerning the audit of the proposed appropria-tions of the company’s profit or loss, and thereby our opinion about this, is to assess with reasonable degree of assurance whether the proposal is in accordance with the Companies Act.
Reasonable assurance is a high level of assurance, but is not a guarantee that an audit conducted in accordance with generally accepted auditing standards in Sweden will always detect actions or omissions that can give rise to liability to the company, or that the proposed appropriations of the company’s profit or loss are not in accordance with the Companies Act.
As part of an audit in accordance with generally accepted auditing standards in Sweden, we exercise professional judgment and maintain professional scepticism throughout the audit. The examination of the administration and the proposed appropria-tions of the company’s profit or loss is based primarily on the audit of the accounts. Additional audit procedures performed are based on our professional judgment with starting point in risk and mate-riality. This means that we focus the examination on such actions, areas and relationships that are material for the operations and where deviations and violations would have particular importance for the company’s situation. We examine and test decisions under-taken, support for decisions, actions taken and other circum-stances that are relevant to our opinion concerning discharge from liability. As a basis for our opinion on the Board of Directors’ proposed appropriations of the company’s profit or loss we exam-ined the Board of Directors’ reasoned statement and a selection of supporting evidence in order to be able to assess whether the proposal is in accordance with the Companies Act.
Ernst & Young AB with Hamish Mabon as main responsible partner, P.O Box 7850 SE-103 99 Stockholm, was appointed audi-tor of Husqvarna AB by the general meeting of the shareholders on the April 9, 2019 and has been the company’s auditor since the April 10, 2014.
Stockholm February 27, 2020Ernst & Young AB
Hamish MabonAuthorized Public Accountant

Allo
cation
of th
e C
on
sum
er B
rand
s Divisio
n
115 / Annual Report 2019 / Husqvarna Group
Allocation of the Consumer Brands Division
The Consumer Brands Division is reported as a separate division for 2018, but has been dissolved and integrated into the Husqvarna and Gardena divisions as of January 1, 2019. The European part, that accounted for approximately 15% Consumer Brands net sales, has been included in the Gardena Division and the remaining 85%, mainly related
to North America, has been included in the Husqvarna Division. The segment reporting in 2019 will consist of three divisions: Husqvarna, Gardena and Construction. A restatement of the segment reporting in the new structure is presented below.
Husqvarna
SEKmQ1
2018Allocation
of CBDQ1 2018 restated
Q2 2018
Allocation of CBD
Q2 2018 restated
Q3 2018
Allocation of CBD
Q3 2018 restated
Net sales 6,049 2,435 8,484 6,719 2,628 9,347 3,689 1,326 5,015
Operating income 1,070 –26 1,044 1,201 –47 1,154 –19 –325 –344 Excl. items affecting
comparability * 1,070 –26 1,044 1,201 –47 1,154 47 –62 –15
Operating margin, % 17.7 12.3 17.9 12.3 –0.5 –6.9
Excl. items affecting comparability * 17.7 12.3 17.9 12.3 1.3 –0.3
Assets 15,948 5,593 21,541 15,155 5,214 20,369 13,669 4,073 17,742
Liabilities 5,301 1,562 6,863 4,856 1,442 6,298 3,707 884 4,591
Net Assets 10,647 4,031 14,678 10,299 3,772 14,071 9,962 3,189 13,151
SEKmQ4
2018Allocation
of CBDQ4 2018 restated
Full-year 2018
Allocation of CBD
Full-year 2018 restated
Net sales 3,323 987 4,310 19,780 7,376 27,156
Operating income –140 –486 –626 2,112 –884 1,228 Excl. items affecting comparability * –41 –36 –77 2,277 –171 2,106
Operating margin, % –4.2 –14.5 10.7 4.5
Excl. items affecting comparability * –1.2 –1.8 11.5 7.8
Assets 14,647 4,054 18,701 14,647 4,054 18,701
Liabilities 4,100 1,220 5,320 4,100 1,220 5,320
Net Assets 10,547 2,834 13,381 10,547 2,834 13,381
SEKmQ1
2017 1Allocation
of CBDQ1 2017 restated
Q2 20171
Allocation of CBD
Q2 2017 restated
Q3 2017 1
Allocation of CBD
Q3 2017 restated
Net sales 6,136 3,102 9,238 6,164 2,703 8,867 3,669 1,262 4,931
Operating income 1,032 22 1,054 1,180 70 1,250 388 –47 341Operating margin, % 16.8 11.4 19.1 14.1 10.6 6.9
Assets 14,883 6,184 21,067 13,470 4,788 18,258 12,018 4,337 16,355
Liabilities 4,776 1,744 6,520 4,224 1,464 5,688 3,395 980 4,375
Net Assets 10,107 4,440 14,547 9,246 3,324 12,570 8,623 3,357 11,980
SEKmQ4
2017 1Allocation
of CBDQ4 2017 restated
Full-year 2017 1
Allocation of CBD
Full-year 2017 restated
Net sales 3,240 945 4,185 19,209 8,012 27,221
Operating income 127 –56 71 2,727 –11 2,716Operating margin, % 3.9 1.7 14.2 10.0
Assets 12,741 4,430 17,171 12,741 4,430 17,171
Liabilities 3,856 1,025 4,881 3,856 1,025 4,881
Net Assets 8,885 3,405 12,290 8,885 3,405 12,290
SEKmFull-year
2015Allocation
of CBD
Full-year 2015
restatedFull-year
2016Allocation
of CBDFull-year 2016
restatedNet sales 17,624 8,174 25,798 17,960 7,325 25,285
Operating income 2,233 65 2,298 2,317 71 2,388 Excl. items affecting comparability * 2,284 89 2,373 2,317 71 2,388
Operating margin, % 12.7 8.9 12.9 9.4
Excl. items affecting comparability * 13.0 9.2 12.9 9.4
Assets 10,917 4,135 15,052 12,317 4,947 17,264
Liabilities 3,021 1,091 4,112 3,642 1,414 5,056
Net Assets 7,896 3,044 10,940 8,675 3,533 12,208
* Alternative Performance Measure, refer to the section “Definitions” for further information.
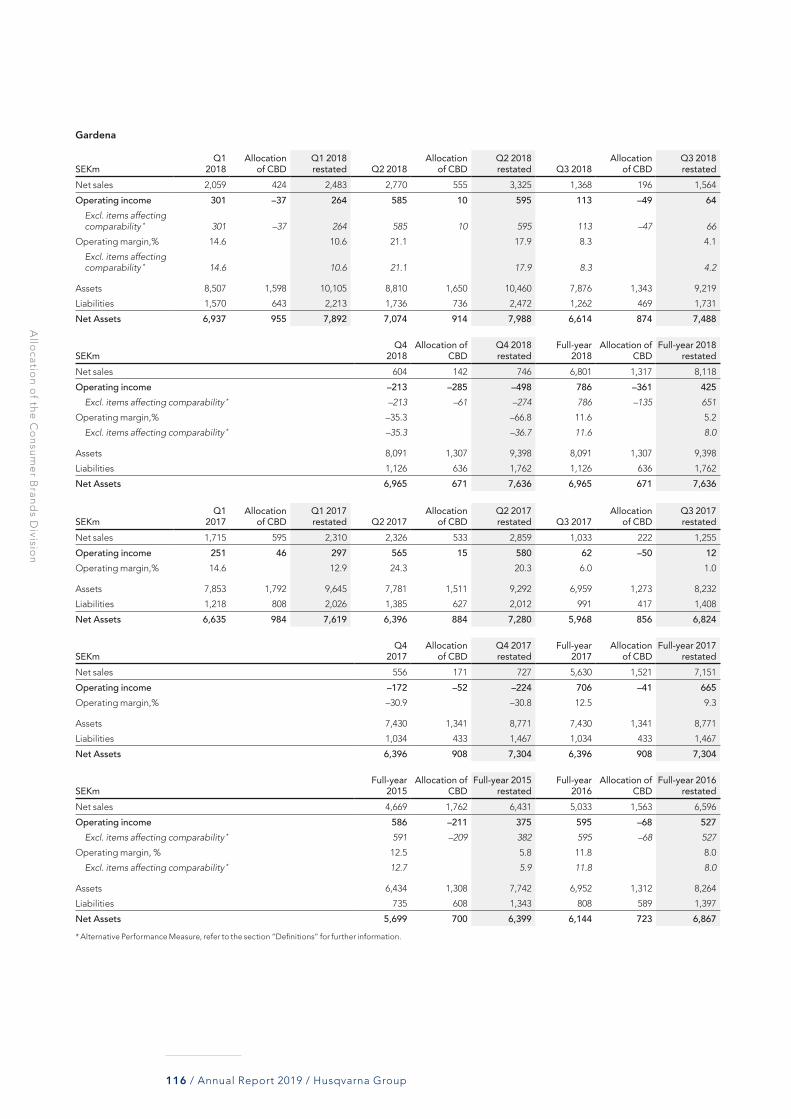
Allo
cation
of th
e C
on
sum
er B
rand
s Divisio
n
116 / Annual Report 2019 / Husqvarna Group
Gardena
SEKmQ1
2018Allocation
of CBDQ1 2018 restated Q2 2018
Allocation of CBD
Q2 2018 restated Q3 2018
Allocation of CBD
Q3 2018 restated
Net sales 2,059 424 2,483 2,770 555 3,325 1,368 196 1,564
Operating income 301 –37 264 585 10 595 113 –49 64 Excl. items affecting
comparability * 301 –37 264 585 10 595 113 –47 66
Operating margin,% 14.6 10.6 21.1 17.9 8.3 4.1
Excl. items affecting comparability * 14.6 10.6 21.1 17.9 8.3 4.2
Assets 8,507 1,598 10,105 8,810 1,650 10,460 7,876 1,343 9,219
Liabilities 1,570 643 2,213 1,736 736 2,472 1,262 469 1,731
Net Assets 6,937 955 7,892 7,074 914 7,988 6,614 874 7,488
SEKmQ4
2018Allocation of
CBDQ4 2018 restated
Full-year 2018
Allocation of CBD
Full-year 2018 restated
Net sales 604 142 746 6,801 1,317 8,118
Operating income –213 –285 –498 786 –361 425 Excl. items affecting comparability * –213 –61 –274 786 –135 651
Operating margin,% –35.3 –66.8 11.6 5.2
Excl. items affecting comparability * –35.3 –36.7 11.6 8.0
Assets 8,091 1,307 9,398 8,091 1,307 9,398
Liabilities 1,126 636 1,762 1,126 636 1,762
Net Assets 6,965 671 7,636 6,965 671 7,636
SEKmQ1
2017Allocation
of CBDQ1 2017 restated Q2 2017
Allocation of CBD
Q2 2017 restated Q3 2017
Allocation of CBD
Q3 2017 restated
Net sales 1,715 595 2,310 2,326 533 2,859 1,033 222 1,255
Operating income 251 46 297 565 15 580 62 –50 12Operating margin,% 14.6 12.9 24.3 20.3 6.0 1.0
Assets 7,853 1,792 9,645 7,781 1,511 9,292 6,959 1,273 8,232
Liabilities 1,218 808 2,026 1,385 627 2,012 991 417 1,408
Net Assets 6,635 984 7,619 6,396 884 7,280 5,968 856 6,824
SEKmQ4
2017Allocation
of CBDQ4 2017 restated
Full-year 2017
Allocation of CBD
Full-year 2017 restated
Net sales 556 171 727 5,630 1,521 7,151
Operating income –172 –52 –224 706 –41 665Operating margin,% –30.9 –30.8 12.5 9.3
Assets 7,430 1,341 8,771 7,430 1,341 8,771
Liabilities 1,034 433 1,467 1,034 433 1,467
Net Assets 6,396 908 7,304 6,396 908 7,304
SEKmFull-year
2015Allocation of
CBDFull-year 2015
restatedFull-year
2016Allocation of
CBDFull-year 2016
restatedNet sales 4,669 1,762 6,431 5,033 1,563 6,596
Operating income 586 –211 375 595 –68 527 Excl. items affecting comparability * 591 –209 382 595 –68 527
Operating margin, % 12.5 5.8 11.8 8.0
Excl. items affecting comparability * 12.7 5.9 11.8 8.0
Assets 6,434 1,308 7,742 6,952 1,312 8,264
Liabilities 735 608 1,343 808 589 1,397
Net Assets 5,699 700 6,399 6,144 723 6,867
* Alternative Performance Measure, refer to the section “Definitions” for further information.

De
finitio
ns
117 / Annual Report 2019 / Husqvarna Group
DefinitionsThis report includes financial measures as required by the financial reporting framework applicable to Husqvarna Group, which is based on IFRS. In addition, there are other measures (alternative performance measures) used by management and other stakeholders to analyze trends and performance of the Group’s operations that cannot be directly read or derived from the financial statements. Husqvarna stake-holders should not consider these as substitutes, but rather as addi-tions, to the financial reporting measures prepared in accordance with IFRS. Please note that the alternative performance measures as defined, may not be comparable to similarly titled measures used by other com-panies. Refer below for a list of definitions of all measures and indicators used, referred to and presented in this report.
Computation of average amountsIn computation of key ratios where averages of capital balances are included, the average capital balances are based on the opening bal-ance and all quarter-end closing balances included in the reporting period, i.e five quarters.
Growth measuresNet sales adjusted for changes in exchange ratesChange in net sales adjusted for currency translation effects. Net sales are also disclosed adjusted for currency translation effects as Husqvarna Group is a global company generating significant transac-tions in other currencies than the reporting currency (SEK) and the cur-rency rates have proven to be volatile.
Net sales growthChange in net sales compared to previous period in percent.
Organic growthChange in net sales, adjusted for acquisitions, divestments and cur-rency translation effects.
Profitability measuresEBITDAEBITDA is a measure of earnings before interest, taxes, depreciation, amortization and impairment charges. EBITDA measures Husqvarna Group’s operating performance and the ability to generate cash from operations, without considering the capital structure of the Group or its fiscal environment. For a reconciliation of EBITDA refer to table below the income statement.
EBITDA marginEBITDA as a percentage of net sales.
Gross marginGross income as a percentage of net sales.
Last twelve months (LTM)Last twelve months rolling has been included to assist stakeholders in their analysis of the seasonality that the Husqvarna Group’s business is exposed to.
Operating marginOperating income as a percentage of net sales.
Return on capital employedOperating income plus financial income (last twelve months) as a per-centage of average capital employed.
Return on equityNet income attributable to equity holders of the Parent Company last twelve months as a percentage of average equity attributable to equity holders of the Parent Company.
Share-based measuresEarnings per share, after dilutionNet income attributable to equity holders of the Parent Company divided by the weighted average number of shares outstanding (net of treasury shares), after dilution.
Equity per share, after dilutionEquity attributable to equity holders of the Parent Company divided by the weighted average number of shares outstanding (net of treasury shares), after dilution.
Capital indicatorsCapital employedTotal equity and liabilities less non-interest-bearing debt including deferred tax liabilities.
Capital expenditureInvestments in property, plant and equipment, right of use assets and intangible assets.
Interest bearing liabilitiesLong-term and short-term borrowings, net pension liability and fair value derivative liabilities.
Liquid fundsCash and cash equivalents, short-term investments and fair value deriv-ative assets.
Net assetsTotal assets excluding liquid funds and interest-bearing assets less operating liabilities, non-interest-bearing provisions and deferred tax liabilities.
Net debtNet debt describes the Group’s gearing and its ability to repay its debts from cash generated from the Group´s ordinary business (see operating cash flow below), if they were all due today. It’s also used to analyze how future net interest costs will impact earnings. Net debt is defined as total interest-bearing liabilities plus dividend payable, less liquid funds and interest-bearing assets. For a reconciliation of net debt refer to table below the balance sheet.
Operating working capitalInventories and trade receivables less trade payables.
Capital measuresEquity/assets ratioEquity attributable to equity holders of the Parent Company as a per-centage of total assets.
Capital turnover rateNet sales last twelve months divided with average net assets.
Net debt/EBITDA excl. items affecting comparability Average net debt in relation to EBITDA last twelve months, excluding items affecting comparability.
Net debt/equity ratioNet debt in relation to total equity.
Operating working capital/net salesAverage operating working capital as a percentage of net sales last twelve months.
Other measuresDirect operating cash flowDirect operating cash flow is a measure of the cash generated by the Groups operating business. The measure is defined as EBITDA, exclud-ing items affecting comparability, adjusted for change in trade payables, inventory and trade receivables and investments in property, plant and equipment and intangible assets. For a reconciliation of direct operat-ing cash flow refer to the table below the cash flow statement.
Items affecting comparabilityTo assist in understanding Husqvarna Group’s operations, we believe that it is useful to consider certain measures and ratios exclusive of items affecting comparability. Items affecting comparability includes items that are non-recurring, have a significant impact and are consid-ered to be important for understanding the operating performance when comparing results between periods. The items affecting compara-bility are disclosed on page 43. All measures and ratios in this report have been disclosed including items affecting comparability first and then excluding items affecting comparability as a second measure when deemed appropriate.
Operating cash flowOperating cash flow is a measure of the amount of cash generated by the Group’s ordinary business operations. The measure is defined as total cash flow from operations and investments, excluding acquisitions and divestments of subsidiaries/operations, divestments of property plant and equipment and investments/divestments of financial assets. For a reconciliation of operating cash flow refer to table below the cash flow statement.
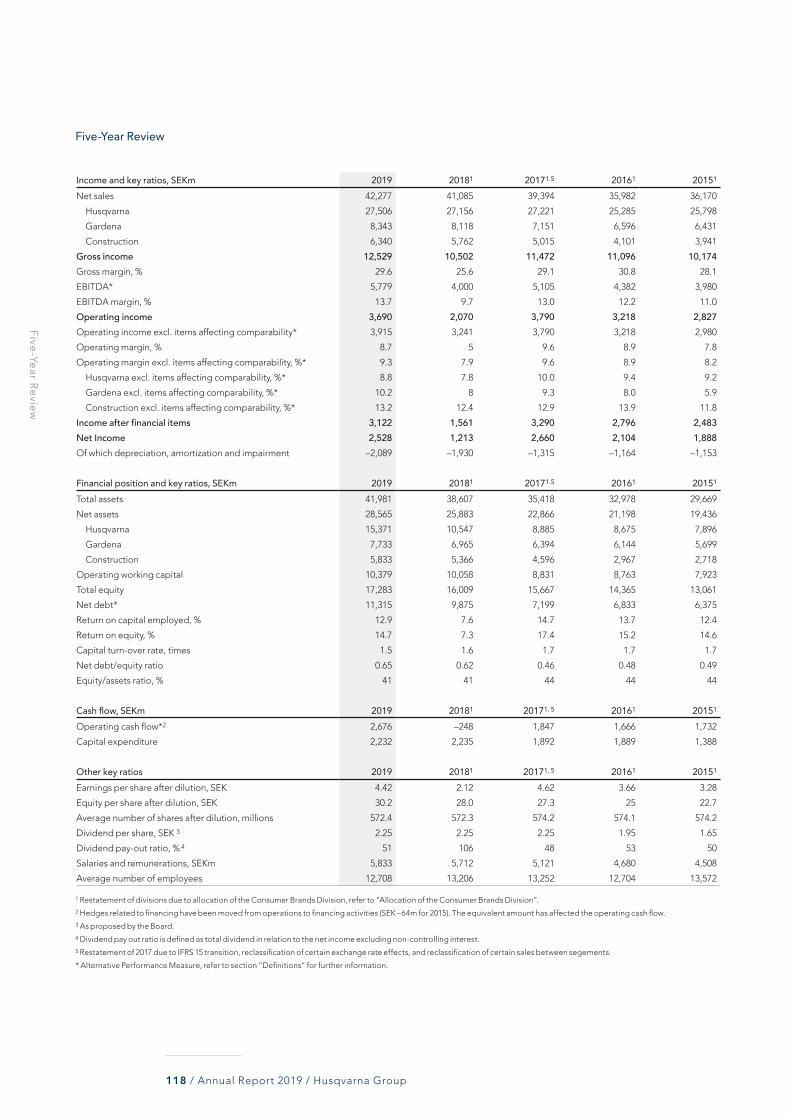
Five
-Year R
evie
w
118 / Annual Report 2019 / Husqvarna Group
Five-Year Review
Income and key ratios, SEKm 2019 20181 20171.5 20161 20151
Net sales 42,277 41,085 39,394 35,982 36,170
Husqvarna 27,506 27,156 27,221 25,285 25,798
Gardena 8,343 8,118 7,151 6,596 6,431
Construction 6,340 5,762 5,015 4,101 3,941
Gross income 12,529 10,502 11,472 11,096 10,174Gross margin, % 29.6 25.6 29.1 30.8 28.1
EBITDA* 5,779 4,000 5,105 4,382 3,980
EBITDA margin, % 13.7 9.7 13.0 12.2 11.0
Operating income 3,690 2,070 3,790 3,218 2,827Operating income excl. items affecting comparability* 3,915 3,241 3,790 3,218 2,980
Operating margin, % 8.7 5 9.6 8.9 7.8
Operating margin excl. items affecting comparability, %* 9.3 7.9 9.6 8.9 8.2
Husqvarna excl. items affecting comparability, %* 8.8 7.8 10.0 9.4 9.2
Gardena excl. items affecting comparability, %* 10.2 8 9.3 8.0 5.9
Construction excl. items affecting comparability, %* 13.2 12.4 12.9 13.9 11.8
Income after financial items 3,122 1,561 3,290 2,796 2,483Net Income 2,528 1,213 2,660 2,104 1,888Of which depreciation, amortization and impairment –2,089 –1,930 –1,315 –1,164 –1,153
Financial position and key ratios, SEKm 2019 20181 20171.5 20161 20151
Total assets 41,981 38,607 35,418 32,978 29,669
Net assets 28,565 25,883 22,866 21,198 19,436
Husqvarna 15,371 10,547 8,885 8,675 7,896
Gardena 7,733 6,965 6,394 6,144 5,699
Construction 5,833 5,366 4,596 2,967 2,718
Operating working capital 10,379 10,058 8,831 8,763 7,923
Total equity 17,283 16,009 15,667 14,365 13,061
Net debt* 11,315 9,875 7,199 6,833 6,375
Return on capital employed, % 12.9 7.6 14.7 13.7 12.4
Return on equity, % 14.7 7.3 17.4 15.2 14.6
Capital turn-over rate, times 1.5 1.6 1.7 1.7 1.7
Net debt/equity ratio 0.65 0.62 0.46 0.48 0.49
Equity/assets ratio, % 41 41 44 44 44
Cash flow, SEKm 2019 20181 20171, 5 20161 20151
Operating cash flow*2 2,676 –248 1,847 1,666 1,732
Capital expenditure 2,232 2,235 1,892 1,889 1,388
Other key ratios 2019 20181 20171, 5 20161 20151
Earnings per share after dilution, SEK 4.42 2.12 4.62 3.66 3.28
Equity per share after dilution, SEK 30.2 28.0 27.3 25 22.7
Average number of shares after dilution, millions 572.4 572.3 574.2 574.1 574.2
Dividend per share, SEK 3 2.25 2.25 2.25 1.95 1.65
Dividend pay-out ratio, % 4 51 106 48 53 50
Salaries and remunerations, SEKm 5,833 5,712 5,121 4,680 4,508
Average number of employees 12,708 13,206 13,252 12,704 13,572
1 Restatement of divisions due to allocation of the Consumer Brands Division, refer to “Allocation of the Consumer Brands Division”. 2 Hedges related to financing have been moved from operations to financing activities (SEK –64m for 2015). The equivalent amount has affected the operating cash flow.3 As proposed by the Board.4 Dividend pay out ratio is defined as total dividend in relation to the net income excluding non-controlling interest.5 Restatement of 2017 due to IFRS 15 transition, reclassification of certain exchange rate effects, and reclassification of certain sales between segements.
* Alternative Performance Measure, refer to section “Definitions” for further information.

Qu
arterly D
ata
119 / Annual Report 2019 / Husqvarna Group
Quarterly Data
Income, SEKm Year Q1 Q2 Q3 Q4 Full-yearNet sales 2019 13,651 13,789 8,429 6,408 42,277
2018 12,303 14,270 8,042 6,470 41,085
2017 12,746 13,069 7,449 6,130 39,394
Operating income 2019 1,644 2,125 414 –493 3,690
2018 1,373 1,925 –124 –1,104 2,070
2017 1,425 2,002 433 –70 3,790
Operating income excl. items affecting comparability* 2019 1,686 2,125 414 –310 3,915
2018 1,373 1,925 225 –282 3,241
2017 1,425 2,002 433 –70 3,790
Operating margin excl. items affecting comparability, %* 2019 12.3 15.4 4.9 –4.8 9.3
2018 11.2 13.5 2.8 –4.4 5.0
2017 11.2 15.3 5.8 –1.1 9.6
Income for the period 2019 1,140 1,506 269 –387 2,528
2018 940 1,380 –185 –922 1,213
2017 988 1,401 210 61 2,660
Earnings per share after dilution, SEK 2019 1.99 2.63 0.47 –0.67 4.42
2018 1.64 2.41 –0.32 –1.61 2.12
2017 1.72 2.43 0.37 0.1 4.62
Financial position, SEKm Year Q1 Q2 Q3 Q4 Full-yearNet debt* 2019 13,548 11,340 11,609 11,315 11,315
2018 9,198 8,862 8,040 9,875 9,875
2017 9,800 7,602 6,440 7,199 7,199
Operating working capital 2019 13,889 12,224 11,238 10,379 10,379
2018 12,243 12,069 10,107 10,058 10,058
2017 12,561 10,768 9,215 8,831 8,831
Net sales by Division, SEKm Year Q1 Q2 Q3 Q4 Full-yearHusqvarna 2019 9,506 8,688 5,204 4,108 27,506
20181, 2 8,484 9,347 5,015 4,310 27,156
2017 1, 2 9,238 8,867 4,931 4,185 27,221
Gardena 2019 2,630 3,373 1,630 710 8,343
2018 1, 2 2,483 3,325 1,564 746 8,118
2017 1, 2 2,310 2,859 1,255 727 7,151
Construction 2019 1,494 1,720 1,575 1,551 6,340
2018 1,328 1,590 1,446 1,398 5,762
2017 1,197 1,341 1,260 1,217 5,015
Operating margin by Division, % Year Q1 Q2 Q3 Q4 Full-yearHusqvarna 2019 12.5 14.0 1.6 –5.5 8.2
2018 1, 2 12.3 12.3 –6.9 –14.5 10.7
2017 1, 2 11.4 14.1 6.9 1.7 14.2
Gardena 2019 14.1 20.8 7.4 –49.0 10.2
2018 1, 2 10.6 17.9 4.1 –66.8 11.6
2017 1, 2 12.9 20.3 1.0 –30.8 12.5
Construction 2019 11.8 15.5 14.6 6.8 12.3
2018 11.9 15.8 13.3 5.0 11.7
2017 11.8 17.4 11.4 10.9 12.9
* Alternative Performance Measure, refer to section “Definitions” for further information.1 Restated due to reclassification of certain sales between segments. 2 Restatement due to allocation of the Consumer Brands Division, refer to “Allocation of the Consumer Brand Division”.
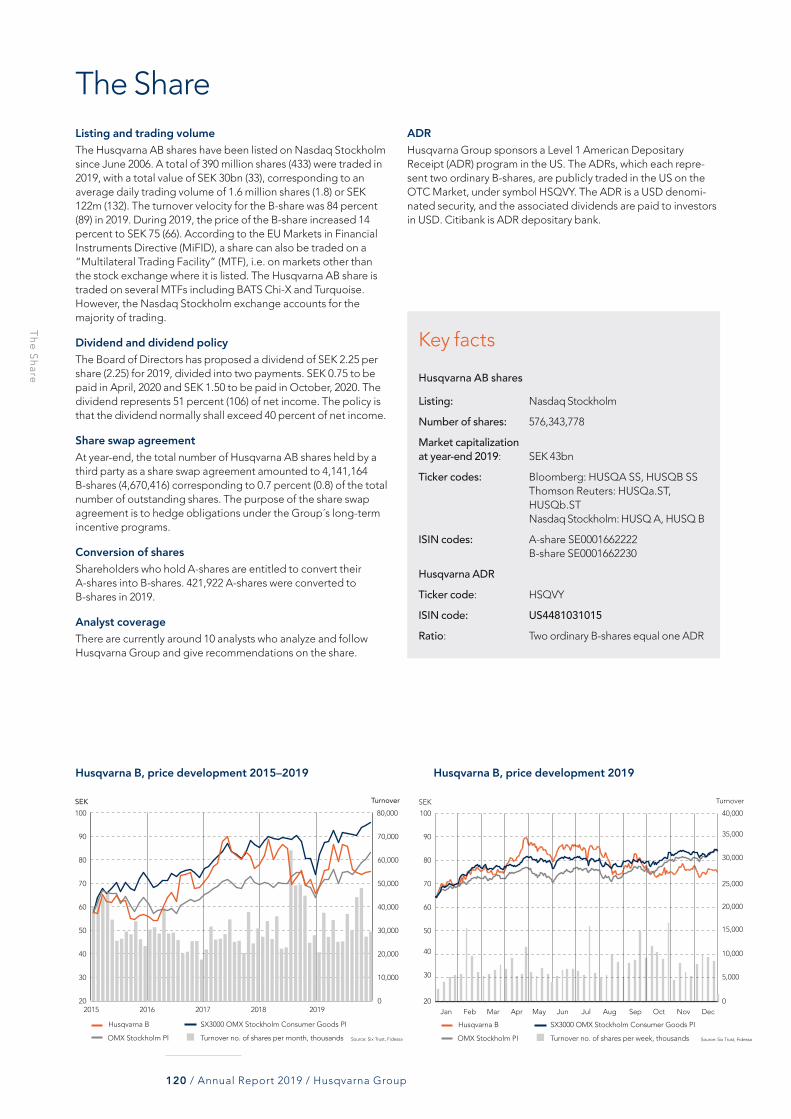
Th
e S
hare
120 / Annual Report 2019 / Husqvarna Group
Listing and trading volume The Husqvarna AB shares have been listed on Nasdaq Stockholm since June 2006. A total of 390 million shares (433) were traded in 2019, with a total value of SEK 30bn (33), corresponding to an average daily trading volume of 1.6 million shares (1.8) or SEK 122m (132). The turnover velocity for the B-share was 84 percent (89) in 2019. During 2019, the price of the B-share increased 14 percent to SEK 75 (66). According to the EU Markets in Financial Instruments Directive (MiFID), a share can also be traded on a “Multilateral Trading Facility” (MTF), i.e. on markets other than the stock exchange where it is listed. The Husqvarna AB share is traded on several MTFs including BATS Chi-X and Turquoise. However, the Nasdaq Stockholm exchange accounts for the majority of trading.
Dividend and dividend policy The Board of Directors has proposed a dividend of SEK 2.25 per share (2.25) for 2019, divided into two payments. SEK 0.75 to be paid in April, 2020 and SEK 1.50 to be paid in October, 2020. The dividend represents 51 percent (106) of net income. The policy is that the dividend normally shall exceed 40 percent of net income.
Share swap agreement At year-end, the total number of Husqvarna AB shares held by a third party as a share swap agreement amounted to 4,141,164 B-shares (4,670,416) corresponding to 0.7 percent (0.8) of the total number of outstanding shares. The purpose of the share swap agreement is to hedge obligations under the Group´s long-term incentive programs.
Conversion of shares Shareholders who hold A-shares are entitled to convert their A-shares into B-shares. 421,922 A-shares were converted to B-shares in 2019.
Analyst coverage There are currently around 10 analysts who analyze and follow Husqvarna Group and give recommendations on the share.
ADR Husqvarna Group sponsors a Level 1 American Depositary Receipt (ADR) program in the US. The ADRs, which each repre-sent two ordinary B-shares, are publicly traded in the US on the OTC Market, under symbol HSQVY. The ADR is a USD denomi-nated security, and the associated dividends are paid to investors in USD. Citibank is ADR depositary bank.
The Share
Husqvarna B, price development 2015–2019 Husqvarna B, price development 2019
0
5,000
10,000
15,000
20,000
25,000
30,000
35,000
40,000
20
30
40
50
60
70
80
90
100
SEK Turnover
DecNovOctSepAugJulJunMayAprMarFebJan
Turnover no. of shares per week, thousands
SX3000 OMX Stockholm Consumer Goods PIHusqvarna B
OMX Stockholm PI Source: Six Trust, FidessaTurnover no. of shares per month, thousands
SX3000 OMX Stockholm Consumer Goods PIHusqvarna B
OMX Stockholm PI
SEK
Source: Six Trust, Fidessa
Turnover
2015 2016 2017 2018 20190
10,000
20,000
30,000
40,000
50,000
60,000
70,000
80,000
20
30
40
50
60
70
80
90
100
Key facts
Husqvarna AB shares
Listing: Nasdaq Stockholm
Number of shares: 576,343,778
Market capitalization at year-end 2019: SEK 43bn
Ticker codes: Bloomberg: HUSQA SS, HUSQB SS Thomson Reuters: HUSQa.ST, HUSQb.ST Nasdaq Stockholm: HUSQ A, HUSQ B
ISIN codes: A-share SE0001662222 B-share SE0001662230
Husqvarna ADR
Ticker code: HSQVY
ISIN code: US4481031015
Ratio: Two ordinary B-shares equal one ADR

Th
e S
hare
121 / Annual Report 2019 / Husqvarna Group
Share capital and number of sharesShare
capital, SEKQuotient
value, SEKNumber of
A-sharesNumber of
B-sharesTotal number
of sharesHusqvarna before listing 2006 495,000,000 100 4,950,000
2006: stock-split and bonus issue 592,518,306 2 9,502,275 286,756,878 296,259,153
2007: bonus issue 770,273,790 2 98,380,020 286,756,875 385,136,895
2008: no transactions 770,273,790 2 98,380,020 286,756,875 385,136,895
2009: rights issue 1,152,687,556 2 147,570,030 428,773,748 576,343,778
2010: conversion from A-shares to B-shares 1,152,687,556 2 134,755,087 441,588,691 576,343,778
2011: conversion from A-shares to B-shares 1,152,687,556 2 129,460,339 446,883,439 576,343,778
2012: conversion from A-shares to B-shares 1,152,687,556 2 127,699,058 448,644,720 576,343,778
2013: conversion from A-shares to B-shares 1,152,687,556 2 126,593,868 449,749,910 576,343,778
2014: conversion from A-shares to B-shares 1,152,687,556 2 122,425,469 453,918,309 576,343,778
2015: conversion from A-shares to B-shares 1,152,687,556 2 113,694,826 462,648,952 576,343,778
2016: conversion from A-shares to B-shares 1,152,687,556 2 113,393,909 462,949,869 576,343,778
2017: conversion from A-shares to B-shares 1,152,687,556 2 112,513,001 463,830,777 576,343,778
2018: conversion from A-shares to B-shares 1,152,687,556 2 112,437,551 463,906,227 576,343,778
2019: conversion from A-shares to B-shares 1,152,687,556 2 112,015,629 464,328,149 576,343,778
Distribution of shareholders by country
Further information concerning the share
The following information, and more, is available on www.husqvarnagroup.com• Share price development• Shareholder ownership structure• Conversion of A-shares• Analyst coverage• Repurchase of shares• Share capital
n Sweden 69.8% n US 9.1% n UK 2.3% n Switzerland 1.9% n Other countries 9.4%n Anonymous ownership 7.4%
Largest shareholders in Husqvarna AB
Ägare Capital, % Votes, %
Investor 16.8% 33.1%
Lundbergföretagen AB 7.6% 25.1%
Handelsbanken Fonder 4.9% 1.8%
Didner & Gerge Fonder 4.5% 2.7%
Swedbank Robur Fonder 4.4% 1.6%
Andra AP-fonden 2.4% 0.9%
BlackRock 2.3% 0.8%
Lannebo Fonder 2.3% 1.7%
Vanguard 2.2% 0.8%
Fjärde AP-fonden 1.4% 0.5%
Summa för de tio största ägarna 48.8% 69.0%Övriga 51.2% 31.0%Totalt 100.0% 100.0%
Shareholding by size in Husqvarna AB
Size of holding Capital, % Votes, %
1 – 1,000 2.4% 2.3%
1,001 – 10,000 4.7% 4.0%
10,001 – 100,000 3.7% 2.3%
100,001 – 1,000,000 8.7% 4.3%
1,000,001 – 73.2% 83.7%
Anonymous ownership 7.4% 3.4%
Totalt 100.0% 100.0%
Share data2019 2018 2017
Earnings per share, SEK 4.42 2.12 4.64
Earnings per share after dilution, SEK 4.42 2.12 4.62
Operating cash flow per share, SEK 4.64 –0.43 3.23
Operating cash flow per share, after dilution, SEK 4.64 –0.43 3.22
Equity per share after dilution, SEK 30.2 28.0 27.3
Dividend per share, SEK 1 2.25 2.25 2.25
Yield, % 2 3.0 3.4 2.9
Dividend payout ratio, % 51 106 48
Year-end price, A-share, SEK 75 66 78
Highest price, A-share, SEK 92 90 91
Lowest price, A-share, SEK 64 63 68
Year-end price, B-share, SEK 75 66 78
Highest price, B-share, SEK 92 90 92
Lowest price, B-share, SEK 64 63 68
Number of shareholders 63,153 60,005 56,601
Market capitalization, SEKm 43,237 37,855 44,984
1 Dividend 2019 as proposed by the Board.2 Dividend/year-end share price.
Source: Holdings/Euroclear as of December 31, 2019.
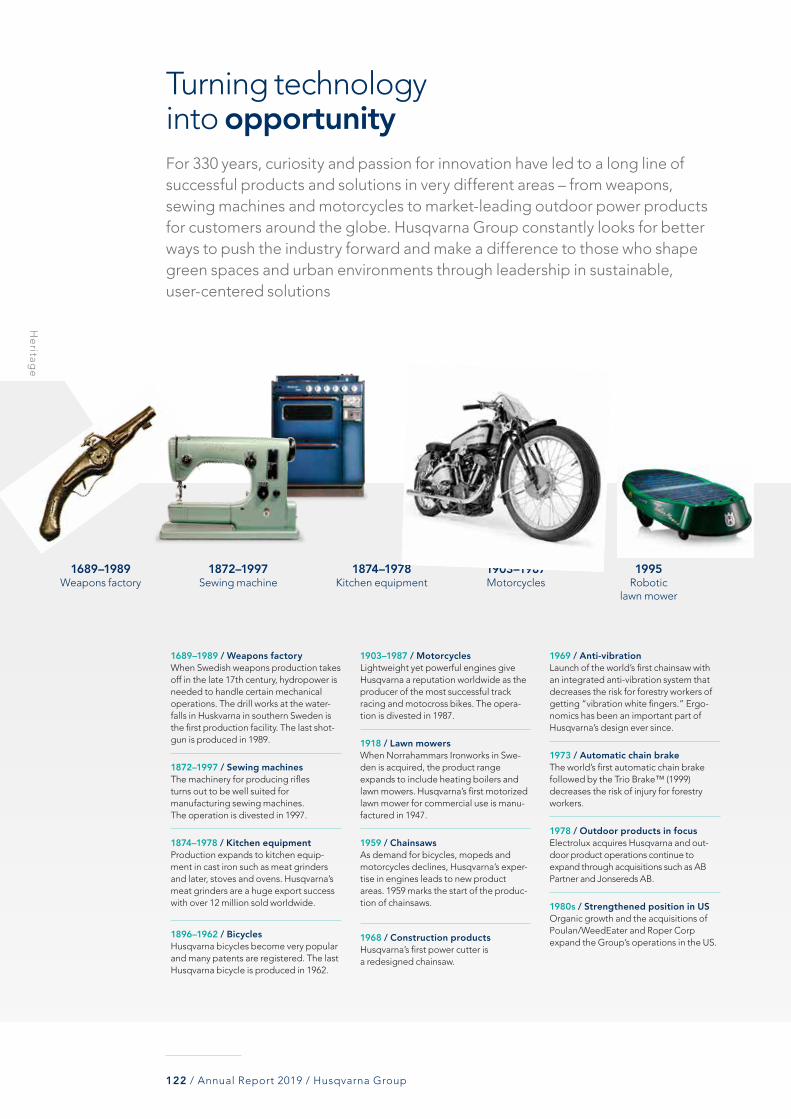
He
ritage
122 / Annual Report 2019 / Husqvarna Group
1689 –1989 / Weapons factory When Swedish weapons production takes off in the late 17th century, hydropower is needed to handle certain mechanical operations. The drill works at the water-falls in Huskvarna in southern Sweden is the first production facility. The last shot-gun is produced in 1989.
1872–1997 / Sewing machinesThe machinery for producing rifles turns out to be well suited for manu facturing sewing machines. The operation is divested in 1997.
1874 –1978 / Kitchen equipmentProduction expands to kitchen equip-ment in cast iron such as meat grinders and later, stoves and ovens. Husqvarna’s meat grinders are a huge export success with over 12 million sold worldwide.
1896 –1962 / BicyclesHusqvarna bicycles become very popular and many patents are registered. The last Husqvarna bicycle is produced in 1962.
1903 –1987 / MotorcyclesLightweight yet powerful engines give Husqvarna a reputation worldwide as the producer of the most successful track racing and motocross bikes. The opera-tion is divested in 1987.
1918 / Lawn mowersWhen Norrahammars Ironworks in Swe-den is acquired, the product range expands to include heating boilers and lawn mowers. Husqvarna’s first motorized lawn mower for commercial use is manu-factured in 1947.
1959 / ChainsawsAs demand for bicycles, mopeds and motorcycles declines, Husqvarna’s exper-tise in engines leads to new product areas. 1959 marks the start of the produc-tion of chainsaws.
1968 / Construction productsHusqvarna’s first power cutter is a redesigned chainsaw.
1969 / Anti-vibrationLaunch of the world’s first chainsaw with an integrated anti-vibration system that decreases the risk for forestry workers of getting “vibration white fingers.” Ergo-nomics has been an important part of Husqvarna’s design ever since.
1973 / Automatic chain brakeThe world’s first automatic chain brake followed by the Trio Brake™ (1999) decreases the risk of injury for forestry workers.
1978 / Outdoor products in focusElectrolux acquires Husqvarna and out-door product operations continue to expand through acquisitions such as AB Partner and Jonsereds AB.
1980s / Strengthened position in USOrganic growth and the acquisitions of Poulan/Weed Eater and Roper Corp expand the Group’s operations in the US.
1689 –1989 Weapons factory
1872–1997 Sewing machine
1874 –1978 Kitchen equipment
1903 –1987 Motorcycles
1995 Robotic
lawn mower
Turning technology into opportunityFor 330 years, curiosity and passion for innovation have led to a long line of successful products and solutions in very different areas – from weapons, sewing machines and motorcycles to market-leading outdoor power products for customers around the globe. Husqvarna Group constantly looks for better ways to push the industry forward and make a difference to those who shape green spaces and urban environments through leadership in sustainable, user-centered solutions
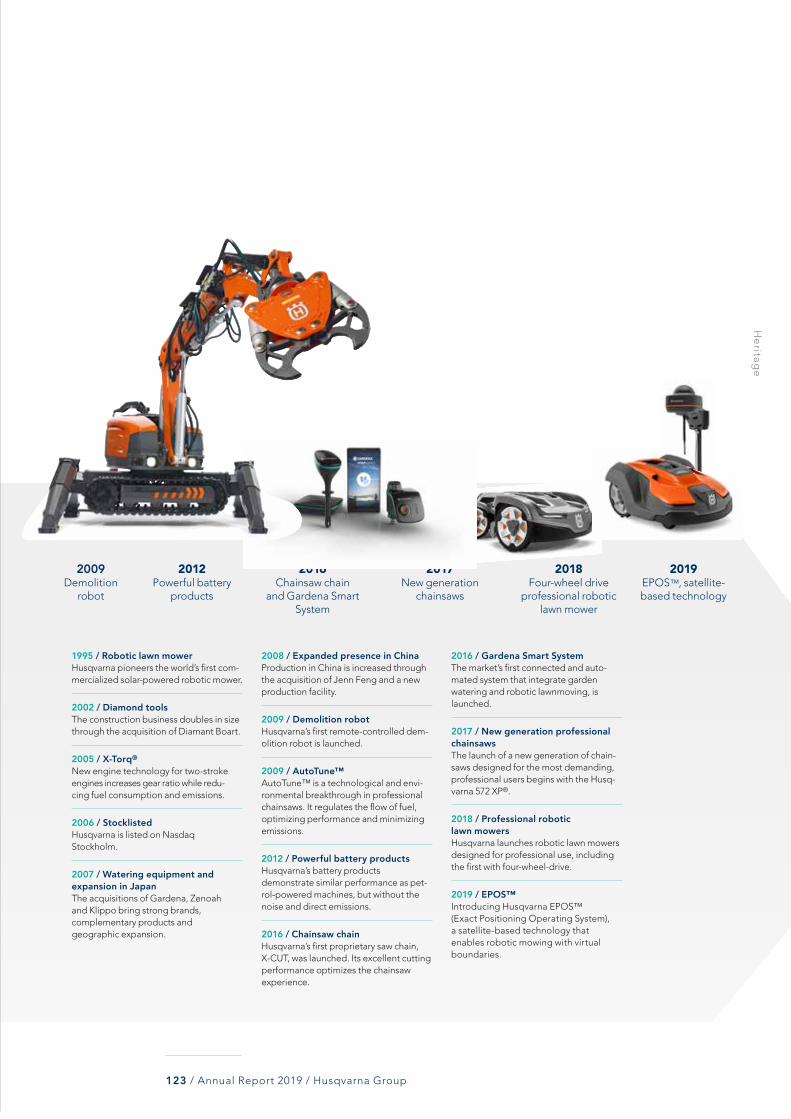
He
ritage
123 / Annual Report 2019 / Husqvarna Group
1995 / Robotic lawn mowerHusqvarna pioneers the world’s first com-mercialized solar- powered robotic mower.
2002 / Diamond toolsThe construction business doubles in size through the acquisition of Diamant Boart.
2005 / X-Torq®
New engine technology for two-stroke engines increases gear ratio while redu- cing fuel consumption and emissions.
2006 / StocklistedHusqvarna is listed on Nasdaq Stockholm.
2007 / Watering equipment and expansion in JapanThe acquisitions of Gardena, Zenoah and Klippo bring strong brands, complementary products and geographic expansion.
2008 / Expanded presence in ChinaProduction in China is increased through the acquisition of Jenn Feng and a new production facility.
2009 / Demolition robotHusqvarna’s first remote- controlled dem-olition robot is launched.
2009 / AutoTune™AutoTune™ is a technological and envi-ronmental breakthrough in professional chainsaws. It regulates the flow of fuel, optimizing performance and minimizing emissions.
2012 / Powerful battery productsHusqvarna’s battery products demonstrate similar performance as pet-rol-powered machines, but without the noise and direct emissions.
2016 / Chainsaw chainHusqvarna’s first proprietary saw chain, X-CUT, was launched. Its excellent cutting performance optimizes the chainsaw experience.
2016 / Gardena Smart SystemThe market’s first connected and auto-mated system that integrate garden watering and robotic lawnmoving, is launched.
2017 / New generation professional chainsawsThe launch of a new generation of chain-saws designed for the most demanding, professional users begins with the Husq-varna 572 XP®.
2018 / Professional robotic lawn mowersHusqvarna launches robotic lawn mowers designed for professional use, including the first with four-wheel-drive.
2019 / EPOS™ Introducing Husqvarna EPOS™ (Exact Positioning Operating System), a satellite-based technology that enables robotic mowing with virtual boundaries.
2009 Demolition
robot
2012 Powerful battery
products
2016 Chainsaw chain
and Gardena Smart System
2017 New generation
chainsaws
2018 Four-wheel drive
professional robotic lawn mower
2019 EPOS™, satellite- based technology
An
nu
al Ge
ne
ral Me
etin
g 2020
124 / Annual Report 2019 / Husqvarna Group
2020 Annual General Meeting The 2020 Annual General Meeting (“AGM”) of Husqvarna AB (publ) will be held at 4:00 p.m. on Thursday, April 2, 2020 at the Elmia Congress Center, Hammarskjöld Hall, Elmiavägen 15, Jönköping, Sweden.
Participation Shareholders who intend to participate in the AGM must:• Be registered in the register of shareholders maintained by
Euroclear Sweden AB as of Friday, March 27, 2020. • Notify the Company of their intention to attend, stating the
number of assistants attending (maximum two), no later than Friday, March 27, 2020.
Notice of participationNotice of intent to participate can be given:• At www.husqvarnagroup.com. • By telephone at +46 36 14 70 10 between 9:00 a.m.
and 4:00 p.m. weekdays. • By post to Husqvarna AB, c/o Euroclear Sweden AB,
P.O. Box 191, SE-101 23 Stockholm, Sweden.
Notice should include the shareholder’s name, social security number or company registration number if any, address and tele-phone number. Information provided together with the notice will be made subject to data processing and will be used solely for the 2020 AGM. Shareholders may vote by proxy, in which case a power of attorney must be submitted to Husqvarna AB prior to the AGM.
Shares registered by nominees To participate in the AGM, shareholders whose shares are nomi-nee registered must have their shares temporarily registered in their own name on Friday, March 27, 2020. To ensure that such registration is made prior to Friday, March 27, 2020, shareholders must inform the nominee well in advance of this date.
Dividend The Board of Directors has proposed a dividend for financial year 2019 of SEK 2.25 per share to be paid in two installments, firstly SEK 0.75 per share with Monday, April 6, 2020 as the first record day, secondly SEK 1.50 per share with Tuesday, October 6, 2020 as the second record day. Assuming the AGM resolves in accordance with the Board of Directors’ proposal, the estimated date for pay-ment of the dividend from Euroclear Sweden AB is Thursday, April 9, 2020 for the first part of the dividend and Friday, October 9, 2020 for the second part.
The last day for trading in Husqvarna AB shares with a right to the first part of the dividend is Thursday, April 2, 2020. The last day for trading in Husqvarna AB shares with a right to the second part of the dividend is Friday, October 2, 2020.
For information on how your personal data is processed, see www.euroclear.com/dam/ESw/Legal/Privacy- noticebolagsstammor-engelska.pdf
Financial calendar 2020April 2 Annual General Meeting
April 24 Interim Report January–March
July 16 Interim Report January– June
October 20 Interim Report January–September

Contact
Johan AnderssonInvestor [email protected]+46 8 738 90 00
Åsa LarssonMedia [email protected]+46 8 738 90 80
Market data, statistics and market shares are estimates made by Husqvarna Group.
Factors affecting forward-looking statementsThis report contains forward-looking statements in the sense referred to in the American Private Securities Litigation Reform Act of 1995. Such statements comprice, among other things, fi nancial goals, goals of future business and fi nancial plans. These statements are based on present expectations and are subject to risks and uncertainties that may give rise to major deviations of the result due to several aspects. These aspects include, among other things: consumer demand and market conditions in the geographical areas and lines of business in which Husqvarna Group operates, the effects of currency fl uctuations, downward pressure on prices due to competition, a material reduction of sales by important distributors, any success in developing new products and in market-ing, outcome of any product responsibility litigation, progress when it comes to reach the goals set for productivity and effi cient use of capital, successful identifi cation of growth opportunities and acquistion objects, and to integrate these into the existing business and successful achievement of goals to make the supply chain more effi cient.
PRODUCTION: Husqvarna AB (publ) and Hallvarsson & Halvarsson.
PRINT: Larsson Offsettryck AB, Linköping 2020.
CHAPTER 01 / 08
Shaping great experiences We make a great difference to people who shape green spaces
and urban environments through our leadership in sustainable,
user-centered solutions. With a passion for innovation, we
create performance, pride and improved results for customers
around the world.
Cover image:
In 2019, the Husqvarna EPOS™ technology was launched, a satellite-based solution for professional robotic mowing with virtual boundaries.
The formal Annual Report, including the Directors’ Report and the fi nancial statements for the Group and the Parent Company, is provided on pages 41–110.
To learn more about Husqvarna Group’s sustainability initiatives, see the Sustainovate Progress report 2019.

Fairway cutting area
Fairway cutting area
Fairway cutting area
Stay-out zone
Stay-out zone
HU
SQVA
RN
A G
RO
UP
AN
NU
AL R
EP
OR
T 2019
ANNUAL REPORT 2019
Shaping great experiencesHead offi ce
Husqvarna AB (publ) / Mailing address: Box 7454, SE-103 92 Stockholm, SwedenVisiting address: Regeringsgatan 28 / Telephone: +46 8 738 90 00 / www.husqvarnagroup.com
Registered offi ceHusqvarna AB (publ) Jönköping / Mailing address: SE-561 82 Huskvarna, Sweden
Visiting address: Drottninggatan 2 / Telephone: +46 36 14 65 00