![Shaping the Future: Developing an Institutional Strategy · • Personal: New arrival to RGU and Scotland [Dec 2016] ... ↑ objectives, buzzword bingo, drafting by committee vs .](https://static.fdocuments.in/doc/165x107/5ec6a394226cb93a6a1972a8/shaping-the-future-developing-an-institutional-a-personal-new-arrival-to-rgu.jpg)
Shaping Earnings Mobility: Policy and Institutional Factors
28
The European Journal of Comparative Economics Vol. 8, n. 2, pp. 175-202 ISSN 1824-2979 Available online at http://eaces.liuc.it Shaping Earnings Mobility: Policy and Institutional Factors 1 Denisa Maria Sologon 2 , Cathal O’Donoghue 3 Abstract This paper explores the role of labour market policy and institutional factors in explaining cross-national differences in earnings mobility across Europe in the 1990s using the European Community Household Panel and OECD data on institutional variables. More regulation in both labour and product markets emerge as sources of labour market rigidity, being positively associated with earnings immobility and exacerbating the adverse effects of macro-economic shocks on earnings mobility. Unionization is found to promote earnings mobility, effect, however, counteracted in periods with adverse macroeconomic shocks. Corporatism is found to promote mobility and to counteract the adverse effects of macroeconomic shocks on earnings mobility. The generosity of the unemployment benefit is found to limit the adverse effects of macroeconomic shocks on earnings mobility. JEL Classification: C23, D31, J31, J60, J50, J08 Keywords: Wage Distribution, Inequality, Earnings Mobility, Labour Market Institutions; Labour Market Policies 1. Introduction While much of the welfare literature focuses on cross-sectional inequality, the underlying dynamics or mobility of individuals within the distribution has significant implications in relation to welfare associated with being in different parts of the distribution. Earnings mobility represents a very important aspect for understanding earnings inequality. While earnings mobility can be welfare decreasing as a result of greater risk (Atkinson, Bourguignon, and Morrisson, 1992), it can also be seen as a mechanism for reducing long-term differentials, acting as a bridge between short-term and lifetime earnings inequality. For example, Friedman (1962) indicates that higher earnings mobility • is sign of a dynamic, more flexible and efficient economy, • contributes to equality of opportunity; • ceteris paribus, is expected to make the distribution of lifetime income more equal. The implication of the latter comment is that through “offsetting mobility”, higher mobility can reduce inequality of income measured over a longer period of time, 1 This research is part of the ‘Earnings Dynamics and Microsimulation’ project supported by the Luxembourg ‘Fond National de la Recherche’ through an AFR grant (PDR no. 893613), cofunded under the Marie Curie Actions of the European Commission (FP7-COFUND). 2 CEPS/INSTEAD; IZA; Maastricht University. E-mail: [email protected] 3 Teagasc Rural Economy Research Centre; NUI Galway; IZA; ULB. E-mail: [email protected]
Transcript of Shaping Earnings Mobility: Policy and Institutional Factors

The European Journal of Comparative Economics
Vol. 8, n. 2, pp. 175-202
ISSN 1824-2979
Available online at http://eaces.liuc.it
Shaping Earnings Mobility: Policy and Institutional Factors1
Denisa Maria Sologon2, Cathal O’Donoghue3
Abstract
This paper explores the role of labour market policy and institutional factors in explaining cross-national differences in earnings mobility across Europe in the 1990s using the European Community Household Panel and OECD data on institutional variables. More regulation in both labour and product markets emerge as sources of labour market rigidity, being positively associated with earnings immobility and exacerbating the adverse effects of macro-economic shocks on earnings mobility. Unionization is found to promote earnings mobility, effect, however, counteracted in periods with adverse macroeconomic shocks. Corporatism is found to promote mobility and to counteract the adverse effects of macroeconomic shocks on earnings mobility. The generosity of the unemployment benefit is found to limit the adverse effects of macroeconomic shocks on earnings mobility.
JEL Classification: C23, D31, J31, J60, J50, J08
Keywords: Wage Distribution, Inequality, Earnings Mobility, Labour Market Institutions; Labour Market Policies
1. Introduction
While much of the welfare literature focuses on cross-sectional inequality, the underlying dynamics or mobility of individuals within the distribution has significant implications in relation to welfare associated with being in different parts of the distribution. Earnings mobility represents a very important aspect for understanding earnings inequality.
While earnings mobility can be welfare decreasing as a result of greater risk (Atkinson, Bourguignon, and Morrisson, 1992), it can also be seen as a mechanism for reducing long-term differentials, acting as a bridge between short-term and lifetime earnings inequality. For example, Friedman (1962) indicates that higher earnings mobility
• is sign of a dynamic, more flexible and efficient economy,
• contributes to equality of opportunity;
• ceteris paribus, is expected to make the distribution of lifetime income more equal.
The implication of the latter comment is that through “offsetting mobility”, higher mobility can reduce inequality of income measured over a longer period of time,
1 This research is part of the ‘Earnings Dynamics and Microsimulation’ project supported by the
Luxembourg ‘Fond National de la Recherche’ through an AFR grant (PDR no. 893613), cofunded under the Marie Curie Actions of the European Commission (FP7-COFUND).
2 CEPS/INSTEAD; IZA; Maastricht University. E-mail: [email protected] 3 Teagasc Rural Economy Research Centre; NUI Galway; IZA; ULB. E-mail:

EJCE, vol.8, n.2 (2011)
Available online at http://eaces.liuc.it
176
such as lifetime income or “permanent” income, despite a rise in annual inequality, resulting in a positive impact on long-term social welfare. However, it depends on the trade-off between long-term inequality and income variability or risk aversion (Creedy and Wilhelm, 2002; Gottschalk and Spolaore, 2002).
This study focuses on the comparative analysis of earnings mobility in Europe. Of course, while wider income definitions such as disposable income are better determinants of welfare, employee earnings are one of the most important factors of disposable income and thus warren a distinct examination. Also, comparative studies, by comparing and contrasting the situation in different countries can facilitate a greater understanding in relation to the structure of mobility. Nevertheless, the literature in this area is relatively limited with only a few consistent comparative studies on earnings mobility, due to the lack of sufficiently comparable panel cross-country data (Aaberge, Bjorklund, Jantti, Palme, Pedersen, Smith, and Wannemo, 2002; Brukhauser and Poupore, 1997; Brukhauser, Holtz-Eakin, and Rhody, 1997; Fritzell, 1990; OECD, 1996, 1997; Hofer and Weber, 2002; Van Kerm, 2004).
It is not, however, sufficient to describe the structure of earnings mobility. It is also instructive to understand the driving forces behind differences in earnings mobility across countries. Studies examining this are even scarcer. To our knowledge, the only example is Aaberge, Bjorklund, Jantti, Palme, Pedersen, Smith, and Wannemo (2002), comparing income inequality and income mobility in the Scandinavian countries and the U.S. during 1980-1990, to explore some of the factors driving mobility. They find that relative income changes are associated with changes in labour market and marital status in all four countries, but the U.S. record the largest magnitude of such changes. Thus there is a large gap in the literature analysing the factors shaping earnings mobility.
Our paper attempts to fill part of this gap by exploring the role of labour market policy and institutional factors in understanding cross-national differences in earnings mobility across 14 EU countries. So far, at the EU level, no study explored the driving factors behind this labour market outcome in a comparative manner.
In our study, mobility is regarded as the opposite of persistency, and can be interpreted as the opportunity for the poor to improve their relative income position in a lifetime perspective. We do not take the stand that mobility is necessarily good, but that the lack of it is bad, as it signals a lack of opportunity to move in the earnings distribution over the lifetime: in the absence of mobility the same individuals are stuck at the bottom of the distribution, hence annual earnings differentials are transformed into lifetime earnings differentials. Understanding the factors that enhance earnings mobility represents a step forward towards designing policies and institutions that enable low-wage workers to escape low-wage jobs and improve their position in the distribution of lifetime earnings.
This question is highly relevant given the economic reality of the 1990s in Europe: the implementation of the single market (1992) and the preparation of the single currency (Maastricht criteria adopted in 1993) increased the pressure on the European labour markets to change. Starting in the early-1990s under the influence of the 1994 OECD Job Strategy, Europe has been moving towards more flexible labour markets through the implementation of employment-friendly reforms, expected to worsen the trade-off between a strong employment performance and a more equal distribution of

D. M. Sologon, C. O’Donoghue, Shaping Earnings Mobility: Policy and Institutional Factors
Available online at http://eaces.liuc.it
177
earnings (OECD, 2004). The pace of change, however, was different across Europe (Palier, 2010), reinforcing the expectation of increased country-heterogeneity with respect to the labour market structure and the distribution of labour market income across Europe.
Using the predicted earnings mobility from Sologon and O’Donoghue (2010a) and Sologon (2010) together with OECD data on institutional factors for 14 EU countries, we apply a nonlinear least squares method to explore the relationship between earnings mobility and labour market policy and institutional factors.
Our study is divided into 5 sections. Section 2 describes the comparative pattern of earnings mobility across Europe. Section 3 discusses the link between institutions, labour market shocks and earnings mobility. Section 4 uses nonlinear least squares regressions to assess the linkage between these factors and earnings mobility, while section 5 concludes.
2. Earnings mobility
There are a number of indicators that can be used to measure earnings mobility. Sologon and O’Donoghue (2010b) and Fields and Ok (1999) discuss the characteristics of a number of these measures, namely the Dickens, Shorrocks and Fields indicators. Rank measures best reflect movement in the earnings distribution between periods, traditionally derived from the transition matrix approach between income groups. This approach, however, does not capture the movement within each income group, thus potentially underestimating the degree of mobility. Dickens (2000a) computes the ranking of individuals in the wage distribution for each year and examines the degree of movement in percentile ranking between years. Shorrocks (1978) measures mobility as the relative reduction in the weighted average of single-year inequality when the accounting period is extended. In the literature it is usually classified among the measures of mobility as an equalizer of longer-term differentials. In recent years, however, this measure is criticised as it fails to capture the equalizing effect, failing to quantify the direction and the extent of the difference between inequality of longer-term income and inequality of base year income, treating equalizing and disequalizing changes in the same way (Benabou and Ok, 2001; Fields, 2008). Fields (2008) proposes an alternative index which captures mobility as an equalizer/disequalizer of longer-term incomes, circumventing the limitation of the Shorrocks index.
In this study we wish to understand the driving factors associated with differential mobility across countries and over time. Most mobility indices, however, capture transitions between periods, which may make it difficult to link them with the yearly policy and institutional factors. One solution is to use a mobility index that reflects one particular period. Building upon the terminology introduced by Friedman and Kuznets (1954), individual earnings (i) in each year (t) are composed of a permanent and a transitory component, assumed independent of each other (Weizsacker, 1993):
(1)
The permanent component of earnings reflects personal characteristics, education, training and other systematic elements. The transitory component reflects

EJCE, vol.8, n.2 (2011)
Available online at http://eaces.liuc.it
178
individual random factors (e.g. illness and accident) and random changes in the market conditions in a particular period. It is expected to average out over time, with no influence on permanent earnings.
Earnings mobility is closely related to these two components of earnings inequality. A large contribution of the permanent component implies that individual earnings are highly correlated over time and individuals do not change their income position to a large extent experiencing low rates of earnings mobility. Therefore, changes in earnings mobility are determined by the extent to which changes in cross-sectional inequality are driven by changes in permanent or transitory variance.
The measure of mobility is derived from decomposing earnings inequality into its permanent and transitory components. Taking the variance of ln(earnings) in (1), under the independence assumption between permanent and transitory earnings, we obtain:
(2)
(3)
The degree of immobility measured by the ratio between permanent and transitory inequality (3), in the tradition of Kalwij and Alessie (2003), is the measure of mobility that we use in this study. This measure offers a summary of the evolution in the structure of inequality: an increase in the immobility ratio indicates a decrease in earnings mobility, equivalent with an increase in the relative share of permanent differentials in the overall inequality. This mobility measure captures non-directional earnings movements and can be interpreted as the opportunity to improve one’s position in the distribution of lifetime earnings.
Data on earnings mobility using these measures is taken from Sologon and O’Donoghue (2010a, 2010b) and Sologon (2010). They use the ECHP over the period 1994-2001 for 14 EU countries. Luxembourg and Austria are observed between 1995 and 2001 and Finland between 1996 and 2001. In the tradition of existing studies, the analysis focuses only on men. The mobility measures are based on real log hourly wage adjusted for CPI of workers aged 20 to 57, born between 1940 and 1981. The analysis considers only observations with hourly wage lower than 50 Euros and higher than 1 Euro. The immobility ratio used in this paper is taken from Sologon and O’Donoghue (2010a) and Sologon (2010), who estimate the covariance structure of individual earnings using the equally weighted minimum distance estimator (Moffitt and Gottschalk, 1995, 1998, 2002, 2011; Baker, 1997; Dickens, 2000b; Haider, 2001; Baker and Solon, 2003; Kalwij and Alessie, 2003; Capellari, 2003; Ramos, 2003; Daly and Valletta, 2005; Gustavsson, 2007, 2008), decompose cross-sectional earnings inequality into permanent and transitory inequality and compute earnings immobility in each country. The estimation of the covariance structure is based on unbalanced samples for each country. The use of unbalanced panels is motivated by the need to mitigate the

D. M. Sologon, C. O’Donoghue, Shaping Earnings Mobility: Policy and Institutional Factors
Available online at http://eaces.liuc.it
179
potential overestimation of earnings persistence expected to arise in balanced panels where the estimation is based only on people with positive earnings for the entire sample period. The estimation of the two components and earnings immobility is done by four birth cohorts (1940-1950, 1951-1960, 1961-1970, 1971-1980) to account for cohort differences in both components and earnings immobility (Blundell and Preston, 1988). For the data description and summary statistics, see Sologon and O’Donoghue (2010a, 2010b) and Sologon (2010).
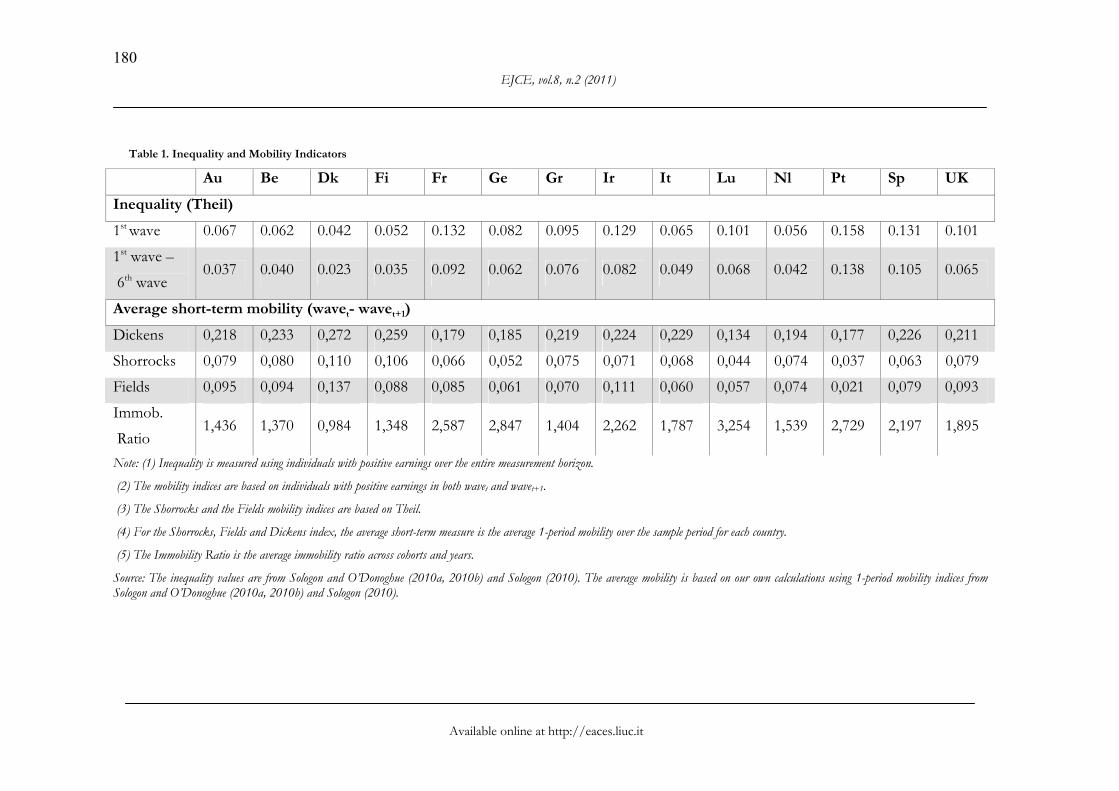
In summary, Table 1 reports in a comparative perspective the degree of short and long-term inequality (Theil) and the average 1-period mobility under alternative measures. Considering inequality first, short-term inequality as measured by the Theil index in the first wave is greater than long-term inequality, as measured by 6-period income, in all countries due to mobility in the earnings distribution. The rank across countries does not vary that much, although there are localised re-rankings within three groups: (a) Austria, Italy and the Netherlands, (b) Luxembourg, Greece and the UK and (c) France and Spain. This is driven by a combination of the change in inequality over time and differential mobility.
On aggregate, conclusions in relation to mobility are reasonably robust to the measure used, with a rank correlation of mobility measures over 0.8. Denmark, Finland, and Belgium typically have the highest mobility measures, with Portugal, Luxembourg, and Germany having the lowest mobility. Except for the most mobile countries, a priori differential mobility seems to differ from typical geographical or welfare regime analyses.
Also quite different welfare implications can be drawn from these statistics. Denmark, Finland and Belgium have among the lowest, both short and long-term earnings inequality, thus we may conclude mobility is relatively equalizing. Germany and Luxembourg meanwhile are mid-ranked under both inequality measures with relatively low mobility, while Portugal has the highest earnings inequality, both short and long-term, and the lowest mobility, revealing a lack of potential for social mobility.
These aggregate measures of mobility mask intra-population differences, for example between cohorts, and changes over time. The evolution of the earnings immobility index over time by cohort is illustrated in. Averaged across cohorts, earnings mobility increases in Denmark, Belgium, Spain, Netherlands and Portugal. Across cohorts, the degree of immobility is higher for older cohorts than for younger cohorts, suggesting a decreasing mobility over the lifecycle. The trend differences in immobility observed between cohorts may be related with the different levels of responsiveness to macroeconomic shocks and their interactions with the other labour market policy and institutional factors. Younger workers are expected to be affected to a larger extent by these shocks compared with experienced workers, which have a high attachment to the labour market and a better protection from the institutional framework. Thus younger cohorts are expected to experience a higher earnings volatility which translates itself into a higher earnings mobility.
EJCE, vol.8, n.2 (2011)
Available online at http://eaces.liuc.it
180
Table 1. Inequality and Mobility Indicators
Au Be Dk Fi Fr Ge Gr Ir It Lu Nl Pt Sp UK
Inequality (Theil)
1st wave 0.067 0.062 0.042 0.052 0.132 0.082 0.095 0.129 0.065 0.101 0.056 0.158 0.131 0.101
1st wave –
6th wave 0.037 0.040 0.023 0.035 0.092 0.062 0.076 0.082 0.049 0.068 0.042 0.138 0.105 0.065
Average short-term mobility (wavet- wavet+1)
Dickens 0,218 0,233 0,272 0,259 0,179 0,185 0,219 0,224 0,229 0,134 0,194 0,177 0,226 0,211
Shorrocks 0,079 0,080 0,110 0,106 0,066 0,052 0,075 0,071 0,068 0,044 0,074 0,037 0,063 0,079
Fields 0,095 0,094 0,137 0,088 0,085 0,061 0,070 0,111 0,060 0,057 0,074 0,021 0,079 0,093
Immob.
Ratio 1,436 1,370 0,984 1,348 2,587 2,847 1,404 2,262 1,787 3,254 1,539 2,729 2,197 1,895
Note: (1) Inequality is measured using individuals with positive earnings over the entire measurement horizon.
(2) The mobility indices are based on individuals with positive earnings in both wavet and wavet+1.
(3) The Shorrocks and the Fields mobility indices are based on Theil.
(4) For the Shorrocks, Fields and Dickens index, the average short-term measure is the average 1-period mobility over the sample period for each country.
(5) The Immobility Ratio is the average immobility ratio across cohorts and years.
Source: The inequality values are from Sologon and O’Donoghue (2010a, 2010b) and Sologon (2010). The average mobility is based on our own calculations using 1-period mobility indices from Sologon and O’Donoghue (2010a, 2010b) and Sologon (2010).

D. M. Sologon, C. O’Donoghue, Shaping Earnings Mobility: Policy and Institutional Factors
Available online at http://eaces.liuc.it
181
Figure 1: Immobility Ratio over Time for Selected Cohorts
02
46
810
1994 1995 1996 1997 1998 1999 2000 2001
Germany
02
46
810
1994 1995 1996 1997 1998 1999 2000 2001
Denmark
02
46
810
1994 1995 1996 1997 1998 1999 2000 2001
Netherlands
02
46
810
1994 1995 1996 1997 1998 1999 2000 2001
Belgium0
24
68
10
1994 1995 1996 1997 1998 1999 2000 2001
France
02
46
810
1994 1995 1996 1997 1998 1999 2000 2001
Luxembourg
02
46
810
1994 1995 1996 1997 1998 1999 2000 2001
UK
02
46
810
1994 1995 1996 1997 1998 1999 2000 2001
Ireland
02
46
810
1994 1995 1996 1997 1998 1999 2000 2001
Italy
02
46
810
1994 1995 1996 1997 1998 1999 2000 2001
Greece
02
46
810
1994 1995 1996 1997 1998 1999 2000 2001
Spain
02
46
810
1994 1995 1996 1997 1998 1999 2000 2001
Portugal
02
46
810
1994 1995 1996 1997 1998 1999 2000 2001
Austria
02
46
810
1994 1995 1996 1997 1998 1999 2000 2001
Finland
Wage Immobility Cohort 1940-1950
Wage Immobility Cohort 1951-1960
Wage Immobility Cohort 1961-1970
Wage Immobility Cohort 1971-1981
Note: Immobility Ratio = Permanent Variance/Transitory Variance. Source: Processed based on the wage immobility index estimated by Sologon and O’Donoghue (2010a) and Sologon (2010) using ECHP data

EJCE, vol.8, n.2 (2011)
Available online at http://eaces.liuc.it
182
3. Linking labour market policies and institutions with outcomes - earnings mobility
The objective of this study is to explore the possible links between earnings mobility and labour market policy and institutional factors. The challenge of this approach is the lack of a specific theory that can explain this link. We attempt to build the link with earnings mobility based on existing labour market theories and empirical findings regarding the impact of these factors on earnings inequality. Earnings mobility and earnings inequality are interconnected, thus the influencing institutional and policy factors of earnings inequality are expected to spill-over earnings mobility. We explain first the determinants of earnings inequality and second we establish the link between labour market policy and institutional factors and earnings mobility.
3.1 Determinants of earnings inequality
The supply-demand-institutions framework (SDI) of Freeman and Katz (1994) can be used to understand how labour market policy and institutional factors influence wage structures. It assumes that different demographic and skill groups are imperfect substitutes in production, implying that shifts in labour skills demand, such as skill-biased technological change and the forces of globalization, and supply, such as cohort size, access to education and immigration, can alter wage and employment outcomes. Supply and demand factors are expected to affect young workers to a larger extent than experienced workers with substantial work tenure (Freeman, 1975).
However, demand and supply factors cannot themselves explain all differences in inequality as most advanced countries operate in the same world markets, with similar technology, industry and occupation mixes. To fully understand the differences in labour market outcomes across countries we need to consider the institutional framework (Freeman and Katz, 1994). Shocks in demand and supply may have different effects on wages and employment, depending on different wage-setting mechanisms and other labour market institutional factors. The stronger the wage-setting mechanism is, the less impact these shocks have on wages. For example, existing evidence shows that unions reduce wage inequality and that this compression effect is stronger in countries where union membership and bargaining coverage are high, and bargaining is centralised and/or co-ordinated (Aidt and Tzannatos, 2002; Blau and Kahn, 1999; OECD, 1997). Additionally, institutional changes, such as changes in the degree of unionization, the degree of centralization/co-ordination of collective bargaining, or product market regulation can have an impact on wage structures (Katz and Autor, 1999).
3.2 Linking earnings mobility with the wage structure
Earnings mobility is closely related to the two components of earnings inequality, permanent and transitory, and is driven by relative changes in both. The rise in inequality in the permanent component of earnings may reflect increasing returns to education, on-the-job training and other persistent abilities that are among the main determinants of the permanent component of earnings, meaning enhanced relative

D. M. Sologon, C. O’Donoghue, Shaping Earnings Mobility: Policy and Institutional Factors
Available online at http://eaces.liuc.it
183
earnings position of the highly skilled individuals (Mincer, 1957, 1958, 1962, 1974; Hause, 1980).
Fortin and Lemieux (1997), Topel (1997) outline a number of factors that determine shifts in relative demand. These include skill-biased technological changes, which enhance the relative earnings position of highly-skilled workers, increases in prices of other products, which imply changes in product demands, and forces of globalization, such as the reduction in trade barriers and outsourcing. Shifts in supply are determined by cohort variations, changes in access to education and immigration. An increase in the interest rate can also lead to a decrease in permanent inequality within younger cohorts and to an increase in permanent inequality in the older cohorts (Weizsacker, 1993).
The rise of earnings instability appears to be “a bit of a puzzle for hypotheses only emphasizing rising skills prices associated with increased growth in the demand for skills relative to the supply of skills” (Katz and Autor, 1999). The increase in transitory inequality may be attributed to increased earnings exposure to macroeconomic shocks and/or a rise in the temporary workforce which increases earnings exposure to shocks, increased labour market instability, increased competitiveness, globalization, increasing international capital mobility, and to the weakening of the labour market institutions (e.g. unions, government wage regulation, and internal labour markets) in filtering the impact of these shocks on earnings (Rodrik, 1997; Katz and Autor, 1999).
Some of the factors influencing directly permanent inequality might impact also transitory inequality. For example, a period of skill-biased technological change can, both increase the demand for skills, and increase earnings instability, as firms might face uncertainty with respect to abilities of individual workers (Katz and Autor, 1999).
Overall, the increase in returns to skills is expected to have a much larger impact on long-run earnings inequality than an increase in transitory inequality (Katz and Autor, 1999; Moffitt and Gottschalk, 2002). Across age groups, as postulated by Freeman’s (1975) “active labour market hypothesis”, similarly with overall income, supply and demand factors together with the other macroeconomic shocks are expected to have the largest effect on the youngest generations of workers. Moreover the limiting impact of these factors on both inequality components is expected to be lower for younger workers, which have a weaker attachment to the labour market compared with senior workers. Therefore, when analysing earnings mobility one has to take into account cohort heterogeneity.
Thus, as illustrated in Figure 2, permanent inequality within birth cohorts results from the interactions between ability distributions, lifecycle decisions, economic structures and labour market policy and institutions. Transitory inequality within birth cohorts is expected to be driven mainly by random macroeconomic and individual-specific shocks, and depends on the ability of labour market policy and institutions to minimize its increase. As the SDI factors affect overall inequality, they are expected to affect its permanent and transitory components, and consequently earnings mobility.

EJCE, vol.8, n.2 (2011)
Available online at http://eaces.liuc.it
184
Figure 2: Determinants of Permanent and Transitory Inequality and Earnings Mobility
3.3 Data description
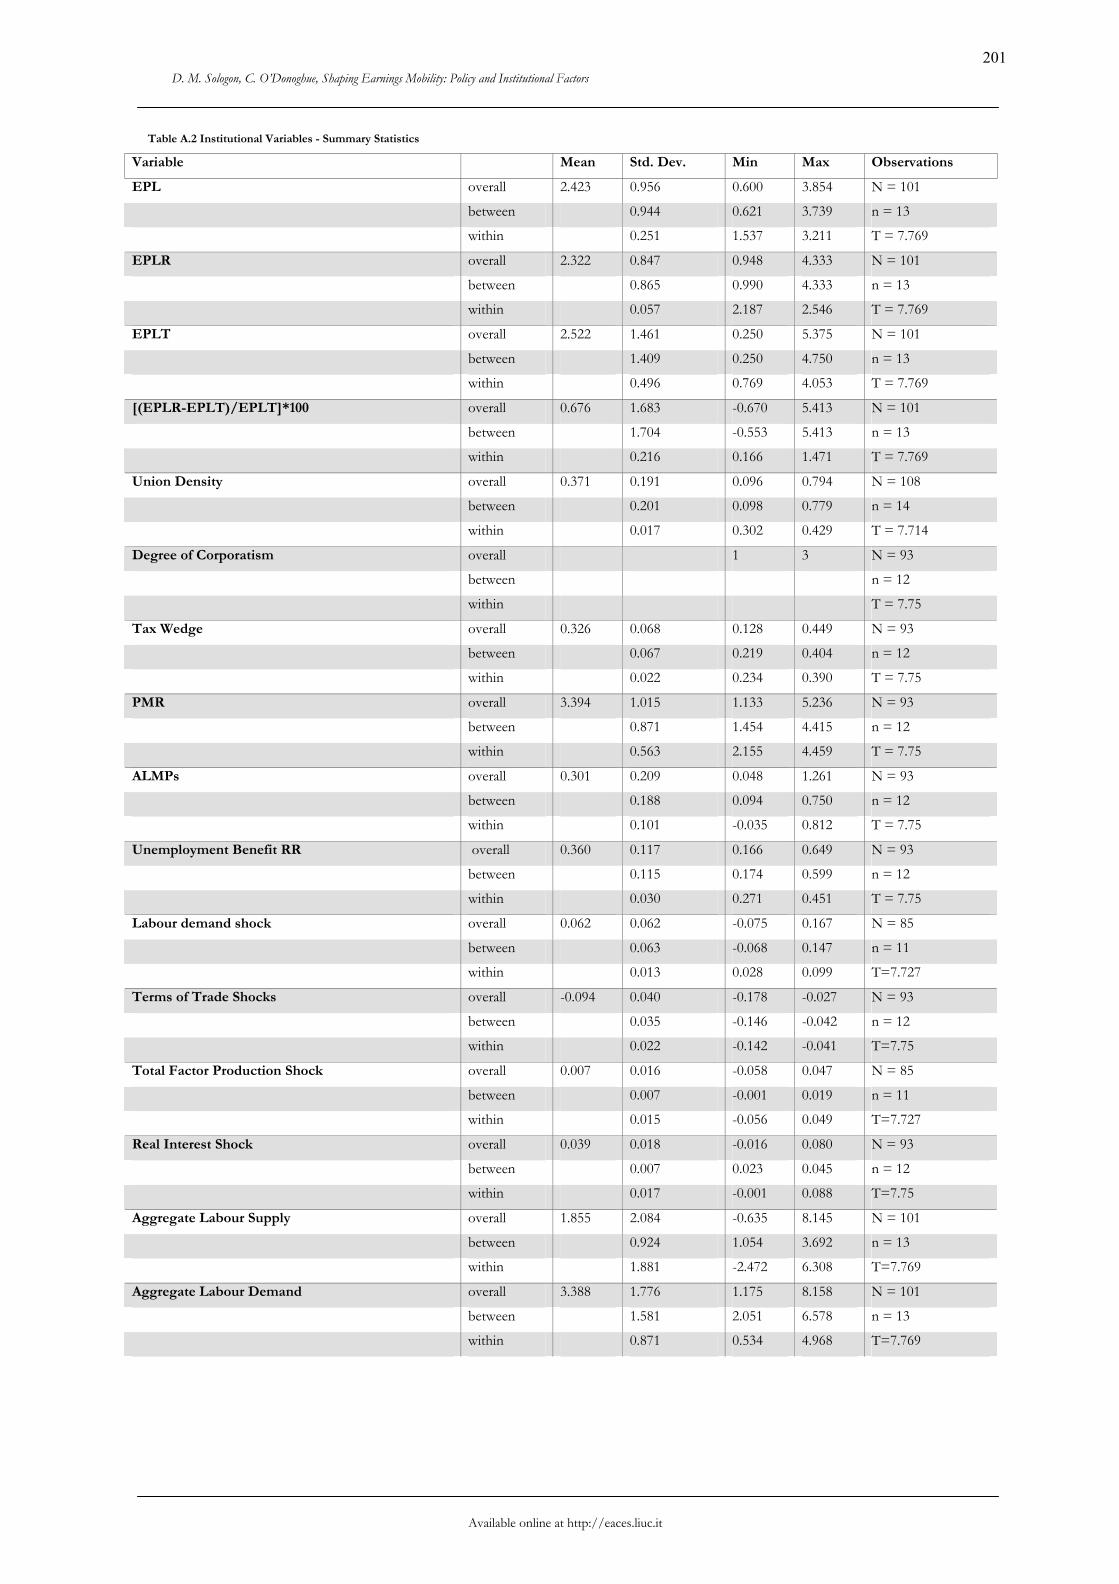
The link between the evolution of earnings mobility and labour market policies and institutions is investigated using the OECD data on labour market indicators, which is a combination of two datasets: the Bassanini and Duval (2006a, 2006b)4 dataset and the Lindert-Allard OECD data set 1950-20015. The institutional variables included in our study are: employment protection legislation (EPL), EPL for temporary (EPLT) and for regular contracts (EPLR), the relative difference between EPLR and EPLT, trade union density, product market regulation (PMR), tax wedge, degree of corporatism, average unemployment benefit replacement rate (UBRR) and spending on active labour market programmes (ALMPs). The macroeconomic shock variables are: labour demand shock, terms of trade shock, total factor productivity shock, real interest shock, aggregate demand shock and aggregate supply shock. These variables are observed at the country level, over the period 1994-2001. A description of the variables is included in Table A.16 and summary statistics of the institutional and shock variables in Table A.2 in the appendix. Luxembourg and Greece have some missing institutional/shock variables and they are dropped from the final estimations. Portugal, Denmark and Ireland record some missing values for labour demand shock.
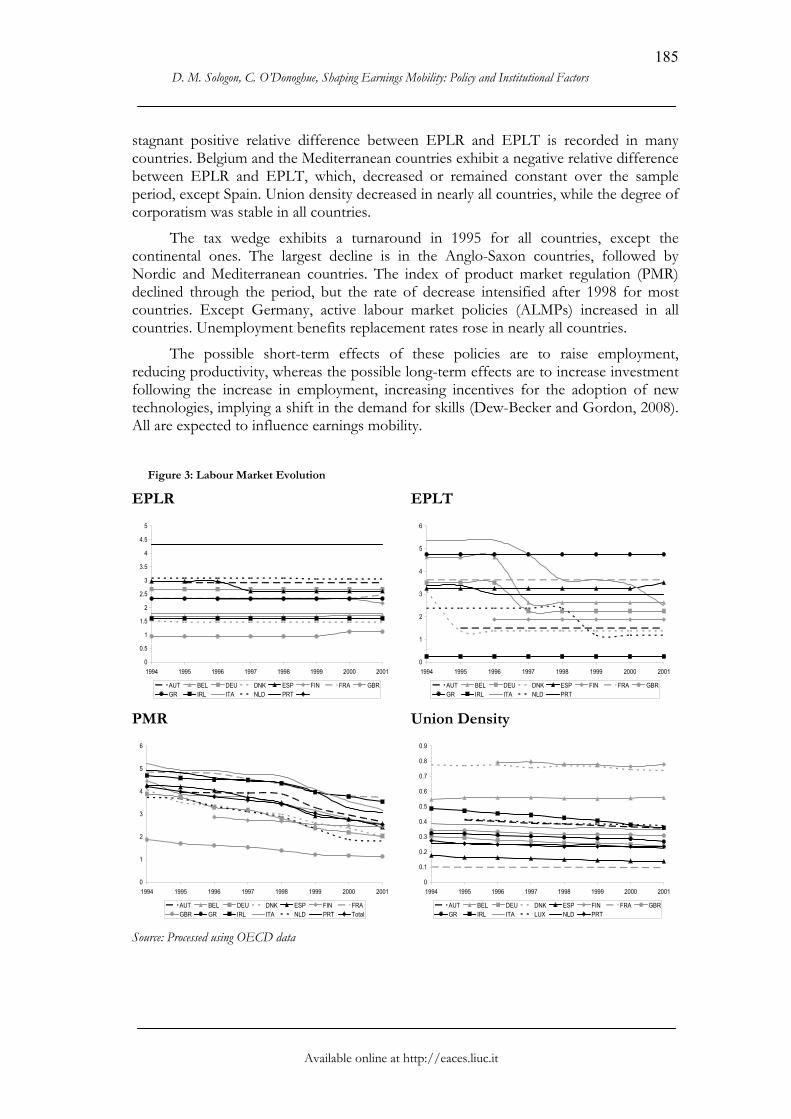
Figure 3 and Figure 4 offer an insight into how much labour market institutions vary across the 14 EU countries and how they evolved over time. There is a substantial heterogeneity across countries, which has the potential to explain the differences in earnings mobility. Over the period, the OECD index of employment protection legislation (EPL) decreased, although not monotonically in most countries under analysis. Employment protection legislation for regular contracts (EPLR) did not change much over time. The greatest changes are recorded for employment protection legislation for temporary contracts (EPLT). Over the sample period, an increasing or
4 The data was provided by email from the authors. 5 http://www.econ.ucdavis.edu/faculty/fzlinder/OECD%20data.html 6 For a more detailed description, please refer to Bassanini and Duval (2006a, 2006b) and the Lindert-
Allard OECD data sets 1950-2001.
Earnings Mobility
D. M. Sologon, C. O’Donoghue, Shaping Earnings Mobility: Policy and Institutional Factors
Available online at http://eaces.liuc.it
185
stagnant positive relative difference between EPLR and EPLT is recorded in many countries. Belgium and the Mediterranean countries exhibit a negative relative difference between EPLR and EPLT, which, decreased or remained constant over the sample period, except Spain. Union density decreased in nearly all countries, while the degree of corporatism was stable in all countries.
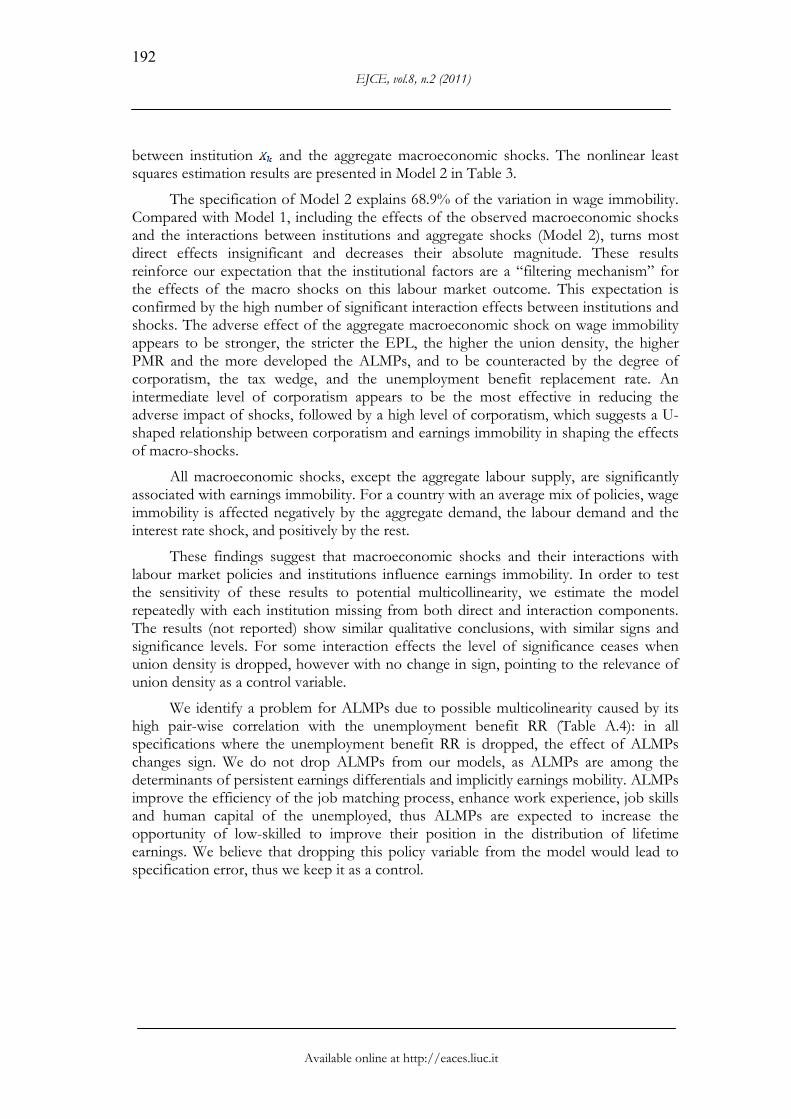
The tax wedge exhibits a turnaround in 1995 for all countries, except the continental ones. The largest decline is in the Anglo-Saxon countries, followed by Nordic and Mediterranean countries. The index of product market regulation (PMR) declined through the period, but the rate of decrease intensified after 1998 for most countries. Except Germany, active labour market policies (ALMPs) increased in all countries. Unemployment benefits replacement rates rose in nearly all countries.
The possible short-term effects of these policies are to raise employment, reducing productivity, whereas the possible long-term effects are to increase investment following the increase in employment, increasing incentives for the adoption of new technologies, implying a shift in the demand for skills (Dew-Becker and Gordon, 2008). All are expected to influence earnings mobility.
Figure 3: Labour Market Evolution
EPLR EPLT
0
0.5
1
1.5
2
2.5
3
3.5
4
4.5
5
1994 1995 1996 1997 1998 1999 2000 2001
AUT BEL DEU DNK ESP FIN FRA GBRGR IRL ITA NLD PRT
0
1
2
3
4
5
6
1994 1995 1996 1997 1998 1999 2000 2001
AUT BEL DEU DNK ESP FIN FRA GBRGR IRL ITA NLD PRT
PMR Union Density
0
1
2
3
4
5
6
1994 1995 1996 1997 1998 1999 2000 2001
AUT BEL DEU DNK ESP FIN FRAGBR GR IRL ITA NLD PRT Total
0
0.1
0.2
0.3
0.4
0.5
0.6
0.7
0.8
0.9
1994 1995 1996 1997 1998 1999 2000 2001
AUT BEL DEU DNK ESP FIN FRA GBRGR IRL ITA LUX NLD PRT
Source: Processed using OECD data

EJCE, vol.8, n.2 (2011)
Available online at http://eaces.liuc.it
186
Figure 4: Labour Market Evolution
Corporatism Tax Wedge
0
0.5
1
1.5
2
2.5
3
3.5
AUT BEL DEU DNK ESP FIN FRA GBR GR IRL ITA LUX NLD PRT
0
0.05
0.1
0.15
0.2
0.25
0.3
0.35
0.4
0.45
0.5
1994 1995 1996 1997 1998 1999 2000 2001
AUT BEL DEU DNK ESP FIN FRA GBRGR IRL ITA LUX NLD PRT
Unemployment Benefit RR ALMP
0
0.1
0.2
0.3
0.4
0.5
0.6
0.7
1994 1995 1996 1997 1998 1999 2000 2001
AUT BEL DEU DNK ESP FIN FRA GBRGR IRL ITA LUX NLD PRT
-0.2
0
0.2
0.4
0.6
0.8
1
1.2
1.4
1994 1995 1996 1997 1998 1999 2000 2001
AUT BEL DEU DNK ESP FIN FRA GBRGR IRL ITA LUX NLD PRT Total
Source: Processed using OECD data
However, the institutional factors do not exist in a vacuum. They are expected to interact with external factors, such as macroeconomic shocks. The evolution of some macroeconomic shocks is illustrated in Figure 5. Changes in demand and supply factors, in technology, in terms of trade, in real interest do not differ significantly among countries; hence they cannot themselves explain the changes in the inequality components. These trends are not surprising, given that these countries operate in the same world markets, with similar technology, industry and occupation mixes. Given that all countries face similar shocks, the difference in institutions can potentially explain the differences in outcomes across countries.

D. M. Sologon, C. O’Donoghue, Shaping Earnings Mobility: Policy and Institutional Factors
Available online at http://eaces.liuc.it
187
Figure 5: Evolution of macroeconomic shocks
-.05
0.0
5.1
Tota
l Pro
duct
ion
Fact
ors
Sho
ck
1994 1996 1998 2000 2002
-.05
0.0
5.1
Rea
l Int
eres
t Sho
ck
1994 1996 1998 2000 2002
-.2-.1
0.1
.2La
bour
Dem
and
Sho
ck
1994 1996 1998 2000 2002
-.2-.1
0.1
.2Te
rms
of T
rade
Sho
ck
1994 1996 1998 2000 2002
02
46
8A
ggre
gate
Dem
and
Sho
ck
1994 1996 1998 2000 2002
02
46
8A
ggre
gate
Sup
ply
Sho
ck
1994 1996 1998 2000 2002
Austria Belgium Denmark
France Ireland Italy
Netherlands Portugal Spain
UK Finland Germany
Luxembourg Greece
Source: Processed using OECD data
4. Quantifying the links between policy, institutions and earnings mobility
What are the factors explaining country heterogeneity in the level and the evolution of earnings mobility? We try to explain cross-country differences in this labour market outcome by relating to differences in the wage-setting mechanism and other labour marker institutions and policies, such as active labour market policies and income maintenance institutions (e.g. unemployment benefits), and institutional and policy changes, such as employment protection legislation, product market regulation, tax wedge, unionization.

EJCE, vol.8, n.2 (2011)
Available online at http://eaces.liuc.it
188
In quantifying the associations between labour market policies and institutions and our dependent variable we start with the simple pair-wise correlations, followed by complex models.
Table 2 presents the pair-wise correlations between earnings immobility and labour market institutions and macro-economic variables. Given the differences earnings immobility trends between the oldest three cohorts and the youngest cohort inin Figure 1, it is necessary to account for cohort heterogeneity when analysing the link between this labour market outcome and labour market institutional and policy factors. Pooling the oldest three cohorts, the immobility ratio exhibits a positive significant association with EPL, EPLR and PMR, and a significant negative association with union density and the unemployment benefit replacement rate. For the youngest cohort, the immobility ratio is significantly positively associated with the relative difference between EPLR and EPLT, and significantly negatively associated with the other factors except the union density and PMR. The correlations with the macroeconomic shocks reveal differences between cohorts. For the oldest cohorts, a significant positive association is observed for the terms of trade shock. For the youngest cohort, a significant positive association is observed for the labour demand shock, and a significant negative association with the real interest rate shock.
Table 2. Pair-wise correlations between the immobility ratio and labour market institutional factors and macroeconomic shocks
Pair wise Correlations Immobility (PV/TV)
Cohort 1940-1969 Cohort 1970-1981
EPL 0.140** -0.317***
EPL regular contracts (EPLR) 0.225*** -0.263***
EPL temporary contracts (EPLT) 0.051 -0.254**
[(EPLR-EPLT)/EPLT]*100 0.024 0.593***
Union Density -0.245*** -0.110
Degree of Corporatism -0.086 -0.201*
Tax Wedge -0.066 -0.449***
PMR 0.160*** 0.018
Active Labour Market Policies -0.063 -0.184*
Average Unemployment Benefit RR -0.114* -0.465***
Labour Demand Shock 0.066 0.574***
Terms of Trade Shock 0.105* 0.102
Total Factor Production Shock -0.041 0.163
Real Interest Shock -0.056 -0.218**
Aggregate Supply Shock -0.014 -0.103
Aggregate Demand Shock -0.092 -0.003 Note: * = significant at 10%; **= significant at 5%; ***= significant at 1%.

D. M. Sologon, C. O’Donoghue, Shaping Earnings Mobility: Policy and Institutional Factors
Available online at http://eaces.liuc.it
189
Nevertheless, these correlations only tell a partial story, neglecting the complex interactions between institutions on the one hand, and between institutions and macroeconomic shocks on the other hand. Institutional factors are expected to shape the pattern and the level of earnings immobility not only directly, but also in interaction with macroeconomic shocks, with the institutional framework expected to be a “filtering mechanism” for the adverse effects that these shocks might have on earnings mobility.
To explore these interactions, we use a nonlinear least squares regression. The biggest advantage of nonlinear least squares regression over other techniques is its high degree of flexibility in specifying a broad range of functions. The way the parameters of a nonlinear function are estimated, however, is conceptually the same as in linear least squares regressions. Another advantage is the efficient use of data, producing good estimates in relatively small datasets.
Given the complexity of the interactions between institutions and between institutions and shocks, a systematic analysis of all interactions is not straightforward. A model with eight policies and institutions implies incorporating a total of 28 cross-institutional interactions, leading to a substantial loss of degrees of freedom. When we consider also shocks, the matter complicates even further. As a work-around, we adopt a nonlinear strategy that incorporates these interactions, avoiding at the same time a substantial loss of degrees of freedom, in the tradition of Blanchard and Wolfers (1999).
Models are estimated independently, with cohorts and countries pooled together. The unit of analysis is the cohort, with four cohorts per country, with observations between 1994 and 20017. We proceed in two steps. First, we test whether policies interact with the overall institutional framework, controlling for cohorts effects and for all the unobserved shocks captured by time effects. Second, we test whether there are any specific interactions between institutional factors and observed aggregate shocks in shaping the pattern of earnings mobility.
One problem is the endogeneity between institutions and overall inequality that is expected to be transferred to the two inequality components, and consequently to earnings mobility. The lack of good instruments prevents us from correcting this problem. Hence, our estimates reflect the complex associations that exist between earnings mobility and the institutional framework, and not causal relationships.
4.1 Systemic interactions between institutions
The interactions between institutions are specified in a multiplicative form between deviations of institutions from their sample mean, as is typical in macroeconomic equations (Bassanini and Duval 2006a, 2006b; Blanchard and Wolfers, 1999). This enables the interpretation of the marginal effects of each institution when the others are kept constant at the sample mean. Incorporating all possible cross-interactions between institutions is not feasible given the substantial loss of degrees of freedom. In order to account for these interactions, we build a nonlinear specification,
7 Exceptions are countries which are not observed for all eight waves, and consequently have fewer
observations.

EJCE, vol.8, n.2 (2011)
Available online at http://eaces.liuc.it
190
where each institution is interacted with the overall institutional framework, defined as the sum of the direct effects of institutions.
Model 1: (4)
The parameters , , and are estimated simultaneously:
• represents wage immobility of cohort i in year t;
• denotes the direct effect of institution on , for a country with an average mix of policies and institutions;
• indicates the interaction between and the overall institutional framework, expressed as the sum of direct effect of policies and institutions, expressed in deviation form in the interaction, where is measured at the country level - a negative and significant effect suggests a systemic reform complementarity between and the overall framework in reducing earnings immobility;
• and represent cohort and period shifters, which capture cohort heterogeneity and all the unobserved shocks that might affect earnings immobility by altering the slopes of the direct and indirect effects.
This complex multiplicative form however can neither be transformed into a linear form, nor be estimated with a linear model. It requires a nonlinear least squares estimation strategy.
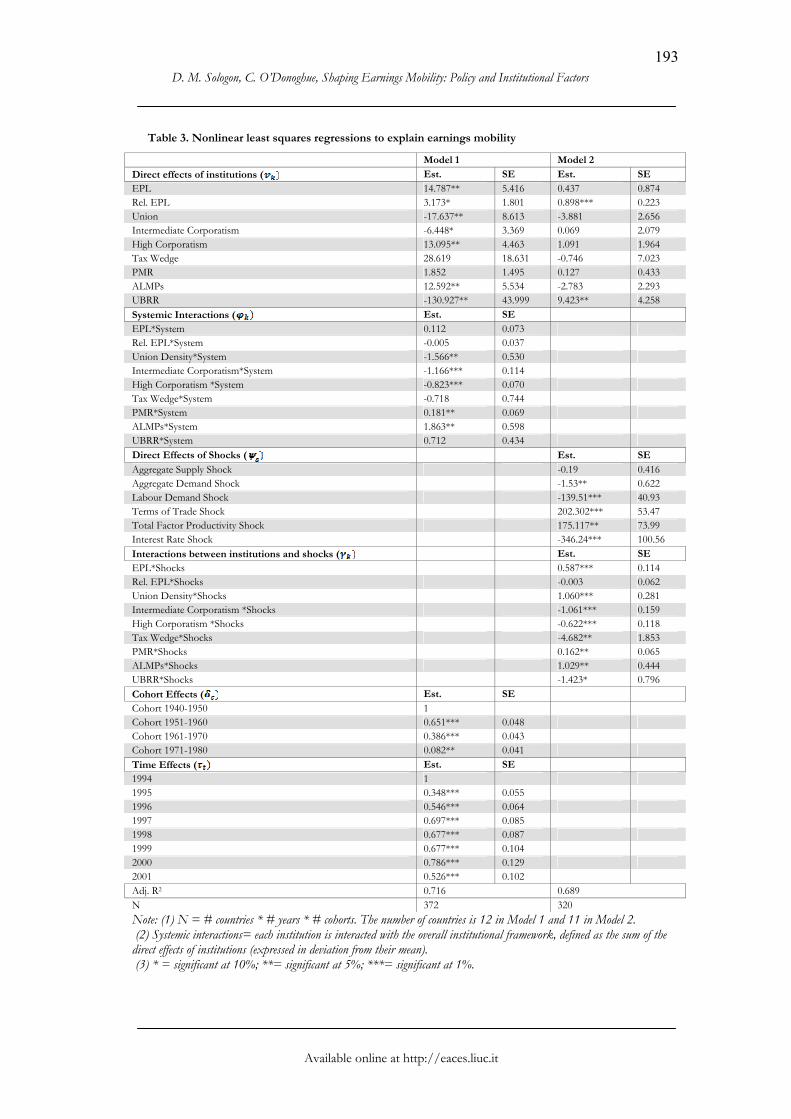
The estimation results are included in Table 3. The results regarding systemic interactions are reported in Model 1. The model with systemic interactions is estimated to explain 71.6% of the cross-country variation in earnings immobility between 1994 and 2001. The cohorts shifters are highly significant, reconfirming the cohort-heterogeneous trends identified by the error component model in Sologon and O’Donoghue (2010a) and Sologon (2010): the older the cohort, the higher the immobility. The time effects are highly significant, indicating that, overall, at the EU level, controlling for the institutional and the cohort effects, the unobserved shocks had a decreasing effect on wage immobility between 1994 and 2001. Thus under the impact of unobserved shocks, the wage distribution in a country with an average mix of policies and institutions became more mobile in 2001 compared to 1994.
The direct effects of institutions indicate that for a country with an average mix of institutions:
• An increase in the strictness of employment protection legislation (EPL), in the relative difference between employment protection legislation for regular contracts (EPLR) and temporary contracts (EPLT), and in active labour market policies (ALMPs) is associated with an increase in earnings immobility.

D. M. Sologon, C. O’Donoghue, Shaping Earnings Mobility: Policy and Institutional Factors
Available online at http://eaces.liuc.it
191
• A U-shaped profile is found for the degree of corporatism, with the intermediate corporatism triggering the lowest earnings immobility.
• An increase in the union density and the unemployment benefit replacement rate is associated with a decrease in earnings immobility.
The systemic interactions suggest that there is:
• a complementarity with the overall framework in reducing wage immobility for the union density and the degree of corporatism – with a stronger negative effect for intermediate than for high corporatism: the more mobility-friendly the overall institutional framework is, the greater is the reducing impact of union density and the degree of corporatism.
• PMR and ALMPs counteract with the overall framework, in a tendency to increase wage immobility.
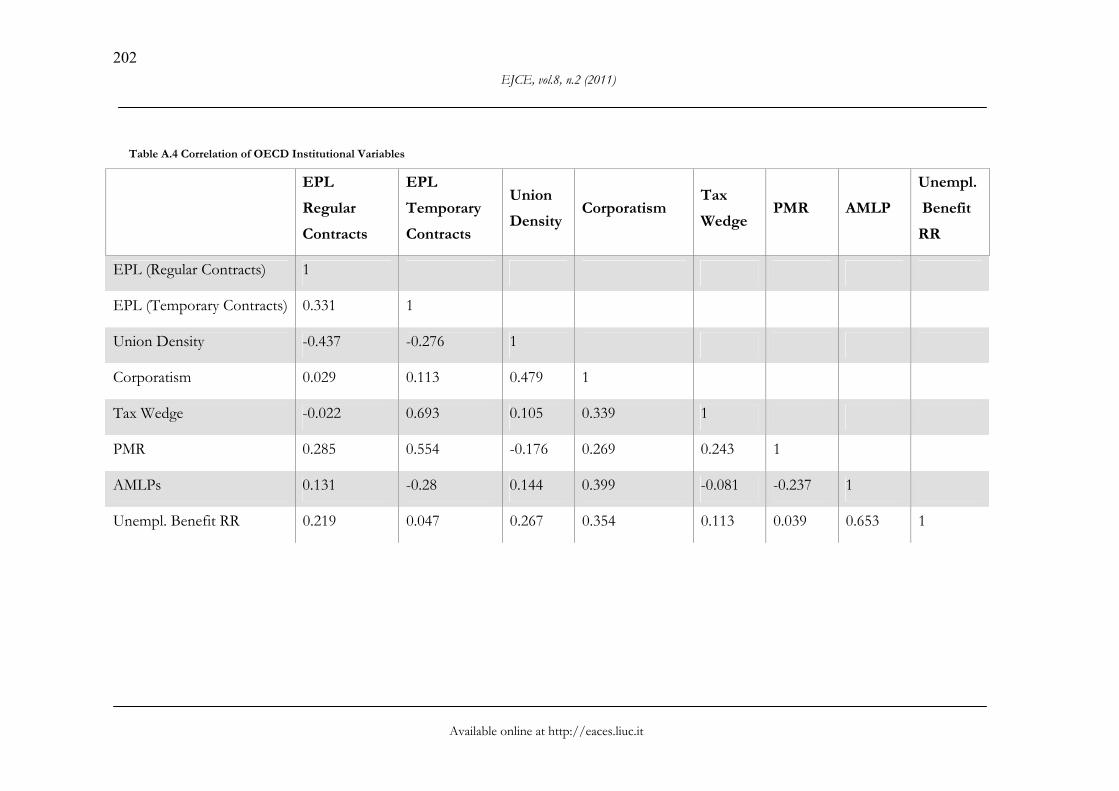
As there may be some multicollinearity between explanatory variables in our model, we show in Table A.4 in the Appendix the pair-wise correlation between the variables. Three variables have a correlation greater than 0.5: both tax wedge and PMR with EPL (Temporary Contracts) and unemployment benefit RR with AMLP. In order to test the sensitivity of the model to potential multicollinearity, we estimate the model repeatedly with each variable missing from both direct and systemic components. Table 4 reports the results. In general, although not robust to value, it is robust to sign. Some noticeable differences where the sign changes however are the direct impact of PMR with the ALMP’s dropped; the direct and systemic impact of ALMPs and the systemic impact of high corporatism with unemployment benefit RR dropped; the systemic impact of the tax wedge with EPL dropped; the systematic impact of the unemployment benefit RR with corporatism dropped. These are consistent with the highest pair-wise correlations and so caution is required in relation to the interpretation of these interactions. Also in a number of cases the level of significance ceases, particularly when union density is dropped. These results do not however significantly affect the main conclusions of this paper.
4.2 Institutions and shocks
This section explores the specific interactions between institutions and macroeconomic shocks, expected to shape the pattern of earnings mobility. We allow the effects to differ by cohorts to account for cohort heterogeneity. The nonlinear model is expressed as follows.
Model 2: (5)
is a set of observed macroeconomic shocks expressed in deviation from their mean (Blanchard and Wolfers, 1999), which are interacted with policy and institutional factors. , , and are estimated simultaneously. now represents the direct effect of institution when the other intuitions and shocks are at their sample means, captures the direct effects of shocks and capture the interaction effect
EJCE, vol.8, n.2 (2011)
Available online at http://eaces.liuc.it
192
between institution and the aggregate macroeconomic shocks. The nonlinear least squares estimation results are presented in Model 2 in Table 3.
The specification of Model 2 explains 68.9% of the variation in wage immobility. Compared with Model 1, including the effects of the observed macroeconomic shocks and the interactions between institutions and aggregate shocks (Model 2), turns most direct effects insignificant and decreases their absolute magnitude. These results reinforce our expectation that the institutional factors are a “filtering mechanism” for the effects of the macro shocks on this labour market outcome. This expectation is confirmed by the high number of significant interaction effects between institutions and shocks. The adverse effect of the aggregate macroeconomic shock on wage immobility appears to be stronger, the stricter the EPL, the higher the union density, the higher PMR and the more developed the ALMPs, and to be counteracted by the degree of corporatism, the tax wedge, and the unemployment benefit replacement rate. An intermediate level of corporatism appears to be the most effective in reducing the adverse impact of shocks, followed by a high level of corporatism, which suggests a U-shaped relationship between corporatism and earnings immobility in shaping the effects of macro-shocks.
All macroeconomic shocks, except the aggregate labour supply, are significantly associated with earnings immobility. For a country with an average mix of policies, wage immobility is affected negatively by the aggregate demand, the labour demand and the interest rate shock, and positively by the rest.
These findings suggest that macroeconomic shocks and their interactions with labour market policies and institutions influence earnings immobility. In order to test the sensitivity of these results to potential multicollinearity, we estimate the model repeatedly with each institution missing from both direct and interaction components. The results (not reported) show similar qualitative conclusions, with similar signs and significance levels. For some interaction effects the level of significance ceases when union density is dropped, however with no change in sign, pointing to the relevance of union density as a control variable.
We identify a problem for ALMPs due to possible multicolinearity caused by its high pair-wise correlation with the unemployment benefit RR (Table A.4): in all specifications where the unemployment benefit RR is dropped, the effect of ALMPs changes sign. We do not drop ALMPs from our models, as ALMPs are among the determinants of persistent earnings differentials and implicitly earnings mobility. ALMPs improve the efficiency of the job matching process, enhance work experience, job skills and human capital of the unemployed, thus ALMPs are expected to increase the opportunity of low-skilled to improve their position in the distribution of lifetime earnings. We believe that dropping this policy variable from the model would lead to specification error, thus we keep it as a control.
D. M. Sologon, C. O’Donoghue, Shaping Earnings Mobility: Policy and Institutional Factors
Available online at http://eaces.liuc.it
193
Table 3. Nonlinear least squares regressions to explain earnings mobility
Model 1 Model 2
Direct effects of institutions ( Est. SE Est. SE EPL 14.787** 5.416 0.437 0.874 Rel. EPL 3.173* 1.801 0.898*** 0.223 Union -17.637** 8.613 -3.881 2.656 Intermediate Corporatism -6.448* 3.369 0.069 2.079 High Corporatism 13.095** 4.463 1.091 1.964 Tax Wedge 28.619 18.631 -0.746 7.023 PMR 1.852 1.495 0.127 0.433 ALMPs 12.592** 5.534 -2.783 2.293 UBRR -130.927** 43.999 9.423** 4.258 Systemic Interactions ( Est. SE EPL*System 0.112 0.073 Rel. EPL*System -0.005 0.037 Union Density*System -1.566** 0.530 Intermediate Corporatism*System -1.166*** 0.114 High Corporatism *System -0.823*** 0.070 Tax Wedge*System -0.718 0.744 PMR*System 0.181** 0.069 ALMPs*System 1.863** 0.598 UBRR*System 0.712 0.434 Direct Effects of Shocks ( Est. SE Aggregate Supply Shock -0.19 0.416 Aggregate Demand Shock -1.53** 0.622 Labour Demand Shock -139.51*** 40.93 Terms of Trade Shock 202.302*** 53.47 Total Factor Productivity Shock 175.117** 73.99 Interest Rate Shock -346.24*** 100.56 Interactions between institutions and shocks ( Est. SE EPL*Shocks 0.587*** 0.114 Rel. EPL*Shocks -0.003 0.062 Union Density*Shocks 1.060*** 0.281 Intermediate Corporatism *Shocks -1.061*** 0.159 High Corporatism *Shocks -0.622*** 0.118 Tax Wedge*Shocks -4.682** 1.853 PMR*Shocks 0.162** 0.065 ALMPs*Shocks 1.029** 0.444 UBRR*Shocks -1.423* 0.796 Cohort Effects ( Est. SE Cohort 1940-1950 1 Cohort 1951-1960 0.651*** 0.048 Cohort 1961-1970 0.386*** 0.043 Cohort 1971-1980 0.082** 0.041 Time Effects ( Est. SE 1994 1 1995 0.348*** 0.055 1996 0.546*** 0.064 1997 0.697*** 0.085 1998 0.677*** 0.087 1999 0.677*** 0.104 2000 0.786*** 0.129 2001 0.526*** 0.102 Adj. R2 0.716 0.689 N 372 320 Note: (1) N = # countries * # years * # cohorts. The number of countries is 12 in Model 1 and 11 in Model 2. (2) Systemic interactions= each institution is interacted with the overall institutional framework, defined as the sum of the direct effects of institutions (expressed in deviation from their mean). (3) * = significant at 10%; **= significant at 5%; ***= significant at 1%.

EJCE, vol.8, n.2 (2011)
Available online at http://eaces.liuc.it
194
Table 4. Sensitivity test
Direct effects Model 1 - no EPL Model 1 - no Union Model 1 - no Corporatism Model 1 - no Tax Wedge Model 1 - no PMR Model 1 - no ALMPs Model 1 – no UBRR
Institutions Est. P value Est. P value Est. P value Est. P value Est. P value Est. P value Est. P value
EPL . . 1.563 0.256 2.238 0.000 14.495 0.000 9.287 0.063 19.056 0.078 1.070 0.001
Rel. EPL . . -0.205 0.691 0.807 0.000 2.376 0.082 3.993 0.015 9.651 0.068 0.318 0.031
Union -15.414 0.092 . . 0.367 0.649 -8.127 0.028 -20.908 0.037 -88.753 0.096 -1.594 0.007
Inter. Corp. -7.371 0.081 0.386 0.788 . . -4.716 0.034 6.007 0.229 -16.770 0.105 -0.556 0.048
High Corp. 6.532 0.063 4.089 0.071 . . 12.370 0.000 8.088 0.046 24.311 0.123 0.591 0.002
Tax Wedge 54.148 0.044 14.384 0.150 15.078 0.000 . . 37.803 0.016 52.315 0.050 5.459 0.004
PMR 4.724 0.027 2.734 0.047 -0.373 0.114 3.042 0.040 . . -7.643 0.075 -0.071 0.641
ALMPs 12.405 0.031 8.419 0.105 2.211 0.017 17.318 0.000 3.843 0.284 . . -1.218 0.056
UBRR -74.488 0.051 -40.012 0.114 -12.881 0.000 -123.716 0.000 -75.639 0.033 -18.389 0.265 . .
Systemic Interaction Est. P value Est. P value Est. P value Est. P value Est. P value Est. P value Est. P value
EPL*System . . 0.023 0.892 -1.289 0.106 0.102 0.170 0.290 0.029 0.084 0.557 0.417 0.786
Rel. EPL*System . . -0.286 0.136 -2.431 0.001 0.009 0.780 0.046 0.330 -0.123 0.264 -4.689 0.001
Union*System -3.196 0.045 . . -7.680 0.002 -1.723 0.000 -2.748 0.020 -0.663 0.254 -18.233 0.007
Inter. Corp.
*System -1.768 0.000 -0.610 0.097 . . -1.172 0.000 -1.375 0.000 2.400 0.209 0.189 0.945
High Corp. *System -0.587 0.012 -0.839 0.000 . . -0.808 0.000 -0.388 0.154 -0.509 0.101 2.158 0.076
Tax Wedge
*System 1.154 0.089 -6.503 0.116 -35.259 0.000 . . -2.773 0.169 -7.732 0.110 -70.280 0.001
PMR*System 0.160 0.025 0.251 0.065 0.284 0.496 0.172 0.000 . . -0.124 0.171 -1.232 0.142
ALMPs*System 2.141 0.035 6.333 0.050 4.181 0.109 1.915 0.000 0.693 0.131 . . -1.261 0.657
UBRR*System 2.008 0.061 -5.842 0.104 -7.126 0.029 0.915 0.018 2.161 0.018 -1.854 0.133 . .
Cohort Eff. Est. P value Est. P value Est. P value Est. P value Est. P value Est. P value Est. P value
C. 1951-1960 0.670 0.000 0.672 0.000 0.755 0.000 0.656 0.000 0.676 0.000 0.601 0.000 0.761 0.000
C. 1961-1970 0.404 0.000 0.400 0.000 0.443 0.000 0.387 0.000 0.397 0.000 0.350 0.000 0.450 0.000
C. 1971-1980 0.085 0.055 0.085 0.047 0.095 0.043 0.082 0.045 0.084 0.045 0.073 0.070 0.099 0.038
Time Eff. yes yes yes yes yes yes yes
Adj. R2 0.686 0.700 0.678 0.715 0.711 0.710 0.673 Note: EPL = Employment protection legislation, Union = union density, Corp = corporatism (intermediate and high), PMR= product market regulation, ALMPs = active labour market policies, UBRR=unemployment benefit replacement rate.

D. M. Sologon, C. O’Donoghue, Shaping Earnings Mobility: Policy and Institutional Factors
Available online at http://eaces.liuc.it
195
5. Concluding remarks and discussion
Earnings mobility is an important determinant of welfare. In this paper, using a mobility measure estimated with ECHP and OECD data, we have tried to understand the role of labour market policy and institutional factors in explaining the differences in earnings mobility across Europe in the 1990s. Starting with early 1990s, most EU labour markets started a set of institutional employment-friendly reforms aimed to increase labour market flexibility. These reforms led to an increase in country heterogeneity, reflected also in the level and the evolution of earnings mobility.
To what extent do labour market policies and institutional factors shape earnings mobility across the 14 EU countries? The nonlinear least squares estimation results reveal a complex framework, where institutions interact significantly with each other and with the macroeconomic shocks in shaping the pattern of earnings mobility. We summarize and discuss the most robust findings.
For a country with an average institutional mix, the strictness of employment protection legislation (EPL) emerges as positively associated with earnings immobility. Our findings are consistent with the argument that EPL increases labour market rigidity by reducing labour turnover through increasing the cost of hirings and of layoffs (Cazes and Nesporova, 2003). The negative impact of a strict EPL affects mainly vulnerable groups with temporary work contracts which have a weaker protection in the labour market. Additionally, robust across specifications, EPL is found to exacerbate the adverse effects of macro-economic shocks on earnings immobility, consistent with the belief that the adverse effect of a strict EPL is augmented in periods of economic volatility when irregular jobs tend to increase at the expense of regular jobs.
A strict regulation in the product market (PMR) is also found to be a source of labour market rigidity, exacerbating the adverse effects of macro-economic shocks on earnings immobility. A possible explanation is that under a highly regulated product market, between-group persistent differentials (between workers in regulated and non-regulated sectors) may be exacerbated by macro shocks, as regulated sectors are characterized by a reduced competition, a reduced labour demand elasticity which favours a strong capture of labour market rents (Nickell, 1999). Ceteris paribus, increasing persistent differentials signal decreasing earnings mobility.
For a country with an average mix of policies and institutions, relative to earnings immobility we find a negative association with union density. Additionally we bring evidence of a reform complementarity with the overall system in reducing earnings immobility: the more mobility-friendly the overall institutional framework is the greater is the reducing impact of union density. This finding is consistent with the view that unions affect wage dispersion and implicitly wage mobility indirectly, mainly through their impact on training and minimum wage. By forcing employers to provide training to their employees, they increase the employees’ human capital and adaptability to new technologies (Aghion and Williamson, 2001), thus increasing their opportunity to improve their position in the distribution of lifetime earnings. However, we find robust evidence that union density is among the factors which amplify the adverse effects of macroeconomic shocks on earnings immobility. This may suggest that periods of high economic volatility may increase persistent earnings differentials between non-unionized and unionized workers, with a negative effect on earnings mobility.

EJCE, vol.8, n.2 (2011)
Available online at http://eaces.liuc.it
196
For a country with an average mix of institutions, robust across most specifications, we find a U-shaped relationship between the degree of corporatism and earnings immobility. Additionally, we bring evidence of reform complementarity with the overall system in reducing earnings immobility, with a stronger reducing effect for an intermediate level than for a high level. A similar U-shaped relationship between corporatism and earnings immobility is found in counteracting the adverse effect of macro-shocks on wage mobility. This finding is consistent with the pro-corporatist view, which states that corporatist systems deal with the adjustment to aggregate shocks, increasing wage flexibility (Teulings and Hartog, 2008).
In the face of macro-shocks, longer and more generous unemployment benefits represent incentives not to accept low-paid jobs. Thus they may improve the job-matching and increase the likelihood of a more stable employment and earnings patterns (Bassanini and Duval, 2006b, 2006a), with a positive impact on earnings mobility in the long-run. This is consistent with our finding which places the generosity of the unemployment benefit among the factors counteracting the adverse effects of macro-shocks on wage mobility.
Besides their interactions with labour market policies and institutions, the macro-economic shocks (except aggregate supply) are significantly associated with earnings immobility. We find negative associations with positive shocks in demand factors and in the real interest rate. Overall, we conclude that not only institutions, but also macroeconomic shocks and their interactions with labour market policies and institutions shape earnings mobility.
The concluding message of this paper is that a number of factors including less regulated labour and product markets, more unionisation, an intermediate corporatism, better protection for the unemployed and a more favourable economic environment are associated with a higher earnings mobility.
D. M. Sologon, C. O’Donoghue, Shaping Earnings Mobility: Policy and Institutional Factors
Available online at http://eaces.liuc.it
197
References
Aaberge R. et al. (2002), ‘Income Inequality and Income Mobility in the Scandinavian Countries Compared to the United States’, Review of Income and Wealth, 48(4)
Aghion P., Williamson J. G. (2001), Growth, Inequality, and Globalization, Cambridge University Press
Aidt T., Tzannatos Z. (2002), Unions and Collective Bargaining: Economic Effects in a Global Environment, The World Bank.
Atkinson A. B., Bourguignon F. J., Morrisson C. (1992)‚ Empirical Studies of Earnings Mobility, Harwood Academic Publishers
Baker M. (1997), ‘Growth-Rate Heterogeneity and the Covariance Structure of Life-Cycle Earnings’, Journal of Labor Economics 15(2), 338-375
Baker M., Solon G. (2003), ‘Earnings Dynamics and Inequality among Canadian Men, 1976-1992: Evidence from Longitudinal Income Tax Records’, Journal of Labor Economics 21(2), 289-321
Bassanini A., Duval R. (2006a), ‘The Determinants of Unemployment across OECD Countries: Reassessing the Role of Policies and Institutions’, OECD Economics Studies, 42
Bassanini A., Duval R. (2006b), ‘Employment Patterns in OECD Countries: Reassessing the Role of Policies and Institutions’, OECD Economics Department Working Papers, 486
Benabou R., Ok E. A. (2001), ‘Mobility and Progressivity: Ranking Income Processes According to Equality of Opportunity’, NBER Working Paper, 8431
Blanchard O., Wolfers J. (1999), ‘The Role of Shocks and Institutions in the Rise of European Unemployment: The Aggregate Evidence’, NBER Working Papers 7282, National Bureau of Economic Research
Blau F. D., Kahn L. M. (1999), ‘Institutions and laws in the labor market’, Handbook of Labor Economics, Ashenfelter O. and Card D. (eds), 25(3), 1399-1461, Elsevier
Blundell R. Preston I. (1998), ‘Consumption inequality and income uncertainty’, Open Access Publications from University College London, <http://eprints.ucl.ac.uk/>
Brukhauser R.V., Poupore J.G. (1997), ‘A Cross-National Comparison of Permanent Inequality in the United States and Germany’, Review of Economics and Statistics, 79, 10-17
Burkhauser R. V., Holtz-Eakin D., Rhody S. E. (1997), ‘Labor Earnings Mobility and Inequality in the United States and Germany during the Growth Years of the 1980s’, International Economic Review, 38, 775-94
Cappellari L. (2003), ‘The Dynamics and Inequality of Italian Men’s Earnings’, The Journal of Human Resources, 39, 475-99
Cazes S., Nesporova A. (2004), ‘Labour Markets in Transition: Balancing Flexibility and Security in Central and Eastern Europe’, Revue de l’OFCE, 5, 23-54
Creedy J., Wilhelm M. (2002), ‘Income Mobility, Inequality and Social Welfare’, Australian Economic Papers, 41(2), 140-150
Daly M. C., Valletta R. G. (2005), ‘Cross-National Trends in Earnings Instability and Earnings Inequality’, Economic Letters, 99(2), 215-219
Dew-Becker I., Gordon R. J. (2008), ‘The Role of Labor Market Changes in the Slowdown of European Productivity Growth’, NBER Working Paper 13840, National Bureau of Economic Research
EJCE, vol.8, n.2 (2011)
Available online at http://eaces.liuc.it
198
Dickens R. (2000a), ‘Caught in a Trap? Wage Mobility in Great Britain: 1975-1994’. Economica, 67(268), 477-497
Dickens R. (2000b), ‘The Evolution of Individual Male Earnings in Great Britain: 1975-95’, The Economic Journal, 110(460), 27-49
Fields G. S. (2008), ‘Does Income Mobility Equalize Longer-Term Incomes? New Measures of an Old Concept’, Journal of Economic Inequality, 8(4), 409-427
Fields G. S., Ok E. A. (1999), ‘Measuring Movement of Incomes’, Economica, 66(264), 455-71 Fortin N. M., Lemieux T. (1997), ‘Institutional Changes and Rising Wage Inequality: Is There a
Linkage?’, Journal of Economic Perspectives 11(2), 75-96 Freeman R. B. (1975), ‘Overinvestment in College Training?’, Journal of Human Resources 10, 287-
311 Freeman R. B., Katz L. F. (1994), ‘Rising Wage Inequality: the United States vs. Other
Advanced Countries’, Working under different rules, Freeman R. B. (eds), Russel Sage Foundation, New York, 29-62
Friedman M. (1962), Capitalism and Freedom, University of Chicago Press, Chicago Friedman M. Kuznets S. (1954), Income from independent professional practice, National Bureau of
Economic Research, New York Fritzell J. (1990), ‘The Dynamics of Income Distribution: Economic Mobility in Sweden in
Comparison with the United States’, Social Science Research, 19(1) Gottschalk P., Spolaore E. (2002), ‘On the Evaluation of Economic Mobility’, Review of Economic
Studies, 68, 191-208 Gustavsson M. (2007), ‘The 1990s Rise in Swedish Earnings Inequality - Persistent or
Transitory?’, Applied Economics, 39(1), 25-30 Gustavsson M. (2008), ‘A New Picture of Swedish Earnings Inequality: Persistent and
Transitory Components, 1960-1990’, Review of Income and Wealth, 54(3) Haider S. (2001), ‘Earnings Instability and Earnings Inequality of Males in the United States:
1967-1991’, Journal of Labor Economics, 19(4), 799-836 Hause J.C. (1980), ‘The Fine Structure of Earnings and the On-the-job Training Hypothesis’,
Econometrica 48(4), 1013-1029 Hofer H., Weber A. (2002), ‘Wage mobility in Austria 1986-1996?’, Labour Economics, 9, 563-577 Kalwij A., Alessie R. (2003), ‘Permanent and Transitory Wage Inequality of British Men, 1975-
2001: Year, Age and Cohort Effect’, Journal of Applied Econometrics, 22, 1063-1093 Katz L. F., Autor D. H. (1999), ‘Changes in the Wage Structure and Earnings Inequality’,
Handbook of Labor Economics, Ashenfelter O. and Card D. (eds), 26(3), 1463-555, Elsevier Lindert-Allard OECD data set 1950-2001, Wired at
<http://www.econ.ucdavis.edu/faculty/fzlinder/OECD%20data. html> Mincer J. (1957), A study of income distribution, Columbia University. Mincer J. (1958), ‘Investment in Human Capital and Personal Income Distribution’, Journal of
Political Economy, 66(4), 281-302 Mincer J. (1962), ‘On-the-job Training: Costs, Returns and Some Implications’, Journal of Political
Economy, 70(5, Part 2), S50-S79 Mincer J. (1974), Schooling, experience and earnings, National Bureau of Economic Research, New
York Moffitt R., Gottschalk P. (1995), ‘Trends in the Covariance Structure of Earnings in the United
States: 1969-1987’, Institute for Research on Poverty Discussion Papers, 1001-93, University of Wisconsin Institute for Research on Poverty

D. M. Sologon, C. O’Donoghue, Shaping Earnings Mobility: Policy and Institutional Factors
Available online at http://eaces.liuc.it
199
Moffitt R., Gottschalk P. (1998), ‘Trends in the Variances of Permanent and Transitory Earnings in the U.S. and their Relation to Earnings’, Boston College Working Papers, 444
Moffitt R., Gottschalk P. (2002), ‘Trends in the Transitory variance of Earnings in the United States’, The Economic Journal 112(478), C68-C73
Moffitt R. A., Gottschalk P. (2011), ‘Trends in the Transitory Variance of Male Earnings in the U.S., 1970-2004’, National Bureau of Economic Research, Working Paper 16833
Nickell S. (1999), ‘Product markets and labour markets’, Labour Economics, 6(1), 1-20 OECD (1996), Employment Outlook, OECD, Paris OECD (1997), Employment Outlook, OECD, Paris OECD (2004), ‘Employment Protection Regulation and Labour Market Performance’,
Employment Outlook, OECD, Paris Palier B. (ed.) (2010), A Long Goodbye to Bismark? The Politics of Welfare Reform in Continental Europe,
Amsterdam University Press, Amsterdam Ramos X. (2003), ‘The Covariance Structure of Earnings in Great Britain, 1991-1999’, Economica,
70(278), 353-374 Rodrik D. (1997), Has Globalization Gone Too Far?, Institute for International Economics,
Washington, DC Sologon D. M. (2010), Earnings Dynamics in Europe, PhD thesis, Boekenplan, Maastricht
University Sologon D. M., O’Donoghue C. (2010a), ‘Earnings Dynamics and Inequality in the EU’, 1994-
2001, CEPS/INSTEAD Working Paper Series, 2010-34, CEPS/INSTEAD Sologon D. M., O’Donoghue C. (2010b), ‘Earnings Mobility in the EU: 1994-2001’,
CEPS/INSTEAD Working Paper Series, 2010-36, CEPS/INSTEAD Shorrocks A. F. (1978), ‘Income Inequality and Income Mobility’, Journal of Economic Theory, 19,
376-393 Teulings C., Hartog J. (2008), Corporatism or Competition? Labour Contracts, Institutions and Wage
Structures in International Comparison, Cambridge University Press Topel R. H. (1997), ‘Factor Proportions and Relative Wages: The Supply-Side Determinants of
Wage Inequality’, The Journal of Economic Perspectives, 11(2), 55-74 Van Kerm P. (2004), ‘What lies behind income mobility? Reranking and distributional change in
Belgium, Western Germany, and the USA’, Economica, 71, 223-239 Weizsacker R. K. V. (1993), A theory of earnings distributions, Cambridge University Press, New
York

EJCE, vol.8, n.2 (2011)
Available online at http://eaces.liuc.it
200
Appendix
Table A.1 Description of OECD variables
OECD Variables Description
Source: Bassanini and Duval (2006a, 2006b)
EPL = Employment Protection Legislation OECD summary indicator of the stringency of Employment Protection Legislation. EPL ranges from 0 to 6.
EPLR = Employment Protection Legislation for regular contracts
OECD summary indicator of the stringency of Employment Protection Legislation for regular contracts
EPLT= Employment Protection Legislation for temporary contracts
OECD summary indicator of the stringency of Employment Protection Legislation for temporary contracts
Union Density Trade union density rate, i.e. the share of workers affiliated to a trade union, in %.
Degree of Corporatism Indicator of the degree of centralisation/co-ordination of the wage bargaining processes, which takes values 1 for decentralised and uncoordinated processes, and 2 and 3 for intermediate and high
Tax Wedge The tax wedge expresses the sum of personal income tax and all social security contributions as a percentage of total labour cost.
PMR
= Product Market Regulation
OECD summary indicator of regulatory impediments to product market competition in seven non-manufacturing industries. The data used in this paper cover regulations and market conditions in seven energy and service industries. PMR ranges from 0 to 6.
ALMPs = Public expenditures on active labour market
policies
Public expenditures on active labour market programmes per unemployed worker as a share of
GDP per capita, in %.
Average unemployment benefit replacement rate
(UBRR)
Average unemployment benefit replacement rate across two income situations (100% and 67% of APW earnings), three family situations (single, with dependent spouse, with spouse in work)
Labour Demand Shock Logarithm of the labour share in business sector GDP purged from the short-run influence of factor prices.
Terms of Trade Shock Logarithm of the relative price of imports weighted by the share of imports in GDP
Total Factor Productivity Shock
Deviation of the logarithm of Total Factor Productivity (TFP) from its trend calculated by means of a Hodrick-Prescott (HP) filter (smoothing parameter λ = 100)
Real Interest Shock Difference between the 10-year nominal government bond yield (in %) and the annual change in the GDP deflator (in %).
Lindert-Allard OECD data sets 1950-2001
Aggregate Supply Shock
At the OECD level, amplified by openness = (INFLOECD-UNCHOECD)*OPEN/100 , INFLOECD = inflation for the OECD as a whole, averaged over the 21 countries, UNCHOECD= Three-year change in the unemployment rate for the OECD as a whole) OPEN= (exports + imports) as a percentage of GDP, from Penn World Tables
Aggregate Demand Shock At the OECD level, amplified by openness= (INFLOECD+UNCHOECD)*OPEN/100
D. M. Sologon, C. O’Donoghue, Shaping Earnings Mobility: Policy and Institutional Factors
Available online at http://eaces.liuc.it
201
Table A.2 Institutional Variables - Summary Statistics
Variable Mean Std. Dev. Min Max Observations
EPL overall 2.423 0.956 0.600 3.854 N = 101
between 0.944 0.621 3.739 n = 13
within 0.251 1.537 3.211 T = 7.769
EPLR overall 2.322 0.847 0.948 4.333 N = 101
between 0.865 0.990 4.333 n = 13
within 0.057 2.187 2.546 T = 7.769
EPLT overall 2.522 1.461 0.250 5.375 N = 101
between 1.409 0.250 4.750 n = 13
within 0.496 0.769 4.053 T = 7.769
[(EPLR-EPLT)/EPLT]*100 overall 0.676 1.683 -0.670 5.413 N = 101
between 1.704 -0.553 5.413 n = 13
within 0.216 0.166 1.471 T = 7.769
Union Density overall 0.371 0.191 0.096 0.794 N = 108
between 0.201 0.098 0.779 n = 14
within 0.017 0.302 0.429 T = 7.714
Degree of Corporatism overall 1 3 N = 93
between n = 12
within T = 7.75
Tax Wedge overall 0.326 0.068 0.128 0.449 N = 93
between 0.067 0.219 0.404 n = 12
within 0.022 0.234 0.390 T = 7.75
PMR overall 3.394 1.015 1.133 5.236 N = 93
between 0.871 1.454 4.415 n = 12
within 0.563 2.155 4.459 T = 7.75
ALMPs overall 0.301 0.209 0.048 1.261 N = 93
between 0.188 0.094 0.750 n = 12
within 0.101 -0.035 0.812 T = 7.75
Unemployment Benefit RR overall 0.360 0.117 0.166 0.649 N = 93
between 0.115 0.174 0.599 n = 12
within 0.030 0.271 0.451 T = 7.75
Labour demand shock overall 0.062 0.062 -0.075 0.167 N = 85
between 0.063 -0.068 0.147 n = 11
within 0.013 0.028 0.099 T=7.727
Terms of Trade Shocks overall -0.094 0.040 -0.178 -0.027 N = 93
between 0.035 -0.146 -0.042 n = 12
within 0.022 -0.142 -0.041 T=7.75
Total Factor Production Shock overall 0.007 0.016 -0.058 0.047 N = 85
between 0.007 -0.001 0.019 n = 11
within 0.015 -0.056 0.049 T=7.727
Real Interest Shock overall 0.039 0.018 -0.016 0.080 N = 93
between 0.007 0.023 0.045 n = 12
within 0.017 -0.001 0.088 T=7.75
Aggregate Labour Supply overall 1.855 2.084 -0.635 8.145 N = 101
between 0.924 1.054 3.692 n = 13
within 1.881 -2.472 6.308 T=7.769
Aggregate Labour Demand overall 3.388 1.776 1.175 8.158 N = 101
between 1.581 2.051 6.578 n = 13
within 0.871 0.534 4.968 T=7.769
EJCE, vol.8, n.2 (2011)
Available online at http://eaces.liuc.it
202
Table A.4 Correlation of OECD Institutional Variables
EPL
Regular
Contracts
EPL
Temporary
Contracts
Union
Density Corporatism
Tax
Wedge PMR AMLP
Unempl.
Benefit
RR
EPL (Regular Contracts) 1
EPL (Temporary Contracts) 0.331 1
Union Density -0.437 -0.276 1
Corporatism 0.029 0.113 0.479 1
Tax Wedge -0.022 0.693 0.105 0.339 1
PMR 0.285 0.554 -0.176 0.269 0.243 1
AMLPs 0.131 -0.28 0.144 0.399 -0.081 -0.237 1
Unempl. Benefit RR 0.219 0.047 0.267 0.354 0.113 0.039 0.653 1