SHAPING A SUSTAINABLE FUTURE - Flybe · Aircraft Aircraft
43
FLYBE GROUP PLC Copyright 2017 SHAPING A SUSTAINABLE FUTURE Full Year Results – Year ended 31 March 2017 Analyst and Investor Presentation 8 June 2017
-
Upload
trinhnguyet -
Category
Documents
-
view
220 -
download
1
Transcript of SHAPING A SUSTAINABLE FUTURE - Flybe · Aircraft Aircraft

FLYBE GROUP PLC Copyright 2017
SHAPING A SUSTAINABLE FUTURE Full Year Results – Year ended 31 March 2017
Analyst and Investor Presentation 8 June 2017

FLYBE GROUP PLC Copyright 2017 2
Agenda Introduction
Christine Ourmieres-Widener Financial Review
Philip de Klerk Performance Review and Priorities
Christine Ourmieres-Widener Summary and Q&A

FLYBE GROUP PLC Copyright 2017
Introduction
PASSIONATE ABOUT THE AIRLINE INDUSTRY TRULY PASSIONATE ABOUT FLYBE
“Tremendous opportunities for Flybe to connect and engage with communities and to establish a
reputation for excellence in serving our customers”

FLYBE GROUP PLC Copyright 2017
Financial review

FLYBE GROUP PLC Copyright 2017
2016/17 Group financial summary Revenue
13.4% increase in Group revenue
Metrics per seat 3.6% reduction in passenger revenue 5.2% reduction in costs including fuel (constant currency) 2.0% increase in costs including fuel
Profit & loss £(6.7)m adjusted loss before tax1
£(19.9)m reported loss before tax £(26.7)m reported loss after tax
Robust balance sheet £153.5m net assets, £(64.0)m net debt and £124.3m total cash
1. Adjusted profit before tax is before revaluation gains or losses on USD aircraft loans
FLYBE GROUP PLC Copyright 2017
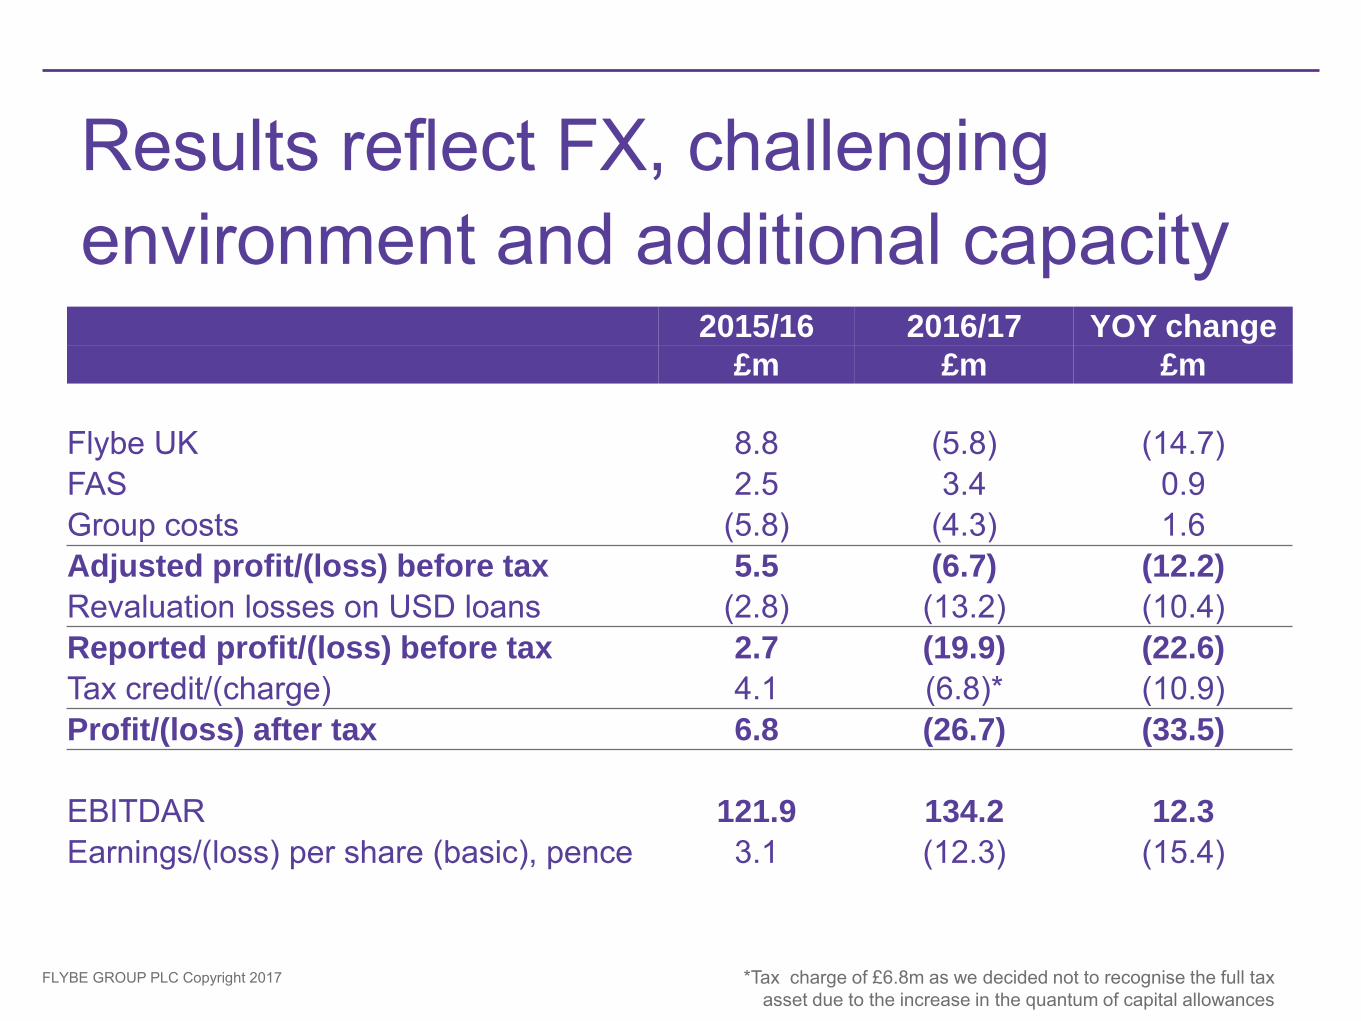
Results reflect FX, challenging environment and additional capacity
2015/16 2016/17 YOY change
£m £m £m
Flybe UK 8.8 (5.8) (14.7) FAS 2.5 3.4 0.9 Group costs (5.8) (4.3) 1.6 Adjusted profit/(loss) before tax 5.5 (6.7) (12.2)
Revaluation losses on USD loans (2.8) (13.2) (10.4) Reported profit/(loss) before tax 2.7 (19.9) (22.6)
Tax credit/(charge) 4.1 (6.8)* (10.9) Profit/(loss) after tax 6.8 (26.7) (33.5)
EBITDAR 121.9 134.2 12.3
Earnings/(loss) per share (basic), pence 3.1 (12.3) (15.4)
*Tax charge of £6.8m as we decided not to recognise the full tax asset due to the increase in the quantum of capital allowances

FLYBE GROUP PLC Copyright 2017
Group revenue increased by 13.4%
2015/16
£m
2016/17
£m
YOY %
change
Passenger revenue 571.7 619.3 8.3%
White Label revenue 13.9 33.0
Revenue from other activities 15.4 23.3
FAS revenue (third party) 22.8 31.8
Revenue 623.8 707.4 13.4%

FLYBE GROUP PLC Copyright 2017
Stable yield but lower load factor
2015/16 2016/17 YOY % change
Seats, m 11.3 12.7 12.3%
Passengers, m 8.2 8.8 7.6%
Load factor, % 72.6% 69.6% -3.0ppts
Average passenger sector length, km 468.1 503.1 7.5%
Passenger Yield 70.23 70.20 0.0%
£ per seat 2015/16 2016/17 YOY % change
Passenger revenue 50.64 48.84 -3.6% Other revenue, incl. White Label 2.59 4.44 Total Flybe UK revenue 53.23 53.28 0.1%

FLYBE GROUP PLC Copyright 2017
Cost per seat up 2%, but 5.2% reduction at constant currency
52.67
56.67 56.39
53.74
(4.00)
(0.46)
(0.47) 0.50
0.85
(0.14)2.65
50
51
52
53
54
55
56
57
58
2015/16Op. cost per
seat
FX impact 2015/16Constantcurrency
StaffCosts
Airport, En-route & Ground
Ops
Aircraft RentalCharges
OtherOperating
gains/(losses)
Other 2016/17Op. costexcl. fuelsaving
Fuel 2016/17Op.
cost per seat
£m
Mainly E195 flying
Fuel price saving
Hedging benefits
More owned aircraft
Change in FX rates YoY
Mostly increase in White Label staff costs
Including maintenance cost
FLYBE GROUP PLC Copyright 2017
FLYBE GROUP PLC Copyright 2017
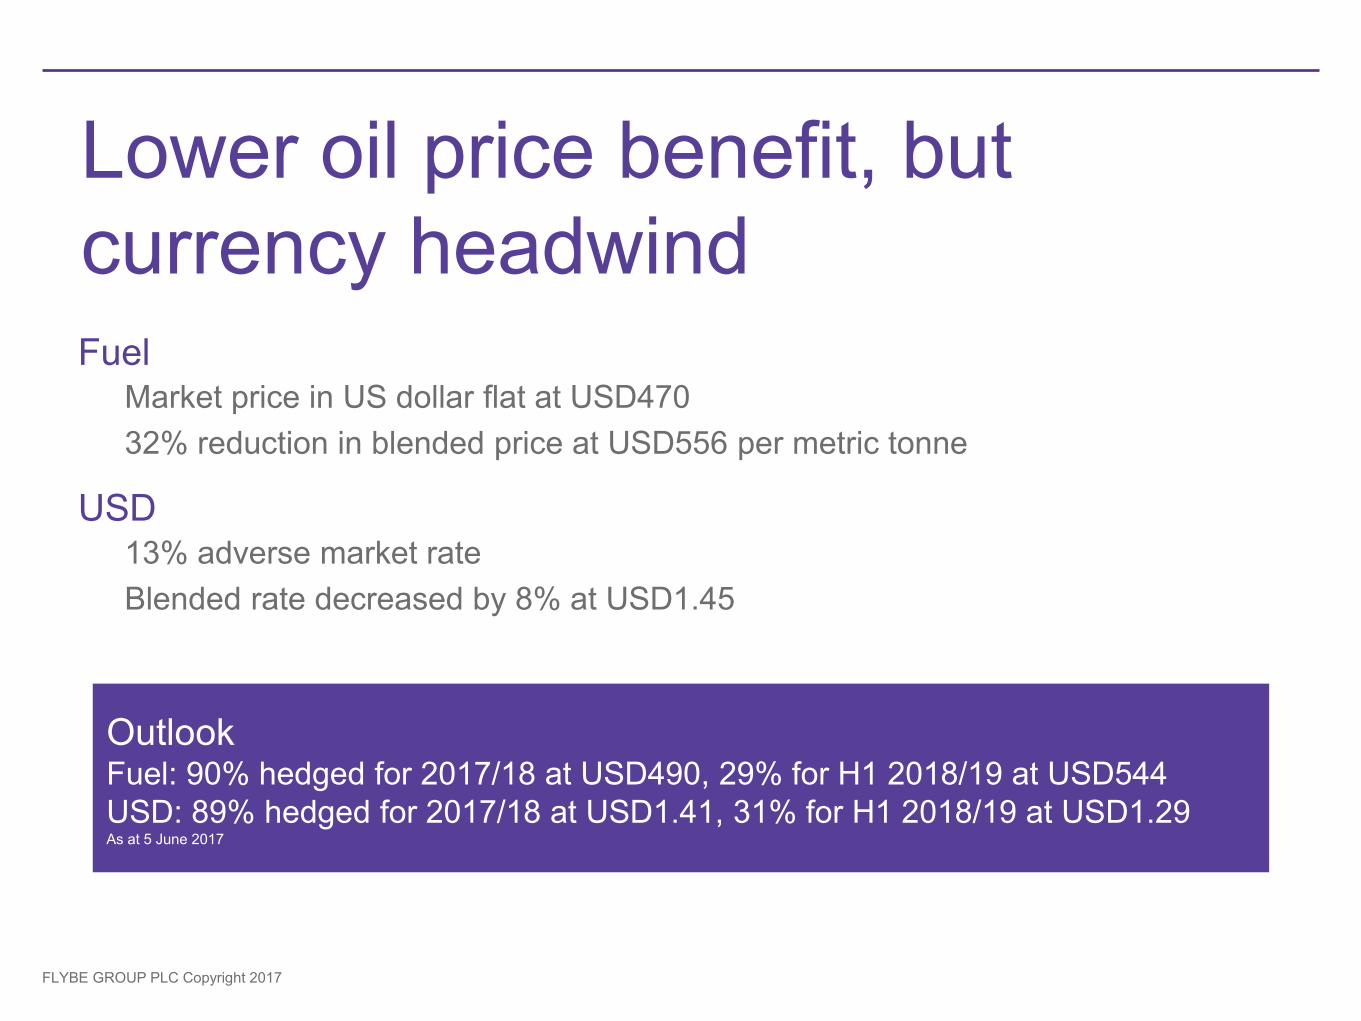
Outlook Fuel: 90% hedged for 2017/18 at USD490, 29% for H1 2018/19 at USD544 USD: 89% hedged for 2017/18 at USD1.41, 31% for H1 2018/19 at USD1.29 As at 5 June 2017
Fuel Market price in US dollar flat at USD470 32% reduction in blended price at USD556 per metric tonne
USD 13% adverse market rate Blended rate decreased by 8% at USD1.45
Lower oil price benefit, but currency headwind

FLYBE GROUP PLC Copyright 2017
£124.3m total cash at 31st March 2017 (31st March 2016: £171.4m) £(64.0)m of net debt (31st March 2016 net funds: £62.2m) £153.5m net assets (31st March 2016: £154.2m)
Pension scheme closed Triennial actuarial valuation completed; £12m deficit agreed over 12 years Deficit recovery contributions increase from £0.5m to £0.83m p.a. IAS19 pension deficit increased to £20.8m
Capital restructure implemented to increase distributable reserves
Balance sheet

FLYBE GROUP PLC Copyright 2017
45
50
55
60
65
70
75
80
85
Apr
-14
May
-14
Jun-
14Ju
l-14
Aug
-14
Sep
-14
Oct
-14
Nov
-14
Dec
-14
Jan-
15Fe
b-15
Mar
-15
Apr
-15
May
-15
Jun-
15Ju
l-15
Aug
-15
Sep
-15
Oct
-15
Nov
-15
Dec
-15
Jan-
16Fe
b-16
Mar
-16
Apr
-16
May
-16
Jun-
16Ju
l-16
Aug
-16
Sep
-16
Oct
-16
Nov
-16
Dec
-16
Jan-
17Fe
b-17
Mar
-17
Apr
-17
May
-17
No
. o
f A
ircra
ft
E195 Surplus AC Republic Deliveries
Fleet peaked in May 2017 2015/16 2016/17
Excludes ATRs
2014/15

FLYBE GROUP PLC Copyright 2017
Took ownership of 10 used Q400 aircraft, out of operating lease for c£98m
C£8m p.a. saving from increasing the number of owned aircraft and reducing the number of leased aircraft over the last two years
Added flexibility to manage fleet size
As at 31ST March Total Aircraft* % Owned
2015/16 70 24%
2016/17 78 35%
2017/18 74 36%
2018/19 69 43%
2019/20 65 48%
Fewer aircraft and reduced cost
assumes all lease aircraft returned at end of lease and no new purchases off lease, ATRs excluded

FLYBE GROUP PLC Copyright 2017
Net debt of £(64.0)m
62.357.0
(64.0)
34.9 (25.1)
(7.7)(107.8)
(7.4)
(13.2)
(80.0)
(60.0)
(40.0)
(20.0)
0.0
20.0
40.0
60.0
80.0
100.0
120.0
Net funds 31 Mar2016
Operating cash MaintenanceCapex & Into
service
Intangible andother Capex
Net Financing Underlying netfunds
Aircraft & EnginePurchases
FX on USD loans Net funds 31 Mar2017
£m
FLYBE GROUP PLC Copyright 2017
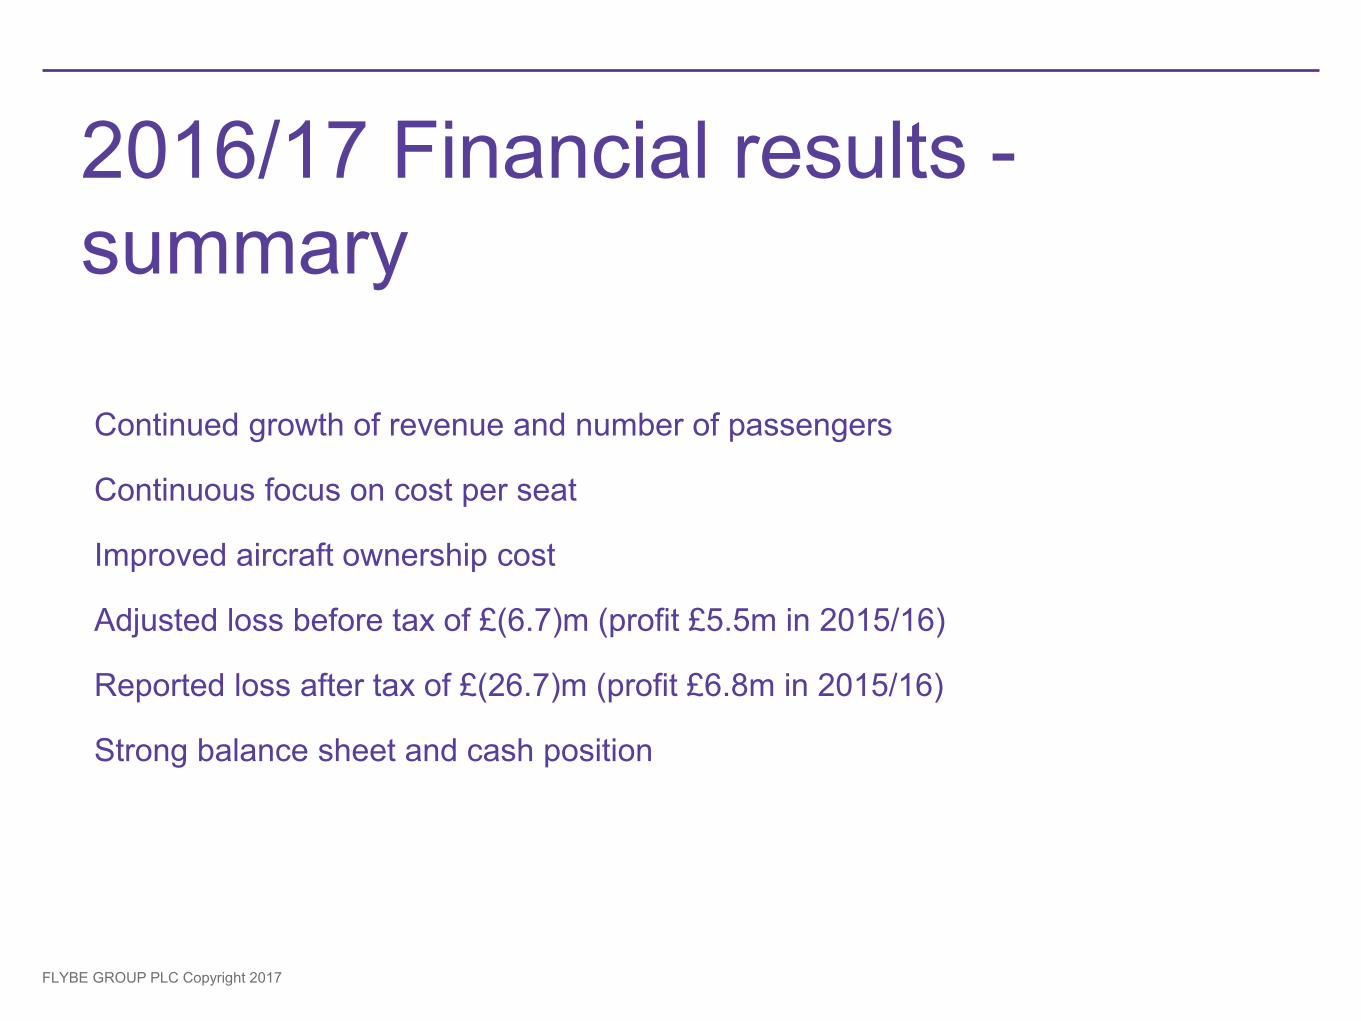
Continued growth of revenue and number of passengers
Continuous focus on cost per seat
Improved aircraft ownership cost
Adjusted loss before tax of £(6.7)m (profit £5.5m in 2015/16)
Reported loss after tax of £(26.7)m (profit £6.8m in 2015/16)
Strong balance sheet and cash position
2016/17 Financial results - summary

FLYBE GROUP PLC FLYBE GROUP PLC
2016/17 Performance and Priorities 2017/18

FLYBE GROUP PLC FLYBE GROUP PLC
2016/17 Performance

FLYBE GROUP PLC Copyright 2017 18
2016/17 Performance Serving more customers with a stable yield 33 new routes in 2016/17, 13 routes cancelled 199 Total routes // 64 airports // 152,064 flights 8.8m passengers and 12.3% more capacity Revenue growth, lower load factor and stable yield Reliability mixed 82.7% OTP arrivals, down from 85.4% 99.0% TDR, up from 98.8% Aircraft utilisation improved 6h 54m per day, up by 5% Employees 3 year pay deal 5% share deal, aligning interests with shareholders

FLYBE GROUP PLC Copyright 2017 19
Flybe diagnosis A sound business model for the airline With other business opportunities Capacity control to enable a demand led business A strong brand but strategy should be focused on the UK However …. More focus on operational and organisational excellence More customer centric Enhanced digital platform Creating better shareholder value

FLYBE GROUP PLC Copyright 2017
Sound business model
A leading regional airline serving UK regions

FLYBE GROUP PLC Copyright 2017
34 42
78 88
118
156
180 189
-
50,000
100,000
150,000
200,000
250,000
300,000
350,000
400,000
SAAB340 ATR42 ATR72/Q400 E175 E195 A319 A320 B737
Thinner routes can only be served economically by regional aircraft Flybe analysis of minimum route thickness by aircraft type for a daily frequency
Note: Analysis assumes: 70% Load Factor on SAAB340, ATR, Q400, E175 and E195, 89% on A319 and A320 and 85% on B737-800 Flight frequency at 3 rotations a day, 7 days per week. No. in bars are avg. seats per aircraft type (Source: Flybe analysis)
Competitors Main Area
Flybe Sweet Spot
Flybe Partners

FLYBE GROUP PLC Copyright 2017 22
Other business opportunities
White Label
A long term partnership with SAS Brussels airline contract expires in October Selective investment in profitable opportunity
MRO
Retain it and integrate it A400M contract very successful Prime role in supporting Flybe
Training Academy Becoming a profit centre

FLYBE GROUP PLC FLYBE GROUP PLC
Priorities 2017/18
© DAVID SCHILCHER 2016
FLYBE GROUP PLC Copyright 2017
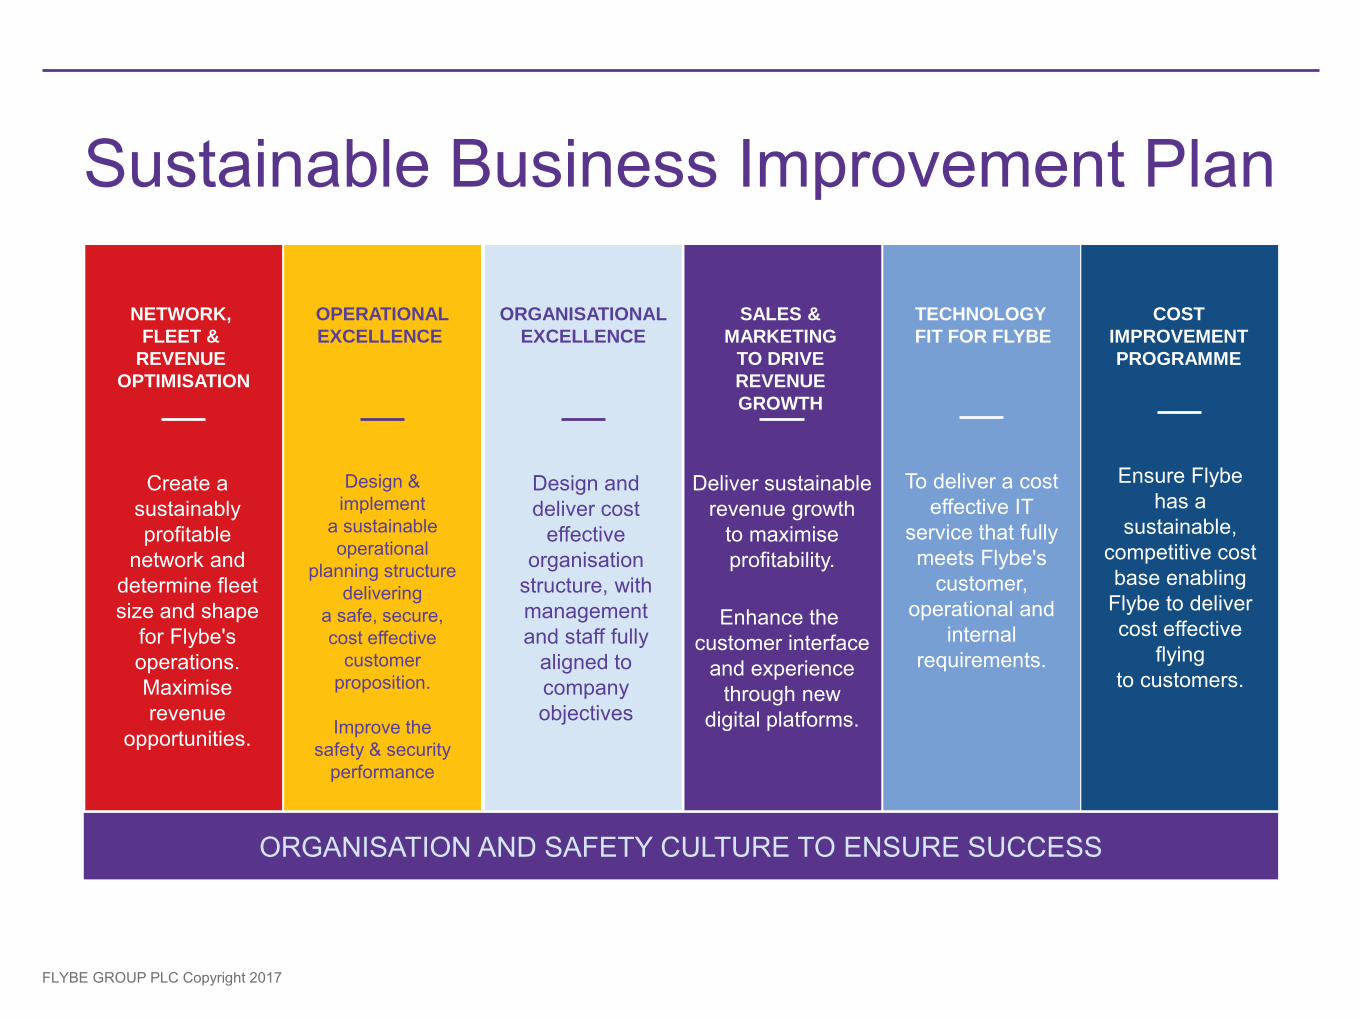
Sustainable Business Improvement Plan
SALES &
MARKETING
TO DRIVE
REVENUE
GROWTH
Deliver sustainable revenue growth
to maximise profitability.
Enhance the customer interface
and experience through new
digital platforms.
NETWORK,
FLEET &
REVENUE
OPTIMISATION
Create a sustainably profitable
network and determine fleet size and shape
for Flybe's operations. Maximise revenue
opportunities.
OPERATIONAL
EXCELLENCE
Design & implement
a sustainable operational
planning structure delivering
a safe, secure, cost effective
customer proposition.
Improve the
safety & security performance
ORGANISATIONAL
EXCELLENCE
Design and deliver cost
effective organisation
structure, with management and staff fully
aligned to company objectives
TECHNOLOGY
FIT FOR FLYBE
To deliver a cost effective IT
service that fully meets Flybe's
customer, operational and
internal requirements.
COST
IMPROVEMENT
PROGRAMME
Ensure Flybe has a
sustainable, competitive cost base enabling
Flybe to deliver cost effective
flying to customers.
ORGANISATION AND SAFETY CULTURE TO ENSURE SUCCESS

FLYBE GROUP PLC Copyright 2017
Taking control of our fleet
8 78 2 (6)
(3) (1) (4)70
74(5)
3 69
1 65
0
10
20
30
40
50
60
70
80
90
2015/16Fleet
Q400delivery
2016/17Fleet
Q400delivery
Q400expire
2017/18Fleet
Q400expire
E195expire
E175delivery
2018/19Fleet
Q400expire
E195expire
E175delivery
2019/20Fleet
24% 35% 36% 43% 48%
Excludes 5 ATRs deployed in Stockholm for SAS White Label and assuming all leases returned at the end of lease and no additional purchases off lease % shows the owned aircraft in our fleet
48%
84
Expectations unchanged from H1

FLYBE GROUP PLC Copyright 2017 26
Focus on UK
Concentrate on routes starting and finishing in UK Cancelled intra European routes for W17 Brexit risk & opportunity Balanced focus on leisure travelers

FLYBE GROUP PLC Copyright 2017
Codeshare / Franchise

FLYBE GROUP PLC Copyright 2017 28
Flybe loves Scotland 31% of total passengers Eastern Airways partnership Loganair no longer to be part of the Flybe Franchise 2 New routes launched to LHR 79 Flights per week from Scotland to London Flybe will remain Scotland’s best airline

FLYBE GROUP PLC Copyright 2017 29
Operational excellence Improved reliability
Additional modifications to Q400 aircraft Well planned and executed maintenance Improved third party management Integrated maintenance organisation
Improved on time performance
Better availability of spare aircraft Better availability of standby crew Working closer with airport partners
Implement new systems
AMOS Electronic Flight Bag

FLYBE GROUP PLC Copyright 2017 30
Organisational excellence
Design Flybe’s Future Organisation
Leaner organisation, more responsibility Less duplication, more accountability Consistent with fleet & network strategy and
company priorities Develop Flybe’s culture
Embed refreshed values Strengthen safety, security and compliance
culture Reward based on performance

FLYBE GROUP PLC Copyright 2017 31
Flybe must be better at digital
Over 80% of booking via the web Non standard & Lack of flexibility Poor customer experience
Limited customer communication Limited customer data Restricted upselling opportunity
A 3 year roadmap A great opportunity to improve revenues and decrease costs

FLYBE GROUP PLC Copyright 2017
The new digital platform will support the customer life cycle
FLYBE GROUP PLC FLYBE GROUP PLC
Outlook and summary

FLYBE GROUP PLC Copyright 2017 34
H1 2017/18 Outlook H1 forward sales as of 5th June
2017: 2.7% capacity increase vs. prior year 45% of capacity sold vs. 44% prior year 2.6% increase in yields helped by timing of
Easter 4.6% increase in passenger revenue per seat
We expect c4% capacity reduction in Winter

FLYBE GROUP PLC Copyright 2017
We have slowed capacity growth, leading to improved load factor
-5.0%
0.0%
5.0%
10.0%
15.0%
20.0%
Q1 16/17 Q2 16/17 Q3 16/17 Q4 16/17 Q1 17/18
Capacity growth (seats)
Load Factor
YoY
chan
ge
Capacity
expected
to reduce
in H2

FLYBE GROUP PLC Copyright 2017 -10.0%
-8.0%
-6.0%
-4.0%
-2.0%
0.0%
2.0%
4.0%
6.0%
8.0%
10.0%
Q1 16/17 Q2 16/17 Q3 16/17 Q4 16/17 Q1 17/18
Cost per seatIncl. fuel
Revenue per seatCost per seatExcl. fuel
Revenue per seat is recovering, and benefit of oil price annualises
YoY
cha
nge Benefit of lower Oil prices

FLYBE GROUP PLC Copyright 2017
Summary Business resilient in tough market Growth in capacity, passenger volume and revenue Reduction in unit cost Partnerships
Control of capacity growth Capacity will be reduced over the coming years Optimise route network Enhance reliability and efficiency Digital & customer centric Digitalise Improve marketing and sales Serving our customers better will create value for
shareholders

FLYBE GROUP PLC Copyright 2017
Q&A

FLYBE GROUP PLC Copyright 2017
Legal disclaimer

FLYBE GROUP PLC Copyright 2017
Appendix

Fleet evolution
The fleet peaks in May 2017 before Flybe starts to return end-of-lease aircraft to its lessors in Autumn 2017. Six Bombardier Q400 aircraft will be handed back later in 2017 at, or slightly ahead of, lease expiry. The number of owned aircraft moved from 17 to 27 year-on-year with owned aircraft now representing 32.5% (2015/16: 23.0%) of the fleet . (Excluding ATRs 34.6% of the fleet is owned)
Bombardier Q400 turboprop 58 2 -6 54
Embraer E175 regional jet 11 - - 11
Embraer E195 regional jet 9 - - 9
ATR72 turboprop (SAS contract) 5 - - 5
Total 83 2 -6 79
Held on operating lease 56 2 -6 52
Owned 27 - - 27
Total 83 2 -6 79
Total seats in fleet 6,904 156 -468 6,592
Average seats per aircraft 83.2 83.4
At 31st
March
2017
Aircraft
Handbacks
At 31st
March
2018
Aircraft
Deliveries

Group Balance Sheet £m March 2017 March 2016 YOY change
£m £m £m
Aircraft 287.3 192.3 95.0
Other property, plant and equipment 21.8 21.4 0.4
Intangibles 11.9 13.3 (1.4)
Net (debt)/funds (64.0) 62.2 (126.2)
Derivative financial instruments 24.5 (9.9) 34.4
Other working capital - net (117.2) (123.5) 6.3
Deferred taxation (0.6) 11.3 (11.9)
Defined benefit pension scheme deficit (20.8) (15.3) (5.5)
Other non-current assets and liabilities 10.6 2.4 8.2
Net assets and shareholders' funds 153.5 154.2 (0.7)

Total cash of £124m
171.5
124.3
(25.1)
(7.4)
58.2
34.9
(107.8)
0.00
50.00
100.00
150.00
200.00
250.00
Opening Cash 31 Mar2016
Operating cash Maintenance Capex Intangible Capex Financing activities Aircraft & EnginePurchases
Closing cash 31 Mar2017
£m