SHANGHAI SHORELINE EVOLUTION INTERPRETED FROM HISTORICAL ... · SHANGHAI SHORELINE EVOLUTION...
4
SHANGHAI SHORELINE EVOLUTION INTERPRETED FROM HISTORICAL ATLAS AND REMOTE SENSING IMAGERY OVER THE PAST 2,200 YEARS H. Mi a,b , W. Wang a,b , G. Qiao a,b, * a College of Surveying and Geo-Informatics, Tongji University, 1239 Siping Road, Shanghai, China b Center for Spatial Information Science and Sustainable Development, Tongji University, 1239 Siping Road, Shanghai, China Commission VIII, WG VIII/9 KEY WORDS: Shanghai, Shoreline Change, Evolution, Atlas, Remote Sensing ABSTRACT: Shanghai, the axis of economic development in China and holding the most prosperous metropolis in the world, is located at Yangtze Estuary which is susceptible to shoreline changes affected by different factors, such as sediment supply and sea level changes, making it very important to study the shoreline changes over long time period. This paper presents the Shanghai shoreline evolution process from BC 221 up to 2015, by employing both the cartographic data (historical atlas) and the remote sensing images. A series of image processing techniques were applied to seamlessly register the historical atlas and satellite images to the same orthophoto base map, followed by the semi-automatic extraction of shoreline from images. Results show that since BC 221, the Shanghai shoreline has been witnessing distinct progradation, and the rate of shoreline advance varied in different areas. The average shoreline change in southern Yangtze Estuary was about 2,573 km 2 (accretion) between BC 221 and 1948 with a 40 km progradation, while the shoreline in northern Hangzhou Bay kept relatively steady after 1671. Overall, 3,119 km 2 of Shanghai area was added between BC 221 and 1948 with an average rate of 75 km 2 /50yr, and the addition went to 4,372 km 2 in 2015. In this paper, the possible drives of the shoreline evolution was discussed. This study is important for understanding the coastal dynamics in Shanghai over a long time period for the management and development of coastal environments. * Corresponding author 1. INTRODUCTION Global mean sea-level change has increased in the rate of rise due to climate change through the melting of land ice and the thermal expansion of ocean water (Milne et al., 2009; Nicholls et al., 2010). Rapid sea-level rise seriously threatens the estuaries and islands, where a large percentage of the population lives (Anthoff et al., 2006; Nicholls et al., 2010; Johnston et al., 2014; Kunt et al., 2014). So, coastal zone monitoring becomes an important task in national development and environmental protection (Rasuly et al., 2010). Shoreline, one of the coastal zone features recognized by International Geographic Data Committee (Kuleli et al., 2011), is valuable for coastal monitoring and assessment (Marfai et al., 2008). The location of the shoreline and its historical rate of change can provide important information for the design of coastal protection, plans for coastal development (Chen et al., 2009). Shanghai, the axis of economic development in China and holding the most prosperous metropolis in the world, is located at Yangtze Estuary which is susceptible to shoreline changes affected by different factors, such as sediment supply and sea level changes, making it very important to study the shoreline changes over long time period. In this paper, we presents the Shanghai shoreline evolution process from BC 221 up to 2015, by employing both the fifteen-period cartographic data (historical atlas) spanning from BC221 to 1948 and the twelve- period remote sensing images from 1960 to 2015. Section 2 introduces the study area and data, including the image processing; Section 3 analyses the shoreline evolution; Section 4 discusses the possible drives of the shoreline change; and last Section gives the conclusion. 2. STUDY AREA AND DATA 2.1 Study area Shanghai stands at 120°51′ E to 122°12′ E and 30°40′ N to 31°53′ N (Figure 1), on the western coast of the East Sea and the eastern shoreline of the Asian Continent, with Yangtze River to its north, and Hangzhou Bay to its south. There are several delta islands, such as Chongming Island, Changxing Island and Hengsha Island. Shanghai, with about 6340 km 2 area, has more than 24 million permanent residents in 2015 (Office of Shanghai Chronicles, 2015). Figure 1. Location map of Shanghai, China The International Archives of the Photogrammetry, Remote Sensing and Spatial Information Sciences, Volume XLI-B8, 2016 XXIII ISPRS Congress, 12–19 July 2016, Prague, Czech Republic This contribution has been peer-reviewed. doi:10.5194/isprsarchives-XLI-B8-1157-2016 1157
Transcript of SHANGHAI SHORELINE EVOLUTION INTERPRETED FROM HISTORICAL ... · SHANGHAI SHORELINE EVOLUTION...

SHANGHAI SHORELINE EVOLUTION INTERPRETED FROM HISTORICAL ATLAS
AND REMOTE SENSING IMAGERY OVER THE PAST 2,200 YEARS
H. Mi a,b, W. Wang a,b, G. Qiao a,b, *
a College of Surveying and Geo-Informatics, Tongji University, 1239 Siping Road, Shanghai, China
b Center for Spatial Information Science and Sustainable Development, Tongji University, 1239 Siping Road, Shanghai, China
Commission VIII, WG VIII/9
KEY WORDS: Shanghai, Shoreline Change, Evolution, Atlas, Remote Sensing
ABSTRACT:
Shanghai, the axis of economic development in China and holding the most prosperous metropolis in the world, is located at
Yangtze Estuary which is susceptible to shoreline changes affected by different factors, such as sediment supply and sea level
changes, making it very important to study the shoreline changes over long time period. This paper presents the Shanghai shoreline
evolution process from BC 221 up to 2015, by employing both the cartographic data (historical atlas) and the remote sensing images.
A series of image processing techniques were applied to seamlessly register the historical atlas and satellite images to the same
orthophoto base map, followed by the semi-automatic extraction of shoreline from images. Results show that since BC 221, the
Shanghai shoreline has been witnessing distinct progradation, and the rate of shoreline advance varied in different areas. The average
shoreline change in southern Yangtze Estuary was about 2,573 km2 (accretion) between BC 221 and 1948 with a 40 km progradation,
while the shoreline in northern Hangzhou Bay kept relatively steady after 1671. Overall, 3,119 km2 of Shanghai area was added
between BC 221 and 1948 with an average rate of 75 km2/50yr, and the addition went to 4,372 km2 in 2015. In this paper, the
possible drives of the shoreline evolution was discussed. This study is important for understanding the coastal dynamics in Shanghai
over a long time period for the management and development of coastal environments.
* Corresponding author
1. INTRODUCTION
Global mean sea-level change has increased in the rate of rise
due to climate change through the melting of land ice and the
thermal expansion of ocean water (Milne et al., 2009; Nicholls
et al., 2010). Rapid sea-level rise seriously threatens the
estuaries and islands, where a large percentage of the population
lives (Anthoff et al., 2006; Nicholls et al., 2010; Johnston et al.,
2014; Kunt et al., 2014). So, coastal zone monitoring becomes
an important task in national development and environmental
protection (Rasuly et al., 2010). Shoreline, one of the coastal
zone features recognized by International Geographic Data
Committee (Kuleli et al., 2011), is valuable for coastal
monitoring and assessment (Marfai et al., 2008). The location of
the shoreline and its historical rate of change can provide
important information for the design of coastal protection, plans
for coastal development (Chen et al., 2009).
Shanghai, the axis of economic development in China and
holding the most prosperous metropolis in the world, is located
at Yangtze Estuary which is susceptible to shoreline changes
affected by different factors, such as sediment supply and sea
level changes, making it very important to study the shoreline
changes over long time period. In this paper, we presents the
Shanghai shoreline evolution process from BC 221 up to 2015,
by employing both the fifteen-period cartographic data
(historical atlas) spanning from BC221 to 1948 and the twelve-
period remote sensing images from 1960 to 2015. Section 2
introduces the study area and data, including the image
processing; Section 3 analyses the shoreline evolution; Section
4 discusses the possible drives of the shoreline change; and last
Section gives the conclusion.
2. STUDY AREA AND DATA
2.1 Study area
Shanghai stands at 120°51′ E to 122°12′ E and 30°40′ N to
31°53′ N (Figure 1), on the western coast of the East Sea and
the eastern shoreline of the Asian Continent, with Yangtze
River to its north, and Hangzhou Bay to its south. There are
several delta islands, such as Chongming Island, Changxing
Island and Hengsha Island. Shanghai, with about 6340 km2 area,
has more than 24 million permanent residents in 2015 (Office of
Shanghai Chronicles, 2015).
Figure 1. Location map of Shanghai, China
The International Archives of the Photogrammetry, Remote Sensing and Spatial Information Sciences, Volume XLI-B8, 2016 XXIII ISPRS Congress, 12–19 July 2016, Prague, Czech Republic
This contribution has been peer-reviewed. doi:10.5194/isprsarchives-XLI-B8-1157-2016
1157
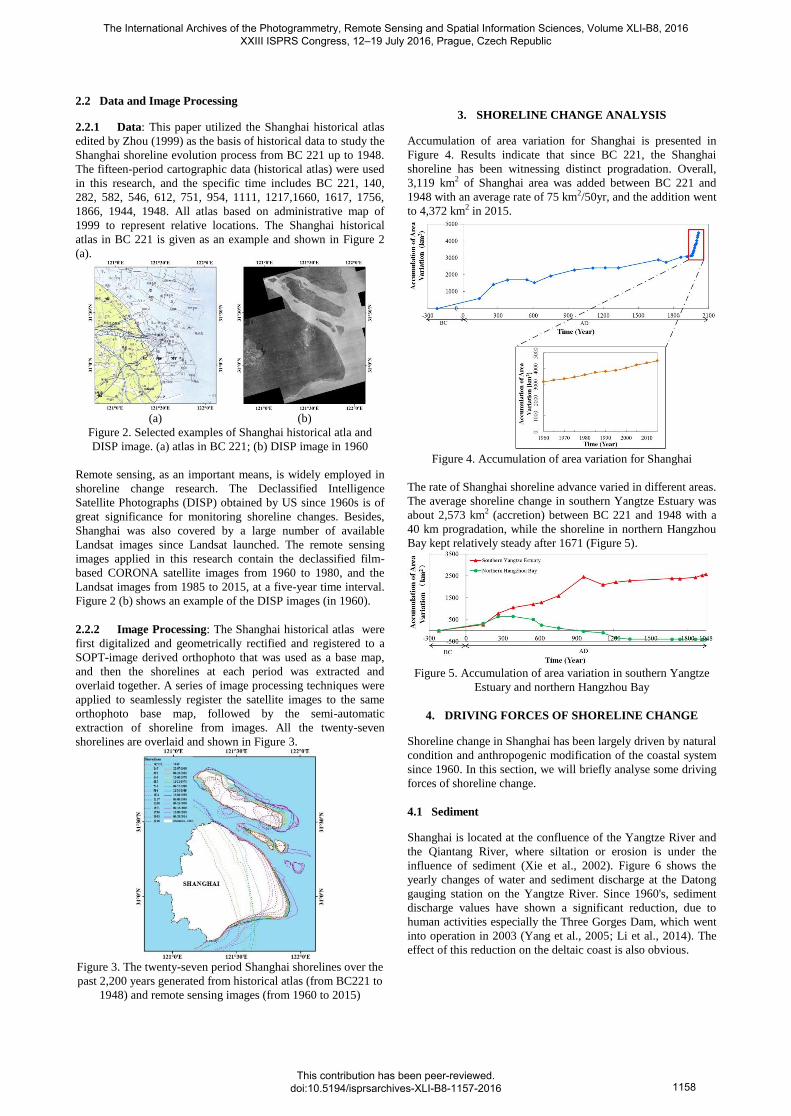
2.2 Data and Image Processing
2.2.1 Data: This paper utilized the Shanghai historical atlas
edited by Zhou (1999) as the basis of historical data to study the
Shanghai shoreline evolution process from BC 221 up to 1948.
The fifteen-period cartographic data (historical atlas) were used
in this research, and the specific time includes BC 221, 140,
282, 582, 546, 612, 751, 954, 1111, 1217,1660, 1617, 1756,
1866, 1944, 1948. All atlas based on administrative map of
1999 to represent relative locations. The Shanghai historical
atlas in BC 221 is given as an example and shown in Figure 2
(a).
(a) (b)
Figure 2. Selected examples of Shanghai historical atla and
DISP image. (a) atlas in BC 221; (b) DISP image in 1960
Remote sensing, as an important means, is widely employed in
shoreline change research. The Declassified Intelligence
Satellite Photographs (DISP) obtained by US since 1960s is of
great significance for monitoring shoreline changes. Besides,
Shanghai was also covered by a large number of available
Landsat images since Landsat launched. The remote sensing
images applied in this research contain the declassified film-
based CORONA satellite images from 1960 to 1980, and the
Landsat images from 1985 to 2015, at a five-year time interval.
Figure 2 (b) shows an example of the DISP images (in 1960).
2.2.2 Image Processing: The Shanghai historical atlas were
first digitalized and geometrically rectified and registered to a
SOPT-image derived orthophoto that was used as a base map,
and then the shorelines at each period was extracted and
overlaid together. A series of image processing techniques were
applied to seamlessly register the satellite images to the same
orthophoto base map, followed by the semi-automatic
extraction of shoreline from images. All the twenty-seven
shorelines are overlaid and shown in Figure 3.
Figure 3. The twenty-seven period Shanghai shorelines over the
past 2,200 years generated from historical atlas (from BC221 to
1948) and remote sensing images (from 1960 to 2015)
3. SHORELINE CHANGE ANALYSIS
Accumulation of area variation for Shanghai is presented in
Figure 4. Results indicate that since BC 221, the Shanghai
shoreline has been witnessing distinct progradation. Overall,
3,119 km2 of Shanghai area was added between BC 221 and
1948 with an average rate of 75 km2/50yr, and the addition went
to 4,372 km2 in 2015.
Figure 4. Accumulation of area variation for Shanghai
The rate of Shanghai shoreline advance varied in different areas.
The average shoreline change in southern Yangtze Estuary was
about 2,573 km2 (accretion) between BC 221 and 1948 with a
40 km progradation, while the shoreline in northern Hangzhou
Bay kept relatively steady after 1671 (Figure 5).
Figure 5. Accumulation of area variation in southern Yangtze
Estuary and northern Hangzhou Bay
4. DRIVING FORCES OF SHORELINE CHANGE
Shoreline change in Shanghai has been largely driven by natural
condition and anthropogenic modification of the coastal system
since 1960. In this section, we will briefly analyse some driving
forces of shoreline change.
4.1 Sediment
Shanghai is located at the confluence of the Yangtze River and
the Qiantang River, where siltation or erosion is under the
influence of sediment (Xie et al., 2002). Figure 6 shows the
yearly changes of water and sediment discharge at the Datong
gauging station on the Yangtze River. Since 1960's, sediment
discharge values have shown a significant reduction, due to
human activities especially the Three Gorges Dam, which went
into operation in 2003 (Yang et al., 2005; Li et al., 2014). The
effect of this reduction on the deltaic coast is also obvious.
The International Archives of the Photogrammetry, Remote Sensing and Spatial Information Sciences, Volume XLI-B8, 2016 XXIII ISPRS Congress, 12–19 July 2016, Prague, Czech Republic
This contribution has been peer-reviewed. doi:10.5194/isprsarchives-XLI-B8-1157-2016
1158
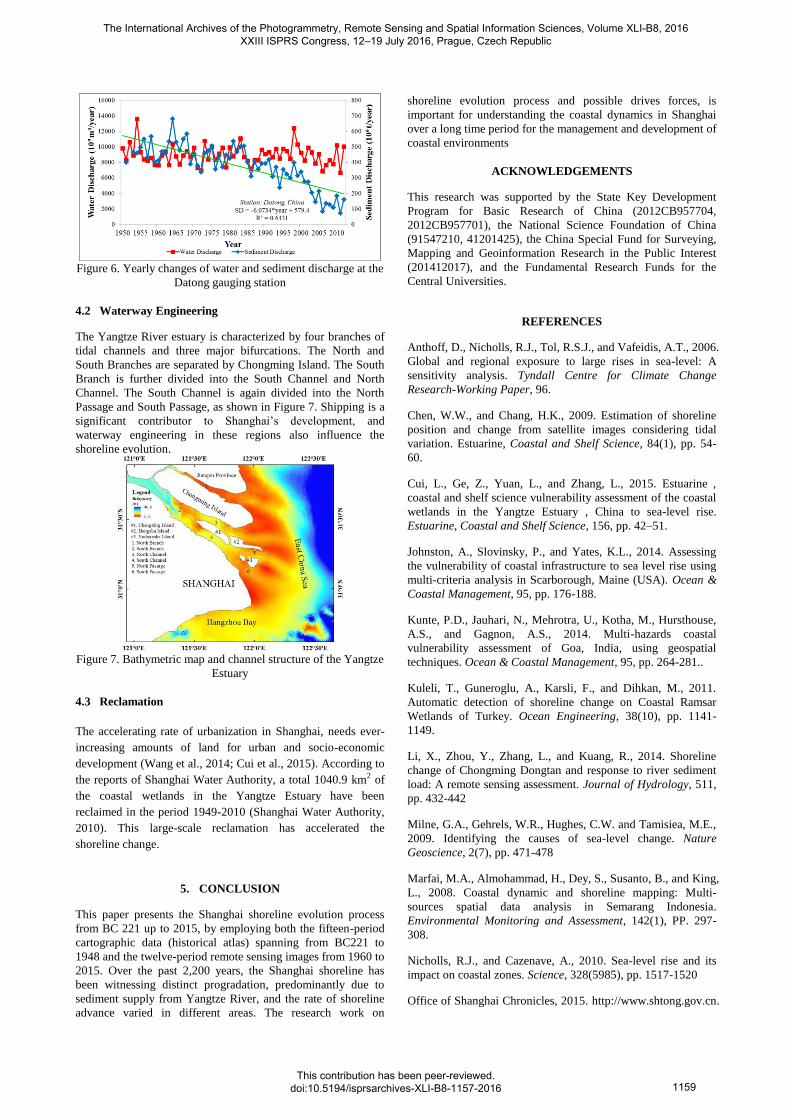
Figure 6. Yearly changes of water and sediment discharge at the
Datong gauging station
4.2 Waterway Engineering
The Yangtze River estuary is characterized by four branches of
tidal channels and three major bifurcations. The North and
South Branches are separated by Chongming Island. The South
Branch is further divided into the South Channel and North
Channel. The South Channel is again divided into the North
Passage and South Passage, as shown in Figure 7. Shipping is a
significant contributor to Shanghai’s development, and
waterway engineering in these regions also influence the
shoreline evolution.
Figure 7. Bathymetric map and channel structure of the Yangtze
Estuary
4.3 Reclamation
The accelerating rate of urbanization in Shanghai, needs ever-
increasing amounts of land for urban and socio-economic
development (Wang et al., 2014; Cui et al., 2015). According to
the reports of Shanghai Water Authority, a total 1040.9 km2 of
the coastal wetlands in the Yangtze Estuary have been
reclaimed in the period 1949-2010 (Shanghai Water Authority,
2010). This large-scale reclamation has accelerated the
shoreline change.
5. CONCLUSION
This paper presents the Shanghai shoreline evolution process
from BC 221 up to 2015, by employing both the fifteen-period
cartographic data (historical atlas) spanning from BC221 to
1948 and the twelve-period remote sensing images from 1960 to
2015. Over the past 2,200 years, the Shanghai shoreline has
been witnessing distinct progradation, predominantly due to
sediment supply from Yangtze River, and the rate of shoreline
advance varied in different areas. The research work on
shoreline evolution process and possible drives forces, is
important for understanding the coastal dynamics in Shanghai
over a long time period for the management and development of
coastal environments
ACKNOWLEDGEMENTS
This research was supported by the State Key Development
Program for Basic Research of China (2012CB957704,
2012CB957701), the National Science Foundation of China
(91547210, 41201425), the China Special Fund for Surveying,
Mapping and Geoinformation Research in the Public Interest
(201412017), and the Fundamental Research Funds for the
Central Universities.
REFERENCES
Anthoff, D., Nicholls, R.J., Tol, R.S.J., and Vafeidis, A.T., 2006.
Global and regional exposure to large rises in sea-level: A
sensitivity analysis. Tyndall Centre for Climate Change
Research-Working Paper, 96.
Chen, W.W., and Chang, H.K., 2009. Estimation of shoreline
position and change from satellite images considering tidal
variation. Estuarine, Coastal and Shelf Science, 84(1), pp. 54-
60.
Cui, L., Ge, Z., Yuan, L., and Zhang, L., 2015. Estuarine ,
coastal and shelf science vulnerability assessment of the coastal
wetlands in the Yangtze Estuary , China to sea-level rise.
Estuarine, Coastal and Shelf Science, 156, pp. 42–51.
Johnston, A., Slovinsky, P., and Yates, K.L., 2014. Assessing
the vulnerability of coastal infrastructure to sea level rise using
multi-criteria analysis in Scarborough, Maine (USA). Ocean &
Coastal Management, 95, pp. 176-188.
Kunte, P.D., Jauhari, N., Mehrotra, U., Kotha, M., Hursthouse,
A.S., and Gagnon, A.S., 2014. Multi-hazards coastal
vulnerability assessment of Goa, India, using geospatial
techniques. Ocean & Coastal Management, 95, pp. 264-281..
Kuleli, T., Guneroglu, A., Karsli, F., and Dihkan, M., 2011.
Automatic detection of shoreline change on Coastal Ramsar
Wetlands of Turkey. Ocean Engineering, 38(10), pp. 1141-
1149.
Li, X., Zhou, Y., Zhang, L., and Kuang, R., 2014. Shoreline
change of Chongming Dongtan and response to river sediment
load: A remote sensing assessment. Journal of Hydrology, 511,
pp. 432-442
Milne, G.A., Gehrels, W.R., Hughes, C.W. and Tamisiea, M.E.,
2009. Identifying the causes of sea-level change. Nature
Geoscience, 2(7), pp. 471-478
Marfai, M.A., Almohammad, H., Dey, S., Susanto, B., and King,
L., 2008. Coastal dynamic and shoreline mapping: Multi-
sources spatial data analysis in Semarang Indonesia.
Environmental Monitoring and Assessment, 142(1), PP. 297-
308.
Nicholls, R.J., and Cazenave, A., 2010. Sea-level rise and its
impact on coastal zones. Science, 328(5985), pp. 1517-1520
Office of Shanghai Chronicles, 2015. http://www.shtong.gov.cn.
The International Archives of the Photogrammetry, Remote Sensing and Spatial Information Sciences, Volume XLI-B8, 2016 XXIII ISPRS Congress, 12–19 July 2016, Prague, Czech Republic
This contribution has been peer-reviewed. doi:10.5194/isprsarchives-XLI-B8-1157-2016
1159

Rasuly, A., Naghdifar, R., and Rasoli, M., 2010. Monitoring of
Caspian Sea coastline changes using object-oriented techniques.
Procedia Environmental Sciences, 2, 416-426.
Shanghai Water Authority, 2010. Shanghai Foreshore
Resources Report. Shanghai Water Authority, Shanghai (in
Chinese).
Wang, H., Ge, Z., Yuan, L., and Zhang, L., 2014. Evaluation of
the combined threat from sea-level rise and sedimentation
reduction to the coastal wetlands in the Yangtze Estuary, China.
Ecological Engineering, 71, 346–354.
Xie, D., Pan, C., Cao, Y., and Zhang, B., 2013. Decadal
variations in the erosion/deposition pattern of the Hangzhou
Bay and their mechanism in recent 50a. Acta Oceanologica
Sinica, 35(4), pp. 121-128 (in Chinese).
Yang, S.L., Zhang, J., Zhu, J., Smith J.P., Dai, S.B., Gao, A.,
and Li, P., 2005. Impact of dams on Yangtze River sediment
supply to the sea and delta intertidal wetland response. Journal
of Geophysical Research: Earth Surface, 110.
Zhou, Z.H., 1999. The Shanghai historical atlas.
The International Archives of the Photogrammetry, Remote Sensing and Spatial Information Sciences, Volume XLI-B8, 2016 XXIII ISPRS Congress, 12–19 July 2016, Prague, Czech Republic
This contribution has been peer-reviewed. doi:10.5194/isprsarchives-XLI-B8-1157-2016
1160