Shands Teaching Hospital and Clinics, Inc. and …€¦ · Shands Teaching Hospital and Clinics,...
60
Shands Teaching Hospital and Clinics, Inc. and Subsidiaries Consolidated Basic Financial Statements, Required Supplementary Information and Supplemental Consolidating Information June 30, 2016 and 2015
Transcript of Shands Teaching Hospital and Clinics, Inc. and …€¦ · Shands Teaching Hospital and Clinics,...

Shands Teaching Hospital and Clinics, Inc. and Subsidiaries Consolidated Basic Financial Statements, Required Supplementary Information and Supplemental Consolidating Information June 30, 2016 and 2015
Shands Teaching Hospital and Clinics, Inc. and Subsidiaries Index June 30, 2016 and 2015
Page(s)
Management’s Discussion and Analysis (Unaudited) .............................................................................. 1-11
Report of Independent Certified Public Accountants ...................................................................... 12-13
Consolidated Basic Financial Statements
Consolidated Basic Statements of Net Position ......................................................................................... 14
Consolidated Basic Statements of Revenues, Expenses and Changes in Net Position ............................ 15
Consolidated Basic Statements of Cash Flows ..................................................................................... 16-17
Notes to Consolidated Basic Financial Statements ............................................................................... 18-52
Required Supplementary Information
Schedule of Changes in the Net Pension Liability and Related Ratios (Unaudited) .................................. 53
Schedule of Employer Contributions (Unaudited) ....................................................................................... 54
Supplemental Consolidating Information
Consolidating Basic Statements of Net Position .................................................................................... 55-56
Consolidating Basic Statements of Revenues, Expenses and Changes in Net Position ...................... 57-58
Shands Teaching Hospital and Clinics, Inc. and Subsidiaries Management’s Discussion and Analysis (Unaudited) June 30, 2016 and 2015
1
Introduction
This section of the Shands Teaching Hospital and Clinics, Inc. and Subsidiaries’ (“Shands”) annual
financial report presents Shands’ analysis of its financial performance as of and for the year ended
June 30, 2016 with comparative information as of and for the years ended June 30, 2015 and 2014. This
discussion has been prepared by management and should be read in conjunction with the consolidated
basic financial statements and related note disclosures.
Organization
Shands is an affiliate of the University of Florida (“UF”) where by statute the President of UF has the right
to appoint and remove members of the Shands Board of Directors. Shands controls or owns various
affiliated entities that operate facilities and provide services that are part of Shands.
Shands and certain of its affiliated entities, along with the UF Health Science Center, operate under
d/b/a’s beginning with “UF Health.” The following identifies the significant component operating units and
affiliates of Shands and their respective primary operations:
UF Health Shands Hospital is a major tertiary care teaching institution licensed to operate an 875-bed
teaching hospital, which provides clinical settings for medical education programs at UF.
UF Health Shands Psychiatric Hospital is a psychiatric and substance abuse facility licensed to operate
81 beds, of which 61 are psychiatric and 20 are substance abuse.
UF Health Shands Rehabilitation Hospital is a 40-bed rehabilitation hospital located on the same
campus as UF Health Shands Psychiatric Hospital.
UF Health Shands HomeCare is a hospital-based home care agency providing home care services to
the citizens of north central Florida.
Shands Recovery, LLC (d/b/a “UF Health Florida Recovery Center”) provides on-site leased housing
in conjunction with intensive outpatient addiction treatment for alcohol and drug abuse. The entity was
created and received separate outpatient licensure from the State of Florida in December 2014. Prior to
incorporation, UF Health Florida Recovery Center was an outpatient department of UF Health Shands
Psychiatric Hospital operating under the main hospital license.
Property Management leases properties in Gainesville, Florida.
ElderCare of Alachua County, Inc. provides social and health care support to the elderly in Alachua
County.
Southeastern HealthCare Foundation, Inc. provides charitable aid to UF and to Shands and owns and
leases various rental properties in Florida.
Joint Ventures: Shands has a 40% minority ownership interest in Lake Shore HMA, LLC, Starke HMA,
LLC, and Live Oak HMA, LLC which owns or leases three rural community hospitals (Shands Lake
Shore located in Lake City, Florida; Shands Starke located in Starke, Florida; and Shands Live Oak
located in Live Oak, Florida). Community Health Systems, Inc. (“CHS”) is the majority partner and
manages the operations of the three facilities. Shands has a 5% minority interest in Munroe HMA
Holdings, LLC (d/b/a “Munroe Regional Medical Center”) which owns a regional medical center
located in Ocala, Florida. CHS manages the operations of the facility and is the majority partner.
Shands Teaching Hospital and Clinics, Inc. and Subsidiaries Management’s Discussion and Analysis (Unaudited) June 30, 2016 and 2015
2
Shands has an equal interest in Shands/Solantic Joint Venture, LLC (d/b/a “CareSpot”) which owns
three walk-in urgent care centers located in Gainesville, Florida. Shands acquired its interest in the
second location in February 2015 and the third location in July 2015. CareSpot manages the operations
of all facilities. Shands and the University of Florida Development Corporation (“UFDC”) are members in
Innovation Square, LLC (“Innovation Square”). Situated between the UF campus and downtown
Gainesville, Innovation Square is a planned mixed-use research neighborhood that advances the national
and global profile of UF with Shands and the local biotech industry. Shands’ financial interest results from
assets transferred to Innovation Square, net of amounts received from UFDC representing their financial
interest.
Overview of the Consolidated Basic Financial Statements
Along with management’s discussion and analysis, the annual financial report includes the report of
independent certified public accountants and the consolidated basic financial statements of Shands. The
consolidated basic financial statements also include notes that explain in more detail some of the
information in the consolidated basic financial statements. By referring to the accompanying notes to the
financial statements, a broader understanding of issues impacting financial performance can be realized.
Required Financial Statements
The required statements are the consolidated basic statements of net position, the consolidated basic
statements of revenues, expenses and changes in net position and the consolidated basic statements of
cash flows. These statements offer short and long-term financial information about Shands’ activities.
The consolidated basic statements of net position reflect all of Shands’ assets, liabilities, deferred inflows
and outflows and provide information about the nature and amounts of investments in resources (assets)
and the obligations to creditors (liabilities). Assets, liabilities and deferred activity are presented in a
classified format, which distinguishes between their current and long-term time frame. The difference
between the assets plus deferred outflows and liabilities plus deferred inflows is reported as “net position.”
The consolidated basic statements of revenues, expenses and changes in net position present the
change in net position resulting from revenues earned and expenses incurred. All changes in net position
are reported as revenues are earned and expenses are incurred, regardless of the timing of related cash
flows.
The consolidated basic statements of cash flows report cash receipts, cash payments, and net changes
in cash resulting from operating, financing (capital and non-capital), and investing activities. The purpose
of the statements is to reflect the key sources and uses of cash during the reporting period.
Financial Analysis of Shands
Statements of Net Position
The condensed consolidated basic statements of net position included in this Management’s Discussion
and Analysis present the financial position of Shands as of June 30, 2016, 2015 and 2014 and include all
assets, liabilities and deferred inflows and outflows. Net position is one indicator of the current financial
condition of Shands. Changes in net position are an indicator of whether the overall financial condition of
the organization has improved or worsened over a period of time. They also provide the basis for
Shands Teaching Hospital and Clinics, Inc. and Subsidiaries Management’s Discussion and Analysis (Unaudited) June 30, 2016 and 2015
3
evaluating the capital structure, as well as assessing the liquidity and financial flexibility of Shands.
However, the financial statement user should consider other nonfinancial factors, such as changes in
economic conditions, population change, regulations, and government legislation affecting the health care
industry.
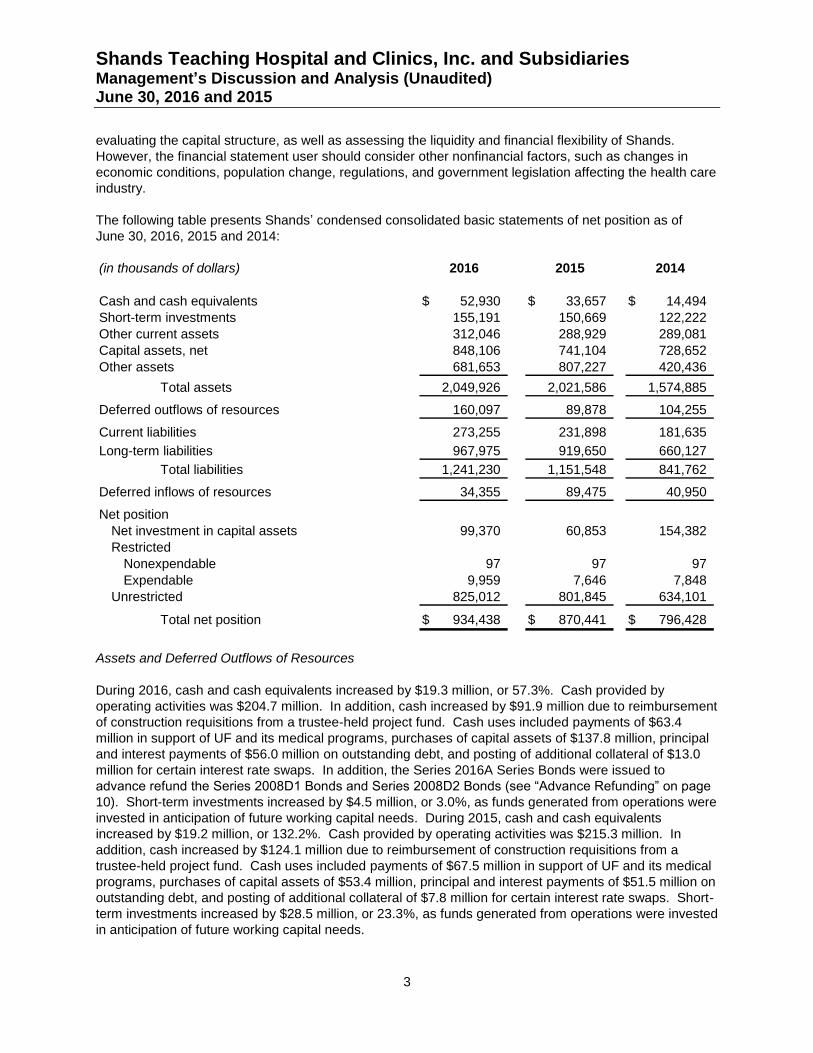
The following table presents Shands’ condensed consolidated basic statements of net position as of
June 30, 2016, 2015 and 2014:
(in thousands of dollars) 2016 2015 2014
Cash and cash equivalents 52,930$ 33,657$ 14,494$
Short-term investments 155,191 150,669 122,222
Other current assets 312,046 288,929 289,081
Capital assets, net 848,106 741,104 728,652
Other assets 681,653 807,227 420,436
Total assets 2,049,926 2,021,586 1,574,885
Deferred outflows of resources 160,097 89,878 104,255
Current liabilities 273,255 231,898 181,635
Long-term liabilities 967,975 919,650 660,127
Total liabilities 1,241,230 1,151,548 841,762
Deferred inflows of resources 34,355 89,475 40,950
Net position
Net investment in capital assets 99,370 60,853 154,382
Restricted
Nonexpendable 97 97 97
Expendable 9,959 7,646 7,848
Unrestricted 825,012 801,845 634,101
Total net position 934,438$ 870,441$ 796,428$
Assets and Deferred Outflows of Resources
During 2016, cash and cash equivalents increased by $19.3 million, or 57.3%. Cash provided by
operating activities was $204.7 million. In addition, cash increased by $91.9 million due to reimbursement
of construction requisitions from a trustee-held project fund. Cash uses included payments of $63.4
million in support of UF and its medical programs, purchases of capital assets of $137.8 million, principal
and interest payments of $56.0 million on outstanding debt, and posting of additional collateral of $13.0
million for certain interest rate swaps. In addition, the Series 2016A Series Bonds were issued to
advance refund the Series 2008D1 Bonds and Series 2008D2 Bonds (see “Advance Refunding” on page
10). Short-term investments increased by $4.5 million, or 3.0%, as funds generated from operations were
invested in anticipation of future working capital needs. During 2015, cash and cash equivalents
increased by $19.2 million, or 132.2%. Cash provided by operating activities was $215.3 million. In
addition, cash increased by $124.1 million due to reimbursement of construction requisitions from a
trustee-held project fund. Cash uses included payments of $67.5 million in support of UF and its medical
programs, purchases of capital assets of $53.4 million, principal and interest payments of $51.5 million on
outstanding debt, and posting of additional collateral of $7.8 million for certain interest rate swaps. Short-
term investments increased by $28.5 million, or 23.3%, as funds generated from operations were invested
in anticipation of future working capital needs.
Shands Teaching Hospital and Clinics, Inc. and Subsidiaries Management’s Discussion and Analysis (Unaudited) June 30, 2016 and 2015
4
Other current assets, including net patient accounts receivable, inventories, prepaid expenses and other
current assets, and assets whose use is limited, current portion increased in 2016 by $23.1 million, or
8.0%. Patient accounts receivable, net increased by $22.7 million due to a variety of factors including
volume growth, increased payment rates driven by higher case mix intensity and lower than expected
collections on receivables which resulted in an increase in receivable days outstanding. Inventory
balances increased by $0.9 million. Prepaid expenses and other current assets decreased by $0.5
million. In 2015, other current assets, including net patient accounts receivable, inventories, prepaid
expenses and other current assets, and assets whose use is limited, current portion decreased by $0.1
million, or 0.1%. Patient accounts receivable, net decreased by $7.2 million due to improved collections
on receivables and a reduction in receivable days outstanding. Inventory balances increased by $1.3
million. Prepaid expenses and other current assets decreased by $3.1 million primarily due to a decrease
in prepaid service agreements and insurance. Assets whose use is limited, current portion increased by
$8.9 million.
Capital assets, net, increased in 2016 by $107.0 million, or 14.4% reflecting purchases of $137.8 million,
which included $104.1 million in construction costs for the new hospitals (see “New Hospitals Project” on
page 11). Other capital activity included increases of $17.0 million in retainage payable and $9.8 million
in capitalized interest, offset by depreciation and amortization expense of $57.4 million, a net loss of $0.1
million on disposal of assets, and proceeds of $0.1 million received from sale of assets. In 2015, capital
assets, net, increased by $12.5 million, or 1.7% reflecting purchases of $53.4 million, which included
$25.8 million in construction costs for the new hospitals. Other capital activity included assets acquired
through installment debt financing of $3.7 million, and increases of $6.0 million in retainage payable and
$6.9 million in capitalized interest, offset by depreciation and amortization expense of $56.6 million, and a
net loss of $0.9 million on disposal of assets.
Other assets decreased in 2016 by $125.6 million, or 15.6%, primarily due to decreases of $78.7 million
in assets whose use is restricted and $61.0 million in other assets, partially offset by an increase of $14.3
million in assets whose use is limited, less current portion. The decrease in assets whose use is
restricted is primarily due to a decrease of $89.6 million in the trustee-held project fund and the
application of $4.3 million of debt service reserve funds towards the advance refunding of the Series
2008D1 Bonds and Series 2008D2 Bonds, partially offset by an increase of $13.0 million in additional
collateral requirements on certain interest rate swaps. The decrease in other assets is primarily due to a
decrease of $54.2 million in the pension asset associated with the defined benefit (“DB”) pension plan and
a $17.7 million reduction in the note receivable due from Shands Jacksonville Medical Center, Inc.
(“SJMC”) (see additional discussion in “Other Changes in Net Position” on page 8), partially offset by an
$11.6 million increase in fair value for interest rate swaps in an asset position. The increase in assets
whose use is limited, less current portion is due to increases in board designated funds for capital needs,
post-retirement benefits, and other health programs. In 2015, other assets increased by $386.8 million,
or 92.0%, primarily due to an increase of $205.8 million in assets whose use is restricted, an increase of
$125.2 million in assets whose use is limited, less current portion, and an increase of $55.8 million in
other assets. The increase in assets whose use is restricted, less current portion, is primarily due to bond
proceeds of $322.4 million, partially offset by issuance costs of $2.7 million and reimbursements of
$124.1 million from the trustee-held portion of the proceeds, and an increase of $7.8 million in additional
collateral requirements related to certain interest rate swaps. The remaining increase in other assets is
primarily due to an increase of $54.2 million in the DB pension plan asset.
Deferred outflows of resources increased in 2016 by $70.2 million, or 78.1%, primarily due to an increase
of $45.9 million in deferred outflows on pension along with an increase of $24.4 million in the fair value of
the hedged interest rate swaps. The increase in deferred outflows on pension resulted from the net
impact of actuarial assumption changes of $51.1 million (largely due to mortality assumptions) partially
offset by actuarial experience of $3.3 million and a net reduction of $1.9 million in plan contribution levels.
Shands Teaching Hospital and Clinics, Inc. and Subsidiaries Management’s Discussion and Analysis (Unaudited) June 30, 2016 and 2015
5
In 2015, deferred outflows of resources decreased by $14.4 million, or 13.8%, primarily due to a decrease
of $20.0 million in deferred outflows on pension due to a reduction in contribution levels and amortization
of actuarial losses partially offset by a decrease of $5.8 million in the fair value of the hedged interest rate
swaps.
Liabilities, Deferred Inflows of Resources and Net Position
Current liabilities increased in 2016 by $41.4 million, or 17.8%, primarily due to increases of $35.6 million
in accounts payable and accrued expenses, $5.2 million in accrued salaries and leave payable, and $7.3
million in estimated third-party payor settlements, partially offset by a decrease of $6.7 million in long-term
debt, current portion. The increase in accounts payable and accrued expenses is primarily due to
increases in patient volume, the timing of the regular payment cycle, as well as increases in retainage
payable and other accrued expenses. The increase in estimated third-party payor settlements is primarily
due to changes in estimates to prior year settlement amounts, resulting in increased liabilities. The
decrease in long-term debt, current portion is due to the final maturity of the Series 2010B Bonds in
December 2015. In 2015, current liabilities increased by $50.3 million, or 27.7%, primarily due to
increases of $2.8 million in long-term debt, current portion, $17.4 million in accounts payable and accrued
expenses, $4.1 million in accrued salaries and leave payable, and $25.9 million in estimated third-party
payor settlements. The increase in accounts payable and accrued expenses is primarily due to increases
in vendor payables associated with patient volume increases, payroll deduction payables, retainage
payable and interest accruals. The increase in estimated third-party payor settlements is primarily due to
collection of prior year settlement receivable amounts, which offset settlement liabilities.
Long-term liabilities increased in 2016 by $48.3 million, or 5.3%, due to an increase of $26.3 million in fair
value adjustments for interest rate swaps in a liability position, and an increase of $36.0 million in the DB
pension plan liability, partially offset by principal payments on debt of $22.7 million including both current
and long-term portions. In 2015, long-term liabilities increased by $259.5 million, or 39.3%, primarily due
to the issuance of $300.0 million in debt, in addition to a bond premium of $22.4 million, and an increase
of $5.6 million in the mark-to-market valuations of interest rate swaps. Partially offsetting the increase
were principal payments on debt of $21.5 million (including both current and long-term portions) and a
decrease of $45.4 million in the DB pension plan liability. At June 30, 2015, the position of the plan was
an asset.
Deferred inflows of resources decreased in 2016 by $55.1 million, or 61.6%, due to a decrease of $47.3
million in deferred inflows on pension due to the net differences between projected and actual earnings
on pension plan investments and a decrease of $7.8 million in the deferred gain on debt refunding
primarily due to the advance refunding of the Series 2008D1 Bonds and Series 2008D2 Bonds. In 2015,
deferred inflows of resources increased by $48.5 million, or 118.5%, due to an increase of $49.4 million in
deferred inflows on pension due to the net differences between projected and actual earnings on plan
investments of $70.9 million partially offset by amortization of plan asset gains of $21.5 million, slightly
offset by amortization of deferred gain on debt refunding of $0.9 million.
Total net position increased in 2016 by $64.0 million, or 7.4%, due to an excess margin of $142.1 million,
capital contributions of $0.7 million, and other changes in net position of $2.3 million, partially offset by
transfers and expenditures in support of UF and its medical programs of $63.4 million and the $17.7
million reduction in the note due from SJMC. In 2015, total net position increased by $74.0 million, or
9.3%, due to an excess margin of $134.3 million and capital contributions of $6.4 million, partially offset
by transfers and expenditures in support of UF and its medical programs of $66.5 million and other
changes in net position of $0.2 million.
Shands Teaching Hospital and Clinics, Inc. and Subsidiaries Management’s Discussion and Analysis (Unaudited) June 30, 2016 and 2015
6
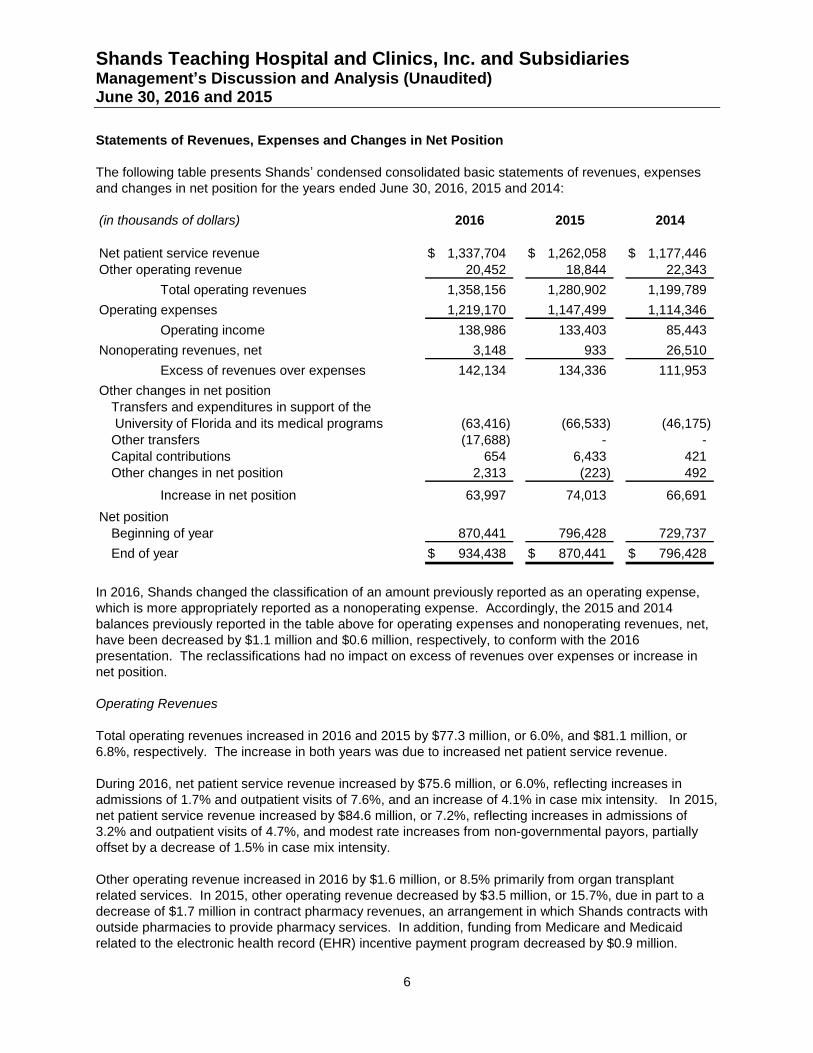
Statements of Revenues, Expenses and Changes in Net Position
The following table presents Shands’ condensed consolidated basic statements of revenues, expenses
and changes in net position for the years ended June 30, 2016, 2015 and 2014:
(in thousands of dollars) 2016 2015 2014
Net patient service revenue 1,337,704$ 1,262,058$ 1,177,446$
Other operating revenue 20,452 18,844 22,343
Total operating revenues 1,358,156 1,280,902 1,199,789
Operating expenses 1,219,170 1,147,499 1,114,346
Operating income 138,986 133,403 85,443
Nonoperating revenues, net 3,148 933 26,510
Excess of revenues over expenses 142,134 134,336 111,953
Other changes in net position
Transfers and expenditures in support of the
University of Florida and its medical programs (63,416) (66,533) (46,175)
Other transfers (17,688) - -
Capital contributions 654 6,433 421
Other changes in net position 2,313 (223) 492
Increase in net position 63,997 74,013 66,691
Net position
Beginning of year 870,441 796,428 729,737
End of year 934,438$ 870,441$ 796,428$
In 2016, Shands changed the classification of an amount previously reported as an operating expense,
which is more appropriately reported as a nonoperating expense. Accordingly, the 2015 and 2014
balances previously reported in the table above for operating expenses and nonoperating revenues, net,
have been decreased by $1.1 million and $0.6 million, respectively, to conform with the 2016
presentation. The reclassifications had no impact on excess of revenues over expenses or increase in
net position.
Operating Revenues
Total operating revenues increased in 2016 and 2015 by $77.3 million, or 6.0%, and $81.1 million, or
6.8%, respectively. The increase in both years was due to increased net patient service revenue.
During 2016, net patient service revenue increased by $75.6 million, or 6.0%, reflecting increases in
admissions of 1.7% and outpatient visits of 7.6%, and an increase of 4.1% in case mix intensity. In 2015,
net patient service revenue increased by $84.6 million, or 7.2%, reflecting increases in admissions of
3.2% and outpatient visits of 4.7%, and modest rate increases from non-governmental payors, partially
offset by a decrease of 1.5% in case mix intensity.
Other operating revenue increased in 2016 by $1.6 million, or 8.5% primarily from organ transplant
related services. In 2015, other operating revenue decreased by $3.5 million, or 15.7%, due in part to a
decrease of $1.7 million in contract pharmacy revenues, an arrangement in which Shands contracts with
outside pharmacies to provide pharmacy services. In addition, funding from Medicare and Medicaid
related to the electronic health record (EHR) incentive payment program decreased by $0.9 million.
Shands Teaching Hospital and Clinics, Inc. and Subsidiaries Management’s Discussion and Analysis (Unaudited) June 30, 2016 and 2015
7
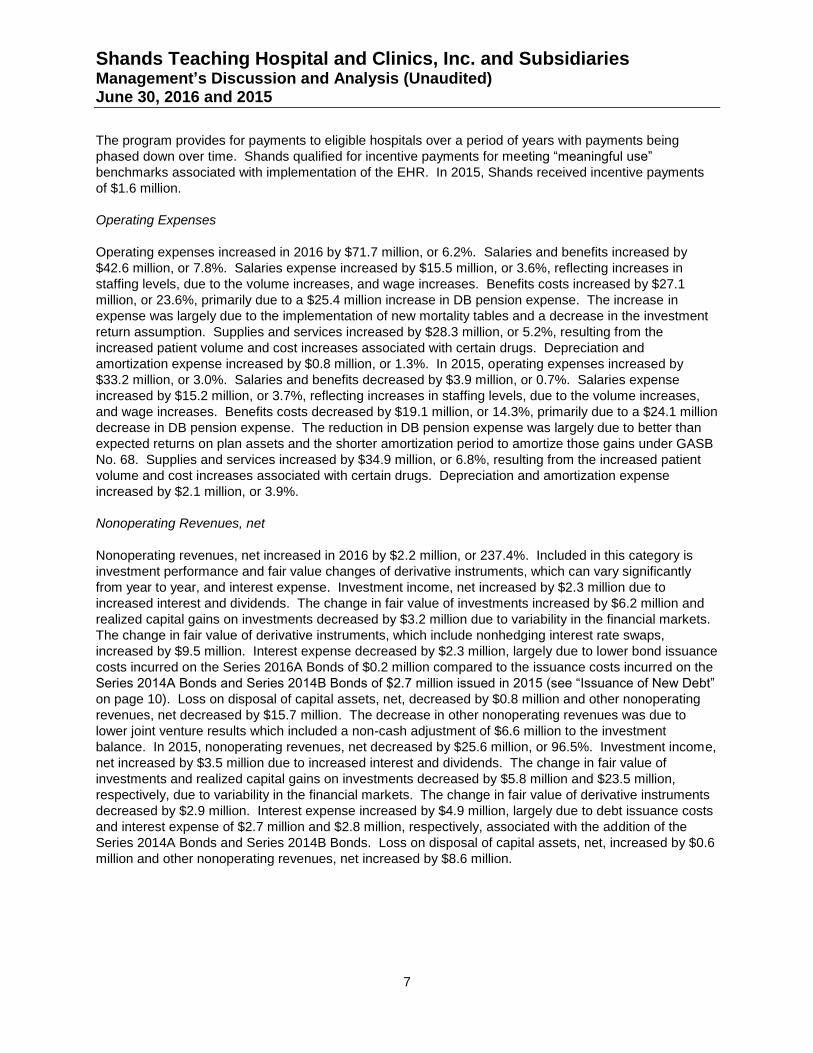
The program provides for payments to eligible hospitals over a period of years with payments being
phased down over time. Shands qualified for incentive payments for meeting “meaningful use”
benchmarks associated with implementation of the EHR. In 2015, Shands received incentive payments
of $1.6 million.
Operating Expenses
Operating expenses increased in 2016 by $71.7 million, or 6.2%. Salaries and benefits increased by
$42.6 million, or 7.8%. Salaries expense increased by $15.5 million, or 3.6%, reflecting increases in
staffing levels, due to the volume increases, and wage increases. Benefits costs increased by $27.1
million, or 23.6%, primarily due to a $25.4 million increase in DB pension expense. The increase in
expense was largely due to the implementation of new mortality tables and a decrease in the investment
return assumption. Supplies and services increased by $28.3 million, or 5.2%, resulting from the
increased patient volume and cost increases associated with certain drugs. Depreciation and
amortization expense increased by $0.8 million, or 1.3%. In 2015, operating expenses increased by
$33.2 million, or 3.0%. Salaries and benefits decreased by $3.9 million, or 0.7%. Salaries expense
increased by $15.2 million, or 3.7%, reflecting increases in staffing levels, due to the volume increases,
and wage increases. Benefits costs decreased by $19.1 million, or 14.3%, primarily due to a $24.1 million
decrease in DB pension expense. The reduction in DB pension expense was largely due to better than
expected returns on plan assets and the shorter amortization period to amortize those gains under GASB
No. 68. Supplies and services increased by $34.9 million, or 6.8%, resulting from the increased patient
volume and cost increases associated with certain drugs. Depreciation and amortization expense
increased by $2.1 million, or 3.9%.
Nonoperating Revenues, net
Nonoperating revenues, net increased in 2016 by $2.2 million, or 237.4%. Included in this category is
investment performance and fair value changes of derivative instruments, which can vary significantly
from year to year, and interest expense. Investment income, net increased by $2.3 million due to
increased interest and dividends. The change in fair value of investments increased by $6.2 million and
realized capital gains on investments decreased by $3.2 million due to variability in the financial markets.
The change in fair value of derivative instruments, which include nonhedging interest rate swaps,
increased by $9.5 million. Interest expense decreased by $2.3 million, largely due to lower bond issuance
costs incurred on the Series 2016A Bonds of $0.2 million compared to the issuance costs incurred on the
Series 2014A Bonds and Series 2014B Bonds of $2.7 million issued in 2015 (see “Issuance of New Debt”
on page 10). Loss on disposal of capital assets, net, decreased by $0.8 million and other nonoperating
revenues, net decreased by $15.7 million. The decrease in other nonoperating revenues was due to
lower joint venture results which included a non-cash adjustment of $6.6 million to the investment
balance. In 2015, nonoperating revenues, net decreased by $25.6 million, or 96.5%. Investment income,
net increased by $3.5 million due to increased interest and dividends. The change in fair value of
investments and realized capital gains on investments decreased by $5.8 million and $23.5 million,
respectively, due to variability in the financial markets. The change in fair value of derivative instruments
decreased by $2.9 million. Interest expense increased by $4.9 million, largely due to debt issuance costs
and interest expense of $2.7 million and $2.8 million, respectively, associated with the addition of the
Series 2014A Bonds and Series 2014B Bonds. Loss on disposal of capital assets, net, increased by $0.6
million and other nonoperating revenues, net increased by $8.6 million.
Shands Teaching Hospital and Clinics, Inc. and Subsidiaries Management’s Discussion and Analysis (Unaudited) June 30, 2016 and 2015
8
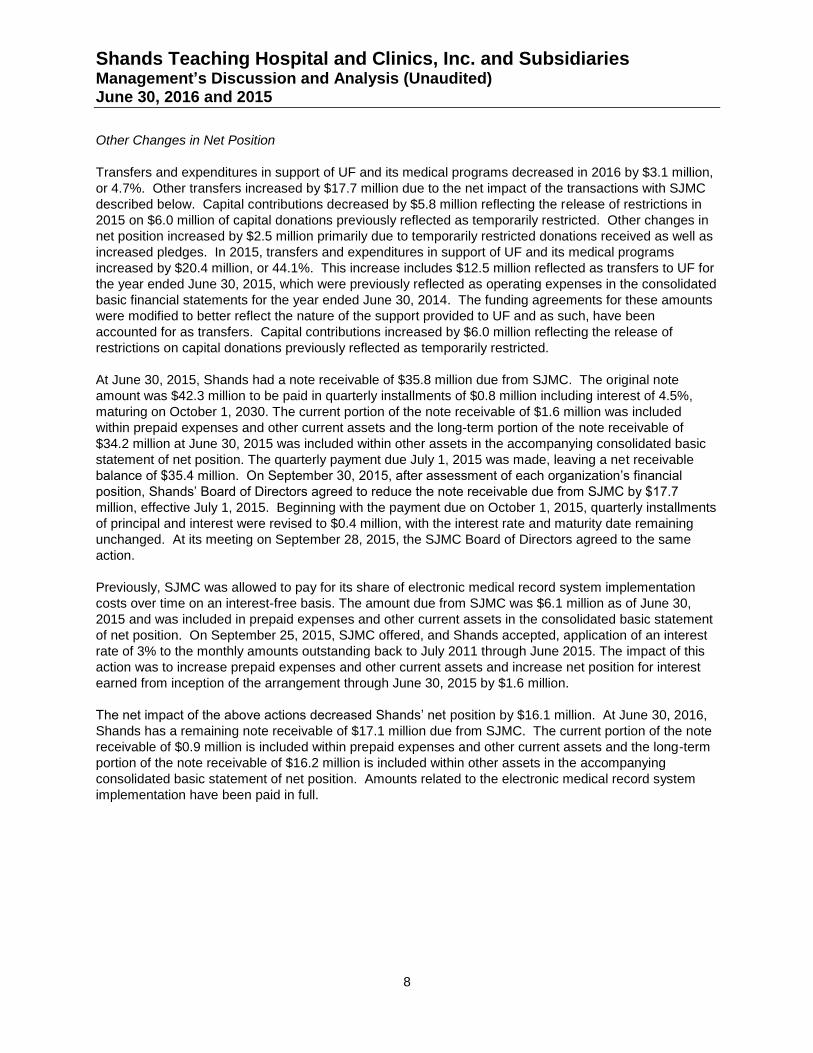
Other Changes in Net Position
Transfers and expenditures in support of UF and its medical programs decreased in 2016 by $3.1 million,
or 4.7%. Other transfers increased by $17.7 million due to the net impact of the transactions with SJMC
described below. Capital contributions decreased by $5.8 million reflecting the release of restrictions in
2015 on $6.0 million of capital donations previously reflected as temporarily restricted. Other changes in
net position increased by $2.5 million primarily due to temporarily restricted donations received as well as
increased pledges. In 2015, transfers and expenditures in support of UF and its medical programs
increased by $20.4 million, or 44.1%. This increase includes $12.5 million reflected as transfers to UF for
the year ended June 30, 2015, which were previously reflected as operating expenses in the consolidated
basic financial statements for the year ended June 30, 2014. The funding agreements for these amounts
were modified to better reflect the nature of the support provided to UF and as such, have been
accounted for as transfers. Capital contributions increased by $6.0 million reflecting the release of
restrictions on capital donations previously reflected as temporarily restricted.
At June 30, 2015, Shands had a note receivable of $35.8 million due from SJMC. The original note
amount was $42.3 million to be paid in quarterly installments of $0.8 million including interest of 4.5%,
maturing on October 1, 2030. The current portion of the note receivable of $1.6 million was included
within prepaid expenses and other current assets and the long-term portion of the note receivable of
$34.2 million at June 30, 2015 was included within other assets in the accompanying consolidated basic
statement of net position. The quarterly payment due July 1, 2015 was made, leaving a net receivable
balance of $35.4 million. On September 30, 2015, after assessment of each organization’s financial
position, Shands’ Board of Directors agreed to reduce the note receivable due from SJMC by $17.7
million, effective July 1, 2015. Beginning with the payment due on October 1, 2015, quarterly installments
of principal and interest were revised to $0.4 million, with the interest rate and maturity date remaining
unchanged. At its meeting on September 28, 2015, the SJMC Board of Directors agreed to the same
action.
Previously, SJMC was allowed to pay for its share of electronic medical record system implementation
costs over time on an interest-free basis. The amount due from SJMC was $6.1 million as of June 30,
2015 and was included in prepaid expenses and other current assets in the consolidated basic statement
of net position. On September 25, 2015, SJMC offered, and Shands accepted, application of an interest
rate of 3% to the monthly amounts outstanding back to July 2011 through June 2015. The impact of this
action was to increase prepaid expenses and other current assets and increase net position for interest
earned from inception of the arrangement through June 30, 2015 by $1.6 million.
The net impact of the above actions decreased Shands’ net position by $16.1 million. At June 30, 2016,
Shands has a remaining note receivable of $17.1 million due from SJMC. The current portion of the note
receivable of $0.9 million is included within prepaid expenses and other current assets and the long-term
portion of the note receivable of $16.2 million is included within other assets in the accompanying
consolidated basic statement of net position. Amounts related to the electronic medical record system
implementation have been paid in full.
Shands Teaching Hospital and Clinics, Inc. and Subsidiaries Management’s Discussion and Analysis (Unaudited) June 30, 2016 and 2015
9
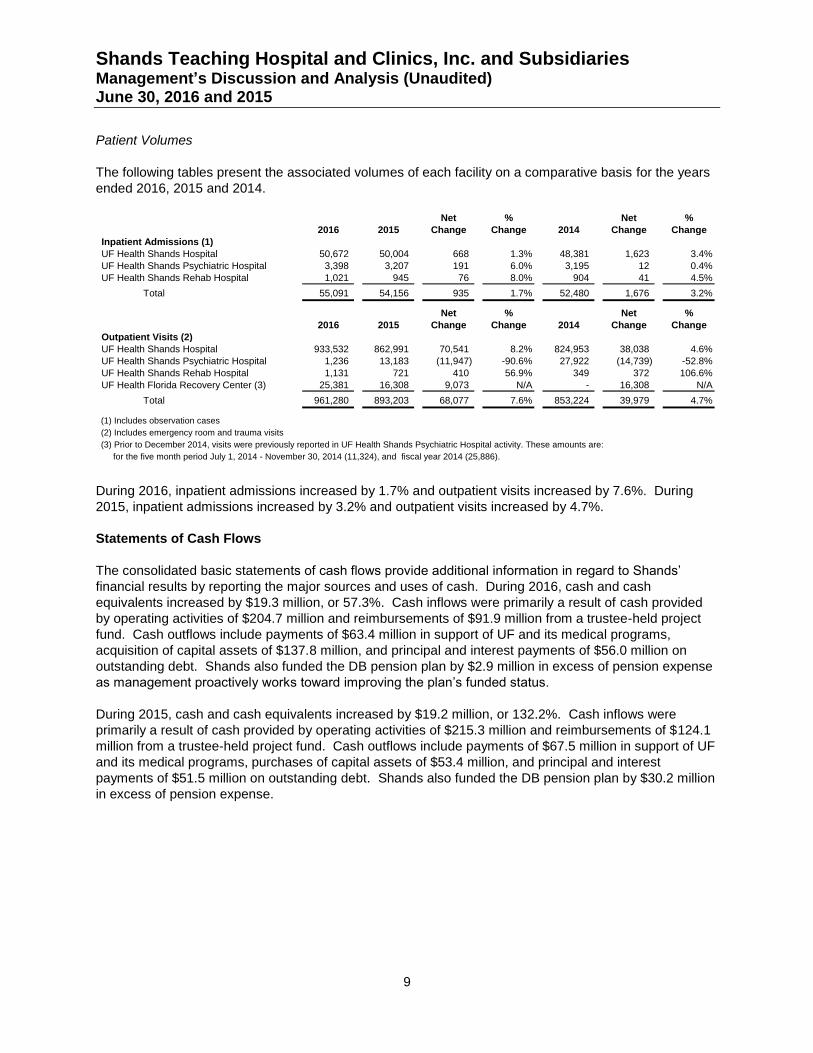
Patient Volumes
The following tables present the associated volumes of each facility on a comparative basis for the years
ended 2016, 2015 and 2014.
Net % Net %
2016 2015 Change Change 2014 Change Change
Inpatient Admissions (1)
UF Health Shands Hospital 50,672 50,004 668 1.3% 48,381 1,623 3.4%
UF Health Shands Psychiatric Hospital 3,398 3,207 191 6.0% 3,195 12 0.4%
UF Health Shands Rehab Hospital 1,021 945 76 8.0% 904 41 4.5%
Total 55,091 54,156 935 1.7% 52,480 1,676 3.2%
Net % Net %
2016 2015 Change Change 2014 Change Change
Outpatient Visits (2)
UF Health Shands Hospital 933,532 862,991 70,541 8.2% 824,953 38,038 4.6%
UF Health Shands Psychiatric Hospital 1,236 13,183 (11,947) -90.6% 27,922 (14,739) -52.8%
UF Health Shands Rehab Hospital 1,131 721 410 56.9% 349 372 106.6%
UF Health Florida Recovery Center (3) 25,381 16,308 9,073 N/A - 16,308 N/A
Total 961,280 893,203 68,077 7.6% 853,224 39,979 4.7%
(1) Includes observation cases
(2) Includes emergency room and trauma visits
(3) Prior to December 2014, visits were previously reported in UF Health Shands Psychiatric Hospital activity. These amounts are:
for the five month period July 1, 2014 - November 30, 2014 (11,324), and fiscal year 2014 (25,886).
During 2016, inpatient admissions increased by 1.7% and outpatient visits increased by 7.6%. During
2015, inpatient admissions increased by 3.2% and outpatient visits increased by 4.7%.
Statements of Cash Flows
The consolidated basic statements of cash flows provide additional information in regard to Shands’
financial results by reporting the major sources and uses of cash. During 2016, cash and cash
equivalents increased by $19.3 million, or 57.3%. Cash inflows were primarily a result of cash provided
by operating activities of $204.7 million and reimbursements of $91.9 million from a trustee-held project
fund. Cash outflows include payments of $63.4 million in support of UF and its medical programs,
acquisition of capital assets of $137.8 million, and principal and interest payments of $56.0 million on
outstanding debt. Shands also funded the DB pension plan by $2.9 million in excess of pension expense
as management proactively works toward improving the plan’s funded status.
During 2015, cash and cash equivalents increased by $19.2 million, or 132.2%. Cash inflows were
primarily a result of cash provided by operating activities of $215.3 million and reimbursements of $124.1
million from a trustee-held project fund. Cash outflows include payments of $67.5 million in support of UF
and its medical programs, purchases of capital assets of $53.4 million, and principal and interest
payments of $51.5 million on outstanding debt. Shands also funded the DB pension plan by $30.2 million
in excess of pension expense.
Shands Teaching Hospital and Clinics, Inc. and Subsidiaries Management’s Discussion and Analysis (Unaudited) June 30, 2016 and 2015
10
Defined Benefit Pension Plan Funded Status
As of June 30, 2016, the funded status (as measured under ERISA funding rules) was 65.7%, down from
75.1% as of June 30, 2015. The reduction in the funded status is largely due to a decrease in the
discount rate, from 4.59% at June 30, 2015 to 3.74% at June 30, 2016. To help improve the funded
status and lower the costs of plan administration, management offered a lump-sum payment option to
terminated vested plan participants. In June 2016, 1,050 plan participants received lump-sum payments
totaling $51.8 million, eliminating $75.2 million in actuarially determined plan obligations. As of June 30,
2015, the funded status was 75.1%, down slightly from 75.3% as of June 30, 2014.
Advance Refunding
In May 2016, the Alachua County Health Facilities Authority (“Authority”) issued the Series 2016A Bonds
in the amount of $46.6 million on behalf of Shands, to advance refund the Series 2008D1 Bonds of $21.7
million and Series 2008D2 Bonds of $22.6 million. The proceeds of the Series 2016A Bonds and debt
service reserve funds of $4.4 million were used to purchase U.S. government securities, to be held in an
irrevocable trust to meet the debt service on the refunded bonds through December 1, 2018, and to pay
issuance costs of $0.2 million. In connection with the transaction, a deferred outflow of $7.0 million was
recorded (to be amortized over the life of the new debt) which includes the unamortized bond discount of
$0.5 million related to the refunded debt. The interest rate on the Series 2016A Bonds is fixed at 2.15%.
Shands advance refunded the Series 2008D1 Bonds and Series 2008D2 Bonds to reduce its total debt
service payments over the next 14.5 years by $10.9 million and to obtain an economic gain (difference
between the present value of the debt service on the new debt and the refunded debt) of $9.2 million.
Issuance of New Debt
In October 2014, the Authority, on behalf of Shands, issued Series 2014A Bonds ($250.0 million) and
Series 2014B Bonds ($50.0 million) plus bond premium of $22.4 million. The bond proceeds of $322.4
million were placed in a trustee-held fund; $2.7 million of the proceeds were used to pay issuance costs,
with $100.0 million used to reimburse Shands for amounts already expended for capital assets. The
remaining proceeds in the trustee-held fund are being used exclusively for the construction of the UF
Health Heart and Vascular Hospital and the UF Health Neuromedicine Hospital. The balance of the
trustee-held fund was $107.9 million as of June 30, 2016, reflecting the net impact of reimbursement
requests ($116.1 million) and interest income ($4.3 million). The Series 2014A bonds are comprised of
$25.4 million in serial bonds maturing on dates in December 2025 through December 2036 at a fixed rate
of 5% and $224.6 million in term bonds with $50.0 million at a fixed rate of 4% and $174.6 million at a
fixed rate of 5%, maturing in December 2044. The Series 2014B bonds are comprised of $50.0 million in
serial bonds maturing in December 2034 at a fixed rate of 5%. Both of the series are tax exempt and
unenhanced.
Shands Teaching Hospital and Clinics, Inc. and Subsidiaries Management’s Discussion and Analysis (Unaudited) June 30, 2016 and 2015
11
Debt Outstanding
As of June 30, 2016, Shands had $855.6 million in debt outstanding compared to $876.6 million at
June 30, 2015. Long-term debt is comprised of tax exempt bond issues, taxable notes, and installment
debt. Shands utilizes interest rate swaps in order to synthetically convert certain variable rate bonds to
fixed rate bonds. Including the effect of the interest rate swaps, 85% of Shands’ bonds and notes
outstanding are fixed while 15% are variable. The Series 1996A Bonds are fixed rate bonds insured by
MBIA. The Series 2007A and Series 2007B Bonds, the Series 2008A Bonds, and the Series 2008C
Bonds are variable rate bonds with fixed rate payor interest rate swaps which synthetically convert them
to fixed rate bonds. The Series 2014A Bonds, Series 2014B Bonds, and 2016A Bonds are unenhanced
fixed rate bonds. The Series 2010A Bonds and the Series 2012A and Series 2012B Bonds are variable
rate bonds. The Series 2013A Taxable Notes and the 2012 Bank Note are taxable fixed rate notes.
As of June 30, 2015, Shands had $876.6 million in debt outstanding compared to $572.9 million at
June 30, 2014. As previously noted, during 2015, Shands incurred an additional $300.0 million in debt to
finance a major construction project (see “New Hospitals Project” below).
New Hospitals Project
Construction is proceeding on the UF Health Heart and Vascular Hospital and the UF Health
Neuromedicine Hospital. The new hospitals are being constructed on property adjacent to the UF Health
Cancer Hospital on the campus of UF Health Shands Hospital in Gainesville, Florida. This project will
include a new 9-floor building with 538,000 gross square feet of space. The building is expected to house
the following facilities and services:
216 private patient beds, including 120 ICU/IMC beds and 96 acute care beds. Located on the
patient floors will be a 6 bay inpatient dialysis suite, rehab therapy gym, CT scanner, satellite
pharmacy, and a blood gas lab.
an operating suite with 10 general ORs, 5 hybrid ORs, 1 intraoperative MRI, 5 Cath labs, 16
recovery bays, 38 pre/post-op rooms, blood dispensing station, and a gross pathology lab.
ambulatory clinic space for Cardiovascular services and Neuromedicine services, a pre-operative
clinic, a blood draw station, neurodiagnostic testing and heart and vascular ancillary services.
a new radiology department with 3 CT scanners (1 located in neuro ICU), 2 MRIs, 2 general
radiology rooms, 1 ultrasound room, and 1 fluoroscopy room.
The estimated cost of this project is $440 million, excluding financing costs and capitalized interest. The
project is expected to be completed and placed in service in the first quarter of calendar 2018. There is
no certificate of need approval necessary for this project. Total project costs incurred as of June 30,
2016, excluding financing costs and capitalized interest was $148.6 million.
Credit Ratings
In November 2015, both Moody’s Investor Services (“Moody’s”) and Standard & Poor’s (“S&P”) affirmed
their previous underlying credit ratings of A3 and A-, respectively. Both Moody’s and S&P indicated a
“Stable” outlook on all of Shands’ rated debt.
Report of Independent Certified Public Accountants
To the Board of Directors of
Shands Teaching Hospital and Clinics, Inc. and Subsidiaries
We have audited the accompanying consolidated basic financial statements of Shands Teaching Hospital
and Clinics, Inc. and Subsidiaries (“Shands”) as of and for the years ended June 30, 2016 and 2015, and
the related notes to the consolidated basic financial statements, which collectively comprise the
consolidated basic statements of net position, the consolidated basic statements of revenues, expenses
and changes in net position, and the consolidated basic statements of cash flows.
Management’s Responsibility for the Consolidated Basic Financial Statements
Management is responsible for the preparation and fair presentation of the consolidated basic financial
statements in accordance with accounting principles generally accepted in the United States of America;
this includes the design, implementation, and maintenance of internal control relevant to the preparation
and fair presentation of consolidated basic financial statements that are free from material misstatement,
whether due to fraud or error.
Independent Certified Public Accountants’ Responsibility
Our responsibility is to express an opinion on the consolidated basic financial statements based on our
audits. We conducted our audits in accordance with auditing standards generally accepted in the United
States of America. Those standards require that we plan and perform our audits to obtain reasonable
assurance about whether the consolidated basic financial statements are free from material misstatement.
An audit involves performing procedures to obtain audit evidence about the amounts and disclosures in
the consolidated basic financial statements. The procedures selected depend on our judgment, including
the assessment of the risks of material misstatement of the consolidated basic financial statements,
whether due to fraud or error. In making those risk assessments, we consider internal control relevant to
Shands’ preparation and fair presentation of the consolidated basic financial statements in order to design
audit procedures that are appropriate in the circumstances, but not for the purpose of expressing an
opinion on the effectiveness of Shands’ internal control. Accordingly, we express no such opinion. An
audit also includes evaluating the appropriateness of accounting policies used and the reasonableness of
significant accounting estimates made by management, as well as evaluating the overall presentation of
the consolidated basic financial statements. We believe that the audit evidence we have obtained is
sufficient and appropriate to provide a basis for our audit opinion.
Opinion
In our opinion, the consolidated basic financial statements referred to above present fairly, in all material
respects, the respective financial position of Shands Teaching Hospital and Clinics, Inc. and Subsidiaries
at June 30, 2016 and 2015, and the respective changes in financial position and cash flows thereof for the
years then ended in accordance with accounting principles generally accepted in the United States of
America.
PricewaterhouseCoopers LLP, 4040 West Boy Scout Boulevard, Suite 1000, Tampa, FL 33607-5745 T: (813) 229 0221, F: (813) 229 3646, www.pwc.com/us
13
Other Matters
The accompanying Management’s Discussion and Analysis (“MD&A”) (Unaudited) for the years ended
June 30, 2016 and 2015 on pages 1 through 11, the Schedule of Changes in the Net Pension Liability and
Related Ratios (Unaudited), and the Schedule of Employer Contributions (Unaudited) on pages 53 and
54, respectively, are required by accounting principles generally accepted in the United States of America
to supplement the consolidated basic financial statements. Such information, although not a part of the
consolidated basic financial statements, is required by the Governmental Accounting Standards Board
who considers it to be an essential part of financial reporting for placing the consolidated basic financial
statements in an appropriate operational, economic, or historical context. We have applied certain limited
procedures to the required supplementary information in accordance with auditing standards generally
accepted in the United States of America, which consisted of inquiries of management about the methods
of preparing the information and comparing the information for consistency with management’s responses
to our inquiries, the consolidated basic financial statements, and other knowledge we obtained during our
audits of the consolidated basic financial statements. We do not express an opinion or provide any
assurance on the information because the limited procedures do not provide us with sufficient evidence to
express an opinion or provide any assurance.
Our audit was conducted for the purpose of forming an opinion on the consolidated basic financial
statements. The consolidating information on pages 55 through 58 is presented for purposes of additional
analysis and is not a required part of the consolidated basic financial statements. The information is the
responsibility of management and was derived from and relates directly to the underlying accounting and
other records used to prepare the consolidated basic financial statements. The information has been
subjected to the auditing procedures applied in the audit of the consolidated basic financial statements
and certain additional procedures, including comparing and reconciling such information directly to the
underlying accounting and other records used to prepare the consolidated basic financial statements or to
the consolidated basic financial statements themselves and other additional procedures, in accordance
with auditing standards generally accepted in the United States of America. In our opinion, the
consolidating information is fairly stated, in all material respects, in relation to the consolidated basic
financial statements taken as a whole.
September 20, 2016
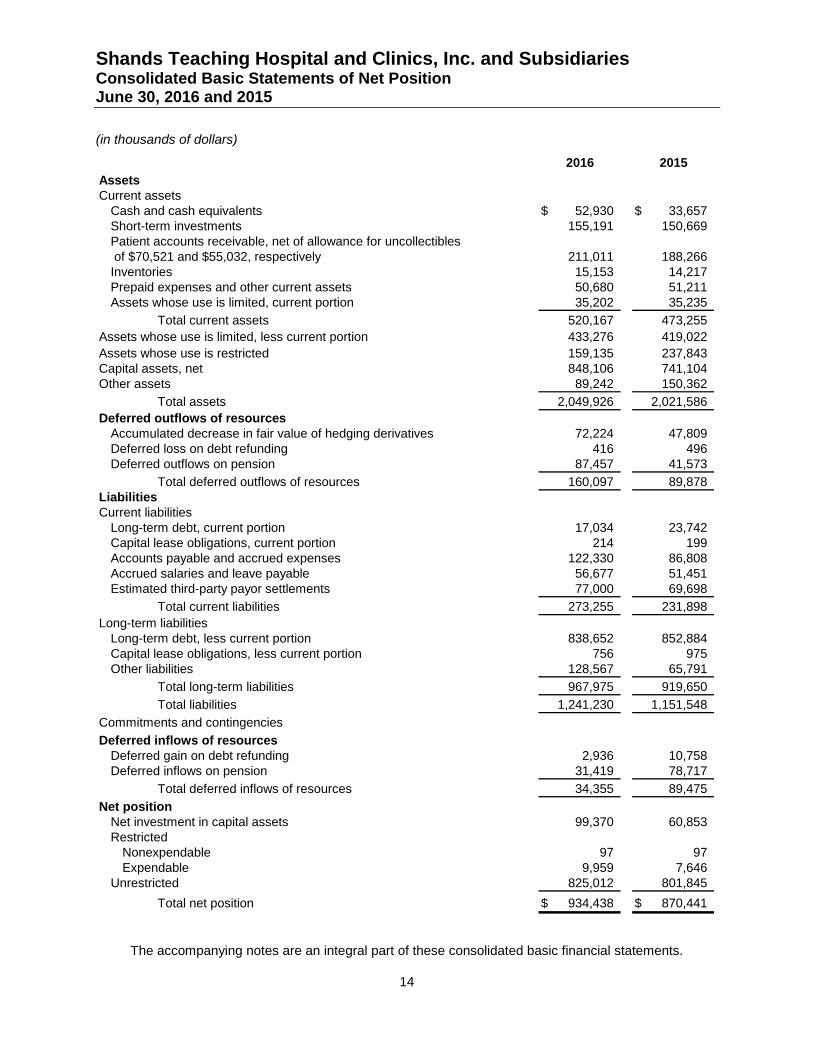
Shands Teaching Hospital and Clinics, Inc. and Subsidiaries Consolidated Basic Statements of Net Position June 30, 2016 and 2015
(in thousands of dollars)
The accompanying notes are an integral part of these consolidated basic financial statements.
14
2016 2015
Assets
Current assets
Cash and cash equivalents 52,930$ 33,657$
Short-term investments 155,191 150,669
Patient accounts receivable, net of allowance for uncollectibles
of $70,521 and $55,032, respectively 211,011 188,266
Inventories 15,153 14,217
Prepaid expenses and other current assets 50,680 51,211
Assets whose use is limited, current portion 35,202 35,235
Total current assets 520,167 473,255
Assets whose use is limited, less current portion 433,276 419,022
Assets whose use is restricted 159,135 237,843
Capital assets, net 848,106 741,104
Other assets 89,242 150,362
Total assets 2,049,926 2,021,586
Deferred outflows of resources
Accumulated decrease in fair value of hedging derivatives 72,224 47,809
Deferred loss on debt refunding 416 496
Deferred outflows on pension 87,457 41,573
Total deferred outflows of resources 160,097 89,878
Liabilities
Current liabilities
Long-term debt, current portion 17,034 23,742
Capital lease obligations, current portion 214 199
Accounts payable and accrued expenses 122,330 86,808
Accrued salaries and leave payable 56,677 51,451
Estimated third-party payor settlements 77,000 69,698
Total current liabilities 273,255 231,898
Long-term liabilities
Long-term debt, less current portion 838,652 852,884
Capital lease obligations, less current portion 756 975
Other liabilities 128,567 65,791
Total long-term liabilities 967,975 919,650
Total liabilities 1,241,230 1,151,548
Commitments and contingencies
Deferred inflows of resources
Deferred gain on debt refunding 2,936 10,758
Deferred inflows on pension 31,419 78,717
Total deferred inflows of resources 34,355 89,475
Net position
Net investment in capital assets 99,370 60,853
Restricted
Nonexpendable 97 97
Expendable 9,959 7,646
Unrestricted 825,012 801,845
Total net position 934,438$ 870,441$
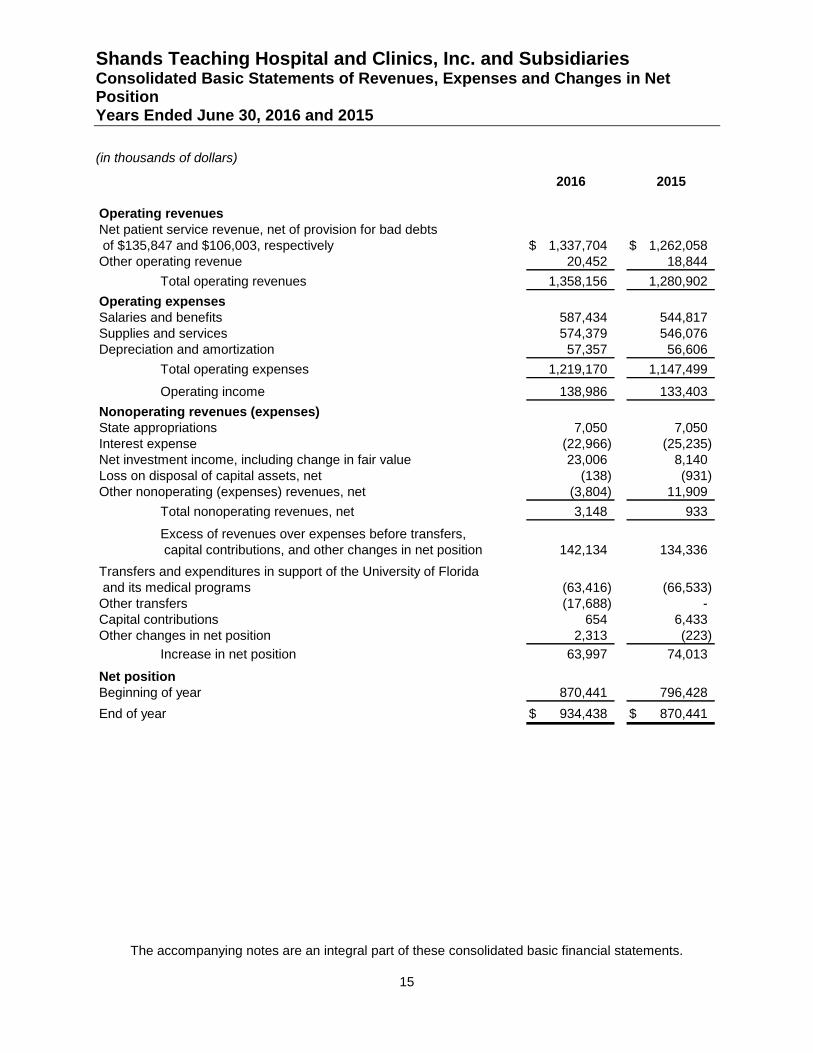
Shands Teaching Hospital and Clinics, Inc. and Subsidiaries Consolidated Basic Statements of Revenues, Expenses and Changes in Net Position Years Ended June 30, 2016 and 2015
(in thousands of dollars)
The accompanying notes are an integral part of these consolidated basic financial statements.
15
2016 2015
Operating revenues
Net patient service revenue, net of provision for bad debts
of $135,847 and $106,003, respectively 1,337,704$ 1,262,058$
Other operating revenue 20,452 18,844
Total operating revenues 1,358,156 1,280,902
Operating expenses
Salaries and benefits 587,434 544,817
Supplies and services 574,379 546,076
Depreciation and amortization 57,357 56,606
Total operating expenses 1,219,170 1,147,499
Operating income 138,986 133,403
Nonoperating revenues (expenses)
State appropriations 7,050 7,050
Interest expense (22,966) (25,235)
Net investment income, including change in fair value 23,006 8,140
Loss on disposal of capital assets, net (138) (931)
Other nonoperating (expenses) revenues, net (3,804) 11,909
Total nonoperating revenues, net 3,148 933
Excess of revenues over expenses before transfers,
capital contributions, and other changes in net position 142,134 134,336
Transfers and expenditures in support of the University of Florida
and its medical programs (63,416) (66,533)
Other transfers (17,688) -
Capital contributions 654 6,433
Other changes in net position 2,313 (223)
Increase in net position 63,997 74,013
Net position
Beginning of year 870,441 796,428
End of year 934,438$ 870,441$
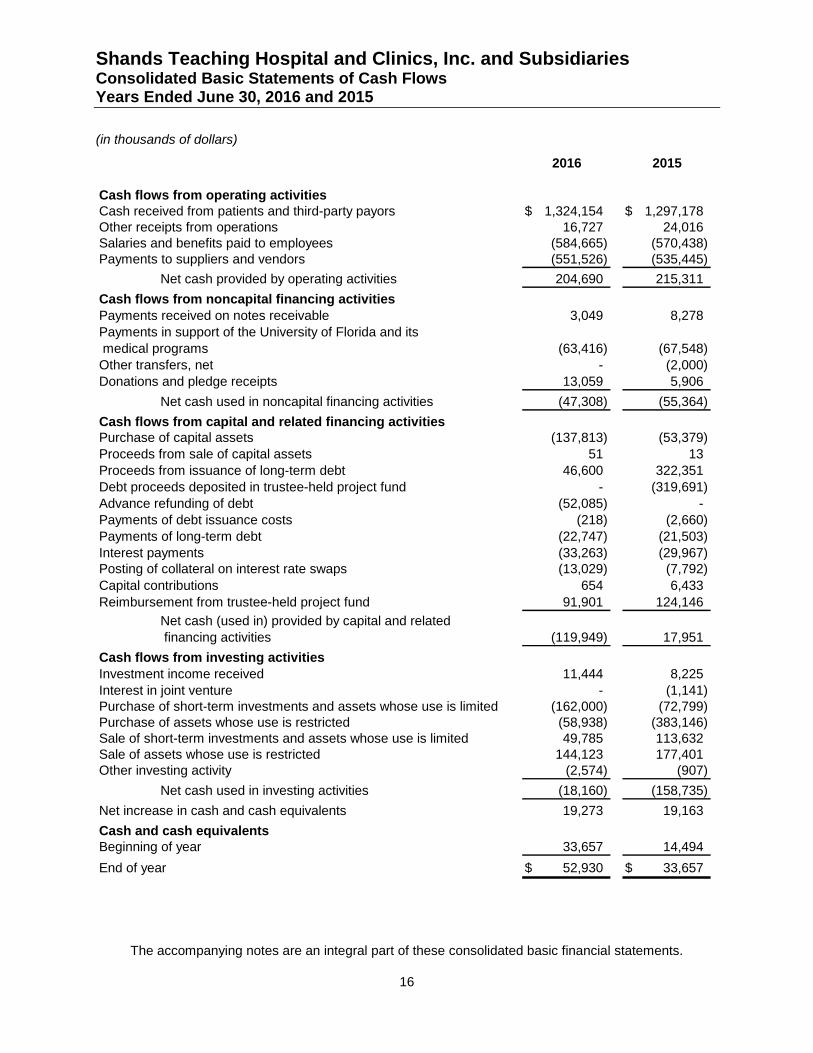
Shands Teaching Hospital and Clinics, Inc. and Subsidiaries Consolidated Basic Statements of Cash Flows Years Ended June 30, 2016 and 2015
(in thousands of dollars)
The accompanying notes are an integral part of these consolidated basic financial statements.
16
2016 2015
Cash flows from operating activities
Cash received from patients and third-party payors 1,324,154$ 1,297,178$
Other receipts from operations 16,727 24,016
Salaries and benefits paid to employees (584,665) (570,438)
Payments to suppliers and vendors (551,526) (535,445)
Net cash provided by operating activities 204,690 215,311
Cash flows from noncapital financing activities
Payments received on notes receivable 3,049 8,278
Payments in support of the University of Florida and its
medical programs (63,416) (67,548)
Other transfers, net - (2,000)
Donations and pledge receipts 13,059 5,906
Net cash used in noncapital financing activities (47,308) (55,364)
Cash flows from capital and related financing activities
Purchase of capital assets (137,813) (53,379)
Proceeds from sale of capital assets 51 13
Proceeds from issuance of long-term debt 46,600 322,351
Debt proceeds deposited in trustee-held project fund - (319,691)
Advance refunding of debt (52,085) -
Payments of debt issuance costs (218) (2,660)
Payments of long-term debt (22,747) (21,503)
Interest payments (33,263) (29,967)
Posting of collateral on interest rate swaps (13,029) (7,792)
Capital contributions 654 6,433
Reimbursement from trustee-held project fund 91,901 124,146
Net cash (used in) provided by capital and related
financing activities (119,949) 17,951
Cash flows from investing activities
Investment income received 11,444 8,225
Interest in joint venture - (1,141)
Purchase of short-term investments and assets whose use is limited (162,000) (72,799)
Purchase of assets whose use is restricted (58,938) (383,146)
Sale of short-term investments and assets whose use is limited 49,785 113,632
Sale of assets whose use is restricted 144,123 177,401
Other investing activity (2,574) (907)
Net cash used in investing activities (18,160) (158,735)
Net increase in cash and cash equivalents 19,273 19,163
Cash and cash equivalents
Beginning of year 33,657 14,494
End of year 52,930$ 33,657$
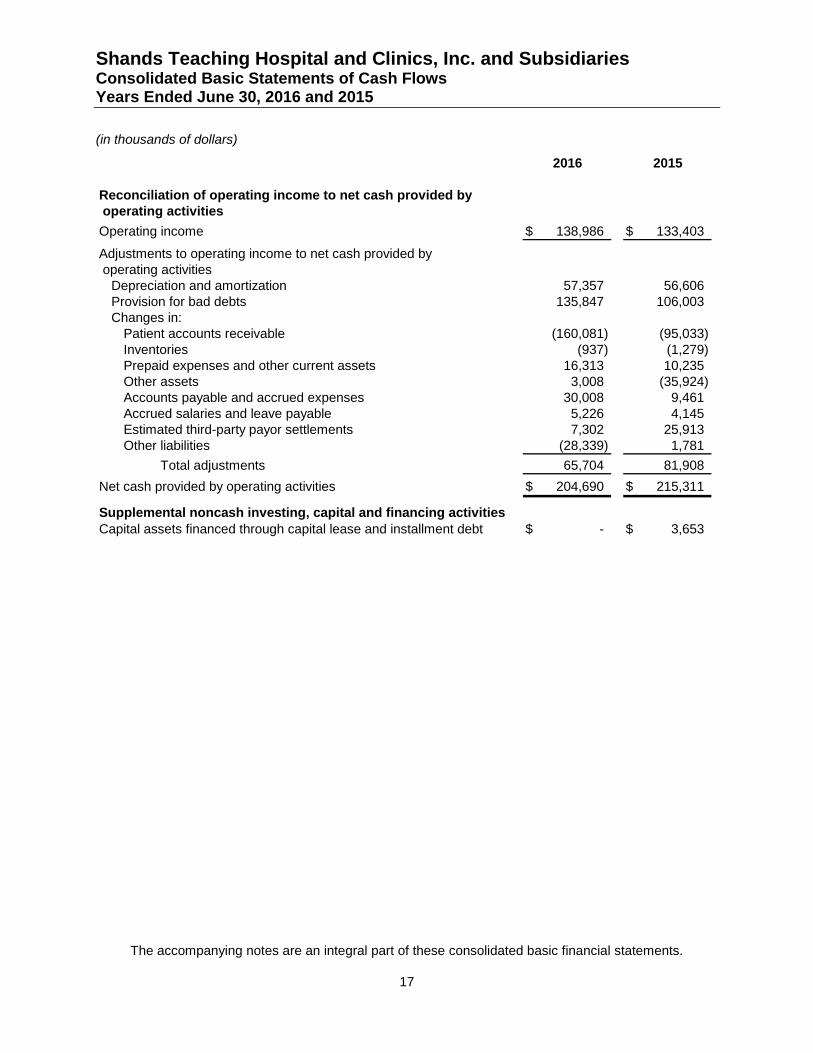
Shands Teaching Hospital and Clinics, Inc. and Subsidiaries Consolidated Basic Statements of Cash Flows Years Ended June 30, 2016 and 2015
(in thousands of dollars)
The accompanying notes are an integral part of these consolidated basic financial statements.
17
2016 2015
Reconciliation of operating income to net cash provided by
operating activities
Operating income 138,986$ 133,403$
Adjustments to operating income to net cash provided by
operating activities
Depreciation and amortization 57,357 56,606
Provision for bad debts 135,847 106,003
Changes in:
Patient accounts receivable (160,081) (95,033)
Inventories (937) (1,279)
Prepaid expenses and other current assets 16,313 10,235
Other assets 3,008 (35,924)
Accounts payable and accrued expenses 30,008 9,461
Accrued salaries and leave payable 5,226 4,145
Estimated third-party payor settlements 7,302 25,913
Other liabilities (28,339) 1,781
Total adjustments 65,704 81,908
Net cash provided by operating activities 204,690$ 215,311$
Supplemental noncash investing, capital and financing activities
Capital assets financed through capital lease and installment debt -$ 3,653$
Shands Teaching Hospital and Clinics, Inc. and Subsidiaries Notes to Consolidated Basic Financial Statements June 30, 2016 and 2015
18
1. Organization
Shands Teaching Hospital and Clinics, Inc. and Subsidiaries (“Shands”) was incorporated on
October 15, 1979 as a Florida not-for-profit corporation. The President of the University of Florida
(“UF”), or his designee, serves as the President of Shands’ Board of Directors and retains
appointment and termination rights over a majority of the members of Shands’ Board of Directors.
The President of UF is deemed a state official as the position is appointed by a Board of Trustees
that govern UF (the “UF Board”), and the members of the UF Board are appointed by the Governor
and the Board of Governors of the State of Florida.
University of Florida Health or “UF Health” encompasses the UF Health Science Center and
Shands. Shands and certain of its affiliated entities operate under d/b/a’s beginning with “UF
Health.”
The accompanying consolidated basic financial statements blend the accounts of Shands and its
subsidiaries. The following identifies the significant affiliates of Shands and their respective
primary operations:
UF Health Shands Hospital is a major tertiary care teaching institution located in Gainesville,
Florida, licensed to operate an 875-bed teaching hospital. UF Health Shands Hospital is a
leading referral center in the State of Florida and provides clinical settings for medical
education programs at UF.
UF Health Shands Psychiatric Hospital is a psychiatric and substance abuse facility located
in Gainesville, Florida, licensed to operate 81 beds, of which 61 are psychiatric and 20 are
substance abuse.
UF Health Shands Rehabilitation Hospital is a 40-bed rehabilitation hospital located on the
same campus as UF Health Shands Psychiatric Hospital.
UF Health Shands HomeCare is a hospital-based home care agency providing home care
services to the citizens of north central Florida.
Shands Recovery, LLC (d/b/a “UF Health Florida Recovery Center”) provides on-site
leased housing in conjunction with intensive outpatient addiction treatment for alcohol and
drug abuse. The entity was created and received separate outpatient licensure from the State
of Florida in December 2014. Prior to incorporation, UF Health Florida Recovery Center was
an outpatient department of UF Health Shands Psychiatric Hospital operating under the main
hospital license.
Property Management leases properties in Gainesville, Florida.
ElderCare of Alachua County, Inc. (“ElderCare”), a Florida not-for-profit corporation,
provides social and health care support to the elderly in Alachua County, Florida, through the
operations of a Senior Recreation Center and programs such as Meals on Wheels and an
Alzheimer’s Day Care Center. Shands is the sole corporate member of ElderCare.
Southeastern HealthCare Foundation, Inc. (“Foundation”), a Florida not-for-profit
corporation, provides charitable aid to UF and to Shands and owns and leases various rental
properties in Florida. Shands is the sole corporate member of the Foundation.
Shands has interests in various joint ventures, fully described in Note 2.
Shands Teaching Hospital and Clinics, Inc. and Subsidiaries Notes to Consolidated Basic Financial Statements June 30, 2016 and 2015
19
2. Summary of Significant Accounting Policies
The following is a summary of the significant accounting policies followed by Shands in the
presentation of these consolidated basic financial statements:
Basis of Presentation
The accompanying consolidated basic financial statements have been prepared in conformity with
accounting principles generally accepted in the United States of America, including all applicable
effective statements of the Governmental Accounting Standards Board (“GASB”), on the accrual
basis of accounting and include the accounts of Shands and its subsidiaries. Significant
intercompany accounts and transactions have been eliminated.
Use of Estimates
The preparation of these consolidated basic financial statements in conformity with accounting
principles generally accepted in the United States of America requires management to make
estimates and assumptions that affect the amounts reported in the consolidated basic financial
statements and accompanying notes. Actual results could differ from those estimates.
Tax Status
Shands and its subsidiaries are exempt from federal income taxes pursuant to Section 501(a) as
organizations described in Section 501(c)(3) of the Internal Revenue Code and from state income
taxes pursuant to Chapter 220 of the Florida Statutes.
Cash and Cash Equivalents
Cash and cash equivalents include investments in highly liquid instruments with original maturities
of three months or less when purchased, except those classified as assets whose use is restricted
in the accompanying consolidated basic statements of net position.
Investments
Investments primarily consist of domestic and global fixed income funds, global equity funds, high
yield funds, hedge funds, Florida Treasury Investment Pool Special Purpose Investment Account
(“SPIA”), and a private equity partnership.
Investments are carried at fair value. Interest, dividends, and gains and losses on investments,
both realized and unrealized, are included in nonoperating revenues when earned.
Assets Whose Use is Limited
Assets whose use is limited is comprised of assets designated for specific purposes by the Board
of Directors (the “Board”). The Board retains control of these assets and may, at its discretion,
subsequently designate their use for other purposes. Amounts required to meet current liabilities
are reported as current assets.
Assets Whose Use is Restricted
Assets whose use is restricted primarily include assets held by trustees under indenture
agreements and collateral held by a swap counterparty.
Inventories
Inventories consist principally of medical, surgical, and pharmaceutical supplies that are stated at
the lower of cost (average cost method) or market.
Shands Teaching Hospital and Clinics, Inc. and Subsidiaries Notes to Consolidated Basic Financial Statements June 30, 2016 and 2015
20
Pledges Receivable
Pledges receivable represent donor commitments to provide future funding, primarily in association
with various capital construction projects at Shands and are generally due over the next four years.
Pledges receivable are recorded net of an estimated reserve for uncollectible pledges. The current
portion of pledges receivable is reported in prepaid expenses and other current assets in the
accompanying consolidated basic statements of net position. The long-term portion of pledges
receivable is reported in other assets in the accompanying consolidated basic statements of net
position. For the years ended June 30, 2016 and 2015, pledge discount rates range from 0.6% to
4.8%.
Capital Assets
Capital assets are recorded at historical cost at date of purchase or at the acquisition value at date
of donation. Equipment under capital leases is stated at the present value of minimum lease
payments at the inception of the lease. Routine maintenance and repairs are expensed when
incurred. Expenditures that materially increase the value, change the capacity or extend the useful
life of an asset are capitalized. Interest costs incurred on borrowed funds during the period of
construction of capital assets are capitalized as a component of the cost of acquiring those assets.
Depreciation is computed using the straight-line method over the estimated useful lives of the
related depreciable assets as recommended by the American Hospital Association. Equipment
under capital leases is amortized using the straight-line method over the shorter period of the lease
term or the estimated useful life of the related assets. Such amortization is included in depreciation
and amortization expense in the accompanying consolidated basic statements of revenues,
expenses and changes in net position. Gains and losses on disposition are recorded in the year of
disposal and are reported as nonoperating revenues (expenses) in the accompanying consolidated
basic statements of revenues, expenses and changes in net position.
Joint Ventures
Shands has a 40% minority interest in Lake Shore HMA, LLC, Starke HMA, LLC, and Live Oak
HMA, LLC which owns or leases three rural community hospitals (Shands Lake Shore located in
Lake City, Florida; Shands Starke located in Starke, Florida; and Shands Live Oak located in Live
Oak, Florida). Community Health Systems, Inc. (“CHS”) is the majority partner and manages the
operations of the three facilities. Shands accounts for the investment under the equity method of
accounting. At June 30, 2016 and 2015, an investment of approximately $6,545,000 and
$14,304,000, respectively, was recorded in other assets in the accompanying consolidated basic
statements of net position. For the years ended June 30, 2016 and 2015, an investment (loss) gain
of approximately ($7,759,000) and $3,737,000, respectively, was recorded in other nonoperating
revenues, net, in the accompanying consolidated basic statements of revenues, expenses and
changes in net position.
Shands has a 5% minority interest in Munroe HMA Holdings, LLC which owns a regional medical
center (Munroe Regional Medical Center) located in Ocala, Florida. CHS manages the operations
of the medical center and is the majority owner. Shands accounts for the investment under the
equity method of accounting. At June 30, 2016 and 2015, an investment of approximately
$10,750,000 and $10,626,000, respectively, was recorded in other assets in the accompanying
consolidated basic statements of net position. For the years ended June 30, 2016 and 2015, an
investment gain of approximately $124,000 and $603,000, respectively, was recorded in other
nonoperating revenues, net in the accompanying consolidated basic statements of revenues,
expenses and changes in net position.
Shands Teaching Hospital and Clinics, Inc. and Subsidiaries Notes to Consolidated Basic Financial Statements June 30, 2016 and 2015
21
Shands has an equal interest in Shands/Solantic Joint Venture, LLC (d/b/a “CareSpot”) which owns
three walk-in urgent care centers located in Gainesville, Florida. Shands acquired its interest in the
second location in February 2015 ($1,141,000) and the third location in July 2015 ($750,000).
CareSpot manages the operations of the three facilities. Shands accounts for the investment
under the equity method of accounting. At June 30, 2016 and 2015, an investment of
approximately $1,772,000 and $1,605,000, respectively, was recorded in other assets in the
accompanying consolidated basic statements of net position. For the years ended June 30, 2016
and 2015, an investment gain of approximately $167,000 and $122,000, respectively, was
recorded in other nonoperating revenues, net in the accompanying consolidated basic statements
of revenues, expenses and changes in net position. In addition, a cash distribution of $750,000
was received for the year ended June 30, 2016.
Shands and the University of Florida Development Corporation (“UFDC”) are members in
Innovation Square, LLC (“Innovation Square”). Situated between the UF campus and downtown
Gainesville, Innovation Square is a planned mixed-use research neighborhood that advances the
national and global profile of UF with Shands and the local biotech industry. Shands’ financial
interest results from capital assets of approximately $10,158,000 transferred to Innovation Square,
net of $2,000,000 of cash received from UFDC representing their financial interest. Shands
accounts for the investment under the cost method of accounting. At June 30, 2016 and 2015, an
investment of approximately $8,158,000 was recorded in other assets in the accompanying
consolidated basic statements of net position. For the years ended June 30, 2016 and 2015, no
investment income or loss was recorded in the accompanying consolidated basic statements of
revenues, expenses and changes in net position.
Accrued Personal Leave
Shands provides accrued time off to eligible employees for vacations, holidays, and short-term
illness dependent on their years of continuous service and their payroll classification. Shands
accrues the estimated expense related to personal leave based on pay rates currently in effect.
Upon termination of employment, employees will have their eligible accrued personal leave paid in
varying amounts. Accrued personal leave was approximately $35,430,000 and $34,179,000 as of
June 30, 2016 and 2015, respectively, and is included in accrued salaries and leave payable in the
accompanying consolidated basic statements of net position.
Bond Issuance Costs
Bond issuance costs are expensed at time of issuance. Issuance costs of approximately $218,000
and $2,660,000 were expensed for the years ended June 30, 2016 and 2015, respectively.
Bond Premiums and Discounts
Bond premiums and discounts are amortized over the period the bonds are outstanding using the
effective interest method.
Long-Term Debt
Long-term debt is comprised of tax exempt bond issues, taxable notes, and installment debt.
Shands Teaching Hospital and Clinics, Inc. and Subsidiaries Notes to Consolidated Basic Financial Statements June 30, 2016 and 2015
22
Deferred Outflows and Inflows of Resources
Deferred outflows of resources represent a consumption of net assets that is applicable to a future
reporting period. Deferred inflows of resources represent an acquisition of net assets that is
applicable to a future reporting period. Deferred outflows of resources have a positive effect on net
position, similar to assets, and deferred inflows of resources have a negative effect on net position,
similar to liabilities. Notwithstanding those similarities, deferred outflows of resources are not
assets and deferred inflows of resources are not liabilities and accordingly are not included in those
sections of the accompanying consolidated basic statements of net position, but rather, separately
reported.
Derivative Financial Instruments
Shands’ derivative financial instruments consist of interest rate swaps, which are utilized by
Shands to manage net exposure to interest rate changes associated with its variable rate debt and
to lower its overall borrowing costs. Shands entered into the floating to fixed interest rate swap
agreements to reduce the market risk associated with the changes in interest rates related to
certain of Shands’ variable rate revenue bonds. These derivative instruments are evaluated to
determine if the derivative instrument is effective in reducing the identified financial risk. If the
derivative instrument is determined to be an effective hedge, its fair value is an asset or liability with
a corresponding deferred outflow or inflow in the accompanying consolidated basic statements of
net position. Deferred outflows or inflows constitute changes in fair value of effectively hedged
derivative instruments. If the derivative instrument is determined to be an ineffective hedge or
when there is no hedgeable item, the derivative instrument is considered to be an investment
derivative; its fair value is recorded in other assets or other liabilities within the consolidated basic
statements of net position, and the change in fair value is recognized within net investment income
in the accompanying consolidated basic statements of revenues, expenses and changes in net
position.
Defined Benefit Pension Plan
For purposes of measuring the net pension liability or asset, deferred outflows of resources and
deferred inflows of resources related to the defined benefit plan, and defined benefit pension
expense, information about the fiduciary net position of the Shands HealthCare Pension Plan (the
“Plan”) and additions to /deductions from the Plan’s fiduciary net position have been determined on
the same basis as they are reported to the Plan. For this purpose, benefit payments are
recognized when due and payable in accordance with the benefit terms. Investments are reported
at fair value.
Net Position
Net position is categorized as “net investment in capital assets,” “restricted-nonexpendable,”
“restricted-expendable,” and “unrestricted.” Net investment in capital assets is intended to reflect
the portion of net position that is associated with capital assets, less outstanding balances due on
borrowings used to finance the purchase or construction of those assets. Unspent debt proceeds
are excluded from the calculation of net investment in capital assets and are included in
unrestricted net position, unless the unspent amounts are externally restricted. Restricted net
position has restrictions placed on the use of assets through external constraints imposed by
contributors. Restricted–nonexpendable net position consists of assets that have been restricted
by donors to be maintained by Shands in perpetuity. Restricted–expendable net position is assets
whose use by Shands has been limited by donors to a specific time period or purpose.
Unrestricted net position is net assets that do not meet the definition of net investment in capital
assets and have no third-party restrictions on use.
Shands Teaching Hospital and Clinics, Inc. and Subsidiaries Notes to Consolidated Basic Financial Statements June 30, 2016 and 2015
23
Operating Revenues and Expenses
Shands’ consolidated basic statements of revenues, expenses and changes in net position
distinguish between operating and nonoperating revenues and expenses. Operating revenues
result from exchange transactions associated with providing health care services, Shands’ principal
activity. Operating expenses are all expenses incurred to provide health care services. State
appropriations, interest expense, net investment income, and gain (loss) on disposal of capital
assets are reported as nonoperating revenues (expenses). Donations received for the purpose of
acquiring or constructing capital assets are recorded below nonoperating revenues as capital
contributions.
Net Patient Service Revenue and Patient Accounts Receivable
Shands has agreements with Medicare, Medicaid, and other third-party payors that provide for
payments to Shands at amounts different from its established rates. Payment arrangements
include prospectively determined rates per discharge, reimbursed costs, discounted charges, and
per diem payments. Net patient service revenue and patient accounts receivable are reported at
estimated net realizable amounts from patients, third-party payors, and others for services
rendered and include estimated retroactive revenue adjustments due to future audits, reviews, and
investigations. Retroactive adjustments are considered in the recognition of revenue on an
estimated basis in the period the related services are rendered, and such amounts are adjusted in
future periods as adjustments become known or as years are no longer subject to such audits,
reviews, and investigations. For the years ended June 30, 2016 and 2015, net patient service
revenue (decreased) increased by approximately ($8,385,000) and $1,500,000, respectively, due
to such adjustments.
Laws and regulations governing the Medicare and Medicaid programs are complex and subject to
interpretation. As a result, there is at least a reasonable possibility that recorded estimates will
change by a material amount in the near term.
Medicare
Shands participates in the federal Medicare program. Approximately 33% of Shands’ net patient
service revenue for the years ended June 30, 2016 and 2015 was derived from services to
Medicare beneficiaries. Inpatient acute care services rendered to Medicare beneficiaries are
reimbursed at prospectively determined rates per discharge. These rates vary according to a
patient classification system that is based on clinical, diagnostic, and other factors.
Inpatient non-acute services, outpatient services, and defined capital costs related to Medicare
beneficiaries are reimbursed based upon a prospective reimbursement methodology. Shands is
paid for reimbursable services at a tentative rate with final settlement determined after submission
of annual cost reports by Shands and audits by the Medicare fiscal intermediary. Shands’
classification of patients under the Medicare program and the appropriateness of their admission
are subject to an independent review. As of June 30, 2016, the Medicare cost reports were final
settled by Shands’ Medicare fiscal intermediary through June 30, 2006.
It is management’s opinion that settlements of outstanding Medicare cost reports, when received,
will not vary materially from the estimated amounts, which are recorded as current liabilities in the
accompanying consolidated basic statements of net position.
Shands Teaching Hospital and Clinics, Inc. and Subsidiaries Notes to Consolidated Basic Financial Statements June 30, 2016 and 2015
24
Medicaid
Approximately 19% of Shands’ net patient service revenue for the years ended June 30, 2016 and
2015 was derived under the Medicaid program. Inpatient services rendered to Medicaid program
beneficiaries are reimbursed at prospectively determined rates per discharge and outpatient
services are reimbursed based upon a cost reimbursement methodology subject to certain ceilings.
Shands is reimbursed for outpatient services at a tentative rate with final settlement determined
after submission of annual cost reports by Shands, and audits by the Medicaid fiscal intermediary.
As of June 30, 2016, the Medicaid cost reports have been audited by the Medicaid fiscal
intermediary through June 30, 2009. In addition to the prospectively determined rates per
discharge and tentative payments received by Shands for the provision of health care services to
Medicaid beneficiaries, the State of Florida provides supplemental Medicaid and disproportionate
share payments to reflect the additional costs associated with treating the Medicaid population in
Florida. These amounts are reflected in net patient service revenue in the accompanying
consolidated basic statements of revenues, expenses and changes in net position.
The Agency for Health Care Administration (“AHCA”) is the administrator of the Statewide Medicaid
Managed Care (“SMMC”) Managed Medical Assistance (“MMA”) Program in the State of Florida.
The MMA program is comprised of several types of managed care plans including Health
Maintenance Organizations, Provider Service Networks, and Children’s Medical Services Network.
The majority of Medicaid recipients are required to enroll in the MMA program.
Shands’ Medicaid outpatient interim rates are based on the most recent “as filed” Medicaid cost
report. The outpatient rates used for 2016 and 2015 were based on the unaudited cost reports for
2014 and 2013, respectively.
It is management’s opinion that settlements of outstanding Medicaid cost reports, when received,
will not vary materially from the estimated amounts, which are recorded as current liabilities in the
accompanying consolidated basic statements of net position.
Other Third-Party Payors
Shands has also entered into reimbursement agreements with certain commercial insurance
carriers, health maintenance organizations, and preferred provider organizations. The basis for
reimbursement under these agreements includes prospectively determined rates per discharge,
discounts from established charges and prospectively determined per diem rates.
Provision for Bad Debts and Allowance for Uncollectible Accounts
The provision for bad debts is based on management’s assessment of historical and expected net
collections, considering business and economic conditions, trends in federal and state
governmental health care coverage, and other collection indicators. Throughout the year,
management assesses the adequacy of the allowance for uncollectible accounts based upon these
trends. The results of this review are then used to make any modification to the provision for bad
debts to establish an appropriate allowance for uncollectible accounts. Patient accounts receivable
are written off after collection efforts have been followed under Shands’ policies.
Shands Teaching Hospital and Clinics, Inc. and Subsidiaries Notes to Consolidated Basic Financial Statements June 30, 2016 and 2015
25
Electronic Medical Records Incentive Program
Shands received approximately $593,000 and $1,574,000 in incentives under the Medicare
Electronic Medical Record incentive program as authorized by the Health Information Technology
for Clinical Health Act (“HITEC”) for the years ended June 30, 2016 and 2015, respectively.
Shands adopted the gain contingency revenue recognition model for HITEC, and recognizes
revenue when it demonstrates meaningful use of certified electronic health record technology for
the applicable period. Payments received were earned and recognized as other operating revenue
in the accompanying consolidated basic statements of revenues, expenses and changes in net
position.
Accounting Pronouncements
In June 2015, the GASB issued GASB Statement No. 75, Accounting and Financial Reporting for
Postemployment Benefits Other Than Pensions (“GASB No. 75”). GASB No. 75 addresses
accounting and financial reporting for other postemployment plans that are provided to the
employees of state and local governmental employers. This Statement establishes standards for
recognizing and measuring liabilities, deferred outflows of resources, deferred inflows of resources,
and expense. GASB No. 75 is effective for fiscal years beginning after June 15, 2017. Shands is
currently evaluating the impact GASB No. 75 will have on its consolidated basic financial
statements.
In March 2016, the GASB issued GASB Statement No. 81, Irrevocable Split-Interest Agreements
(“GASB No. 81”). GASB No. 81 improves accounting and financial reporting by establishing
recognition and measurement requirements for irrevocable split-interest agreements which are a
specific type of giving arrangement used by donors to provide resources to two or more
beneficiaries, including governments. GASB No. 81 is effective for fiscal years beginning after
December 15, 2016. Shands is currently evaluating the impact GASB No. 81 will have on its
consolidated basic financial statements.
In March 2016, the GASB issued GASB Statement No. 82, Pension Issues – an Amendment of
GASB Statements No. 67, No. 68, and No. 73 (“GASB No. 82”). This Statement addresses specific
issues including presentation of payroll related measures in required supplementary information,
selection of assumptions, and classification of employer paid member contributions. GASB No. 82
is effective for fiscal years beginning after June 15, 2016. Shands is currently evaluating the
impact GASB No. 82 will have on its consolidated basic financial statements.
Reclassifications
Certain amounts in the 2015 consolidated basic financial statements have been reclassified to
conform with the 2016 presentation. A reclassification of approximately $419,022,000 from assets
whose use is restricted to assets whose use is limited, less current portion is reflected in the
accompanying consolidated basic statements of net position at June 30, 2015 and a
reclassification of approximately $1,093,000 from operating expenses to nonoperating revenues
(expenses) is reflected in the accompanying consolidated basic statements of revenues, expenses
and changes in net position for the year ended June 30, 2015. The reclassifications did not have an
impact on the previously reported net position or increase in net position. Additionally, these
reclassifications impacted certain amounts in the accompanying consolidated basic statements of
cash flows for the year ended June 30, 2015. However, the reclassifications did not have an
impact on the net increase in cash and cash equivalents.
Shands Teaching Hospital and Clinics, Inc. and Subsidiaries Notes to Consolidated Basic Financial Statements June 30, 2016 and 2015
26
3. Unsponsored Community Benefit
Community benefit is a planned, managed, organized, and measured approach to a health care
organization’s participation in meeting identified community health needs. It implies collaboration
with a “community” to “benefit” its residents, particularly the poor and other underserved groups, by
improving health status and quality of life. Community benefit projects and services are identified
by health care organizations in response to findings of a community health assessment, strategic
and/or clinical priorities, and partnership areas of attention.
Community benefit categories include financial assistance, community health services, health
professions education, research, and donations. Shands has a long history of providing community
benefits and has quantified these benefits using national guidelines developed by the Catholic
Health Association in collaboration with the Voluntary Hospital Association.
Shands has policies for providing financial assistance for patients requiring care but who have
limited or no means to pay for that care. These policies provide free or discounted health and
health-related services to persons who qualify under certain income and asset criteria. Because
Shands does not pursue collection of amounts determined to qualify for financial assistance, they
are not reported as net patient service revenue. Shands maintains records to identify and monitor
the level of financial assistance it provides. Charges foregone for services provided under Shands’
financial assistance policy as a percentage of total charges for the years ended June 30, 2016 and
2015 were approximately 4.1% and 5.3%, respectively.
In addition to financial assistance, Shands provides benefits for the broader community. The cost
of providing these community benefits can exceed the revenue sources available. Examples of the
benefits provided by Shands and general definitions regarding those benefits are described below:
Community health services include activities carried out to improve community health. They
extend beyond patient care activities and are usually subsidized by the health care
organization. Examples include community health education, counseling and support
services, and health care screenings.
Health professions education includes education provided in clinical settings such as
internships and programs for physicians, nurses, and allied health professionals. It also
includes scholarships for health professional education related to providing community health
improvement services and specialty in-service programs to professionals in the community.
Research includes studies on health care delivery, unreimbursed studies on therapeutic
protocols, evaluation of innovative treatments, and research papers prepared for professional
journals.
Donations include funds and in-kind services benefiting the community-at-large.
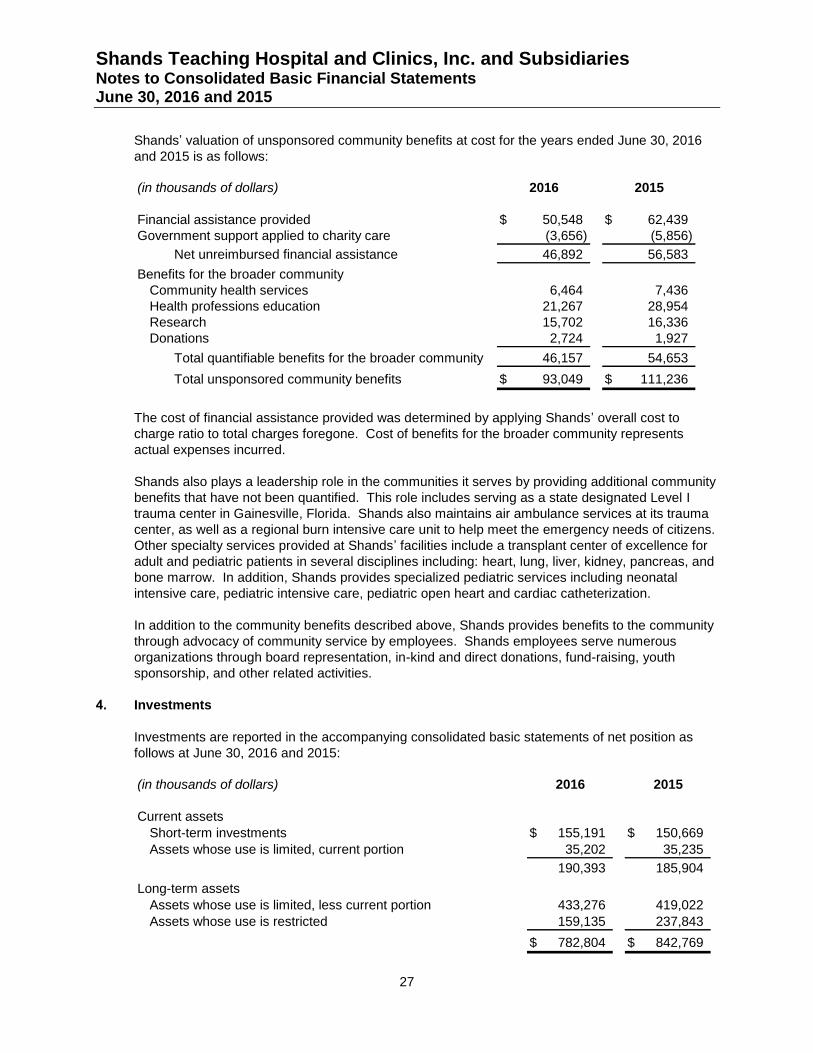
Shands Teaching Hospital and Clinics, Inc. and Subsidiaries Notes to Consolidated Basic Financial Statements June 30, 2016 and 2015
27
Shands’ valuation of unsponsored community benefits at cost for the years ended June 30, 2016
and 2015 is as follows:
(in thousands of dollars) 2016 2015
Financial assistance provided 50,548$ 62,439$
Government support applied to charity care (3,656) (5,856)
Net unreimbursed financial assistance 46,892 56,583
Benefits for the broader community
Community health services 6,464 7,436
Health professions education 21,267 28,954
Research 15,702 16,336
Donations 2,724 1,927
Total quantifiable benefits for the broader community 46,157 54,653
Total unsponsored community benefits 93,049$ 111,236$
The cost of financial assistance provided was determined by applying Shands’ overall cost to
charge ratio to total charges foregone. Cost of benefits for the broader community represents
actual expenses incurred.
Shands also plays a leadership role in the communities it serves by providing additional community
benefits that have not been quantified. This role includes serving as a state designated Level I
trauma center in Gainesville, Florida. Shands also maintains air ambulance services at its trauma
center, as well as a regional burn intensive care unit to help meet the emergency needs of citizens.
Other specialty services provided at Shands’ facilities include a transplant center of excellence for
adult and pediatric patients in several disciplines including: heart, lung, liver, kidney, pancreas, and
bone marrow. In addition, Shands provides specialized pediatric services including neonatal
intensive care, pediatric intensive care, pediatric open heart and cardiac catheterization.
In addition to the community benefits described above, Shands provides benefits to the community
through advocacy of community service by employees. Shands employees serve numerous
organizations through board representation, in-kind and direct donations, fund-raising, youth
sponsorship, and other related activities.
4. Investments
Investments are reported in the accompanying consolidated basic statements of net position as
follows at June 30, 2016 and 2015:
(in thousands of dollars) 2016 2015
Current assets
Short-term investments 155,191$ 150,669$
Assets whose use is limited, current portion 35,202 35,235
190,393 185,904
Long-term assets
Assets whose use is limited, less current portion 433,276 419,022
Assets whose use is restricted 159,135 237,843
782,804$ 842,769$
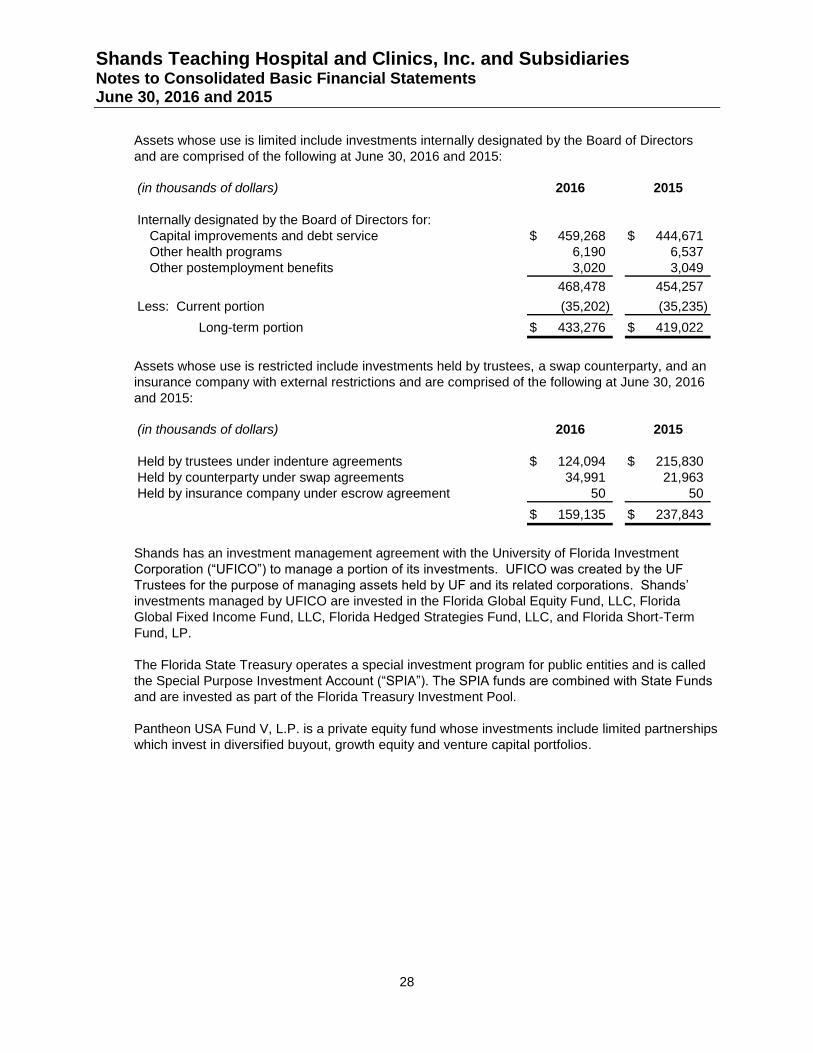
Shands Teaching Hospital and Clinics, Inc. and Subsidiaries Notes to Consolidated Basic Financial Statements June 30, 2016 and 2015
28
Assets whose use is limited include investments internally designated by the Board of Directors
and are comprised of the following at June 30, 2016 and 2015:
(in thousands of dollars) 2016 2015
Internally designated by the Board of Directors for:
Capital improvements and debt service 459,268$ 444,671$
Other health programs 6,190 6,537
Other postemployment benefits 3,020 3,049
468,478 454,257
Less: Current portion (35,202) (35,235)
Long-term portion 433,276$ 419,022$
Assets whose use is restricted include investments held by trustees, a swap counterparty, and an
insurance company with external restrictions and are comprised of the following at June 30, 2016
and 2015:
(in thousands of dollars) 2016 2015
Held by trustees under indenture agreements 124,094$ 215,830$
Held by counterparty under swap agreements 34,991 21,963
Held by insurance company under escrow agreement 50 50
159,135$ 237,843$
Shands has an investment management agreement with the University of Florida Investment
Corporation (“UFICO”) to manage a portion of its investments. UFICO was created by the UF
Trustees for the purpose of managing assets held by UF and its related corporations. Shands’
investments managed by UFICO are invested in the Florida Global Equity Fund, LLC, Florida
Global Fixed Income Fund, LLC, Florida Hedged Strategies Fund, LLC, and Florida Short-Term
Fund, LP.
The Florida State Treasury operates a special investment program for public entities and is called
the Special Purpose Investment Account (“SPIA”). The SPIA funds are combined with State Funds
and are invested as part of the Florida Treasury Investment Pool.
Pantheon USA Fund V, L.P. is a private equity fund whose investments include limited partnerships
which invest in diversified buyout, growth equity and venture capital portfolios.
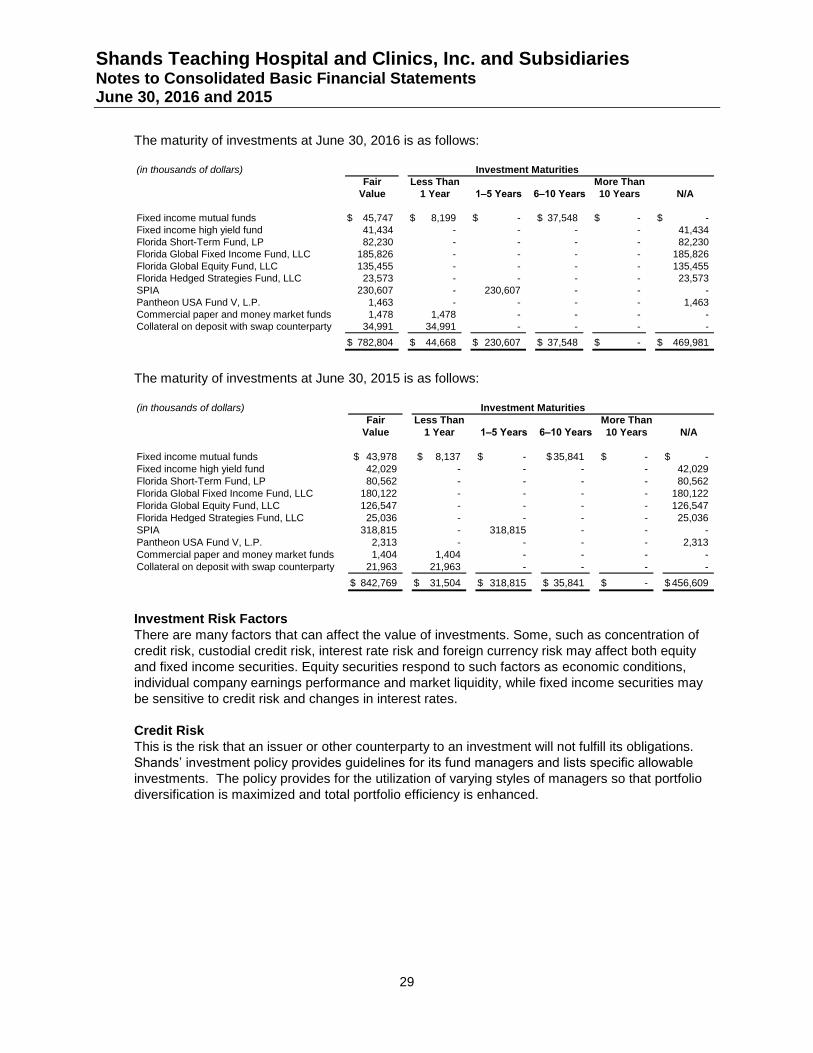
Shands Teaching Hospital and Clinics, Inc. and Subsidiaries Notes to Consolidated Basic Financial Statements June 30, 2016 and 2015
29
The maturity of investments at June 30, 2016 is as follows:
(in thousands of dollars)
Fair Less Than More Than
Value 1 Year 1–5 Years 6–10 Years 10 Years N/A
Fixed income mutual funds 45,747$ 8,199$ -$ 37,548$ -$ -$
Fixed income high yield fund 41,434 - - - - 41,434
Florida Short-Term Fund, LP 82,230 - - - - 82,230
Florida Global Fixed Income Fund, LLC 185,826 - - - - 185,826
Florida Global Equity Fund, LLC 135,455 - - - - 135,455
Florida Hedged Strategies Fund, LLC 23,573 - - - - 23,573
SPIA 230,607 - 230,607 - - -
Pantheon USA Fund V, L.P. 1,463 - - - - 1,463
Commercial paper and money market funds 1,478 1,478 - - - -
Collateral on deposit with swap counterparty 34,991 34,991 - - - -
782,804$ 44,668$ 230,607$ 37,548$ -$ 469,981$
Investment Maturities
The maturity of investments at June 30, 2015 is as follows:
(in thousands of dollars)
Fair Less Than More Than
Value 1 Year 1–5 Years 6–10 Years 10 Years N/A
Fixed income mutual funds 43,978$ 8,137$ -$ 35,841$ -$ -$
Fixed income high yield fund 42,029 - - - - 42,029
Florida Short-Term Fund, LP 80,562 - - - - 80,562
Florida Global Fixed Income Fund, LLC 180,122 - - - - 180,122
Florida Global Equity Fund, LLC 126,547 - - - - 126,547
Florida Hedged Strategies Fund, LLC 25,036 - - - - 25,036
SPIA 318,815 - 318,815 - - -
Pantheon USA Fund V, L.P. 2,313 - - - - 2,313
Commercial paper and money market funds 1,404 1,404 - - - -
Collateral on deposit with swap counterparty 21,963 21,963 - - - -
842,769$ 31,504$ 318,815$ 35,841$ -$ 456,609$
Investment Maturities
Investment Risk Factors
There are many factors that can affect the value of investments. Some, such as concentration of
credit risk, custodial credit risk, interest rate risk and foreign currency risk may affect both equity
and fixed income securities. Equity securities respond to such factors as economic conditions,
individual company earnings performance and market liquidity, while fixed income securities may
be sensitive to credit risk and changes in interest rates.
Credit Risk
This is the risk that an issuer or other counterparty to an investment will not fulfill its obligations.
Shands’ investment policy provides guidelines for its fund managers and lists specific allowable
investments. The policy provides for the utilization of varying styles of managers so that portfolio
diversification is maximized and total portfolio efficiency is enhanced.
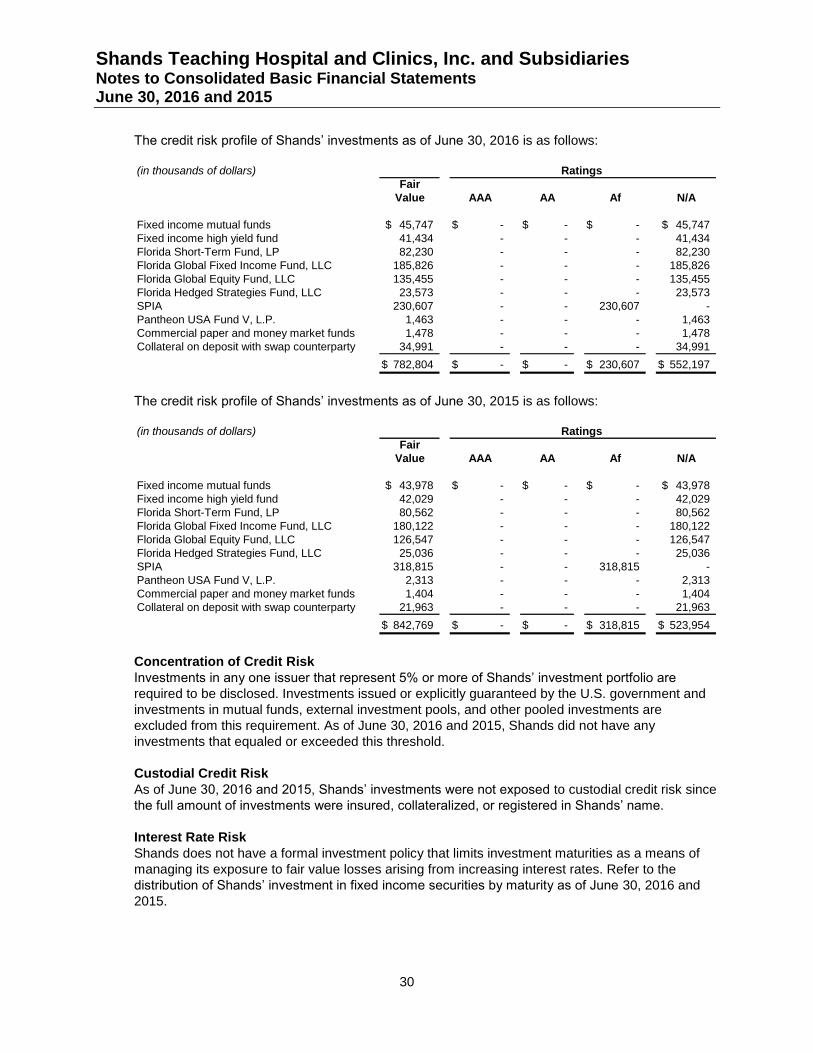
Shands Teaching Hospital and Clinics, Inc. and Subsidiaries Notes to Consolidated Basic Financial Statements June 30, 2016 and 2015
30
The credit risk profile of Shands’ investments as of June 30, 2016 is as follows:
(in thousands of dollars)
Fair
Value AAA AA Af N/A
Fixed income mutual funds 45,747$ -$ -$ -$ 45,747$
Fixed income high yield fund 41,434 - - - 41,434
Florida Short-Term Fund, LP 82,230 - - - 82,230
Florida Global Fixed Income Fund, LLC 185,826 - - - 185,826
Florida Global Equity Fund, LLC 135,455 - - - 135,455
Florida Hedged Strategies Fund, LLC 23,573 - - - 23,573
SPIA 230,607 - - 230,607 -
Pantheon USA Fund V, L.P. 1,463 - - - 1,463
Commercial paper and money market funds 1,478 - - - 1,478
Collateral on deposit with swap counterparty 34,991 - - - 34,991
782,804$ -$ -$ 230,607$ 552,197$
Ratings
The credit risk profile of Shands’ investments as of June 30, 2015 is as follows:
(in thousands of dollars)
Fair
Value AAA AA Af N/A
Fixed income mutual funds 43,978$ -$ -$ -$ 43,978$
Fixed income high yield fund 42,029 - - - 42,029
Florida Short-Term Fund, LP 80,562 - - - 80,562
Florida Global Fixed Income Fund, LLC 180,122 - - - 180,122
Florida Global Equity Fund, LLC 126,547 - - - 126,547
Florida Hedged Strategies Fund, LLC 25,036 - - - 25,036
SPIA 318,815 - - 318,815 -
Pantheon USA Fund V, L.P. 2,313 - - - 2,313
Commercial paper and money market funds 1,404 - - - 1,404
Collateral on deposit with swap counterparty 21,963 - - - 21,963
842,769$ -$ -$ 318,815$ 523,954$
Ratings
Concentration of Credit Risk
Investments in any one issuer that represent 5% or more of Shands’ investment portfolio are
required to be disclosed. Investments issued or explicitly guaranteed by the U.S. government and
investments in mutual funds, external investment pools, and other pooled investments are
excluded from this requirement. As of June 30, 2016 and 2015, Shands did not have any
investments that equaled or exceeded this threshold.
Custodial Credit Risk
As of June 30, 2016 and 2015, Shands’ investments were not exposed to custodial credit risk since
the full amount of investments were insured, collateralized, or registered in Shands’ name.
Interest Rate Risk
Shands does not have a formal investment policy that limits investment maturities as a means of
managing its exposure to fair value losses arising from increasing interest rates. Refer to the
distribution of Shands’ investment in fixed income securities by maturity as of June 30, 2016 and
2015.
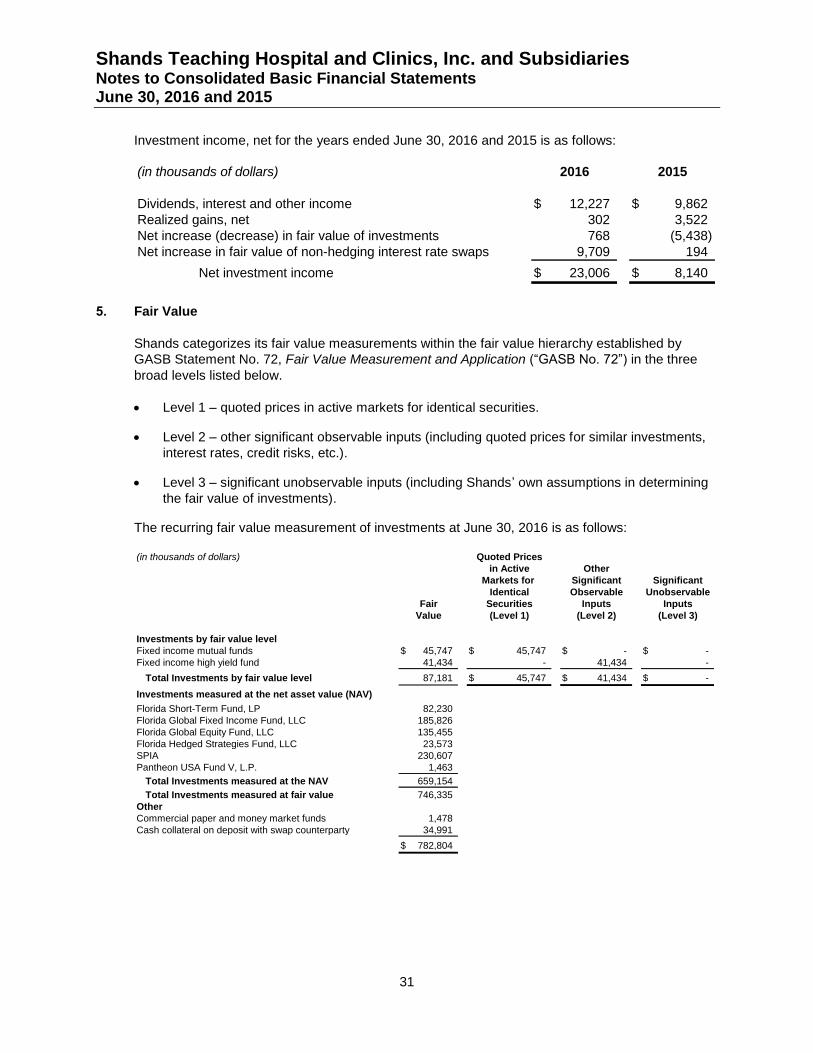
Shands Teaching Hospital and Clinics, Inc. and Subsidiaries Notes to Consolidated Basic Financial Statements June 30, 2016 and 2015
31
Investment income, net for the years ended June 30, 2016 and 2015 is as follows:
(in thousands of dollars) 2016 2015
Dividends, interest and other income 12,227$ 9,862$
Realized gains, net 302 3,522
Net increase (decrease) in fair value of investments 768 (5,438)
Net increase in fair value of non-hedging interest rate swaps 9,709 194
Net investment income 23,006$ 8,140$
5. Fair Value
Shands categorizes its fair value measurements within the fair value hierarchy established by
GASB Statement No. 72, Fair Value Measurement and Application (“GASB No. 72”) in the three
broad levels listed below.
Level 1 – quoted prices in active markets for identical securities.
Level 2 – other significant observable inputs (including quoted prices for similar investments,
interest rates, credit risks, etc.).
Level 3 – significant unobservable inputs (including Shands’ own assumptions in determining
the fair value of investments).
The recurring fair value measurement of investments at June 30, 2016 is as follows:
(in thousands of dollars) Quoted Prices
in Active Other
Markets for Significant Significant
Identical Observable Unobservable
Fair Securities Inputs Inputs
Value (Level 1) (Level 2) (Level 3)
Investments by fair value level
Fixed income mutual funds 45,747$ 45,747$ -$ -$
Fixed income high yield fund 41,434 - 41,434 -
Total Investments by fair value level 87,181 45,747$ 41,434$ -$
Investments measured at the net asset value (NAV)
Florida Short-Term Fund, LP 82,230
Florida Global Fixed Income Fund, LLC 185,826
Florida Global Equity Fund, LLC 135,455
Florida Hedged Strategies Fund, LLC 23,573
SPIA 230,607
Pantheon USA Fund V, L.P. 1,463
Total Investments measured at the NAV 659,154
Total Investments measured at fair value 746,335
Other
Commercial paper and money market funds 1,478
Cash collateral on deposit with swap counterparty 34,991
782,804$
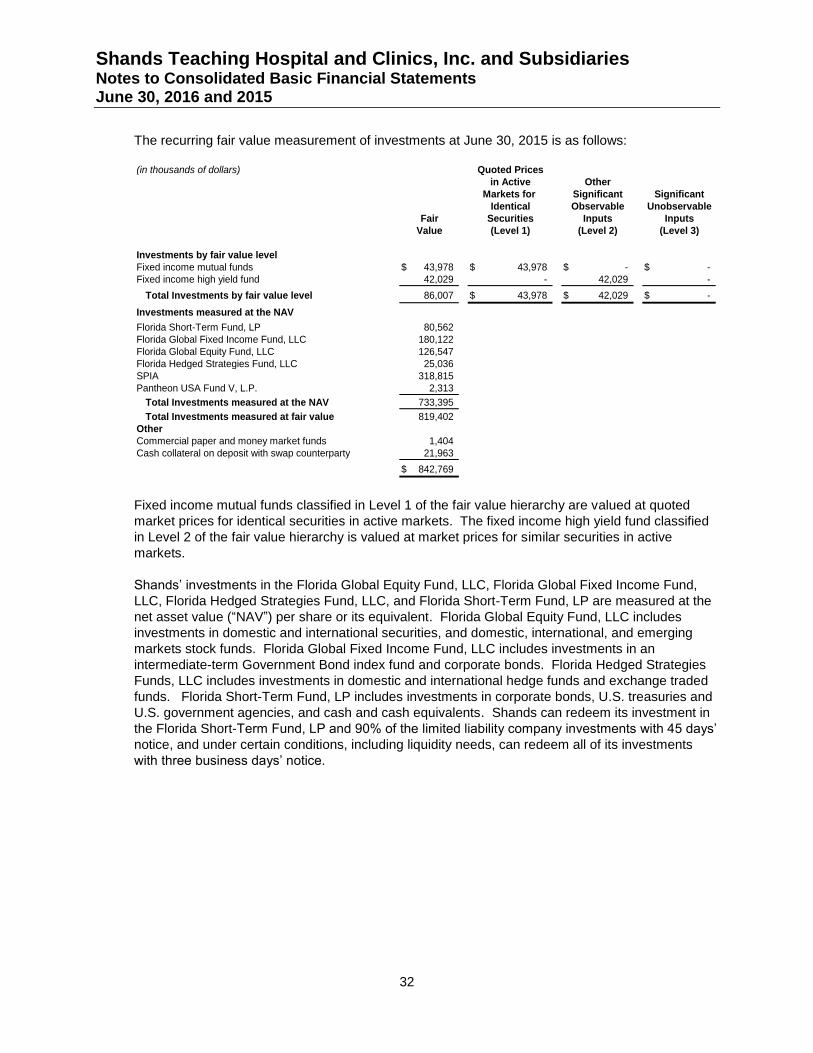
Shands Teaching Hospital and Clinics, Inc. and Subsidiaries Notes to Consolidated Basic Financial Statements June 30, 2016 and 2015
32
The recurring fair value measurement of investments at June 30, 2015 is as follows:
(in thousands of dollars) Quoted Prices
in Active Other
Markets for Significant Significant
Identical Observable Unobservable
Fair Securities Inputs Inputs
Value (Level 1) (Level 2) (Level 3)
Investments by fair value level
Fixed income mutual funds 43,978$ 43,978$ -$ -$
Fixed income high yield fund 42,029 - 42,029 -
Total Investments by fair value level 86,007 43,978$ 42,029$ -$
Investments measured at the NAV
Florida Short-Term Fund, LP 80,562
Florida Global Fixed Income Fund, LLC 180,122
Florida Global Equity Fund, LLC 126,547
Florida Hedged Strategies Fund, LLC 25,036
SPIA 318,815
Pantheon USA Fund V, L.P. 2,313
Total Investments measured at the NAV 733,395
Total Investments measured at fair value 819,402
Other
Commercial paper and money market funds 1,404
Cash collateral on deposit with swap counterparty 21,963
842,769$
Fixed income mutual funds classified in Level 1 of the fair value hierarchy are valued at quoted
market prices for identical securities in active markets. The fixed income high yield fund classified
in Level 2 of the fair value hierarchy is valued at market prices for similar securities in active
markets.
Shands’ investments in the Florida Global Equity Fund, LLC, Florida Global Fixed Income Fund,
LLC, Florida Hedged Strategies Fund, LLC, and Florida Short-Term Fund, LP are measured at the
net asset value (“NAV”) per share or its equivalent. Florida Global Equity Fund, LLC includes
investments in domestic and international securities, and domestic, international, and emerging
markets stock funds. Florida Global Fixed Income Fund, LLC includes investments in an
intermediate-term Government Bond index fund and corporate bonds. Florida Hedged Strategies
Funds, LLC includes investments in domestic and international hedge funds and exchange traded
funds. Florida Short-Term Fund, LP includes investments in corporate bonds, U.S. treasuries and
U.S. government agencies, and cash and cash equivalents. Shands can redeem its investment in
the Florida Short-Term Fund, LP and 90% of the limited liability company investments with 45 days’
notice, and under certain conditions, including liquidity needs, can redeem all of its investments
with three business days’ notice.
Shands Teaching Hospital and Clinics, Inc. and Subsidiaries Notes to Consolidated Basic Financial Statements June 30, 2016 and 2015
33
Shands’ investment in SPIA is measured at the NAV per share or its equivalent. SPIA invests in a
combination of short-term liquid instruments and intermediate fixed income securities. A maximum
of 40% can be redeemed with 5 day notice including $20,000,000 with same day notice. The
remaining 60% can be redeemed with 6 month notice. The 6 month notice can be waived by SPIA
administration upon request.
Shands’ investment in Pantheon USA Fund V, L.P. is measured at the NAV per share or its
equivalent. Redemptions are allowable only to the extent of distributions received from the fund’s
underlying fund investments. It is expected that the underlying assets of the fund will be liquidated
over the next 1 to 3 years. The remaining unfunded commitment as of June 30, 2016 is
approximately $330,000.
Shands’ interest rate swaps are classified in Level 2 of the fair value hierarchy. The fair values of
the fixed rate payer and fixed rate receiver interest rate swaps are estimated using the zero-coupon
discounting method. This method calculates the future payments required by the swap, assuming
that the current forward rates implied by the yield curve are the market’s best estimate of future
spot interest rates. These payments are then discounted using the spot rates implied by the
current yield curve for a hypothetical zero-coupon rate bond due on the date of each future net
settlement payment on the swaps. The fair values of the 2007A and 2007B total return swaps are
estimated by multiplying each swap’s notional amount by the difference between the base price
and the current fair value of the underlying bonds. As the Series 2007A Bonds and Series 2007B
Bonds are not actively trading, to replicate the fair value of these bonds, the prices were implied by
applying a credit spread adjustment based on bonds with similar terms and similar issuers that are
trading in active markets. Fair value of the interest rate swaps are included in Note 8.
Shands long-term debt is classified in Level 2 of the fair value hierarchy. The fair value of fixed rate
debt is estimated based on dealer quotes for hospital taxable and tax-exempt debt with similar
terms and maturities and using discounted cash flow analyses based on current interest rates for
similar types of borrowing arrangements. The fair value of variable rate debt approximates its
carrying value. The carrying value of Shands’ long-term debt was approximately $855,686,000 and
$876,626,000 at June 30, 2016 and 2015, respectively. The fair value was approximately
$879,053,000 and $857,963,000 at June 30, 2016 and 2015, respectively.
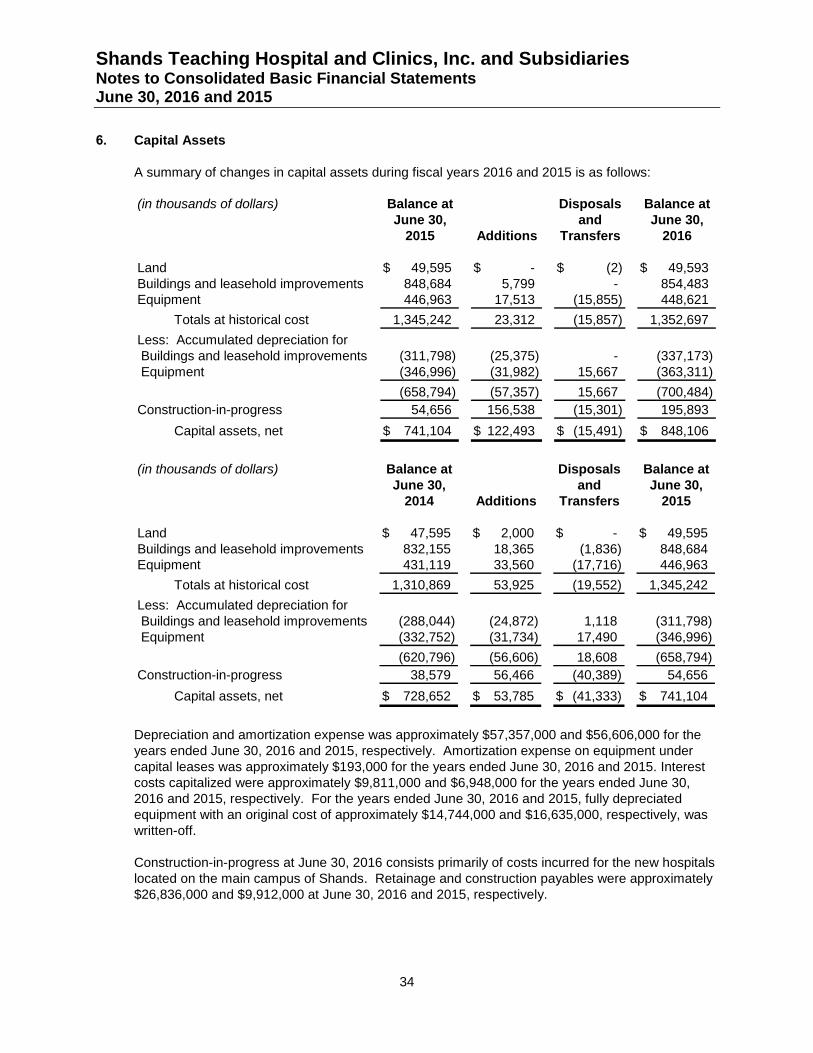
Shands Teaching Hospital and Clinics, Inc. and Subsidiaries Notes to Consolidated Basic Financial Statements June 30, 2016 and 2015
34
6. Capital Assets
A summary of changes in capital assets during fiscal years 2016 and 2015 is as follows:
(in thousands of dollars) Balance at Disposals Balance at
June 30, and June 30,
2015 Additions Transfers 2016
Land 49,595$ -$ (2)$ 49,593$
Buildings and leasehold improvements 848,684 5,799 - 854,483
Equipment 446,963 17,513 (15,855) 448,621
Totals at historical cost 1,345,242 23,312 (15,857) 1,352,697
Less: Accumulated depreciation for
Buildings and leasehold improvements (311,798) (25,375) - (337,173)
Equipment (346,996) (31,982) 15,667 (363,311)
(658,794) (57,357) 15,667 (700,484)
Construction-in-progress 54,656 156,538 (15,301) 195,893
Capital assets, net 741,104$ 122,493$ (15,491)$ 848,106$
(in thousands of dollars) Balance at Disposals Balance at
June 30, and June 30,
2014 Additions Transfers 2015
Land 47,595$ 2,000$ -$ 49,595$
Buildings and leasehold improvements 832,155 18,365 (1,836) 848,684
Equipment 431,119 33,560 (17,716) 446,963
Totals at historical cost 1,310,869 53,925 (19,552) 1,345,242
Less: Accumulated depreciation for
Buildings and leasehold improvements (288,044) (24,872) 1,118 (311,798)
Equipment (332,752) (31,734) 17,490 (346,996)
(620,796) (56,606) 18,608 (658,794)
Construction-in-progress 38,579 56,466 (40,389) 54,656
Capital assets, net 728,652$ 53,785$ (41,333)$ 741,104$
Depreciation and amortization expense was approximately $57,357,000 and $56,606,000 for the
years ended June 30, 2016 and 2015, respectively. Amortization expense on equipment under
capital leases was approximately $193,000 for the years ended June 30, 2016 and 2015. Interest
costs capitalized were approximately $9,811,000 and $6,948,000 for the years ended June 30,
2016 and 2015, respectively. For the years ended June 30, 2016 and 2015, fully depreciated
equipment with an original cost of approximately $14,744,000 and $16,635,000, respectively, was
written-off.
Construction-in-progress at June 30, 2016 consists primarily of costs incurred for the new hospitals
located on the main campus of Shands. Retainage and construction payables were approximately
$26,836,000 and $9,912,000 at June 30, 2016 and 2015, respectively.
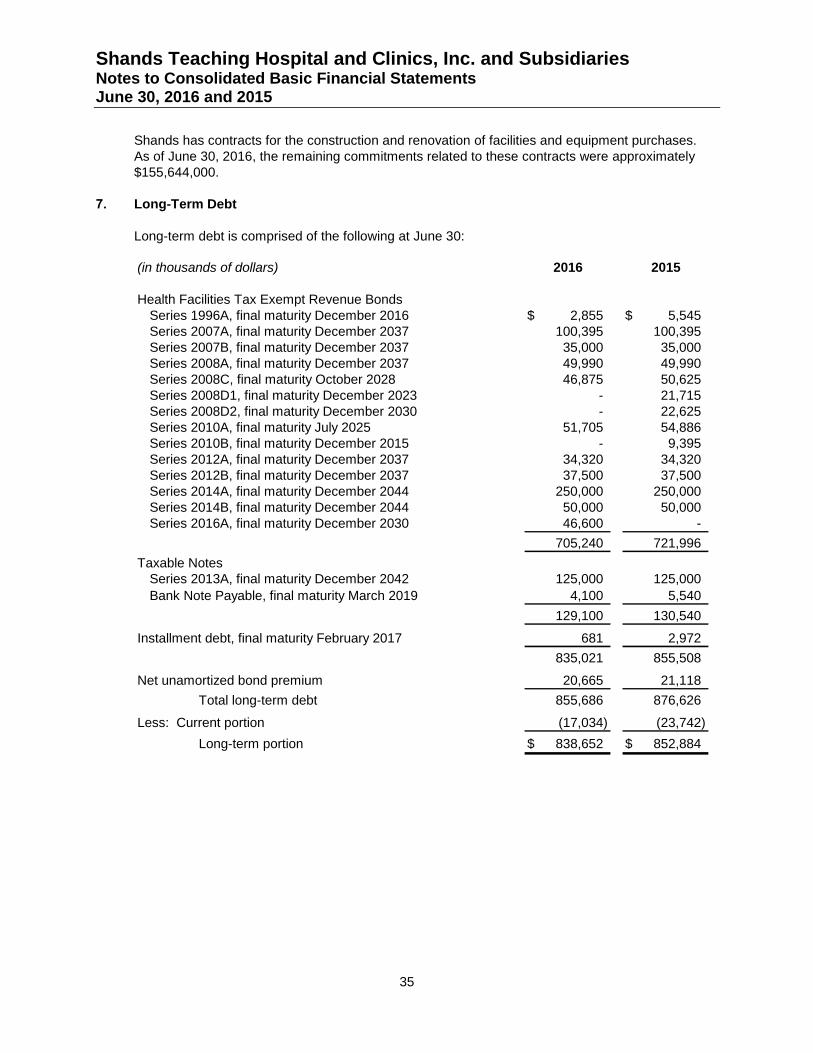
Shands Teaching Hospital and Clinics, Inc. and Subsidiaries Notes to Consolidated Basic Financial Statements June 30, 2016 and 2015
35
Shands has contracts for the construction and renovation of facilities and equipment purchases.
As of June 30, 2016, the remaining commitments related to these contracts were approximately
$155,644,000.
7. Long-Term Debt
Long-term debt is comprised of the following at June 30:
(in thousands of dollars) 2016 2015
Health Facilities Tax Exempt Revenue Bonds
Series 1996A, final maturity December 2016 2,855$ 5,545$
Series 2007A, final maturity December 2037 100,395 100,395
Series 2007B, final maturity December 2037 35,000 35,000
Series 2008A, final maturity December 2037 49,990 49,990
Series 2008C, final maturity October 2028 46,875 50,625
Series 2008D1, final maturity December 2023 - 21,715
Series 2008D2, final maturity December 2030 - 22,625
Series 2010A, final maturity July 2025 51,705 54,886
Series 2010B, final maturity December 2015 - 9,395
Series 2012A, final maturity December 2037 34,320 34,320
Series 2012B, final maturity December 2037 37,500 37,500
Series 2014A, final maturity December 2044 250,000 250,000
Series 2014B, final maturity December 2044 50,000 50,000
Series 2016A, final maturity December 2030 46,600 -
705,240 721,996
Taxable Notes
Series 2013A, final maturity December 2042 125,000 125,000
Bank Note Payable, final maturity March 2019Bank Note Payable, final maturity March 2019 4,100 5,540
129,100 130,540
Installment debt, final maturity February 2017 681 2,972
835,021 855,508
Net unamortized bond premium 20,665 21,118
Total long-term debt 855,686 876,626
Less: Current portion (17,034) (23,742)
Long-term portion 838,652$ 852,884$
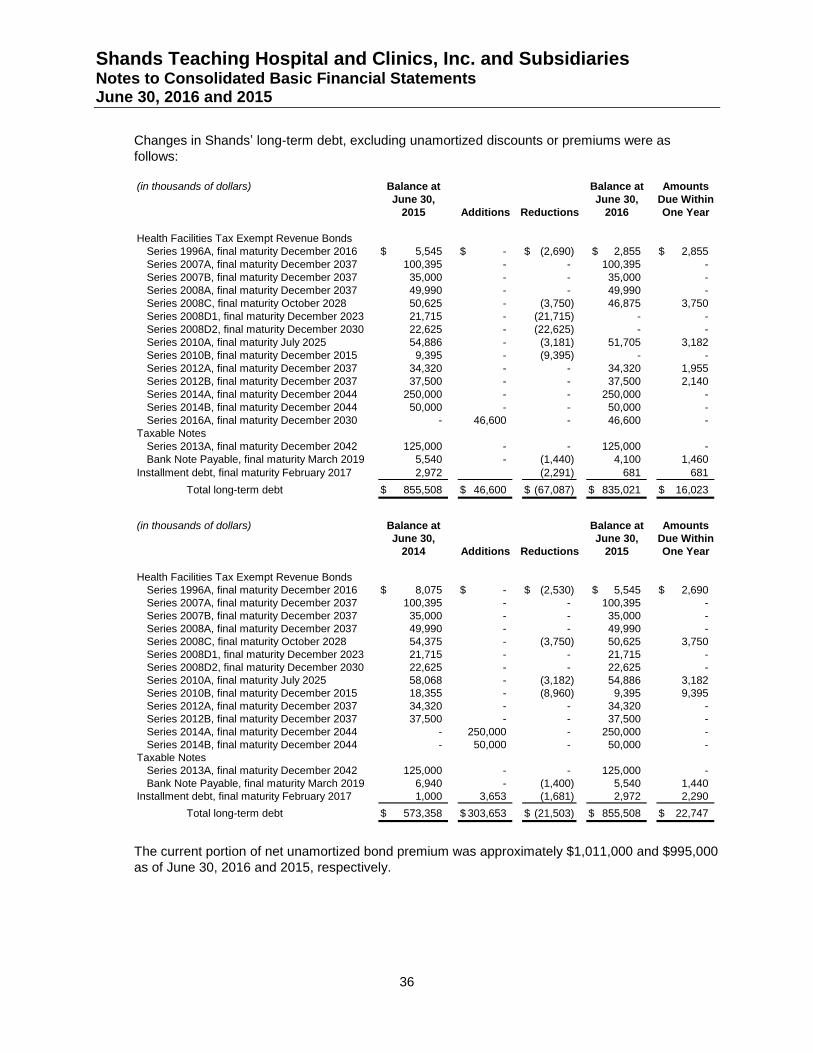
Shands Teaching Hospital and Clinics, Inc. and Subsidiaries Notes to Consolidated Basic Financial Statements June 30, 2016 and 2015
36
Changes in Shands’ long-term debt, excluding unamortized discounts or premiums were as
follows:
(in thousands of dollars) Balance at Balance at Amounts
June 30, June 30, Due Within
2015 Additions Reductions 2016 One Year
Health Facilities Tax Exempt Revenue Bonds
Series 1996A, final maturity December 2016 5,545$ -$ (2,690)$ 2,855$ 2,855$
Series 2007A, final maturity December 2037 100,395 - - 100,395 -
Series 2007B, final maturity December 2037 35,000 - - 35,000 -
Series 2008A, final maturity December 2037 49,990 - - 49,990 -
Series 2008C, final maturity October 2028 50,625 - (3,750) 46,875 3,750
Series 2008D1, final maturity December 2023 21,715 - (21,715) - -
Series 2008D2, final maturity December 2030 22,625 - (22,625) - -
Series 2010A, final maturity July 2025 54,886 - (3,181) 51,705 3,182
Series 2010B, final maturity December 2015 9,395 - (9,395) - -
Series 2012A, final maturity December 2037 34,320 - - 34,320 1,955
Series 2012B, final maturity December 2037 37,500 - - 37,500 2,140
Series 2014A, final maturity December 2044 250,000 - - 250,000 -
Series 2014B, final maturity December 2044 50,000 - - 50,000 -
Series 2016A, final maturity December 2030 - 46,600 - 46,600 -
Taxable Notes
Series 2013A, final maturity December 2042 125,000 - - 125,000 -
Bank Note Payable, final maturity March 2019 5,540 - (1,440) 4,100 1,460
Installment debt, final maturity February 2017 2,972 (2,291) 681 681
Total long-term debt 855,508$ 46,600$ (67,087)$ 835,021$ 16,023$
(in thousands of dollars) Balance at Balance at Amounts
June 30, June 30, Due Within
2014 Additions Reductions 2015 One Year
Health Facilities Tax Exempt Revenue Bonds
Series 1996A, final maturity December 2016 8,075$ -$ (2,530)$ 5,545$ 2,690$
Series 2007A, final maturity December 2037 100,395 - - 100,395 -
Series 2007B, final maturity December 2037 35,000 - - 35,000 -
Series 2008A, final maturity December 2037 49,990 - - 49,990 -
Series 2008C, final maturity October 2028 54,375 - (3,750) 50,625 3,750
Series 2008D1, final maturity December 2023 21,715 - - 21,715 -
Series 2008D2, final maturity December 2030 22,625 - - 22,625 -
Series 2010A, final maturity July 2025 58,068 - (3,182) 54,886 3,182
Series 2010B, final maturity December 2015 18,355 - (8,960) 9,395 9,395
Series 2012A, final maturity December 2037 34,320 - - 34,320 -
Series 2012B, final maturity December 2037 37,500 - - 37,500 -
Series 2014A, final maturity December 2044 - 250,000 - 250,000 -
Series 2014B, final maturity December 2044 - 50,000 - 50,000 -
Taxable Notes
Series 2013A, final maturity December 2042 125,000 - - 125,000 -
Bank Note Payable, final maturity March 2019 6,940 - (1,400) 5,540 1,440
Installment debt, final maturity February 2017 1,000 3,653 (1,681) 2,972 2,290
Total long-term debt 573,358$ 303,653$ (21,503)$ 855,508$ 22,747$
The current portion of net unamortized bond premium was approximately $1,011,000 and $995,000
as of June 30, 2016 and 2015, respectively.
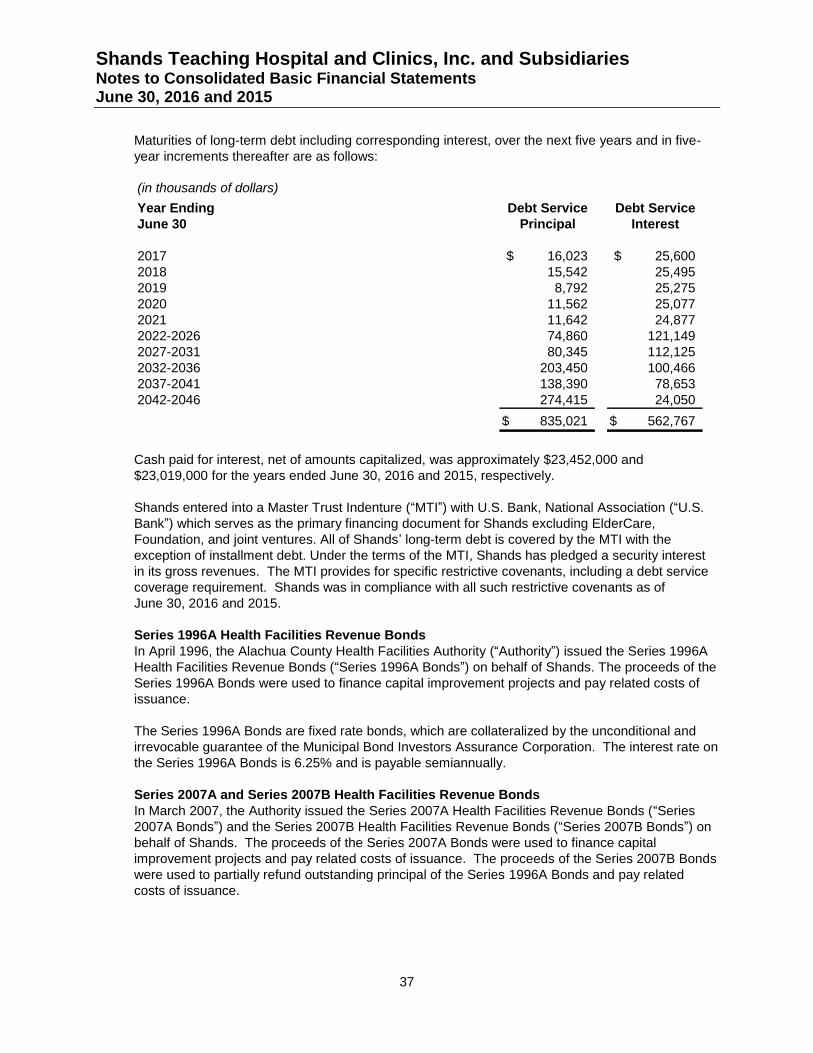
Shands Teaching Hospital and Clinics, Inc. and Subsidiaries Notes to Consolidated Basic Financial Statements June 30, 2016 and 2015
37
Maturities of long-term debt including corresponding interest, over the next five years and in five-
year increments thereafter are as follows:
(in thousands of dollars)
Year Ending Debt Service Debt Service
June 30 Principal Interest
2017 16,023$ 25,600$
2018 15,542 25,495
2019 8,792 25,275
2020 11,562 25,077
2021 11,642 24,877
2022-2026 74,860 121,149
2027-2031 80,345 112,125
2032-2036 203,450 100,466
2037-2041 138,390 78,653
2042-2046 274,415 24,050
835,021$ 562,767$
Cash paid for interest, net of amounts capitalized, was approximately $23,452,000 and
$23,019,000 for the years ended June 30, 2016 and 2015, respectively.
Shands entered into a Master Trust Indenture (“MTI”) with U.S. Bank, National Association (“U.S.
Bank”) which serves as the primary financing document for Shands excluding ElderCare,
Foundation, and joint ventures. All of Shands’ long-term debt is covered by the MTI with the
exception of installment debt. Under the terms of the MTI, Shands has pledged a security interest
in its gross revenues. The MTI provides for specific restrictive covenants, including a debt service
coverage requirement. Shands was in compliance with all such restrictive covenants as of
June 30, 2016 and 2015.
Series 1996A Health Facilities Revenue Bonds
In April 1996, the Alachua County Health Facilities Authority (“Authority”) issued the Series 1996A
Health Facilities Revenue Bonds (“Series 1996A Bonds”) on behalf of Shands. The proceeds of the
Series 1996A Bonds were used to finance capital improvement projects and pay related costs of
issuance.
The Series 1996A Bonds are fixed rate bonds, which are collateralized by the unconditional and
irrevocable guarantee of the Municipal Bond Investors Assurance Corporation. The interest rate on
the Series 1996A Bonds is 6.25% and is payable semiannually.
Series 2007A and Series 2007B Health Facilities Revenue Bonds
In March 2007, the Authority issued the Series 2007A Health Facilities Revenue Bonds (“Series
2007A Bonds”) and the Series 2007B Health Facilities Revenue Bonds (“Series 2007B Bonds”) on
behalf of Shands. The proceeds of the Series 2007A Bonds were used to finance capital
improvement projects and pay related costs of issuance. The proceeds of the Series 2007B Bonds
were used to partially refund outstanding principal of the Series 1996A Bonds and pay related
costs of issuance.
Shands Teaching Hospital and Clinics, Inc. and Subsidiaries Notes to Consolidated Basic Financial Statements June 30, 2016 and 2015
38
The Series 2007A Bonds and Series 2007B Bonds are variable rate bonds based upon 67% of
three month London Interbank Offered Rate (“LIBOR”) plus 0.87%. The interest rate on the bonds
is reset quarterly and the interest rate was 1.32% and 1.06% at June 30, 2016 and 2015,
respectively. The Series 2007A Bonds and Series 2007B Bonds maturing on or after June 1, 2017
are redeemable at Shands’ option at par value.
Series 2008A Health Facilities Revenue Bonds
In June 2008, the Authority issued the Series 2008A Health Facilities Revenue Bonds (“Series
2008A Bonds”) on behalf of Shands. The proceeds of the Series 2008A Bonds were used to retire
the Series 2007C Bonds.
The Series 2008A Bonds are variable rate bonds issued in the Unit Pricing Mode. Interest periods
range from 1 to 270 days. The weighted average interest rate on the Series 2008A Bonds was
0.44% and 0.10% at June 30, 2016 and 2015, respectively. The Series 2008A Bonds are backed
by a bank letter of credit for approximately $50,709,000 that expires in December 2020. There
were no amounts outstanding under this letter of credit at June 30, 2016 and 2015. The Series
2008A Bonds are redeemable at the option of Shands at par value plus accrued interest at any
interest payment date.
Series 2008C Health Facilities Revenue Bonds
In November 2008, the Authority issued the Series 2008C Health Facilities Revenue Bonds
(“Series 2008C Bonds”) on behalf of Shands. The proceeds of the Series 2008C Bonds were used
to refund the Series 1996B Bonds and pay related costs of issuance.
The Series 2008C Bonds are variable rate bonds based upon 65% of one month LIBOR plus
1.30%. The interest rate on the Series 2008C Bonds was 1.60% and 1.42% at June 30, 2016 and
2015, respectively.
Series 2008D1 and Series 2008D2 Health Facilities Revenue Bonds
In November 2008, the Authority issued the Series 2008D1 Health Facilities Revenue Bonds
(“Series 2008D1 Bonds”) and the Series 2008D2 Health Facilities Revenue Bonds (“Series 2008D2
Bonds”) on behalf of Shands. The proceeds of the Series 2008D1 Bonds and Series 2008D2
Bonds were used to refund a portion of the Series 2007A Bonds.
In 2016, the Series 2008D1 Bonds and Series 2008D2 Bonds were advance refunded with the
proceeds from the issuance of the Series 2016A Health Facilities Revenue Refunding Bonds.
Series 2010A Health Facilities Revenue Bonds
In June 2010, the Authority issued the Series 2010A Health Facilities Revenue Bonds (“Series
2010A Bonds”) on behalf of Shands. The proceeds of the Series 2010A Bonds were used to
finance capital improvement projects and pay related costs of issuance.
The Series 2010A Bonds are variable rate bonds based upon 65% of one month LIBOR plus
1.105% with a minimum rate floor of 1.29%. The interest rate on the Series 2010A Bonds was
1.40% and 1.29% at June 30, 2016 and 2015, respectively.
Shands Teaching Hospital and Clinics, Inc. and Subsidiaries Notes to Consolidated Basic Financial Statements June 30, 2016 and 2015
39
Series 2012A and Series 2012B Health Facilities Revenue Bonds
In December 2012, the Authority issued the Series 2012A Health Facilities Revenue Bonds
(“Series 2012A Bonds”) and the Series 2012B Health Facilities Revenue Bonds (“Series 2012B
Bonds”) on behalf of Shands. The proceeds of the Series 2012A Bonds and Series 2012B Bonds
were used to refund outstanding principal of the Series 2008B Bonds and partially refund
outstanding principal of the Series 2008A Bonds.
The Series 2012A Bonds and Series 2012B Bonds are variable rate bonds based upon 67% of one
month LIBOR plus 0.85% and 67% of one month LIBOR plus 0.93%, respectively. Prior to July 1,
2015 the variable rate on the Series 2012A Bonds and Series 2012B Bonds were based upon 67%
of one month LIBOR plus 0.98% and 67% of one month LIBOR plus 1.05%, respectively. The
interest rate on the Series 2012A Bonds and Series 2012B Bonds was 1.16% and 1.24%,
respectively, at June 30, 2016 and 1.10% and 1.17%, respectively, at June 30, 2015.
Series 2014A and Series 2014B Health Facilities Revenue Bonds
In October 2014, the Authority issued the Series 2014A Health Facilities Revenue Bonds (“Series
2014A Bonds”) and the Series 2014B Health Facilities Revenue Bonds (“Series 2014B Bonds”) on
behalf of Shands. The proceeds of the Series 2014A Bonds and Series 2014B Bonds are being
used to finance capital improvement projects and pay related costs of issuance.
The Series 2014A Bonds and Series 2014B Bonds are unenhanced fixed rate bonds. Interest
rates on the Series 2014A Bonds range from 4.00% to 5.00% and the interest rate on the Series
2014B Bonds is 5.00% and are payable semiannually. The Series 2014A Bonds and Series 2014B
Bonds maturing on or after December 1, 2024 are redeemable at Shands’ option at par value.
Series 2016A Health Facilities Revenue Refunding Bonds
In May 2016, the Authority issued the Series 2016A Health Facilities Revenue Refunding Bonds
(“Series 2016A Bonds”) on behalf of Shands. The proceeds of the Series 2016A Bonds were used
to advance refund the Series 2008D1 Bonds and Series 2008D2 Bonds and pay related costs of
issuance. The interest rate on the Series 2016A Bonds is fixed at 2.15% and is payable quarterly.
Shands advance refunded the Series 2008D1 Bonds and Series D2 Bonds to reduce its total debt
service payments over the next 14.5 years by approximately $10,935,000 and to obtain an
economic gain (difference between the present value of the debt service on the new debt and the
refunded debt) of approximately $9,247,000. The advance refunding resulted in the recognition of a
deferred outflow of approximately $7,029,000 which will be amortized over the life of the Series
2016A Bonds.
Series 2013A Taxable Notes
In March 2013, Shands issued the Series 2013A Taxable Notes (“Series 2013A Notes”). The
proceeds of the Series 2013A Notes were used to finance capital improvement projects, other
business purposes, and pay related costs of issuance.
The interest rate on the Series 2013A Notes is fixed at 4.741% and is payable semiannually.
Bank Note
In 2012, PNC Bank issued a seven year taxable loan to Shands to finance a property purchase,
renovations, and equipment. The interest rate on the loan is fixed at 2.08%. Principal and interest
payments are payable monthly through final maturity in March 2019.
Shands Teaching Hospital and Clinics, Inc. and Subsidiaries Notes to Consolidated Basic Financial Statements June 30, 2016 and 2015
40
8. Interest Rate Swaps
On June 30, 2016 and 2015, Shands had the following derivative instruments outstanding:
(in thousands of dollars)
Shands Counterparty 2016 2015
Notional Notional Effective Maturity Fair Fair
Item Type Objective Amount Amount Date Date Terms Value Value
1996B Fixed rate
payer
interest
rate swap
Hedge of changes in
cash flows on the
Series 1996B Bonds
refinanced in 2008
75,000$ 75,000$ 7/03/2003 12/01/2026 Pay fixed rate of 3.175%.
Receive 67% of one month
LIBOR.
(10,689)$ (8,770)$
1996B Fixed rate
receiver
interest
rate swap
Hedge of changes in
cash flows on the
1996B fixed rate
payer interest rate
swap
75,000$ 75,000$ 6/03/2009 12/01/2026 Pay SIFMA Municipal
Swap Index rate. Receive
fixed rate of 3.40%.
10,902$ 9,012$
2007A Fixed rate
payer
interest
rate swap
Hedge of changes in
cash flows on the
Series 2007A Bonds
100,395$ 100,395$ 3/30/2007 12/01/2037 Pay fixed rate of 4.349%.
Receive 67% of three
month LIBOR plus 87
basis points.
(37,341)$ (24,511)$
2007B Fixed rate
payer
interest
rate swap
Hedge of changes in
cash flows on the
Series 2007B Bonds
35,000$ 35,000$ 3/30/2007 12/01/2037 Pay fixed rate of 4.349%.
Receive 67% of three
month LIBOR plus 87
basis points.
(11,695)$ (7,872)$
2007A Total return
interest
rate swap
Hedge of changes in
cash flows on the
Series 2007A Bonds
27,950$ 40,000$ 1/27/2011 12/01/2019 Pay SIFMA Municipal
Swap Index rate plus 100
basis points. Receive 67%
of three month LIBOR plus
87 basis points.
7,748$ 3,793$
2007A Total return
interest
rate swap
Hedge of changes in
cash flows on the
Series 2007A Bonds
14,900$ 20,000$ 1/10/2014 12/01/2019 Pay SIFMA Municipal
Swap Index rate plus 100
basis points. Receive 67%
of three month LIBOR plus
87 basis points.
2,204$ (350)$
2007B Total return
interest
rate swap
Hedge of changes in
cash flows on the
Series 2007B Bonds
24,456$ 35,000$ 1/27/2011 12/01/2019 Pay SIFMA Municipal
Swap Index rate plus 100
basis points. Receive 67%
of three month LIBOR plus
87 basis points.
7,035$ 3,806$
2008A Fixed rate
payer
interest
rate swap
Hedge of changes in
cash flows on the
Series 2008A Bonds
49,990$ 49,990$ 11/07/2007 12/01/2037 Pay fixed rate of 3.538%.
Receive 67% of one month
LIBOR.
(19,952)$ (13,379)$
2008C Fixed rate
payer
interest
rate swap
Hedge of changes in
cash flows on the
Series 2008C Bonds
46,875$ 46,875$ 11/05/2008 10/02/2028 Pay fixed rate of 4.18%.
Receive 65% of one month
LIBOR plus 130 basis
points.
(6,032)$ (4,844)$
(57,820)$ (43,115)$
At June 30, 2016, approximately $27,889,000 and $85,709,000 and at June 30, 2015,
approximately $16,611,000 and $59,726,000 related to the fair value of interest rate swaps are
recorded in other assets and other liabilities, respectively, in the accompanying consolidated basic
statements of net position.
Credit Risk
Shands has sought to limit its counterparty risk. As of June 30, 2016 and 2015, the Moody’s and
Standard & Poor’s credit ratings for the counterparty for the swap agreements, with the exception
of the 2007A total return swap agreement effective January 10, 2014 and the 2008C interest rate
swap agreement, were Baa2/NR, the Moody’s and Standard & Poor’s credit ratings for the
counterparty of the 2007A total return swap agreement effective January 10, 2014 were A1/A, and
the Moody’s and Standard & Poor’s credit ratings for the counterparty of the 2008C interest rate
swap agreement were Baa2/BBB+. The counterparty for all of the swap agreements, with the
exception of the 2008A and 2008C interest rate swap agreements, may be required to post
Shands Teaching Hospital and Clinics, Inc. and Subsidiaries Notes to Consolidated Basic Financial Statements June 30, 2016 and 2015
41
collateral if the fair value of the interest rate swap is positive and meets certain thresholds.
Collateral in the amount of approximately $11,780,000 and $4,740,000 was required to be posted
by the counterparty with Shands as of June 30, 2016 and 2015, respectively.
Interest Rate Risk
Shands is not exposed to interest rate risk on its fixed rate payer interest rate swap agreements as
they are structured in a receive variable, pay fixed rate mode. The 1996B fixed receiver swap is
structured in a receive fixed, pay variable rate mode. However, the 1996B fixed receiver swap
hedges the cash flows associated with the 1996B fixed payer swap. The 2007A and 2007B total
return swaps are structured in a receive variable, pay variable rate mode and hedge the cash flows
associated with the Series 2007A Bonds and Series 2007B Bonds.
Basis Risk
Shands is exposed to basis risk on its 2008A fixed rate payer swap agreement because the
variable-rate payments received by Shands on the hedging derivative instrument are based on a
rate or index other than the interest rates that Shands pays on its hedged variable rate debt, which
is remarketed in varying amounts and at various dates. As of June 30, 2016 and 2015, the
weighted variable interest rate on Shands’ hedged variable rate debt is 0.44% and 0.10%,
respectively, while the swap index is 67% of one month LIBOR, or 0.31% and 0.13%, respectively.
Termination Risk
The interest rate swap agreements use the International Swap Dealers Association Master
Agreement, which includes standard termination event provisions, such as failure to pay and
bankruptcy.
Commitments
Several of Shands’ interest rate swap agreements require collateral to be posted if the fair value of
the interest rate swap is negative and meets certain thresholds. The threshold amount depends on
Shands’ unenhanced credit rating as determined by Moody’s and Standard & Poor’s. Collateral in
the amount of approximately $34,991,000 and $21,963,000 was required to be posted by Shands
with the counterparty as of June 30, 2016 and 2015, respectively.
9. Retirement Benefit Plans
Defined Contribution Plans
Shands sponsors two defined contribution plans that cover eligible employees, the Shands
HealthCare Matched Savings Account 403(b) Plan (“403(b) Plan”) and the Shands HealthCare
Matched Savings Account 401(a) Plan (“401(a) Plan”). Under the provisions of the 403(b) Plan,
employees may elect to defer up to 75% of annual compensation (as defined) subject to Internal
Revenue Code limitations. Under the 401(a) Plan, Shands makes a non-elective discretionary
contribution on behalf of employees (a percentage of compensation based upon years of service)
and a matching contribution equal to 75% of the first 4% of compensation that an employee
contributes to the 403(b) Plan. Shands’ contributions to the 401(a) Plan were approximately
$30,007,000 and $28,856,000 for the years ended June 30, 2016 and 2015, respectively.
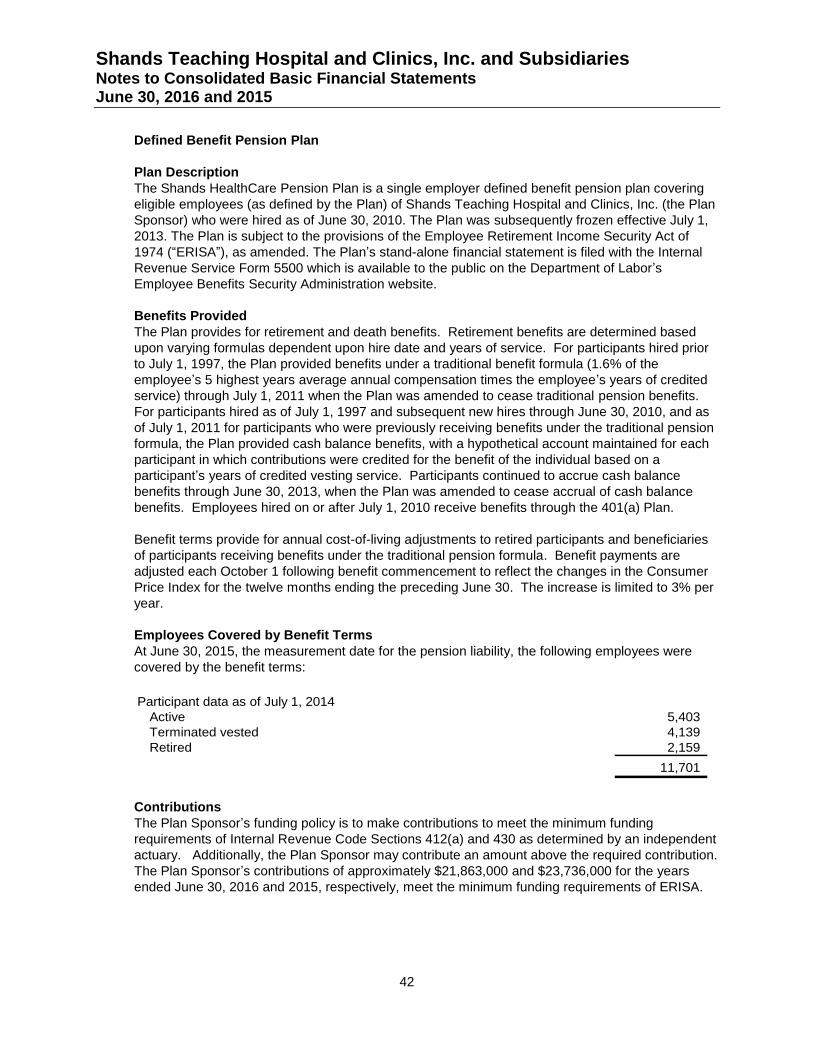
Shands Teaching Hospital and Clinics, Inc. and Subsidiaries Notes to Consolidated Basic Financial Statements June 30, 2016 and 2015
42
Defined Benefit Pension Plan
Plan Description
The Shands HealthCare Pension Plan is a single employer defined benefit pension plan covering
eligible employees (as defined by the Plan) of Shands Teaching Hospital and Clinics, Inc. (the Plan
Sponsor) who were hired as of June 30, 2010. The Plan was subsequently frozen effective July 1,
2013. The Plan is subject to the provisions of the Employee Retirement Income Security Act of
1974 (“ERISA”), as amended. The Plan’s stand-alone financial statement is filed with the Internal
Revenue Service Form 5500 which is available to the public on the Department of Labor’s
Employee Benefits Security Administration website.
Benefits Provided
The Plan provides for retirement and death benefits. Retirement benefits are determined based
upon varying formulas dependent upon hire date and years of service. For participants hired prior
to July 1, 1997, the Plan provided benefits under a traditional benefit formula (1.6% of the
employee’s 5 highest years average annual compensation times the employee’s years of credited
service) through July 1, 2011 when the Plan was amended to cease traditional pension benefits.
For participants hired as of July 1, 1997 and subsequent new hires through June 30, 2010, and as
of July 1, 2011 for participants who were previously receiving benefits under the traditional pension
formula, the Plan provided cash balance benefits, with a hypothetical account maintained for each
participant in which contributions were credited for the benefit of the individual based on a
participant’s years of credited vesting service. Participants continued to accrue cash balance
benefits through June 30, 2013, when the Plan was amended to cease accrual of cash balance
benefits. Employees hired on or after July 1, 2010 receive benefits through the 401(a) Plan.
Benefit terms provide for annual cost-of-living adjustments to retired participants and beneficiaries
of participants receiving benefits under the traditional pension formula. Benefit payments are
adjusted each October 1 following benefit commencement to reflect the changes in the Consumer
Price Index for the twelve months ending the preceding June 30. The increase is limited to 3% per
year.
Employees Covered by Benefit Terms
At June 30, 2015, the measurement date for the pension liability, the following employees were
covered by the benefit terms:
Participant data as of July 1, 2014
Active 5,403
Terminated vested 4,139
Retired 2,159
11,701
Contributions
The Plan Sponsor’s funding policy is to make contributions to meet the minimum funding
requirements of Internal Revenue Code Sections 412(a) and 430 as determined by an independent
actuary. Additionally, the Plan Sponsor may contribute an amount above the required contribution.
The Plan Sponsor’s contributions of approximately $21,863,000 and $23,736,000 for the years
ended June 30, 2016 and 2015, respectively, meet the minimum funding requirements of ERISA.
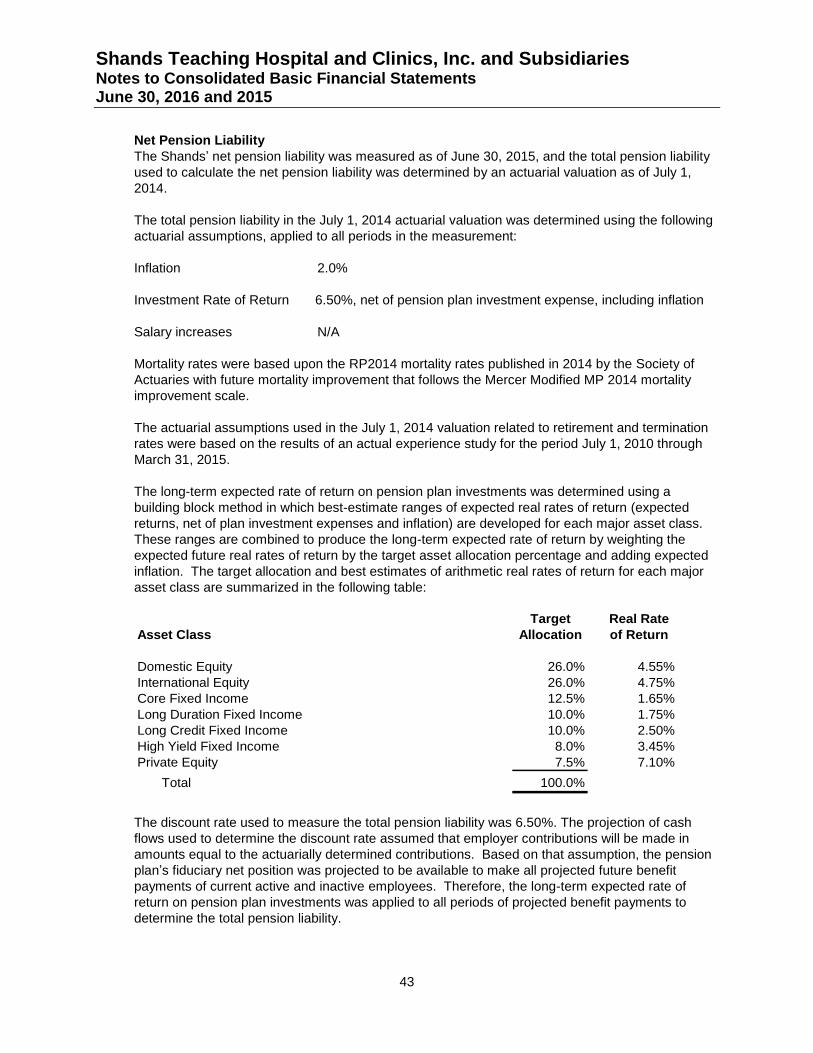
Shands Teaching Hospital and Clinics, Inc. and Subsidiaries Notes to Consolidated Basic Financial Statements June 30, 2016 and 2015
43
Net Pension Liability
The Shands’ net pension liability was measured as of June 30, 2015, and the total pension liability
used to calculate the net pension liability was determined by an actuarial valuation as of July 1,
2014.
The total pension liability in the July 1, 2014 actuarial valuation was determined using the following
actuarial assumptions, applied to all periods in the measurement:
Inflation 2.0%
Investment Rate of Return 6.50%, net of pension plan investment expense, including inflation
Salary increases N/A
Mortality rates were based upon the RP2014 mortality rates published in 2014 by the Society of
Actuaries with future mortality improvement that follows the Mercer Modified MP 2014 mortality
improvement scale.
The actuarial assumptions used in the July 1, 2014 valuation related to retirement and termination
rates were based on the results of an actual experience study for the period July 1, 2010 through
March 31, 2015.
The long-term expected rate of return on pension plan investments was determined using a
building block method in which best-estimate ranges of expected real rates of return (expected
returns, net of plan investment expenses and inflation) are developed for each major asset class.
These ranges are combined to produce the long-term expected rate of return by weighting the
expected future real rates of return by the target asset allocation percentage and adding expected
inflation. The target allocation and best estimates of arithmetic real rates of return for each major
asset class are summarized in the following table:
Target Real Rate
Asset Class Allocation of Return
Domestic Equity 26.0% 4.55%
International Equity 26.0% 4.75%
Core Fixed Income 12.5% 1.65%
Long Duration Fixed Income 10.0% 1.75%
Long Credit Fixed Income 10.0% 2.50%
High Yield Fixed Income 8.0% 3.45%
Private Equity 7.5% 7.10%
Total 100.0%
The discount rate used to measure the total pension liability was 6.50%. The projection of cash
flows used to determine the discount rate assumed that employer contributions will be made in
amounts equal to the actuarially determined contributions. Based on that assumption, the pension
plan’s fiduciary net position was projected to be available to make all projected future benefit
payments of current active and inactive employees. Therefore, the long-term expected rate of
return on pension plan investments was applied to all periods of projected benefit payments to
determine the total pension liability.
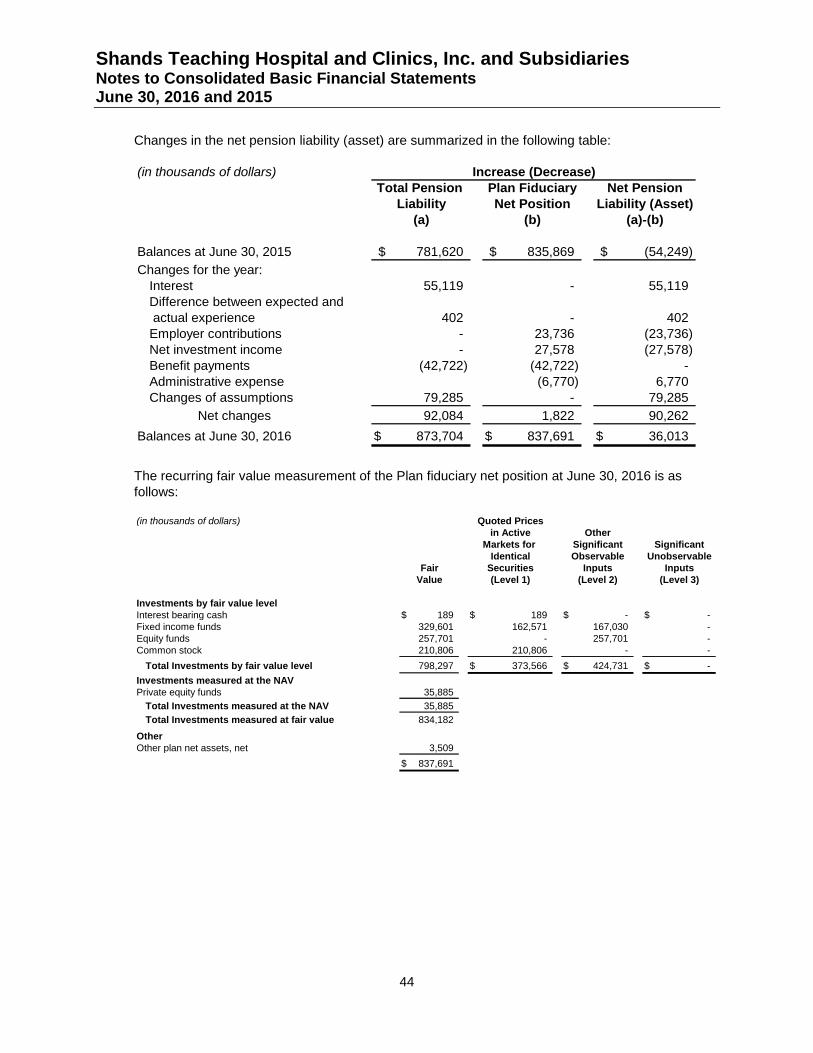
Shands Teaching Hospital and Clinics, Inc. and Subsidiaries Notes to Consolidated Basic Financial Statements June 30, 2016 and 2015
44
Changes in the net pension liability (asset) are summarized in the following table:
(in thousands of dollars)
Total Pension Plan Fiduciary Net Pension
Liability Net Position Liability (Asset)
(a) (b) (a)-(b)
Balances at June 30, 2015 781,620$ 835,869$ (54,249)$
Changes for the year:
Interest 55,119 - 55,119
Difference between expected and
actual experience 402 - 402
Employer contributions - 23,736 (23,736)
Net investment income - 27,578 (27,578)
Benefit payments (42,722) (42,722) -
Administrative expense (6,770) 6,770
Changes of assumptions 79,285 - 79,285
Net changes 92,084 1,822 90,262
Balances at June 30, 2016 873,704$ 837,691$ 36,013$
Increase (Decrease)
The recurring fair value measurement of the Plan fiduciary net position at June 30, 2016 is as
follows:
(in thousands of dollars) Quoted Prices
in Active Other
Markets for Significant Significant
Identical Observable Unobservable
Fair Securities Inputs Inputs
Value (Level 1) (Level 2) (Level 3)
Investments by fair value level
Interest bearing cash 189$ 189$ -$ -$
Fixed income funds 329,601 162,571 167,030 -
Equity funds 257,701 - 257,701 -
Common stock 210,806 210,806 - -
Total Investments by fair value level 798,297 373,566$ 424,731$ -$
Investments measured at the NAV
Private equity funds 35,885
Total Investments measured at the NAV 35,885
Total Investments measured at fair value 834,182
Other
Other plan net assets, net 3,509
837,691$
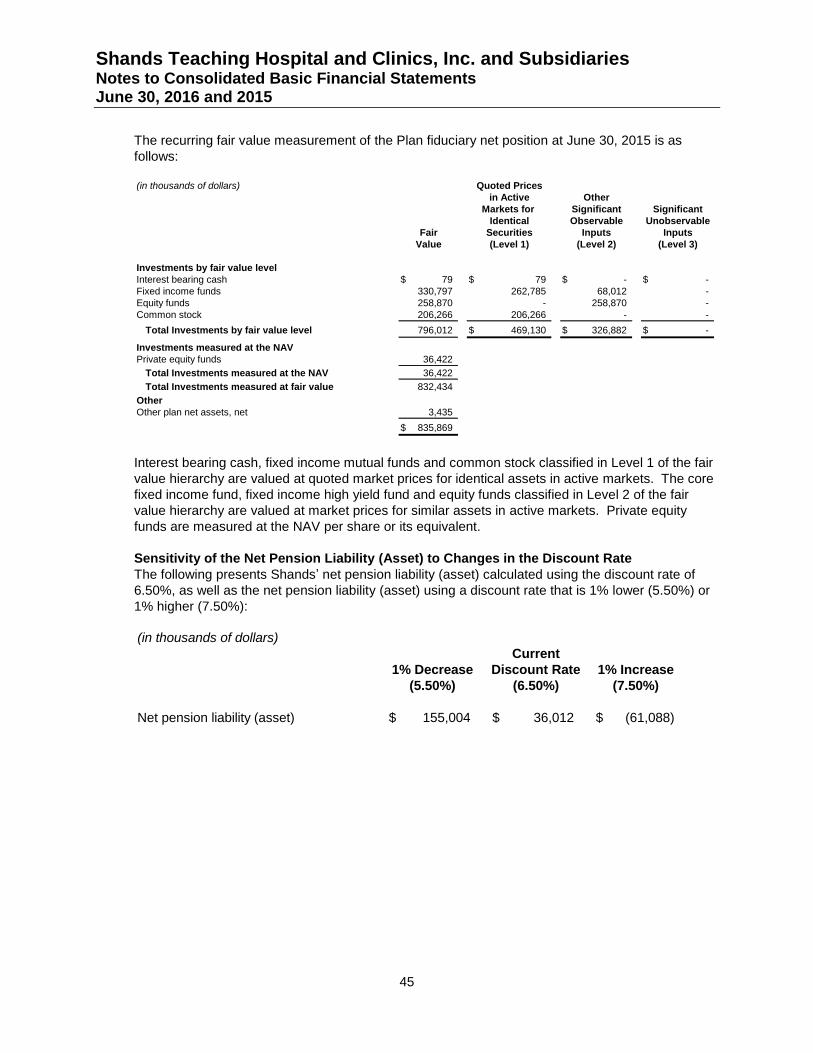
Shands Teaching Hospital and Clinics, Inc. and Subsidiaries Notes to Consolidated Basic Financial Statements June 30, 2016 and 2015
45
The recurring fair value measurement of the Plan fiduciary net position at June 30, 2015 is as
follows:
(in thousands of dollars) Quoted Prices
in Active Other
Markets for Significant Significant
Identical Observable Unobservable
Fair Securities Inputs Inputs
Value (Level 1) (Level 2) (Level 3)
Investments by fair value level
Interest bearing cash 79$ 79$ -$ -$
Fixed income funds 330,797 262,785 68,012 -
Equity funds 258,870 - 258,870 -
Common stock 206,266 206,266 - -
Total Investments by fair value level 796,012 469,130$ 326,882$ -$
Investments measured at the NAV
Private equity funds 36,422
Total Investments measured at the NAV 36,422
Total Investments measured at fair value 832,434
Other
Other plan net assets, net 3,435
835,869$
Interest bearing cash, fixed income mutual funds and common stock classified in Level 1 of the fair
value hierarchy are valued at quoted market prices for identical assets in active markets. The core
fixed income fund, fixed income high yield fund and equity funds classified in Level 2 of the fair
value hierarchy are valued at market prices for similar assets in active markets. Private equity
funds are measured at the NAV per share or its equivalent.
Sensitivity of the Net Pension Liability (Asset) to Changes in the Discount Rate
The following presents Shands’ net pension liability (asset) calculated using the discount rate of
6.50%, as well as the net pension liability (asset) using a discount rate that is 1% lower (5.50%) or
1% higher (7.50%):
(in thousands of dollars)
Current
1% Decrease Discount Rate 1% Increase
(5.50%) (6.50%) (7.50%)
Net pension liability (asset) 155,004$ 36,012$ (61,088)$
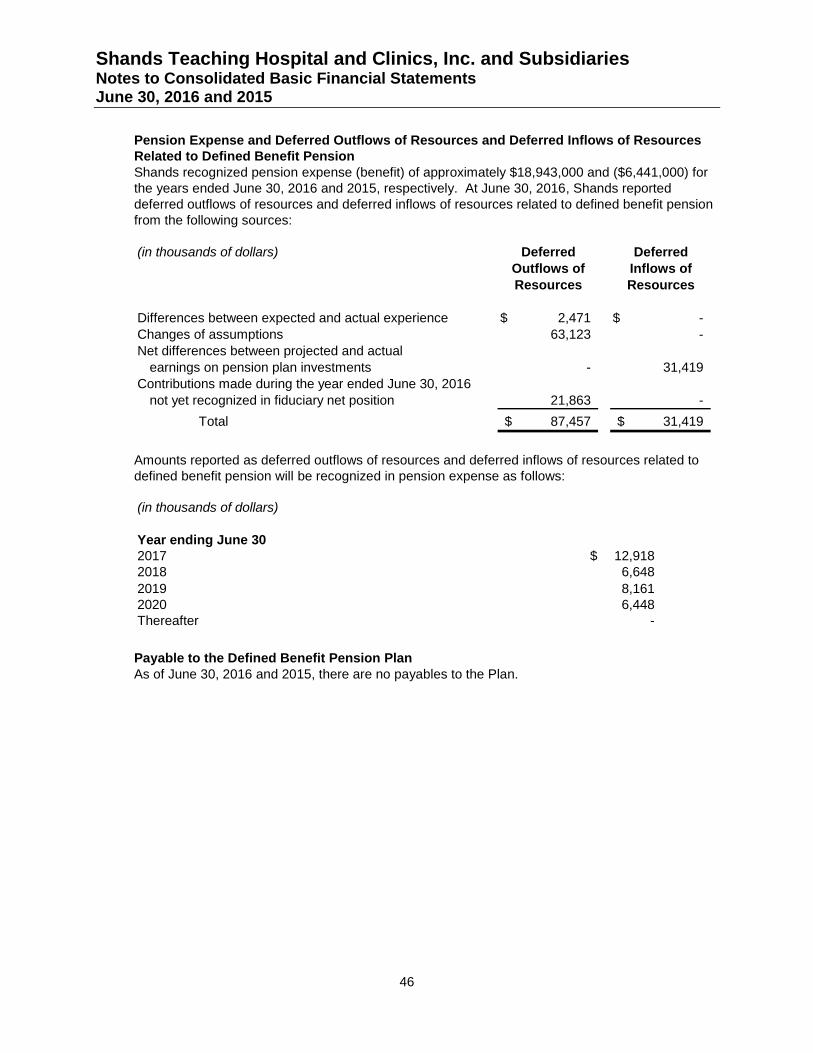
Shands Teaching Hospital and Clinics, Inc. and Subsidiaries Notes to Consolidated Basic Financial Statements June 30, 2016 and 2015
46
Pension Expense and Deferred Outflows of Resources and Deferred Inflows of Resources
Related to Defined Benefit Pension
Shands recognized pension expense (benefit) of approximately $18,943,000 and ($6,441,000) for
the years ended June 30, 2016 and 2015, respectively. At June 30, 2016, Shands reported
deferred outflows of resources and deferred inflows of resources related to defined benefit pension
from the following sources:
(in thousands of dollars) Deferred Deferred
Outflows of Inflows of
Resources Resources
Differences between expected and actual experience 2,471$ -$
Changes of assumptions 63,123 -
Net differences between projected and actual
earnings on pension plan investments - 31,419
Contributions made during the year ended June 30, 2016
not yet recognized in fiduciary net position 21,863 -
Total 87,457$ 31,419$
Amounts reported as deferred outflows of resources and deferred inflows of resources related to
defined benefit pension will be recognized in pension expense as follows:
(in thousands of dollars)
Year ending June 30
2017 12,918$
2018 6,648
2019 8,161
2020 6,448
Thereafter -
Payable to the Defined Benefit Pension Plan
As of June 30, 2016 and 2015, there are no payables to the Plan.
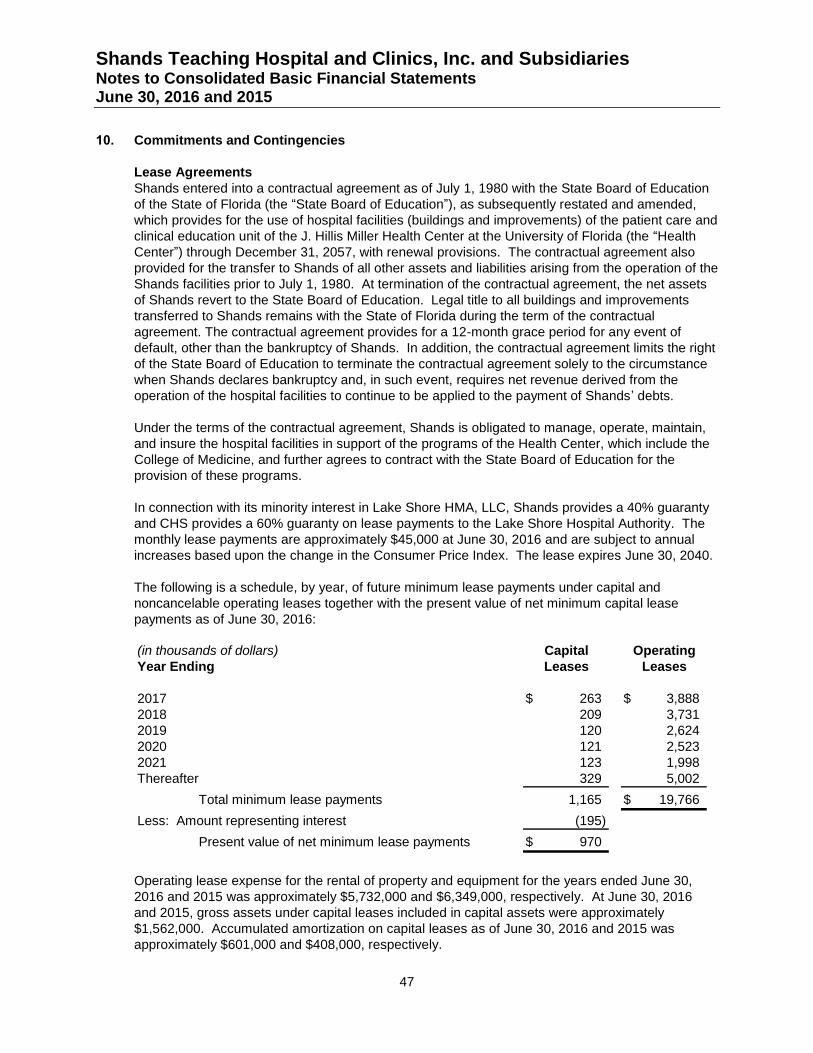
Shands Teaching Hospital and Clinics, Inc. and Subsidiaries Notes to Consolidated Basic Financial Statements June 30, 2016 and 2015
47
10. Commitments and Contingencies
Lease Agreements
Shands entered into a contractual agreement as of July 1, 1980 with the State Board of Education
of the State of Florida (the “State Board of Education”), as subsequently restated and amended,
which provides for the use of hospital facilities (buildings and improvements) of the patient care and
clinical education unit of the J. Hillis Miller Health Center at the University of Florida (the “Health
Center”) through December 31, 2057, with renewal provisions. The contractual agreement also
provided for the transfer to Shands of all other assets and liabilities arising from the operation of the
Shands facilities prior to July 1, 1980. At termination of the contractual agreement, the net assets
of Shands revert to the State Board of Education. Legal title to all buildings and improvements
transferred to Shands remains with the State of Florida during the term of the contractual
agreement. The contractual agreement provides for a 12-month grace period for any event of
default, other than the bankruptcy of Shands. In addition, the contractual agreement limits the right
of the State Board of Education to terminate the contractual agreement solely to the circumstance
when Shands declares bankruptcy and, in such event, requires net revenue derived from the
operation of the hospital facilities to continue to be applied to the payment of Shands’ debts.
Under the terms of the contractual agreement, Shands is obligated to manage, operate, maintain,
and insure the hospital facilities in support of the programs of the Health Center, which include the
College of Medicine, and further agrees to contract with the State Board of Education for the
provision of these programs.
In connection with its minority interest in Lake Shore HMA, LLC, Shands provides a 40% guaranty
and CHS provides a 60% guaranty on lease payments to the Lake Shore Hospital Authority. The
monthly lease payments are approximately $45,000 at June 30, 2016 and are subject to annual
increases based upon the change in the Consumer Price Index. The lease expires June 30, 2040.
The following is a schedule, by year, of future minimum lease payments under capital and
noncancelable operating leases together with the present value of net minimum capital lease
payments as of June 30, 2016:
(in thousands of dollars) Capital Operating
Year Ending Leases Leases
2017 263$ 3,888$
2018 209 3,731
2019 120 2,624
2020 121 2,523
2021 123 1,998
Thereafter 329 5,002
Total minimum lease payments 1,165 19,766$
Less: Amount representing interest (195)
Present value of net minimum lease payments 970$
Operating lease expense for the rental of property and equipment for the years ended June 30,
2016 and 2015 was approximately $5,732,000 and $6,349,000, respectively. At June 30, 2016
and 2015, gross assets under capital leases included in capital assets were approximately
$1,562,000. Accumulated amortization on capital leases as of June 30, 2016 and 2015 was
approximately $601,000 and $408,000, respectively.
Shands Teaching Hospital and Clinics, Inc. and Subsidiaries Notes to Consolidated Basic Financial Statements June 30, 2016 and 2015
48
Commitments
Shands has contracts for the construction and renovation of facilities and equipment purchases. As
of June 30, 2016, the remaining commitments relating to these contracts were approximately
$155,644,000 (Note 6).
Shands has contracts for the maintenance of computer application software for its core operating
systems. As of June 30, 2016, the remaining commitments relating to these contracts were
approximately $7,222,000.
Risk Management and Professional Liabilities
Shands is exposed to various risks of loss from torts; theft of, damage to, and destruction of assets;
business interruption; errors and omissions; employee injuries and illnesses; natural disasters;
medical malpractice; and employee health, dental, and accident benefits. Commercial insurance
coverage is purchased for claims arising from such matters in excess of self-insured limits. Settled
claims have not exceeded this commercial coverage for the years ended June 30, 2016 and 2015.
Effective July 1, 2011, Shands was granted sovereign immunity under the provision of Chapter
2011-114, Laws of Florida, and further codified in 768.28(2), Florida Statutes. As such, recovery in
tort actions arising subsequent to June 30, 2011 was limited to $100,000 for any one person for
one incident and all recovery related to one incident was limited to a total of $200,000. Effective
October 1, 2011, the limits increased to $200,000 for any one person for one incident and
$300,000 in total for one incident.
Shands participates with other health care providers in the University of Florida J. Hillis Miller
Health Center Self-Insurance Program (“UFSIP”). UFSIP is an operating unit of the Board of
Governors of the State of Florida (“FBOG”). UFSIP provides medical malpractice and general
liability occurrence-based coverage to Shands. Insurance in excess of the coverage provided by
UFSIP is provided by the University of Florida Healthcare Education Insurance Company
(“UFHEIC”). UFHEIC is wholly-owned by FBOG. UFHEIC provides coverage to Shands on a
claims reported basis. UFHEIC obtains reinsurance for a substantial portion of the insurance
coverage that it provides to the participants in its insurance program. The policies between UFSIP
and UFHEIC and Shands are not retrospectively rated. The costs incurred by Shands related to
these policies are expensed in the period that coverage is provided.
Shands could be subject to malpractice claims in excess of insurance coverage through UFSIP or
UFHEIC; however, the estimated potential loss, if any, cannot be estimated. Management of
Shands is not aware of any potential uninsured losses that could materially affect the consolidated
financial position of Shands.
Health Insurance
Shands participates with other related party employers controlled by UF including Shands
Jacksonville Medical Center (“SJMC”), University of Florida Foundation, Inc. (“UF Foundation”),
UFICO, and other eligible employees of the University of Florida in “GatorCare”, a premium based
plan, to provide health and pharmaceutical coverage to its employees. GatorCare Health
Management Corporation (“GCHMC”) was incorporated to coordinate and facilitate the
management of GatorCare. Premium amounts collected by GCHMC are determined by the level of
benefits coverage selected by each employee and to cover administrative costs of the plan. Cash
held by GCHMC is largely restricted for payments of health and pharmacy claims of Shands and
the related party employers, with the remaining cash available to cover the administrative functions
of GCHMC.
Shands Teaching Hospital and Clinics, Inc. and Subsidiaries Notes to Consolidated Basic Financial Statements June 30, 2016 and 2015
49
Expenses net of employee contributions related to the health and pharmaceutical plan for the years
ended June 30, 2016 and 2015 were approximately $68,577,000 and $67,452,000, respectively.
In addition, Shands provides certain other postemployment benefits (“OPEB”) for approximately
1,300 eligible active and retired employees through the Shands Retiree Medical Plan. Many of
Shands’ employees may become eligible for those benefits if they reach retirement age while
working for Shands. OPEB expense was approximately $462,000 and $427,000 for the years
ended June 30, 2016 and 2015, respectively. At June 30, 2016 and 2015, the net OPEB obligation
of approximately $3,260,000 and $2,798,000, respectively, is included in other liabilities in the
accompanying consolidated basic statements of net position.
Workers’ Compensation Insurance
Shands is self-insured for workers’ compensation up to $600,000 per occurrence for the years
ended June 30, 2016 and 2015. Shands has purchased excess coverage from a commercial
carrier up to the amount allowed by Florida Statutes. Total workers’ compensation expenses for
the years ended June 30, 2016 and 2015 were approximately $1,567,000 and $1,078,000,
respectively.
Litigation
Shands is involved in litigation arising in the normal course of business. After consultation with
legal counsel, management believes that these matters will be resolved without material adverse
effect on Shands’ future financial position or results of operations.
Other Industry Risks
The health care industry is subject to numerous laws and regulations of federal, state, and local
governments. Compliance with these laws and regulations can be subject to government review
and interpretation, as well as regulatory actions unknown and unasserted at this time. Federal
government activity has increased with respect to investigations and allegations concerning
possible violations by health care providers of regulations, which could result in the imposition of
significant fines and penalties, as well as significant repayments of previously billed and collected
revenue from patient services. There have also been numerous lawsuits filed against nonprofit
hospitals related to charity care. These lawsuits allege various hospital practices related to the
uninsured, including, among other things, charging uninsured patients more than what insurers
would pay for the same services, rapidly rising prices, and aggressive collection policies.
Management believes that Shands is in compliance with current laws and regulations and that
Shands’ ultimate exposure from any such matters would not have a material effect on Shands’
consolidated basic financial statements.
11. Transactions with Related Parties
Shands has various agreements for services provided by UF for support of the educational, clinical,
and research activities of the College of Medicine, maintenance, security, utilities, and various
services. Expenses related to these agreements were approximately $176,494,000 and
$170,720,000 for the years ended June 30, 2016 and 2015, respectively, of which approximately
$63,416,000 and $66,533,000 for the years ended June 30, 2016 and 2015, respectively, are
transfers and expenditures in support of UF and its medical programs included under this caption in
the accompanying consolidated basic statements of revenues, expenses and changes in net
position. At June 30, 2016 and 2015, approximately $10,204,000 and $12,925,000, respectively,
was owed to UF under these agreements and is included in accounts payable and accrued
expenses in the accompanying consolidated basic statements of net position.
Shands Teaching Hospital and Clinics, Inc. and Subsidiaries Notes to Consolidated Basic Financial Statements June 30, 2016 and 2015
50
Shands provides contracted services at cost to UF for support of the clinical and research activities
of the College of Medicine, maintenance, utilities, telephone communication, and various other
services. The amount credited against expenses for these contracted services was approximately
$91,582,000 and $82,600,000 for the years ended June 30, 2016 and 2015, respectively. At
June 30, 2016 and 2015, approximately $7,510,000 and $5,565,000, respectively, was owed to
Shands under these agreements and is included in prepaid expenses and other current assets in
the accompanying consolidated basic statements of net position.
Shands has an agreement whereby UF provides billing services for emergency room physician
fees. UF remits the collections to Shands on a monthly basis less an administrative fee. The
amount collected by UF on Shands’ behalf less the administrative fee for the years ended June 30,
2016 and 2015 was approximately $12,384,000 and $11,862,000, respectively. At June 30, 2016
and 2015, approximately $1,224,000 and $1,725,000, respectively, was owed to Shands and is
included in prepaid expenses and other current assets in the accompanying consolidated basic
statements of net position.
Shands has an investment management agreement with UFICO to manage a portion of its
investments. UFICO was created by the UF Trustees for the purpose of managing assets held by
UF and its related corporations. As of June 30, 2016 and 2015, the fair value of investments
managed by UFICO on Shands’ behalf was approximately $427,084,000 and $412,267,000,
respectively. Investment management fees of approximately $454,000 and $350,000 were
incurred for the years ended June 30, 2016 and 2015, respectively.
Shands provides contracted services at cost to SJMC for administrative and information technology
support services. The amount credited against expenses for these contracted services was
approximately $6,686,000 and $7,089,000 for the years ended June 30, 2016 and 2015,
respectively. At June 30, 2016 and 2015, approximately $455,000 and $567,000, respectively, was
owed to Shands under these agreements and is included in prepaid expenses and other current
assets in the accompanying consolidated basic statements of net position.
SJMC provides organ procurement services for Shands. Expenses related to these services were
approximately $490,000 and $538,000 for the years ended June 30, 2016 and 2015, respectively.
At June 30, 2016 and 2015, Shands had a note receivable of approximately $17,071,000 and
$35,777,000, respectively, due from SJMC. The current portion of the note receivable of
approximately $855,000 and $1,636,000 is included within prepaid expenses and other current
assets and the long-term portion of the note receivable of approximately $16,216,000 and
$34,141,000 at June 30, 2016 and 2015, respectively, is included within other assets in the
accompanying consolidated basic statements of net position. The original note amount was
approximately $42,276,000 to be paid in quarterly installments of approximately $805,000 including
interest of 4.5%, maturing on October 1, 2030. The quarterly payment due July 1, 2015 was made,
leaving a net balance receivable of approximately $35,375,000. On September 30, 2015, after
assessment of each organization’s financial position, Shands’ Board of Directors agreed to reduce
the note receivable due from SJMC by approximately $17,688,000, effective July 1, 2015.
Beginning with the payment due on October 1, 2015, quarterly installments of principal and interest
will be approximately $402,000, with the interest rate and maturity date remaining unchanged. The
reduction in the note receivable of $17,688,000 was recorded in other transfers in the
accompanying consolidated basic statements of revenues, expenses, and changes in net position.
Shands Teaching Hospital and Clinics, Inc. and Subsidiaries Notes to Consolidated Basic Financial Statements June 30, 2016 and 2015
51
At June 30, 2015, Shands had a receivable of approximately $6,149,000 due from SJMC for its
share of electronic medical record system implementation costs which was included within prepaid
expenses and other current assets in the consolidated basic statements of net position. In
September 2015, an interest rate of 3% was applied to the monthly amounts outstanding from July
2011 through June 2015. In September 2015, Shands recognized interest income of approximately
$1,584,000 from inception through June 2015. The outstanding balance of the receivable and
corresponding interest was repaid in full by June 2016.
GCHMC collects monthly premiums from Shands for health and pharmacy insurance coverage for
eligible employees. GCHMC pays the health and pharmacy claims on behalf of Shands. Premium
expense for the years ended June 30, 2016 and 2015 was approximately $77,492,000 and
$75,892,000, respectively. At June 30, 2016 and 2015, approximately $8,651,000 and $852,000,
respectively, was due from GCHMC and is included in other assets in the accompanying
consolidated basic statements of net position.
Shands provides administrative services to GCHMC. The amount credited against expenses for
these contracted services for the years ended June 30, 2016 and 2015 was approximately
$741,000 and $282,000, respectively. At June 30, 2016 and 2015, approximately $165,000 and
$113,000, respectively, was owed to Shands and is included in prepaid expenses and other current
assets in the accompanying consolidated basic statements of net position.
Shands provides pharmacy discounts to GCHMC beginning October 2015. The discounts for the
year ended June 30, 2016 were approximately $241,000. At June 30, 2016, approximately
$83,000 was owed to GCHMC and is included in accounts payable and accrued expenses in the
accompanying consolidated basic statements of net position.
Shands leases medical and administrative space from Innovation Square. Expense associated
with the leased space was approximately $342,000 and $327,000 for the years ended June 30,
2016 and 2015, respectively.
Shands entered into a three year pledge commitment to donate $7,500,000 to the UF Foundation
towards the construction of a UF medical education building. Pledge payments of $2,000,000
annually were made during 2015 and 2014 and $3,500,000 during 2013.
12. Concentrations of Credit Risk
Shands grants credit without collateral to its patients, many of whom are local residents and are
insured under third-party payor agreements. Shands does not charge interest on accounts
receivable. The composition of receivables from patients and third-party payors is as follows:
2016 2015
Medicare (includes HMOs) 28.4% 28.7%
Medicaid (includes HMOs) 18.9% 19.4%
Blue Cross 15.1% 14.9%
Commercial 5.7% 4.9%
Managed Care 24.3% 25.6%
Other third-party payors 7.2% 6.3%
Patients 0.4% 0.2%
100.0% 100.0%
Shands Teaching Hospital and Clinics, Inc. and Subsidiaries Notes to Consolidated Basic Financial Statements June 30, 2016 and 2015
52
Concentrations of credit risk with respect to patient accounts receivable are limited to Medicare,
Medicaid and various commercial payors.
Shands places its cash and cash equivalents with what management believes to be high-quality
financial institutions and thus limits its credit exposure. Shands has deposits in excess of the
federal insured amount of $250,000. Management does not anticipate nonperformance risk by the
financial institutions.
13. Subsequent Events
Shands has assessed the impact of subsequent events through September 20, 2016, the date the
audited consolidated basic financial statements were issued, and has concluded that there were no
such events that require adjustment to the consolidated basic financial statements or disclosure in
the notes to the consolidated basic financial statements.
Shands Teaching Hospital and Clinics, Inc. and Subsidiaries Schedule of Changes in the Net Pension Liability and Related Ratios (Unaudited) June 30, 2016 and 2015
53
(in thousands of dollars) 2016 2015
Total pension liability
Service cost -$ -$
Interest 55,119 53,701
Changes of benefit terms - -
Differences between expected and actual experience 402 149
Changes of assumptions 79,285 2,689
Benefit payments (42,722) (35,351)
Net change in total pension liability 92,084 21,188
Total pension liability – beginning 781,620 760,432
Total pension liability – ending (a) 873,704$ 781,620$
Plan fiduciary net position
Employer contributions 23,736$ 35,758$
Net investment income 27,578 124,555
Benefit payments (42,722) (35,351)
Administrative expense (6,770) (5,790)
Net change in plan fiduciary net position 1,822 119,172
Plan fiduciary net position – beginning 835,869 716,697
Plan fiduciary net position – ending (b) 837,691$ 835,869$
Net pension liability (asset) – ending (a)-(b) 36,013$ (54,249)$
Plan fiduciary net position as a percentage of total pension liability 95.88% 106.94%
Covered employee payroll 292,099$ 304,720$
Net pension liability (asset) as a percentage of covered employee payroll 12.33% (17.8%)
Notes to Schedule
Changes of assumptions 2016:
The investment return assumption was decreased from 7.25% to 6.50% to reflect the updated capital
market outlook.
The cost of living assumption ultimate rate was decreased from 2.5% to 2.0%.
The mortality assumption was updated to the RP2014 mortality tables with future mortality improvement that
follows the Mercer Modified MP2014 mortality improvement scale.
Retirement rates and withdrawal rates were updated based on the results of an experience study performed
in 2015.
Changes of assumptions 2015:
The interest credit ultimate rate was changed from 3.83% to 4.10%.
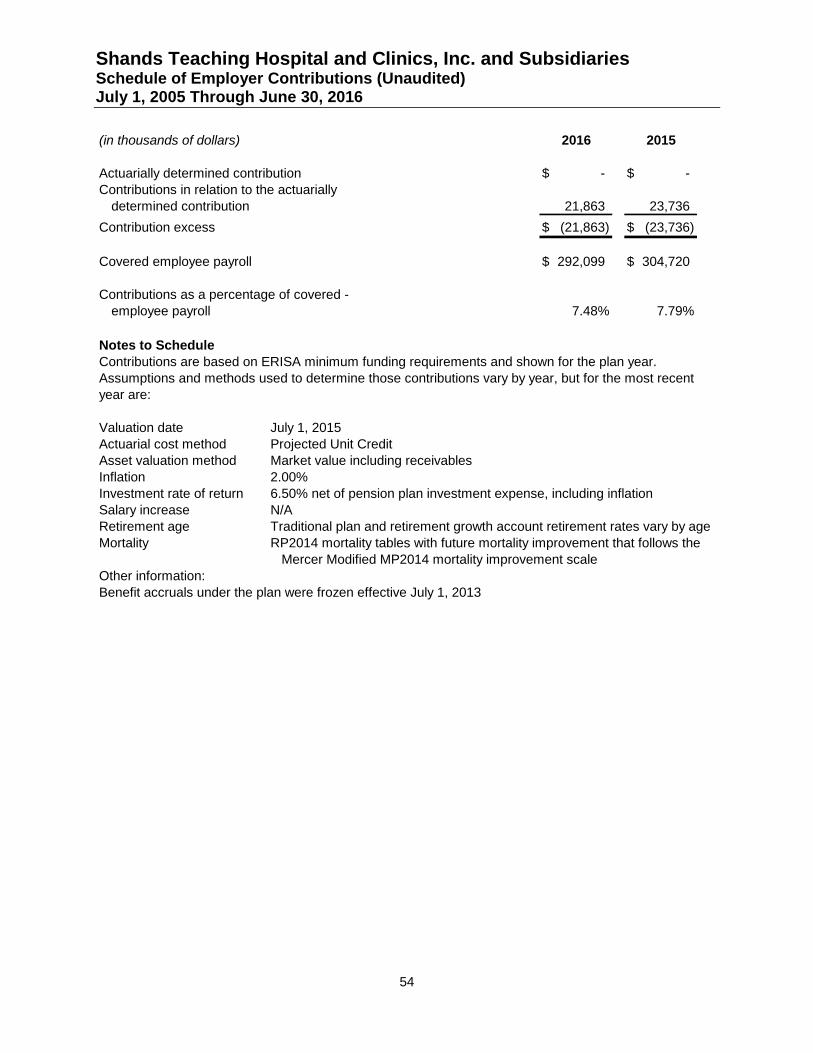
Shands Teaching Hospital and Clinics, Inc. and Subsidiaries Schedule of Employer Contributions (Unaudited) July 1, 2005 Through June 30, 2016
54
(in thousands of dollars) 2016 2015
Actuarially determined contribution -$ -$
Contributions in relation to the actuarially
determined contribution 21,863 23,736
Contribution excess (21,863)$ (23,736)$
Covered employee payroll 292,099$ 304,720$
Contributions as a percentage of covered -
employee payroll 7.48% 7.79%
Notes to Schedule
Contributions are based on ERISA minimum funding requirements and shown for the plan year.
Assumptions and methods used to determine those contributions vary by year, but for the most recent
year are:
Valuation date July 1, 2015
Actuarial cost method Projected Unit Credit
Asset valuation method Market value including receivables
Inflation 2.00%
Investment rate of return 6.50% net of pension plan investment expense, including inflation
Salary increase N/A
Retirement age Traditional plan and retirement growth account retirement rates vary by age
Mortality RP2014 mortality tables with future mortality improvement that follows the
Mercer Modified MP2014 mortality improvement scale
Other information:
Benefit accruals under the plan were frozen effective July 1, 2013
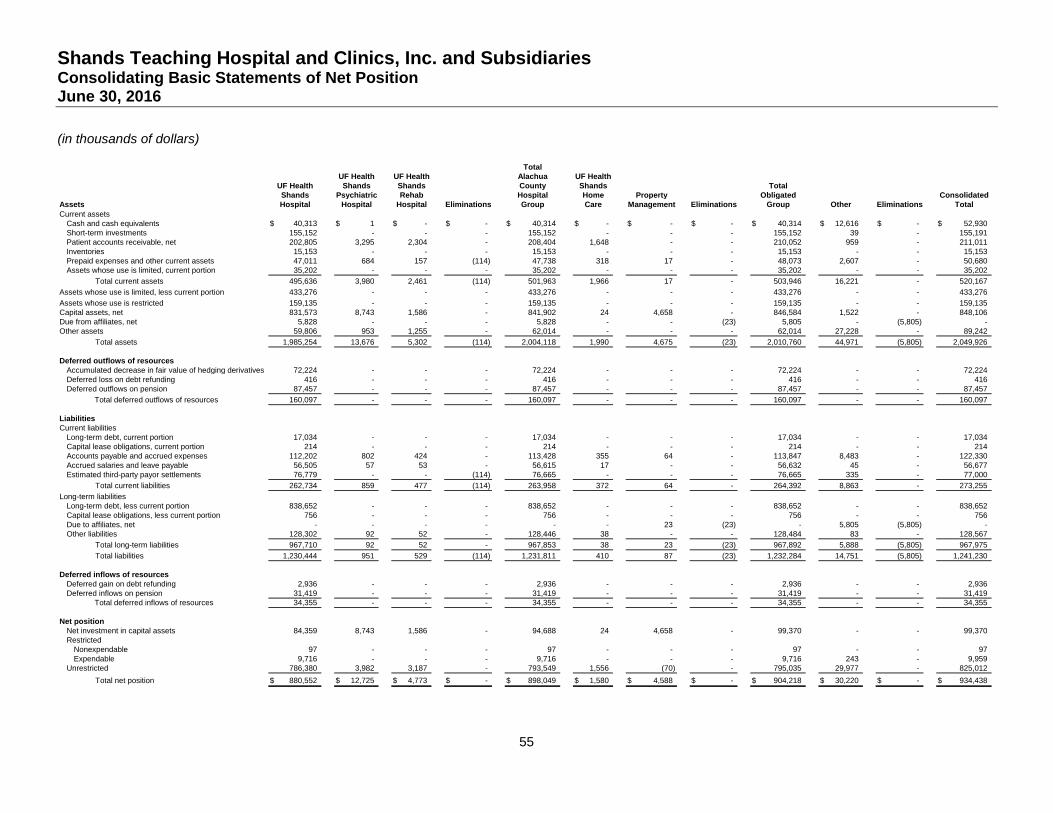
Shands Teaching Hospital and Clinics, Inc. and Subsidiaries Consolidating Basic Statements of Net Position June 30, 2016
(in thousands of dollars)
55
Total
UF Health UF Health Alachua UF Health
UF Health Shands Shands County Shands Total
Shands Psychiatric Rehab Hospital Home Property Obligated Consolidated
Assets Hospital Hospital Hospital Eliminations Group Care Management Eliminations Group Other Eliminations Total
Current assets
Cash and cash equivalents 40,313$ 1$ -$ -$ 40,314$ -$ -$ -$ 40,314$ 12,616$ -$ 52,930$
Short-term investments 155,152 - - - 155,152 - - - 155,152 39 - 155,191
Patient accounts receivable, net 202,805 3,295 2,304 - 208,404 1,648 - - 210,052 959 - 211,011
Inventories 15,153 - - - 15,153 - - - 15,153 - - 15,153
Prepaid expenses and other current assets 47,011 684 157 (114) 47,738 318 17 - 48,073 2,607 - 50,680
Assets whose use is limited, current portion 35,202 - - - 35,202 - - - 35,202 - - 35,202
Total current assets 495,636 3,980 2,461 (114) 501,963 1,966 17 - 503,946 16,221 - 520,167
Assets whose use is limited, less current portion 433,276 - - - 433,276 - - - 433,276 - - 433,276
Assets whose use is restricted 159,135 - - - 159,135 - - - 159,135 - - 159,135
Capital assets, net 831,573 8,743 1,586 - 841,902 24 4,658 - 846,584 1,522 - 848,106
Due from affiliates, net 5,828 - - - 5,828 - - (23) 5,805 - (5,805) -
Other assets 59,806 953 1,255 - 62,014 - - - 62,014 27,228 - 89,242
Total assets 1,985,254 13,676 5,302 (114) 2,004,118 1,990 4,675 (23) 2,010,760 44,971 (5,805) 2,049,926
Deferred outflows of resources
Accumulated decrease in fair value of hedging derivatives 72,224 - - - 72,224 - - - 72,224 - - 72,224
Deferred loss on debt refunding 416 - - - 416 - - - 416 - - 416
Deferred outflows on pension 87,457 - - - 87,457 - - - 87,457 - - 87,457
Total deferred outflows of resources 160,097 - - - 160,097 - - - 160,097 - - 160,097
Liabilities
Current liabilities
Long-term debt, current portion 17,034 - - - 17,034 - - - 17,034 - - 17,034
Capital lease obligations, current portion 214 - - - 214 - - - 214 - - 214
Accounts payable and accrued expenses 112,202 802 424 - 113,428 355 64 - 113,847 8,483 - 122,330
Accrued salaries and leave payable 56,505 57 53 - 56,615 17 - - 56,632 45 - 56,677
Estimated third-party payor settlements 76,779 - - (114) 76,665 - - - 76,665 335 - 77,000
Total current liabilities 262,734 859 477 (114) 263,958 372 64 - 264,392 8,863 - 273,255
Long-term liabilities
Long-term debt, less current portion 838,652 - - - 838,652 - - - 838,652 - - 838,652
Capital lease obligations, less current portion 756 - - - 756 - - - 756 - - 756
Due to affiliates, net - - - - - - 23 (23) - 5,805 (5,805) -
Other liabilities 128,302 92 52 - 128,446 38 - - 128,484 83 - 128,567
Total long-term liabilities 967,710 92 52 - 967,853 38 23 (23) 967,892 5,888 (5,805) 967,975
Total liabilities 1,230,444 951 529 (114) 1,231,811 410 87 (23) 1,232,284 14,751 (5,805) 1,241,230
Deferred inflows of resources
Deferred gain on debt refunding 2,936 - - - 2,936 - - - 2,936 - - 2,936
Deferred inflows on pension 31,419 - - - 31,419 - - - 31,419 - - 31,419
Total deferred inflows of resources 34,355 - - - 34,355 - - - 34,355 - - 34,355
Net position
Net investment in capital assets 84,359 8,743 1,586 - 94,688 24 4,658 - 99,370 - - 99,370
Restricted
Nonexpendable 97 - - - 97 - - - 97 - - 97
Expendable 9,716 - - - 9,716 - - - 9,716 243 - 9,959
Unrestricted 786,380 3,982 3,187 - 793,549 1,556 (70) - 795,035 29,977 - 825,012
Total net position 880,552$ 12,725$ 4,773$ -$ 898,049$ 1,580$ 4,588$ -$ 904,218$ 30,220$ -$ 934,438$
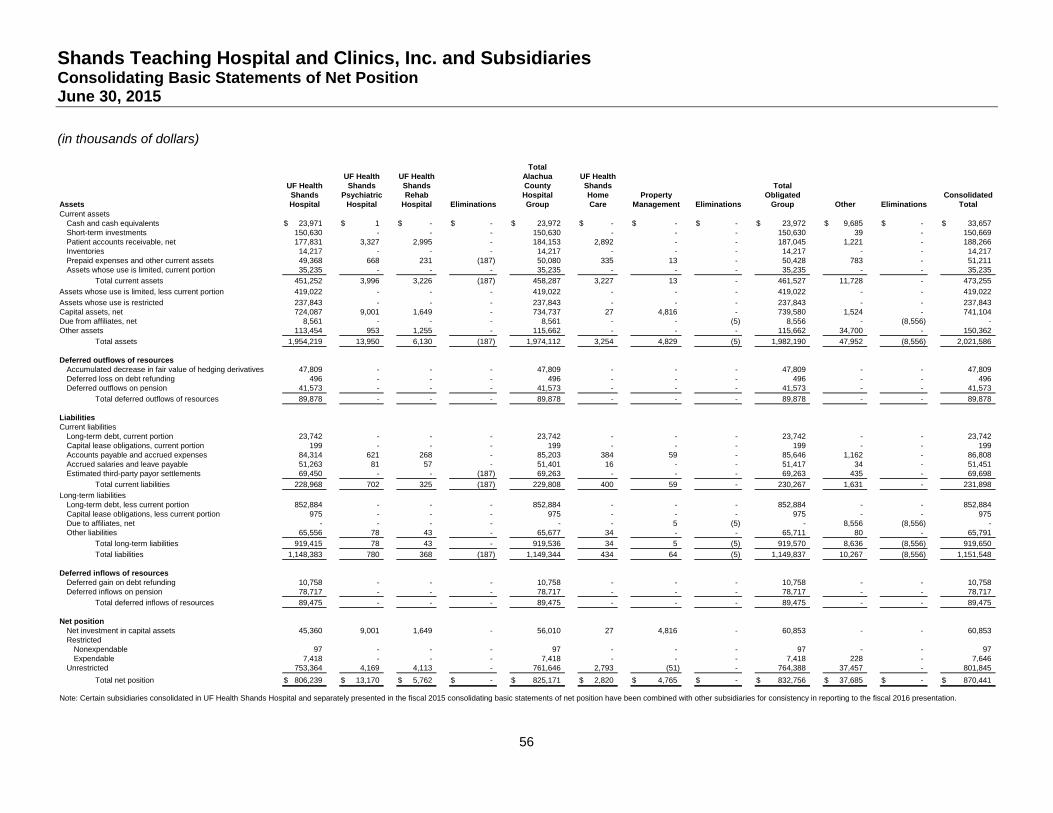
Shands Teaching Hospital and Clinics, Inc. and Subsidiaries Consolidating Basic Statements of Net Position June 30, 2015
(in thousands of dollars)
56
Total
UF Health UF Health Alachua UF Health
UF Health Shands Shands County Shands Total
Shands Psychiatric Rehab Hospital Home Property Obligated Consolidated
Assets Hospital Hospital Hospital Eliminations Group Care Management Eliminations Group Other Eliminations Total
Current assets
Cash and cash equivalents 23,971$ 1$ -$ -$ 23,972$ -$ -$ -$ 23,972$ 9,685$ -$ 33,657$
Short-term investments 150,630 - - - 150,630 - - - 150,630 39 - 150,669
Patient accounts receivable, net 177,831 3,327 2,995 - 184,153 2,892 - - 187,045 1,221 - 188,266
Inventories 14,217 - - - 14,217 - - - 14,217 - - 14,217
Prepaid expenses and other current assets 49,368 668 231 (187) 50,080 335 13 - 50,428 783 - 51,211
Assets whose use is limited, current portion 35,235 - - - 35,235 - - - 35,235 - - 35,235
Total current assets 451,252 3,996 3,226 (187) 458,287 3,227 13 - 461,527 11,728 - 473,255
Assets whose use is limited, less current portion 419,022 - - - 419,022 - - - 419,022 - - 419,022
Assets whose use is restricted 237,843 - - - 237,843 - - - 237,843 - - 237,843
Capital assets, net 724,087 9,001 1,649 - 734,737 27 4,816 - 739,580 1,524 - 741,104
Due from affiliates, net 8,561 - - - 8,561 - - (5) 8,556 - (8,556) -
Other assets 113,454 953 1,255 - 115,662 - - - 115,662 34,700 - 150,362
Total assets 1,954,219 13,950 6,130 (187) 1,974,112 3,254 4,829 (5) 1,982,190 47,952 (8,556) 2,021,586
Deferred outflows of resources
Accumulated decrease in fair value of hedging derivatives 47,809 - - - 47,809 - - - 47,809 - - 47,809
Deferred loss on debt refunding 496 - - - 496 - - - 496 - - 496
Deferred outflows on pension 41,573 - - - 41,573 - - - 41,573 - - 41,573
Total deferred outflows of resources 89,878 - - - 89,878 - - - 89,878 - - 89,878
Liabilities
Current liabilities
Long-term debt, current portion 23,742 - - - 23,742 - - - 23,742 - - 23,742
Capital lease obligations, current portion 199 - - - 199 - - - 199 - - 199
Accounts payable and accrued expenses 84,314 621 268 - 85,203 384 59 - 85,646 1,162 - 86,808
Accrued salaries and leave payable 51,263 81 57 - 51,401 16 - - 51,417 34 - 51,451
Estimated third-party payor settlements 69,450 - - (187) 69,263 - - - 69,263 435 - 69,698
Total current liabilities 228,968 702 325 (187) 229,808 400 59 - 230,267 1,631 - 231,898
Long-term liabilities
Long-term debt, less current portion 852,884 - - - 852,884 - - - 852,884 - - 852,884
Capital lease obligations, less current portion 975 - - - 975 - - - 975 - - 975
Due to affiliates, net - - - - - - 5 (5) - 8,556 (8,556) -
Other liabilities 65,556 78 43 - 65,677 34 - - 65,711 80 - 65,791
Total long-term liabilities 919,415 78 43 - 919,536 34 5 (5) 919,570 8,636 (8,556) 919,650
Total liabilities 1,148,383 780 368 (187) 1,149,344 434 64 (5) 1,149,837 10,267 (8,556) 1,151,548
Deferred inflows of resources
Deferred gain on debt refunding 10,758 - - - 10,758 - - - 10,758 - - 10,758
Deferred inflows on pension 78,717 - - - 78,717 - - - 78,717 - - 78,717
Total deferred inflows of resources 89,475 - - - 89,475 - - - 89,475 - - 89,475
Net position
Net investment in capital assets 45,360 9,001 1,649 - 56,010 27 4,816 - 60,853 - - 60,853
Restricted
Nonexpendable 97 - - - 97 - - - 97 - - 97
Expendable 7,418 - - - 7,418 - - - 7,418 228 - 7,646
Unrestricted 753,364 4,169 4,113 - 761,646 2,793 (51) - 764,388 37,457 - 801,845
Total net position 806,239$ 13,170$ 5,762$ -$ 825,171$ 2,820$ 4,765$ -$ 832,756$ 37,685$ -$ 870,441$
Note: Certain subsidiaries consolidated in UF Health Shands Hospital and separately presented in the fiscal 2015 consolidating basic statements of net position have been combined with other subsidiaries for consistency in reporting to the fiscal 2016 presentation.
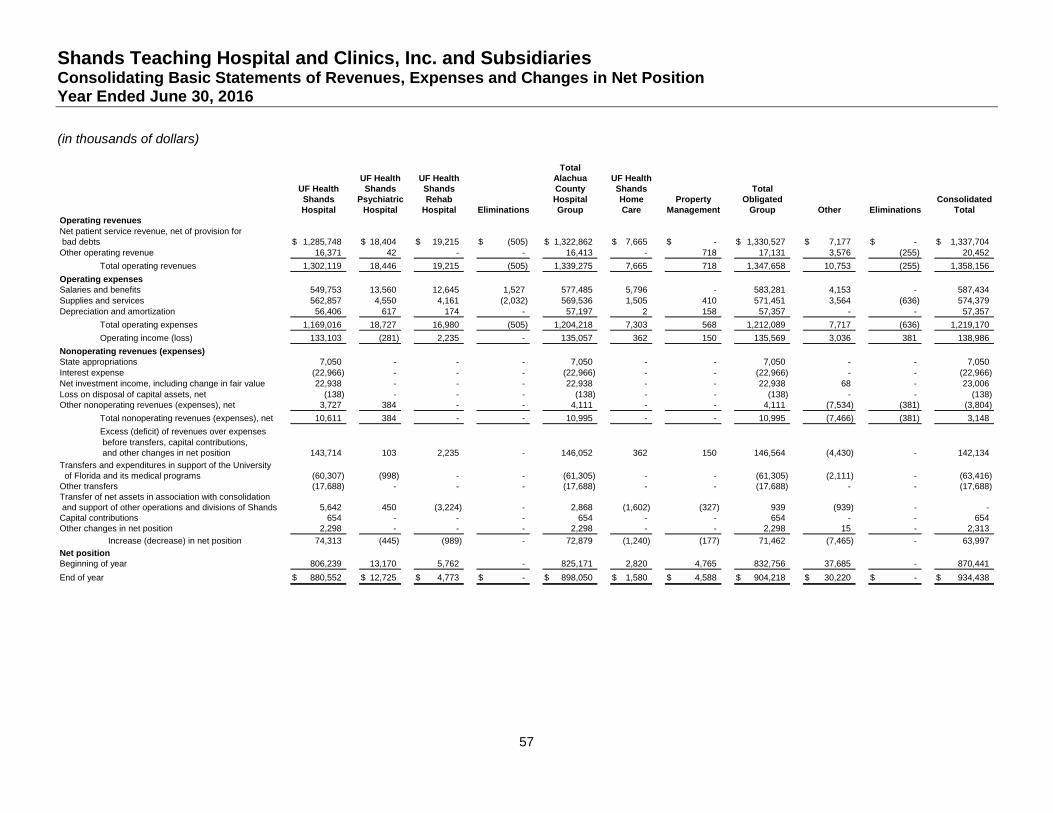
Shands Teaching Hospital and Clinics, Inc. and Subsidiaries Consolidating Basic Statements of Revenues, Expenses and Changes in Net Position Year Ended June 30, 2016
(in thousands of dollars)
57
Total
UF Health UF Health Alachua UF Health
UF Health Shands Shands County Shands Total
Shands Psychiatric Rehab Hospital Home Property Obligated Consolidated
Hospital Hospital Hospital Eliminations Group Care Management Group Other Eliminations Total
Operating revenues
Net patient service revenue, net of provision for
bad debts 1,285,748$ 18,404$ 19,215$ (505)$ 1,322,862$ 7,665$ -$ 1,330,527$ 7,177$ -$ 1,337,704$
Other operating revenue 16,371 42 - - 16,413 - 718 17,131 3,576 (255) 20,452
Total operating revenues 1,302,119 18,446 19,215 (505) 1,339,275 7,665 718 1,347,658 10,753 (255) 1,358,156
Operating expenses
Salaries and benefits 549,753 13,560 12,645 1,527 577,485 5,796 - 583,281 4,153 - 587,434
Supplies and services 562,857 4,550 4,161 (2,032) 569,536 1,505 410 571,451 3,564 (636) 574,379
Depreciation and amortization 56,406 617 174 - 57,197 2 158 57,357 - - 57,357
Total operating expenses 1,169,016 18,727 16,980 (505) 1,204,218 7,303 568 1,212,089 7,717 (636) 1,219,170
Operating income (loss) 133,103 (281) 2,235 - 135,057 362 150 135,569 3,036 381 138,986
Nonoperating revenues (expenses)
State appropriations 7,050 - - - 7,050 - - 7,050 - - 7,050
Interest expense (22,966) - - - (22,966) - - (22,966) - - (22,966)
Net investment income, including change in fair value 22,938 - - - 22,938 - - 22,938 68 - 23,006
Loss on disposal of capital assets, net (138) - - - (138) - - (138) - - (138)
Other nonoperating revenues (expenses), net 3,727 384 - - 4,111 - - 4,111 (7,534) (381) (3,804)
Total nonoperating revenues (expenses), net 10,611 384 - - 10,995 - - 10,995 (7,466) (381) 3,148
Excess (deficit) of revenues over expenses
before transfers, capital contributions,
and other changes in net position 143,714 103 2,235 - 146,052 362 150 146,564 (4,430) - 142,134
Transfers and expenditures in support of the University
of Florida and its medical programs (60,307) (998) - - (61,305) - - (61,305) (2,111) - (63,416)
Other transfers (17,688) - - - (17,688) - - (17,688) - - (17,688)
Transfer of net assets in association with consolidation
and support of other operations and divisions of Shands 5,642 450 (3,224) - 2,868 (1,602) (327) 939 (939) - -
Capital contributions 654 - - - 654 - - 654 - - 654
Other changes in net position 2,298 - - - 2,298 - - 2,298 15 - 2,313
Increase (decrease) in net position 74,313 (445) (989) - 72,879 (1,240) (177) 71,462 (7,465) - 63,997
Net position
Beginning of year 806,239 13,170 5,762 - 825,171 2,820 4,765 832,756 37,685 - 870,441
End of year 880,552$ 12,725$ 4,773$ -$ 898,050$ 1,580$ 4,588$ 904,218$ 30,220$ -$ 934,438$
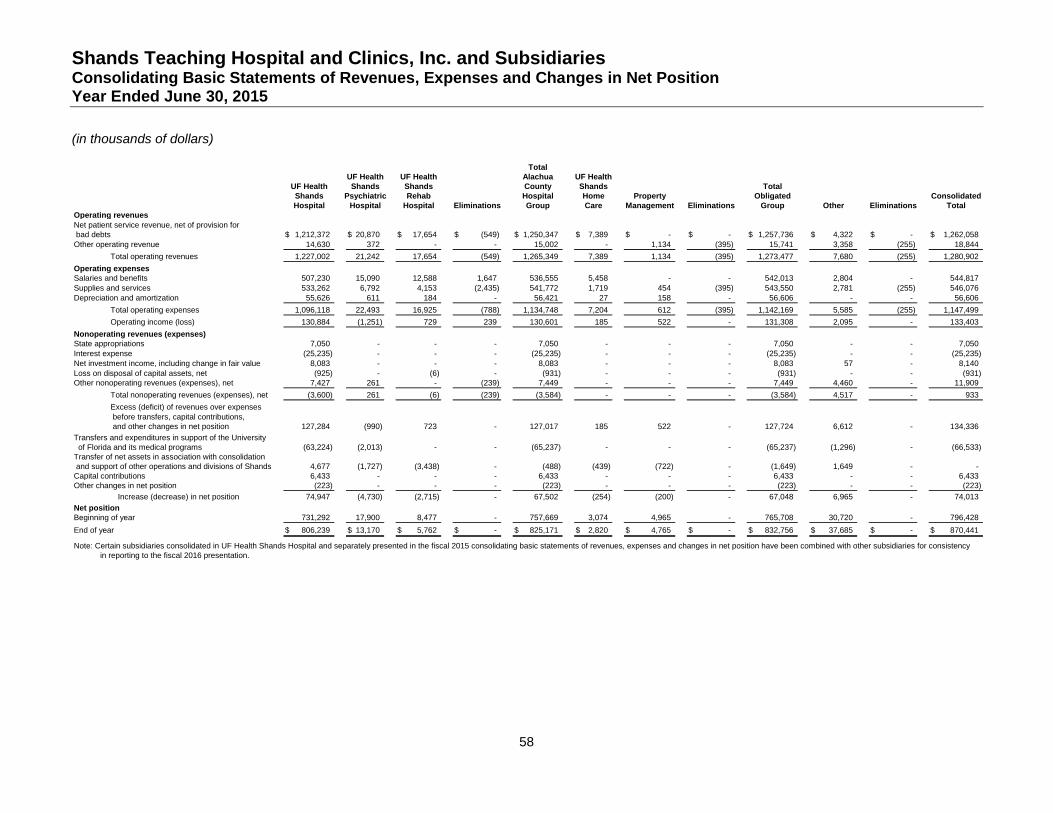
Shands Teaching Hospital and Clinics, Inc. and Subsidiaries Consolidating Basic Statements of Revenues, Expenses and Changes in Net Position Year Ended June 30, 2015
(in thousands of dollars)
58
Total
UF Health UF Health Alachua UF Health
UF Health Shands Shands County Shands Total
Shands Psychiatric Rehab Hospital Home Property Obligated Consolidated
Hospital Hospital Hospital Eliminations Group Care Management Eliminations Group Other Eliminations Total
Operating revenues
Net patient service revenue, net of provision for
bad debts 1,212,372$ 20,870$ 17,654$ (549)$ 1,250,347$ 7,389$ -$ -$ 1,257,736$ 4,322$ -$ 1,262,058$
Other operating revenue 14,630 372 - - 15,002 - 1,134 (395) 15,741 3,358 (255) 18,844
Total operating revenues 1,227,002 21,242 17,654 (549) 1,265,349 7,389 1,134 (395) 1,273,477 7,680 (255) 1,280,902
Operating expenses
Salaries and benefits 507,230 15,090 12,588 1,647 536,555 5,458 - - 542,013 2,804 - 544,817
Supplies and services 533,262 6,792 4,153 (2,435) 541,772 1,719 454 (395) 543,550 2,781 (255) 546,076
Depreciation and amortization 55,626 611 184 - 56,421 27 158 - 56,606 - - 56,606
Total operating expenses 1,096,118 22,493 16,925 (788) 1,134,748 7,204 612 (395) 1,142,169 5,585 (255) 1,147,499
Operating income (loss) 130,884 (1,251) 729 239 130,601 185 522 - 131,308 2,095 - 133,403
Nonoperating revenues (expenses)
State appropriations 7,050 - - - 7,050 - - - 7,050 - - 7,050
Interest expense (25,235) - - - (25,235) - - - (25,235) - - (25,235)
Net investment income, including change in fair value 8,083 - - - 8,083 - - - 8,083 57 - 8,140
Loss on disposal of capital assets, net (925) - (6) - (931) - - - (931) - - (931)
Other nonoperating revenues (expenses), net 7,427 261 - (239) 7,449 - - - 7,449 4,460 - 11,909
Total nonoperating revenues (expenses), net (3,600) 261 (6) (239) (3,584) - - - (3,584) 4,517 - 933
Excess (deficit) of revenues over expenses
before transfers, capital contributions,
and other changes in net position 127,284 (990) 723 - 127,017 185 522 - 127,724 6,612 - 134,336
Transfers and expenditures in support of the University
of Florida and its medical programs (63,224) (2,013) - - (65,237) - - - (65,237) (1,296) - (66,533)
Transfer of net assets in association with consolidation
and support of other operations and divisions of Shands 4,677 (1,727) (3,438) - (488) (439) (722) - (1,649) 1,649 - -
Capital contributions 6,433 - - - 6,433 - - - 6,433 - - 6,433
Other changes in net position (223) - - - (223) - - - (223) - - (223)
Increase (decrease) in net position 74,947 (4,730) (2,715) - 67,502 (254) (200) - 67,048 6,965 - 74,013
Net position
Beginning of year 731,292 17,900 8,477 - 757,669 3,074 4,965 - 765,708 30,720 - 796,428
End of year 806,239$ 13,170$ 5,762$ -$ 825,171$ 2,820$ 4,765$ -$ 832,756$ 37,685$ -$ 870,441$
Note: Certain subsidiaries consolidated in UF Health Shands Hospital and separately presented in the fiscal 2015 consolidating basic statements of revenues, expenses and changes in net position have been combined with other subsidiaries for consistency
in reporting to the fiscal 2016 presentation.