Shale Oil Final Presentation
73
SHALE OIL: Exploration and Development Presented By: Justin Brady, Laura Kerr, Mike Potts Senior Capstone Project Spring 2006
Transcript of Shale Oil Final Presentation

SHALE OIL: Exploration and Development
Presented By: Justin Brady, Laura Kerr, Mike Potts
Senior Capstone Project
Spring 2006

Current Energy Crisis
• World’s main source of energy: Petroleum
• Demand exceeding supply
– April 17, 2006: Oil reaches $70/barrel
• Opportunity to develop alternate energy sources– Large economic incentive

Why Shale Oil?
• Currently, United Arab Emirates hold 50% of world’s known oil reserves
How much does the US hold?
2%
How many reserves would be added from developing oil shale?
2 TRILLION BARRELS
•Result: US takes over as leader in the world in oil reserves.

Outline• Introduction to Shale Oil• Project Statement• Subsurface Operations
– Reservoir Temperature Profiles– Heating– Freeze Walls– Reservoir Composition Analysis
• Surface Facilities– Oil/Gas Processing– Power Plant
• Pipelines to Market• Production Schedule• Economics and Risk

Shale Oil: Definition• Sedimentary rock
with a high organic content– Organic matter is
known as kerogen
• Kerogen:– MWavg.=3000– Approximate formula
C200H300SN5O111
1. Feng H.Y. Rates Of Pyrolysis Of Colorado shale oil. p. 732. American Institute Of Chemical Engineers Journal . Vol. 31 No. 5. 1985.

Shale Oil: History in the US
• Office of Naval Petroleum and Shale Oil Reserves formed in 1912
• First Demonstration mine opened outside of Rifle, Colorado just after World War II

Shale Oil: History in the US• TOSCO opened an experimental mine and
production plant near Parachute, Colorado in 1960’s
• Exxon opens Colony II project outside of Parachute, Colorado in 1980– Colony Project is closed in May of 1982 – Nearly 2,200 people unemployed – Loss of more than $900 million.

Project Statement• Determine which method of production of
shale oil is the most feasible.
• Analyze production process to determine– Subsurface designs– Reservoir characteristics– Surface processing facilities– Scheduling of project– Pipelines
• Perform an economic analysis on project.

Shale Oil Production Methods
Above Ground Retorting
• Mining of ore• Well known technology• Large environmental
impact– Popcorn effect– Large open mines– Emissions
In-SituConversion
• Underground conversion
• Research in progress• Lower environmental
impact• Not commercially proven

In-Situ Conversion• Currently being explored by Shell Oil
with the Mahogany Project.
• Entails the heating of kerogen in the ground and extracting the produced hydrocarbons for further processing.

In-Situ Process Overview
• Step 1: Heating– Conversion of kerogen
to oil and gas
• Step 2: Freeze Wall Construction and Water Removal– Impermeable wall
around production site– Prevents large
environmental impact1. Mut, Stephen. The Potential of Oil Shale. 8/20/05

In-Situ Process Overview
• Step 3: Production– Products from kerogen
conversion
• Step 4: Processing and Transportation– Oil and gas separation
– Pipelines to market

Schedule Table
site preparation: drilling wells, freeze wall formation, water removal
heating only
Production: refrigeration and heating continues
water injection
site reclamation

Reservoir Temperature Profile• Unsteady state 1D
temperature profile• Profile created for
– Heater to heater 60 feet apart (25 heaters/acre)1
– Heat given off by reaction accounted for
– Initial Reservoir temperature 150oF
1. Bartis et. al. Oil Shale Development in the United States. Rand Santa Monica, California: 2005 p. 50.

Reservoir Temperature Profile• Heat balance on reservoir
qz
Tk
t
TC p −
∂∂=
∂∂
2
2
ρ
1. Guerin, Gilles 2000. Acoustic and Thermal Characterization of Oil Migration, Gas Hydrates Formation and Silica Diagenesis, PhD. Thesis, Columbia University
• Concentration due to cracking
kRT
Ek CAe
dt
dC a )(−
−=
Accumulation Conduction Generation
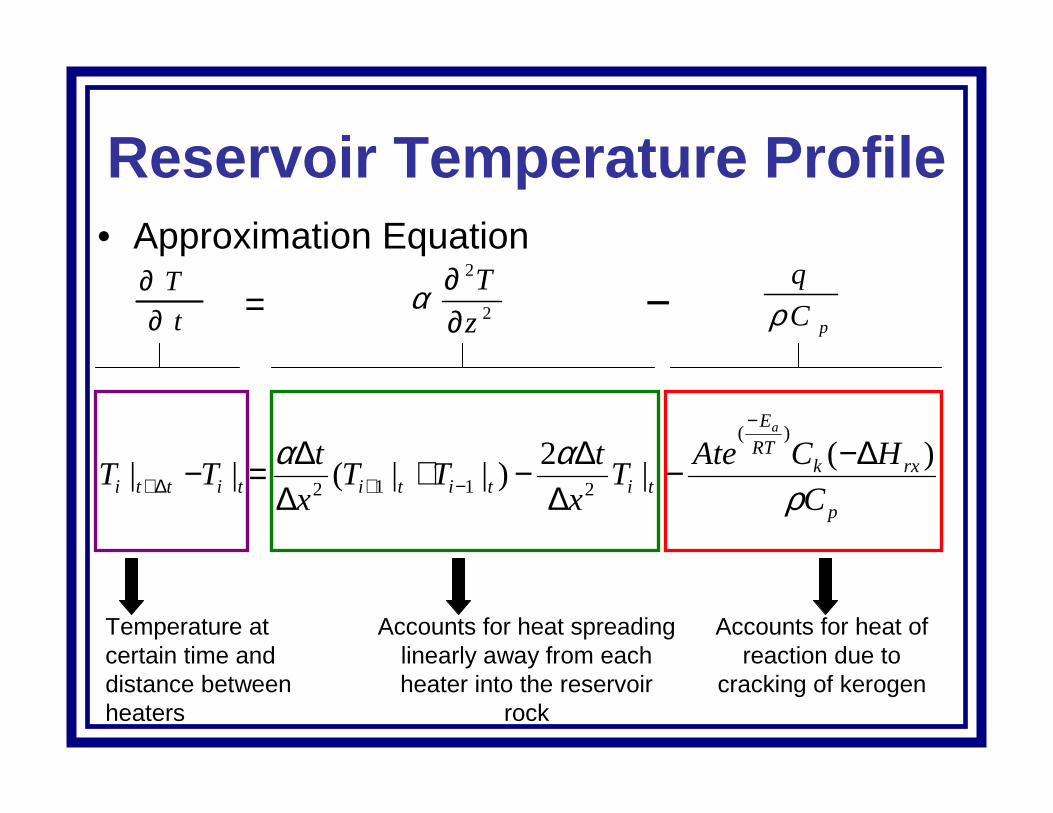
Reservoir Temperature Profile• Approximation Equation
p
rxkRT
E
tititititti C
HCAteT
x
tTT
x
tTT
a
ραα )(
|2
)||(||
)(
2112
∆−−∆
∆−+∆
∆=−
−
−+∆+
Accounts for heat of reaction due to
cracking of kerogen
Accounts for heat spreading linearly away from each heater into the reservoir
rock
Temperature at certain time and distance between heaters
t
T
∂∂
= 2
2
z
T
∂∂α
pC
q
ρ−

Reservoir Temperature Profile Assumptions
• Thermal diffusivity assumed constant
• Models only include periods of time when no fluid flow is occurring in reservoir
• Heaters assumed to be in a hexagonal pattern in the earth
• Heat generation from reaction is calculated from average kinetic values of kerogen cracking
• Heat lost to overburden by heaters not considered

Temperature vs. Reservoir Distance:Heat of Reaction Included
0.0
200.0
400.0
600.0
800.0
1000.0
1200.0
1400.0
1600.0
0.0 10.0 20.0 30.0 40.0 50.0 60.0
Distance (ft)
Tem
pera
ture
(F)
3.5yr 21 months 3 year Beginning of heating 10.5 months
Reservoir Temperature Profile
Takes 3.1 years to start production of the well in the center of the heaters.

Temperature vs. Reservoir Distance
0.0
200.0
400.0
600.0
800.0
1000.0
1200.0
1400.0
1600.0
0.0 10.0 20.0 30.0 40.0 50.0 60.0
Distance (ft)
Tem
pera
ture
(F)
3.5yr 21 months 3 year Beginning of heating 10.5 months
Reservoir Temperature Profile: No Heat from Reaction
Takes 3.3 years to start production of the well in the center of the heaters.
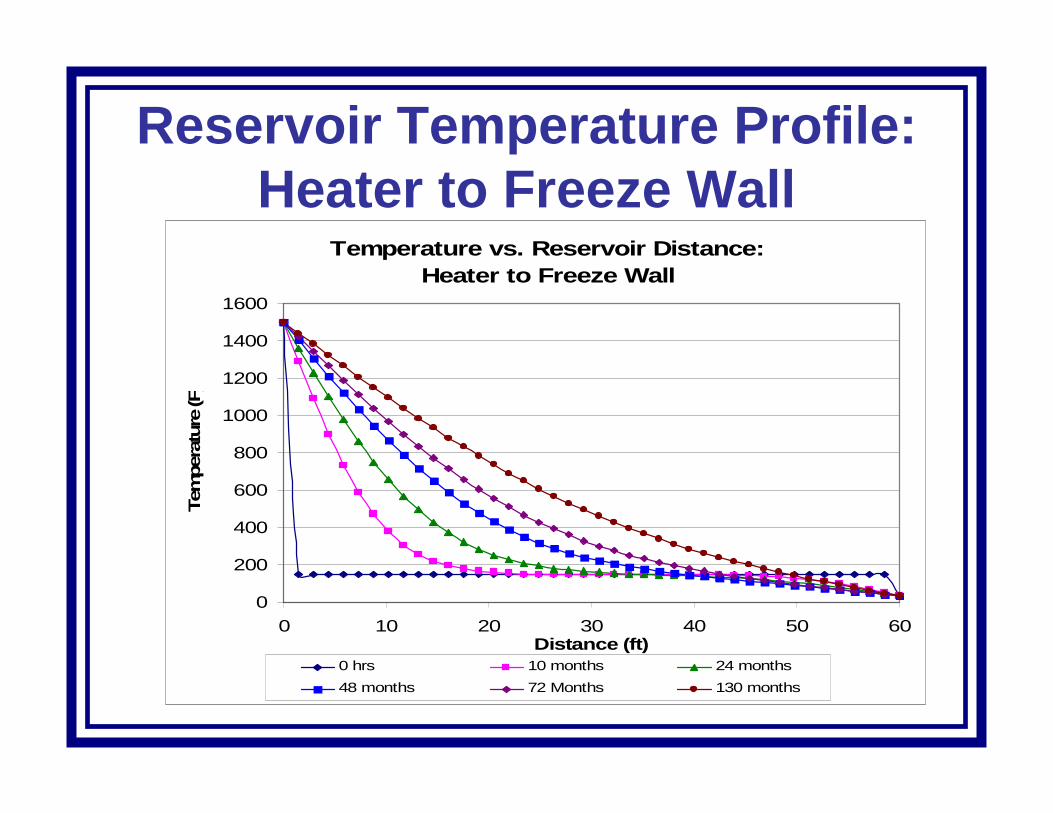
Reservoir Temperature Profile:Heater to Freeze Wall
Temperature vs. Reservoir Distance: Heater to Freeze Wall
0
200
400
600
800
1000
1200
1400
1600
0 10 20 30 40 50 60Distance (ft)
Tem
pera
ture
(F)
0 hrs 10 months 24 months
48 months 72 Months 130 months

2D Reservoir Temperature Profile
• Developed using ANSYS
• Initial reservoir temperature 150oF
• Freeze walls included as boundary condition.
30 ft 30 ft30 ft 30 ft
Production wellHeater


Shale Oil: Subsurface Operations
• Drilling costs
• Refrigeration costs
• Pumping costs
• Heating costs

Drilling Costs
• Consists of wells for heaters and producers– 250 wells for heaters per 10 acre plot
– 80 producer wells
• Total well costs of $26.4 million.– $80,0002 per well.
2. Brown, Randy. Field Engineer XAE inc.

Freeze Wall Construction• Constructed of
double wall pipes placed 8 ft. apart
• Calcium chloride brine at -10 degrees F is circulated.
• Water in the soil freezes creating an impermeable barrier.
*Soil freeze technologies

Freeze Wall: Duty & Costs
WQ K 10*0.5 6=
waterfreezing M*)(** ∆Η+−= initialfinalp TTCMQ
zTkQ ∂
∂−=
Purchase cost for 5.0*106 KW of refrigeration1: $12.5 million
Operating Cost2: $3.2 million per day
1. Peters et al p.894 fig. B-72. Peters et al p.898 table B-1
During freezing:
During production:
KWQ 7.8=

Pumping
• Ground water trapped within freeze wall
• Must be removed to prevent contamination
Heaters
500 ft, Shale
2000 ft, Overburden
Producing well
Ground water

Pumping Costs• A pump is needed to remove water
from within the freeze wall.– 2 barrels of water for every barrel of oil6
– Pumps must handle 1.6 million gallons per hour to remove the water in 2 weeks.
• Centrifugal pumps• 80 pumps, $23,000 per pump7
• $120,000 electricity needed per day
6. Bartis et. al. Oil Shale Development in the United States. p. 50. Rand Santa Monica, California: 20057. Peters et. al. Plant Design And Economics For Chemical Engineers. P. 516, Mcgraw-Hill: New York 2003.
Heating: Challenges
• Challenges– Regulated at a constant temperature
– Must operate at high temperatures– Must have a large power output.

Heating: Solution
Overburden
Shale
Heaters
Supporting casing
•Electric heaters lowered to the bottom of well hole
•Extends the entire length of the shale layer
2000 ft
500 ft
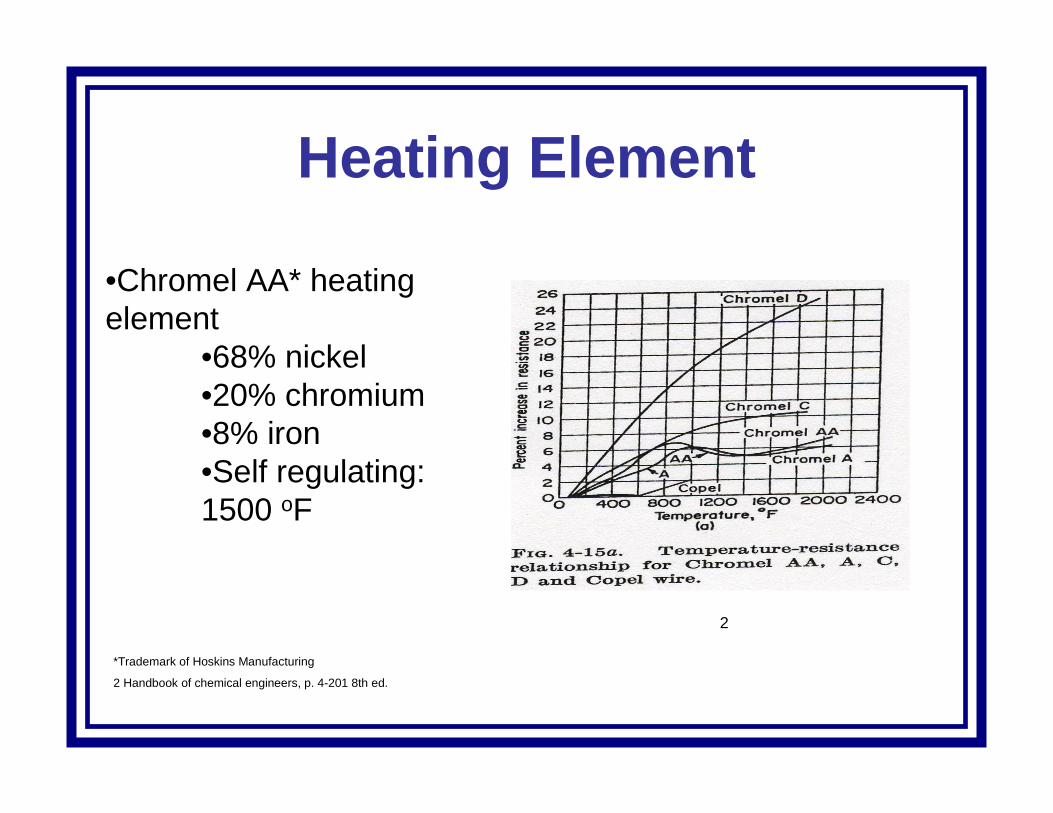
Heating Element
•Chromel AA* heating element
•68% nickel•20% chromium•8% iron•Self regulating: 1500 oF
*Trademark of Hoskins Manufacturing
2 Handbook of chemical engineers, p. 4-201 8th ed.
2

Heater Design
Heating Element
Electrical Insulator
Steel Casing
6”
.5”
6”
10’
•Cylindrical design
•Electric heating element suspended in the center.
•Spaced from the casing by electrical insulators

Heater DesignHeating Element
Ceramic Insulator
Steel Casing
.5”
6.625”

Heating Costs
Electrical• 165 KW per heater• Operating at 480 V AC
and 350 amps• Electrical costs heating:
– $.08 per KW-hr4 $80,000 per day total
Materials• Steel Casing
– $10 per foot
• Heater element– $20 per foot
• Porcelain insulator– $14 each, 250 per
heater
• Total material cost: $80,000 per heater

Reservoir Composition Study• Heating process causes
cracking of kerogen.
• Estimation of composition of products in reservoir needed.
• A temperature profile is necessary for composition computation
• Ultimately, reservoir characteristics will allow design of processing facilities.

Reservoir Composition Model• Cracking process under
the earth– Kerogen:
• MWavg.=3000• Approximate formula
C200H300SN5O11
• Modeled using visbreaking model
• Using temperature profile, predicts concentrations of hydrocarbons in reservoir
Reaction depiction for thermal cracking 1
1. Castellanos, Julian. Visbreaking Yields. Encyclopedia of Chemical Processing and Design vol. 62. Marcel Dekker: New York. P411,

Composition Model
∑∑−
=+=
∗−=2
1,
2,
i
jji
n
ikikik
Si KCsCsKdt
dC
Example of hydrocarbon cracking
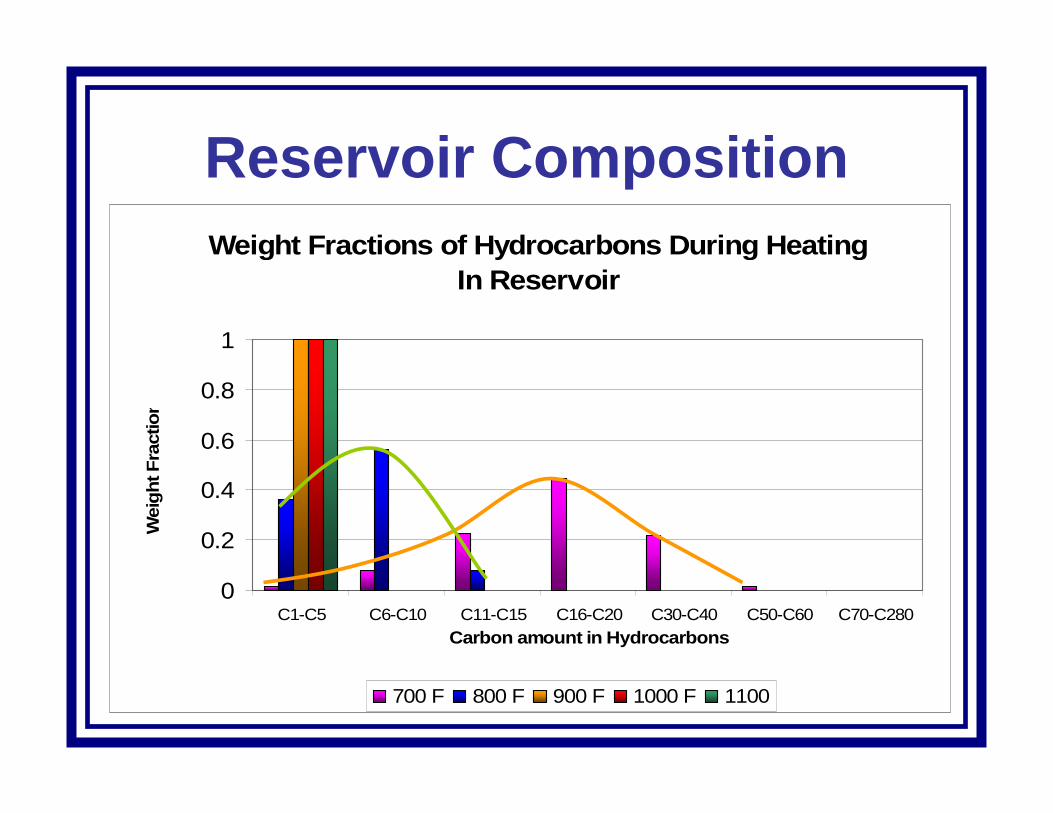
Reservoir CompositionWeight Fractions of Hydrocarbons During Heating
In Reservoir
0
0.2
0.4
0.6
0.8
1
C1-C5 C6-C10 C11-C15 C16-C20 C30-C40 C50-C60 C70-C280Carbon amount in Hydrocarbons
Wei
ght F
ract
ion
700 F 800 F 900 F 1000 F 1100

Problems With Composition Model
• Averaged K-Values must be used due to the large amounts of data
• Parameters are fit to laboratory data that may not be similar to reservoir
• Does not account for coking in reservoir
• Results are not close to reported results from experimental site

Suggested Solution for Composition Model
• Use a tool with a larger capacity than excel
• Use a model specifically developed to calculate products from kerogen– Example: Braun and Burnham’s model of
decomposition of kerogen

Oil Processing DesignSpecifications
Oil composition1. No significant sulfur content
2. Carbon solid from cracking is not produced
3. Heavy hydrocarbons are not produced
4. TBP curve of a sample light sweet crude oil is being used currently.
• Update with compositional model results
Production1. 20 acres produced from one
facility
2. Water treatment will function ¼of the time of the oil treatment
1. Bartis et. al. Oil Shale Development in the United States. p. 50. Rand Santa Monica, California: 2005

Oil Surface Facilities Considerations
• Elevation changes• High temperature fluid• Piping will be above
ground• Two different
transportation routes for oil and gas
• Some gas will be used for running electricity plant
Experimental project site

Oil Processing Skeleton Model
Oil Processing
Water processing

Oil Processing Facilities
•Inlet temperature= 680oF
•Inlet pressure= 1000psia
Separates C 1- C5 and from heavier products
Sent to Denver refinery for sale

Water Processing Facilities
Pumps water backInto well
•Inlet temperature = 680oF
•Inlet Pressure= 1000psia
To oil processing

Processing Facilities
• Future options for gas treatment– Create a gas plant on site
– Use ethane to make ethylene on site– LPG to market with oil
– Burn gas production for power generation

Power Plant Options
Nuclear Power Plant• Bad public opinion
• Low emissions
Gas Powered Plant• Methane is priced high
• Producing methane on sight
Coal Powered Plant• High emissions
• Coal supply needed

Power Plant• Combined Cycle
– Capital Cost, $500M
– Operating Cost, $60,000/day
– Natural Gas Required, 110M ft3
– Electricity Generated, 800 MW
– Efficiency, 57%
R.H. Kehlhofer, et al., Combined-Cycle Gas & Steam Turbine Power Plants

Gathering Pipelines• Well to Header
– 4” Schedule 80, Carbon Steel
– Oil & Gas• Header to Main
Gathering Pipe– 8” Schedule 80,
Carbon Steel– Oil & Gas
• Main Gathering Pipe to Processing Facility– 20” Schedule 80,
Carbon Steel– Oil & Gas
To further collection and processing
Producing wells surrounded by heaters
Header

Sell Pipelines
• Gas to/from Market– 8” Schedule 80, Carbon
Steel
• Oil to Market– 12” Schedule 80, Carbon
Steel
• Gas to Power Plant– 16” Schedule 80, Carbon
Steel

Pipeline CostsPipe Description Contents D (in) Schedule Length (ft) $/foot Total Cost
1. From Well Oil & Gas 4 80 400000 10$ 4,000,000$ 2. From 1 Acre Oil & Gas 8 80 100000 30$ 3,000,000$ 3. From 10 Acres Oil & Gas 20 80 1000 100$ 100,000$ 4. Crude Oil to Sell Oil 24 80 1188000 110$ 130,680,000$ 5. Gas to sell Gas 8 80 1188000 30$ 35,640,000$ 6. Gas to Power Plant Gas 10 80 10500 40$ 420,000$
1
1
23
5
6
4
Total Piping Cost= $173,840,000

Production Schedule
• Ten acre tracts
• 40,000 BPD per tract• A new tract every year

Schedule Table
site preparation: drilling wells, freeze wall formation, water removal
heating only
Production: refrigeration and heating continues
water injection
site reclamation
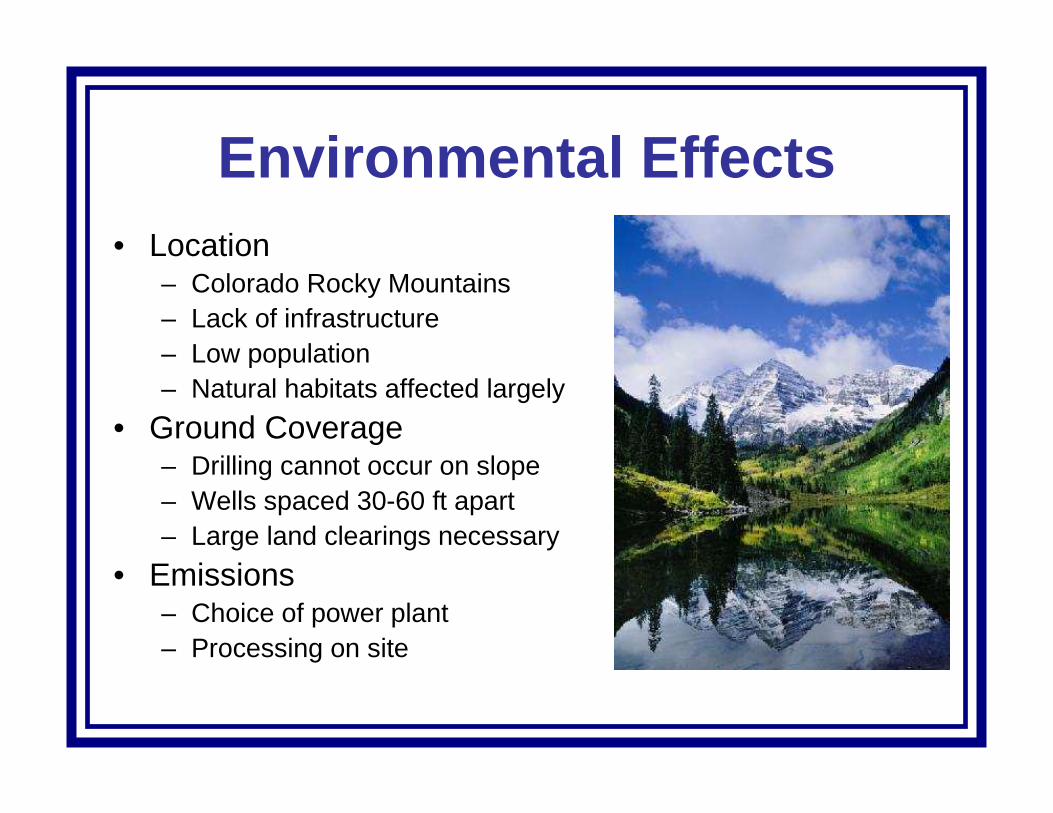
Environmental Effects• Location
– Colorado Rocky Mountains– Lack of infrastructure– Low population– Natural habitats affected largely
• Ground Coverage– Drilling cannot occur on slope– Wells spaced 30-60 ft apart– Large land clearings necessary
• Emissions– Choice of power plant– Processing on site

Crude Oil Price ForecastCrude Oil Forecasted Prices
(Price per Barrel, $US 2004)
$0.00
$10.00
$20.00
$30.00
$40.00
$50.00
$60.00
$70.00
$80.00
$90.00
2000 2005 2010 2015 2020 2025 2030 2035
Year
Dol
lars Most Likely
High
Low

Natural Gas Price ForecastNatural Gas Forecasted Prices
(Price per Thousand Cubic Feet, $US 2004)
$0.00
$1.00
$2.00
$3.00
$4.00
$5.00
$6.00
$7.00
$8.00
$9.00
2000 2005 2010 2015 2020 2025 2030 2035
Year
Dol
lars Most Likely
High
Low

Pricing Estimations• Includes
• Equipment costs• Heating• Cooling• Power Plant• Drilling• Production taxes• Operating costs
• Excludes• Logistical costs
• Extensive Road building
• Transporting materials• Relocating employees
• Research costs• Reclamation costs

Processing Equipment CostsComponent Basis of Estimation Cost
a. Heat Exchangers 5 @ $15,867 $80,000 b. Distillation D=3m, H=6m, 10 trays $87,000 c. Mixer #2 D=.508 $16,000 d. Mixer #1 D=.4572m $14,000 e. Flash #1 D=1m, H=10m $15,000 f. Pump .0544 m3/s, 6800 kPa $40,000 g. Pumps (piping) 2 w/ .151 m3/s, 1035 kPa $32,000 h. Heat Exchangers 3 w/ SA= 100 ft2 $3,600 i. Expander P=1932 kW $235,000 j. Expander #2 P=552 kW $105,000 k. Compressor 5800 kW, centrifugal-rotary $1,100,000
$1,727,600Processing Equipment Costs

Extraction Equipment Costs
$541,067,000 Extraction Equipment Costs$500,000,000.00
Combined Cycle, $400/kWhd. Power Plant
$1,840,000.0080, 1.6M gal/hr water, 2 weeksc. Pump
$12,500,000.00800 KW capacityb. Refrigeration plant
$25,000,000.0025/acre @ $100,000a. Heaters
CostBasis of
EstimationComponent
Total Capital Investment = $867 million

Component Basis for Estimate Cost Per Year
I. Manufacturing Cost A. Direct Production Costs 1. Raw Materials a. Cooling Water 178M lb/hr $0.08/1000kg $1,650,000 2. Operating Costs a. Drilling Costs (contract) $22,400,000 b. Operating Labor $2,000,000 c. Refrigeration $0.68 per KW $196,000,000
$220,400,000 3. Direct Supervision and Clerical 15% of Operating Labor $300,000 3. Utilities (Power Plant) a. Variable Operating Costs $86,500/day $31,572,500 b. Fixed Operating Costs $3.6M/year $3,600,000 4. Maintenance and Repair 7% of FCI $57,798,000 5. Operating Supplies 15% of Maintenance and Repair $8,670,000 6. Laboratory Charges 5% of Operating Labor $100,000 7. Patents not applicable $0 B. Fixed Charges 1. Capital Costs Straight Line Depreciation, 25 years $33,027,000 a. BLM Production Tax 12.5% of Gross $228,617,750 b. Insurance .7% of FCI $5,780,000 c. State Production Tax 1% of Gross $18,289,420 C. Overhead Costs 10% of the Total Product Cost $56,000,000
II. General Expenses A. Administration Costs 20% of Operating labor and maintenance $11,960,000
Total Annual Cost $677,800,000
Total
Annual Costs
Cost per barrel: $23.21

Profit Estimates
Input picture of cash flow position thing!!!!!
Payback period: 9.7 years
Cash Flow at 25 years: $9.7 billion
NPV at 8%: $1.5 billion
Return on Investment: 162%

Risk Assessment Distribution for NPV / Net Income/G30
Val
ues
in 1
0^ -
10
Values in Billions
0.000
0.500
1.000
1.500
2.000
2.500
Mean=1.485529E+09
-6 -4 -2 0 2 4 6 8 10-6 -4 -2 0 2 4 6 8 10
5% 90% 5% -1.4391 4.3723
Mean=1.485529E+09

Distribution for Total / ROI/F29
0.000
0.200
0.400
0.600
0.800
1.000
Mean=0.9269187
-2 -1 0 1 2 3 4-2 -1 0 1 2 3 4
5% 90% 5% -.1468 1.9868
Mean=0.9269187
Risk Assessment

Future Work• Logistics
– Transportation of materials– Drilling complications– Reclamation Process– Work Force
• Optimizations– Heater to heater distances– Heater temperature– Heater material– Composition of reservoir
• 3D temperature profile• Detailed project risk assessment

Questions?

Net Present Values: Varied Rates
Rate NPV (25 years)0.08 $1.5 billion0.10 $0.8 billion0.12 $0.4 billion0.15 $-0.1 billion
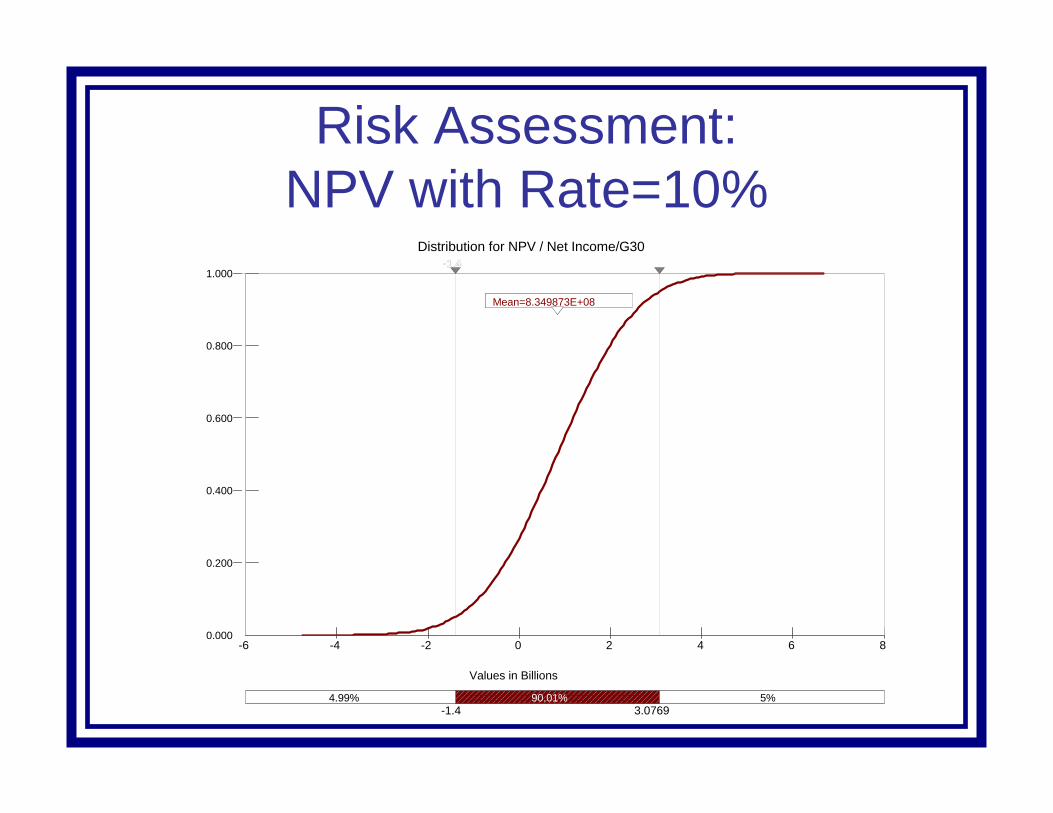
Risk Assessment:NPV with Rate=10%
Distribution for NPV / Net Income/G30
Values in Billions
0.000
0.200
0.400
0.600
0.800
1.000
Mean=8.349873E+08
-6 -4 -2 0 2 4 6 8
-1.4-1.4-1.4-1.4
-6 -4 -2 0 2 4 6 8
4.99% 90.01% 5% -1.4 3.0769
Mean=8.349873E+08 Mean=8.349873E+08

Risk Assessment:NPV with Rate=12%
Distribution for NPV / Net Income/G30
Values in Billions
0.000
0.200
0.400
0.600
0.800
1.000
Mean=3.687469E+08
-4 -3 -2 -1 0 1 2 3 4 5-4 -3 -2 -1 0 1 2 3 4 5
5% 90% 5% -1.3767 2.1075
Mean=3.687469E+08

Risk Assessment:NPV with Rate=15%
Distribution for NPV / Net Income/G30
Values in Billions
0.000
0.200
0.400
0.600
0.800
1.000
Mean=-1.012595E+08
-4 -3 -2 -1 0 1 2 3 4-4 -3 -2 -1 0 1 2 3 4
5% 90% 5% -1.3296 1.1296
Mean=-1.012595E+08

Temperature Profile: Affect of Thermal Diffusivity
Thermal Diffusivity vs. Time
0
20000
40000
60000
80000
100000
0.003 0.008 0.013
Thermal Diffusivity (ft^2/hr)
Tim
e (h
rs)
40 ft 50 ft 60 ft 30 ft 70 ft

Temperature Profile:Affect of Heater Distance
Heater Distance vs. Time
0
20000
40000
60000
80000
100000
25 35 45 55 65 75
Heater Distance (ft)
Tim
e (h
rs)
.004 ft̂ 2/hr .008 ft̂ 2/hr .016 ft̂ 2/hr

Reservoir Production: Fracturing
Reservoir
Heater
Water and Sand
Heater