Shaking Table Testing on a Column-Footing Model Papers/Chiou...Christchurch 6th International...
10
6 th International Conference on Earthquake Geotechnical Engineering 1-4 November 2015 Christchurch, New Zealand Shaking Table Testing on a Column-Footing Model J. Chiou 1 , C. Chen 2 , Y. Huang 3 and C. Chen 4 ABSTRACT In recent years, the foundation rocking mechanism was adopted in seismic design to isolate seismic waves for reducing the seismic demand. In this study, shaking table testing of a rocking- dominated column-footing model was performed to investigate the rocking effect on the dynamic behavior of a structure of this type under seismic loading. The model was a column of height of 80cm with a square footing of size 40cm×40cm. Vietnam sand was adopted for the soil specimen. Specific sinusoidal waves and historical earthquake records were selected for input motions. From the preliminary results of the testing, the rocking response of the footing could help reduce the dynamic amplification effect of the model. For the model under a small excitation, its acceleration response could be amplified, while upon the application of a larger excitation, its acceleration response was limited by the rotational capacity of the footing. However, too large shaking still would trigger another form of failure, such as foundation twisting. In addition, the experimental moment-rotation response of the footing was further compared with that deduced from cyclic pushover testing. The backbone curve of the moment-rotation response of the footing was similar to the capacity curve deduced from the pushover testing. The effective damping ratio in the dynamic testing was lower than in the pushover testing at the same rotation level. Introduction In Taiwan, spread footings are commonly used bridge foundations founded on a stiff stratum, such as gravel or rock. They are normally subjected to vertical loading, but when their superstructure is subjected to horizontal loading, such as seismic loading, they will have rotational displacements due to the induced moments at the column base. In recent years, seismic design has moved toward performance based design, in which a structure is designed to meet different performance requirements corresponding to different levels of design earthquakes from low seismic intensity to high seismic intensity. For the higher level of design earthquake, the footing may significantly rock to make the column base become quite flexible. The above foundation rocking effect in recent years was used in seismic design to isolate seismic waves for reducing the seismic demand (Gajan et al., 2005; Megro and Kawashima, 2005, AASHTO, 2009). However, foundation rocking may cause the soil around the edges of the footing to yield and settle and also result in adverse influence on the stability of structures. For instance, Shirato et al. (2008) had conducted large scale of shaking table testing for a structure model under different seismic and foundation embedment cases: in some cases the structure model was intact; in some cases the model had significant settlement and even in a case the model toppled. Therefore, it is necessary to conduct more studies to investigate the applicability of foundation rocking for the use in seismic isolation. To this end, this study designed a rocking-governed 1 Research Fellow, National Center for Research on Earthquake Engineering, Taipei, Taiwan, [email protected] 2 Assistant Researcher, National Center for Research on Earthquake Engineering, Taipei, Taiwan 3 Master Student, Department of Civil Engineering, National Taiwan University, Taipei, Taiwan 4 Professor, National Center for Research on Earthquake Engineering, Taipei, Taiwan
Transcript of Shaking Table Testing on a Column-Footing Model Papers/Chiou...Christchurch 6th International...

6th International Conference on Earthquake Geotechnical Engineering 1-4 November 2015 Christchurch, New Zealand
Shaking Table Testing on a Column-Footing Model
J. Chiou1, C. Chen2, Y. Huang3 and C. Chen4
ABSTRACT
In recent years, the foundation rocking mechanism was adopted in seismic design to isolate
seismic waves for reducing the seismic demand. In this study, shaking table testing of a rocking-dominated column-footing model was performed to investigate the rocking effect on the dynamic behavior of a structure of this type under seismic loading. The model was a column of height of 80cm with a square footing of size 40cm×40cm. Vietnam sand was adopted for the soil specimen. Specific sinusoidal waves and historical earthquake records were selected for input motions. From the preliminary results of the testing, the rocking response of the footing could help reduce the dynamic amplification effect of the model. For the model under a small excitation, its acceleration response could be amplified, while upon the application of a larger excitation, its acceleration response was limited by the rotational capacity of the footing. However, too large shaking still would trigger another form of failure, such as foundation twisting. In addition, the experimental moment-rotation response of the footing was further compared with that deduced from cyclic pushover testing. The backbone curve of the moment-rotation response of the footing was similar to the capacity curve deduced from the pushover testing. The effective damping ratio in the dynamic testing was lower than in the pushover testing at the same rotation level.
Introduction
In Taiwan, spread footings are commonly used bridge foundations founded on a stiff stratum, such as gravel or rock. They are normally subjected to vertical loading, but when their superstructure is subjected to horizontal loading, such as seismic loading, they will have rotational displacements due to the induced moments at the column base. In recent years, seismic design has moved toward performance based design, in which a structure is designed to meet different performance requirements corresponding to different levels of design earthquakes from low seismic intensity to high seismic intensity. For the higher level of design earthquake, the footing may significantly rock to make the column base become quite flexible. The above foundation rocking effect in recent years was used in seismic design to isolate seismic waves for reducing the seismic demand (Gajan et al., 2005; Megro and Kawashima, 2005, AASHTO, 2009). However, foundation rocking may cause the soil around the edges of the footing to yield and settle and also result in adverse influence on the stability of structures. For instance, Shirato et al. (2008) had conducted large scale of shaking table testing for a structure model under different seismic and foundation embedment cases: in some cases the structure model was intact; in some cases the model had significant settlement and even in a case the model toppled. Therefore, it is necessary to conduct more studies to investigate the applicability of foundation rocking for the use in seismic isolation. To this end, this study designed a rocking-governed 1 Research Fellow, National Center for Research on Earthquake Engineering, Taipei, Taiwan, [email protected] 2 Assistant Researcher, National Center for Research on Earthquake Engineering, Taipei, Taiwan 3 Master Student, Department of Civil Engineering, National Taiwan University, Taipei, Taiwan 4 Professor, National Center for Research on Earthquake Engineering, Taipei, Taiwan

column-footing model and conducted shaking table testing on it to investigate the seismic performance of this type of structure.
Model Design and Test Program A prototype condition that an 8m-high single column with a 4m×4m footing is situated on a 12m-thick sandy stratum was assumed. The length scaling factor of 10 was adopted and the model was designed as displayed in Figure 1, in which the height of the column was 80 cm, the size of the footing was 40cm×40cm and the weight of the model was 0.165 kN. Mass blocks of weight 0.905 kN were placed on the top of the column to simulate the weight of the structure. The weight of the whole model was 1.07 kN. Vietnam sand was used for the soil specimen and its basic properties are shown in Table 1. The sand was compacted to have the relative density of about 75% to model a stiff stratum. The mass density of the soil was 1.585 t/m3; the frictional angle of the soil estimated from plate load testing was about 39º; the shear modulus of the soil was about 14.6 MN/m2. The factor of safety of the footing was more than 23 (Chiou and Chen, 2014).
Figure 1. The column-footing model
Table 1. Physical properties of Vietnam sand
Property Value or Description Property Value or
Description D10 (mm) 0.17 Uniformity coefficient Cu 1.824
D30 (mm) 0.21 Coefficient of curvature Cc 0.837
D60 (mm) 0.31 Unified Soil Classification System SP
The arrangement of the shaking table testing is shown in Figure 2. The same column-footing was put on a laminar box developed at NCREE. The laminar shear box is composed of 15 layers of
40cm
80cm
5.4c
m8.9cm
Aluminum pipe 89mm,
t=3mm

sliding frames (Ueng et al., 2006). In the box, the soil specimen size is 1880 mm × 1880 mm × 1520 mm. These 15 layers of frames are separately supported on surrounding rigid steel walls, one above the other, with a vertical gap of 20 mm between adjacent layers, which can simulate the soil movement of a level ground subjected to horizontal seismic waves. On the top of the column attached the mass blocks.
Figure 2. Shaking table testing The setup of instrument sensors is displayed in Figure 3, including accelerometers, LDTs, and strain gauges. The accelerometers were used to measure the vertical and horizontal accelerations of the structure model and soil. The LDTs were used to measure the horizontal displacement of the frames of the shear box, representing the lateral movements of the soil. The strain gauges were attached on the column sides near the column base to measure the bending strains. The input motions were applied at the bottom of the shear box via the shaking table to simulate seismic loading. Three types of input motions were adopted, including white noise sweeping, sinusoid signals, and historical earthquake records. The amplitude and bandwidth of white noise waves adopted were 0.03g and 60Hz, respectively. The use of white noise sweeping is to identify the dynamic properties of the structure-foundation system and the soil layers. The frequencies of the input sinusoid waves were 1, 2, 4 and 6 Hz. Three historical earthquake records were adopted: Chi-Chi 921 Taiwan Earthquake (recorded at Stations TCU079 and TAP086), and Hualien 331 Taiwan Earthquake (recorded at Station TCU079). The 921 Earthquake was an inland earthquake. The records of TCU079 and TAP086 represented near-fault and far-fault motions, respectively. The 331 Earthquake was an offshore earthquake. TCU079 record represented a seismic motion near the epicenter. The acceleration response spectra of these records are displayed in Figure 4.

(a) (b)
Figure 3. Arrangement of instrument sensors: (a) side view, (b) top view
Figure 4. Normalized acceleration spectra of selected historical earthquake motions
Results White Noise Sweeping Using the horizontal accelerations at the bottom of the soil (AYBN) and the surface of the soil (AYGW) under the white noise wave, the transfer function between them (AYGW/AYBN) could be built as shown in Figure 5, indicating that the predominant frequency of the soil was about 20Hz. In the same way, the transfer function of the structure model using the horizontal accelerations at the surface of the soil (AYGW) and the top of the mass (AYM) was built as shown in Figure 6. From the figure, the predominant frequency of the structure model was about 3.9 Hz.
AXM, AYM, AZME, AZMW
PCBXAccelerometer
Strain gauge
AXBW, AYBN, AZB
LDT
X
Z
PCB3DX3
DX9PCB9
SG4 SG2SG1AXGN
DY9AY9
AY3, DY3
AZF4 AZF1
AXFC
PCBY
X
Y
AZF4 AZF1
AZF3
AYFC
AXFC
AZF2
AYGW, AZGW
AXGNPCB3DX3
DY3, AY3
0
0.5
1
1.5
2
2.5
3
3.5
4
4.5
5
0 0.5 1 1.5 2 2.5 3 3.5 4 4.5 5
Sa/P
GA
Period (sec)
921-TCU079921-TAP086331-TCU079
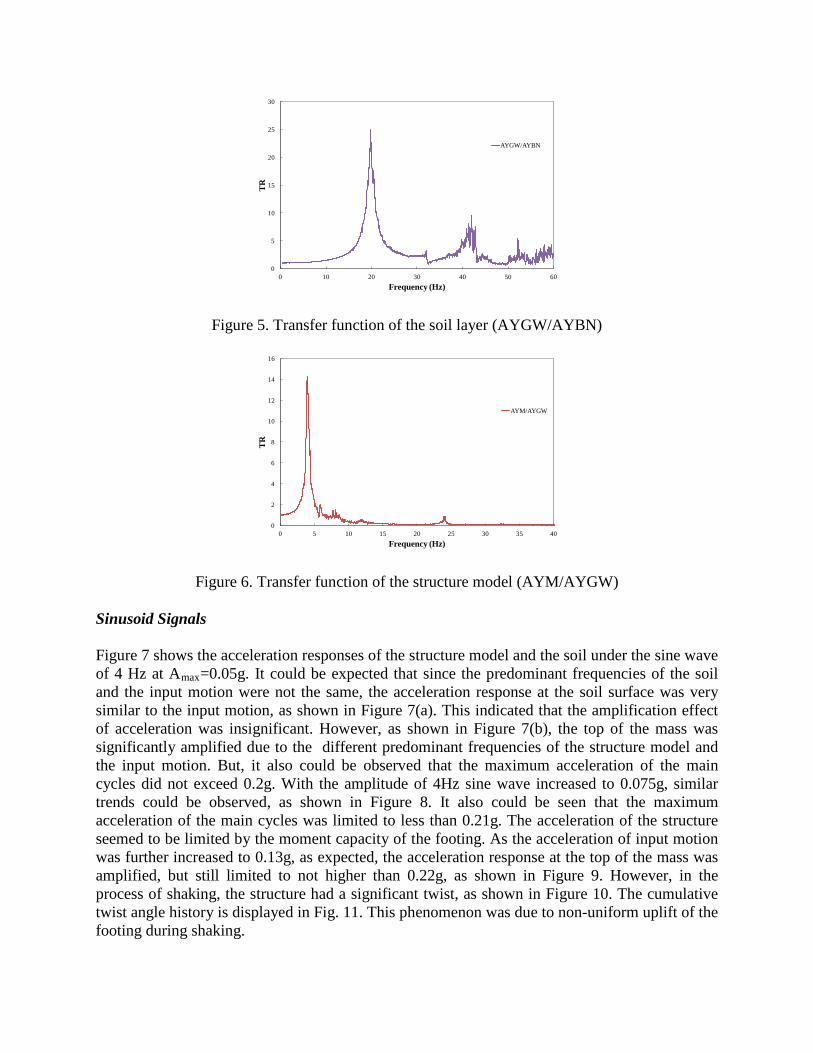
Figure 5. Transfer function of the soil layer (AYGW/AYBN)
Figure 6. Transfer function of the structure model (AYM/AYGW) Sinusoid Signals Figure 7 shows the acceleration responses of the structure model and the soil under the sine wave of 4 Hz at Amax=0.05g. It could be expected that since the predominant frequencies of the soil and the input motion were not the same, the acceleration response at the soil surface was very similar to the input motion, as shown in Figure 7(a). This indicated that the amplification effect of acceleration was insignificant. However, as shown in Figure 7(b), the top of the mass was significantly amplified due to the different predominant frequencies of the structure model and the input motion. But, it also could be observed that the maximum acceleration of the main cycles did not exceed 0.2g. With the amplitude of 4Hz sine wave increased to 0.075g, similar trends could be observed, as shown in Figure 8. It also could be seen that the maximum acceleration of the main cycles was limited to less than 0.21g. The acceleration of the structure seemed to be limited by the moment capacity of the footing. As the acceleration of input motion was further increased to 0.13g, as expected, the acceleration response at the top of the mass was amplified, but still limited to not higher than 0.22g, as shown in Figure 9. However, in the process of shaking, the structure had a significant twist, as shown in Figure 10. The cumulative twist angle history is displayed in Fig. 11. This phenomenon was due to non-uniform uplift of the footing during shaking.
0
5
10
15
20
25
30
0 10 20 30 40 50 60
TR
Frequency (Hz)
AYGW/AYBN
0
2
4
6
8
10
12
14
16
0 5 10 15 20 25 30 35 40
TR
Frequency (Hz)
AYM/AYGW

(a)
(b)
Figure 7. Accelerations of the soil and the structure model (Amax=0.05g): (a) soil surface and the
footing, (b) top of the mass
(a)
(b)
Figure 8. Accelerations of the soil and the structure model (Amax=0.075g): (a) soil surface and
the footing, (b) top of the mass
(a)
(b)
Figure 9. Accelerations of the soil and the structure model (Amax=0.13g): (a) soil surface and the
footing, (b) top of the mass
-0.25
-0.2
-0.15
-0.1
-0.05
0
0.05
0.1
0.15
0.2
0.25
8 10 12 14 16 18 20 22 24 26 28
Acc
eler
atio
n (g
)
Time (sec)
AYGWAYBNAYFC
-0.25
-0.2
-0.15
-0.1
-0.05
0
0.05
0.1
0.15
0.2
0.25
8 10 12 14 16 18 20 22 24 26 28
Acc
eler
atio
n (g
)
Time (sec)
AYM
-0.25
-0.2
-0.15
-0.1
-0.05
0
0.05
0.1
0.15
0.2
0.25
8 10 12 14 16 18 20 22 24 26 28
Acc
eler
atio
n (g
)
Time (sec)
AYGWAYBN AYFC
-0.25
-0.2
-0.15
-0.1
-0.05
0
0.05
0.1
0.15
0.2
0.25
8 13 18 23 28
Acc
eler
atio
n (g
)
Time (sec)
AYM
-0.25
-0.2
-0.15
-0.1
-0.05
0
0.05
0.1
0.15
0.2
0.25
8 10 12 14 16 18 20 22 24 26 28
Acc
eler
atio
n (g
)
Time (sec)
AYGWAYBNAYFC
-0.25
-0.2
-0.15
-0.1
-0.05
0
0.05
0.1
0.15
0.2
0.25
8 10 12 14 16 18 20 22 24 26 28
Acc
eler
atio
n (g
)
Time (sec)
AYM

Figure 10. Foundation twist: side view orthogonal to the direction of shaking
Figure 11. Cumulative foundation twist during shaking
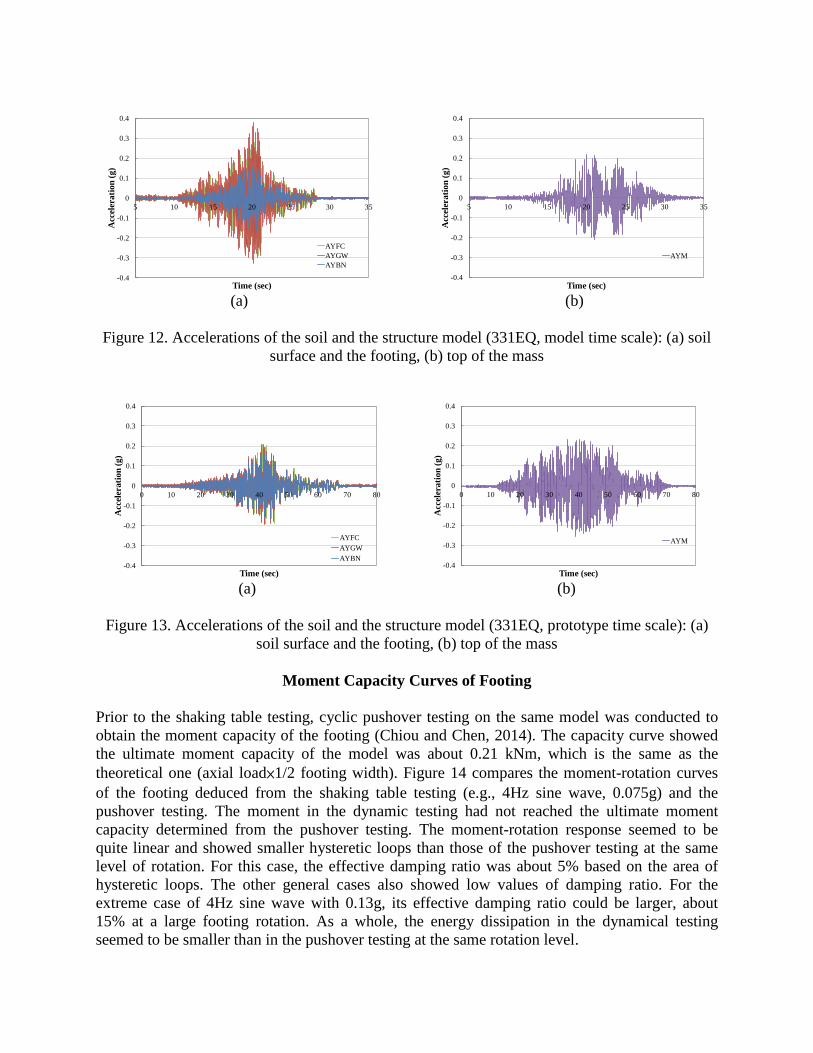
Historical Earthquake Events For the historical earthquake events, the model (reduced) and prototype (original) time scales were considered. The results under the 331 Earthquake event (TCU079) with maximum acceleration of 0.2g are discussed in this section. Figure 12 shows the acceleration responses of the soil and the model under the model time scale. In Figure 12(a), it could be found that the accelerations of the soil and the footing was significantly amplified; however, the acceleration at the top of the mass was less amplified (max. acceleration < 0.2g), although the footing maximum acceleration was amplified to larger than 0.2g, as shown in Figure 12(b). For the input motion in the original time scale, the responses of the soil and the structure were different from those in the model time scale. Figure 13 displays the acceleration responses of the soil and the model under the original time scale. In Figure 13(a), it could be observed that the accelerations of the soil and the model were less amplified. However, it could be seen that the acceleration at the top of the mass was significantly amplified but limited to not larger than 0.23g, as shown in Figure 13(b).
-0.25
-0.2
-0.15
-0.1
-0.05
0
0.05
0.1
0.15
0.2
0.25
0
0.01
0.02
0.03
0.04
0.05
0.06
0.07
0.08
0.09
0.1
5 10 15 20 25A
ccel
erat
ion
of in
put m
otio
n (g
)
Trist
ang
le (r
ad)
Time (sec)
Foundation trist (0.13g)Input motion
(a)
(b)
Figure 12. Accelerations of the soil and the structure model (331EQ, model time scale): (a) soil
surface and the footing, (b) top of the mass
(a)
(b)
Figure 13. Accelerations of the soil and the structure model (331EQ, prototype time scale): (a)
soil surface and the footing, (b) top of the mass
Moment Capacity Curves of Footing Prior to the shaking table testing, cyclic pushover testing on the same model was conducted to obtain the moment capacity of the footing (Chiou and Chen, 2014). The capacity curve showed the ultimate moment capacity of the model was about 0.21 kNm, which is the same as the theoretical one (axial load×1/2 footing width). Figure 14 compares the moment-rotation curves of the footing deduced from the shaking table testing (e.g., 4Hz sine wave, 0.075g) and the pushover testing. The moment in the dynamic testing had not reached the ultimate moment capacity determined from the pushover testing. The moment-rotation response seemed to be quite linear and showed smaller hysteretic loops than those of the pushover testing at the same level of rotation. For this case, the effective damping ratio was about 5% based on the area of hysteretic loops. The other general cases also showed low values of damping ratio. For the extreme case of 4Hz sine wave with 0.13g, its effective damping ratio could be larger, about 15% at a large footing rotation. As a whole, the energy dissipation in the dynamical testing seemed to be smaller than in the pushover testing at the same rotation level.
-0.4
-0.3
-0.2
-0.1
0
0.1
0.2
0.3
0.4
5 10 15 20 25 30 35
Acc
eler
atio
n (g
)
Time (sec)
AYFCAYGWAYBN
-0.4
-0.3
-0.2
-0.1
0
0.1
0.2
0.3
0.4
5 10 15 20 25 30 35
Acc
eler
atio
n (g
)
Time (sec)
AYM
-0.4
-0.3
-0.2
-0.1
0
0.1
0.2
0.3
0.4
0 10 20 30 40 50 60 70 80
Acc
eler
atio
n (g
)
Time (sec)
AYFCAYGWAYBN
-0.4
-0.3
-0.2
-0.1
0
0.1
0.2
0.3
0.4
0 10 20 30 40 50 60 70 80
Acc
eler
atio
n (g
)
Time (sec)
AYM

Figure 14. Comparisons of moment-rotation curves of the shaking table testing (4Hz sine wave, 0.075g) and the pushover testing
Conclusions
Based on the results of this study, the following conclusions can be drawn:
1. The whole system had two subsystems: structure-footing model and soil layer. The response of the structure was therefore related to the frequency content of the input motions, and the dynamic characteristics of the model and the soil.
2. When the frequency content of the input motions was close to the soil layer, the response of the soil was amplified, but the response of the structure model was not. When the frequency of the input motion was close to that of the structure model, the response of the structure was amplified, but the soil was not.
3. The maximum response at the top of the mass had a limit being controlled by the moment capacity of the footing.
4. The moment capacity curve of the footing could be determined by using pushover testing. The effective damping ratio in the dynamic testing was smaller than in the cyclic pushover testing at the same rotation level.
5. Although the seismic response of the structure can be limited by the moment capacity of the footing, too large seismic loading may trigger another form of failure, such as foundation twisting as observed in the test.
Acknowledgments
The authors would like to thank the National Center for Research on Earthquake Engineering, National Applied Research Laboratories of Taiwan for conducting the testing. The authors would also like to thank the Ministry of Science and Technology of Taiwan for financial support (Grant No. MOST 102-2625-M-492-001).
-0.3
-0.2
-0.1
0
0.1
0.2
0.3
-0.04-0.03-0.02-0.0100.010.020.030.04
Mom
ent (
kNm
)
Rotation (rad)

References AASHTO (2009). Guide Specifications for LRFD Seismic Bridge Design, American Association of State Highway and Transportation Officials, Washington, D.C.
Chiou, J.S., and Chen, C.H. (2014). “Pushover testing on a footing model on dry sand,” The Fifth Asia Conference on Earthquake Engineering (5ACEE).
Gajan, S., Kutter, B.L., Phalen, J.D., Hutchinson, T.C., and Martin, G.R. (2005). “Centrifuge modeling of load-deformation behavior of rocking shallow foundations,” Soil Dynamics and Earthquake Engineering, 25, 773-783.
Megro, P.E. and Kawashima, K. (2005). “Rocking isolation of a typical bridge pier on spread foundation,” Journal of Earthquake Engineering, 9(2), 395-414.
Shirato, M., Kouno, T., Asai, R., Nakatani, S., Fukui, J., and Paolucci, R. (2008). “Large-scale experiments on nonlinear behavior of shallow foundations subjected to strong earthquakes,” Soils and Foundations, 48(5), 673-692.
Ueng, T. S., Wang, M. H., Chen, M. H., Chen, C. H., and Peng, L. H. (2006). “A large biaxial shear box for shaking table test on saturated sand,” Geotechnical Testing Journal, 29(1), 1-8.