Shadowing tradespeople: Inefficiency in maintenance fieldwork
11
Shadowing tradespeople: Inefficiency in maintenance fieldwork Sanghoon Lee ⁎, Ömer Akin 5000 Forbes Ave., School of Architecture, Carnegie Mellon University, Pittsburgh, PA 15213, USA abstract article info Article history: Accepted 18 November 2008 Keywords: Facilities maintenance Maintenance activity Efficiency evaluation Informational support This research investigates current practices in Operations and Maintenance (O&M), from the initial phase of assigning maintenance requests through the completion of the requests, in order to identify types of inefficiency and their causes. Fifty-eight real maintenance cases have been shadowed; and maintenance activities performed by the tradespeople have been recorded with time data corresponding to each activity. O&M inefficiencies categorized into two groups, Structural and Individual, are demonstrated through specific cases. A statistical analysis is used to show how O&M tasks, activities, and categories impact overall O&M performance. The results show that tradespeople vastly underutilize maintenance data in the field due to problems with data accessibility and reliability. Based on the shadowing activity results, we observed 12+% potential for improvement in maintenance time efficiency by providing proper information support. © 2008 Elsevier B.V. All rights reserved. 1. Introduction There is significant potential for improvement in the performance of building equipment and facilities maintenance fieldwork. Opera- tions and Maintenance (O&M) occurs throughout the lifecycle of a building. Not surprisingly, the majority of expenses are incurred during O&M. Many strategies have been developed to enhance the O&M environment. However, it is well-known that the maintenance industry adopts new technologies more slowly than other industries. Although the industry's tools and maintenance support systems have been enhanced considerably, for decades, its overall style of main- tenance fieldwork has remained essentially unchanged. Furthermore, tradespeople vastly underutilize maintenance data in the field due to problems with data accessibility and reliability. This research investigates current practices from the initial phase of assigning maintenance requests through the completion of the requests in order to identify inefficiency in maintenance fieldwork and to develop strategies to improve the O&M environment with information support. 1.1. What is O&M? The Federal Energy Management Program (FEMP) [1] defines O&M as “the activities related to the performance of routine, preventive, predictive, scheduled, and unscheduled actions aimed at preventing equipment failure or decline with the goal of increasing efficiency, reliability, and safety.” Mann [2] defines facility maintenance as “the activities required to keep a facility in as-built condition, continuing to have its original productive capacity.” Chanter and Swallow [3] see it as “work which enables the building to continue to efficiently perform the functions for which it was designed,” and Cotts and Lee [4] define it as “the work necessary to maintain the original anticipated useful life of a fixed asset; the upkeep of property and equipment.” Therefore, O&M encompasses the activities that Facilities Manage- ment Services (FMS) personnel perform to ensure that facilities continue to fulfill their intended functions. More specifically, the term “Operations” include activities performed to provide comfortable working and living environments, whereas “Maintenance” provides equipment upkeep to prevent functional failure. The definitions above, however, do not take into account one critical factor: the limited resources in terms of materials and human labor that FMS personnel use during O&M. 1.2. Importance of O&M The O&M phase is the longest period in the lifecycle of a building. Consequently, the majority of expenses are accrued during the O&M phase [5]. According to Teicholz [6], more than 85% of total costs spent over the life cycle of a building are on O&M. Furthermore, good O&M improves the efficiency, reliability, and safety of a building. For example, Pacific Northwest National Laboratory (PNNL) has developed an O&M decision support system called “Decision Support for Operations and Maintenance (DSOM),” which is “an expert O&M system that integrates plant operations, fuel management, and main- tenance process [7].” With DSOM in one application, they were able to eliminate a potentially dangerous water hammer condition as well as increase output efficiency by about 13% [8]. In addition, Portland Energy Conservation, Inc. (PECI) [9] has stated in their report to the U.S. Department of Energy for FEMP that good operation strategy can save 5–20% on energy costs without a significant investment. Automation in Construction 18 (2009) 536–546 ⁎ Corresponding author. Tel.: +1 412 268 2008; fax: +1 412 268 7507. E-mail address: [email protected] (S. Lee). 0926-5805/$ – see front matter © 2008 Elsevier B.V. All rights reserved. doi:10.1016/j.autcon.2008.11.002 Contents lists available at ScienceDirect Automation in Construction journal homepage: www.elsevier.com/locate/autcon
-
Upload
sanghoon-lee -
Category
Documents
-
view
226 -
download
6
Transcript of Shadowing tradespeople: Inefficiency in maintenance fieldwork
Automation in Construction 18 (2009) 536–546
Contents lists available at ScienceDirect
Automation in Construction
j ourna l homepage: www.e lsev ie r.com/ locate /autcon
Shadowing tradespeople: Inefficiency in maintenance fieldwork
Sanghoon Lee ⁎, Ömer Akin5000 Forbes Ave., School of Architecture, Carnegie Mellon University, Pittsburgh, PA 15213, USA
⁎ Corresponding author. Tel.: +1 412 268 2008; fax:E-mail address: [email protected] (S. Lee).
0926-5805/$ – see front matter © 2008 Elsevier B.V. Adoi:10.1016/j.autcon.2008.11.002
a b s t r a c t
a r t i c l e i n f oArticle history:
This research investigates cu Accepted 18 November 2008Keywords:Facilities maintenanceMaintenance activityEfficiency evaluationInformational support
rrent practices in Operations and Maintenance (O&M), from the initial phase ofassigning maintenance requests through the completion of the requests, in order to identify types ofinefficiency and their causes. Fifty-eight real maintenance cases have been shadowed; and maintenanceactivities performed by the tradespeople have been recorded with time data corresponding to each activity.O&M inefficiencies categorized into two groups, Structural and Individual, are demonstrated through specificcases. A statistical analysis is used to show how O&M tasks, activities, and categories impact overall O&Mperformance. The results show that tradespeople vastly underutilize maintenance data in the field due toproblems with data accessibility and reliability. Based on the shadowing activity results, we observed 12+%potential for improvement in maintenance time efficiency by providing proper information support.
© 2008 Elsevier B.V. All rights reserved.
1. Introduction
There is significant potential for improvement in the performanceof building equipment and facilities maintenance fieldwork. Opera-tions and Maintenance (O&M) occurs throughout the lifecycle of abuilding. Not surprisingly, the majority of expenses are incurredduring O&M. Many strategies have been developed to enhance theO&M environment. However, it is well-known that the maintenanceindustry adopts new technologies more slowly than other industries.Although the industry's tools and maintenance support systems havebeen enhanced considerably, for decades, its overall style of main-tenance fieldwork has remained essentially unchanged. Furthermore,tradespeople vastly underutilize maintenance data in the fielddue to problems with data accessibility and reliability. This researchinvestigates current practices from the initial phase of assigningmaintenance requests through the completion of the requests inorder to identify inefficiency in maintenance fieldwork and to developstrategies to improve the O&M environment with informationsupport.
1.1. What is O&M?
The Federal EnergyManagement Program (FEMP) [1] defines O&Mas “the activities related to the performance of routine, preventive,predictive, scheduled, and unscheduled actions aimed at preventingequipment failure or decline with the goal of increasing efficiency,reliability, and safety.” Mann [2] defines facility maintenance as “theactivities required to keep a facility in as-built condition, continuing to
+1 412 268 7507.
ll rights reserved.
have its original productive capacity.” Chanter and Swallow [3] see itas “work which enables the building to continue to efficiently performthe functions for which it was designed,” and Cotts and Lee [4] defineit as “the work necessary to maintain the original anticipated usefullife of a fixed asset; the upkeep of property and equipment.”
Therefore, O&M encompasses the activities that Facilities Manage-ment Services (FMS) personnel perform to ensure that facilitiescontinue to fulfill their intended functions. More specifically, the term“Operations” include activities performed to provide comfortableworking and living environments, whereas “Maintenance” providesequipment upkeep to prevent functional failure. The definitionsabove, however, do not take into account one critical factor: thelimited resources in terms of materials and human labor that FMSpersonnel use during O&M.
1.2. Importance of O&M
The O&M phase is the longest period in the lifecycle of a building.Consequently, the majority of expenses are accrued during the O&Mphase [5]. According to Teicholz [6], more than 85% of total costs spentover the life cycle of a building are on O&M. Furthermore, good O&Mimproves the efficiency, reliability, and safety of a building.
For example, Pacific Northwest National Laboratory (PNNL) hasdeveloped an O&M decision support system called “Decision Supportfor Operations and Maintenance (DSOM),” which is “an expert O&Msystem that integrates plant operations, fuel management, and main-tenance process [7].”With DSOM in one application, they were able toeliminate a potentially dangerous water hammer condition as well asincrease output efficiency by about 13% [8]. In addition, PortlandEnergy Conservation, Inc. (PECI) [9] has stated in their report to theU.S.Department of Energy for FEMP that good operation strategy can save5–20% on energy costs without a significant investment.

Table 1The sequence of maintenance events built from the example maintenance description.
Actor Events Time (min)
The electrician Transits from the FMS shop to office A in building X 10The electrician Replaces a light bulb 20The electrician Returns to the FMS shop 10
537S. Lee, Ö. Akin / Automation in Construction 18 (2009) 536–546
1.3. Types of O&M
O&M activities are categorized in different ways. Thomas [10] seesthree areas:
• “Demand work: where the client calls in for service, wherebreakdowns in equipment require repairs and emergency eventsthat affect the facilities department.”
• “Preventivemaintenancework: where a scheduled program of workmaintains the investment in the physical assets for a corporation.These assets may be equipment assets or facility assets.”
• “Project work: where changes to the business focus require areorientation of space and people or the changes in regulationsrequire upgrades to maintain compliance, such as ADA, EPA, orOSHA.” ADA, EPA, and OSHA stand for Americans with DisabilitiesAct, Environmental Protection Agency, and Occupational Safety andHealth Administration.
Anadol and Akin [11] have conducted a case study on facilitiesdesign and management. In this study, the authors summarize theorganization's five types of maintenance as follows:
• “Daily service (DS) is limited service work, scheduled by needpriority and availability of trade groups.”
• “Unplanned maintenance (UP) is any emergency addressed within24 hours to insure life safety, to protect university assets or to meetcritical user needs.”
• “Planned maintenance (PM) is preventive maintenance carried outon a planned schedule to prolong equipment and building life cycle.”The organization does not use this term for work order classificationin the work order management system. Preventive maintenance(PM) is used, instead.
• “Projects (PR) include installation or modification work whichenhances the asset value of a building and its systems.”
• “Parts/Contracts (PC) is work pending due to material availability(longer than 1 week) and specialized contracted to supplementservice capability.” PC is not a term used for the work ordermanagement system in the FMS department. They use “In Progress”status for any work orders not completed.
In addition to the maintenance types, there are also repair jobsnot yet classified because problems were reported directly throughsecurity or coworkers, rather than through the FMS dispatcher whoassigns a type of maintenance through the work order system. In thiscase, work orders are generated on the following day, based on reportsmade by the tradesperson who carried out the work orders.
Our aim of shadowing FMS tradespeople is to better understandfacilities O&M in the field and to collect raw data for these activitiesand time spent on each activity. Surveys conducted in the 1990s foundthat useful information in this area was either unsatisfactory orlacking all together [5,12]. Since then, computerized O&M systemshave been developed to fill much of the information gap butdifficulties in accessing and accuracy of O&M information still remain.This study intends to identify sources of inefficiency in maintenance,which include not only redundant or superfluous activities but alsocore activities conducted in inefficient ways.
2. Shadowing tradespeople
There have been many studies on the utilization of FacilitiesManagement (FM) systems [13–16] and the roles of FM managers[17,18] to assess current processes and identify opportunities forimprovement by performing cost-benefit analyses. However, verylittle attention has been paid to tradespeople's roles and their per-formance in the field. Since tradespeople are responsible for re-sponding to and remedying situations, it is essential for them to easily
access up-to-date information for effective and efficient operationsand maintenance of facilities upkeep.
In this study, we shadowed three electricians and one plumberfor four weeks. The operations manager recommended this period oftime and the individuals to be shadowed based on the considerationthat four weeks would be reasonable period of time to observe avariety of maintenance activities including some cycles of workcompletion and redundancy with these tradespeople. Each trade-sperson has roles and responsibilities. For example, one electrician isresponsible for urgent priority and unscheduled daily service, whileanother electrician takes care of preventive maintenance and projects.They work different shifts to be ready for an emergency at any time ofthe day. Therefore, in the shadowing experiment we expected to beable to observe how they organize their work orders and develop anaccurate record of all that takes place during fieldwork. It was alsoexpected that such a record would reveal how tradespeople completetheir tasks, what information they need, and how they get thisinformation.
The observations were recorded on a template developed based ona use-case specification format, which will be described in the nextchapter. In addition, a voice recorder was used for time stamping aswell as capturing data and tradespeople's behaviors as accurately aspossible.
3. Documentation of results
Each record of tasks completed by a tradesperson is parsed into aseries of discrete parts called events until each event has only oneaction. Subjects and objects are actors and components of O&Menvironments. An actor is a person or a group of personswho carry outthe event. They are not restricted to FMS personnel, but include allrelevant persons such as building occupants and subcontractors. Then,time data is calculated based on the observation record and the audioclip. The starting time is when the actor starts the action and theending time is when the actor starts the next action. Time less than aminute is rounded-off. The following is an example to demonstrateour method.
“An electrician leaves his shop at 10:00AM to replace a light bulbin office A in building X. He arrives at the office at 10:10AM. Hereplaces the broken light bulb. The completion time is 10:30AM.He returns to the FMS shop at 10:40AM.”
In this example, the following are parsed as meaningful words:
• Actions: leaves, arrives, replaces, and returns — main maintenanceactivities
• Subject(s): electrician — actor of the events• Objects: FMS shop, office A, building X, light bulb— target objects toeach event. If objects are related to information to complete theparticular event, the information is listed with a proper code.Information classification with codes is discussed later.
• Time data: 10:00AM, 10:10AM, 10:30AM, and 10:40AM
Table 1 shows the sequence of maintenance events built from theparsed key words.
As the next step, a unique ID is assigned to each activity to referenceand identify it at later points in the table and also to use the numbers

Table 2An example template where observation results are filled out.
Title: Unclogging bath tub in building N
Basic info Date: 06/13/06; Type of maintenance: urgent priority; type of tradespeople: two plumbers
Work description Unclog bathtub in building N
Work flow Preparation phase: (before dispatched)
ID Actor Description Information C/N/O/T/Us/S/Up Time (min) Activity category
B1 Plumber A Picks up work order in the machine room in building N [O] Work description 1 Gets work orders[O] Location
Reads work descriptions [O] Maintenance typeB2 Plumber A Returns to shop 6 TransitB3 Plumber B Joins plumber A N/A CollaborationB4 Two plumbers Get plunger and lubricants [Us] Work description 3 Get materials/toolsFieldwork phase
ID Actor Description Information C/N/O/T/Us/S/Up Time (min) Activity category
F1 Plumbers Move to the site [Us] Location 11 TransitTalk about work orders to do [T] Work description Exchange information
F2 Plumbers Unclog the bathtub 11 RepairF3 Plumbers Test the bath tub to make sure the problem is fixed [C] Problem is fixed 1 InspectionF4 Plumbers Leave to the next site [Us] Location of next work order N/A TransitFollow-up phase: (post-fieldwork)
ID Actor Description Information C/N/O/T/Us/S/Up Time (min) Activity category
P1Misc
538 S. Lee, Ö. Akin / Automation in Construction 18 (2009) 536–546
in the ID to show a hierarchy of events. The nomenclature used inassigning IDs is as follows:
• B (before dispatched): O&M activities that tradespeople carry outbefore being dispatched
• F (field work): O&M activities that tradespeople carry out in the field• P (post-fieldwork): O&M activities that tradespeople carry out asfollow-up work.
Therefore, the IDs were coded in the format of B, F, or P, followed bya number. When necessary, subtask IDs were coded as F bnumber.numberN. For example, F1.1 is the first subtask of F1. Table 2 shows thetemplate filled in with an example of observation results.
To classify information instances and identify flow of informationfrom initiation to completion, we adapted Ergen's coding scheme [19],which has been developed based on the four fundamental functions ofdatabase management (create, retrieve, update, and delete, orcommonly referred to as CRUD [20]). In order to show informationflow in a pre-cast supply chain using RFID (radio frequencyidentification) technology, she classified her data managementfunctions into six categories: CTRAUS, which stands for: create (C),transfer (T), receive (R), access (A), update (U) and store (S). Weenhanced her coding scheme to fit O&M environments by adding thefollowing items: information needed (N), information obtained (O),and information used (Us). “N” helps identify what, when and whereinformation is needed. “O” signifies the obtaining of information from
Fig. 1. State diagram of
data repositories. “T” indicates that information has been transferredbetween FMS personnel. “Us” refers to the act of simply using theinformation during fieldwork. It is important to note that in currentpractice much of this information flow occurs through casual methodssuch as post-it notes, notes on work order sheets, and word of mouth,which is often hard tomanage and access. Fig. 1 shows a state diagramof O&M informationwhile carrying out awork order and the completeset of data classification is as follows:
1. Information created (C) means that an actor creates information.2. Information needed (N) means that information is needed at the
moment a particular event is carried out. For example, if anelectrician needs to replace a lamp, the information needed at thatmoment includes type and location of the broken lamp.
3. Information obtained (O) means that the information is obtained.We assigned this category to information obtained only from FMSmanagement systems, not from FMS personnel. Examples includesensor-derived data and information recorded on the directories ofelectric panels.
4. Information transferred (T) describes information transferredbetween FMS personnel, not between a tradesperson and anytype of computerized systems. This is necessary to distinguishtransferred information from obtained information.
5. Information used (Us) means that the information is used tocomplete an activity. This informationmust be created, obtained, ortransferred prior to performing the activity.
O&M information.

Table 5Electricians' time spent for CMA, MSA, and transit.
Electrician CMA MSA Transit Total
Time Ratio Time Ratio Time Ratio Time Ratio
Daily service 481 29% 28 2% 252 15% 761 46%Urgent priority 228 14% 2 0% 59 4% 289 17%Preventive maintenance 260 16% 1 0% 51 3% 312 19%Project 130 8% 0 0% 40 2% 170 10%Contractor support 30 2% 0 0% 34 2% 63 4%Not classified 44 3% 1 0% 29 2% 74 4%Total 1172 70% 32 2% 465 28% 1670 100%
Table 3Types of maintenance and the number of work requests for each type.
Maintenance type Electrician Plumber Total
# of workrequests
Time(min)
# of workrequests
Time(min)
# of workrequests
Time(min)
DS 17 (+1) 761 7 259 24 (+1) 102050% 46% 29% 32% 41% 41%
PM 4 (+2) 312 12 367 16 (+2) 67912% 19% 50% 45% 28% 27%
UP 3 (+2) 289 3 108 6 (+2) 3979% 17% 13% 13% 10% 16%
PR 2 (+1) 170 1 32 3 (+1) 2026% 10% 4% 4% 5% 8%
CS 4 64 0 0 4 6412% 4% 0% 0% 7% 3%
NC 4 74 1 55 5 12912% 4% 4% 7% 9% 5%
Total 34 (+6) 1670 24 821 58 (+6) 2491100% 100% 100% 100% 100% 100%
539S. Lee, Ö. Akin / Automation in Construction 18 (2009) 536–546
6. Information stored (S) means that the information created, ob-tained, or transferred is documented on any forms that the actoruses, such as a work order form or a material requisition form.
7. Information updated (Up) means that the information is updated.The information should be stored in information repositories priorto this event.
Each fieldwork event was also classified into three groups: coremaintenance activities (CMA), maintenance support activities (MSA)and transit activities so that we could identify opportunities forimprovement. The details of this classification process will bediscussed in Section 4.1.1.
4. Analyzing the shadowing activity
4.1. Descriptive data
We organize the fieldwork data under three categories: electrician,plumber and combined. Table 3 shows the number of maintenancerequests carried out during the shadowing activity for each type ofmaintenance and its ratio to the total number of maintenance activities.The number in parentheses represents maintenance requests that wereobserved, but for which time was not measured. In Table 3, DS, PM, UP,PR, CS and NC stand for daily service, preventive maintenance, urgentpriority, project, contractor support, and not classified, respectively.
A total of 64 maintenance requests were observed; 58 have timedata and six do not. Ratios were also calculated to show thepercentage of the particular requests in relation to the total numberof requests in that category. Comparison shows that the time spent on
Table 4Classification of maintenance fieldwork activities.
Maintenance activity types Examples
Core maintenance activities(CMA)
• Getting maintenance requests• Locating equipment/facilities• Diagnosis/repair/inspection• Preventive maintenance activities• Project activities• Supporting sub-contractors• Arranging collaboration with co-workers/sub-contractors• Documentation
Maintenance support activities(MSA)
• Reading manuals/specifications/drawings• Exchanging information about equipment among FMSpersonnel• Getting information on necessary materials/tools
Transit • Moving from the office to the maintenance site• Moving from one maintenance site to the next• Moving from the maintenance site to the office
each type of maintenance increased in proportion to the number ofmaintenance requests in general.
4.1.1. Classification of maintenance activitiesWe classify maintenance activities into three groups: core
maintenance activities (CMA), maintenance support activities(MSA), and time spent in transit from one location to the next. CMAare crucial in completing the job and cannot be replaced by any otheractivities, whereas MSA improve the tradespeople's performanceduring the CMA. Many different types of MSA could exist to achievethe same goal and their impact on the core processes varies. Activitiesin the last category are for transit principally between locations, suchas the office and the site of the maintenance work. Table 4 showsexamples for each category.
Obviously, in order to improvemaintenance efficiency, all activitiesnot contributing to the successful completion and quality of O&Mwork should be eliminated. Those in CMA and MSA categories arenecessary in the sense that they help tradespeople do their jobs,although some excessive and redundant processes can still beobserved and should be reduced. Frequently, reducing those activitiescan be done without significantly influencing the entire process. Thisresearch targets these activities.
In many cases, in-house tradespeople are paid by the hour and notfor the number of thework orders they carry out within a given periodof time. Consequently, they are not highly motivated to save time andcarry out more work orders in a given time period. As such, they donot tend to do the things that could result in saving time, even if thistakes very little effort. For example, a tradesperson does not hesitateto move from one site to the next, when it is not entirely necessary.This extra transit is also a target of this research.
Tables 5 and 6 show time tradespeople spent on each type ofthe maintenance activities and the ratio of this to total time. Theelectricians spent 70% of their time doing CMA and 28% time forTransit. Only 2% of total time was used for information-relatedactivities such as O&M information exchange between FMS personnelor with customers. Similarly, the plumber spent 62% and 36% for CMAand transit, respectively. He spent 2% of total time for MSA. Theseresults show that the tradespeople spent most of their time doingCMA and transit.
While transit is an inevitable activity it appears that the overallmaintenance efficiency could be improved by realizing savings even
Table 6Plumber's time spent for CMA, MSA, and transit.
Plumber CMA MSA Transit Total
Time Ratio Time Ratio Time Ratio Time Ratio
Daily service 138 17% 1 0% 120 15% 259 32%Urgent priority 94 11% 2 0% 12 1% 108 13%Preventive maintenance 214 26% 10 1% 143 17% 367 45%Project 20 2% 1 0% 11 1% 32 4%Contractor support 0 0% 0 0% 0 0% 0 0%Not classified 45 5% 0 0% 10 1% 55 7%Total 511 62% 14 2% 296 36% 821 100%
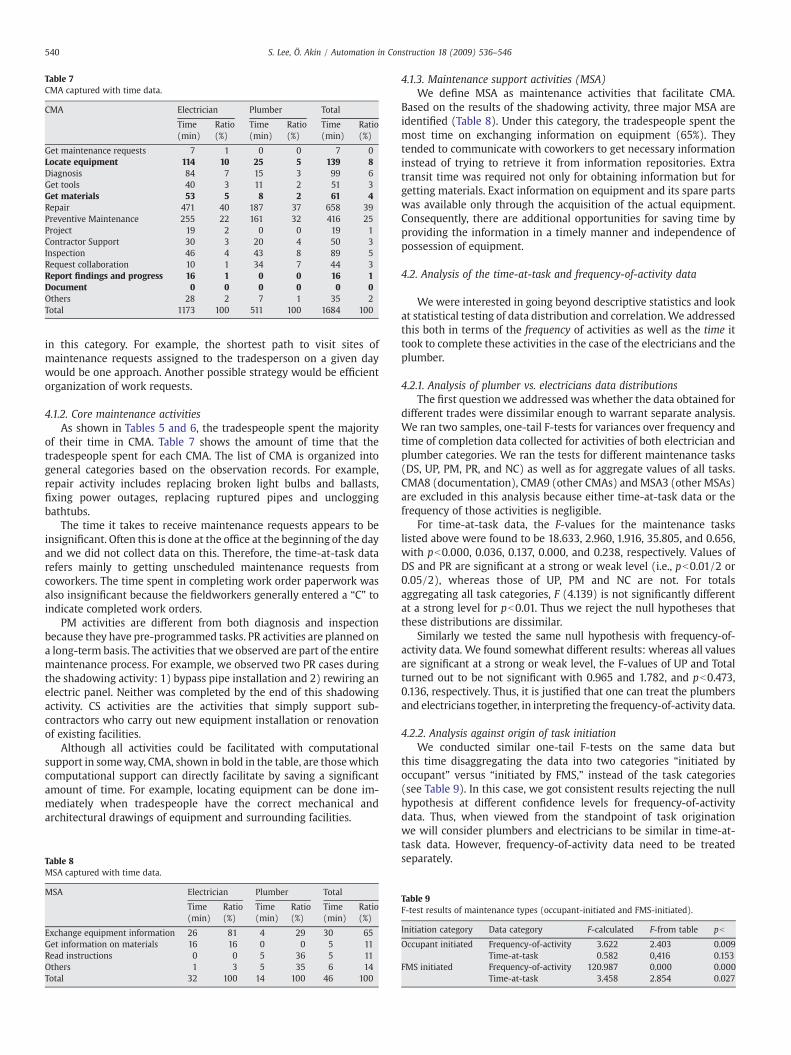
Table 7CMA captured with time data.
CMA Electrician Plumber Total
Time(min)
Ratio(%)
Time(min)
Ratio(%)
Time(min)
Ratio(%)
Get maintenance requests 7 1 0 0 7 0Locate equipment 114 10 25 5 139 8Diagnosis 84 7 15 3 99 6Get tools 40 3 11 2 51 3Get materials 53 5 8 2 61 4Repair 471 40 187 37 658 39Preventive Maintenance 255 22 161 32 416 25Project 19 2 0 0 19 1Contractor Support 30 3 20 4 50 3Inspection 46 4 43 8 89 5Request collaboration 10 1 34 7 44 3Report findings and progress 16 1 0 0 16 1Document 0 0 0 0 0 0Others 28 2 7 1 35 2Total 1173 100 511 100 1684 100
540 S. Lee, Ö. Akin / Automation in Construction 18 (2009) 536–546
in this category. For example, the shortest path to visit sites ofmaintenance requests assigned to the tradesperson on a given daywould be one approach. Another possible strategy would be efficientorganization of work requests.
4.1.2. Core maintenance activitiesAs shown in Tables 5 and 6, the tradespeople spent the majority
of their time in CMA. Table 7 shows the amount of time that thetradespeople spent for each CMA. The list of CMA is organized intogeneral categories based on the observation records. For example,repair activity includes replacing broken light bulbs and ballasts,fixing power outages, replacing ruptured pipes and uncloggingbathtubs.
The time it takes to receive maintenance requests appears to beinsignificant. Often this is done at the office at the beginning of the dayand we did not collect data on this. Therefore, the time-at-task datarefers mainly to getting unscheduled maintenance requests fromcoworkers. The time spent in completing work order paperwork wasalso insignificant because the fieldworkers generally entered a “C” toindicate completed work orders.
PM activities are different from both diagnosis and inspectionbecause they have pre-programmed tasks. PR activities are planned ona long-term basis. The activities that we observed are part of the entiremaintenance process. For example, we observed two PR cases duringthe shadowing activity: 1) bypass pipe installation and 2) rewiring anelectric panel. Neither was completed by the end of this shadowingactivity. CS activities are the activities that simply support sub-contractors who carry out new equipment installation or renovationof existing facilities.
Although all activities could be facilitated with computationalsupport in someway, CMA, shown in bold in the table, are thosewhichcomputational support can directly facilitate by saving a significantamount of time. For example, locating equipment can be done im-mediately when tradespeople have the correct mechanical andarchitectural drawings of equipment and surrounding facilities.
Table 8MSA captured with time data.
MSA Electrician Plumber Total
Time(min)
Ratio(%)
Time(min)
Ratio(%)
Time(min)
Ratio(%)
Exchange equipment information 26 81 4 29 30 65Get information on materials 16 16 0 0 5 11Read instructions 0 0 5 36 5 11Others 1 3 5 35 6 14Total 32 100 14 100 46 100
4.1.3. Maintenance support activities (MSA)We define MSA as maintenance activities that facilitate CMA.
Based on the results of the shadowing activity, three major MSA areidentified (Table 8). Under this category, the tradespeople spent themost time on exchanging information on equipment (65%). Theytended to communicate with coworkers to get necessary informationinstead of trying to retrieve it from information repositories. Extratransit time was required not only for obtaining information but forgetting materials. Exact information on equipment and its spare partswas available only through the acquisition of the actual equipment.Consequently, there are additional opportunities for saving time byproviding the information in a timely manner and independence ofpossession of equipment.
4.2. Analysis of the time-at-task and frequency-of-activity data
Wewere interested in going beyond descriptive statistics and lookat statistical testing of data distribution and correlation. We addressedthis both in terms of the frequency of activities as well as the time ittook to complete these activities in the case of the electricians and theplumber.
4.2.1. Analysis of plumber vs. electricians data distributionsThe first questionwe addressed was whether the data obtained for
different trades were dissimilar enough to warrant separate analysis.We ran two samples, one-tail F-tests for variances over frequency andtime of completion data collected for activities of both electrician andplumber categories. We ran the tests for different maintenance tasks(DS, UP, PM, PR, and NC) as well as for aggregate values of all tasks.CMA8 (documentation), CMA9 (other CMAs) andMSA3 (other MSAs)are excluded in this analysis because either time-at-task data or thefrequency of those activities is negligible.
For time-at-task data, the F-values for the maintenance taskslisted above were found to be 18.633, 2.960, 1.916, 35.805, and 0.656,with pb0.000, 0.036, 0.137, 0.000, and 0.238, respectively. Values ofDS and PR are significant at a strong or weak level (i.e., pb0.01/2 or0.05/2), whereas those of UP, PM and NC are not. For totalsaggregating all task categories, F (4.139) is not significantly differentat a strong level for pb0.01. Thus we reject the null hypotheses thatthese distributions are dissimilar.
Similarly we tested the same null hypothesis with frequency-of-activity data. We found somewhat different results: whereas all valuesare significant at a strong or weak level, the F-values of UP and Totalturned out to be not significant with 0.965 and 1.782, and pb0.473,0.136, respectively. Thus, it is justified that one can treat the plumbersand electricians together, in interpreting the frequency-of-activity data.
4.2.2. Analysis against origin of task initiationWe conducted similar one-tail F-tests on the same data but
this time disaggregating the data into two categories “initiated byoccupant” versus “initiated by FMS,” instead of the task categories(see Table 9). In this case, we got consistent results rejecting the nullhypothesis at different confidence levels for frequency-of-activitydata. Thus, when viewed from the standpoint of task originationwe will consider plumbers and electricians to be similar in time-at-task data. However, frequency-of-activity data need to be treatedseparately.
Table 9F-test results of maintenance types (occupant-initiated and FMS-initiated).
Initiation category Data category F-calculated F-from table pb
Occupant initiated Frequency-of-activity 3.622 2.403 0.009Time-at-task 0.582 0,416 0.153
FMS initiated Frequency-of-activity 120.987 0.000 0.000Time-at-task 3.458 2.854 0.027

541S. Lee, Ö. Akin / Automation in Construction 18 (2009) 536–546
4.2.3. Correlation analysis of maintenance activitiesNext we looked at the correlation between various activities used
in completing these tasks. For brevity we use the abbreviations shownbelow.
• CMA1: Locating equipment
Table 10Time-at-task for the maintenance ac
Tradespeople Maintenancetype
Electrician DSUPPMPRCSNC
Plumber DSUPPMPRCSNC
Table 11Correlation analysis with time-at-tas
Activity CMA
C1 C2 C
CMA1 1.00CMA2 1.00 1.00CMA3 −0.15 −0.10 1CMA4 −0.15 −0.11 0CMA5 0.22 0.27 0CMA6 −0.15 −0.10 0CMA7 −0.48 −0.51 −CMA8 N/A N/A NCMA9 0.63 0.65 0MSA1 0.00 0.05 0MSA2 −0.22 −0.17 0MSA3 −0.11 −0.11 −Transit1 −0.18 −0.14 0Transit2 0.17 0.22 0Transit3 −0.24 −0.19 0Transit4 0.04 0.06 0
Bold data illustrate clusters of data t
• MSA1: Exchanging maintenance-relatedequipment information
• CMA2: Diagnosis
• MSA2: Getting information on materials, spareparts and tools• CMA3: Getting materials/tools
• MSA3: Other MSA • CMA4: Carrying out maintenancerequests specified in work order• CMA5: Inspection
• Transit1: Transit from the shop to the site, orfrom the current site to the next• CMA6: Requesting collaboration
• Transit2: Necessary transit during fieldwork • CMA7: Reporting progress andfindings• Transit3: Unnecessary transit during fieldwork
• CMA8: Documentation
• Transit4: Transit from site to shop • CMA9: Other CMAActual repair for scheduled and unscheduled daily maintenance,installation for projects, and tasks specified in work order forpreventive maintenance are consolidated into CMA4 (maintenancerequest specified in work order), because each observation has onlyone type among the maintenance activities described in each workorder. In addition, several maintenance activities that the trades-people neither perform frequently nor spend a significant amount oftime on are consolidated into CMA9 (other CMA) and MSA3 (otherMSA) respectively.
Table 10 shows time-at-task data for the maintenance activities,measured in minutes. The empty cells signify no activity recorded,
tivities.
CMA
C1 C2 C3 C4 C5 C6
0 5 76 340 41 10109 79 5 17
0 2550 10 1205 00 2 24 5
10 5 8 63 18 340 71 23
15 10 11 176 20 20
0 38 0
k data (combined).
3 C4 C5 C6 C7
.00.66 1.00.91 0.48 1.00.99 0.58 0.93 1.000.36 −0.05 −0.48 −0.32 1.00/A N/A N/A N/A N/A.01 −0.29 0.36 0.06 −0.23.98 0.57 0.97 0.99 −0.42.95 0.50 0.89 0.97 −0.210.02 0.72 −0.18 −0.10 0.42.78 0.96 0.63 0.73 0.02.93 0.56 0.99 0.94 −0.42.98 0.61 0.85 0.96 −0.45.66 0.79 0.59 0.63 0.02
hat are positively correlated each other.
whereas entry of “0” means that the time spent for the particularactivity was negligible, such as when target equipment was locatedimmediately, or no time was taken for docmentation.
We ran a correlation analysis (R2) on this data and highlightedin Table 11 those values of correlation that are 50% or above,in order to identify clusters of significantly correlated activities.Through this visual analysis we infer several general patterns:Transit activities (transit from the shop to the site or from thecurrent site to the next site; necessary transit during the field-work; unnecessary transit during the fieldwork; transit from site toshop) are significantly, positively correlated within themselves.The CMA3-6 (getting materials, spare parts and tools; carrying outmaintenance requests specified in work order; inspection; request-ing collaboration) are significantly, positively correlated withinthemselves. Transit activities (same as in 1) are significantlycorrelated with MSA (exchanging maintenance-related equip-ment information; getting information on materials, spare partsand tools; other support activities) and CMA3-6 (same as in 2)activities.
This leads us to believe that transit is a critical factor in the efficientexecution of fieldwork. In fact, the highly correlated CMA aredependent in most cases on travel to another location or the office.Transit is also well correlated with all MSA, which do not showconsistent correlationwithin. Correlation between these activities and“necessary” transit (Transit1, Transit2, and Transit4) is higher thanwith “unnecessary” transit (Transit3). This is comforting to see fromthe standpoint of fieldwork efficiency; while the high correlationbetween “unnecessary” and “necessary” transit is disconcerting, fromthe same vantage point.
MSA Transit
C7 C8 C9 M1 M2 M3 T1 T2 T3 T4
1 0 8 23 4 1 126 73 42 110 18 2 0 15 34 10
5 0 1 46 50 20 20
5 0 1 22 125 0 8 1 24 5
0 1 0 62 18 27 130 2 120 10 109 8 5 210 1 5 3 3
0 7 10
MSA Transit
C8 C9 M1 M2 M3 T1 T2 T3 T4
N/AN/A 1.00N/A 0.14 1.00N/A 0.19 0.94 1.00N/A −0.43 −0.11 −0.16 1.00N/A −0.23 0.72 0.67 0.60 1.00N/A 0.35 0.97 0.91 −0.10 0.69 1.00N/A −0.10 0.94 0.91 −0.10 0.70 0.85 1.00N/A −0.28 0.65 0.49 0.55 0.89 0.61 0.56 1.00

Table 12Frequencies of maintenance activities.
Actors MaintenanceType
CMA MSA Transit
C1 C2 C3 C4 C5 C6 C7 C8 C9 M1 M2 M3 T1 T2 T3 T4
Electrician DS (Total: 17) 17 1 7 12 4 1 1 17 1 4 3 1 17 7 4 1UP (Total: 3) 3 3 3 2 0 0 0 3 1 1 1 0 3 3 0 1PM (Total: 4) 4 0 0 4 0 0 1 4 0 1 0 0 4 1 0 0PR (Total: 2) 2 0 1 2 0 0 0 2 0 0 0 0 2 0 1 0CS (Total: 4) 4 0 0 3 0 0 5 4 0 0 0 0 3 0 0 2NC (Total: 4) 4 1 1 4 2 0 3 4 1 0 1 0 4 3 0 0Sub-Total (34) 34 5 12 27 6 1 10 34 3 6 5 1 33 14 5 4
Plumber DS (Total: 7) 7 1 1 5 2 2 0 7 0 1 1 0 7 1 1 2UP (Total: 3) 3 0 0 3 3 0 0 3 0 1 0 0 2 0 0 0PM (Total: 12) 12 1 4 12 1 0 0 12 0 0 0 3 12 1 1 2PR (Total: 1) 1 0 0 1 0 0 0 1 0 1 0 0 1 1 0 1CS (Total: 0) 0 0 0 0 0 0 0 0 0 0 0 0 0 0 0 0NC (Total: 1) 1 0 0 1 1 0 0 1 1 0 0 0 0 1 0 0Sub-Total (24) 24 2 5 22 7 2 0 24 1 3 1 3 22 4 2 5
Tradespeople Total: 58 7 17 49 13 3 10 58 4 9 6 4 55 18 7 9
542 S. Lee, Ö. Akin / Automation in Construction 18 (2009) 536–546
We are not sure if this latter correlation points to a deficiency inour data collection, analysis or the piggybacking effect of one type oftransit on the others. We are inclined to believe the latter conclusion,since it is often common human nature to carry out like tasks (i.e.,transit) in conjunction.
Table 12 shows the frequencies of the identified maintenanceactivities. As described earlier, the total number of observations is 58.The frequency of CMA4 is less than this number because there wereseveral cases in which the tradespeople did not need to performany maintenance-related acts. For example, an electrician got a workorder to fix power outage. When he arrived at the site, the power hadalready been restored. In this particular case, a sub-contractor hadturned off the power in his work areawithout notifying the occupants.This was simply a case of false alarm.
Table 13 shows correlation analysis results with the frequenciesof the maintenance activities. The pattern of correlations here are notas clear and simple as those in the time-at-task correlations betweenthe maintenance activities. However, there is sufficient evidence toobserve dependencies between these tasks that are reminiscent ofthose in the case of time-at-task. The three triangles labeled A, B, andC, respectively, in Table 13, highlight the potential correlation sets thatwe observed in the time-at-task. The scarcity of clusters with highlevels of correlation (50% and up; highlighted in Table 13), givesus pause about drawing conclusions similar to thosewe did in the caseof time at task. However, CMA1 (locating equipment), which is notsignificantly correlated with other activities in the analysis with time-
Table 13Correlation analysis with the frequencies of maintenance activities (Combined).
at-task data, clearly shows significant correlations with otheractivities because tradespeople always locate equipment first to dothe other activities. This can also explain why CMA8 (documentation)shows significant correlations with other activities in the analysis.
4.2.4. Analysis of maintenance activitiesNext, we carried out ANOVA (analysis of variance) tests to verify
that the maintenance tasks that we defined a priori — daily service,urgent priority, preventive maintenance, project, and not classified —
in fact, are distinct. CMA8 (documentation), CMA9 (other CMAs) andMSA3 (other MSAs) are excluded from the ANOVA tests for the samereasons as the F-tests (negligible values of time-at-task data andfrequency-of-activity data).
The F-test for single factor (electrician) with time-at-task, yieldedan F-calculated of 1.858 for the maintenance tasks listed above.This is not significant at pb0.11. The same ANOVA for plumbersyielded F-calculated =2.470, with pb0.038, which is weak signifi-cance. The ANOVA for the combined data was also insignificant: F-calculated=2.039, with pb0.081. Based on this we conclude that thetwo trades appear to be more similar than not in terms of the time-at-task, for our maintenance task classifications.
We repeated the same analysis to verify that the maintenancetasks we defined a priori are in fact distinct when tabulated forfrequency-of-activity data. The F-test for single factor (electrician)yielded an F-calculated of 7.837 for the maintenance tasks listedabove. This is significant at p~0.00. The same ANOVA for plumber

Table 14Example of material-related structural inefficiency.
Original Enhanced
Action Activitytype
Time(min)
Action ActivityType
Time(min)
Visits room X in building D Transit 1 12 Requests bulbs and ballasts needed CMA 3Figure out types of bulbs and ballasts MSA 4 Dispenses requested materials CMA 10Returns to material store Transit 2 6 Visits room X in building D Transit 1 12Requests bulbs and ballasts needed CMA 3 Decides not to replace bulbs and ballasts in two out of three areas
due to equipment beneath bulbsCMA 2
Dispenses requested materials CMA 10 Decides to ask laborers to remove the obstacles CMAReturns to site with materials Transit 2 7 Replaces one ballast and two bulbs in area that he can access CMA 28Decides not to replace bulbs and ballasts in two out of threeareas due to equipment beneath bulbs
CMA 2 Installs bulbs CMA 9
Decides to ask laborers to remove the obstacles CMA Cleans surrounding area CMAReplaces one ballast and two bulbs in area that he can access CMA 28 Closes light cover CMAFinds that type of bulb is incorrect (correct bulb is 4100 k,not 3500 k). Removes installed bulbs
Extra CMA 1 Takes remaining bulbs and ballasts to local storage room in samebuilding (mechanical room)
CMA 2
Returns to material store Transit 3 6 Completes work order sheet with current status CMA 0Returns wrong bulbs and requests right ones Extra CMA 3 Total Time: 66Goes back to site with bulbs Transit 3 6Installs bulbs CMA 9Cleans surrounding area CMACloses light cover CMATakes remaining bulbs and ballasts to local storage room insame building (mechanical room)
CMA 2
Completes work order sheet with current status CMA 0Total Time: 99
The bold data in the table illustrate examples of Structural and Individual Inefficiencies.
Table 15Structurally inefficient maintenance cases.
Inefficiency cases Originaltime data(1)
Total time inideal sequence(2)
Time spent forredundant andexcessiveactivities (3)
Ratio[(3)/(1)]
Case 1-1: Fixingpower outage
156 32 124 79%
Case 1-2: PM forsafety shower
23 8 15 65%
Case 1-3: CS forlight panel
10 5 5 50%
Case 2-1: Addingcircuit
90 70 20 22%
Case 2-2: Changingballasts and light bulbs
99 69 30 30%
543S. Lee, Ö. Akin / Automation in Construction 18 (2009) 536–546
yielded F-calculated=5.949, with p~0.00. However, the ANOVA forthe combined data was also significant: F-calculated=5.073, withp~0.00. Based on this we conclude that the two trades appear to besimilar in terms of the frequency of maintenance task classifications.
4.2.5. Analysis of tradespeople activitiesWe used the same ANOVA approach to test the similarities in
the variances of the activity categories for combined data of theelectricians and the plumber, over the thirteen maintenance activitiesdefined above. The two-factor with replication of results ANOVA yieldsa high level of significance for both time at task and frequency forthe maintenance activities: F-calculated=6.197 (p ∼ 0.00), and F-calculated=5.072 (p ∼ 0.00), respectively.
4.2.6. Summary of analysesOne of our findings in this section is that the data of the electricians
versus the plumber for both frequency-of-activity and time-at-taskdistributions are overall sufficiently similar for us to treat this datatogether. When viewed from the standpoint of task origination, wealso find the two sets of data (plumbers versus electricians) to besimilar along both frequency-of-activity and time-at-task data.
In considering the maintenance activity categories (CMA, MSAand transit), in the case of time-at-task we see some clear clustersof dependency. The catalyst in this clustering effect seems to be thetransit category which may be the critical factor in the efficient exe-cution of fieldwork. In fact, the highly correlated CMA are dependentin most cases on transit, say travel to another location or the office.Transit is also well correlated with all MSA, which do not show con-sistent correlation within. Correlation between these activities andtransit is generally high. This is probably due to the fact that mostsupport activities require going somewhere to get equipment,materials, or information. We also observed a high correlation bet-ween “unnecessary” and “necessary” transit. This can be an explana-tion for inefficiency, through the piggyback effect of one type of transitonto others. These results are not evident in the frequency-of-activitydata.
Based on ANOVA with task (DS, UP, PM, PR and NC) and activity(CMA, MSA and transit) categories for both the plumber and theelectricians, we observe that the two trades appear to be similar in
terms of the time-at-task classifications. The results of ANOVA: two-factors with replication also indicate a high level of significancefor both frequency-of-activity and time-at-task for the maintenanceactivity data being similar. This suggests that when consideringthe task or activity aspects of the two tradeswe can combine their data.
4.3. Inefficient maintenance cases and incidents
Maintenance inefficiencies obtained from the results of theshadowing activity are grouped into two categories: structural in-efficiency and individual inefficiency. Structural inefficiency is causedby the maintenance environment. This type of inefficiency can occurregardless of personal effort. Individual inefficiency, on the otherhand, is caused by specific persons and includes things such as failureof recall or other isolated mistakes. Therefore, individual inefficientactivities performed by one tradesperson might not be repeated byanother.
In the following two sections we discuss each inefficiency in detailwithin actual cases observed. The tables we use to illustrate thesecases are formatted in two parts: the left side labeled “Original” showsthe actual sequence of activities that the tradesperson performed,while the table on the right side labeled “Enhanced” shows thesequence of activities in an ideal (efficient) activity sequence. The

Table 16Individual inefficiency case — extra transit to get a tool.
Original Enhanced
Action Activitytype
Time(min)
Action Activitytype
Time(min)
Visit the site in basement of building J Transit1 9 Visit the site in basement of building J Transit1 9Inspect visually to find ruptured area CMA 2 Inspect visually to find ruptured area CMA 2Return to material store in FMS building Transit 2 4 Return to material store in FMS building Transit 2 4Call police to open material store CMA 2 Call police to open material store CMA 2Wait for police CMA 17 Wait for police CMA 17Get connectors, adhesive, and pipe of same size CMA 7 Get connectors, adhesive, and pipe of same size CMA 7Return to site Transit 2 14 Get a hammerInspect visually again to determine length of pipe needing to be removed CMA 11 Return to site Transit 2 14One plumber returns to FMS building to get hammer. Transit 3 16 Inspect visually again to determine length of pipe
needing to be removedCMA 11
Meanwhile, the other enters crawl space on the other side of ruptured pipe. CMARemove ruptured part CMA 4Remove ruptured part CMA 4Replace ruptured part CMA 7Try to replace pipe but find prepared pipe is too short CMA 3Clean site CMA 3Try to recycle some part of old pipe, but could not Extra CMA 5Return to shop Transit 4 5Measure length of pipe needed Extra CMA 3Total Time: 85Install the short pipe first Extra CMA 4
Return to FMS building to get another section of pipe to make up difference Extra CMA 5Cut a pipe to make 12” piece Extra CMA 1Return to site with new pipe Transit 3 6Install new pipe and complete the repair job CMA 7Clean the site CMA 3Return to shop Transit 4 5Total Time: 128
Table 17Individual inefficiency cases.
Inefficiency cases Originaltime data(1)
Total time inideal sequence(2)
Time spent forredundant andexcessive activities (3)
Ratio[(3)/(1)]
Case 1: Replaceruptured pipe
128 85 43 34%
Case 2: Replace lightbulbs–I
55 40 15 27%
Case 3: Replace lightbulbs and ballast–II
99 83 16 16%
Case 4: Replace ballast 100 90 10 10%
544 S. Lee, Ö. Akin / Automation in Construction 18 (2009) 536–546
development of the “enhanced” version of tables was created byidentifying and eliminating the non-value-adding activities from theoriginal fieldwork flow. This includes activities labeled “Transit” and“MSA” in the second column, and any activities that were repeateddue to an error. Furthermore, in the “enhanced” version we con-solidated activities that could be performed together to save extratransit time. Since the first finding from the statistical analyses enablesus to treat time data of the electricians and the plumber together, wecombined them into one set of a data pool and analyzed them in termsof structural as well as individual inefficiency.
4.3.1. Structural inefficiencyStructural inefficiency was observed in several maintenance
cases mainly due to difficulties in locating equipment and inefficientmaintenance procedures related to materials. Table 14 shows anexample of this type of inefficiency observed while the tradespersonchanged ballasts and light bulbs. The tradesperson spent an extra17 minutes (17% of total time) just to get material information. In theconventional maintenance environment, there was only one way toget the information, which was to visit the site and look at the actualequipment. This requires initial transit except in cases that the trades-person had personal experience of maintaining the particular equip-ment and therefore having accurate recall of it.
This particular case also illustrates individual inefficiency since thetradesperson makes the mistake of getting the wrong type of lightbulb, resulting in extra transit between the shop and the site.
Table 15 shows a complete list of maintenance cases in whichwe observed structural cases with their original time, enhanced time,time spent on redundant and excessive activities and ratios betweentime spent on redundant and excessive activities and original time.Case 1-X represents maintenance cases in which the tradespeoplehad difficulties in locating equipment and Case 2-Y has inefficientprocedures due to getting materials or material-related information.The results clearly show that there is a significant amount of in-efficiency in current maintenance fieldwork (51% on average). Inaddition, all three cases of inefficiency due to difficulty in locatingequipment are 50% or above, which means that difficulty in locatingequipment caused significant delay in work completion. This alsoimplies that there was an essential problem in using drawings anddocuments that had equipment location information.
In this class of inefficiencies, new technology that can affect thestructure of the maintenance task is likely to eliminate the class ofinefficiency all together.
4.3.2. Individual inefficiencyWe observed five cases of individual inefficiency. Table 16, for
instance, shows a sequence of maintenance activities to repair aruptured pipe. During the repair, the tradespeople forgot to bring ahammer with them to the site, so one of the tradespeople had toreturn to their shop to get one, which resulted in extra time spent.Also, since they did not measure the length of the ruptured pipeto be replaced, the new pipe segment they replaced the broken onewith was too short, resulting in more extra time. In these cases,inefficiencies are the result of spending extra time to get tools and/ormaterials and structural improvements are unlikely to remedy these.However, there is still potential improvement by providing, for in-stance, a checklist of all the necessary tools and materials in con-junction with the type of maintenance fieldwork.
In another case a tradesperson had difficulty locating the targetequipment (for about 2.5 hours) because it was painted the samecolor as the wall and was behind other equipment. While there is astructural flaw here, it also behooves the tradesperson to realize whentoo much time has been wasted and consult reliable data source toresolve the issue.
Table 17 shows the complete list of individual inefficiency casesobserved with time data. 19% of their time was spent on redundant

Fig. 2. Root-cause diagram of inefficiency in maintenance.
545S. Lee, Ö. Akin / Automation in Construction 18 (2009) 536–546
activities such as visiting the materials storeroom to get correctmaterials, which were incorrect at the initial visit to the site.
4.3.3. Shadowing tradespeople and fieldwork efficiencyThrough the shadowing activity, we observed specific cases of
inefficiency in maintenance, which is categorized into two groups:structural, and individual. Fig. 2 illustrates a root-cause diagramof inefficiency in maintenance developed with the results of theshadowing activity. A root-cause diagram is frequently used toillustrate a hierarchical structure of underlying factors that contributethe target problem [21]. In the figure, maintenance activities thatcaused structural inefficiency include locating equipment and gettinginformation on materials, spare parts and tools. In most cases, thetradespeople did not have any trouble with locating equipment.However, when they failed at the initial try, they confronted seriousdifficulty in getting information on equipment location, resultingin consumption of more than 50% of their time to complete themaintenance task.
Getting correct materials and tools is also an essential factor thatcauses both structural and individual inefficiency. We observed 26%of total time on redundant activities as structural inefficiency and 19%as individual inefficiency. The tradespeople have to initially visit thesite to get correct information on materials because they frequentlyhave difficulty in getting it from information repositories. Similarly,lack of information on materials and spare parts causes individualinefficiency, resulting in extra transit as revealed through ourstatistical analyses.
The causes illustrated in Fig. 2 are primarily from lack of availablemaintenance information, including one power outage incident,which was also observed during the shadowing activity. The incidentmight have caused loss of all the occupant's work at the time. As theprimary target of improving maintenance efficiency, we focused on aset of activities listed in Table 18.
Locating equipment and facilities is the core maintenance activitythat causes significant delay in maintenance. Since it is a relativelybrief activity, once you have correct information this should saveabout 6% of their total maintenance time, based on our data estimates.
Although time spent on documenting findings and progress isonly 1+% of the total activities, it is one of the essential maintenance
Table 18Target activities for computational support.
Factors Activities Time Ratio to totaltime
Structuralinefficiency
Locating equipment/facilities 139 6%Documenting findings and progress 16+ 1+%Exchanging information on target equipment 30 1+%Getting information on materials 5+ 0+%
Individualinefficiency
Getting correct materials 94 4%
activities because accumulated documentation will form the main-tenance history of the particular piece of equipment. As it is,considerable effort is being spent on exchange of information.We infer that there are significant time gains in this area, only ifO&M environments could become information rich through the useof digital technology or other improvements. Time spent on gettinginformation on materials and necessary time for transit to the sitewould be curtailed.
Finally, as indirect benefits from computational support, we expectto reduce individual inefficiency (around 4% of total time in the caseof shadowing activity results) by providing correct materials informa-tion. Overall, we conclude that, based on the shadowing activityresults, we have 12+% potential for improvement in maintenanceefficiency in terms of maintenance time by providing proper com-putational support. If we include time spent on transit2 (necessarytransit) and transit3 (unnecessary transit), which is 534 minutes, thepotential for improvement researches 21+% in an ideal maintenanceprocess in which tradespeople only move from one place to the nextwhen starting and finishing the work order.
5. Conclusions
This paper discussed structural and individual inefficiencies inmaintaining equipment and facilities. The inefficiencies were devel-oped based on actual observations of O&M fieldwork. To collect rawdata from the Operations and Maintenance (O&M) practice, FacilitiesManagement Services (FMS) personnel were shadowed on avolunteer basis for four weeks.
Descriptive and statistical analyses with the obtained data revealquantitative results of inefficiencies in O&M fieldwork (similaritiesand correlations of time-at-task data and frequency-of-activitydata) from various perspectives. In case of time-at-task data, theresults of F-tests, ANOVA: single factor and ANOVA: two-factorswith replication indicate that the data distributions of O&M fieldworkby the electricians and the plumber are overall sufficiently similarfrom various perspectives. This suggests that when considering time-at-task aspects of the two trades (data from electricians andplumbers) one can combine their data together. In considering themaintenance activity categories (core maintenance activity (CMA),maintenance support activity (MSA), transit activity), the transitcategory may be the critical factor in the efficient execution of fieldwork because the highly correlated CMA (getting materials, spareparts and tools; carrying out maintenance requests specified in thework order; inspection; requesting collaboration) and all MSA aredependent on transit in most cases.
Excluding the conventional core maintenance activities suchas diagnosis, repair, and inspection that tradespeople conduct withequipment, most O&M activities observed are information-relatedactivities, for which they spent around 12+% of their total time. Theseactivities could easily be facilitated by providing proper computa-tional support. In addition, we observed that the current conditions
546 S. Lee, Ö. Akin / Automation in Construction 18 (2009) 536–546
of O&M information stored in computerized O&M systems and,especially, hard-copy documents are often old and therefore unreli-able due to the fact that the tradespeople tend to rely on their and/orcolleagues recall rather than computerized O&M systems when theycollect information on the specific equipment and the facility. This wasalso one of essential cause for O&M fieldwork inefficiency.
In order to complete work orders, various types of O&M in-formation are used, including performance-related data from sensors,equipment specifications, O&M history and drawings. It is obviousthat accurate information about equipment is critical to successfullycomplete O&M activities. ‘Accurate’ in this context means the correctspecification for a type of replacement part, the exact locationwhere awork order task has to be completed, or the correct contact numberand address for a person involved in the execution of the task, Other-wise, the O&M personnel have to perform additional informationcollection activities which can be time consuming. Moreover, asrevealed in the correlation analysis, those activities are often ac-companied by redundant transit activities. Consequently, this is asignificant factor in controlling O&M efficiency.
Therefore, there is a need for a computer based decision supportsystem that provides accurate information at the needed time sothat FMS personnel can minimize information retrieval time. In orderto improve the accuracy of information, such a system needs to bedesigned such that users update, easily and correctly, any changesthey made during O&M fieldwork. From the perspective of retrievinginformation, a computing strategy which supports ubiquitous infor-mation access needs to be considered so that O&M personnel canretrieve information without extra transit. Consequently, such asystem would enable O&M personnel to have more time for coreO&M activities. This would result in faster and more reliable O&M,which is the ultimate objective of primary research in this area,including the present one.
Acknowledgement
We would like to thank the tradespeople who volunteered for theshadowing activity. We are also grateful to Fernanda Leite and SharadOberoi for participating in the activity and collecting raw data. Thisresearch is underwritten by the National Institute of Standards andTechnology, grant numbers 60NANB5D1161 and 60NANB6D6157.
References
[1] Operations & Maintenance, http://www1.eere.energy.gov/femp/operations_maintenance/index.html, accessed on January 31, 2007.
[2] L. Mann Jr., Maintenance Management, Revised ed., 1984 Lanham, Maryland.[3] B. Chanter, P. Swallow, Building Maintenance Management, London, Great Britain,
1996.[4] D.G. Cotts, M. Lee, The Facility Management Handbook, New York, New York, 1992.[5] L.Y. Liu, A.L. Stumpf, S.S. Kim, F.M. Zbinden, Capturing as-built project information
for facility management, Proc. the First Congress held in conjunction with A/E/CSystems'94, 1994, pp. 614–621, USA.
[6] E. Teicholz, Bridging the AEC technology gap, IFMA Facility Management Journal,March–April, 2004, Retrieved on February 10, 2007, from http://www.bricsnet.com/content/Teicholz.pdf.
[7] Pacific Northwest National Laboratory, DSOM®— Decision Support for Operations&Maintenance, Retrieved on February 15, 2007, fromhttp://www.pnl.gov/dsom/.
[8] R.J. Meador, Maintaining the solution to operations and maintenance efficiencyimprovement, Pacific Northwest National Laboratory, PNL-SA-26005, Richland,Washington, 1995.
[9] PECI, Operations & Maintenance Best Practices: A Guide to Achieving OperationalEfficiency, 1999.
[10] G.L. Thomas, Operations and maintenance, in: E. Teicholz (Ed.), Facility Design andManagement Handbook, New York, New York, 2001, p. 22.10.
[11] Z. Anadol, Ö. Akin, Case study one: Facility design and management at CarnegieMellon University, , 2000.
[12] M.J. Clayton, R.E. Johnson, Y. Song, J. Al-Qawasmi, A Study of Information Contentof As-Built Drawings for USAA, , 1998 Retrieved January 14, 2007, from http://archone.tamu.edu/crs//documents/publications/asbuilt.pdf.
[13] D. Fleming, Facilities management: a behavioural approach, Facilities 22 (1/2)(2004) 35–43.
[14] I.M. Shohet, S. Lavy, Development of an integrated healthcare facilities managementmodel, Facilities 22 (5/6) (2004) 129–140.
[15] K. Alexander, A strategy for facilitiesmanagement, Facilities 21 (11/12) (2003) 269–274.[16] D. Kincaid, Integrated facility management, Facilities 12 (8) (1994) 20–23.[17] M.R. Sekula, Your first 60 days as head of facilities, Facilities 22 (9/10) (2004)
228–232.[18] M.A. El-Haram, A. Agapiou, The role of the facility manager in new procurement
routes, Journal of Quality in Maintenance Engineering 8 (2) (2002) 124–134.[19] E. Ergen, Formalization of Life Cycle Information of Engineered-to-Order
Components Using Advanced Tracking Technologies, Ph.D. Thesis, Departmentof Civil and Environmental Engineering, Carnegie Mellon University, 2005.
[20] H. Kilov, From semantic to object-oriented data modeling, Proc. the firstinternational conference on systems integration on Systems integration ’90,1990, pp. 385–393, USA.
[21] K.E.Wiegers, SoftwareRequirements, 2nd ed.Microsoft Press, Redmond,Washington,2003.