
Shadow Carbon Pricing and the Role of Development Banks · Shadow Carbon Pricing and the Role of...
34
Shadow Carbon Pricing and the Role of Development Banks ‘NAFIN Fellowship Programme’ Working Paper No 2 Cesar Gabriel Espinosa García [email protected] Nacional Financiera, S.N.C. (NAFIN) NAFIN Visiting Fellow at LSE LACC and Grantham Institute March 2018
Transcript of Shadow Carbon Pricing and the Role of Development Banks · Shadow Carbon Pricing and the Role of...
Shadow Carbon Pricing and
the Role of Development
Banks
‘NAFIN Fellowship Programme’ Working Paper No 2
Cesar Gabriel Espinosa García [email protected]
Nacional Financiera, S.N.C. (NAFIN) NAFIN Visiting Fellow at LSE LACC and Grantham Institute
March 2018

Shadow Carbon Pricing and the Role of
Development Banks ‘NAFIN Fellowship Programme’ Working Paper No 2
Cesar Gabriel Espinosa García
March 2018

Note
The NAFIN Visiting Fellow programme is hosted by the Latin America and Caribbean
Centre (LACC), the Grantham Research Institute on Climate Change and the Environment
(GRI) at the LSE. The programme supports one fellow each year to ‘address the challenges
to international climate finance flows from the perspective of the national development
bank’. The views expressed in this Working Paper do not reflect the position of the LSE,
the LACC, NAFIN or the GRI.
Contents
Abstract 1
Introduction 1
1. Mexico and Climate Change 3
Actions Taken 3
Green Bond Market in Mexico 5
Mexico’s First Emission Trading System (ETS) 8
2. Nacional Financiera and climate change. 10
3. Price of Carbon Explained 10
Concept 10
Carbon Taxes and Emissions Trading Systems (ETS) 13
Drawbacks, Limitations and Resilience 15
4. Shadow Carbon Price (SCP) 16
Development Banks and SCP 16
Development Banks: How to Finance a Green Agenda? 19
5. Carbon Risk Management 20
6. Conclusion 22
Bibliography 24
1
Abstract
Carbon pricing is proposed by many economists as a means to avoid a future increase of
more than 2°C in global temperature. Although there is a consensus that carbon pricing is a
potential solution, there is a debate about the real value that needs to be set to reach this
goal. However a derivation of carbon pricing allows an institution or firm to internalize the
carbon costs available. Shadow carbon pricing (SCP) represents a way to acknowledge the
potential carbon cost, and in such a way that firms, institutions and other stakeholders
reduce greenhouse gas (GHG) emissions globally in advance of possible stricter regulation.
In this context, development banks can play a very important role to promote incentives for
internationalization and to encourage, implement and disseminate use of the concept.
Introduction
As levels of pollution and greenhouse gas (GHG) emissions released to the atmosphere
have increased, concerns about the potentially devastating impacts of climate change to
nature, economy and welfare have also risen. Yet, efforts to address climate change have
had a mixed record. The Kyoto Protocol adopted in 1997 and which entered into force in
2005, have tried to establish commitments from the 195 adopter countries to reduce GHG
emissions. Unfortunately, countries such as Canada, Japan, New Zealand and Russia
abandoned the agreement in 2012 to the frustration of other countries that had already
delivered on some or most of the targets. A second effort at a global agreement was marked
by the 2015 COP 21 in Paris at which a more ambitious set of goals and commitments were
set out, of which the most important was to limit the increase of the global temperature to
below 2° Celsius (UN, 2015). To meet this goal most countries subscribed to the Intended
Nationally Determined Contributions (INDCs), where they pledged to take actions that
would contribute to their GHGs emissions. As part of their commitment, Mexico pledged to
reduce its GHG emissions by 22% by 2030 and by 50% by 2050.
In order to reduce carbon emission and meet the COP 21 goals a number of approaches
have been proposed and critiqued. One simple but powerful idea has been carbon pricing.
This approach addresses climate change as an externality that is inherent to market failure,
as for example described by Nicholas Stern, the author of the Stern Review (HM Treasury
2006). The core of the concept is that by setting a price to the environmental damage
(measured in terms of GHG emissions due to a specific activity or activities) caused by
firms, institutions or individuals the externality can be identified, quantified and addressed.
In simple terms, this means that the more GHG emissions are released, the more the
identified producer should pay. In theory, putting a price on carbon acts as an incentive for
organisations or individuals to cut GHGs emissions. If the carbon price is high enough, it
can motivate the implementation of switching from high to low-carbon technologies (for
example, transitioning to renewable or more efficient technologies), a change in procedures
(for example to implement a less resource-intensive use or better waste management), or
revised project assessments by taking into consideration the cost of emissions as a “new”
factor.
In order for carbon pricing to lead to corrective actions, new economic resources are
required. Development Banks therefore have a potential role in the transition to a
2
sustainable economy by deploying important financial resources to small, medium and
large projects (Garmendia 2017). Moreover, development banks could lead the way and
attend to specific market failures (through enabling development and availability of new
technologies for example) and support projects that commercial banks or other financial
institutions do not usually consider because of risk assessments. This transition has already
started and since the role of carbon pricing is becoming more important, it is time to
develop and analyse new financial models to support more projects. By studying carbon
pricing, we are able to estimate the potential financial needs of organisations, as well as
anticipate appropriate regulatory changes and to minimize the adverse financial impacts of
such regulations. We will also be able to look for new ways to implement carbon pricing in
internal credit models and address new types of risks such as carbon risks in investment
portfolios. In this working paper, I will discuss these topics and try to bring a general scope
in order to motivate new ideas, suggestions, and ways of thinking.
Carbon pricing is a theoretical concept which accounts for the damage and the cost of
carbon, includes theoretical discount factors, economic complex models and is usually
considered from a global rather than local perspective. The paper will therefore consider in
closer detail a more applied derivation of the concept, the Shadow Carbon Price (SCP).
There is a growing attention to SCPs. In 2014, six leading multilateral development banks
(MDBs) committed to the implementation of ambitious climate actions began to consider
the adoption of a SCP where appropriate, that along with other measures for GHG emission
projects, was considered to offer an enhanced perspective of the environmental impact of
such projects. In December 2017, at the One Planet Summit the World Bank Group
committed to applying a SCP in the economic analysis for all International Bank for
Reconstruction and Development (IBRD)/International Development Association (IDA)
projects in key high emission sectors where design had begun from July 2017. The
International Finance Corporation (IFC) had already started using carbon pricing in January
2017 and it intends to mainstream the concept from start 2018. This growing attention
suggests that MDBs believe they can play an important role demonstrating the
opportunities of investing in sustainable projects and help other financial institutions to
mitigate risks associated with a risk-return analysis by mainstreaming the concept of SCP
across economic sectors.
This working paper attempts to learn from some of the actions of MDBs in using the SCP
in order to understand whether it might be feasible to mainstream the concept in Mexican
development banks, or in particular within Nacional Financiera (NAFIN). The potential is
for SCPs to complement actions already taken by MDBs and to increase the contribution
towards achieving Mexico’s objectives as stated in its Intended Nationally Determined
Contributions (INDCs) to meet the goals set at Paris COP 21.
3
1. Mexico and Climate Change
Actions Taken
In October of 2012, the General Law for Climate Change entered into force (GLCC, Ley
General de Cambio Climático in spanish). The Law established a set of policies to meet
important objectives; specifically:
By 2020, reduction of 30% of GHG emissions versus a baseline.
By 2024, at least 35% of power generation should come from clean energy.
By 2050, a reduction of 50% of GHG emissions versus the baseline year in 2000.
A net zero rate of carbon loss, although no deadline had been defined in 2012, at
Paris COP21 Mexico pledged a zero deforestation rate by 2030.
Derived from this GLCC, there was a specific mandate for the federal government to
elaborate the National Climate Change Strategy (Estrategia Nacional de Cambio Climático)
which is the planning instrument.
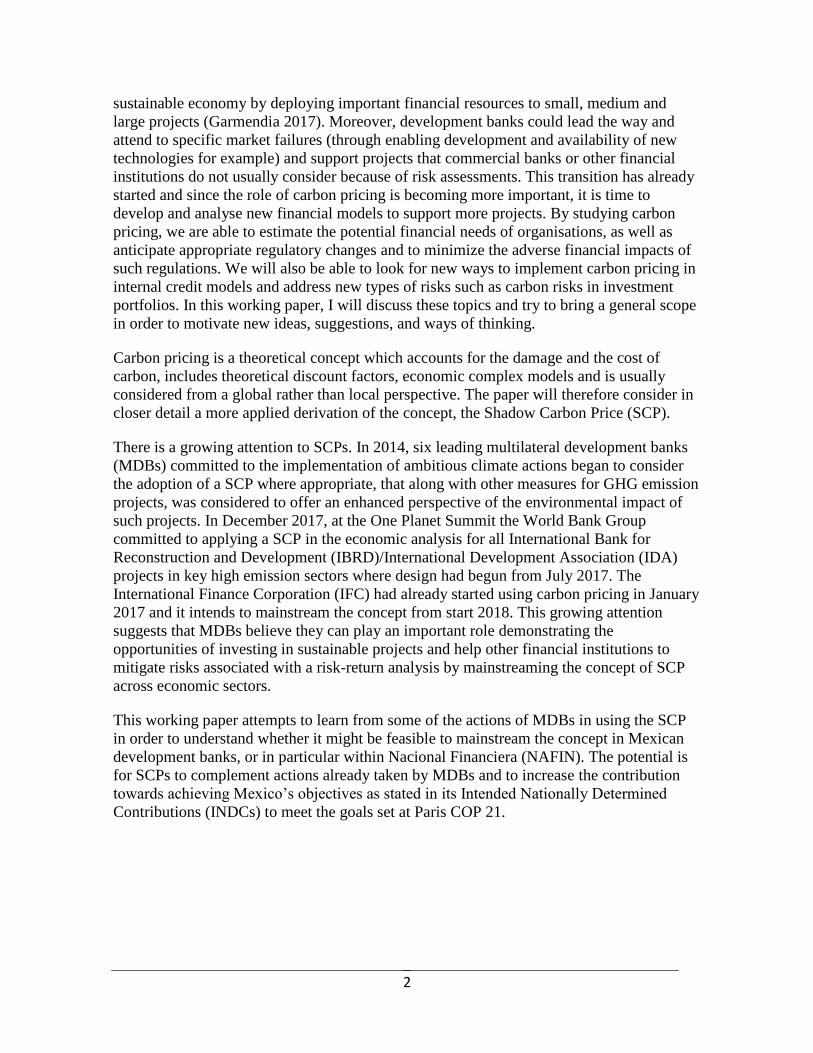
After the GLCC was released, the government had one year to install and operate the
National System for Climate Change or NSCC (Sistema Nacional de Cambio Climático).
This system was created with the objective of achieving coordination among public, private
and social sectors by identifying synergies to face jointly the vulnerabilities and risks of the
country and to establish actions of mitigation and adaptation (Gobierno de la República
2013). Figure 1 shows the different participants within this national system.
Figure 1: National System for Climate Change
Source: (SEMARNAT-INECC 2016)
4
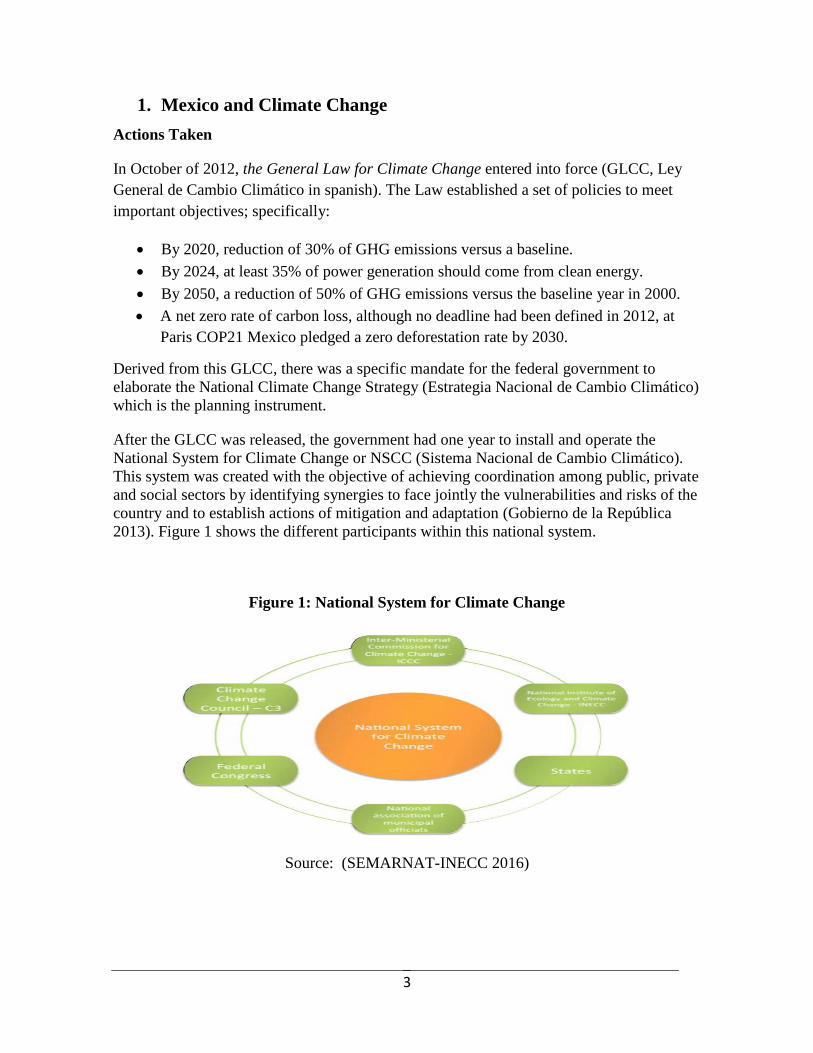
In 2015 Mexico signed up to the Paris accord, becoming the first developing country to
submit its INDCs, pledging to reduce CO2 emissions in 22% by 2030 (Figure 2) and in
50% by 2050.
Figure 2: Mexico’s Target Business as Usual (BAU)
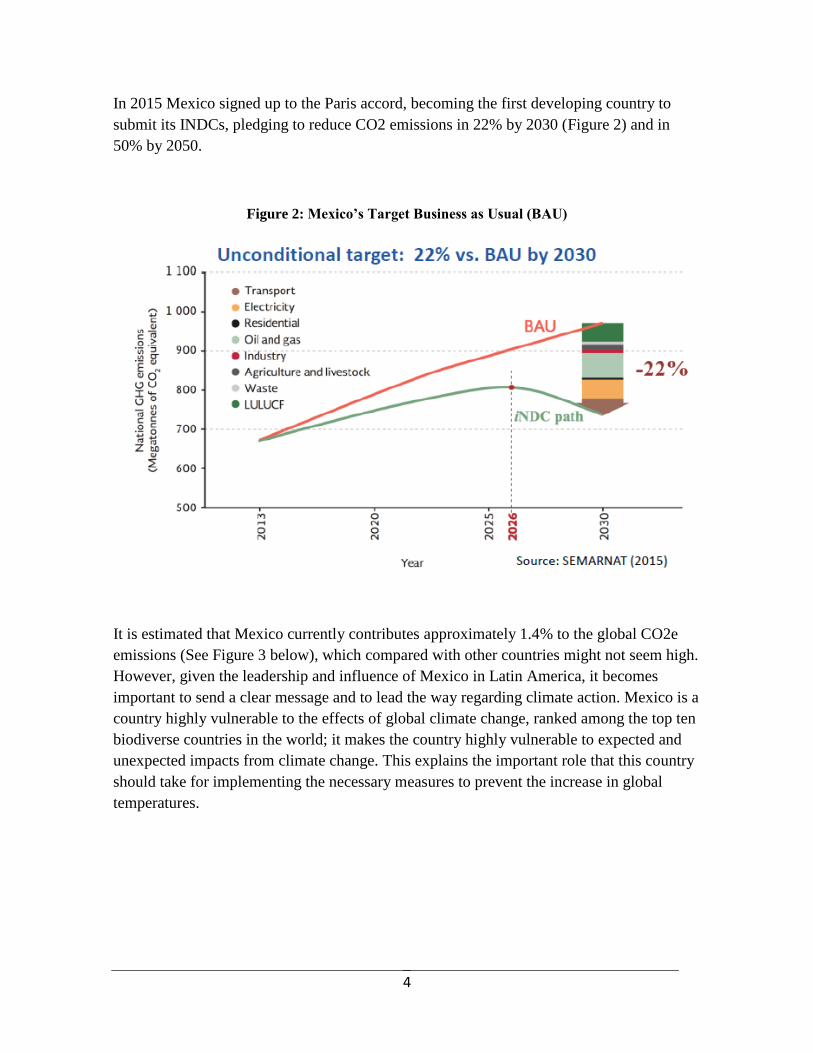
It is estimated that Mexico currently contributes approximately 1.4% to the global CO2e
emissions (See Figure 3 below), which compared with other countries might not seem high.
However, given the leadership and influence of Mexico in Latin America, it becomes
important to send a clear message and to lead the way regarding climate action. Mexico is a
country highly vulnerable to the effects of global climate change, ranked among the top ten
biodiverse countries in the world; it makes the country highly vulnerable to expected and
unexpected impacts from climate change. This explains the important role that this country
should take for implementing the necessary measures to prevent the increase in global
temperatures.
5
Figure 3: World’s CO2 Contribution by Country
Green Bond Market in Mexico
In 2015, Mexico entered the global green bonds market when Nacional Financiera issued
the first dollar-denominated green bond by a Mexican financial institution. This was
followed by a second green bond, this time in Mexican pesos in 2016. Three more issuers
have followed this example including Banobras, another Mexican development bank that
issued the first sustainable bond in 2017. The graph below shows the growth of the green
bonds market in Mexico in recent years (Figure 4).
6
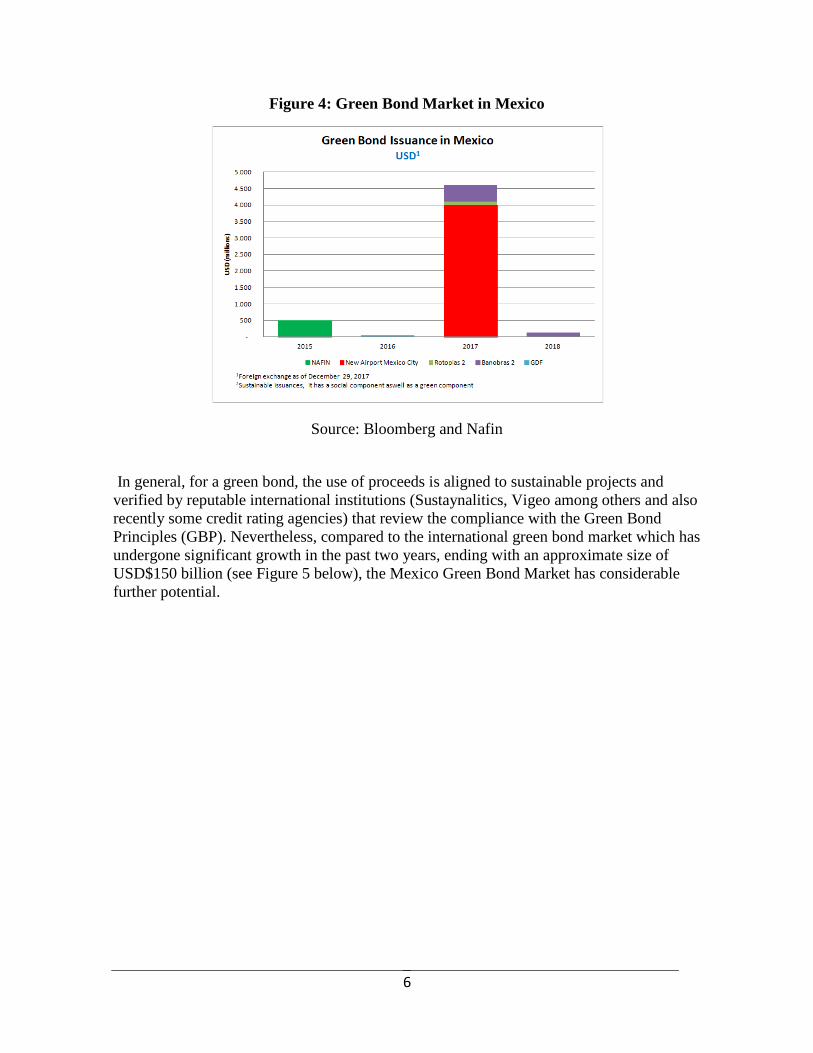
Figure 4: Green Bond Market in Mexico
Source: Bloomberg and Nafin
In general, for a green bond, the use of proceeds is aligned to sustainable projects and
verified by reputable international institutions (Sustaynalitics, Vigeo among others and also
recently some credit rating agencies) that review the compliance with the Green Bond
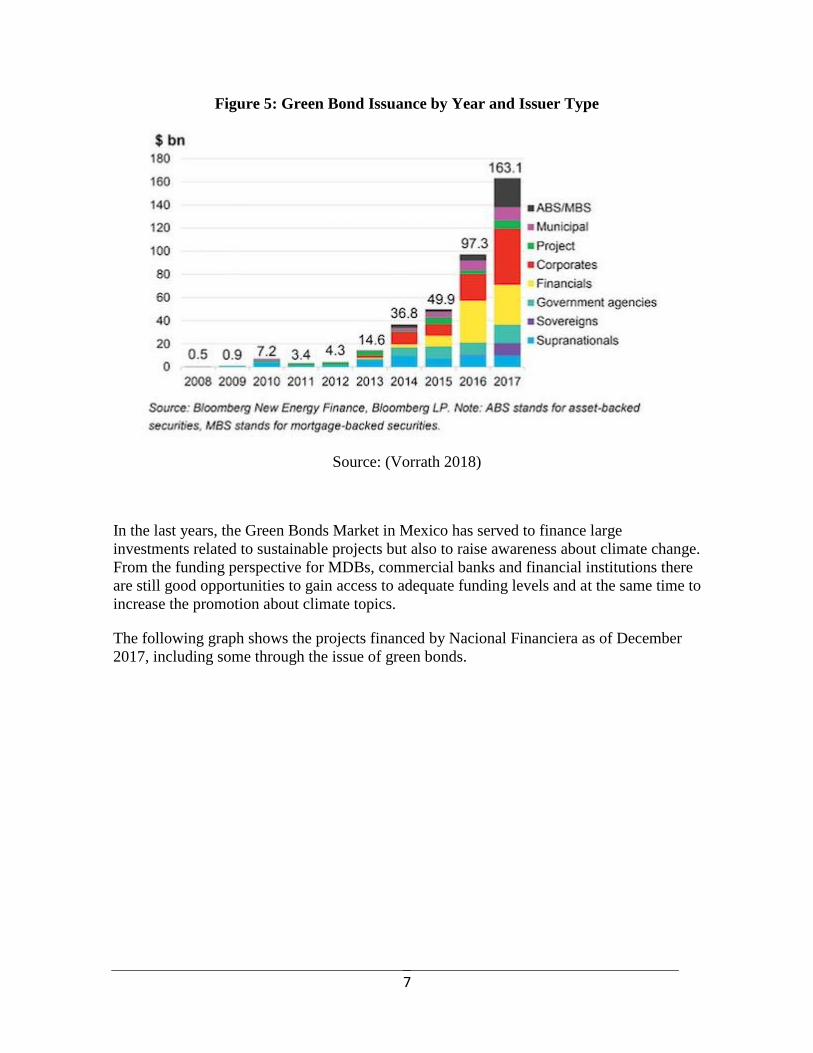
Principles (GBP). Nevertheless, compared to the international green bond market which has
undergone significant growth in the past two years, ending with an approximate size of
USD$150 billion (see Figure 5 below), the Mexico Green Bond Market has considerable
further potential.
7
Figure 5: Green Bond Issuance by Year and Issuer Type
Source: (Vorrath 2018)
In the last years, the Green Bonds Market in Mexico has served to finance large
investments related to sustainable projects but also to raise awareness about climate change.
From the funding perspective for MDBs, commercial banks and financial institutions there
are still good opportunities to gain access to adequate funding levels and at the same time to
increase the promotion about climate topics.
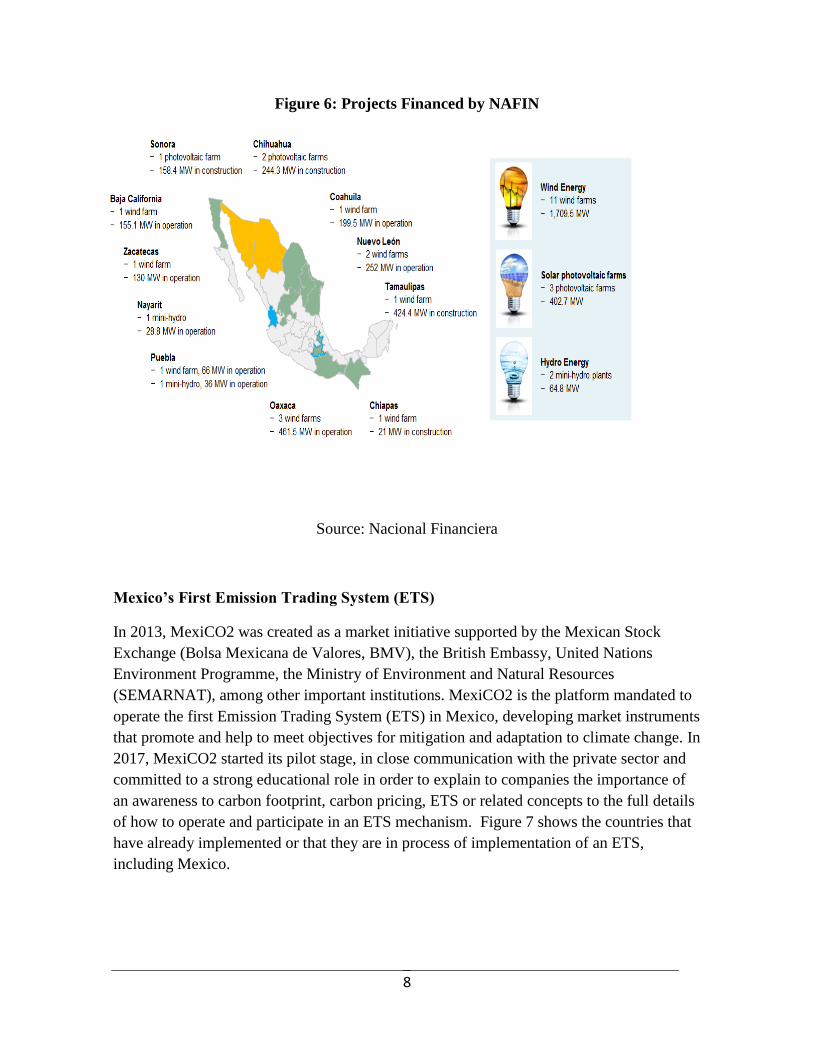
The following graph shows the projects financed by Nacional Financiera as of December
2017, including some through the issue of green bonds.
8
Figure 6: Projects Financed by NAFIN
Source: Nacional Financiera
Mexico’s First Emission Trading System (ETS)
In 2013, MexiCO2 was created as a market initiative supported by the Mexican Stock
Exchange (Bolsa Mexicana de Valores, BMV), the British Embassy, United Nations
Environment Programme, the Ministry of Environment and Natural Resources
(SEMARNAT), among other important institutions. MexiCO2 is the platform mandated to
operate the first Emission Trading System (ETS) in Mexico, developing market instruments
that promote and help to meet objectives for mitigation and adaptation to climate change. In
2017, MexiCO2 started its pilot stage, in close communication with the private sector and
committed to a strong educational role in order to explain to companies the importance of
an awareness to carbon footprint, carbon pricing, ETS or related concepts to the full details
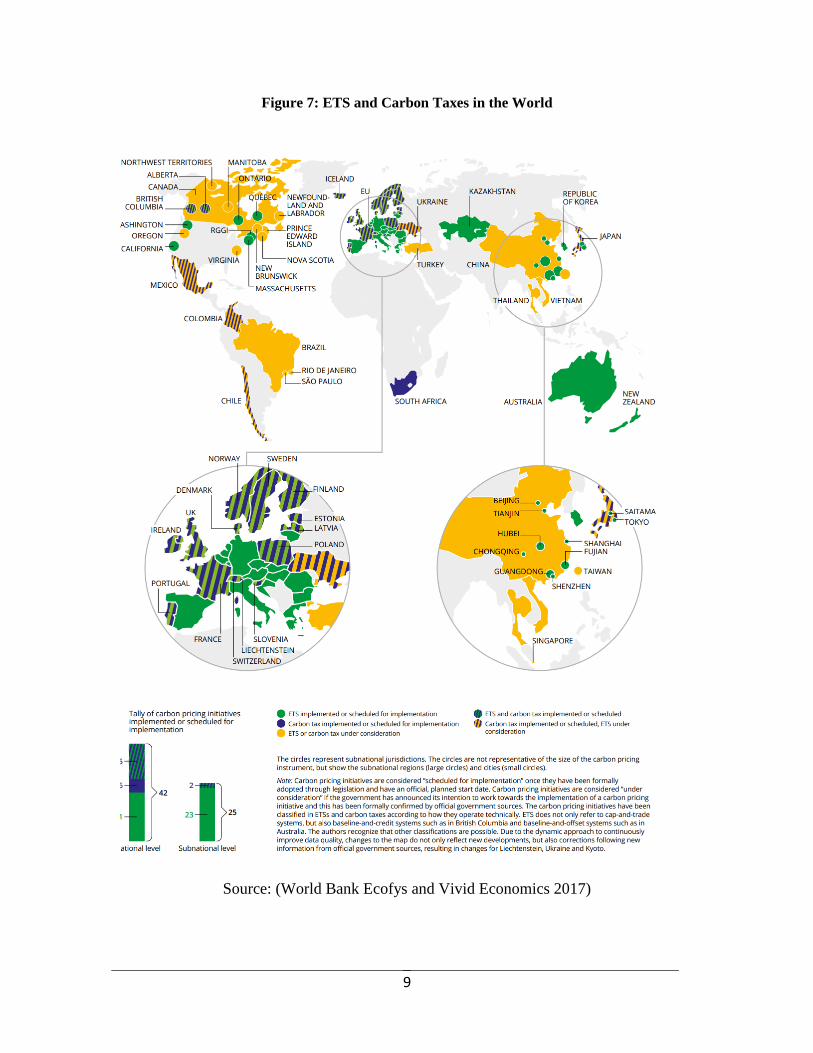
of how to operate and participate in an ETS mechanism. Figure 7 shows the countries that
have already implemented or that they are in process of implementation of an ETS,
including Mexico.
9
Figure 7: ETS and Carbon Taxes in the World
Source: (World Bank Ecofys and Vivid Economics 2017)
10
2. Nacional Financiera and climate change. Nacional Financiera (NAFIN) has played a key role in supporting Mexico’s strategy to
address climate change. In 2009, the Sustainable Project Division was created and NAFIN
became the first bank to finance a wind farm in Mexico. Rather than compete with
commercial banks, NAFIN has complemented their actions. Currently, NAFIN participates
in syndicate loans with other development and commercial banks, and the sustainable
projects portfolio has evolved from purely wind projects, to small-scale hydroelectric, solar,
and recently, geothermal projects. Moreover, the projects supported by NAFIN and other
Mexican development banks have evolved and, today, commercial banks have entered the
market to provide finance now that the projects are graded as profitable and risk associated
to them has decreased.
As attention to carbon pricing has increased development banks are presented with new
opportunities for innovation and intervention. Development banks should be proactive in
coming years since finance will be needed for smaller enterprises and other institutions. As
a shadow price is internalized into the business processes and project evaluation, the need
for more financial resources in this transition is evident. A better understanding of the
potential of Shadow Pricing presents to development banks with a different set of tools, that
might be a useful means to address climate change in a context of a more aggressive carbon
tax regime.
3. Price of Carbon Explained
Concept
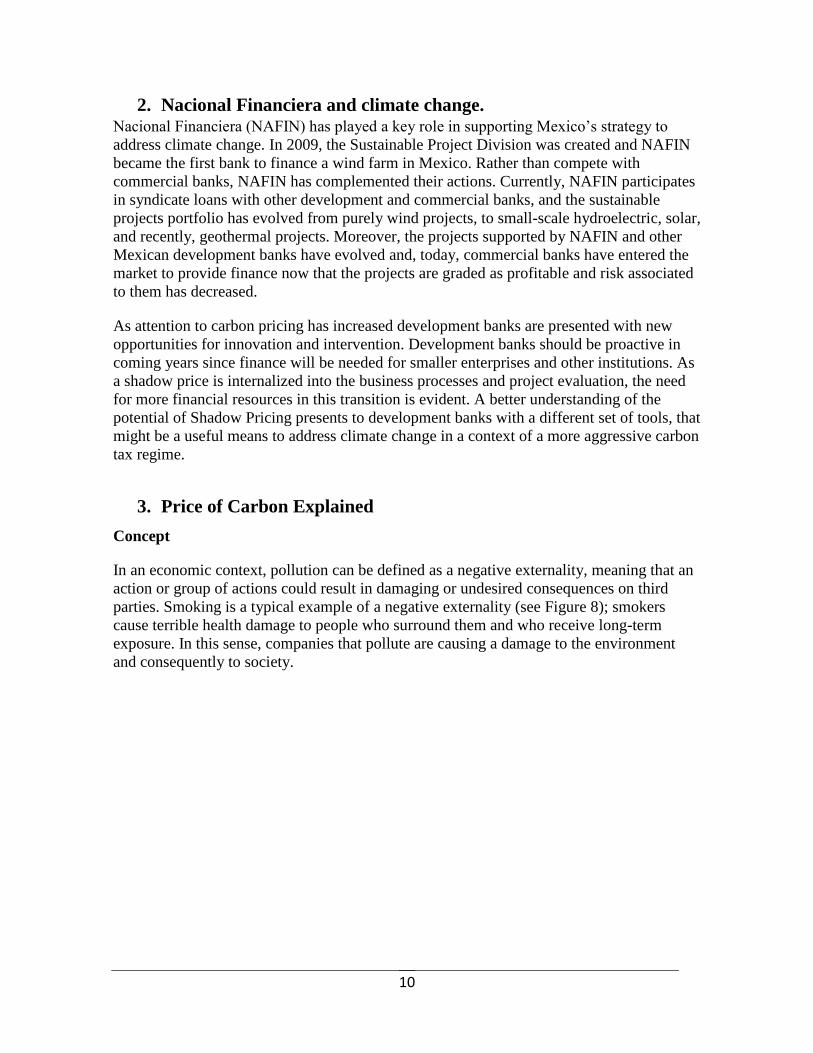
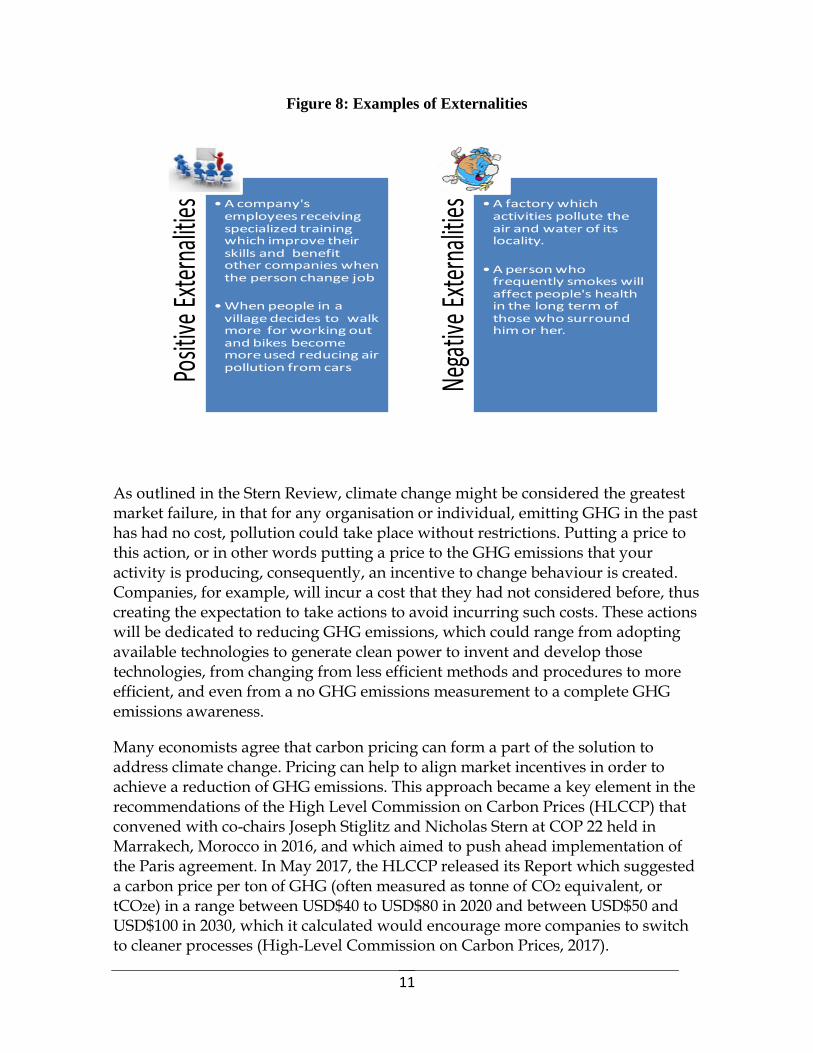
In an economic context, pollution can be defined as a negative externality, meaning that an
action or group of actions could result in damaging or undesired consequences on third
parties. Smoking is a typical example of a negative externality (see Figure 8); smokers
cause terrible health damage to people who surround them and who receive long-term
exposure. In this sense, companies that pollute are causing a damage to the environment
and consequently to society.
11
Figure 8: Examples of Externalities
As outlined in the Stern Review, climate change might be considered the greatest market failure, in that for any organisation or individual, emitting GHG in the past has had no cost, pollution could take place without restrictions. Putting a price to this action, or in other words putting a price to the GHG emissions that your activity is producing, consequently, an incentive to change behaviour is created. Companies, for example, will incur a cost that they had not considered before, thus creating the expectation to take actions to avoid incurring such costs. These actions will be dedicated to reducing GHG emissions, which could range from adopting available technologies to generate clean power to invent and develop those technologies, from changing from less efficient methods and procedures to more efficient, and even from a no GHG emissions measurement to a complete GHG emissions awareness.
Many economists agree that carbon pricing can form a part of the solution to address climate change. Pricing can help to align market incentives in order to achieve a reduction of GHG emissions. This approach became a key element in the recommendations of the High Level Commission on Carbon Prices (HLCCP) that convened with co-chairs Joseph Stiglitz and Nicholas Stern at COP 22 held in Marrakech, Morocco in 2016, and which aimed to push ahead implementation of the Paris agreement. In May 2017, the HLCCP released its Report which suggested a carbon price per ton of GHG (often measured as tonne of CO2 equivalent, or tCO2e) in a range between USD$40 to USD$80 in 2020 and between USD$50 and USD$100 in 2030, which it calculated would encourage more companies to switch to cleaner processes (High-Level Commission on Carbon Prices, 2017).
Posit
ive E
xter
nalit
ies •A company's employees receiving specialized training which improve their skills and benefit other companies when the person change job
•When people in a village decides to walk more for working out and bikes become more used reducing air pollution from cars
Nega
tive
Exte
rnali
ties •A factory which
activities pollute the air and water of its locality.
•A person who frequently smokes will affect people's health in the long term of those who surround him or her.
12
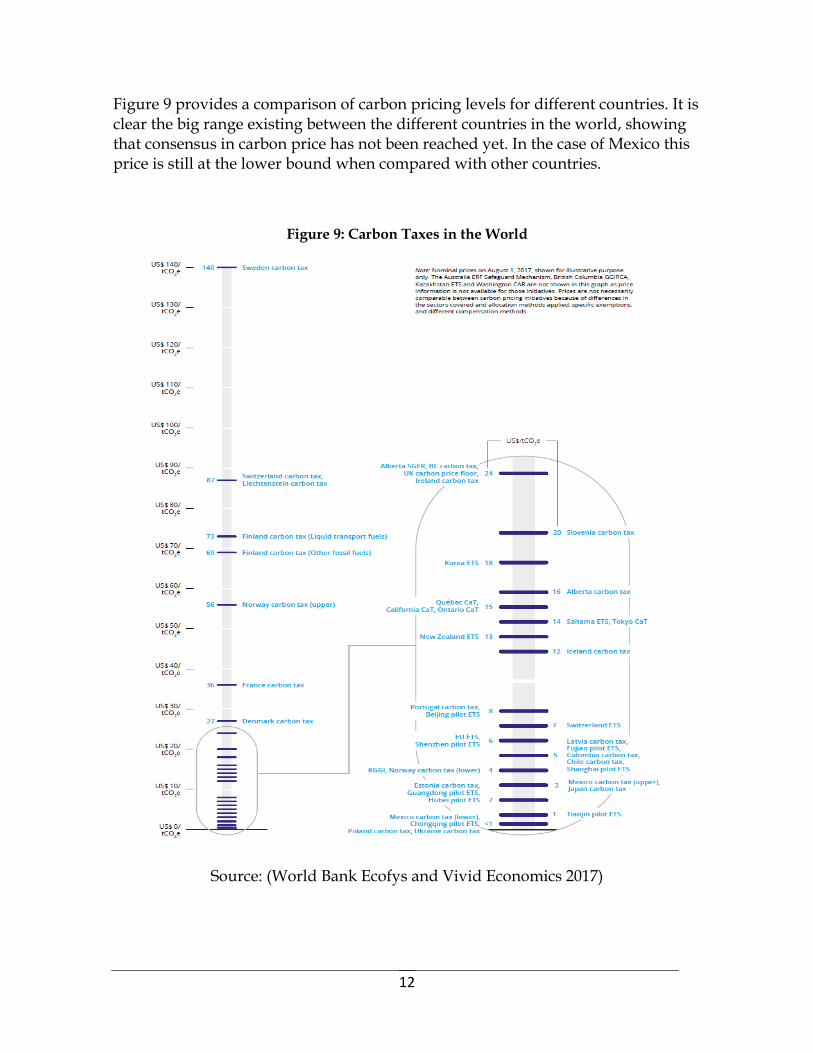
Figure 9 provides a comparison of carbon pricing levels for different countries. It is clear the big range existing between the different countries in the world, showing that consensus in carbon price has not been reached yet. In the case of Mexico this price is still at the lower bound when compared with other countries.
Figure 9: Carbon Taxes in the World
Source: (World Bank Ecofys and Vivid Economics 2017)
13
Carbon Taxes and Emissions Trading Systems (ETS)
The interest in carbon pricing as a means to reduce GHG emission prompts attention to how to design appropriate policies to attain this outcome. Here, I will discuss two common approaches. Carbon tax regimes have been implemented in many countries, including Mexico which implemented a carbon tax in 2013. But, if the rate is set too low then a carbon tax may not be sufficient to create an incentive for companies to transition to more environmentally friendly practices, and they may instead be willing to pay to pollute (in environmental law known as Polluters Pay Principle).
A different approach is the so-called cap-and-trade systems or emission trading system (ETS). In its general form, an ETS is a platform dedicated to the trade of carbon allowances between companies. The allowances are codified as government issued permits that sanction a certain quantity of GHG emission within a country. Each permit is equivalent to a certain number N tCO2e, so that a Company A that receives X number of permits, there is an allowance to emit Y=X*N tCO2es per year. If Company A goes beyond Y, it will have to pay a charge determined (carbon price) by the excess CO2 ton emitted. In the event, however, that another company, Company B, has introduced a new cleaner technology that allows it to save permits, then it can sell them to Company A and benefit from its decision to switch to more eco-friendly technologies. This exchange, in the form of a trade, takes place through the ETS platform. In the most positive scenario, the revenues received by Company B from the sale of its permits may be used to invest in new eco-technologies, thereby creating a virtuous cycle.
For a government that wants to reduce the total GHG emission, there is an opportunity to cap the number of permits. This limit should create the incentive for a new market, where those who transition faster to less carbon-intensive technologies, will be able to sell their surplus to those who have not. These trades will occur below the cap imposed by the government. In subsequent years, the government may reduce the cap compared with the previous year, while signalling that companies have time to adapt in order to reduce their GHG emissions.
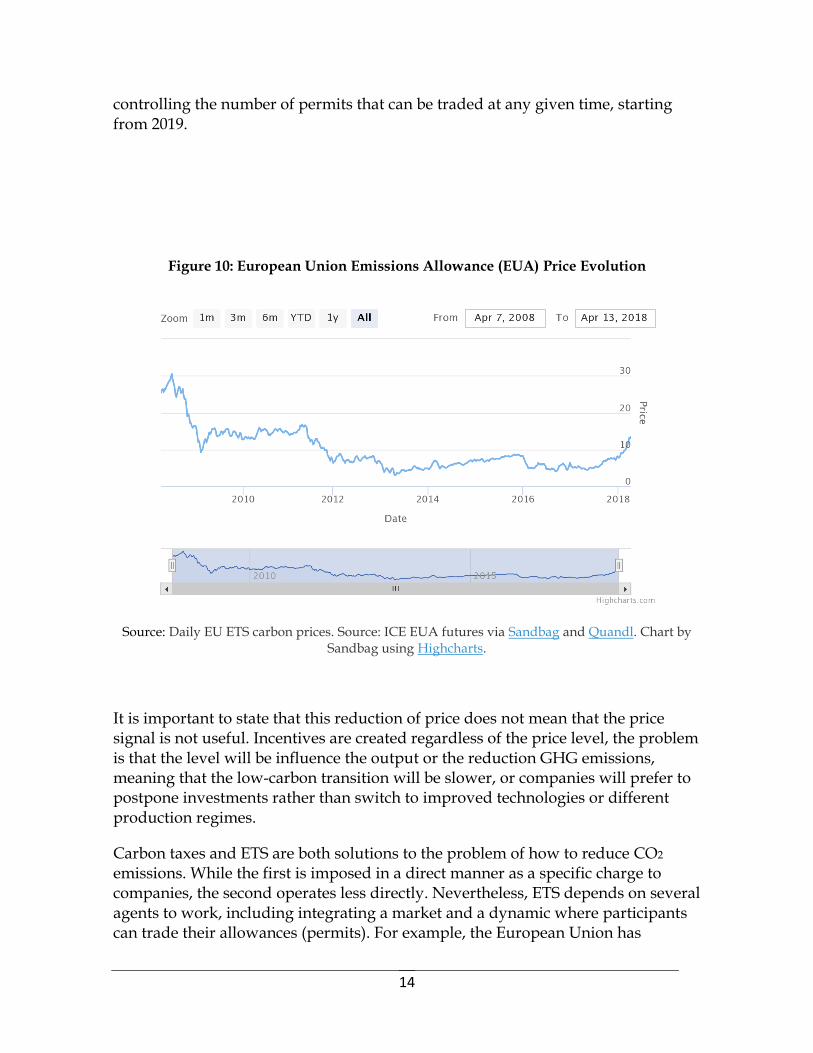
The experience of ETS has been extremely mixed (Evans 2017). In the period 2008-2012, prices reached a maximum level of €30 per tonne, however following the economic crisis led to a reduction in industrial activity, which in turn meant the expected pollution levels were much below the total cap for the given years. This meant the supply of permits (as set by the cap) was greater than demand for permits (due to the lower pollution levels from a decreased industrial output). This surplus brought prices down to between €4 and €8 per tonne thorough 2016 and 2017 (see Figure 10). Due to the large surplus of permits caused by the recession, the European Union passed reforms to create a price stability mechanism by
14
controlling the number of permits that can be traded at any given time, starting from 2019.
Figure 10: European Union Emissions Allowance (EUA) Price Evolution
Source: Daily EU ETS carbon prices. Source: ICE EUA futures via Sandbag and Quandl. Chart by Sandbag using Highcharts.
It is important to state that this reduction of price does not mean that the price signal is not useful. Incentives are created regardless of the price level, the problem is that the level will be influence the output or the reduction GHG emissions, meaning that the low-carbon transition will be slower, or companies will prefer to postpone investments rather than switch to improved technologies or different production regimes.
Carbon taxes and ETS are both solutions to the problem of how to reduce CO2 emissions. While the first is imposed in a direct manner as a specific charge to companies, the second operates less directly. Nevertheless, ETS depends on several agents to work, including integrating a market and a dynamic where participants can trade their allowances (permits). For example, the European Union has
15
operated the largest ETS since 2005, involving 28 members of the EU and 3 non-member states. Now in its third phase, the EU ETS puts a carbon pricing mechanism for about 11,000 large installations that account for almost 50% of the total GHGs in the EU. It is thus an important policy instrument to help the EU meet its target to reduce 40% of GHG emissions by 2030 as part of its INDCs (Evans 2017). Another example of an ETS is in the state of California in the United States, which has been operating since 2013, which has achieved greater than expected reductions of GHGs. In 2015 a multilateral linked ETS was established between the Canadian province of Quebec and California, and the province of Ontario joined this multilateral ETS in 2018 (World Bank Ecofys and Vivid Economics 2015).
Drawbacks, Limitations and Resilience
Although the carbon price schemes offer important benefits, as we have seen, it is necessary to highlight a number of drawbacks.
First, there are many other types of negative externalities for example, network lock-in for carbon intensive infrastructure, innovation or new technology - that carbon pricing is not adept at addressing. And, differently, it seems infeasible as a mechanism to retro-fit urban infrastructure in order to transition to more eco-friendly and sustainable cities. Therefore carbon pricing schemes are likely to be one of many solutions to prevent climate change and governments need to think holistically about how to address other externalities in order to enable decarbonisation.
Second, there is no agreement on setting the right level of carbon price in order to reach a goal to limit the increase in global temperature to 2 degrees. Theoretically, the “correct” price should be the one that is necessary to abate GHG emissions in the future (Price, Thornton, and Nelson 2007). However it can be very difficult to establish a level given how many factors need to be considered. The general consensus seems to be that carbon prices are low – and too low to meet Paris Agreement objectives - and it has been widely discussed in academia that a new generation of climate models are required in order to better establish a suitable level (Farmer et al. 2015)..
Third, economies demonstrate a strong resilience aversion to change due mainly to dependency on fossil fuels (often referred to as carbon lock-in) and riskiness associated with low-carbon technologies. In many countries, this lock-in against change is confirmed by governments that have exempted carbon taxes for certain sectors, or in an ETS-scheme, given free allowances to certain installations, as a
16
way to politically appease the economic interests of these industries.(Breslow 2012).
4. Shadow Carbon Price (SCP) The shift of interest toward carbon prices as a means to address the Paris Agreement goals has motivated companies to find ways to reduce future regulatory uncertainty. The premise is that governments could implement a carbon price through establishing an ETS or a carbon tax. Companies would thus need to anticipate the potential cost of a carbon price to their business. To hedge for this future risk, companies are starting to incorporate a hypothetical carbon price into their investment decisions, an approach that is referred to as a shadow carbon price (SCP). An extensive use of a higher shadow carbon price might offset low carbon prices and could assist with meeting climate change goals.
For governments the benefit of a SCP used intensively will be to allow greater caution in the implementation of more direct carbon price measures that could damage particular sectors or economic activity generally, especially if implemented too quickly without allowing an adequate period for firms to adapt.
SCP allows an internalization of the concept within company business model before regulation enters into force, meaning a more moderate transition for companies with reduced costs compared with those that may come with a sudden change of regulations or higher carbon taxes.
Development Banks and SCP
Although shadow carbon prices are not used extensively by different economic actors at this point in time, this approach raises important issues for the role of other institutions to also use SCP in their investment decisions, such as development banks. It is possible, for example, to consider development banks using higher levels of SCP in credit assessments as a means to promote among companies, institutions and other stakeholders the benefits of this transition and shift more resources towards sustainable projects. There is little doubt that a major mobilization of financial resources is needed and MDBs will therefore need significant expansion in their lending capacities.
Shadow carbon price will become a tool for development banks since theoretically they allow a de-prioritization of high emissions projects if it is used internally within financial appraisals.
In 2014, the African Development Bank Group (ADBG), the Asian Development Bank (ADB), the European Bank for Reconstruction and Development (EBRD), the

17
European Investment Bank (EIB), the Inter-American and Development Bank (IDB) and the World Bank Group (WBG), committed to the implementation of ambitious climate actions. Among them there are the following:
Leveraging their resources to reinforce climate finance.
Developing and applying innovative ideas. Mainstreaming assessment of climate risk throughout their core operations (this
includes the use of carbon price in appropriate cases)
And to promote harmonized, transparent and robust climate finance reporting.
In other similar case, the WBG made the following announcements at the One Planet Summit in Paris in December 2017.
The WBG will no longer finance upstream oil and gas after 2019 (bar exceptional circumstances).
Ramping up WBG climate ambition through its Climate Change Action Plan. Transparency and disclosure to drive their own decarbonization. Here the WBG
will apply a SCP in the economic analysis of all IBRD/IDA projects in key high emission sectors.
Mobilizing finance for transformation in mitigation and climate resilience.
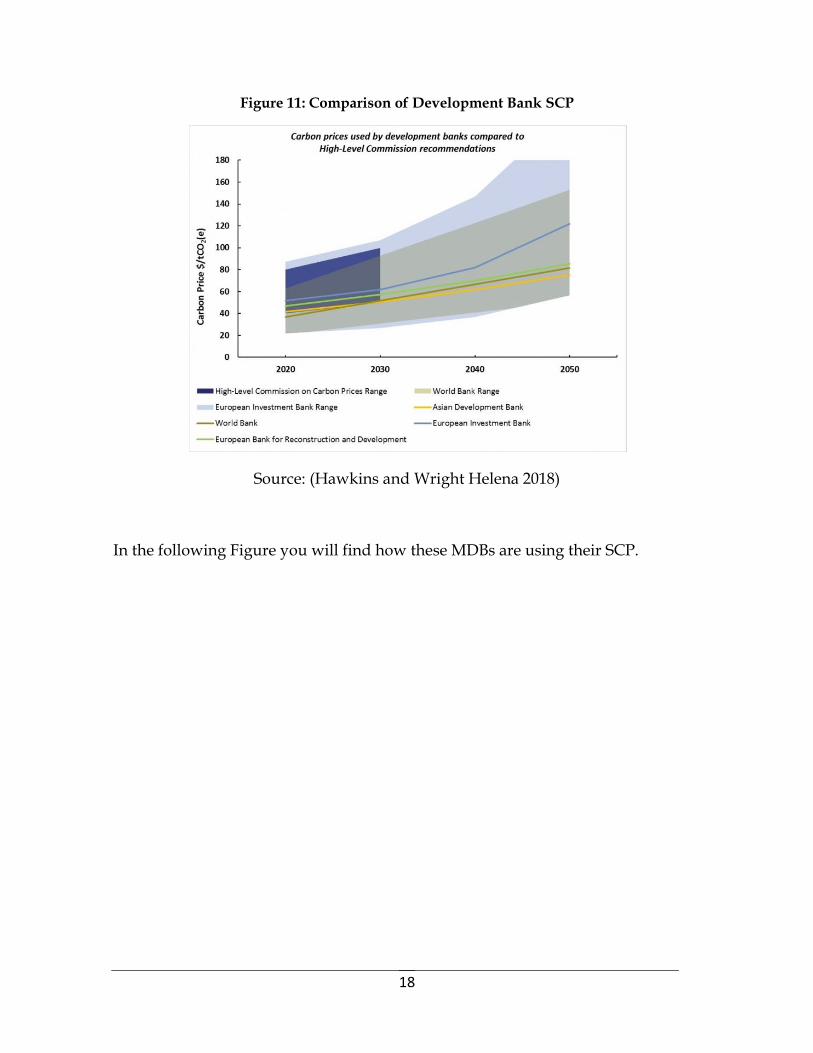
Figure 11 shows a projection for the SCPs used by MDBs for the following years, compared with the recommendations of the High Level Commission. The ADB and EBRD only use a central price. The shaded ranges (below) show the difference between the high and low carbon prices the World Bank and EIB use in project assessments.
18
Figure 11: Comparison of Development Bank SCP
Source: (Hawkins and Wright Helena 2018)
In the following Figure you will find how these MDBs are using their SCP.
19
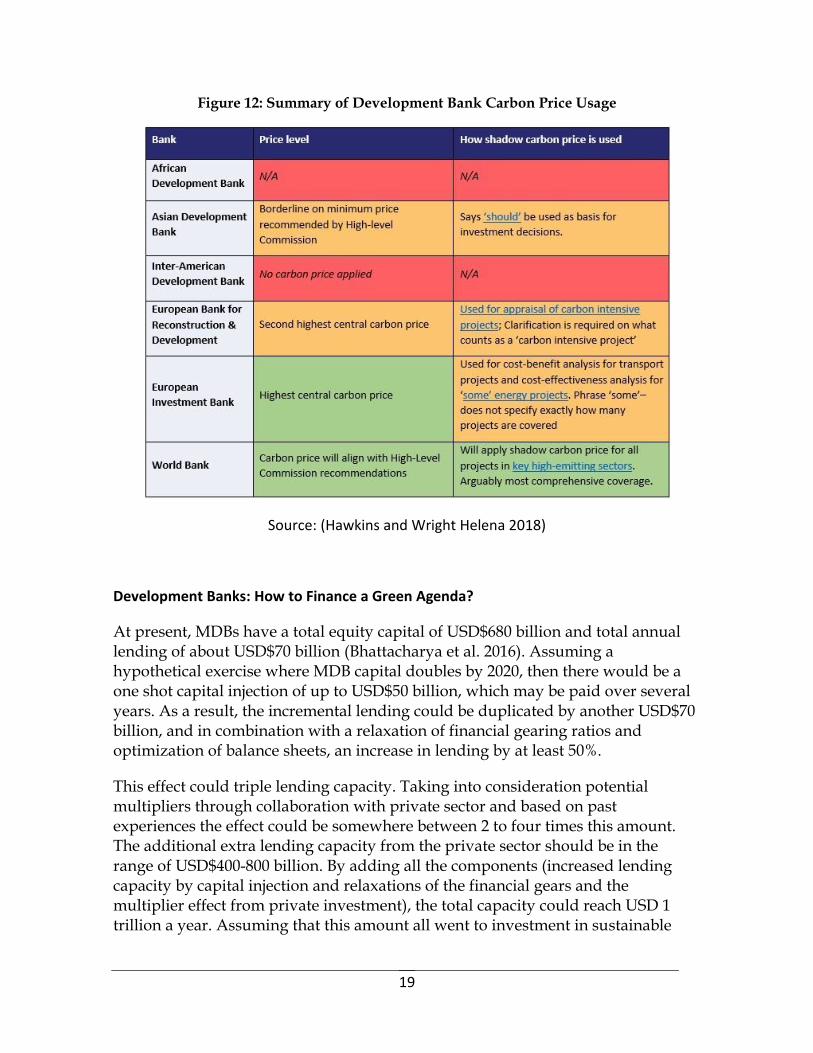
Figure 12: Summary of Development Bank Carbon Price Usage
Source: (Hawkins and Wright Helena 2018)
Development Banks: How to Finance a Green Agenda?
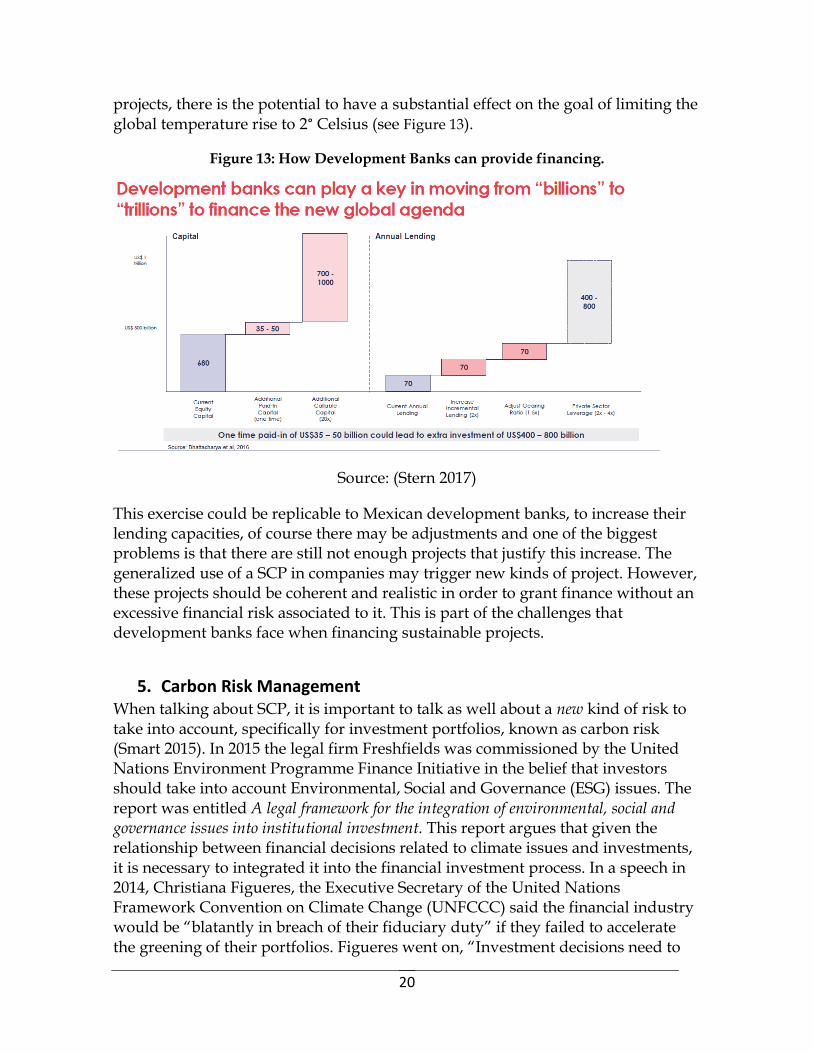
At present, MDBs have a total equity capital of USD$680 billion and total annual lending of about USD$70 billion (Bhattacharya et al. 2016). Assuming a hypothetical exercise where MDB capital doubles by 2020, then there would be a one shot capital injection of up to USD$50 billion, which may be paid over several years. As a result, the incremental lending could be duplicated by another USD$70 billion, and in combination with a relaxation of financial gearing ratios and optimization of balance sheets, an increase in lending by at least 50%.
This effect could triple lending capacity. Taking into consideration potential multipliers through collaboration with private sector and based on past experiences the effect could be somewhere between 2 to four times this amount. The additional extra lending capacity from the private sector should be in the range of USD$400-800 billion. By adding all the components (increased lending capacity by capital injection and relaxations of the financial gears and the multiplier effect from private investment), the total capacity could reach USD 1 trillion a year. Assuming that this amount all went to investment in sustainable
20
projects, there is the potential to have a substantial effect on the goal of limiting the global temperature rise to 2° Celsius (see Figure 13).
Figure 13: How Development Banks can provide financing.
Source: (Stern 2017)
This exercise could be replicable to Mexican development banks, to increase their lending capacities, of course there may be adjustments and one of the biggest problems is that there are still not enough projects that justify this increase. The generalized use of a SCP in companies may trigger new kinds of project. However, these projects should be coherent and realistic in order to grant finance without an excessive financial risk associated to it. This is part of the challenges that development banks face when financing sustainable projects.
5. Carbon Risk Management When talking about SCP, it is important to talk as well about a new kind of risk to take into account, specifically for investment portfolios, known as carbon risk (Smart 2015). In 2015 the legal firm Freshfields was commissioned by the United Nations Environment Programme Finance Initiative in the belief that investors should take into account Environmental, Social and Governance (ESG) issues. The report was entitled A legal framework for the integration of environmental, social and governance issues into institutional investment. This report argues that given the relationship between financial decisions related to climate issues and investments, it is necessary to integrated it into the financial investment process. In a speech in 2014, Christiana Figueres, the Executive Secretary of the United Nations Framework Convention on Climate Change (UNFCCC) said the financial industry would be “blatantly in breach of their fiduciary duty” if they failed to accelerate the greening of their portfolios. Figueres went on, “Investment decisions need to
21
reflect the clear scientific evidence, and fiduciary responsibility needs to grasp the intergenerational reality: namely that unchecked climate change has the potential to impact and eventually devastate the lives, livelihoods and savings of many, now and well into the future.”(United Nations 2014). The point was backed up by the actions of key stakeholder. Also in 2014, for example, the UK the Law Commission published the guidance on fiduciary duty recommending that whenever trustees think there are material ESG issues, they should take them into account for investment decisions.
The management of carbon risk reached a turning point in 2015 among pension funds, insurers and banks in the US. Investors committed to decarbonise at least USD$100bn of institutional equity investment as a part of the Decarbonisation Portfolio. These attempts to quantify the carbon exposure has been the first step for managing this risk, supported by internal disclosure as the second step. But, how does one calculate the carbon of an investment portfolio? One answer is to add each individual stock or security exposure. Consider the following example. Imagine a person owns 5% of company and the footprint for that company is 1,000,000 tCO2e per year. Multiplying this by the person’s equity stake in the company will result in a carbon exposure to that position of 50,000 tCO2e per year. Repeating the exercise for each of that person’s investments provides a total exposure for their portfolio.
This approach allows measurement of the carbon portfolio exposure and the opportunity to evaluate if this portfolio is over-weighted, neutral or underweighted high fuel carbon companies, given some benchmark and of course take some risk management actions, if necessary, to reduce that exposure.
After quantifying risk, three alternatives are available to mitigate it.
Divest some or all of the high-risk holdings.
Engage with companies to improve their performance
Hedge by investing in eco-friendly companies and better positioned for a low
carbon economy.
These mitigation actions should be undertaken in an orderly way in order to avoid any unwanted market disruptions.
The importance of considering this risk is illustrated in a report entitled The Unburnable Carbon report published by the Carbon Tracker Initiative in 2012. This report argues that in order to achieve the climate goals by 2050, an estimated of $20tn of fossils fuel reserves need to remain in the ground. However, these reserves will become stranded assets for many companies, therefore the fossil fuel companies may be overvalued and represent a financial risk to investors. Nevertheless, it is debatable that a company will end up with stranded assets
22
because a rapid change in regulations has a lower probability than a smooth transition over a number of years and moreover some investors believe that fossil fuel companies will play a big role in the transition to a low carbon economy by financing renewable energy.
In this sense it is important to take into account the importance of conducting a review of investment portfolios, especially while the risk of stranded assets is low. In short, it is important to start assessing which could become under some circumstances troubled assets, risk management and investment areas should start thinking how to incorporate new factors in their investment processes. SCP could become an important approach to evaluate this risk.
6. Conclusion Actions taken by governments around the world have brought a huge mobilization of financial resources that are expected to continue increasing in the future. Mexico aligned with these international efforts to reduce GHG emissions has implemented important actions aimed to meet its international commitments in reducing GHG emissions. In this effort development banks globally and in Mexico will play an ever more important role by financing green projects. In this context, carbon pricing has gained increased attention. More specifically shadow carbon pricing could present a solution for companies or institutions that want to change their procedures while remaining competitive and profitable. Development banks such as NAFIN could help with financing this transition. In this sense, there are some proactive ideas that present potential solutions and experience from other institutions, companies or governments in the world.
Programmes implemented or projects financed by development banks should be evaluated to measure their impact on the environment, in other words, their carbon footprint should be evaluated.
Credit risk areas might incorporate a SCP when assessing projects as another factor in their credit evaluation; in this way, the concept can be introduced within the credit portfolio.
Treasury departments and risk management institutions could incorporate SCP as a new factor for their investment process when deciding to invest in debt or equity for their investment portfolios. In other words, it is important to develop methods and procedures to start measuring the carbon risk on their investment portfolios.
Internalizing the use of a SCP; this can be done in different ways by learning how other institutions have incorporated this concept and to measure their own footprint to the different departments within the institution.

23
To educate and to work closely with other institutions within the National System for Climate Change in developing a framework to study projects to internalize a SCP and to communicate results to enterprises in all sectors to start an agenda of carbon disclosure that will help to evaluate their projects.
To evaluate new programmes or new types of projects with lower emissions impact but looking for higher volume, for example financing small business to use a more sustainable energy like solar.
To encourage research in technology for clean energy, including to finance scholarships, inventions, patents and new procedures aimed to help transitions to low-carbon economies working together with universities.
These are some of few ideas or suggestions in order for development banks. Although there is no inventory of how and to what extent the application of carbon pricing and shadow pricing approaches have been adopted, it is important to start thinking how to internalize the concept within institutions to create a sense of greater awareness that leads the way toward the transition to a greener economy.
24
Bibliography
Alarcón, Sofia. 2013. “Política Nacional de Cambio Climático: El Papel de SEMARNAT.” SEMARNAT: 43. http://ecologia.guanajuato.gob.mx/sitio/upload/articulos/154/files/01_SoffiaAlarcon.pdf.
Altamirano, Juan Carlos, and Julia Martinez. 2017. “Mexico’s 3 Big Steps Towards Comprehensive Carbon Pricing.” World Resources Institute. http://www.wri.org/blog/2017/04/mexicos-3-big-steps-towards-comprehensive-carbon-pricing (April 21, 2018).
Bartlett, Nicolette, Hannah Cushing, and Sara Law. 2016. September Embedding a Carbon Price into Business Strategy. https://b8f65cb373b1b7b15feb-c70d8ead6ced550b4d987d7c03fcdd1d.ssl.cf3.rackcdn.com/cms/reports/documents/000/001/132/original/CDP_Carbon_Price_report_2016.pdf?1474899276 (April 21, 2018).
Belausteguigoitia, Juan Carlos. 2014. “Carbon Tax: Challenges For Design & Implementation in Mexico.” : 35. https://www.slideserve.com/keaton-nolan/estudios-econ-micos.
Bhattacharya, Amar et al. 2016. “Delivering on Sustainable Infrastructure for Better Development and Better Climate.” December. http://www.lse.ac.uk/grantham/.
Bhattacharya, Amar, Jeremy Oppenheim, and Nicholas Stern. 2015. 91 Global Economy & Development Driving Sustainable Development Through Better Infrastructure : Key Elements of a Transformation Program. https://www.brookings.edu/wp-content/uploads/2016/07/07-sustainable-development-infrastructure-v2.pdf.
Breslow, Jason M. 2012. “Steve Coll: How Exxon Shaped the Climate Debate.” Frontline Newspaper. https://www.pbs.org/wgbh/frontline/article/steve-coll-how-exxon-shaped-the-climate-debate/ (April 21, 2018).
Daniel, Kent D, Robert B Litterman, and Gernot Wagner. 2016. NBER WORKING PAPER SERIES APPLYING ASSET PRICING THEORY TO CALIBRATE THE PRICE OF CLIMATE RISK. http://www.nber.org/papers/w22795 (April 21, 2018).
DECC. 2018. Updated Short-Term Traded Carbon Values Used for UK Public Policy Appraisal. UK. https://assets.publishing.service.gov.uk/government/uploads/system/uploads/attachment_data/file/671194/Updated_short-
25
term_traded_carbon_values_for_appraisal_purposes.pdf (April 21, 2018).
Dell, Melissa, Benjamin F. Jones, and Benjamin A. Olken. 2014. “What Do We Learn from the Weather? The New Climate-Economy Literature †.” Journal of Economic Literature 52(3): 740–98. http://pubs.aeaweb.org/doi/abs/10.1257/jel.52.3.740.
Doda, Baran, Simon Quemin, and Luca Taschini. 2018. “Linking Permit Markets Multilaterally.” ESRC Centre for Climate Change Economics and Policy London March: 53. http://www.lse.ac.uk/GranthamInstitute/wp-content/uploads/2018/03/Working-Paper-275-Doda-et-al_March-2018.pdf (April 21, 2018).
Doda, Baran, and Luca Taschini. 2016. “Carbon Dating: When Is It Beneficial to Link ETSs?” Centre for Climate Change Economics and Policy (234): 41. http://www.lse.ac.uk/GranthamInstitute/wp-content/uploads/2015/09/Working-Paper-208-Doda-and-Taschini-August2016.pdf (April 21, 2018).
Drfize, Jean, and Nicholas Stern. 1990. “POLICY REFORM, SHADOW PRICES, AND MARKET PRICES.” Journal of Public Economics 42(145). http://personal.lse.ac.uk/sternn/058NHS.pdf (April 21, 2018).
Enkvist, Per-Anders, Jens Dinkel, and Charles Lin. Impact of the Financial Crisis on Carbon Economics: Version 2.1 of the Global Greenhouse Gas Abatement Cost Curve. https://www.mckinsey.com/~/media/McKinsey/Business Functions/Sustainability and Resource Productivity/Our Insights/Impact of the financial crisis on carbon economics Version 21/Impact of the financial crisis on carbon economics Version 21.ashx (April 21, 2018).
Environmental Economics and Energy. 2015. Pathways to Deep Decarbonization in Mexico. http://deepdecarbonization.org/wp-content/uploads/2015/09/DDPP_MEX.pdf (April 21, 2018).
Evans, Simon. 2017. “Q&A: Will the Reformed EU Emissions Trading System Raise Carbon Prices?” CarbonBrief. https://www.carbonbrief.org/qa-will-reformed-eu-emissions-trading-system-raise-carbon-prices.
Fankhauser, Samuel, and Cameron Hepburn. 2010a. “Designing Carbon Markets, Part II: Carbon Markets in Space.” Energy Policy 38(8): 4381–87. https://www.sciencedirect.com/science/article/pii/S0301421510002569 (April 21, 2018).
———. 2010b. “Designing Carbon Markets. Part I: Carbon Markets in Time.” Energy Policy 38(8): 4363–70.
26
https://www.sciencedirect.com/science/article/pii/S0301421510002545 (April 21, 2018).
Farmer, J. Doyne, Cameron Hepburn, Penny Mealy, and Alexander Teytelboym. 2015. “A Third Wave in the Economics of Climate Change.” Environmental and Resource Economics 62(2): 329–57. http://link.springer.com/10.1007/s10640-015-9965-2 (April 21, 2018).
Garmendia, Emilio. 2017. How Can National Development Banks Address Key Challenges Associated with Raising Climate Finance to Increase Investment Flows for Projects in Their Countries? Mexico City. http://www.lse.ac.uk/lacc/publications/LSE-NAFIN-working-paper-1-Perez-Montero-dev-banks-green-finance.pdf.
Gobierno de la Republica. 2013. Programa Especial de Cambio Climatico 2014-2018. Mexico: Gobierno de la Republica. http://www.transparencia.inecc.gob.mx/transparencia/pecc_2014_2018.pdf (April 21, 2018).
Gobierno de la República. 2013. “Estrategia Nacional de Cambio Climático 10-20-40.” http://www.semarnat.gob.mx/archivosanteriores/informacionambiental/Documents/06_otras/ENCC.pdf (April 22, 2018).
Graf, Nathaniel, and Brett Pasinella. 2017. “Carbon Pricing as a Climate Action Tool: Experiences from Swarthmore College - Second Nature.” Second Nature. http://secondnature.org/2017/05/11/carbon-pricing-climate-action-tool-experiences-swarthmore-college/ (April 21, 2018).
Hawkins, James, and Wright Helena. 2018. “How Are Development Banks Performing on Shadow Carbon Pricing? | E3G.” E3G. https://www.e3g.org/library/how-are-development-banks-performing-on-shadow-carbon-pricing (April 29, 2018).
Johnson, Todd M, Claudio Alatorre, Zayra Romo, and Feng Liu. 2010. The World Bank Low-Carbon Development for Mexico. http://documents.worldbank.org/curated/en/236751468049142717/pdf/524580PUB0low0101Official0Use0Only1.pdf (April 21, 2018).
Marcu, Andrei. 2016. Carbon Market Provisions in the Paris Agreement (Article 6). https://www.ceps.eu/system/files/SR No 128 ACM Post COP21 Analysis of Article 6.pdf (April 21, 2018).
McKinsey. 2009. Pathways to a Low-Carbon Economy for Brazil. https://www.mckinsey.com/~/media/McKinsey/Business
27
Functions/Sustainability and Resource Productivity/Our Insights/Pathways to a low carbon economy for Brazil/Pathways to a low carbon economy for Brazil.ashx (April 21, 2018).
Montes De Oca, Mariza, and Alexander Von Humboldt. 2016. “Design and Approaches to the Carbon Tax in Mexico: Lessons and the Road Ahead.” In Technical Seminar: Regional Perspectives on the Implementation of Carbon Pricing Instruments, ICAP. http://www.precioalcarbonochile.cl/wp-content/uploads/2016/11/4-The-Mexican-Experience-Mariza-Oca.pdf (April 22, 2018).
OECD. 2016. Effective Carbon Rates: Pricing CO2 through Taxes and Emissions Trading Systems. PAris: OECD Publishing. https://read.oecd-ilibrary.org/taxation/effective-carbon-rates_9789264260115-en#page5 (April 21, 2018).
Price, Richard, Simeon Thornton, and Stephen Nelson. 2007. Defra The Social Cost Of Carbon And The Shadow Price Of Carbon: What They Are, And How To Use Them In Economic Appraisal In The UK. http://www.opsi.gov.uk/click-use/value-added-licence-information/index.htm (April 21, 2018).
Pulver, Simone. 2007. “Making Sense of Corporate Environmentalism.” Organization & Environment 20(1): 44–83. https://www.researchgate.net/publication/249701340_Making_Sense_of_Corporate_Environmentalism_An_Environmental_Contestation_Approach_to_Analyzing_the_Causes_and_Consequences_of_the_Climate_Change_Policy_Split_in_the_Oil_Industry (April 21, 2018).
Reynoso, Luis Huesca, and Alejandra López Montes. 2016. “Impuestos Ambientales Al Carbono En México y Su Progresividad: Una Revisión Analítica.” Economía Informa 398(May): 18. http://linkinghub.elsevier.com/retrieve/pii/S0185084916300032.
Roberto, Frank. 2016. “Cost of Carbon Implementation – Energy and Mines World Congress.” November: 9. http://energyandmines.com/wp-content/uploads/2017/09/Frank-Roberto-Newmont.pdf (April 21, 2018).
SEMARNAT-INECC. 2016. Mexico’s Climate Change Mid-Century Strategy. Mexico City. https://unfccc.int/files/focus/long-term_strategies/application/pdf/mexico_mcs_final_cop22nov16_red.pdf (April 21, 2018).
Smart, Lauren. 2015. “Carbon Risk: How Do We Measure and Manage It? | The Actuary, the Official Magazine of the Institute and Faculty of Actuaries.” TheActuary. http://www.theactuary.com/features/2015/06/carbon-risk-
28
how-do-we-measure-and-manage-it/ (April 21, 2018).
Stern, Nicholas. 2006. STERN REVIEW: The Economics of Climate Change. http://www.brown.edu/Departments/Economics/Faculty/Matthew_Turner/ec1340/readings/Sternreview_full.pdf (April 21, 2018).
———. 2017. “Towards a Low-Carbon Future.” (November): 31. https://www.oxfordmartin.ox.ac.uk/downloads/events/171102_Stern_lecture.pdf.
Stiglitz, Joseph E et al. 2017. Report of the High-Level Commission on Carbon Prices. https://static1.squarespace.com/static/54ff9c5ce4b0a53decccfb4c/t/59244eed17bffc0ac256cf16/1495551740633/CarbonPricing_Final_May29.pdf (April 22, 2018).
“The Price of Carbon: What Should It Be and Why?” 2008. In The Price of Carbon: What Should It Be and Why?, Friends of the Earth, 22. https://friendsoftheearth.uk/sites/default/files/downloads/carbon_price_seminar_2008.pdf (April 21, 2018).
———. 2008. In Friends of the Earth, 22. http://www.foe.co.uk/resource/reports/carbon_price_seminar_2008.pdf (April 22, 2018).
UNEP Team members. 2017. United Nations Environment Programme (UNEP) The Emissions Gap Report 2017 - A UN Environment Synthesis Report. Nairobi. https://wedocs.unep.org/bitstream/handle/20.500.11822/22070/EGR_2017.pdf (April 21, 2018).
United Nations. 2014. “PRESS RELEASE: Safeguarding Future Retirement Funds – Time for Investors to Move Out of High- Carbon Assets Says UN ’ s Top Climate Official.” In Press Release, New York, 3. http://unfccc.int/files/press/press_releases_advisories/application/pdf/pr20140115_ceres_final1.pdf.
Vorrath, Sophie. 2018. “Graph of the Day: Green Bonds Soar to Record $163bn in 2017.” Reneweconomy. https://reneweconomy.com.au/graph-day-green-bonds-soar-record-163bn-2017/ (April 22, 2018).
Wagner, Gernot, and Martin L, Weitzman. 2015. Princeton University Press Climate Shock: The Economic Consequences of a Hotter Planet.
WBG. 2017. “Carbon Pricing Watch 2017.” WBG-ECOFYS: 20. https://openknowledge.worldbank.org/bitstream/handle/10986/26565/9781464811296.pdf?sequence=4&isAllowed=y (April 21, 2018).
29
World Bank Ecofys and Vivid Economics. 2017. State and Trends of Carbon Pricing 2017. Washington DC: World Bank.
Wright, Helena, Ingri D Holmes, Robert Barbe, and James Hawkins. 2017. “GREENING FINANCIAL FLOWS WHAT PROGRESS HAS BEEN MADE IN THE DEVELOPMENT BANKS?” https://www.e3g.org/library/negative-carbon-pricing-a-shadow-price-we-need-to-know-blog (April 21, 2018).
(Alarcón 2013; Altamiran o and Martinez 2017; B artlett, Cushin g, and Law 2016; Be lau steguigoitia 2014; Bhattacharya et al. 2016; Bhattacharya, Oppenhe im, and Stern 2015; B reslow 2012; Daniel, Litterman, and Wagner 2016; DECC 2018; De ll, Jones, and Olken 2014; Doda, Quemin, and Taschini 2018; Doda and Taschini 2016; Drf ize and Stern 1990; En kvist, Din kel, and Lin n.d.; Environmental Economics and Energy 2015; Evans 2017; Fan khauser and Hepbu rn 2010b, 2010a; Farme r et al. 2015; Garmend ia 2017; Gobierno de la Repu blica 2013; Graf and Pasinella 2017; Hawkins and Wright Helena 2018; John son et a l. 2010 ; Marcu 2016; McKinse y 2009; Montes De Oca and V on Humboldt 2016; OEC D 2016; P rice Carbon What sh ould it be why? 2008; Price Carbon What shou ld it be why? 2008; Price, Thornton, and Nelson 2007; Pulver 2007; Re yn oso and Montes 2016; Robert o 2016; SEMARNAT-INECC 2016; Smart 2015 ; Stern 2006, 2017; Stiglitz et al. 2017; Stiglitz and Stern 2017; UNEP Team
membe rs 2017; Wagner and L, We itzman 2015; WB G 2017; World B ank Ecof ys and Vivid Ec onomics 2015; Wright et al. 2017);(Wagne r and L, We itzman 2015);(United Nations 2014)

![Governments as Shadow Banks: The Looming Threat to ...pages.stern.nyu.edu/...as_shadow_banks_TLR_Acharya.pdf2012] Governments as Shadow Banks 1747 over time.12 Given such difficulty](https://static.fdocuments.in/doc/165x107/5e4bfb1ec01edf4aac085b27/governments-as-shadow-banks-the-looming-threat-to-pagessternnyueduasshadowbankstlr.jpg)


![A Comparison of the US and European Shadow Banking Systems ... · Definitions • Mculley ~ î ì ì ó : ^unlike regulated banks […], unregulated shadow banks fund themselves with](https://static.fdocuments.in/doc/165x107/5e37ea71309dfc2a7113eb46/a-comparison-of-the-us-and-european-shadow-banking-systems-definitions-a-mculley.jpg)