SGS MIN 2005 09 an Advanced Modelling Technique en 11 09
6
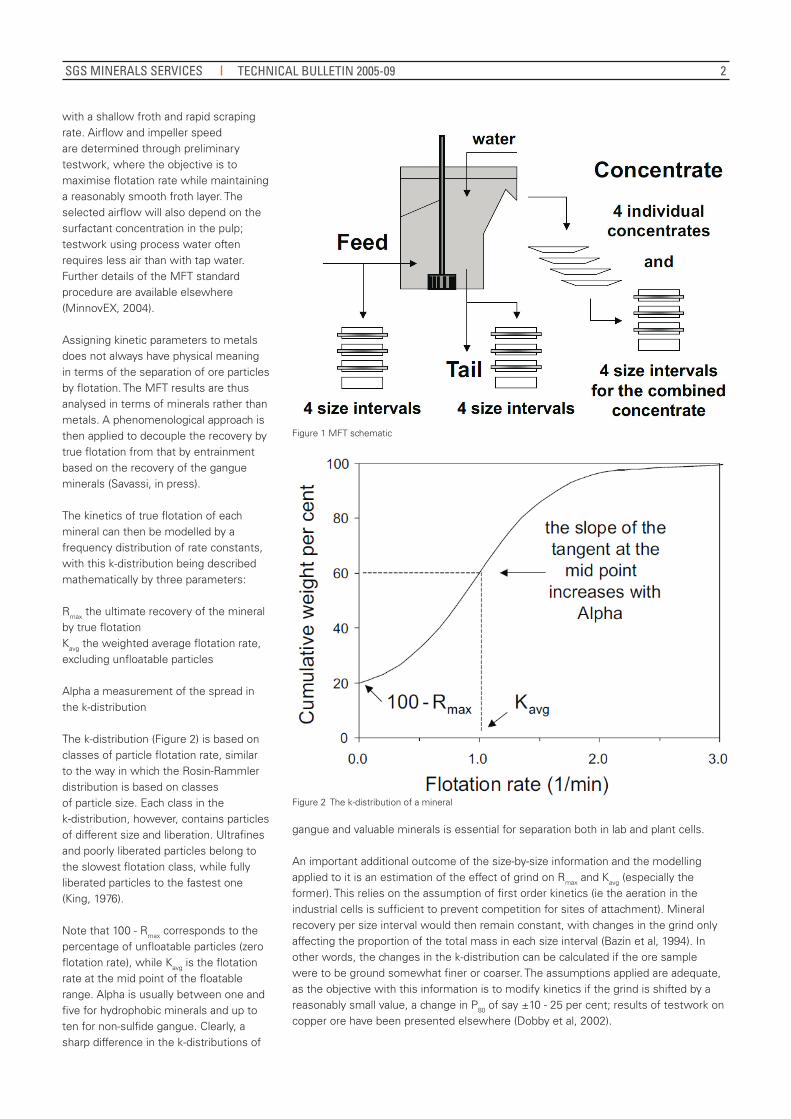
SGS MINERALS SERVICES TECHNICAL PAPER 2005-09 2005 AN ADVANCED MODELLING TECHNIQUE FOR SCALE-UP OF BATCH FLOTATION RESULTS TO PLANT METALLURGICAL PERFORMANCE G.S. DOBBY AND O.N. SAVASSI - SGS ABSTRACT A rigorous methodology for prediction of flotation plant performance is presented, which is based on a standardised batch flotation test called the MFT. The work is part of the FLEET program, developed by MinnovEX with the support of seven large mining firms. The methodology is divided into three key steps: 1. direct measurement of the kinetics of true flotation in the pulp, independent of hydraulic entrainment and other froth effects in the batch cell; 2. benchmarking of the industrial plant over a broad range of ore types and operation conditions; and 3. model calibration to describe froth effects in the plant, with a minimal number of parameters. To date, the methodology has been applied with success at several industrial plants, encompassing copper, gold, nickel, iron, lead, zinc and coal operations. This paper includes a description of the laboratory testwork procedure and scale-up to full industrial circuits. Examples of industrial application are also presented. INTRODUCTION It is well known that scale-up of laboratory flotation results to full plant performance is a difficult challenge. We have all heard the statement from operating plant metallurgists: ‘plant performance cannot be replicated in a batch flotation cell’; how, then, can we have confidence in translating results from the laboratory to optimise existing plants or to design new ones? Indeed, the differences in mixing regime (batch versus continuous flow) and efficiency of transport through the froth are significant and must be taken into account on a phenomenological basis, if a reliable scale-up methodology is to be developed. This paper reviews the method developed by MinnovEX to resolve the problem. It begins with a description of the procedure for direct measurement of the kinetics of true flotation in the pulp using a batch cell. The paper then describes industrial circuit benchmarking and model calibration, followed by validation of the model. The paper finishes with examples of industrial application in several flotation systems. MEASURING THE PULP KINETICS The traditional approach to flotation scale-up testwork attempts to use a batch cell to replicate industrial performance, assuming that the lab cell works as a scale model of the full plant. Industrial experience has shown, unfortunately, that the results obtained by such an approach can rarely be relied upon, due to the difficulty of replicating in a batch cell the effect of variables such as plant throughput and circuit configuration. The MinnovEX Flotation Test (MFT) is based on the principle that the kinetics of true flotation in the pulp constitutes the primary source for selective separation of ore particles in both lab and plant cells (Dobby and Finch, 1987). Selectivity can obviously be enhanced by proper control of the froth in the plant. However, if all particles had exactly the same true flotation kinetics, there is nothing the plant operator could do with the froth to achieve separation. Moreover, the froth structure can differ considerably between lab and industrial cells due to geometrical aspects such as the rising velocity of the bubbles across the pulp-froth interface and the distance they have to travel from there to reach the concentrate launder. The standard MFT cell is made of clear plastic to facilitate level control. The cell is also equipped with a froth crowder to prevent a dead zone from forming behind the impeller. Upon scraping, a t-shaped paddle stands at 1 cm above the pulp level mark, which is maintained by adding process water or equivalent. As shown in Figure 1, four concentrates are collected at specific times, with samples of the feed, tail and combined concentrate being analysed for size-by- size assays. The MFT has been designed to minimise the impact of the froth layer upon lab results by operating the cell
Transcript of SGS MIN 2005 09 an Advanced Modelling Technique en 11 09

SGS MINERALS SERVICES TECHNICAL PAPER 2005-09 2005
AN ADVANCED MODELLING TECHNIQUE FOR SCALE-UP OF BATCH FLOTATION RESULTS TO PLANT METALLURGICAL PERFORMANCEG.S. DOBBY AND O.N. SAVASSI - SGS
ABSTRACT A rigorous methodology for prediction of flotation plant performance is presented, which is based on a standardised batch flotation test called the MFT. The work is part of the FLEET program, developed by MinnovEX with the support of seven large mining firms. The methodology is divided into three key steps:1. direct measurement of the kinetics of true flotation in the pulp, independent of hydraulic entrainment and
other froth effects in the batch cell;2. benchmarking of the industrial plant over a broad range of ore types and operation conditions; and3. model calibration to describe froth effects in the plant, with a minimal number of parameters.
To date, the methodology has been applied with success at several industrial plants, encompassing copper, gold, nickel, iron, lead, zinc and coal operations. This paper includes a description of the laboratory testwork procedure and scale-up to full industrial circuits. Examples of industrial application are also presented.
INTRODUCTION
It is well known that scale-up of laboratory flotation results to full plant performance is a difficult challenge. We have all heard the statement from operating plant metallurgists: ‘plant performance cannot be replicated in a batch flotation cell’; how, then, can wehave confidence in translating results from the laboratory to optimise existing plants or to design new ones? Indeed, the differences in mixing regime (batch versus continuous flow) and efficiency of transport through the froth are significant and must be taken into account on a phenomenological basis, if a reliablescale-up methodology is to be developed.
This paper reviews the method developed by MinnovEX to resolve the problem. It begins with a description of the procedure for direct measurement of the kinetics of true flotation in the pulp using a batch cell. The paper then describes industrial circuit benchmarking and model calibration, followed by validation of the model. The paper finishes with examples of industrial application in several flotation systems.
MEASURING THE PULP KINETICS
The traditional approach to flotation scale-up testwork attempts to use a batch cell to replicate industrial performance, assuming that the lab cell works as a scale model of the full plant.Industrial experience has shown, unfortunately, that the results obtained by such an approach can rarely be relied upon, due to the difficulty of replicating in a batch cell the effect of variables such as plant throughput and circuit configuration.
The MinnovEX Flotation Test (MFT) is based on the principle that the kinetics of true flotation in the pulp constitutes theprimary source for selective separation of ore particles in both lab and plant cells (Dobby and Finch, 1987). Selectivity canobviously be enhanced by proper control of the froth in the plant. However, if all particles had exactly the same true
flotation kinetics, there is nothing the plant operator could do with the froth to achieve separation. Moreover, the froth structure can differ considerably between lab and industrial cells due to geometrical aspects such as the rising velocity of the bubbles across the pulp-froth interface and the distance they have to travel from there to reach the concentrate launder.The standard MFT cell is made of clear plastic to facilitate level control. The cell is also equipped with a froth crowder toprevent a dead zone from forming behind the impeller. Upon scraping, a t-shaped paddle stands at 1 cm above the pulp level mark, which is maintained by adding process water or equivalent. As shown in Figure 1, four concentrates are collected at specific times, with samples of the feed, tail and combined concentrate being analysed for size-by-size assays.
The MFT has been designed to minimise the impact of the froth layer upon lab results by operating the cell
2
with a shallow froth and rapid scraping rate. Airflow and impeller speed are determined through preliminary testwork, where the objective is to maximise flotation rate while maintaining a reasonably smooth froth layer. The selected airflow will also depend on the surfactant concentration in the pulp; testwork using process water often requires less air than with tap water. Further details of the MFT standard procedure are available elsewhere (MinnovEX, 2004).
Assigning kinetic parameters to metals does not always have physical meaning in terms of the separation of ore particles by flotation. The MFT results are thus analysed in terms of minerals rather than metals. A phenomenological approach is then applied to decouple the recovery by true flotation from that by entrainment based on the recovery of the gangue minerals (Savassi, in press).
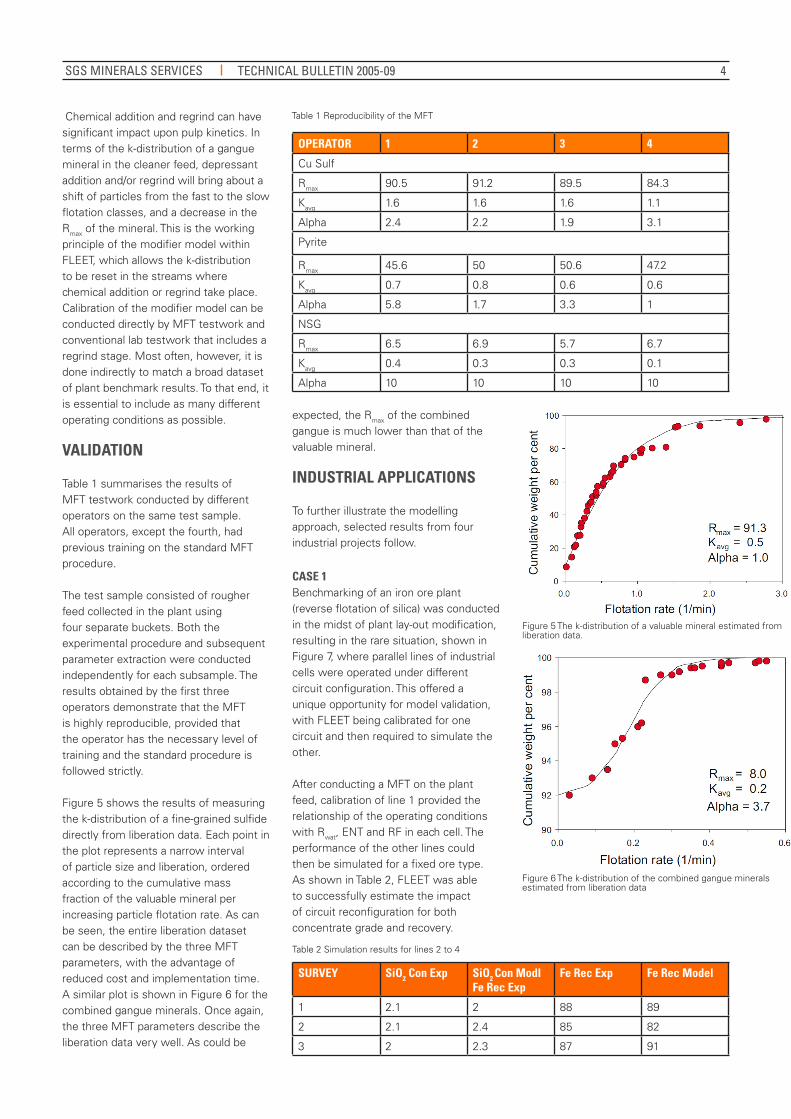
The kinetics of true flotation of each mineral can then be modelled by a frequency distribution of rate constants, with this k-distribution being described mathematically by three parameters:
Rmax the ultimate recovery of the mineral by true flotationKavg the weighted average flotation rate, excluding unfloatable particles
Alpha a measurement of the spread in the k-distribution
The k-distribution (Figure 2) is based on classes of particle flotation rate, similar to the way in which the Rosin-Rammlerdistribution is based on classes of particle size. Each class in the k-distribution, however, contains particles of different size and liberation. Ultrafines and poorly liberated particles belong to the slowest flotation class, while fully liberated particles to the fastest one (King, 1976).
Note that 100 - Rmax corresponds to the percentage of unfloatable particles (zero flotation rate), while Kavg is the flotation rate at the mid point of the floatable range. Alpha is usually between one and five for hydrophobic minerals and up toten for non-sulfide gangue. Clearly, a sharp difference in the k-distributions of
Figure 1 MFT schematic
Figure 2 The k-distribution of a mineral
gangue and valuable minerals is essential for separation both in lab and plant cells.
An important additional outcome of the size-by-size information and the modelling applied to it is an estimation of the effect of grind on Rmax and Kavg (especially the former). This relies on the assumption of first order kinetics (ie the aeration in the industrial cells is sufficient to prevent competition for sites of attachment). Mineral recovery per size interval would then remain constant, with changes in the grind only affecting the proportion of the total mass in each size interval (Bazin et al, 1994). In other words, the changes in the k-distribution can be calculated if the ore sample were to be ground somewhat finer or coarser. The assumptions applied are adequate, as the objective with this information is to modify kinetics if the grind is shifted by a reasonably small value, a change in P80 of say ±10 - 25 per cent; results of testwork on copper ore have been presented elsewhere (Dobby et al, 2002).
SGS MINERALS SERVICES TECHNICAL BULLETIN 2005-09

3
The traditional approach of testing over a range of grinds is thus not required. This plays an important role in plant designstudies, as the test grind applied to a given sample is often quite different from what the ore sees when it is processed in the plant (Bulled and McInnes, 2005).
PLANT BENCHMARK AND SCALE-UP
The objective of plant benchmarking is to assess metallurgical performance over a broad range of ore types and operatingconditions. As a rule of thumb, each survey should cover a period of about three times the total plant residence time, with sample increments taken at every half an hour or less. The settings in any practical application, however, will always depend upon plant stability.
Samples for the MFT testwork are usually collected half way through the plant survey. Decision on whether or not to collect those samples in increments depends on the extent of particleageing in the pulp as well as on sample reliability and survey timing aspects.
Similar to the MFT analysis, all plant benchmarking data is mass balanced in terms of minerals (the conversion rules are site specific). Figure 3 displays mass balancing results for a large copper ore plant. Note that each point in the plots represents an assay in a given stream during a specific plant survey (more than300 assays all up). As can be seen, the plant data is very consistent in this case, with just a few outliners.
The models for conventional and column cells within the FLEET simulator are based on three mass transfer parameters per stage (Savassi, in press):
RF the froth recovery of attached particles, which is calibrated according to the stage recovery of the valuablemineralRwat the water recovery in each stage of the circuit, which is calculated directly from plant mass balancingENT the degree of entrainment through the froth, which is calibrated according to the stage recovery of the non-sulfide gangue
Figure 3 Mass balancing results for a large copper ore plant
Figure 4 Propagating the k-distribution
Once a broad dataset has been generated, it is possible to determine the variation of the Rwat/RF ratio in each stage of the plant and then relate RF to the set point of the tailings or concentrate assays. This approach allows the intervention of the plant operator to be included when simulating different conditions. In other words, the effect of changing the mass pull in any stage of the plant can be simulated by varying RF and applying the calibrated values for Rwat/RF ratio and ENT to account for hydraulic entrainment.
The first cell or stage of the circuit is simulated using the mineral k-distribution obtained from the MFT testwork. The model then calculates the k-distribution for both the concentrate and the tail based upon mass conservation of the flotation rate classes (Figure 4). The new k-distributions are linked to the other cells downstream according to the flotation circuit flow sheet, allowing propagation from cell to cell, or from stage to stage. Typically, therefore, one is not required to conduct lab testwork for multiple streams of the circuit in order to simulate metallurgical performance.
SGS MINERALS SERVICES TECHNICAL BULLETIN 2005-09
4
Chemical addition and regrind can have significant impact upon pulp kinetics. In terms of the k-distribution of a ganguemineral in the cleaner feed, depressant addition and/or regrind will bring about a shift of particles from the fast to the slowflotation classes, and a decrease in the Rmax of the mineral. This is the working principle of the modifier model within FLEET, which allows the k-distribution to be reset in the streams where chemical addition or regrind take place. Calibration of the modifier model can be conducted directly by MFT testwork and conventional lab testwork that includes a regrind stage. Most often, however, it is done indirectly to match a broad dataset of plant benchmark results. To that end, it is essential to include as many different operating conditions as possible.
VALIDATION
Table 1 summarises the results of MFT testwork conducted by different operators on the same test sample. All operators, except the fourth, had previous training on the standard MFT procedure.
The test sample consisted of rougher feed collected in the plant using four separate buckets. Both the experimental procedure and subsequent parameter extraction were conducted independently for each subsample. The results obtained by the first threeoperators demonstrate that the MFT is highly reproducible, provided that the operator has the necessary level of training and the standard procedure is followed strictly.
Figure 5 shows the results of measuring the k-distribution of a fine-grained sulfide directly from liberation data. Each point inthe plot represents a narrow interval of particle size and liberation, ordered according to the cumulative mass fraction of the valuable mineral per increasing particle flotation rate. As canbe seen, the entire liberation dataset can be described by the three MFT parameters, with the advantage of reduced cost and implementation time.A similar plot is shown in Figure 6 for the combined gangue minerals. Once again, the three MFT parameters describe theliberation data very well. As could be
OPERATOR 1 2 3 4
Cu Sulf
Rmax 90.5 91.2 89.5 84.3
Kavg 1.6 1.6 1.6 1.1
Alpha 2.4 2.2 1.9 3.1
Pyrite
Rmax 45.6 50 50.6 47.2
Kavg 0.7 0.8 0.6 0.6
Alpha 5.8 1.7 3.3 1
NSG
Rmax 6.5 6.9 5.7 6.7
Kavg 0.4 0.3 0.3 0.1
Alpha 10 10 10 10
Table 1 Reproducibility of the MFT
Figure 5 The k-distribution of a valuable mineral estimated fromliberation data.
Figure 6 The k-distribution of the combined gangue mineralsestimated from liberation data
Table 2 Simulation results for lines 2 to 4
expected, the Rmax of the combined gangue is much lower than that of the valuable mineral.
INDUSTRIAL APPLICATIONS
To further illustrate the modelling approach, selected results from four industrial projects follow.
CASE 1Benchmarking of an iron ore plant (reverse flotation of silica) was conducted in the midst of plant lay-out modification, resulting in the rare situation, shown in Figure 7, where parallel lines of industrial cells were operated under different circuit configuration. This offered a unique opportunity for model validation, with FLEET being calibrated for one circuit and then required to simulate the other.
After conducting a MFT on the plant feed, calibration of line 1 provided the relationship of the operating conditions with Rwat, ENT and RF in each cell. The performance of the other lines could then be simulated for a fixed ore type. As shown in Table 2, FLEET was able to successfully estimate the impact of circuit reconfiguration for both concentrate grade and recovery.
SURVEY SiO2 Con Exp SiO2 Con Modl Fe Rec Exp
Fe Rec Exp Fe Rec Model
1 2.1 2 88 89
2 2.1 2.4 85 82
3 2 2.3 87 91
SGS MINERALS SERVICES TECHNICAL BULLETIN 2005-09
5
Figure 5 The k-distribution of a valuable mineral estimated fromliberation data.
Figure 7 Parallel lines of industrial cells with different circuit configuration.
Figure 8 Impact of changes in the grind
Figure 10 FLEET calibration results for a large copper ore plant
Figure 11 Design of a green fields flotation plantFigure 9 FLEET calibration results for a complex gold plant
Figure 6 The k-distribution of the combined gangue mineralsestimated from liberation data
CASE 2As described earlier, a key feature of the MFT is the ability to estimate the effect of changes in the grind by means of one single test. Figure 8 illustrates a case where flotation improves with finer grind. In this case, each 20 μm reduction in feed P80 will increase gold recovery by about one per cent in the rougher.
This approach provides an automatic link between comminution and flotation models.
A total of ten surveys were conducted in a gold plant over a period of fixed ore type characteristics (measured by the MFT testwork). As usual in gold operations, the flotation circuit wasvery complex, aiming at maximum recovery. Cell dimensions at some stages were close to 30 times smaller than the roughers, as a consequence of the valuable mineral occurring in trace quantities.
After mass balancing each one of the ten surveys individually, the weighted averaged assays were used to represent the base case of plant metallurgical performance. The strong relationship between base case and calibrationresults shown in Figure 9 demonstrates that FLEET was able to simulate the plant with a high level of accuracy.
CASE 3Large copper ore plants are known for wide variation in feed characteristics, making it impossible to propose a base case to represent the average plant performance. Calibration results for one such operation are shown in Figure 10, including eight plant surveys. As can be seen, FLEET is able to match the data from the individual surveys very well (see also Figure 3).
It must be emphasised that, in this case, the simulator has only four parameters to adjust, namely: the froth recovery in therougher, cleaner, scavenger and column stages. Fixed modifier parameters were used to represent the normal operation of the regrind circuit (six surveys out of eight). Different modifier parameters were necessary to match the plant data when the circulating load was excessive
(three times greater than normal) or very low (a third of the normal range).
Some of the variables that can now be investigated by simulation include: feed throughput and P80, circuit configurationand mass pull at different stages. Changes in the pulp kinetics due to ore type or improvement of the reagent scheme can be measured via MFT testwork.
CASE 4The grade-recovery curves in Figure 11 summarise the results of a green fields design project. In this case, the MFT testwork was conducted on a bulk sample representing the entire ore deposit. Three potential configurations were then tested for the new circuit, within the range of variation in Rwat, ENT, RF and modifier parameters observed in existing plants processing ores of similar characteristics.
SGS MINERALS SERVICES TECHNICAL BULLETIN 2005-09

6
Therefore, the use of the FLEET simulator and the MFT testwork for design purposes allows the performance of a new flotation plant to be predicted in detail long before commissioning. In addition, the flowrate of all streams in the plant are estimated with a good level of confidence, a significant aid to the design of pumping systems.
One other important feature of FLEET is the multi-feed capability, which allows automatic simulation of up to hundredsor thousands of different feed characteristics at once. This is particularly useful in production planning projects, where the ore deposit is divided into a 3D matrix of blocks, whose final gradeand recovery in the flotation plant must be predicted by simulation.In this type of application, the MFT is conducted on drill core
samples, with the kinetic parameters being distributed across the deposit by a geometallurgical model. The comminution simulator CEET can then be used to estimate the throughput andP80 of the flotation feed for each ore block. A more detailed description of the use of FLEET in production planning projects is the subject of a separate paper (Bulled and McInnes, 2005).
CONCLUSIONS
It has been demonstrated that rigorous scale-up of batch results can be achieved by the measurement of the kinetics of
true flotation in the pulp along with the calibration of froth effects in the plant. The information contained in an entire liberation dataset can be described by the three MFT parameters for bothvaluable and gangue minerals, with the advantage of reduced cost and implementation time. The MFT is highly reproducible, provided that the operatorhas the necessary level of training and the standard procedure is followed strictly. The FLEET simulator is able to estimate the impact of circuitreconfiguration, and the use of the FLEET simulator in conjunction with the MFT testwork allows the optimisation ofexisting flotation plants as well as more effective design of new ones.
ACKNOWLEDGEMENTS
The authors wish to acknowledge support provided by the seven FLEET partner companies: Barrick Gold, BHP-Billiton, CVRD, Falconbridge, Groupo Mexico, Phelps Dodge and Rio Tinto.
REFERENCES
Bazin, C, Grant R, Cooper, M and Tessier, R, 1994, Prediction of metallurgical performance as a function of fineness of grind, in Proceedings 26th Canadian Mineral Processors, Ottawa.
Bulled, D and McInnes, C, 2005. Flotation plant design and production planning through geometallurgical modelling, in Proceedings Centenary of
© 2011 SGS. All rights reserved. The information contained herein is provided “as is” and SGS does not warrant that it will be error-free or will meet any particular criteria of per-formance or quality. Do not quote or refer any information herein without SGS’ prior written consent. Any unautho-rized alteration, forgery or falsification of the content or appearance of this document is unlawful and offenders may be prosecuted to the fullest extent of the law.
CONTACT INFORMATION
Email us at [email protected]
WWW.SGS.COM/MINERALS
Flotation Symposium, (The Australasian Institute of Mining and Metallurgy: Melbourne).
Dobby, G and Finch, J, 1987. Particle size dependence in flotation derived from a fundamental model of the capture process, International Journal of Mineral Processing, 21:241-260.
Dobby, G, Kosick, G and Amelunxen, R, 2002. A focus on variability within the orebody for improved design of flotation plants, in Proceedings 33rd Canadian Mineral Processors, Ottawa.
King, P, 1976. The use of simulation in the design and modification of flotation plants, in Flotation, A M Gaudin Memorial Volume (ed: M C Fuerstenau), Vol 2, pp 937-962 (AIME).
MinnovEX Technologies, 2004. MinnovEX flotation test: standard procedure and parameter extraction [online]. Available from: <http://www.minnovex.com>.
Savassi, O, in press. A compartment model for the mass transfer inside a conventional flotation cell, International Journal of Mineral Processing.
SG
S Te
chni
cal P
aper
#20
05-0
9
SGS MINERALS SERVICES TECHNICAL BULLETIN 2005-09