
SGN CH 0 Initial Pages i to xii - CORE
281
Saurashtra University Re – Accredited Grade ‘B’ by NAAC (CGPA 2.93) Joshi, Ashish B., 2010, A Study on Coporate Governance and the Financial Performance of Selected Indian Companies, thesis PhD, Saurashtra University http://etheses.saurashtrauniversity.edu/id/eprint/101 Copyright and moral rights for this thesis are retained by the author A copy can be downloaded for personal non-commercial research or study, without prior permission or charge. This thesis cannot be reproduced or quoted extensively from without first obtaining permission in writing from the Author. The content must not be changed in any way or sold commercially in any format or medium without the formal permission of the Author When referring to this work, full bibliographic details including the author, title, awarding institution and date of the thesis must be given. Saurashtra University Theses Service http://etheses.saurashtrauniversity.edu [email protected] © The Author
Transcript of SGN CH 0 Initial Pages i to xii - CORE

Saurashtra University Re – Accredited Grade ‘B’ by NAAC (CGPA 2.93)
Joshi, Ashish B., 2010, A Study on Coporate Governance and the Financial Performance of Selected Indian Companies, thesis PhD, Saurashtra University
http://etheses.saurashtrauniversity.edu/id/eprint/101 Copyright and moral rights for this thesis are retained by the author A copy can be downloaded for personal non-commercial research or study, without prior permission or charge. This thesis cannot be reproduced or quoted extensively from without first obtaining permission in writing from the Author. The content must not be changed in any way or sold commercially in any format or medium without the formal permission of the Author When referring to this work, full bibliographic details including the author, title, awarding institution and date of the thesis must be given.
Saurashtra University Theses Service http://etheses.saurashtrauniversity.edu
© The Author
SGN
“A STUDY ON CORPORATE GOVERNANCE
AND THE FINANCIAL PERFORMANCE
OF SELECTED INDIAN COMPANIES.”
:: SUBMITTED TO ::
SAURASHTRA UNIVERSITY
FOR THE AWARD OF THE DEGREE OF
DOCTOR OF PHILOSOPHY
UNDER THE FACULTY OF COMMERCE
BY
MR. ASHISH JOSHI
Registration No. : 3805 Date: 28th February, 2008 Synopsis Submitted Date: 23rd March, 2010
UNDER THE SUPERVISION OF
DR. HITESH J. SHUKLA
ASSOCIATE PROFESSOR
DEPARTMENT OF BUSINESS MANAGEMENT (MBA Program)
SAURASHTRA UNIVERSITY RAJKOT – 360 005
GUJARAT (INDIA)
September – 2010
ii
Structure of The Thesis
Certificate by The Guide iii
Declaration by Research Scholar iv
Acknowledgement v
Executive Summary vi
List of Abbreviations viii
Contents ix
List of Tables x
List of Graphs xii
Details of Thesis 1-255
Annexure : Clause 49 of Listing Agreement i – xiii

iii
Certificate by The Guide
This is to certify that Mr. Ashish B. Joshi has carried out the research work as
presented in this thesis under my supervision and the presentation is his contribution.
It is a standard piece of work, which embraces a fresh approach towards analysis and
interpretation of facts, which provides the candidate’s capacity for critical
examination and sound judgment over the problem studies by him.
He has devoted himself to the conduct of this research work under my guidance and
supervision as per the stipulated norms of Saurasthra University and this work has not
been submitted for the award of any degree to any other university.
Date:
Place : Rajkot DR. HITESH J SHUKLA
Associate Professor,
Department Business Management (MBA Program)
Saurashtra University,
Rajkot – 360 005
iv
Declaration by Research Scholar
I, the undersigned Mr. Ashish Joshi, a research student of Doctor of Philosophy,
Department of Business Management, Saurashtra University, Rajkot here by declare
that the research work embodied in this thesis is the outcome of my endeavor and it
was supervised by Dr. Hitesh J. Shukla, Associate Professor, Department of Business
Management, Saurashtra University, Rajkot.
I further declare that this thesis not in any form has been submitted to any other
institution of higher learning for the award of any degree or diploma.
Date: Ashish Joshi
Place : Rajkot
v
Acknowledgement
First of all, I acknowledge the grace of God, to make me always charged whenever my strength goes down.
How can I express my sincere and informal thanks to my guide, really there is no word or there are no words than to say heartily “Thanks” to my guide Dr. Hitesh J Shukla, Associate Professor, Department of Business Management, Saurashtra University, Rajkot. I have really no meaning of subject without his continuous, valuable and strong conceptual base guidance. No doubt it was my dream to reach to this level but there was only hope, he is the only person who has shown me real path and ladder to reach to the level of this kind and generated learning desire in me. His ability to motivate me and make me understand about such difficult and current topic has triggered my desire of undertaking research. I am really thankful for his guidance.
I would like to express my deep sense and gratitude to Prof. Pratapsinh L. Chauhan, Professor and Head, Department of Business Management, Saurasthra University, Rajkot Prof. D C Gohil, Head, Department of Commerce and Business Administration, Saurashtra University, Rajkot and Dr. Sanjay J. Bhayani, Association Professor, Department of Business Management, Saurashtra University, Rajkot.
I am indeed thankful to the all members of IITE and Electrotherm group companies. I have received due support and inspiration from Dr. Nagesh Bhandari (Managing Trustee), Mrs. Ritu Bhandari (Advisor), Dr. S B Sharma (Director) , Prof. C C Rajyaguru (Additional Director), Prof. V K Mangalik and Mr. P J Maniar (CAO). I am also grateful to Mr. Moe Vyas (CEO, AAA) and Mr. Ashwin Patel (CS, Electrotherm) and all faculty members of management department, who have supported me for this thesis.
For conducting this research, I have received due support from Center for Corporate Governance and Citizenship – IIM Bangalore, Center for Corporate Governance – NISM, Mumbai, Global Corporate Governance Forum – IFC Washington, Ahmedabad Management Association and Shri N. Vitthal (IAS-Retd), [former Chief Vigilance Commissioner, Govt. of India].
I am also thankful to my parents and family members without their kind support this cannot be possible.
Ashish Joshi

vi
Executive Summary
Good governance is the expectations of every stakeholder, specially, shareholder.
Governance is related with the controlling of the activity and controlling of the
corporate sector can be termed as corporate governance. But the implementation of
‘Corporate Governance’ is not that much simple as its meaning. Corporate
Governance is recently emerged concept and has taken the attention of each and every
country, investors and corporate professionals.
Corporate governance is the practice, which requires transparency, accountability and
good performance from the corporate executives. It has, its strong base from the
internal management of company, to the shareholders’ value as well as corporate
social responsibility. Reasons for selecting corporate level units which are functioning
in India is to find out whether corporate governance is actually being practiced by the
corporate level executives or not.
The first chapter gives an overview of corporate governance. It introduces the concept
of Corporate Governance in narrow as broad definitions. The corporate governance
and relationship with various stakeholders is also narrated in it. The global landmarks
in the history of corporate governance in the countries like USA, UK is also discussed
in this chapter. Brief reports of various corporate governance committees formed at
international level, OECD principles and Sorbanes – Oxley Act is also discussed in
this chapter. Finally the chapter describes the history of all efforts made by various
players in the area of corporate governance in India. The chapter also contains recent
developments in India related to corporate governance like report of CII Task Force
and Corporate Governance: Voluntary Guidelines issued by Ministry of Corporate
Affairs, Government of India.
The second chapter is about the measuring financial performance. It discusses stake
holders who are interested in the financial performance. There are various techniques
for analysis is discussed in this chapter like, Ratio Analysis, Du-Pont Analysis,
Comparative Statement Analysis, Time Series Analysis and Inter Firm Analysis.
Various types are ratios are also discussed in this chapter, including Liquidity Ratios,
Leverage Ratios, Activity Ratios and Profitability Ratios.
vii
The Third chapter is about research methodology. It includes the methodology to
compute score for Corporate Governance and parameters to judge the financial
performance. Researcher has selected BSE 100 Companies spread across various
sectors. For the study of sample, researcher has used secondary data and for that
Annual Reports of 90 companies are gathered and analyzed. Researcher has collected
the data from the annual reports of the financial year 2008. The collected data are then
classified and segmented into various groups. The parameters for arriving at financial
corporate governance performance score and financial performance score are also
discussed in this chapter.
The Forth chapter analyses the corporate governance practices in Indian companies.
The sample of 90 companies is further classified into 12 sectors. The corporate
governance is calculated using several parameters and is grouped into 17 different
aspects having total weightage score of 100.
Average score of all sample companies in India is 67. The average score of FMCG
and Information Technology sector companies is highest at 71. The lowest average
score (63) is from Capital Goods sector companies. The Infosys Technologies Limited
scores highest points (91), whereas Mahanagar Telecom Nigam Limited scores lowest
(48) points in the corporate governance performance parameters.
The Fifth Chapter analyses the financial performance of companies. The four key
parameters used to evaluate the financial performance are, EBT/Sales Ratio,
Sales/Total Assets Ratio, Earnings Per Share and Price/Earnings Multiple. Further a
co-relation is also established between above four financial performance parameters
and four key corporate governance parameters. Four key areas of corporate
governance area are: Director’s Information (DI), Board Committees (BC),
Transparency & Disclosure (TD) and General Information (GI). A cross tabulation is
also formed for each sector using financial performance related parameters on one
axis and the corporate governance parameters on the other axis. The three hypotheses
are also tested using various techniques.
The sixth chapter includes the summary of every chapter. A comprehensive data
related to calculations related with Corporate Governance score and summary of
financial performance is also produced in it. The Table indicated correlation and
hypothesis testing is also included in the chapter.

viii
List of Abbreviations
BSE : Bombay Stock Exchange
BC : Board Composition (& Related Disclosure)
CII : Confederation of Indian Industry
CG : Corporate governance
CSR : Corporate Social Responsibility
DIR : Directors (& Related Disclosure)
EBT : Earnings Before Tax
EPS : Earnings Per Share
EHS : Employee Health and Safety
FDI : Foreign Direct Investors
FP : Financial Performance
FII : Foreign Institutional Investor
FMCG : Fast Moving Consumer Goods
Govt. : Government
GI : General Information (& Related Disclosure)
HRD : Human Resources Development
IR : Industrial Relations
NM : Not Mentioned
NSE : National Stock Exchange
N.W. : Net worth
PAT : Profit After Tax
PE : Price Earnings Multiple
SEBI : Securities and Exchange Board of India
TA : Total Assets
TD : Transparency (& Related Disclosure)
ix
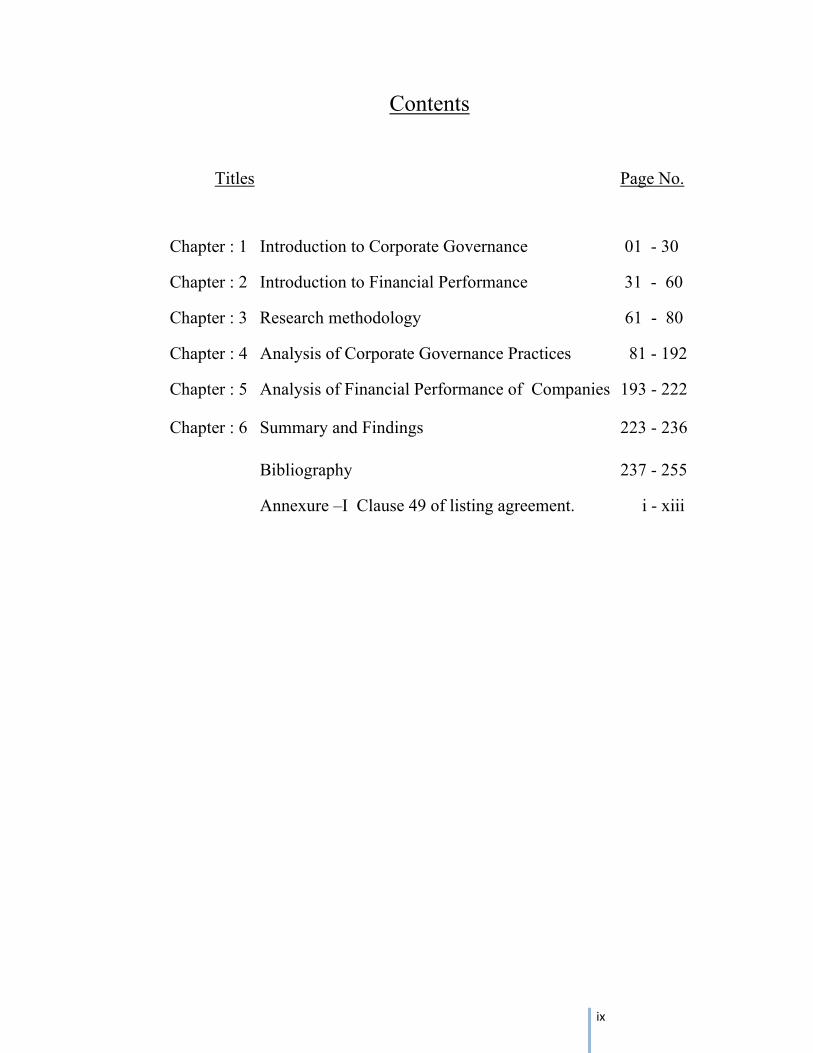
Contents
Titles Page No.
Chapter : 1 Introduction to Corporate Governance 01 - 30
Chapter : 2 Introduction to Financial Performance 31 - 60
Chapter : 3 Research methodology 61 - 80
Chapter : 4 Analysis of Corporate Governance Practices 81 - 192
Chapter : 5 Analysis of Financial Performance of Companies 193 - 222 Chapter : 6 Summary and Findings 223 - 236
Bibliography 237 - 255
Annexure –I Clause 49 of listing agreement. i - xiii
x
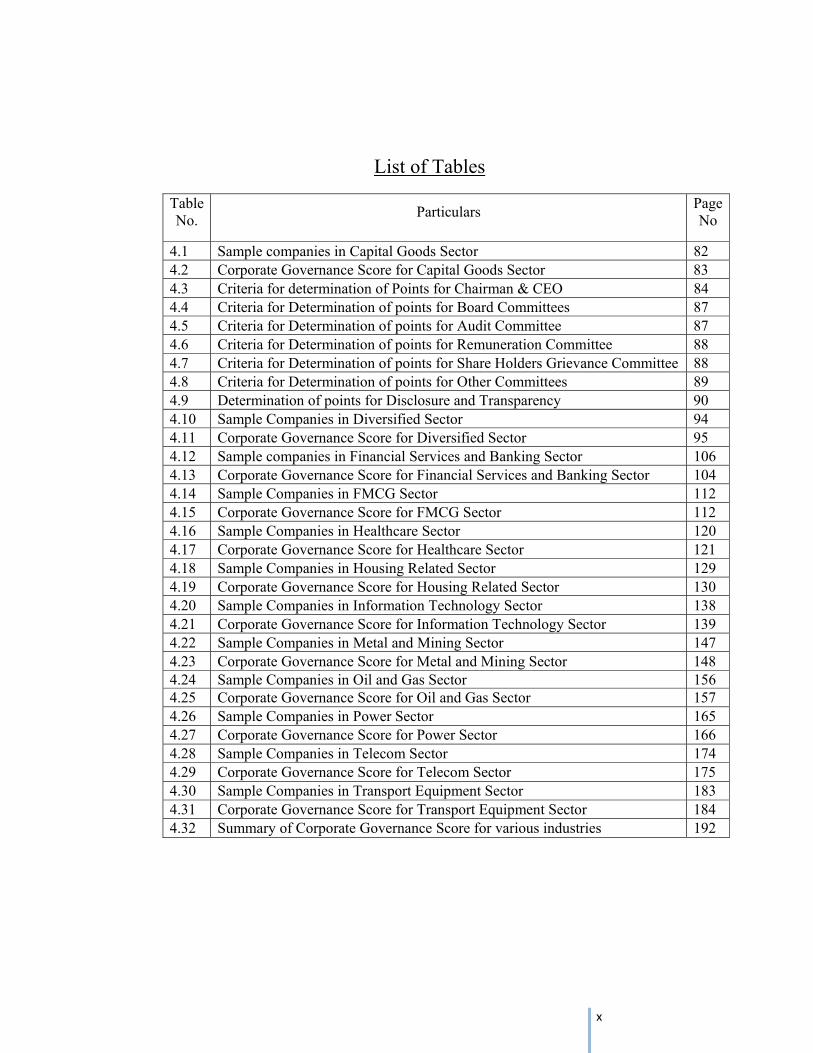
List of Tables
Table No. Particulars Page
No
4.1 Sample companies in Capital Goods Sector 82 4.2 Corporate Governance Score for Capital Goods Sector 83 4.3 Criteria for determination of Points for Chairman & CEO 84 4.4 Criteria for Determination of points for Board Committees 87 4.5 Criteria for Determination of points for Audit Committee 87 4.6 Criteria for Determination of points for Remuneration Committee 88 4.7 Criteria for Determination of points for Share Holders Grievance Committee 88 4.8 Criteria for Determination of points for Other Committees 89 4.9 Determination of points for Disclosure and Transparency 90 4.10 Sample Companies in Diversified Sector 94 4.11 Corporate Governance Score for Diversified Sector 95 4.12 Sample companies in Financial Services and Banking Sector 106 4.13 Corporate Governance Score for Financial Services and Banking Sector 104 4.14 Sample Companies in FMCG Sector 112 4.15 Corporate Governance Score for FMCG Sector 112 4.16 Sample Companies in Healthcare Sector 120 4.17 Corporate Governance Score for Healthcare Sector 121 4.18 Sample Companies in Housing Related Sector 129 4.19 Corporate Governance Score for Housing Related Sector 130 4.20 Sample Companies in Information Technology Sector 138 4.21 Corporate Governance Score for Information Technology Sector 139 4.22 Sample Companies in Metal and Mining Sector 147 4.23 Corporate Governance Score for Metal and Mining Sector 148 4.24 Sample Companies in Oil and Gas Sector 156 4.25 Corporate Governance Score for Oil and Gas Sector 157 4.26 Sample Companies in Power Sector 165 4.27 Corporate Governance Score for Power Sector 166 4.28 Sample Companies in Telecom Sector 174 4.29 Corporate Governance Score for Telecom Sector 175 4.30 Sample Companies in Transport Equipment Sector 183 4.31 Corporate Governance Score for Transport Equipment Sector 184 4.32 Summary of Corporate Governance Score for various industries 192
xi
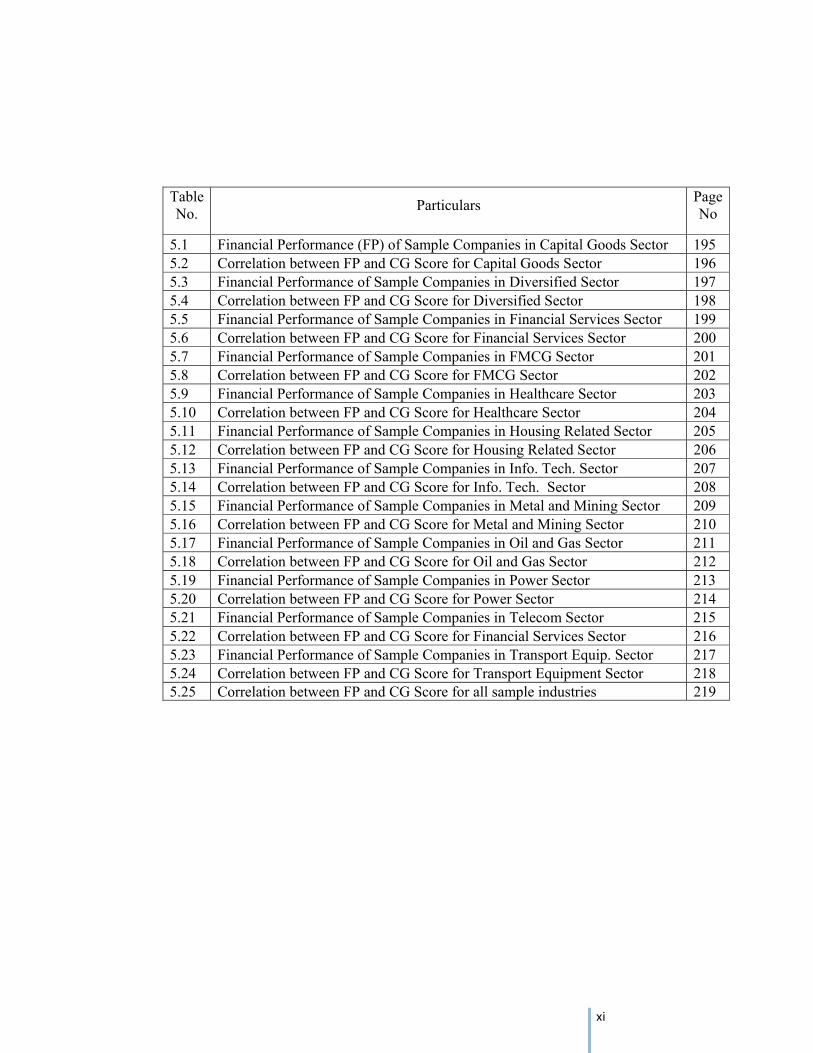
Table No. Particulars Page
No
5.1 Financial Performance (FP) of Sample Companies in Capital Goods Sector 195 5.2 Correlation between FP and CG Score for Capital Goods Sector 196 5.3 Financial Performance of Sample Companies in Diversified Sector 197 5.4 Correlation between FP and CG Score for Diversified Sector 198 5.5 Financial Performance of Sample Companies in Financial Services Sector 199 5.6 Correlation between FP and CG Score for Financial Services Sector 200 5.7 Financial Performance of Sample Companies in FMCG Sector 201 5.8 Correlation between FP and CG Score for FMCG Sector 202 5.9 Financial Performance of Sample Companies in Healthcare Sector 203 5.10 Correlation between FP and CG Score for Healthcare Sector 204 5.11 Financial Performance of Sample Companies in Housing Related Sector 205 5.12 Correlation between FP and CG Score for Housing Related Sector 206 5.13 Financial Performance of Sample Companies in Info. Tech. Sector 207 5.14 Correlation between FP and CG Score for Info. Tech. Sector 208 5.15 Financial Performance of Sample Companies in Metal and Mining Sector 209 5.16 Correlation between FP and CG Score for Metal and Mining Sector 210 5.17 Financial Performance of Sample Companies in Oil and Gas Sector 211 5.18 Correlation between FP and CG Score for Oil and Gas Sector 212 5.19 Financial Performance of Sample Companies in Power Sector 213 5.20 Correlation between FP and CG Score for Power Sector 214 5.21 Financial Performance of Sample Companies in Telecom Sector 215 5.22 Correlation between FP and CG Score for Financial Services Sector 216 5.23 Financial Performance of Sample Companies in Transport Equip. Sector 217 5.24 Correlation between FP and CG Score for Transport Equipment Sector 218 5.25 Correlation between FP and CG Score for all sample industries 219
xii
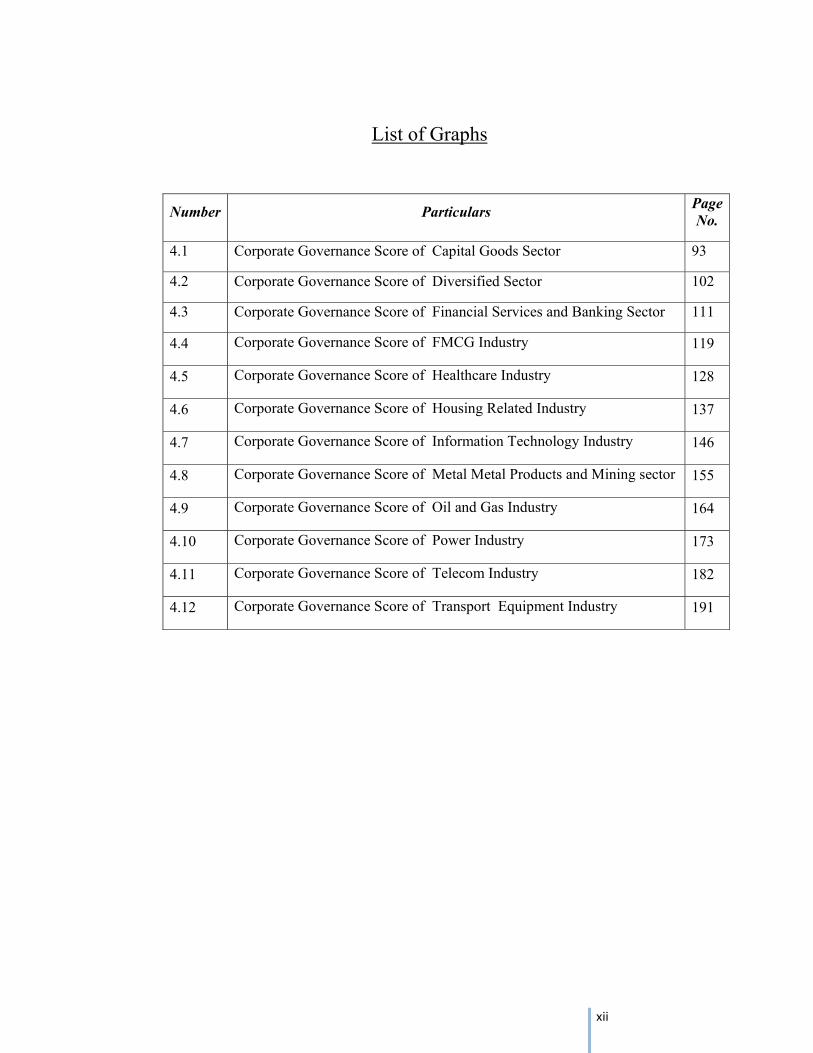
List of Graphs
Number Particulars Page No.
4.1 Corporate Governance Score of Capital Goods Sector 93
4.2 Corporate Governance Score of Diversified Sector 102
4.3 Corporate Governance Score of Financial Services and Banking Sector 111
4.4 Corporate Governance Score of FMCG Industry 119
4.5 Corporate Governance Score of Healthcare Industry 128
4.6 Corporate Governance Score of Housing Related Industry 137
4.7 Corporate Governance Score of Information Technology Industry 146
4.8 Corporate Governance Score of Metal Metal Products and Mining sector 155
4.9 Corporate Governance Score of Oil and Gas Industry 164
4.10 Corporate Governance Score of Power Industry 173
4.11 Corporate Governance Score of Telecom Industry 182
4.12 Corporate Governance Score of Transport Equipment Industry 191

SGN
Chapter: 1
Introduction to Corporate Governance
• Corporate Governance : An Understanding
• Global landmarks in the Emergence of Corporate
Governance
o Developments in US
o Developments in UK
o Corporate Governance Committees
o World Bank on Corporate Governance
o OECD Principles
o Sorbanes-Oxley Act, 2002
• Corporate Governance History in India.
o CII Code
o Kumar Mangalam Birla Committee and Clause 49
o Naresh Chandra Committee
o Narayana Murthy Committee
• Corporate Governance : Recent Developments in India
o CII Taskforce on Corporate Governance - 2009
o Corporate Governance Voluntary Guidelines –
2009
Chapter: 1 Introduction To Corporate Governance
2
Corporate Governance: An understanding
Before delving further on the subject, it is important to define the concept of corporate
governance. The vast amount of literature available on the subject ensures that there
exist innumerable definitions of corporate governance. To get a fair view on the
subject it would be prudent to give a narrow as well as a broad definition of corporate
governance.
In a narrow sense, corporate governance involves a set of relationships amongst the
company’s management, its board of directors, its shareholders, its auditors and other
stakeholders. These relationships, which involve various rules and incentives, provide
the structure through which the objectives of the company are set, and the means of
attaining these objectives as well as monitoring performance are determined. Thus,
the key aspects of good corporate governance include transparency of corporate
structures and operations; the accountability of managers and the boards to
shareholders; and corporate responsibility towards stakeholders.
While corporate governance essentially lays down the framework for creating long-
term trust between companies and the external providers of capital, it would be wrong
to think that the importance of corporate governance lies solely in better access of
finance.
Companies around the world are realizing that better corporate governance adds
considerable value to their operational performance:
• It improves strategic thinking at the top by inducting independent directors
who bring a wealth of experience, and a host of new ideas
• It rationalizes the management and monitoring of risk that a firm faces
globally
• It limits the liability of top management and directors, by carefully articulating
the decision making process
• It assures the integrity of financial reports
• It has long term reputational effects among key stakeholders, both internally
and externally

Chapter: 1 Introduction To Corporate Governance
3
In a broader sense, however, good corporate governance- the extents to which
companies are run in an open and honest manner- is important for overall market
confidence, the efficiency of capital allocation, the growth and development of
countries’ industrial bases, and ultimately the nations’ overall wealth and welfare.
It is important to note that in both the narrow as well as in the broad definitions, the
concepts of disclosure and transparency occupy centre-stage. In the first instance, they
create trust at the firm level among the suppliers of finance. In the second instance,
they create overall confidence at the aggregate economy level. In both cases, they
result in efficient allocation of capital.
Having committed to the above definitions, it is important to note that ever since the
first writings on the subject appeared in the academic domain, there have been many
debates on the true scope and nature of corporate governance mechanisms around the
world.
More specifically on the question ‘Who should corporate governance really
represent?’ This issue of whether a company should be run solely in the interest of the
shareholders or whether it should take account the interest of all constituents1 has
been widely discussed and debated for a long time now. Two definitions of Corporate
Governance highlight the variation in the points of view:
‘Corporate governance is concerned with ways of bringing the interests of investors
and manager into line and ensuring that firms are run for the benefit of investors’.2
Corporate governance includes ‘the structures, processes, cultures and systems that
engender the successful operation of organizations’3
The issue raised here is whether the recognition of claims of a wider set of
stakeholders, than those of shareholders alone, is the legitimate concern of corporate
governance. If it can be established that there are groups other than shareholders with
legitimate claims on companies, and that their involvement in corporate decision
making is both a right and is also economically beneficial, then the task of policy
Chapter: 1 Introduction To Corporate Governance
4
makers is to consider: ‘How should the company be regulated so as to enhance its
effectiveness as a mechanism for enhancing the overall wealth or well-being of all
stakeholders?’
The belief that the purpose of the modern corporation is to maximize shareholder
value, along with typical capital market and ownership features has been associated
with the ‘Anglo-Saxon’ agency model of the corporation.
This contrasts the ‘German (and Japanese) conception of the company as a social
institution’. In making this distinction, commentators have mostly focused on the
extent and nature of the separation of ownership and control. The Anglo-Saxon model
is said to be characterized by a clear separation between management control and
shareholder ownership, and hence is described as an ‘outsider’ system of corporate
governance. It is contrasted with the ‘insider’ system, thought to be more descriptive
of continental European and Japanese corporate forms.
Shareholder primacy is embodied in the finance view of corporate governance, which
is a special instance of the principal-agent framework in economic theory. In terms of
the finance view, the primary justification for the existence of the corporation is to
maximize shareholder wealth. Since ownership and control are separate (for purposes
of liquidity, risk sharing and specialization), the central corporate governance issue
from this perspective is aligning the objectives of management with the objective of
shareholder wealth maximization.
While companies are encouraged to foster long-term relationships with stakeholders
by taking their interests into account, there is no concomitant pressure to build into
corporate governance, structures and processes that would ensure company
accountability towards stakeholder groups. It is frequently argued that attempts to
mediate stakeholder claims may obscure performance evaluation and therefore
facilitate discretionary behaviour by management.

Chapter: 1 Introduction To Corporate Governance
5
The issue raised in the stakeholder theories is whether the recognition of a wider set
of claims than those of shareholders alone is the legitimate concern of corporate
governance.
It is argued that the new high technology world has significantly reduced the
opportunity, ability, and motivation of consumers to engage in rational decision
making. Therefore, the development of loyal, inclusive stakeholder relationships,
rather than the production of a better product at a lower price, will be the most
important determinant of commercial viability and business success.
The main intention of the stakeholder’s concept as theory is to affirm and show that
the company together with its executive board is responsible not only for shareholders
but also for individuals or groups that have a stake in the actions and decisions of such
organization. Concerning the concept of company, the theory implies understanding
the company as a social institution that conforms a plural project in which distinct
groups with rights and demands take part.
With reference to company manageability, this theory implies searching for a balance
among the distinct company interest groups – shareholders, workers, clients,
suppliers, banks, subsidiaries, local communities, pressure groups and the like- on
part of the executive board. Furthermore, the executive board should also look for
participation of those individuals and groups – either directly or by means of
representatives- that are somehow linked to the organization aims.4
Chapter: 1 Introduction To Corporate Governance
6
Global Landmarks in the Emergence of Corporate Governance
There were several frauds and scams in the corporate history of the world. It was felt
that the system for regulation is not satisfactory and it was felt that it needed
substantial external regulations. These regulations should penalize the wrong doers
while those who abide by rules and regulations, should be rewarded by the market
forces. There were several changes brought out by governments, shareholder
activism, insistence of mutual funds and large institutional investors, that corporate
they invested in adopt better governance practices and in formation of several
committees to study the issues in depth and make recommendations, codes and
guidelines on Corporate Governance that are to be put in practice. All these measures
have brought about a metamorphosis in corporate that realized that investors and
society are serious about corporate governance.
• Developments in USA
Corporate Governance gained importance with the occurrence of the Watergate
scandal in United States. Thereafter, as a result of subsequent investigations, US
regulatory and legislative bodies were able to highlight control failures that had
allowed several major corporations to make illegal political contributions and to bribe
government officials. This led to the development of the Foreign and Corrupt
Practices Act of 1977 that contained specific provisions regarding the establishment,
maintenance and review of systems of internal control. This was followed in 1979 by
Securities and Exchange Commission’s proposals for mandatory reporting on internal
financial controls. In 1985, following a series of high profile business failures in the
US, the most notable one of which being the savings and loan collapse, the Tradway
Commission was formed to identify the main cause of misrepresentation in financial
reports and to recommend ways of reducing incidence thereof. The tradway Report
published in 1987 highlighted the need for a proper control environment, independent
audit committees and an objective internal audit function and called for published
reports on the effectiveness of internal control The commission also requested the
sponsoring organizations to develop an integrated set of internal control criteria to
enable companies to improve their control.5
Chapter: 1 Introduction To Corporate Governance
7
• Developments in UK
In England, the seeds of modern corporate governance were sown by the Bank of
Credit and Commerce International (BCCI) Scandal. The Barings Bank was another
landmark. It heightened people’s awareness and sensitivity on the issue and resolve
that something ought to be done to stem the rot of corporate misdeeds. These couple
of examples of corporate failures indicated absence of proper structure and objectives
of top management. Corporate Governance assumed more importance in light of
these corporate failures, which was affecting the shareholders and other interested
parties.
As a result of these corporate failures and lack of regulatory measurers from
authorities as an adequate response to check them in future, the Committee of
Sponsoring Organizations (COSO) was born. The report produced in 1992 suggested
a control framework and was endorsed a refined in four subsequent UK reports:
Cadbury, Ruthman, Hampel and Turbull.
There were several other corporate failures in the companies like Polly Peck, British
& Commonwealth and Robert Maxwell’s Mirror Group News International were all
victims of the boom-to-bust decade of the 1980s. Several companies, which saw
explosive growth in earnings, ended the decade in a memorably disastrous manner.
Such spectacular corporate failures arose primarily out of poorly managed business
practices.
The publication of a serious of reports consolidated into the Combined Code on
Corporate Governance (The Hampel Report) in 1998 resulted in major changes in the
area of corporate governance in United Kingdom. The corporate governance
committees of last decade have analyzed the problems and crises besetting the
corporate sector and the markets and have sought to provide guidelines for corporate
management. Studying the subject matter of the corporate codes and the reports
produced by various committees highlighted the key practical problem and concerns
driving the development of corporate governance over the last decade.6
Chapter: 1 Introduction To Corporate Governance
8
• Corporate Governance Committees
The main committees, known by the names of the individuals who chaired them are
discussed hereunder
a) Cadbury committee on Corporate Governance – 1992 7
The stated objectives of the Cadbury Committee5was “To help raise the
standards of corporate governance and the level of confidence in financial
reporting and auditing by setting out clearly what it sees as the respective
responsibilities of those involved and what it believes his expected of them.
The committee investigated the accountability of the board of directors to
shareholders and to society. It submitted its report and associated “Code of
Best Practices” in 1992 wherein it spelt out the methods of governance needed
to achieve a balance between the essential power of the board of directors and
their proper accountability. Its recommendations were not mandatory. The
Cadbury code of best practices had 19 recommendations. The
recommendations are in the nature of guidelines relating to the board of
directors, non-executive directors, executive directors and those on reporting
and control.
The stress in the Cadbury committee report is on the crucial role of the board
and the need for it to observe the Code of Best Practices. Its important
recommendations include the setting up of an audit committee with
independent members.
b) The Paul Ruthman Committee
The committee was constituted later to deal with the said controversial point
of Cadbury Report. It watered down the proposal on the grounds of
practicality. It restricted the reporting requirement to internal financials
controls only as against “the effectiveness of the company’s system of internal
control” as stipulated by the Code of Best Practices contained in the Cadbury
Report.

Chapter: 1 Introduction To Corporate Governance
9
The final report submitted by the Committee chaired by Ron Hampel had
some important and progressive elements, notably the extension of directors’
responsibilities to “all relevant control objectives including business risk
assessment and minimizing the risk of fraud….”
c) The Greenbury Committee 8
This committee was setup in January 1995 to identify good practices by the
Confederation of British Industry (CBI), in determining directors’
remuneration and to prepare a code of such practices for use by public limited
companies of United Kingdom.
The committee aimed to provide an answer to the general concerns about the
accountability by the proper allocation of responsibility for determining
directors’ remuneration, the proper reporting to shareholders and greater
transparency in the process.
The committee produced the Greenbury Code of Best Practice which was
divided into the four sections : Remmuneration Committee, Disclosures,
Remuneration Policy and Service Contracts and Compensation.
The Greenbury committee recommended that UK companies should
implement the code as set out to the fullest extent practicable, that they should
make annual compliance statements, and that investor institutions should use
their power to ensure that the best practice is followed.
d) The Hampel Committee 9
The Hampel committee was setup in November 1995 to promote high
standards on Corporate Governance both to protect investors and preserve and
enhance the standing of companies listed on the London Stock Exchange.
The committee developed further the Cadbury report. And it made the
following recommendations.
i) The auditors should report on internal control privately to the directors.
ii) The directors maintain and review all controls.
iii) Companies should time to time review their need for internal audit
function and control.

Chapter: 1 Introduction To Corporate Governance
10
It also introduced the combined code that consolidated the recommendation of
earlier corporate governance reports (Cadbury Committee and Greenbury
Committee).
e) The Combined Code
The combined code was subsequently derived from Ron Hampel Committee’s
Final Report, Cadbury Report and the Greenbury Report. The combined code
is appended to the listing rules of the London Stock Exchange. As such,
compliance of the code is mandatory for all listed companies in UK.
The stipulations contained in the Combined Code require, among other things,
that the boards should maintain a sound system of internal control to safeguard
shareholder’s investments and the company’s assets. The directors should, at
least annually, conduct a review of the effectiveness of the group’s system of
internal control covering all controls, including financial, operational and
compliance and risk management, and report to shareholders that they have
done so.
f) The Turnbull Committee 10
The Turnbull Committee was set up by the Institute of Chartered Accountants
in England and Wales (ICAEW) in 1999 to provide guidance to assist
companies in implementing the requirements of the Combined Code relating
to internal control.
The committee provided guidance to assist companies in implementing the
requirements of the Combined Code relating to internal control. It
recommended that where companies do not have an internal audit function, the
board should consider the need for carrying out an internal audit annually.
The committee also recommended that board of directors confirm the
existence of procedures for evaluation and managing key risks.
Corporate Governance is constantly evolving to reflect the current corporate
economic and legal environment. To be effective, corporate governance
practices need to be tailor to particular needs, objectives and risk management
structure of an organization.

Chapter: 1 Introduction To Corporate Governance
11
• World Bank on Corporate Governance
The World Bank, involved in sustainable development was one of the earliest
economic organization o study the issue of corporate governance and suggest certain
guidelines. The World Bank report on corporate governance recognizes the
complexity of the concept and focuses on the principles such as transparency,
accountability, fairness and responsibility that are universal in their applications.
Corporate governance is concerned with holding the balance between economic and
social goals and between individual and communal goals. The governance framework
is there to encourage the efficient use of resources and equally to require
accountability for the stewardship of those resources. The aim is to align as nearly as
possible, the interests of individuals, organizations and society.
The foundation of any corporate governance is disclosure. Openness is the basis of
public confidence in the corporate system and funds will flow to those centers of
economic activity, which inspire trust. This report points the way to establishment of
trust and the encouragement of enterprise. It marks an important milestone in the
development of corporate governance.
• OECD Principles 11
Organization for Economic Co-operation and Development (OECD) was one of the
earliest non-governmental organizations to work on and spell out principles and
practices that should govern corporate in their goal to attain long-term shareholder
value.
The OECD were trend setters as the Code of Best practices are associated with
Cadbury report. The OECD principles in summary include the following elements.
i) The rights of shareholders
ii) Equitable treatment of shareholders
iii) Role of stakeholders in corporate governance
iv) Disclosure and Transparency
v) Responsibilities of the board
The OECD guidelines are somewhat general and both the Anglo-American system
and Continental European (or German) system would be quite consistent with it.
Chapter: 1 Introduction To Corporate Governance
12
• Sarbanes- Oxley Act, 2002 13
The Sarbanes-Oxley Act (SOX) is a sincere attempt to address all the issues
associated with corporate failure to achieve quality governance and to restore
investor’s confidence. The Act was formulated to protect investors by improving the
accuracy and reliability of corporate disclosures, made precious to the securities laws
and for other purposes. The act contains a number of provisions that dramatically
change the reporting and corporate director’s governance obligations of public
companies, the directors and officers. The important provisions in the SOX Act are
briefly given below.
i) Establishment of Public Company Accounting Oversight Board
(PCAOB): SOX creates a new board consisting of five members of
whom two will be certified public accountants. All accounting firms
have to get registered with the board. The board will make regular
inspection of firms. The board will report to SEC. The report will be
ultimately forwarded to Congress.
ii) Audit Committee: The SOX provides for new improved audit
committee. The committee is responsible for appointment, fixing fees
and oversight of the work of independent auditors. The registered
public accounting firms should report directly to audit committee on all
critical accounting policies.
iii) Conflict of Interest: The public accounting firms should not perform
any audit services for a publically traded company.
iv) Audit Partner Rotation : The act provides for mandatory rotation of
lead audit or co-ordinating partner and the partner reviewing audit once
every 5 years.
v) Improper influence on conduct of Audits : According to act, it is
unlawful for any executive or director of the firm to take any action to
fraudulently influence, coerce or manipulate an audit.
vi) Prohibition of non-audit services : Under SOX act, auditors are
prohibited from providing non-audit services concurrently with audit
financial review services.

Chapter: 1 Introduction To Corporate Governance
13
vii) CEOs and CFOs are required to affirm the financials : CEOs and CFOs
are required to certify the reports filed with the Securities and
Exchange Commission (SEC).
viii) Loans to Directors : The act prohibits US and foreign companies with
Securities traded within US from making or arranging from third
parties any type of personal loan to directors.
ix) Attorneys : The attorneys dealing with publicly traded companies are
required to report evidence of material violation of securities law or
breach of fiduciary duty or similar violations by the company or any
agent of the company to Chief Counsel or CEO and if CEO does not
respond then to the audit committee or the Board of Directors.
x) Securities Analysts : The SOX has provision under which brokers and
dealers of securities should not retaliate or threaten to retaliate an
analyst employed by broker or dealer for any adverse , negative or
unfavorable research report on a public company. The act further
provides for disclosure of conflict of interest by the securities analysts
and brokers or dealers.
xi) Penalties : The penalties are also prescribed under SOX act for any
wrong doing. The penalties are very Stiff.
The Act also provides for studies to be conducted by Securities and Exchange
Commission or the Government Accounting Office in the following area :
i) Auditor’s Rotation
ii) Off balance Sheet Transactions
iii) Consolidation of Accounting firms & its impact on industry
iv) Role of Credit Rating Industry
v) Role of Investment Bank and Financial Advisers.
The most important aspect of SOX is that it makes it clear that company’s senior
officers are accountable and responsible for the corporate culture they create and must
be faithful to the same rules they setout for other employees. The CEO for example,
must be responsible for the company’s disclosure, controls and financial reporting.
Chapter: 1 Introduction To Corporate Governance
14
Corporate governance : History in India
There have been several major corporate governance initiatives launched in India
since the mid-1990s. The first was by the Confederation of Indian Industry (CII),
India’s largest industry and business association, which came up with the first
voluntary code of corporate governance in 1998. The second was by the SEBI, now
enshrined as Clause 49 of the listing agreement. The third was the Naresh Chandra
Committee, which submitted its report in 2002. The fourth was again by SEBI — the
Narayana Murthy Committee, which also submitted its report in 2002. Based on some
of the recommendation of this committee, SEBI revised Clause 49 of the listing
agreement in August 2003.
Subsequently, SEBI withdrew the revised Clause 49 in December 2003, and currently,
the original Clause 49 is in force.
• The CII Code 14
More than a year before the onset of the Asian crisis, CII set up a committee to
examine corporate governance issues, and recommend a voluntary code of best
practices. The committee was driven by the conviction that good corporate
governance was essential for Indian companies to access domestic as well as global
capital at competitive rates. The first draft of the code was prepared by April 1997,
and the final document (Desirable Corporate Governance: A Code), was publicly
released in April 1998. The code was voluntary, contained detailed provisions, and
focused on listed companies.
Desirable Disclosure “Listed companies should give data on high and low monthly averages of share prices
in a major stock exchange where the company is listed; greater detail on business
segments, up to 10% of turnover, giving share in sales revenue, review of operations,
analysis of markets and future prospects.” Major Indian stock exchanges should
gradually insist upon a corporate governance compliance certificate, signed by the

Chapter: 1 Introduction To Corporate Governance
15
CEO and the CFO.” If any company goes to more than one credit rating agency, then
it must divulge in the prospectus and issue document the rating of all the agencies that
did such an exercise. These must be given in a tabular format that shows where the
company stands relative to higher and lower ranking.”
“Companies that default on fixed deposits should not be permitted to accept further
deposits and make inter-corporate loans or investments or declare dividends until the
default is made good.”
The CII code is voluntary. Since 1998, CII has been trying induce companies to
disclose much greater information about their boards. Consequently, annual reports of
companies that abide by the code contain a chapter on corporate governance
• Kumar Mangalam Birla committee report and Clause 49 15
While the CII code was well-received and some progressive companies adopted it, it
was felt that under Indian conditions a statutory rather than a voluntary code would be
more purposeful, and meaningful.
Consequently, the second major corporate governance initiative in the country was
undertaken by SEBI. In early 1999, it set up a committee under Kumar Mangalam
Birla to promote and raise the standards of good corporate governance. In early 2000,
the SEBI board had accepted and ratified key recommendations of this committee,
and these were incorporated into Clause 49 of the Listing Agreement of the Stock
Exchanges.
This report pointed out that the issue of corporate governance involves besides
shareholders, all other stakeholders. The committee’s recommendations have looked
at corporate governance from the point of view of the stakeholders and in particular
that of shareholders and investors.
Chapter: 1 Introduction To Corporate Governance
16
The control and reporting functions of boards, the roles of the various committees of
the board, the role of management, all assume special significance when viewed from
this perspective.
At the heart of committee’s report is the set of recommendations, which distinguish
the responsibilities, and obligations of the boards and the management in instituting
the systems for good C.G. Many of them are mandatory. These recommendations are
expected to be enforced on listed companies for initials disclosures. This enables
shareholders to know, where the companies are in which they have involved. The
committee recognized that India had in place a basic system of corporate governance
and that SEBI has already taken a number of initiatives towards raising the existing
standards.
The committee also recognized that the Confederation of Indian Industries (CII) had
published a code entitled “Desirable code of corporate of Governance and was
encouraged to note that some of the forward looking companies have already
reviewed their annual report through complied with the code.
Now to protect investors especially shareholders from any malpractices and injustice
the Securities and Exchange Board of India appointed committee on corporate
governance on May 7, 1999 under chairmanship of Shri Kumar Managalam Birla,
Member of SEBI Board to promote standard of Corporate Governance.
The constitutions of Committee
The committee has identified the three key constituents of corporate governance as
the share holders, the Board of Directors and the Management. Along with this the
committee has identified major 3 aspects namely accountability, transparency and
equality of treatment for all shareholders. Crucial to good corporate governance are
the existence and enforceability of regulations relating to insider information and
insider trading. These matters are currently being examined over here. The committee
had received good comments from almost all experts institutions, chamber of
commerce Adrian Cadbury – Cadbury Committee etc.
Chapter: 1 Introduction To Corporate Governance
17
Corporate Governance Objectives
Corporate Governance has several claimants – shareholders, suppliers, customers,
creditors, the bankers, employees of company and society. The committee for SEBI
keeping view has prepared primarily the interests of a particular class of stakeholders
namely the shareholders this report on corporate governance. It means enhancement
of shareholder value keeping in view the interests of the other stack holders.
Committee has recommended C.G. as company’s principles rather than just act. The
company should treat corporate governance as way of life rather than code.
Applicability of the Recommendation
Recommendations : Mandatory Non-Mandatory
The committee was of the firm view that mandatory compliance of the
recommendations at least in respect of essential the essential would be most
appropriate in the Indian context for the present.
The committee felt that some of the recommendations are absolutely essential for the
framework of corporate governance and virtually from its core while others could be
considered desirable. Thus committee has classified recognize into two parts.
Applicability
The committee was of the opinion that the recommendations should be made
applicable to the listed companies them directors, management, employees and
professionals associated with such companies, in accordance with time table proposed
in the schedule given later in this section.
According to the committee, the recommendations were to be applied to all the listed
private and public sector companies, in accordance with the schedule of
implementation. As for listed entitles which are not companies, but body corporate
e.g. private sector banks, financial institutions, insurance companies etc. incorporated
under statutes, the recommendations will apply to the extent that they do not violate
guidelines issued by prevalent authority.

Chapter: 1 Introduction To Corporate Governance
18
Schedule of implementation
The committee recognized that compliance with the recommendations would involve
restructuring the existing boards of companies. With in financial year 2000-2001, not
later than March 31, 2001 by all entitles, which are included either in-group ‘A’ of the
BSE on in S&P CNX Nifty index as on January 1, 2000. However, to comply with
recommendations, these companies may have to begin the process of implementation
as early as possible. These companies would cover more than 80% of the market
capitalization.
Within Financial year 2001-2002 but not later than March 31, 2002 by all the entities
which are presently listed with paid up share capital of Rs. 10 crore and above an net
worth of Rs. 25 crore as more any time in the history of the company. Within
financial year 2002-03 but not later than market 31, 2003 by all the entities which are
presently listed with paid up share capitals of Rs. 3 crore and above.
Mandatory Recommendations
Board of Directors:
An effective corporate governance system is one, which allows the board to perform
these dual functions efficiently. The board of directors of a company thus directs and
controls the management of a company and is accountable to the shareholders. The
board directs the company, by formulating and reviewing company’s policies
strategies, major plans of action, risk policy, annual budgets and business plans,
setting performance objectives, monitoring implementation and corporate
performance and over seeing major capital expenditures, appositions and change in
financial control and compliance with applicable law taking into the account the
interests of the stake holders.
Composition of the B.O.D.:
The composition of the Board is as important as it determines the ability of the board
to collectively provide leadership and ensures that no one individual or a group is able
to dominate the board. This has undergone a change and increasingly the boards
comprise of following groups of directors. Promoter, director executive and non-
executive directors, a part of who are independent.

Chapter: 1 Introduction To Corporate Governance
19
Independent Direction:
Independent directions are those directors who apart from receiving director’s
remuneration do not have any other material pecuniary relationship with company.
Further, all pecuniary relationship or transactions of the non executive directors
should be disclosed in the annual report. The committee recommended that the board
of a company have an optimum combination of executive and non-executive directors
with not less than fifty percent of the board comprising the non-executive directors. In
case a company has a non-executive chairman, at least one third of board should
comprise of independent directors and in case a company has an executive chairman
at least half of board should be independent.
Nominee Directors:
These directors are the nominees of the financial as investment institutions to
safeguard their interest it may be present of retired employee of financial institution
on outsider. The committee recommend that institutions should appoint nominees on
the boards of companies only on a selective basis where such appointment is pursuant
to a right under loan agreements as where such appointment in is considered
necessary to protect like interest of the institutions.
Chairman of the Board:
The committee recommended that a non-executive chairman should be entitled to
maintain a chairman’s office at the company’s expense and also allowed
reimbursement of expenses incurred in performance of his duties. This will enable
him to discharge the responsibilities effectively.
Audit committee (Non Mandatory):
The committee is of the view that the need for having an audit committee grows from
the recognition of the audit committees’ position in the larger mosaic of governance
process. The audit committee’s job is one of oversight and monitoring and carrying
out this job it relies on similar financial management and outside auditors. The
committee believes that the progressive standards of governance applicable to the full
board should also be applicable to the audit committee.
Chapter: 1 Introduction To Corporate Governance
20
The committee therefore recommended that the board of a company should set up a
qualified and independent audit committee. The committee states that audit committee
should have minimum three members, all being non-executive directors, with the
majority being independent and with at least one director having financial and
accounting knowledge.
Frequency of Meeting and Quorum (Mandatory Recommendation):
The committee recommends that to begun with the audit committee should meet at
least thrice a year. One meeting must be held before finalization of annual accounts
and one necessarily every six months. The quorum should be either two members or
one third of members of audit committee, whichever is higher and there should be a
minimum of two Independent directors.
Powers of audit committee (Mandatory):
(1) To investigate any activity within its terms of reference.
(2) To seek information from any employee.
(3) To obtain outside legal on other professional advice.
(4) To secure attendance of outsiders with relevant expertise, if it considers necessary.
Functions of Audit Committee (Mandatory):
(1) To ensure that the financial statement is correct, sufficient and creditable.
(2) Recommending the appointment and removal of external audit.
(3) Reviewing with management annual financial statement before submission to
board related to changes in accounting policies and practices.
(a) Major accounting entries.
(b) Qualifications in draft audit report.
(c) Significant adjustments arising out of audit.
(d) Compliance with accounting standards.
(e) Compliance with stock exchange and legal requirement concerning
financial statements.
(f) Any transaction that may have potential conflict with the interest of
company at large.

Chapter: 1 Introduction To Corporate Governance
21
(4) Reviewing with the management about adequacy of control.
(5) Discuss with internal auditors into the matter suspecting fraud on irregularity.
(6) Discuss with external auditors before the audit commences and also post-audit
discussion to ascertain any area of concern. .
Remuneration Committee (Mandatory):
The committee is of the view that a company must have a creditable and transparent
policy in determining and accounting for the remuneration of the directors. For this
purpose the committee recommends that the board should set up a remuneration
committee to determine on their behalf and on behalf of the shareholders with agreed
terms of references. The Remuneration Committee should comprise of at least three
directors, all of them should be non-executive directors, the chairman being an
independent one. The chairman of Remuneration Committee should present at AGM.
It is important for the shareholders to be informed of the remuneration of the directors
of the company, which is mandatory.
• Naresh Chandra Committee Report 16
The Naresh Chandra committee was appointed in August 2002 by the Department of
Company Affairs (DCA) under the Ministry of Finance and Company Affairs to
examine various corporate governance issues. The Committee submitted its report in
December 2002. It made recommendations in two key aspects of corporate
governance: financial and non-financial disclosures: and independent auditing and
board oversight of management.
The committee submitted its report on various aspects concerning corporate
governance such as role, remuneration, and training etc. of independent directors,
audit committee, the auditors and then relationship with the company and how their
roles can be regulated as improved. The committee stingily believes that “a good
accounting system is a strong indication of the management commitment to
governance.
Chapter: 1 Introduction To Corporate Governance
22
Good accounting means that it should ensure optimum disclosure and transparency,
should be reliable and credible and should have comparability.
According to the committee, the statutory auditor in a company is the “lead actor” in
disclosure front and this has been amply recognized sections 209 to 223 of the
companies act.
The chief aspects concerning the auditors functioning as per the act are:
• Auditors are fiduciaries of the shareholders not of the management as they are
appointed as the shareholders appoint them.
• Auditor’s independence is guaranteed as rules for removing on replacing an
auditor as more stringent than for reappointment.
• The statutory auditor of a company can, at all times, have the right of access to
all books of accounts and vouchers of a company and his repeat can be quite
exhaustive to specify whether, The auditor could obtain from management all
information and explanations that were necessary for the purpose of audit.
• Proper books of accounts have been kept by the company
• Brained offices have been audited by him
• Company’s accounts conform to accounting standards set by the institute of
chartered Accountants of India.
Some Mandatory functions are,
• The adequacy of internal control commensurate to the size of the company and
its business.
• The adequacy of records maintained on fixed assets and inventories and
whether any fixed assets were re-valued during the year.
• Loans and advances that were given by the company, and whether the parties
concerned were regular in repaying the principal and interest.
• Loans and advances taken by the company and whether these were at terms in
judicial to the interest of the company and also whether these were being
property repaid according to conducted schedules.
• Transactions including loans and advances, with related parties as defined by
section 301 of the companies act.
Chapter: 1 Introduction To Corporate Governance
23
• Fixed deposits accepted by the company from the public and if so, whether
these conform to the provisions laid down by section 58A of Co.’s Act.
• Regularity of depositing of provident fund dues and whether the employees’
State Insurance Act 1948, was applicable to the company.
• No personal expenses of directors and employees were charged to the profit &
loss Act.
. Guidelines of Committee to Auditors:
i) For the public to have confidence in the quality of audit, it is essential that
auditors showed always be and be seen to be independent of the company,
which includes integrity, professional ethics and objectivity.
ii) Before taking any work auditor must consider that there should not be any
threat to his independence. And if it present he should adopt risk aversion
virtue.
iii) Where such treats exist the auditor should either desist from the task or, at
the very least, but in place safeguards that criminate them to reduce the
threats to clearly insignificant levels. For the auditor is unable to fully
implement credible and adequate safeguards then he must not do the work.
• Narayana Murthy Committee report on Corporate Governance 17
The fourth initiative on corporate governance in India is in the form of the
recommendations of the Narayana Murthy committee. The committee was set up by
SEBI, under the chairmanship of Mr. N. R. Narayana Murthy, to review Clause 49,
and suggest measures to improve corporate governance standards. Some of the major
recommendations of the committee primarily related to audit committees, audit
reports, independent directors, related party transactions, risk management,
directorships and director compensation, codes of conduct and financial disclosures.
Clause 49 of the listing agreement of SEBI
is attached as annexure : I

Chapter: 1 Introduction To Corporate Governance
24
Corporate governance: Recent Developments in India
It is observed that the scale and scope of economic reform and development in India
over the past 20 years has been impressive. The country has opened up large parts of
its economy and capital markets, and in the process has produced many highly
regarded companies in sectors such as information technology, banking, autos, steel
and textile manufacturing. These companies are now making their presence felt
outside India through global mergers and acquisitions.
As mentioned above, a lesser known fact remains about India is that in April 1998 the
country produced one of the first substantial codes of best practice in corporate
governance in Asia. It was published not by a governmental body, a securities
regulator or a stock exchange, but by the Confederation of Indian Industries (CII), the
country’s peak industry body.
The following year, the government appointed a committee under the leadership of
Kumar Mangalam Birla, Chairman, Aditya Birla Group, to draft India’s first national
code on corporate governance for listed companies. Many of the committee’s
recommendations were mandatory, closely aligned to international best practice at the
time and set higher governance standards for listed companies than most other
jurisdictions in Asia. The Indian Code of Corporate Governance, approved by the
Securities and Exchange Board of India (SEBI) in early 2000, was implemented in
stages over the following two years and led to changes in stock exchange listing rules,
notably the new Clause 49 in the Listing Agreement.
Further reforms have been made over the past decade to modernise both company law
and securities regulations. The Companies Act, 1956 has been amended several times,
in areas such as postal ballots and audit committees, while committees were appointed
in 2002 and 2004 to recommend improvements. The latter committee, chaired by Dr
J.J Irani, was charged with undertaking a comprehensive review of the 1956 Act and
its recommendations led to a rewrite of the law and a new Companies Bill, 2008.
(This bill was resubmitted as the Companies Bill, 2009 following national elections in
2009. It is still waiting to pass Parliament.)

Chapter: 1 Introduction To Corporate Governance
25
In the area of securities regulation, SEBI has made numerous changes in recent years
including: revising and strengthening Clause 49 in relation to independent directors
and audit committees; revising Clause 41 of the Listing Agreement on interim and
annual financial results; and amending other listing rules to protect the interests of
minority shareholders, for example in mergers and acquisitions.
Not surprisingly, the recent Satyam fraud of late 2008 led to renewed reform efforts
by Indian authorities and regulators. SEBI brought out new rules in February 2009
requiring greater disclosure by promoters (i.e., controlling shareholders) of their
shareholdings and any pledging of shares to third parties. And in November 2009 it
announced it would be making some further changes to the Listing Agreement,
including requiring listed companies to produce half yearly balance sheets. 18
• Confederation of Indian Industry (CII) Taskforce on Corporate
Governance 19
History tells us that even the best standards cannot prevent instances of major
corporate misconduct. This has been true in the US - Enron, WorldCom, Tyco and,
more recently gross miss-selling of collateralized debt obligations; in the UK; in
France; in Germany; in Italy; in Japan; in South Korea; and many other OECD
nations. The Satyam-Maytas Infra-Maytas Properties scandal that has rocked India
since 16th December 2008 is another example of a massive fraud.
Satyam is a one-off incident - especially considering the size of the malfeasance. The
overwhelming majority of corporate India is well run, well regulated and does
business in a sound and legal manner. However, the Satyam episode has prompted a
relook at our corporate governance norms and how industry can go a step further
through some voluntary measures.
With this in mind, the CII set up a Task Force under Mr. Naresh Chandra in February
2009 to recommend ways of further improving corporate governance standards and
practices both in letter and spirit.
Chapter: 1 Introduction To Corporate Governance
26
The recommendations of the Naresh Chandra Task Force evolved over a series of
meetings. The leitmotif of the report is to enunciate additional principles that can
improve corporate governance in spirit and in practice. The report enumerates a set of
voluntary recommendations with an objective to establish higher standards of probity
and corporate governance in the country.
The recommendations outlined in this report are aimed at listed companies and wholly
owned subsidiaries of listed companies.
The recommendations in brief are as under :
1. Appointment of Independent Director
a. Nomination Committee
2. Duties, liabilities and remuneration of independent directors
a. Letter of Appointment to Directors
b. Fixed Contractual Remuneration
c. Structure of Compensation to NEDs
3. Remuneration Committee of Board
4. Audit Committee of Board
5. Separation of the offices of the Chairman and the Chief Executive Officer
6. Attending Board and Committee Meetings through Tele-conferencing and
video conferencing
7. Executive Sessions of Independent Director
8. Role of board in shareholders and related party tranjactions
9. Auditor – Company Relationship
10. Independence to Auditors
11. Certificate of Independence
12. Auditor Partner Rotation
13. Auditor Liability
14. Appointment of Auditors
15. Qualifications of Auditors Report
16. Whistle Blowing Policy
17. Risk Management Framework
Chapter: 1 Introduction To Corporate Governance
27
18. The legal and regulatory standards
19. Capability of Regulatory Agencies - Ensuring Quality in Audit Process
20. Effective and Credible Enforcement
21. Confiscation of Shares
22. Personal Liability
23. Liability of Directors and Employees
24. Institutional Activism
25. Media as a stakeholder
According to the report, much of best-in-class corporate governance is voluntary – of
companies taking conscious decisions of going beyond the mere letter of law. The
spirit of this Task Force Report is to encourage better practices through voluntary
adoption - based on a firm conviction that good corporate governance not only comes
from within but also generates significantly greater reputational and stakeholder value
when perceived to go beyond the rubric of law.
• Corporate Governance voluntary guidelines 2009 20
More recently, in December 2009, the Ministry of Corporate Affairs (MCA) published a new set of “Corporate Governance Voluntary Guidelines 2009”, designed to encourage companies to adopt better practices in the running of boards and board committees, the appointment and rotation of external auditors, and creating a whistle blowing mechanism. The guidelines are divided into the following six parts:
i) Board of Directors
ii) Responsibilities of the Board
iii) Audit Committee of the Board
iv) Auditors
v) Secretarial Audit
vi) Institution of mechanism for Whistle Blowing
These guidelines provide for a set of good practices which may be voluntarily adopted
by the Public companies. Private companies, particularly the bigger ones, may also
like to adopt these guidelines. The guidelines are not intended to be a substitute for or
addition to the existing laws but are recommendatory in nature.

Chapter: 1 Introduction To Corporate Governance
28
Despite these wide-ranging developments in regulation and policy, what becomes
increasingly apparent in India is that the reform process has not addressed, or
effectively addressed, a key challenge at the heart of the governance problem, namely
the accountability of promoters to other shareholders. Even though most listed
companies have large controlling shareholders, typically a family, the regulation of
related-party transactions in India is minimal. Promoters have considerable freedom
of action in undertaking such transactions and are subject to only limited regulatory
controls. They are also permitted to issue preferential warrants to themselves at an
effective discount to the market price—something that would not be condoned in
more developed markets.
In this context, relying largely on independent directors (appointed by controlling
shareholders), independent board committees and greater corporate disclosure as the
primary mechanisms to check abuses of power by promoters and to safeguard the
interests of minority shareholders is likely to prove weak and insufficient (as indeed it
did in the Satyam case). Board reform is fundamentally important, and is a major
issue of concern to institutional investors, but it needs to be complemented by other
regulations that directly address the relationship between controlling and minority
shareholders—in other words, a proper regime for the regulation of related-party
transactions.
While some leading Indian companies deserve credit for actively pursuing high
standards of governance, including producing examples of world-class corporate
disclosure, the strong growth of the economy and capital markets has fostered, in our
view, a fair degree of complacency towards corporate governance and the rights of
minority shareholders. As this paper shows, few listed companies in India are attuned
to a major global trend of the past five years—the expansion of cross-border proxy
voting— nor do they seem interested in voluntarily enhancing the transparency and
fairness of their annual general meetings (e.g., by fully counting all votes through a
“poll”, rather than conducting voting by the old system of a show of hands). This
complacency is also reflected in the ongoing difficulties that investors face in
deciphering the financial statements of some listed companies, including even some
large caps.

Chapter: 1 Introduction To Corporate Governance
29
References …
1. In its broadest sense the ‘constituents’ may be thought of as those stakeholders who have a ‘moral interest’ or ‘stake’ in the existence and activities of a corporation. In a more narrow sense it embraces, at the core, shareholders and employees, but also extends to certain customers, suppliers and lenders. It is this loose definition of ‘stakeholders’ which we adopt here.
2. F. Mayer (1997), ‘Corporate governance, competition, and performance’, In Enterprise and Community: New Directions in Corporate Governance, S. Deakin and A. Hughes (Eds), Blackwell Publishers: Oxford.
3. K. Keasey, S. Thompson and M. Wright (1997), ‘Introduction: The corporate governance problem - competing diagnoses and solutions,’ In K. Keasey, S. Thompson and M. Wright, Corporate Governance: Economic, Management, and Financial Issues. Oxford University Press: Oxford.
4. National Foundation for Corporate Governance , Discussion Paper : Corporate Governance in India : Theory and Practice.
5. A.C.Fernando (2006), Corporate Governance, Principles, Policies and Practices. pp 76, Pearson
6. A.C.Fernando (2006), Corporate Governance, Principles, Policies and Practices. pp 77, Pearson
7. Cadbury Committee Report : A report by the committee on the financial aspects of corporate governance. The committee was chaired by Sir Adrian Cadbury and issued for comment on (27 may 1992)
8. Greenbury Committee Report (1994) investigating board members’ remuneration and responsibilities
9. The committee report on corporate governance, The Hampel committee report (1998)
10. The combined code of Best practices in Corporate Governance , The Turnbull Committee Report, (1998)
11. Principles of Corporate Governance : A report by OECD Task Force on Corporate Governance. (1999)
12. Patterson Report : The link between Corporate Governance and Performance (2001)
13. Sarbanes Oxley Act of 2002 passed by the congress of the United States of America on 23rd January, 2002.
14. Confederation of Indian Industry, (March 1998) Desirable corporate Governance : A Code (Based on recommendations of the national task force on corporate governance , chaired by Shri Rahul Bajaj).
15. Department of Company Affairs (2000) Report of the taskforce on Corporate Excellence through Governance ( on the basis of report submitted by a
Chapter: 1 Introduction To Corporate Governance
30
committee chaired by Dr P L Sanjeeva Reddy & by Kumar Mangalam Birla Committee on corporate Governance , Chartered Secretary ( March 2000)
16. Report on Corporate Governance by committee headed by Shri Naresh Chandra on regulation of private companies and partnership
17. Securities and Exchange Board of India (2002) Report on SEBI Committee on Corporate Governance (under the chairmanship of Shri N R Narayanamurthy)
18. “ACGA White Paper on Corporate Governance in India” January 19, 2010 Published by: Asian Corporate Governance Association (ACGA) Hong Kong
19. Report of the CII Taskforce on Corporate Governance Chaired by Mr. Naresh Chandra ( November 2009)
20. Ministry of Corporate Affairs, Government of India. Corporate Governance Voluntary Guidelines 2009,
21. Securities and Exchange Board of India Clause 49 of listing agreement.
SGN
Chapter: 2
Introduction to Financial Performance
• Financial Performance : An Introduction
• Usefulness of financial performance to various
stakeholders.
• Techniques \ Tools to measure financial performance
o Financial Ratio Analysis
o Du-pont Analysis
o Comparative Statement Analysis
o Time-Series Analysis
o Inter-firm Analysis
• Ratio Analysis.
o Liquidity Ratios
o Leverage Ratios
o Activity Ratios
o Profitability Ratios
Chapter: 2 Introduction To Financial Performance
32
Financial Performance : An Introduction
The performance of the firm can be measured by its financial results, i.e., by its size
of earnings Riskiness and profitability are two major factors which jointly determine
the value of the concern. Financial decisions which increase risks will decrease the
value of the firm and on the other hand, financial decisions which increase the
profitability will increase value of the firm. Risk and profitability are two essential
ingredients of a business concern.
There has been a considerable debate about the ultimate objective of firm
performance, whether it is profit maximization or wealth maximization. It is observed
that while considering the firm performance, the profit and wealth maximization are
linked and are effected by one-another.
A company’s financial performance, therefore is normally judged by a series of ratios
or figures, however there are following three ratio parameters which can be used to
evaluate financial performance, they are:
a) Return on Equity
b) Earnings Per Share and
c) Price Earnings Ratio.
All three parameters are discussed in detailed along with various other ratios.
However, it is to be noted that fundamentally, the balance sheet indicates the financial
position of the company as on that point of time. However, profit and loss account is a
statement, which is prepared for a particular financial year.
In Indian context, where an analyst has to rely upon the audited financial statement
for a particular company, the performance is to be judged from the financial statement
only. This chapter, however indicates some of the techniques, which can be used for
such analysis of financial performance.1
Chapter: 2 Introduction To Financial Performance
33
Usefulness of financial performance to various stakeholders. 2
The analysis of financial performance is used by most of the business communities.
They include the following.
1. Trade Creditors The creditors provide goods / services on credit to the firm. They always
face concern about recovery of their money. The creditors are always keen
to know about the liquidity position of the firm. Thus, the financial
performance parameters for them evolve around short term liquidity
condition of the firm.
2. Suppliers of long term debt The suppliers of long term debt provide finance for the on-going /
expansion projects of the firm. The long term debt providers will always
focus upon the solvency condition and survival of the business. Their
confidence in the firm is of utmost importance as they are providing
finance for a longer period of time.
Thus, for them the financial performance parameters evolve around the
following:
i) Firm’s profitability over a period of time.
ii) Firm’s ability to generate cash - to be able to pay interest and
iii) Firm’s ability to generate cash – to be able to repay the principal and
iv) The relationship between various sources of funds.
The long term creditors do consider the historical financial statements for
the financial performance.
However, the financial institutions \ bank also depends a lot on the
projected financial statements indicating performance of the firm.
Normally, the projections are prepared on the basis of expected capacity
expansion, projected level of production \ service and market trends for the
price movements of the raw material as well as finished goods.

Chapter: 2 Introduction To Financial Performance
34
3. Investors Investors are the persons who have invested their money in the equity
share capital of the firm. They are the most concerned community as they
have also taken risk of investments – expecting a better financial
performance of the firm. The investors’ community always put more
confidence in firm’s steady growth in earnings. They judge the
performance of the company by analyzing firm’s present and future
profitability, revenue stream and risk position.
4. Management Management for a firm is always keen on financial analysis. It is
ultimately the responsibility of the management to look at the most
effective utilization of the resources. Management always tries to match
effective balance between the asset liability management, effective risk
management and short-term and long-term solvency condition.

Chapter: 2 Introduction To Financial Performance
35
Techniques \ Tools to measure financial performance
There are various tools available to judge the financial performance of the firm. They
include the following.
1. Financial Ratio Analysis 1 The Financial Ratio Analysis is considered to be the most powerful tool of
financial analysis. In simple language ratio means relationship between two or
more things. It is also said that a ratio is the indicated quotient of two
mathematical expressions.
It is observed that the absolute financial figures published in the annual report
do not give any clear picture about the performance of a firm.
Let us take an example that a firm claims that it has earned a net profit after
tax of Rs. 5,00,000/- (Five Lac) this figure alone is not sufficient to judge the
performance of the firm. This profit of Rs. Five Lac may look very impressive
when it is achieved on an investment of Rs. 50,00,000/- (Fifty Lac) but it may
not so much impressive when it is achieved on investment of Rs. 5,00,00,000/-
(Five Crores). This is where the ratio analysis is very useful to judge the
financial performance.
The ratio analysis also helps to summarize the large quantities of financial data
and to make qualitative judgment about the firm’s financial performance.
There are various liquidity ratios which are quantitative in nature but are
helpful to make qualitative judgment about the firm.
The financial ratios involve useful information about the analysis of the firm.
However, standalone ratio of one firm alone may not be useful to evaluate the
firm’s performance. Therefore, ratio should ideally be compared with some
standard which may consist of the following.3
Chapter: 2 Introduction To Financial Performance
36
i) Past Ratios
Past ratios are the ratios which are calculated from the financial
statements of previous years.
ii) Competitors’ Ratios
The ratios of some same size and industry representative firm,
which can be considered as the progressive and successful
competitor can be useful for comparison. However, they should
be compared within a similar timeframe.
iii) Industry Ratio
There are some ratios which are common at industry level.
However, they may be compared at the firm level – in reference
to which the industry belongs.
iv) Projected Ratios
Whenever, a firm approaches to any long term finance
provider, they have to give financial projections, which are
based on some ratios.
Above points are normally refereed for inter-firm or firm v/s industry
comparison. However, in all circumstances it is difficult find the exact
competitor company for comparison because of several reasons.
The ratio analysis can further be used in the following context:
a. Time Series Analysis
This is a very easy way to evaluate the performance of a firm. In this,
the current year’s financial ratios are compared over a period of time.
This is an indication of direction of the firm’s direction of change.
Chapter: 2 Introduction To Financial Performance
37
Here, the role of analyst is also becoming important. It should be noted
that the analyst should not only stick to mathematical aspect of the
ratio. They should go into root cause and try to analyze the reasons
behind changing trend of ratios.
b. Cross Sectional Analysis \ Inter-firm analysis
When the financial ratio of one firm is compared with some selected
firms in the same industry, at the same point of time, it is known as
Cross Sectional Analysis or Inter-firm analysis.
In many cases, comparison of firm’s performance with carefully
selected firms from the industry is more beneficial. It may indicate the
firm’s strengths or weaknesses in terms of operating leverage or
financial leverage.
c. Industry Analysis In this type of analysis, the ratio of one firm is compared with the
average ratios of industry – of which a firm is a member. This type of
analysis is known as Industry Analysis.
It is well accepted fact that each industry has its unique characteristics,
which will have impact on the financial and operating relationships of
the firm. But in many cases, it is difficult to get the actual ratios of the
industry because of various reasons.
d. Proforma Analysis
In many cases, future - projected ratios are used as the standard of
comparison. The future ratios are normally used in the Financial
Projections which are also popularly known as Proforma Ratios.
The comparison of firm’s projected v/s actual ratio will indicate the
relative position of the firm. Mainly it will also indicate the operational
or financial leverage position of the firm – when it started the project
and actual position when the project is completed or half way.

Chapter: 2 Introduction To Financial Performance
38
2. DuPont Analysis 1 According to the Du-pont analysis, RONA (or ROCE) is an important tool for
judging the operating financial performance 4. It is an indication of the earning
power of the firm.
RONA is calculated as under :
EBIT Sales X GP X EBIT
RONA = NA = NA Sales GP
Where : RONA = Return on Net Assets
EBIT = Earnings Before Interest and Tax
GP = Gross Profit
NA = Net Assets
It is observed that most of the firms would like to improve their RONA. However, in
this competitive world, RONA is always under pressure. Hence, firms have to balance
between the Asset Turnover and Gross profit Margin. Many firms adopt various ways
to increase the Gross Profit Margin some firms resort to vertical integration for cost
reduction also.
A firm can convert impressive RONA into an impressive ROE through financial
efficiency. It is observed that ROE us certainly affected by the Financial leverage and
combination of debt and equity. Therefore, ROE is a product of RONA and financial
leverage ratios which reflect the operating efficiency.
Therefore, ROE = Operating Performance X Leverage Factor.

Chapter: 2 Introduction To Financial Performance
39
The Du-pont chart can also be indicated with the help of the following diagramme.
Therefore, the combined effect of the du-pont chart can be explained with the
following.
ROE = Sales x GP x EBIT x PAT x NA
NA Sales GP EBIT NW
As discussed above, ROE when it is multiplied by retention ratio gives
growth.
3. Comparative Statement Analysis 1 Comparative Statement Analysis is one of the methods to trace periodic
change in the financial performance of a firm.
The changes over the period are described by way of Increase of Decrease in
income statement and balance sheet. The changes are normally of two types :
i) Aggregate Changes
ii) Proportional Changes
A sample of comparative statement is described as under:
Particulars Previous Year (Amt. Rs.)
Current Year (Amt. Rs.)
Change (in Amt)
Change (in % )
Liabilities and Capital Current Liabilities XX XX (+ / -) (+ / -) % Long Term Liabilities XX XX (+ / -) (+ / -) % Share Capital & Res. XX XX (+ / -) (+ / -) %
Total XX XX (+ / -) (+ / -) %Assets Fixed Assets XX XX (+ / -) (+ / -) % Current Assets XX XX (+ / -) (+ / -) % Other Assets XX XX (+ / -) (+ / -) %
Total XX XX (+ / -) (+ / -) %
Return on Equity
Return on Net Assets Financial Leverage (Bal. Sheet) Financial Leverage (Income)
Assets Turnover Profit Margin
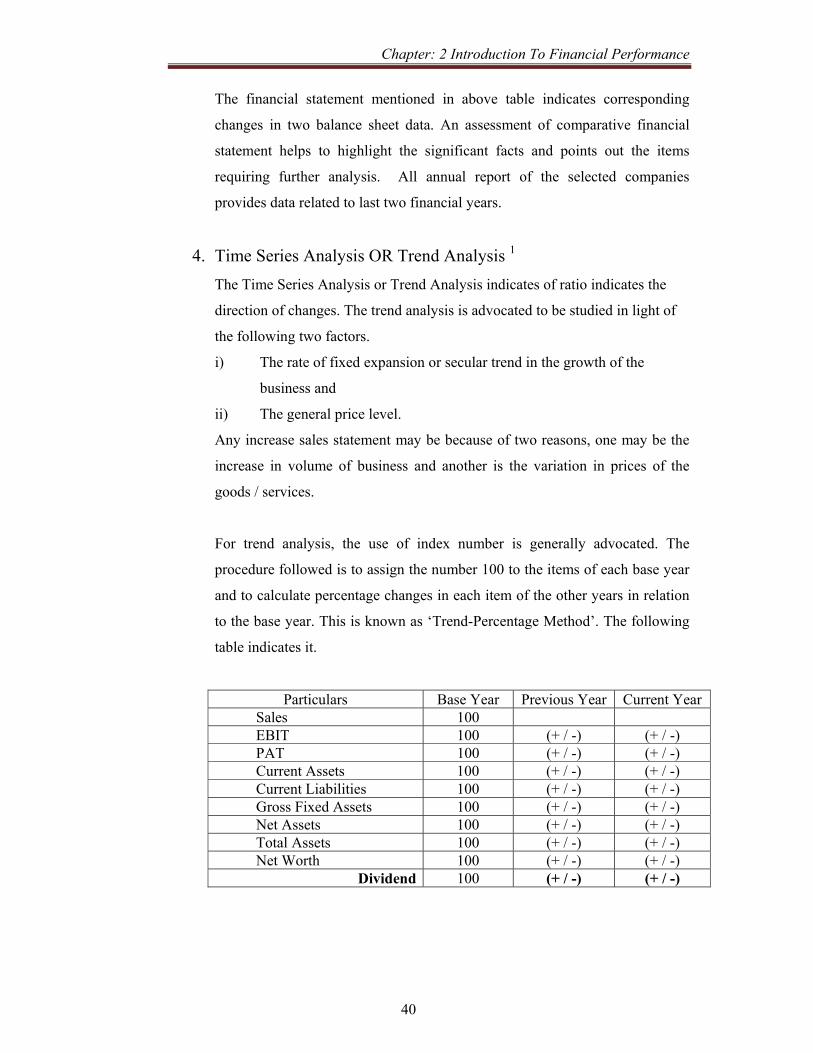
Chapter: 2 Introduction To Financial Performance
40
The financial statement mentioned in above table indicates corresponding
changes in two balance sheet data. An assessment of comparative financial
statement helps to highlight the significant facts and points out the items
requiring further analysis. All annual report of the selected companies
provides data related to last two financial years.
4. Time Series Analysis OR Trend Analysis 1 The Time Series Analysis or Trend Analysis indicates of ratio indicates the
direction of changes. The trend analysis is advocated to be studied in light of
the following two factors.
i) The rate of fixed expansion or secular trend in the growth of the
business and
ii) The general price level.
Any increase sales statement may be because of two reasons, one may be the
increase in volume of business and another is the variation in prices of the
goods / services.
For trend analysis, the use of index number is generally advocated. The
procedure followed is to assign the number 100 to the items of each base year
and to calculate percentage changes in each item of the other years in relation
to the base year. This is known as ‘Trend-Percentage Method’. The following
table indicates it.
Particulars Base Year Previous Year Current Year Sales 100 EBIT 100 (+ / -) (+ / -) PAT 100 (+ / -) (+ / -) Current Assets 100 (+ / -) (+ / -) Current Liabilities 100 (+ / -) (+ / -) Gross Fixed Assets 100 (+ / -) (+ / -) Net Assets 100 (+ / -) (+ / -) Total Assets 100 (+ / -) (+ / -) Net Worth 100 (+ / -) (+ / -)
Dividend 100 (+ / -) (+ / -)
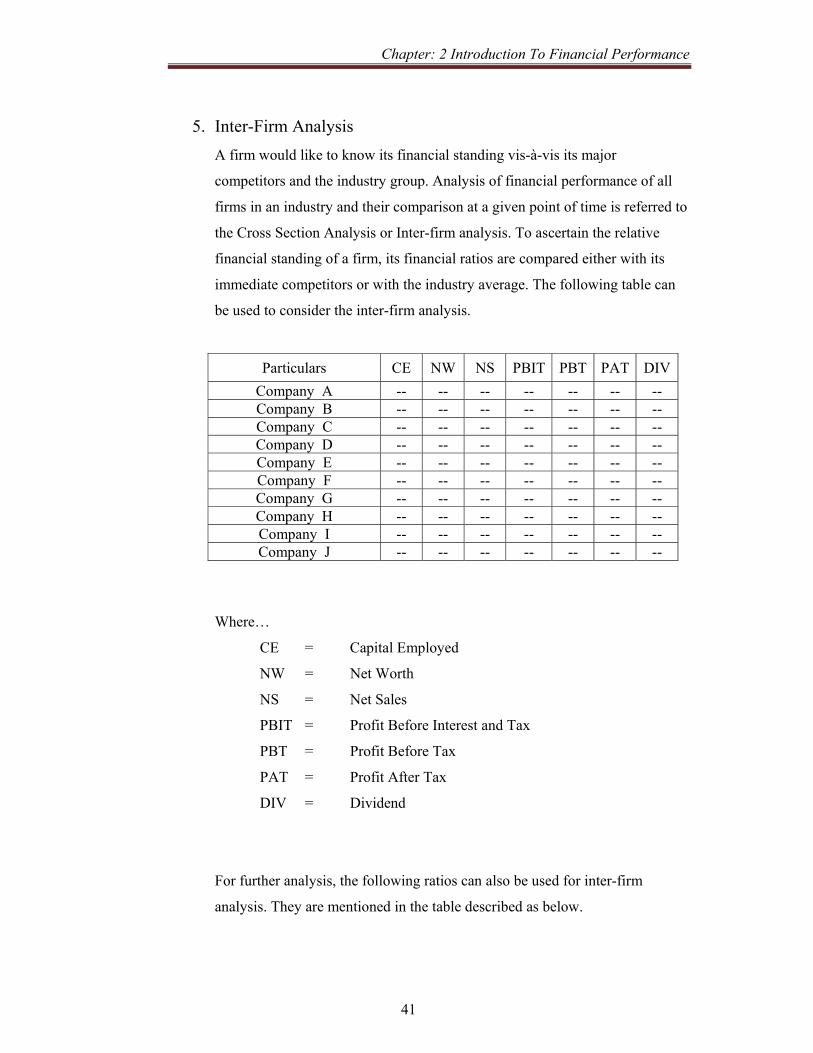
Chapter: 2 Introduction To Financial Performance
41
5. Inter-Firm Analysis A firm would like to know its financial standing vis-à-vis its major
competitors and the industry group. Analysis of financial performance of all
firms in an industry and their comparison at a given point of time is referred to
the Cross Section Analysis or Inter-firm analysis. To ascertain the relative
financial standing of a firm, its financial ratios are compared either with its
immediate competitors or with the industry average. The following table can
be used to consider the inter-firm analysis.
Particulars CE NW NS PBIT PBT PAT DIVCompany A -- -- -- -- -- -- -- Company B -- -- -- -- -- -- -- Company C -- -- -- -- -- -- -- Company D -- -- -- -- -- -- -- Company E -- -- -- -- -- -- -- Company F -- -- -- -- -- -- -- Company G -- -- -- -- -- -- -- Company H -- -- -- -- -- -- -- Company I -- -- -- -- -- -- -- Company J -- -- -- -- -- -- --
Where…
CE = Capital Employed
NW = Net Worth
NS = Net Sales
PBIT = Profit Before Interest and Tax
PBT = Profit Before Tax
PAT = Profit After Tax
DIV = Dividend
For further analysis, the following ratios can also be used for inter-firm
analysis. They are mentioned in the table described as below.

Chapter: 2 Introduction To Financial Performance
42
Particulars NS CE
PBITNS
PBITCE
PAT PBIT
CE NW
PATNW
Company A -- -- -- -- -- -- Company B -- -- -- -- -- -- Company C -- -- -- -- -- -- Company D -- -- -- -- -- -- Company E -- -- -- -- -- -- Company F -- -- -- -- -- -- Company G -- -- -- -- -- -- Company H -- -- -- -- -- -- Company I -- -- -- -- -- -- Company J -- -- -- -- -- --
Where…
NS / CE = Net Sales to Capital Employed
PBIT / NW = Profit Before Int. & Tax (PBIT) to Net Sales
PBIT / CE = Profit Before Int. & Tax (PBIT) to Cap.
Employed
PAT / PBIT = Profit After Tax to Profit Before Interest and
Tax
CE / NW = Capital Employed to Net Worth
PAT / NW = Profit After Tax to Net Worth
Chapter: 2 Introduction To Financial Performance
43
Ratio Analysis Ratios are calculated based on the financial and related statement like. Profit
& Loss account, Balance Sheet etc. The ratios are classified as under 5:
a) Liquidity Ratios
b) Leverage Ratios
c) Activity Ratios and
d) Profitability Ratios
The objective behind calculating each of the ratios is different and the
outcome expected is also different. Let us study the objective behind every
type and sub-type of ratio.
a) Liquidity Ratios Liquidity Ratios are calculated to measure the firm’s ability to meet its current
obligations. The solvency position is indicated by the liquidity ratios. The
solvency position is very critical for any firm. It is often indicated by the
Indian industry that it has ample sources available for the long term finance,
but very limited sources are available for the short term finance or to meet
working capital requirement. So, a firm’s performance in this area is an
important indication towards the performance.
The following are the ratios that indicate liquidity position.
i) Current Ratio
Current Ratio is calculated by dividing current assets by Current
Liabilities. The forma for the Current Ratio is as under:
Current Ratio = Current Assets
Current Liabilities
Where…
Current Assets include cash and those assets which are convertible into
cash within a period of one year.
Current Liabilities includes all obligations which are to maturing
within a period of one year.

Chapter: 2 Introduction To Financial Performance
44
ii) Quick Ratio
It is also popularly known as an acid test ratio. This ratio normally
describes the quick or liquid assets and current liabilities.
It is considered that an asset is liquid if it can be converted into cash
immediately. Cash is considered to be the most liquid assets other
assets those are relatively liquid and included in quick assets are
debtors and bills receivable and marketable securities. As the
inventories are treated as less liquid as they requires some time for
realizing into cash. The quick ratio is calculated as under:
Quick Ratio = Current Assets – Inventories
Current Liabilities
Where…
Current Assets include cash and those assets which are convertible into
cash within a period of one year.
Current Liabilities includes all obligations which are to maturing
within a period of one year.
Inventories include all three types – Raw Material, Work In Process
(WIP) and Finished Goods.
iii) Cash Ratio
Cash is considered to be the most liquid asset. The financial analysts
normally examine cash ratio and its equivalent to current liabilities.
Trade investment or marketable securities are equivalent of cash;
therefore, they may be included in the computation of cash ratio. The
Cash ratio is calculated as under:
Cash Ratio = Cash + Marketable Securities
Current Liabilities
Cash ratio can be more or less. The less ratio should also not to be the
issue of huge concern as the company may have a strong reserve
power.

Chapter: 2 Introduction To Financial Performance
45
iv) Interval Measure
The interval measure assesses the firm’s ability to meet its regular cash
expenses. The interval measure relates liquid assets to average daily
operating cash outflows. The Interval Measure is calculated in number
of days as under:
Interval Measure = Current Assets – Inventory
Average Daily Operating Expenses
Where…
Average Daily Operating Expenses =
[ ( Cost of Goods Sold + Selling & Admin overheads
-- Depreciation) / 360 ]
v) Net Working Capital Ratio
The difference between current assets and current liabilities (excluding
short term bank borrowings) is known as Net Working Capital (NWC)
OR Net Current Assets (NCA). NWC is sometimes used as a measure
of a firm’s liquidity. The ratio is calculated as under :
NWC Ratio = Net Working Capital (NWC)
Net Assets.
The NWC measuers the firm’s potential reservoir of funds. It can be
related to net assets (or Capital Employed)
All above ratios indicate firm’s liquidity situation. But during the analysis it is
to be considered that Current Assets & Current Liabilities keeps on changing
at a rapid pace and can change quickly.

Chapter: 2 Introduction To Financial Performance
46
b) Leverage Ratios Leverage Ratios are popularly known as the capital structure ratios as well.
Any firm has got two sources of finance one is owned funds and the other is
borrowed funds. As a general rule, there should be an appropriate mix of debt
and owners’ equity in financing the firm’s assets. As popularly known, these
ratios indicate mix of funds provided by owners and lenders. There are various
implications of the manner in which the funds are arranged they can be
prescribed as under:
1. The composition of debt and equity. The debt is considered as more
risk from a firm’s point of view. As it is obligation on the part of the
firm to re-pay the amount along with the interest component.
2. The use of debt can also be sometimes advantageous in case where the
firm can retain control of the firm with a limited stake and their
earnings will be increased when a firm earns a rate which is higher
than its cost of capital of borrowed funds.
3. It is observed that highly debt firm find it difficult to get appropriate
return. As they are facing the problem of incremental level of marginal
rate of interest.
The process of magnifying the shareholders’ return through use of debt is
popularly known as ‘trading on equity’. However, the situation can be
different when the rates are reverse or the situation is different.
The leverage ratios are calculated on the basis of balance sheet, it may also be
computed using profit and loss account by determining the extent to which
operating profits are sufficient to cover the fixed charges.
i) Debt Ratio
The debt ratios can be considered to arrive at the ratio of proportion of
total debt and net assets. The following two debt ratios are popular.
a) Debt Ratio = Total Debt
Total Debt + Net Worth
Where… Total Debt + Net Worth = Capital Employed
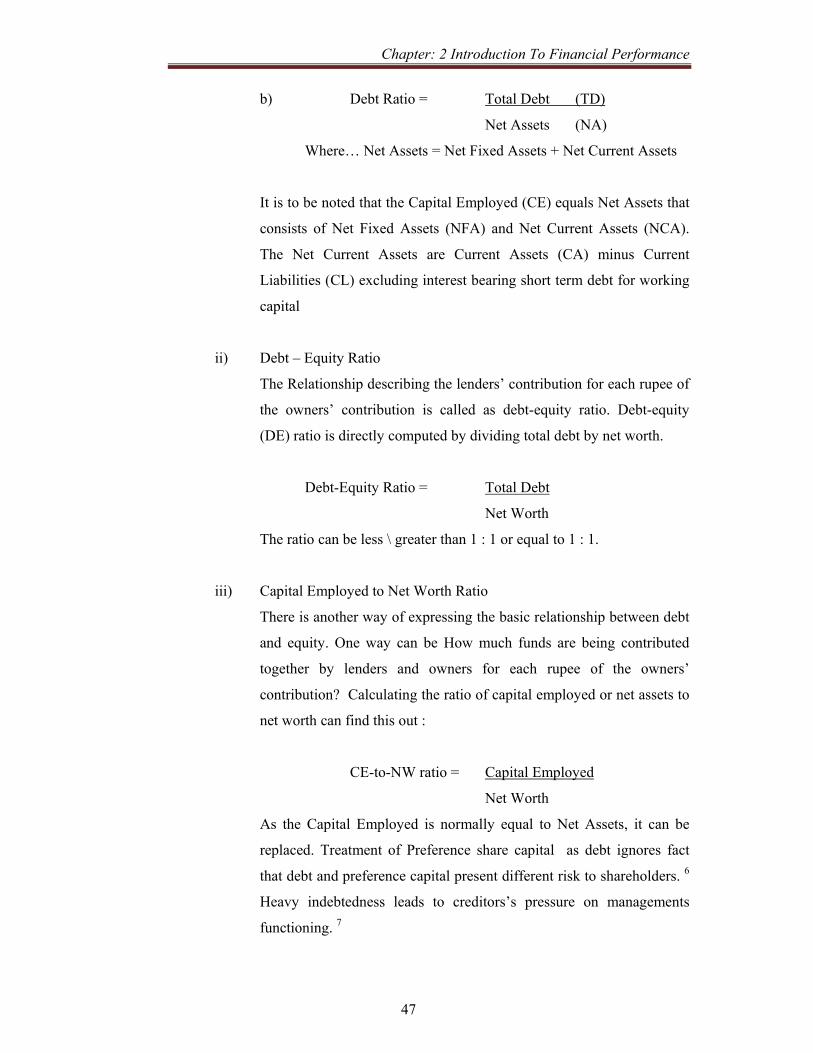
Chapter: 2 Introduction To Financial Performance
47
b) Debt Ratio = Total Debt (TD)
Net Assets (NA)
Where… Net Assets = Net Fixed Assets + Net Current Assets
It is to be noted that the Capital Employed (CE) equals Net Assets that
consists of Net Fixed Assets (NFA) and Net Current Assets (NCA).
The Net Current Assets are Current Assets (CA) minus Current
Liabilities (CL) excluding interest bearing short term debt for working
capital
ii) Debt – Equity Ratio
The Relationship describing the lenders’ contribution for each rupee of
the owners’ contribution is called as debt-equity ratio. Debt-equity
(DE) ratio is directly computed by dividing total debt by net worth.
Debt-Equity Ratio = Total Debt
Net Worth
The ratio can be less \ greater than 1 : 1 or equal to 1 : 1.
iii) Capital Employed to Net Worth Ratio
There is another way of expressing the basic relationship between debt
and equity. One way can be How much funds are being contributed
together by lenders and owners for each rupee of the owners’
contribution? Calculating the ratio of capital employed or net assets to
net worth can find this out :
CE-to-NW ratio = Capital Employed
Net Worth
As the Capital Employed is normally equal to Net Assets, it can be
replaced. Treatment of Preference share capital as debt ignores fact
that debt and preference capital present different risk to shareholders. 6
Heavy indebtedness leads to creditors’s pressure on managements
functioning. 7

Chapter: 2 Introduction To Financial Performance
48
iv) Interest Coverage Ratios
Debt ratios are described as a static in nature and many times make it
difficult to exactly direct towards firm’s ability to meet the interest or
other fixed charges obligation.
The interest coverage ratio or the Times – interest-earned is used to test
the firm’s debt servicing capacity. The interest coverage ratio is
calculated as under:
Interest Coverage = EBIT
Interest
Some times, the depreciation – being a non cash item it can be
excluded. Therefore the interest coverage can also be computed as
under :
Interest Coverage = EBITDA
Interest
This ratio indicates the extent to which earnings may fall without
causing any embarrassment to the firm regarding the payment of the
interest charges. A higher ratio is desirable; but too high a ratio
indicates that the firm is very conservative in using debt and that it is
not using credit to the best advantage of shareholders. A lower ratio
indicates excessive use of debt or inefficient operations.
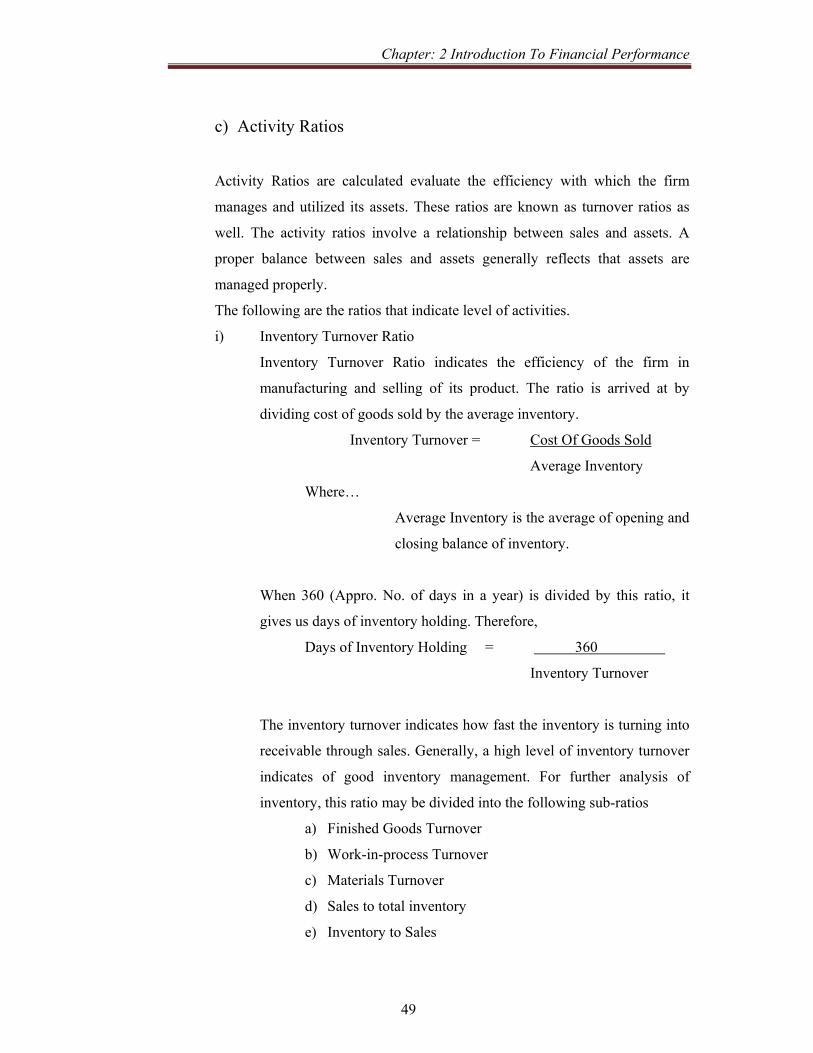
Chapter: 2 Introduction To Financial Performance
49
c) Activity Ratios
Activity Ratios are calculated evaluate the efficiency with which the firm
manages and utilized its assets. These ratios are known as turnover ratios as
well. The activity ratios involve a relationship between sales and assets. A
proper balance between sales and assets generally reflects that assets are
managed properly.
The following are the ratios that indicate level of activities.
i) Inventory Turnover Ratio
Inventory Turnover Ratio indicates the efficiency of the firm in
manufacturing and selling of its product. The ratio is arrived at by
dividing cost of goods sold by the average inventory.
Inventory Turnover = Cost Of Goods Sold
Average Inventory
Where…
Average Inventory is the average of opening and
closing balance of inventory.
When 360 (Appro. No. of days in a year) is divided by this ratio, it
gives us days of inventory holding. Therefore,
Days of Inventory Holding = 360
Inventory Turnover
The inventory turnover indicates how fast the inventory is turning into
receivable through sales. Generally, a high level of inventory turnover
indicates of good inventory management. For further analysis of
inventory, this ratio may be divided into the following sub-ratios
a) Finished Goods Turnover
b) Work-in-process Turnover
c) Materials Turnover
d) Sales to total inventory
e) Inventory to Sales
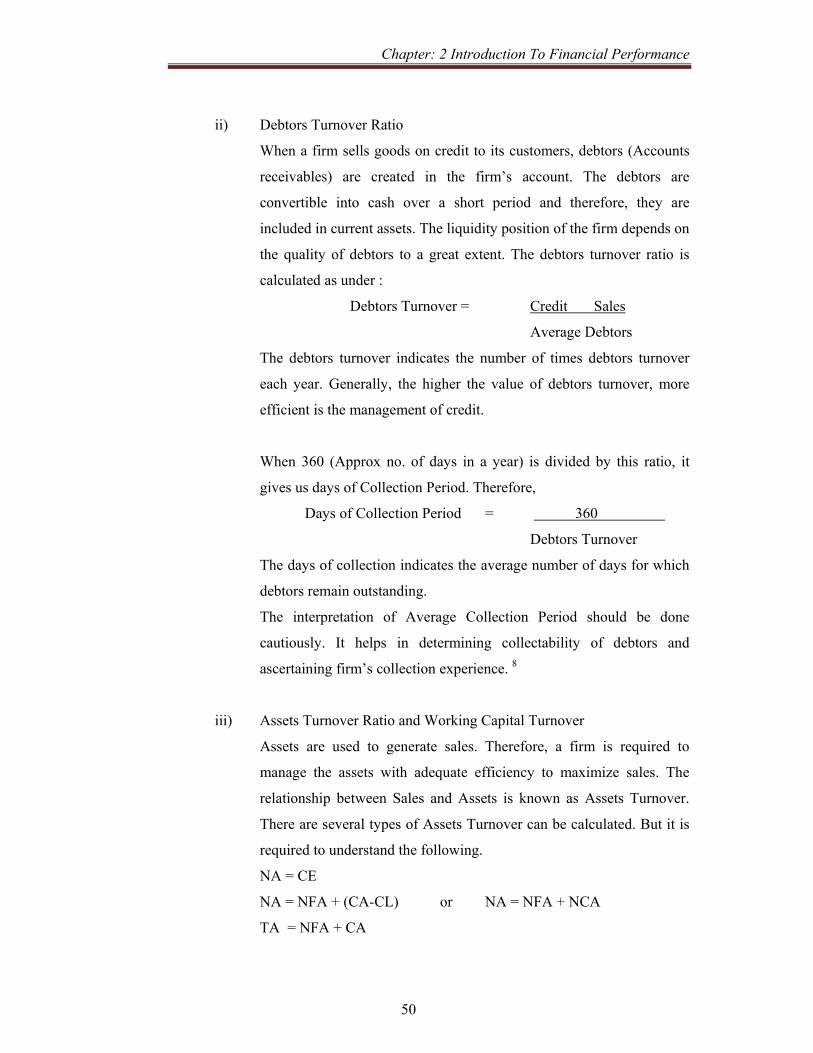
Chapter: 2 Introduction To Financial Performance
50
ii) Debtors Turnover Ratio
When a firm sells goods on credit to its customers, debtors (Accounts
receivables) are created in the firm’s account. The debtors are
convertible into cash over a short period and therefore, they are
included in current assets. The liquidity position of the firm depends on
the quality of debtors to a great extent. The debtors turnover ratio is
calculated as under :
Debtors Turnover = Credit Sales
Average Debtors
The debtors turnover indicates the number of times debtors turnover
each year. Generally, the higher the value of debtors turnover, more
efficient is the management of credit.
When 360 (Approx no. of days in a year) is divided by this ratio, it
gives us days of Collection Period. Therefore,
Days of Collection Period = 360
Debtors Turnover
The days of collection indicates the average number of days for which
debtors remain outstanding.
The interpretation of Average Collection Period should be done
cautiously. It helps in determining collectability of debtors and
ascertaining firm’s collection experience. 8
iii) Assets Turnover Ratio and Working Capital Turnover
Assets are used to generate sales. Therefore, a firm is required to
manage the assets with adequate efficiency to maximize sales. The
relationship between Sales and Assets is known as Assets Turnover.
There are several types of Assets Turnover can be calculated. But it is
required to understand the following.
NA = CE
NA = NFA + (CA-CL) or NA = NFA + NCA
TA = NFA + CA
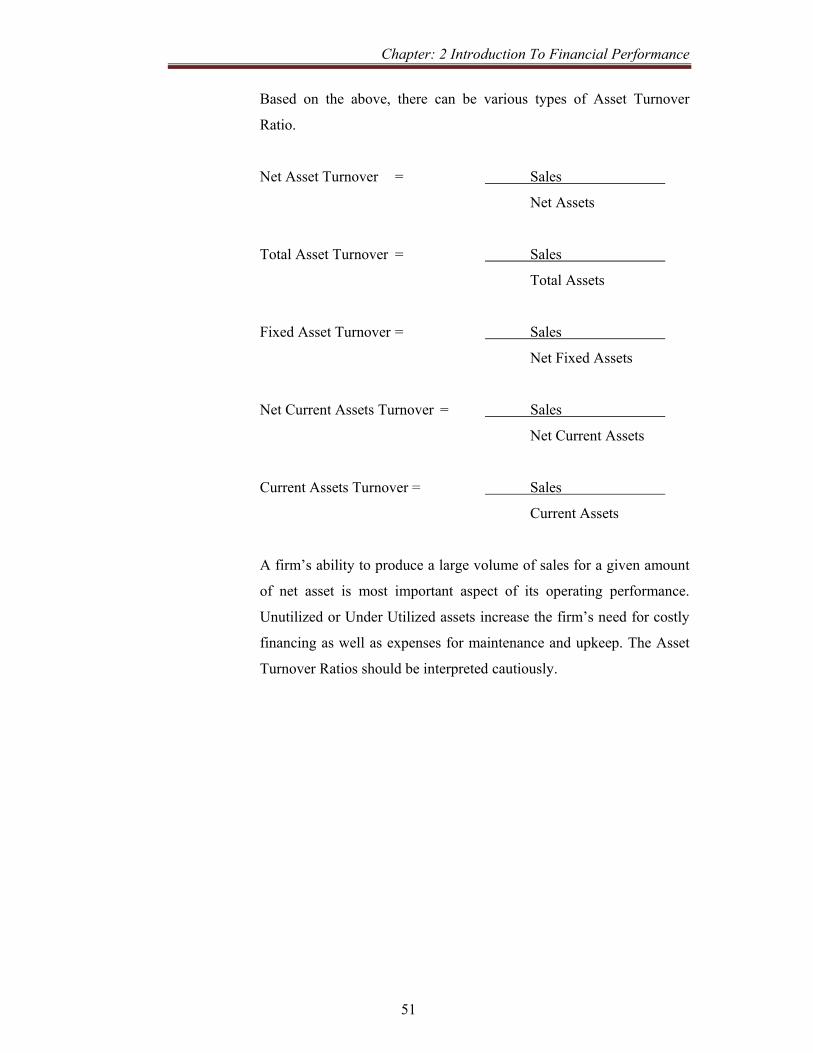
Chapter: 2 Introduction To Financial Performance
51
Based on the above, there can be various types of Asset Turnover
Ratio.
Net Asset Turnover = Sales
Net Assets
Total Asset Turnover = Sales
Total Assets
Fixed Asset Turnover = Sales
Net Fixed Assets
Net Current Assets Turnover = Sales
Net Current Assets
Current Assets Turnover = Sales
Current Assets
A firm’s ability to produce a large volume of sales for a given amount
of net asset is most important aspect of its operating performance.
Unutilized or Under Utilized assets increase the firm’s need for costly
financing as well as expenses for maintenance and upkeep. The Asset
Turnover Ratios should be interpreted cautiously.

Chapter: 2 Introduction To Financial Performance
52
d) Profitability Ratios A majority of the discussion in the financial performance evolves around the
concepts of profit maximization and wealth maximization. Profits are always
essential. But it would not be appropriate to go ahead with the discussion of
profit maximization until the concept of profit is properly understood. The
method to arrive at profit is as under:
Sales / Total Income
Less Cost of Goods Sold
PBITDA
Less Interest
PBDTA
Less Depreciation
PBT
Less Tax & Adjustments
PAT
Add Depreciation & Non Cash Exp
Cash Profit.
Where…
PBITDA = Profit Before Interest Tax Depreciation & Adjustments
PBDTA = Profit Before Depreciation Tax & Adjustments
PBDTA = Profit Before Depreciation Tax & Adjustments
PBT = Profit Before Tax
PAT = Profit After Tax
Cash Profit = Profit After Tax + Depreciation (and other non cash
exps.)
A firm’s performance is often judged by the profitability. However, two types
of profitability ratios are calculated.
a) Profitability in relation to sales.
b) Profitability in relation to investments.
The following are the ratios that profitability position of a firm. It is a fact that
sufficient profit must be earned by a firm to sustain, expand and grow.9

Chapter: 2 Introduction To Financial Performance
53
i) Gross Profit Margin
Gross profit is the first profitability ratio. It is calculated on gross
profitability margin. It is calculated as under:
Gross Profit Margin = Sales – Cost of Goods Sold
Sales
= Gross Profit
Sales
The gross profit margin reflects the efficiency with which management
produces each unit of product. This ratio also indicates the aggregate
spread between the Cost of Goods Sold (COGS) and the sales revenue.
A high gross profit margin ratio can be sign of good management. The
high gross margin may be due to any of the following 10.
a) Higher sales prices, while cost of goods sold remain constant.
b) Lower Cost of Goods Sold, sales pricing remaining constant.
c) An increase in the proportionate volume of higher margin items.
The analysis of these factors will reveal to the management how a
depressed gross profit margin can be improved.
A lower gross profit margin may reflect higher cost of goods sold due
to the firm’s inability to purchase raw materials at favorable terms, and
inefficient utilization of plant and machinery or over investment in
plant and machinery, resulting in higher cost of production.
ii) Net Profit Margin
Net profit is obtained by deducting operating expenses, interest and
taxes are subtracted from the gross profit. The net profit margin ratio is
measured by dividing profit after tax by sales. The formula can be
narrated as under:
Net Profit Margin = Profit After Tax
Sales
Chapter: 2 Introduction To Financial Performance
54
Net profit margin ratio establishes relationship between net profit and
sales. It also indicates management’s efficiency in manufacturing,
administering and selling the products. This ratio is overall measure of
the firm’s ability to turn each rupee sales into net profit. If the net
margin is inadequate, the firm will fail to achieve satisfactory return on
shareholders’ funds.
The ratio also indicates the firm’s ability to withstand adverse
economic conditions. Where a firm with higher net margin ratio will be
in advantageous, position to survive in the face of falling selling prices,
rising costs of production or declining demand for the product. Such
conditions are very difficult for low profit margin firms.
iii) Operating Expense Ratio
The operating expense ratio explains the changes in the profit margin.
(EBIT to Sales) ratio. This ratio is computed by dividing operating
expenses viz. cost of goods sold plus selling expenses and general and
administrative expenses (excluding interest) by sales:
Operating Expense Ratio = Operating Expenses
Sales
A higher operating expense ratio is un-favourable as it indicates a
smaller amount of operating income to meet interest, dividends etc.
The variations in this ratio can be because of various reasons like:
a) Changes in Sales Prices
b) Changes in the demand for the product
c) Changes in administrative or selling expenses or
d) Changes in the proportionate shares of sales of different products
with varying gross margins.
These, along with other causes are reasons for variations in the ratio.

Chapter: 2 Introduction To Financial Performance
55
iv) Return On Investment
Term investment is equal to ‘Total Assets’ or ‘Net Assets’. The funds
employed in net assets are known as capital employed. Net Assets is
equal to Net Fixed Assets plus Current Assets minus Current
Liabilities (Excluding Bank Loans). Alternatively, capital employed is
equal to net worth plus total debt.
As per the conventional approach of calculating Return on Investment
(ROI) is to divide PAT by investment. Investment indicates pool of
funds supplied by shareholders and lenders.
The taxes are not something which is within the control of
management, and since the firm’s opportunities for availing tax
incentives differ, it is more prudent to use before-tax measure of ROI.
The following two methods indicate calculation of ROI.
ROI = ROTA = EBIT
TA
ROI = RONA = EBIT
NA
Some companies even use EBITDA to calculate the ROI.
v) Return On Equity
The common shareholder is entitled to the residual profits. A return on
shareholders’ equity is calculated to see the profitability of owners’
investment. The shareholders’ equity or net worth will include paid-up
share capital, share premium and reserves and surplus less accumulated
losses. Net worth can also by found by subtracting total liabilities from
total assets.
The return on equity is net profit after taxes divided by shareholders’
equity which is given by net worth.
Chapter: 2 Introduction To Financial Performance
56
ROE = Profit After Taxes = PAT
Net Worth (Equity) NW
ROE indicates how well the firm has used the resources of owners.
The earning of a satisfactory return is the most desirable objective of a
business. The ratio of net profit to owners’ equity reflects the extent to
which this objective is accomplished. Therefore, this ratio is great
interest to the present as well as the prospective shareholders and also
great concern to management.
The return on owners’ equity of the company is normally compared
with the ratios for other similar companies and the industry average.
This reveals the relative performance and strength of the company in
attracting future investments.
vi) Earnings Per Share
The Earnings Per Share is one of the key measure of profitability of
shareholders’ investment. The EPS is calculated by dividing the profit
after taxes by total number of ordinary shares outstanding. The
formulae to calculate EPS is as under :
EPS = Profit After Tax
Number of Outstanding Shares
The calculation of EPS over the years indicates whether the firm’s
earnings power on per-share basis has changed over that period or not.
The EPS of the Company should be compared with industry average
and the EPS of the other firms. However, EPS does not indicate how
much of EPS is distributed as a dividend and how much is retained
earnings.

Chapter: 2 Introduction To Financial Performance
57
vii) Dividend Per Share
The dividend is the income which a shareholder really receives. This is
the amount which is a part of earnings distributed as cash to the
shareholders. Therefore, it is a large number of interest to majority of
the investors. Some investors put greater weightage on Dividend Per
Share rather than on EPS.
The DPS is calculated as under:
DPS = Earnings paid to shareholders (Dividends)
Number of ordinary shares outstanding
Now, for example a company earns Rs. 8.00 per share and distributes
Rs. 2.00 per share, then the difference per share is retained in the
business.
viii) Dividend Payout Ratio
The dividend payout ratio is the comparison of amount distributed as
dividend and amount earned per share. The payout ratio is calculated
as under.
Payout Ratio = Dividend Per Share
Earnings Per Share
Earnings not distributed per share are retained in the business.
Therefore, retention ratio in the business will be equal to 1 – Payout
Ratio. If this figure is multiplied by ROE, one can know the growth in
the owners’ equity as a result of retention policy.
ix) Dividend and Earnings Yield
The dividend yield is the dividends per share divided by market value
per share. It can be calculated as under :
Dividend Yield = Dividend Per Share = DPS
Market Value Per Share MV
Chapter: 2 Introduction To Financial Performance
58
The earnings yield is the earnings per share divided by market value
per share. It can be calculated as under :
Earnings Yield = Earnings Per Share = EPS
Market Value Per Share MV
Above ratios evaluate the shareholders’ return in relation to the market
value of the share. The earnings yield ratio is also called as Earnings –
Price (E/P) Ratio.
x) Price Earnings Ratio
This ratio is reciprocal to the above ratio. This is one of the most
popular among the financial analysts to value the firm’s performance
as expected by the shareholders. This can be calculated as under :
P/E Ratio = Market Value Per Share = MV
Earnings Per Share EPS
This also indicates investors’ judgment or expectations about the
firm’s performance.
Normally, this ratio reflects investors’ expectations about the growth in
the firm’s earnings.
xi) Market Value to Book Value Ratio
This ratio is primarily indication of market v/s book value of share.
Hence, it is the ratio of share price to book value per share :
M/B Ratio = Market Value Per Share
Book Value Per Share
Where…
Book Value Per Share = Net Worth
No. of shares outstanding

Chapter: 2 Introduction To Financial Performance
59
This is also an indication of the company’s worth compared to funds
which are put into by shareholders.
xii) Tobin’s Q
This is the ratio of Market Value of Firm’s assets ( or equity an debt)
to its assets’ replacement costs.
Thus, this can be calculated as under :
Tobin’s Q = Market Value of Assets
Replacement Cost of Assets
It is assumed that the firms will have incentive to invest when Q is
greater than 1. However, they will be reluctant to invest once the Q
becomes equal to 1.
It is to be noted that this ratio differs from market value to book value
ratio in the following respects:
a) It includes both debt and equity in the numerator and
b) All assets in the denominator, not just the book value of equity.
However, it is observed that in most of the cases it is difficult to arrive
at the genuine market value of assets. It is argued that firms will have
incentive to invest then Q is greater than 1. They will be reluctant to
invest once Q becomes equal to 1. 11
Chapter: 2 Introduction To Financial Performance
60
Note and References
1. Pandey I M (2005) Ninth Edition Financial Management PP 517 - 544
2. For a detailed discussion, see Foster G, Financial Statement Analysis, Prentice
Hall 1986 pp 2-7
3. Anthony, R N and Reece, J S , Management Accounting Principles,
Taraporewala, 1975 pp 260-263
4. Operating Leverage may be defined as a change in EBIT for a given change in
Sales.
5. This is most common traditional classification of ratios. For a comprehensive
treatment of statement analysis one can refer to Foster G, Financial Statement
Analysis, Prentice Hall 1986
6. Barges, Alexander, The effect of Capital structure on the cost of capital,
Prentice-Hall inc. 1963, p 35.
7. Miller D E, The meaningful interpretation of financial statement, AMA 1966
8. Miller Op. Cit P 67.
9. Drucker, P.F., The Practice of Management, Pan 1968, pp 99-100.
10. Kennedy, R D and Mc Muller, S. Y. Financial Statement , Richard D Irwin p
404.
11. Brealey R and Myers S, Principles of Corporate Finance, McGraw Hill, 1984
p. 578
SGN
Chapter: 3
Research Methodology
• Introduction
o Statement of Problem
o Significance of Study
• Review of Literature
• Objectives
o Perspectives and Assumptions
• Methodology
o Ratios
o Questionnaire
• Selection of sample
• Limitations of Study

Chapter: 3 Research Methodology
62
Introduction
Corporate Governance has a buzzword in the corporate world. It is the most
happening area where several bodies across several countries are trying to improve
the standards of governance in corporate world. The other aspect which is required to
be looked into is whether standard of governance affect the performance of the
company on financial parameters or not.
As the research is on the corporate governance related topic, before delving further on
the subject, it is important to dwell upon the concept of corporate governance.
Corporate governance is about commitment to values and about ethical business
conduct. It is about how an organization is managed. This includes its corporate and
other structures, its culture, policies and the manner in which it deals with various
stakeholders. Accordingly, timely and accurate disclosure of information regarding
the financial performance, ownership and governance of the company is an important
part of corporate governance.
This improves public understanding about the structure, activities and policies of the
organization. Consequently, the organization is able to attract investors and enhance
the trust and confidence of the stakeholders. This is the system by which companies
are run and the means by which they are responsive to their shareholders, employees
and society.
This study is mainly focus on measuring the corporate governance practices adopted
by selected Indian companies on various parameters and also to study the implication
of governance on the financial performance.
Statement of Problem Title of the study – “A STUDY OF CORPORATE GOVERNANCE AND THE
FINANCIAL PERFORMANCE OF SELECTED INDIAN COMPANIES.”
Chapter: 3 Research Methodology
63
Significance of study
There are several developments in corporate sector at national and international level
which indicate that a detailed study is required in corporate governance area.
If we look into history, there are several attempts made by Government and various
trade associations for systematic development of Corporate Governance.
• The first attempt was made by Confederation of Indian Industries (CII), which
came out with ‘CII Code on Corporate Governance’ in 1997-98.1
• The second attempt was by Securities and Exchange Board of India (SEBI) in
1999, which appointed Kumar Mangalam Birla Committee2 and upon its
recommendation, SEBI incorporated Clause 49 of Listing Agreement.
• In 2002 the Department of Company Affairs, Government of India appointed a
committee under chairmanship of Shri Naresh Chandra to examine various
Corporate Governance issues3.
• The fourth initiative on corporate governance in India is in the form of the
recommendations of the Narayana Murthy committee. The committee was set
up by SEBI, under the chairmanship of Mr. N. R. Narayana Murthy4, to
review Clause 49, and suggest measures to improve corporate governance
standards.
• More recently, in 2009, CII constituted a committee under the chairmanship of
Shri Naresh Chandra to improve the corporate governance standards in India5.
• In December 2009, the Ministry of Corporate Affairs (MCA) published a new
set of “Corporate Governance Voluntary Guidelines 2009” 6, designed to
encourage companies to adopt better practices in the running of boards and
board committees, the appointment and rotation of external auditors, and
creating a whistle blowing mechanism.
• Securities and Exchange Board of India has also incorporated various
corporate governance practices as a part of listing agreement (Clause 49)7.
These points indicate that there is a need to examine the prevailing corporate
practices in Indian context.
Chapter: 3 Research Methodology
64
Review of Literature
Empirical studies have been conducted in various countries on whether there is any
link between the corporate governance / board composition and corporate
performance. Some researchers had looked for a direct evidence of a link between
board composition and corporate performance. Many foreign researchers have tried to
study the correlation between the Corporate Governance and firm’s performance.
Much of the previous literature has shown a positive relationship between governance
and firm performance assuming that governance is an independent regressor, i.e. it is
exogenously determined, in a firm performance regression. This would suggest that
firms are not in equilibrium, and improvements in governance would lead to
improvements in firm performance. On the other hand, Demsetz and Lehn (1985) 8,
among others, have shown that governance is related to observable firm and CEO
characteristics.
Studies have generally examined three characteristics of boards, namely, the size of
the board, proportion of outsiders on the board, and the number of board meetings.
Among studies that assume board characteristics are exogenously determined, Jensen
(1993) 9, Yermack (1996) 10, Eisenberg, Sundgren, and Wells (1998) 11, and Mak and
Kusnadi (2002) 12 find that small size boards are positively related to high firm value,
Baysinger and Butler (1985) 13, Mehran (1995) 14, and Klein (1998) 15 find that firm
value is insignificantly related to a higher proportion of outsiders on the board, and
Vafeas (1999) 16 and Adams and Ferreira (2004) 17 find that firm value is increased
when boards meet more often. Accordingly, good governance changes are defined
when the board got smaller, the proportion of outsiders in the board were increased,
and when the number of board meetings increases.
However, many theoretical and empirical studies have suggested board characteristics
are endogenously determined and that board size and composition varies with firm
characteristics (see, Kole and Lehn 1999 18 , Mak and Rousch 2000 19 and Adams
2005 20 ).
Chapter: 3 Research Methodology
65
The relation between the proportion of outside directors, a proxy for board
independence, and firm performance is mixed. Studies using financial statement data
and Tobin’s Q find no link between board independence and firm performance, while
those using stock returns data or bond yield data find a positive link. Consistent with
Hermalin and Weisbach (1991) 21 and Bhagat and Black (2002) 22, we do not find
Tobin’s Q to increase in board independence (in fact, we find the opposite), but we do
find that firms with independent boards have higher returns on equity, higher profit
margins, larger dividend yields, and larger stock repurchases, suggesting that board
independence is associated with other important measures of firm performance aside
from Tobin’s Q.
Limiting board size is believed to improve firm performance because the benefits by
larger boards of increased monitoring are outweighed by the poorer communication
and decision-making of larger groups (Lipton and Lorsch 1992) 23. Consistent with
this notion, Yermack (1996) 24 documents an inverse relation between board size and
profitability, asset utilization, and Tobin’s Q. Anderson (2004) 25 show that the cost
of debt is lower for larger boards, presumably because creditors view these firms as
having more effective monitors of their financial accounting processes.
Several studies have examined the separation of CEO and chairman, positing that
agency problems are higher when the same person holds both positions.
The question of how corporate governance and board characteristics such as
composition or size or quality related to profitability or performance are still remains
unresolved. Yet, the recommendation of the Securities and Exchange Board of India
committee on Corporate Governance under the Chairmanship of Kumar Mangalam
Birla (1999) 2, the Confederation of Indian Industry (CII) code on Corporate
Governance (1999) 1, The Naresh Chandra Committee (2002) 3 and the Securities and
Exchange Board of India Committee on corporate Governance under the
Chairmanship of N R Narayanamurthy (2003) 4 are in favour of improving the
corporate governance scenario in India by favouring majority – independent director’s
board. However, the J J Irani Committee 26 has recommended 33 per cent
independence, which can also vary with the size and type of organization.
Chapter: 3 Research Methodology
66
According Garg ( 2007) 27, the board size and performance as also board
independence and performance were inversely related. A bad performance leads to
increase in board size, which in turn hampers the performance. However, Shukla
(2007) 28 suggests that the pay and performance of the directors is linked and a
transparent policy should be place to decide the remuneration of the directors.
McKinsey's 'Global Investor Opinion Survey'(2000 (updated in 2002 and later)) is the
most widely quoted opinion-based research into the link between corporate
governance and performance as measured by the valuation of the company.
McKinsey surveyed over 200 institutional investors and found that 80% of the
respondents would pay a premium for well governed companies. The size of the
premium varied by market, from 11% for Canadian companies to around 40% for
companies operating in countries where the regulatory backdrop was less certain, such
as Egypt, Morocco, and Russia. The UK and US scored 12% and 14% respectively.
Although the study is opinion-based, it was believed that the finding reflected a
growing perception amongst market participants that well-governed companies,
which were perceived to be run in the interests of investors, may benefit from a lower
cost of capital.
There are a number of other studies that sought to link broad perceptions of the
quality of companies to superior share price performance. 31
They generally support McKinsey's finding that investors favour companies, which
they perceive to be well governed. However, we note that opinion-based research
relies on circumstantial and inevitably subjective data. The finding is therefore of
limited evidentiary value.
Governance-ranking research seeks to establish a link between one or more factors or
standards that objectively measure a company's governance quality and its
performance. The focus on certain standards by reference to which the quality of
corporate governance can to some extent be objectively measured has obvious
attractions.
Chapter: 3 Research Methodology
67
However, it also causes problems and distortions in the findings of the research. To
begin with, any single governance standard may for a number of reasons be unrelated
to the performance of companies in a particular market during a given period of time.
Research that focuses on a single standard, such as the composition of boards, in
isolation, may thus lead to incorrect conclusions. Moreover, such research does not
effectively capture the general benefits that may result from active ownership
involving engagement regarding a larger set of standards. More complex research
considers a range of governance standards against which the corporate governance
qualities of the companies investigated are assessed. The selection of a set of
governance standards introduces a subjective element into governance-ranking
research. In addition researchers may attach different weight to them for the purposes
of the ranking that underlies the studies, introducing further subjectivity.
Many of the studies that suggest that there is no link between corporate governance
and performance focus on a single governance standard.32 For several reasons, such a
result is perhaps unsurprising. Similarly, research involving a ranking based on
compliance with too many potentially insignificant governance standards may distort
the finding of a link between certain 'core' standards and performance. It is therefore,
believed that the most valuable research focuses on a relatively small set of
governance standards and seeks to identify which standards are directly related to
performance.
The most celebrated governance-ranking study, which supports the proposition that
there is a link between the quality of corporate governance, measured in terms of
shareholder rights, and performance was carried out by Gompers et al (2004). Based
on an assessment of the governance of 1,500 US companies using 24 governance
'provisions' analysed by the Institutional Investors Research Center (IRRC) during the
1990s, the study found that if a fund had taken long positions in companies scoring in
the top decile of their governance ranking and short positions in companies in the
bottom decile, it would have outperformed the market by 8.5% per year throughout
the 1990s.33
Chapter: 3 Research Methodology
68
The research also supported the proposition that companies with a good governance
ranking were higher valued and had higher profits than those with a bad ranking. Prior
to Gompers et al, Millstein and MacAvoy (1998) had found that over five years, well-
governed companies (identified on the basis of CalPERS ratings) outperformed by
7%.
Support for a link between good governance practice and shareholder returns was also
found in research conducted by Governance Metrics International. Following on from
the research by Gompers et al, Bebchuk et al (2004) investigated which of the 24
governance provisions tracked by the IRRC. 34
There is a need for stronger tests to discern whether Corporate Governance and
composition of board has any impact on a firm’s financial performance. Hence, a
research can be conducted regarding corporate governance has any impact on firm
performance.

Chapter: 3 Research Methodology
69
Objectives
The broader objective of this research is
to understand the Corporate Governance processes of Indian Companies and
to see the impact of Corporate Governance on the Financial Performance.
These objectives can be summarized as under;
• To understand the concept of corporate governance practices in true sense and
in Indian context.
• To study the acceptance and implementation of corporate governance in
Indian corporate.
• To study the corporate governance practices and measure in terms of corporate
governance score
• To understand firm financial performance and corporate governance.
• To know the impact of corporate governance on financial performance.
Perspectives: The formulation of the study has been framed out from two perspectives :
• To evaluate the implementation of Corporate Governance Code by assessing corporate governance score
• To evaluate the financial performance of the sample company using various financial ratios.
Assumptions: The broader assumptions in the study are as under:
H01 There is no significant difference in the Corporate Governance Score
of selected Indian Companies. H02 There is no significant difference in the Corporate Governance Score
among various sectors of the Indian companies. H03 There is a positive impact of Corporate Governance on the financial
performance of the selected Indian companies.
Chapter: 3 Research Methodology
70
Methodology
As a part of this study, the researcher is required to calculate various scores in the area
of financial performance and Corporate Governance.
o Ratios (For measuring the Financial Performance) To evaluate a financial performance has been a difficult task for any
researcher. However we have considered the following ratios as key financial
performance indicator.
There are several parameters to evaluate any financial statement. However as
the focus of the research is on Corporate Governance, the following financial
parameters are considered. They are as under :
i) EBT / Sales
ii) Sales / Total Assets
iii) Earning Per Share
iv) P/E Multiple
o Questionnaire (For estimating Corporate Governance Code) The present study aims to examine the governance practices
prevailing in the corporate sector within the Indian regulatory
framework. The study is conducted to assess governance
practices and process followed by Indian corporate houses. The
study also aims to assess the substance and quality of reporting
of Corporate Governance practices in annual reports.
The study aims to evaluate the state of compliance of various
governance parameters in these companies. The parameters
include the Statutory and Non mandatory requirements
stipulated by revised Clause 49 of the listing agreement as
prescribed by Securities and Exchange Board of India (SEBI)
and relative amendments in the Companies Act, 1956.

Chapter: 3 Research Methodology
71
To arrive at a corporate governance score, several parameters
are considered they are mentioned in the following table29.
No. Governance Parameters
Points / Score
Assigned
1 Statement of Company's philosophy on code of governance 2
2 Structure and Strength of board 2
3 Chairman & CEO Duality (Max)--> 5
i Promoter Executive Chairman - Cum - MD / CEO 1
ii Non promoter Executive Chairman cum MD / CEO 2
iii Promoter Non Executive Chairman 3
iv Non Promoter Non Executive Chairman 4
v Non Executive Independent Chairman 5
4 Disclosure of Tenure and Age limit of directors 2
5 Disclosure of : 3
i Definition of Independent Director 1
ii Definition of Financial Expert 1
iii
Selection Criteria of Board of Directors incl. independent
directors 1
6
Post Board meeting follow up system and compliance of the
board procedures 2
7 Appointment of lead independent director 2
8 Disclosure of other provision as to the boards and committees 1
9 Disclosure of : 2
i Remuneration Policy 1
ii Remuneration of Directors 1
10 Code of Conduct 2
i Information on Code of Conduct 1
ii Affirmation of compliance 1
11 Board Committee
A Audit Committee 8
i Transparency in composition of audit committee 1
ii
Compliance of minimum requirement of the number of
independent directors in the committee 1
iii
Compliance of minimum requirement of the number of
meetings of the committee. 1
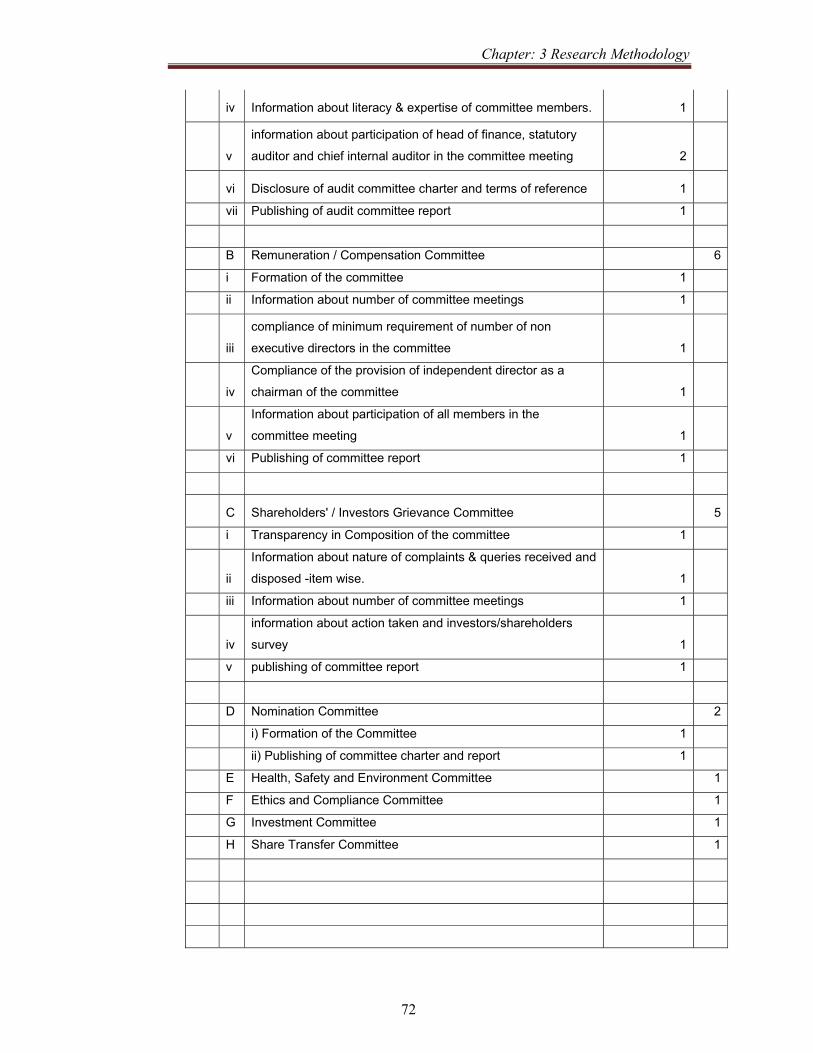
Chapter: 3 Research Methodology
72
iv Information about literacy & expertise of committee members. 1
v
information about participation of head of finance, statutory
auditor and chief internal auditor in the committee meeting 2
vi Disclosure of audit committee charter and terms of reference 1
vii Publishing of audit committee report 1
B Remuneration / Compensation Committee 6
i Formation of the committee 1
ii Information about number of committee meetings 1
iii
compliance of minimum requirement of number of non
executive directors in the committee 1
iv
Compliance of the provision of independent director as a
chairman of the committee 1
v
Information about participation of all members in the
committee meeting 1
vi Publishing of committee report 1
C Shareholders' / Investors Grievance Committee 5
i Transparency in Composition of the committee 1
ii
Information about nature of complaints & queries received and
disposed -item wise. 1
iii Information about number of committee meetings 1
iv
information about action taken and investors/shareholders
survey 1
v publishing of committee report 1
D Nomination Committee 2
i) Formation of the Committee 1
ii) Publishing of committee charter and report 1
E Health, Safety and Environment Committee 1
F Ethics and Compliance Committee 1
G Investment Committee 1
H Share Transfer Committee 1
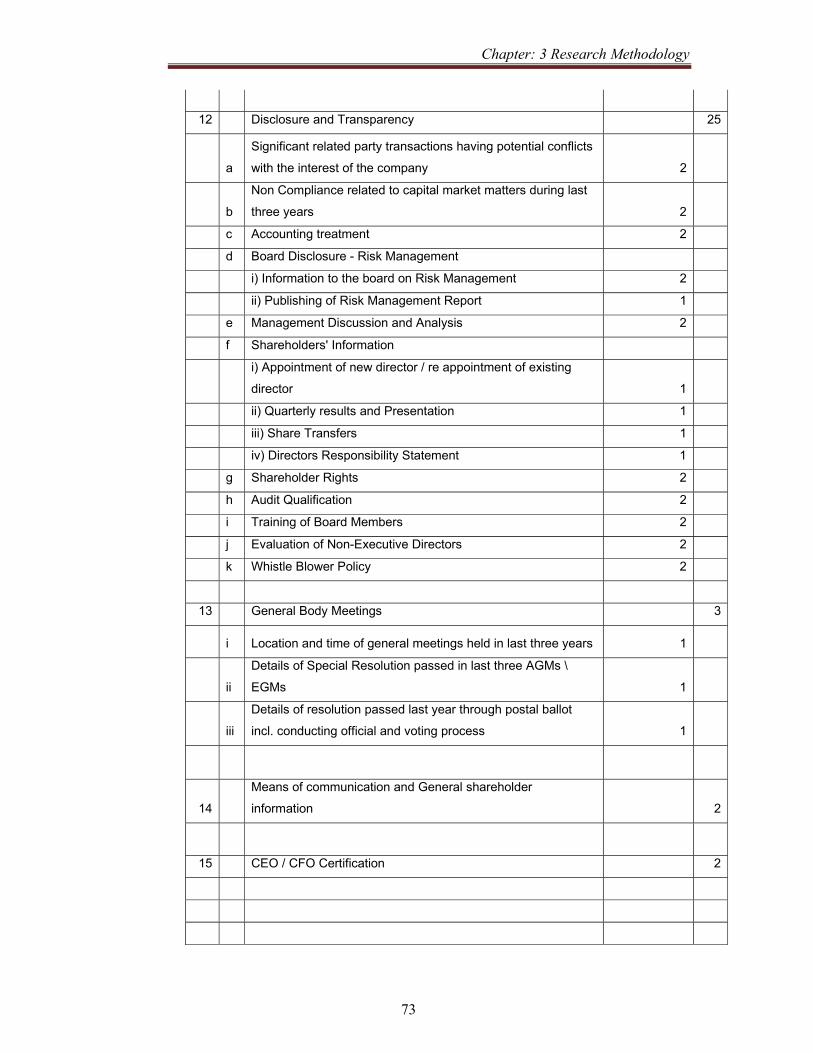
Chapter: 3 Research Methodology
73
12 Disclosure and Transparency 25
a
Significant related party transactions having potential conflicts
with the interest of the company 2
b
Non Compliance related to capital market matters during last
three years 2
c Accounting treatment 2
d Board Disclosure - Risk Management
i) Information to the board on Risk Management 2
ii) Publishing of Risk Management Report 1
e Management Discussion and Analysis 2
f Shareholders' Information
i) Appointment of new director / re appointment of existing
director 1
ii) Quarterly results and Presentation 1
iii) Share Transfers 1
iv) Directors Responsibility Statement 1
g Shareholder Rights 2
h Audit Qualification 2
i Training of Board Members 2
j Evaluation of Non-Executive Directors 2
k Whistle Blower Policy 2
13 General Body Meetings 3
i Location and time of general meetings held in last three years 1
ii
Details of Special Resolution passed in last three AGMs \
EGMs 1
iii
Details of resolution passed last year through postal ballot
incl. conducting official and voting process 1
14
Means of communication and General shareholder
information 2
15 CEO / CFO Certification 2

Chapter: 3 Research Methodology
74
16
Compliance of Corporate Governance and Auditors'
Certificate 10
Clean Certificate from Auditor 10
Qualified Certificate from auditors 5
17 Disclosure of Stakeholders' interests : 10
i Environment, Health & Safety Measures (EHS) 2
ii Human Resource Development Initiative (HRD) 2
iii Corporate Social Responsibility (CSR) 2
iv Industrial Relation (IR) 2
v Disclosure of policies on EHS, HRD, CSR & IR 2
T O T A L 100
Evaluation of Governance Standard.
After analysis of governance structure, process and disclosures
made on corporate governance, the question comes to mind is
what is the standard and quality of governance that has been
achieved by various companies?
Considering the fact that there have been certain genuine
difficulties because of non availability of inside information, no
scope for discussion with key officials of these companies, their
auditors – internal auditors, directors and major shareholders
etc. as an alternative, it is developed as a working method,
which is described in the above table. It was designed on the
basis of Clause 49 of the listing agreement. This point based
method gives weight-age to various components and ultimately,
each of these companies has been awarded different points on
key parameters.
Score Range Rank
86 – 100 Excellent
71 – 85 Very Good
56 – 70 Good
41 – 55 Average
Below 41 Poor
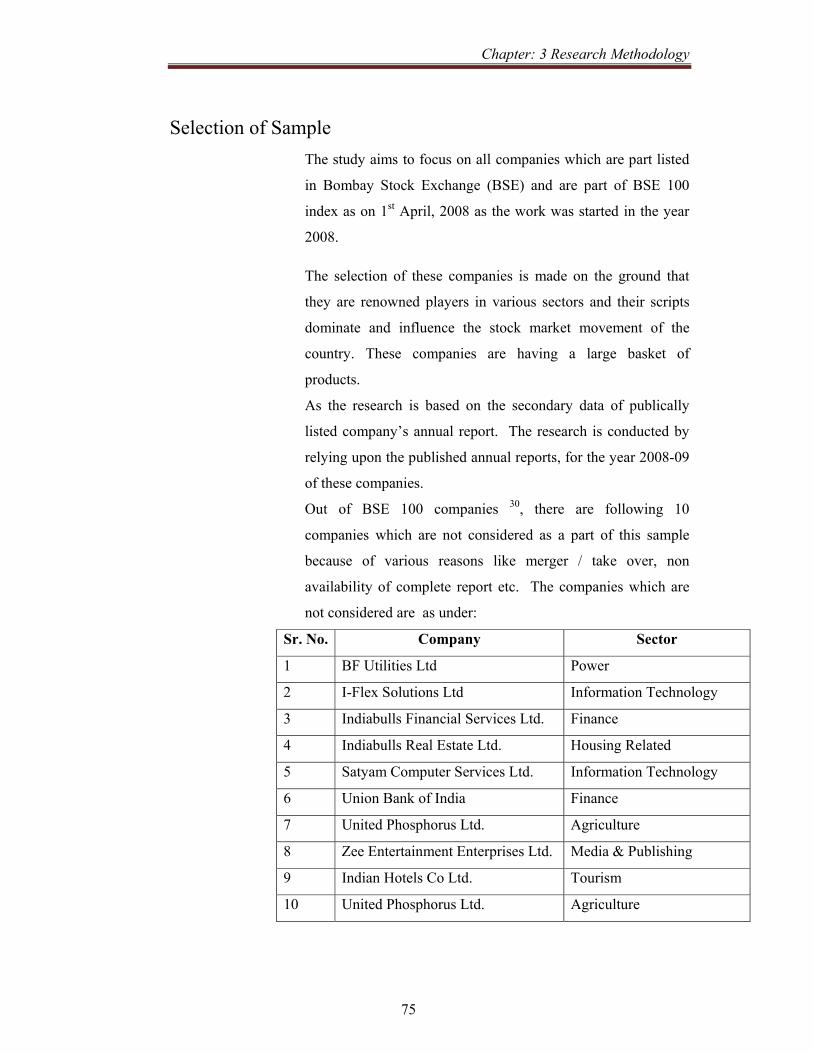
Chapter: 3 Research Methodology
75
Selection of Sample The study aims to focus on all companies which are part listed
in Bombay Stock Exchange (BSE) and are part of BSE 100
index as on 1st April, 2008 as the work was started in the year
2008.
The selection of these companies is made on the ground that
they are renowned players in various sectors and their scripts
dominate and influence the stock market movement of the
country. These companies are having a large basket of
products.
As the research is based on the secondary data of publically
listed company’s annual report. The research is conducted by
relying upon the published annual reports, for the year 2008-09
of these companies.
Out of BSE 100 companies 30, there are following 10
companies which are not considered as a part of this sample
because of various reasons like merger / take over, non
availability of complete report etc. The companies which are
not considered are as under:
Sr. No. Company Sector
1 BF Utilities Ltd Power
2 I-Flex Solutions Ltd Information Technology
3 Indiabulls Financial Services Ltd. Finance
4 Indiabulls Real Estate Ltd. Housing Related
5 Satyam Computer Services Ltd. Information Technology
6 Union Bank of India Finance
7 United Phosphorus Ltd. Agriculture
8 Zee Entertainment Enterprises Ltd. Media & Publishing
9 Indian Hotels Co Ltd. Tourism
10 United Phosphorus Ltd. Agriculture

Chapter: 3 Research Methodology
76
Therefore the sample size of the study includes 90 companies
as they fulfill the required criteria.
The sample for this study comprises 90 renowned corporate
houses representing following the various sectors.
Sr. No. Sector No. of Companies
1 Capital Goods 08
2 Diversified 06
3 Finance 13
4 FMCG 05
5 Healthcare 07
6 Housing Related 08
7 Information Technology 07
8 Mining, Metal & Metal Products 08
9 Oil and Gas 11
10 Power 04
11 Telecom 05
12 Transport Equipments 08
Total 90
Chapter: 3 Research Methodology
77
Limitations of Study
Despite of some efforts, there are several limitations of this
study, they can be mentioned as under :
1. The study is conducted by depending upon the secondary
sources of information
2. The study is limited to BSE 100 index companies as on 1st
April, 2008 this indicated a reasonable sample size.
3. The Corporate Governance study is calculated by Score
which can have a scope for further research.

Chapter: 3 Research Methodology
78
References
1. Confederation of Indian Industry, (March 1998) Desirable corporate Governance : A Code (Based on recommendations of the national task force on corporate governance , chaired by Shri Rahul Bajaj).
2. Department of Company Affairs (2000) Report of the taskforce on Corporate Excellence through Governance (by Kumar Mangalam Birla Committee on corporate Governance , Chartered Secretary ( March 2000)
3. Report on Corporate Governance by committee headed by Shri Naresh Chandra on regulation of private companies and partnership
4. Securities and Exchange Board of India (2002) Report on SEBI Committee on Corporate Governance (under the chairmanship of Shri N R Narayanamurthy)
5. Report of the CII Taskforce on Corporate Governance Chaired by Mr. Naresh Chandra ( November 2009)
6. Ministry of Corporate Affairs, Government of India. Corporate Governance Voluntary Guidelines 2009,
7. Securities and Exchange Board of India Clause 49 of listing agreement.
8. Demsetz, Harold, and Kenneth Lehn, 1985, The structure of corporate ownership: causes and consequences, Journal of Political Economy, 93, 1155-77
9. Jensen, Michael C., 1993, The modern industrial revolution, exit, and the failure of internal control systems, Journal of Finance, 48, 831-880.
10. Yermack, David, 1996, Higher market valuation of companies with a small board of directors, Journal of Financial Economics, 40, 185-221.
11. Eisenberg, Theodore, Sundgren, Stefan, and Martin T. Wells, 1998, Larger board size and decreasing firm value in small Firms, Journal of Financial Economics, 48, 35-54
12. Mak, Yuen Teen, and Yuanto Kusnadi, 2002, Size really matters: further evidence on the negative relationship between board size and firm value, Pacific-Basin Finance Journal, 13, 301-318.
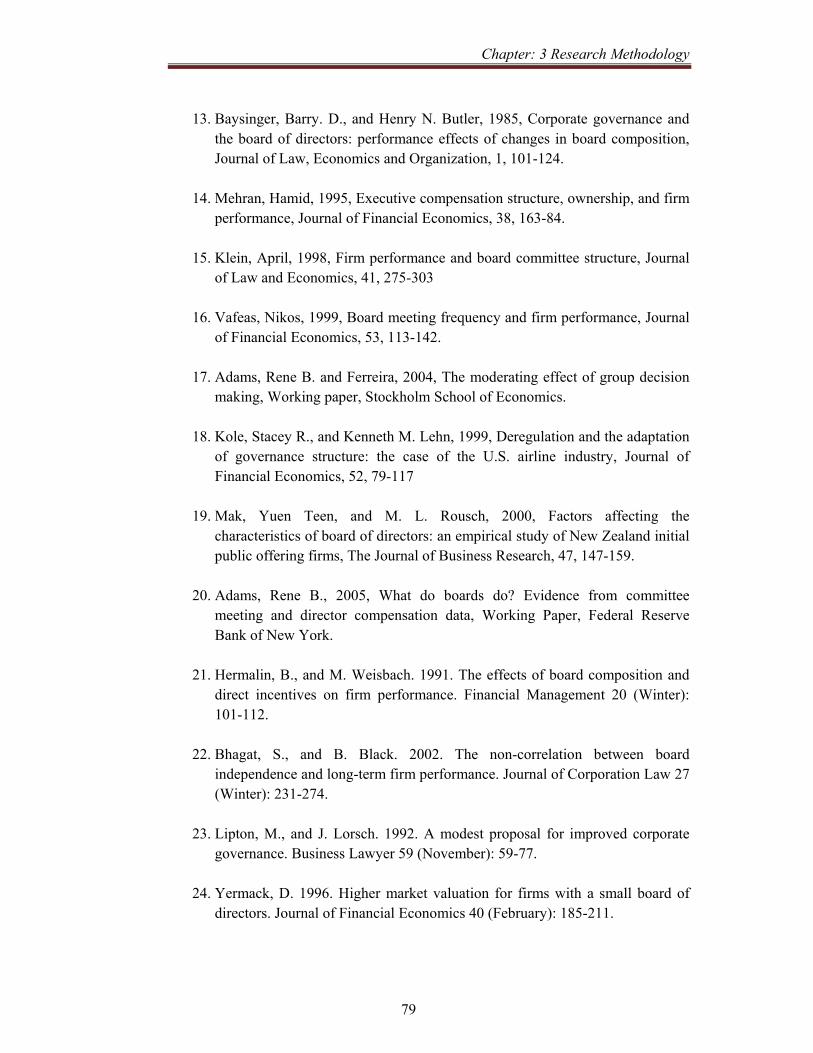
Chapter: 3 Research Methodology
79
13. Baysinger, Barry. D., and Henry N. Butler, 1985, Corporate governance and
the board of directors: performance effects of changes in board composition, Journal of Law, Economics and Organization, 1, 101-124.
14. Mehran, Hamid, 1995, Executive compensation structure, ownership, and firm performance, Journal of Financial Economics, 38, 163-84.
15. Klein, April, 1998, Firm performance and board committee structure, Journal of Law and Economics, 41, 275-303
16. Vafeas, Nikos, 1999, Board meeting frequency and firm performance, Journal of Financial Economics, 53, 113-142.
17. Adams, Rene B. and Ferreira, 2004, The moderating effect of group decision making, Working paper, Stockholm School of Economics.
18. Kole, Stacey R., and Kenneth M. Lehn, 1999, Deregulation and the adaptation of governance structure: the case of the U.S. airline industry, Journal of Financial Economics, 52, 79-117
19. Mak, Yuen Teen, and M. L. Rousch, 2000, Factors affecting the characteristics of board of directors: an empirical study of New Zealand initial public offering firms, The Journal of Business Research, 47, 147-159.
20. Adams, Rene B., 2005, What do boards do? Evidence from committee meeting and director compensation data, Working Paper, Federal Reserve Bank of New York.
21. Hermalin, B., and M. Weisbach. 1991. The effects of board composition and direct incentives on firm performance. Financial Management 20 (Winter): 101-112.
22. Bhagat, S., and B. Black. 2002. The non-correlation between board independence and long-term firm performance. Journal of Corporation Law 27 (Winter): 231-274.
23. Lipton, M., and J. Lorsch. 1992. A modest proposal for improved corporate governance. Business Lawyer 59 (November): 59-77.
24. Yermack, D. 1996. Higher market valuation for firms with a small board of directors. Journal of Financial Economics 40 (February): 185-211.

Chapter: 3 Research Methodology
80
25. Anderson, R., S. Mansi, and D. Reeb. 2004. Board characteristics, accounting report integrity, and the cost of debt. Journal of Accounting and Economics 37 (September): 315-342.
26. Ministry of Corporate Affairs, Government of India, Report of expert committee headed by Dr. J J Irani December 2004
27. Garg A K (2007), “ Influence of Board Size and Independence on Firm Performance : A study of Indian Companies”, Vikalpa, IIM-A, 32 (3), 39-60
28. Shukla H J (2007), “Corporate Governance in India”
29. Das S C (2007), Corporate Governance Standards and Practices in Information
Technology Industry in India, The Management Accountant, 111-113
30. The Bombay Stock Exchange, Companies in BSE 100 Index as on 1st April, 2008.
31. Antunovich et al (2000) and BusinessWeek (2000).
32. For example, Bhagat and Black (1999) and (2002), Dalton et al (1998) and Demsetz and Villalonga (2001), Dulewicz and Herbert (2003).
33. The IRRC tracks 22 company level rules and coverage under six state take-over laws. Duplication between company level provisions and state laws means that taken together there are 24 provisions divided into five broad groups: Measures for delaying hostile bidders, voting rights, director protection, other take-over defences and state laws.
34. Drobetz et al (2004) replicated the finding of Gompers et al in respect of the German market. The research by Bauer et al (2004), based on an analysis of corporate governance data on a sample of European companies included in the FTSE Eurotop 300, provided somewhat mixed support. They found a positive relationship between the corporate governance standards investigated and share price and company value but not operating performance

SGN
Chapter: 4
Analysis of Corporate Governance Practices
• Industry specific Analysis of Corporate Governance.
o Capital Goods Industry
o Diversified Industry
o Finance Industry
o FMCG Industry
o Healthcare Industry
o Housing Related Industry
o Information Technology Industry
o Metal,Metal Products & Mining Industry
o Oil & Gas Industry
o Power Industry
o Telecom Industry
o Transport Equipments Industry
• Summary of Corporate Governance score of various
industries.
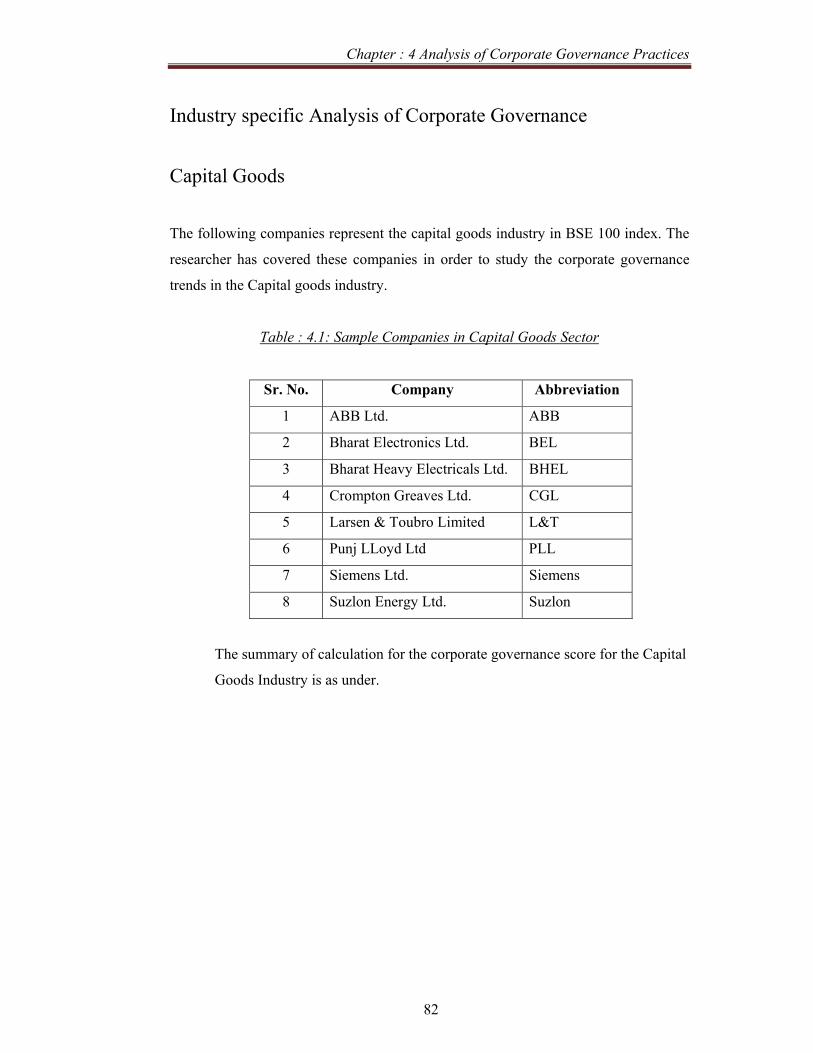
Chapter : 4 Analysis of Corporate Governance Practices
82
Industry specific Analysis of Corporate Governance
Capital Goods
The following companies represent the capital goods industry in BSE 100 index. The
researcher has covered these companies in order to study the corporate governance
trends in the Capital goods industry.
Table : 4.1: Sample Companies in Capital Goods Sector
Sr. No. Company Abbreviation
1 ABB Ltd. ABB
2 Bharat Electronics Ltd. BEL
3 Bharat Heavy Electricals Ltd. BHEL
4 Crompton Greaves Ltd. CGL
5 Larsen & Toubro Limited L&T
6 Punj LLoyd Ltd PLL
7 Siemens Ltd. Siemens
8 Suzlon Energy Ltd. Suzlon
The summary of calculation for the corporate governance score for the Capital
Goods Industry is as under.

Chapter : 4 Analysis of Corporate Governance Practices
83
Table : 4.2 : Corporate Governance Score for Capital Goods Sector
C A P I T A L G O O D S - 0 8 - COMPANIES Criterion for Evaluation of Governance Standard for INDUSTRY AVG : 63, AGGREGATE AVG : 67
No. Governance Parameters
Points / Score
Assigned ABB BEL BHEL CG L&T PL Siemens Suzlon
1
Statement of Company's philosophy on code of governance 2 2 2 2 2 2 2 2 2
2 Structure and Strength of board 2 2 2 2 2 2 2 2 2
3 Chairman & CEO Duality 5 4 2 2 3 2 1 4 1
4 Disclosure of Tenure and Age limit of directors 2 2 2 2 2 2 2 2 2
5 Disclosure of : 3 0 0 1 0 0 0 0 0
6
Post Board meeting follow up system and compliance of the board procedures 2 0 0 0 0 0 0 0 0
7 Appointment of lead independent director 2 0 0 0 0 0 0 0 0
8
Disclosure of other provision as to the boards and committees 1 1 1 1 1 1 1 1 1
9 Disclosure of : 2 2 1 1 1 2 1 1 1 10 Code of Conduct 2 2 2 2 2 2 2 2 2 11 Board Committee 25 15 10 16 15 16 15 15 16 12 Disclosure and Transparency 25 20 20 16 16 16 16 16 1613 General Body Meetings 3 3 3 3 3 3 3 3 3
14
Means of communication and General shareholder information 2 2 2 2 2 2 2 2 2
15 CEO / CFO Certification 2 2 2 2 2 2 2 2 2
16
Compliance of Corporate Governance and Auditors' Certificate 10 10 10 10 10 10 10 10 10
17 Disclosure of Stakeholders' interests : 10 2 0 2 0 0 0 2 2
T O T A L 100 69 59 64 61 62 59 64 62COMPANY RANK 1 5 2 4 3 5 2 3

Chapter : 4 Analysis of Corporate Governance Practices
84
Capital Goods Industry - Analysis of Corporate Governance Score
1. Statement of Company's philosophy on code of governance:
In the Capital Goods industry there are 8 sample units, while looking to the
Corporate Governance, the first score point was statement of Company’s
philosophy on Corporate Governance and thus the point was assigned a
weightage of 2 on a scale of 100. All 8 companies get the expected score of 2.
On other hand all companies have sufficient disclosure of the statement of
Company's philosophy on code of governance
However, ABB have better described Company's philosophy on code of
governance.
2. Structure and Strength of board
In the Corporate Governance score, the second score point was about the
Structure and Strength of the board. The point was assigned a weightage of 2
on a scale of 100. All 8 companies get the expected score of 2. All companies
have sufficiently disclosed the composition of the Board of Directors.
3. Chairman & CEO Duality
The appointment of Chairman of the board carries of critical importance. The
third point describes about the duality of Chairman and CEO. The point
assigned a weightage of total 5 points, which are assigned on the following
basis.
Table : 4.3: Criteria for determination of Points for Chairman & CEO
Sr. No. Particulars PointsI Promoter Executive Chairman - Cum - MD / CEO 1 Ii Non promoter Executive Chairman cum MD / CEO 2 Iii Promoter Non Executive Chairman 3 Iv Non Promoter Non Executive Chairman 4 V Non Executive Independent Chairman 5
No company among this sample is assigned a score of 5 as no company is
having Non Executive Independent Chairman. However, Siemens and ABB
have Non Promoter Non Executive Chairman hence are assigned a score of 4.

Chapter : 4 Analysis of Corporate Governance Practices
85
While, Punj Lloyd and Suzlon are assigned a score of 1 as they have Promoter
Executive Chairman - Cum – Managing Director.
4. Disclosure of Tenure and Age limit of directors
In the Corporate Governance score, the fourth point was about Disclosure of
Tenure and Age limit of directors. The point was assigned a weightage of 2 on
a scale of 100. All 8 companies get the expected score of 2. All companies
have sufficiently disclosed the tenure and age limit of Directors.
5. Disclosure of Definition and selection criteria for (Independent) Directors
In the Corporate Governance score, the fifth point was about the definition of
‘Independent Director’ and ‘Financial Expert’ and selection criteria for board
members (including independent director). The point was assigned a
weightage of 3 on a scale of 100. None of the companies have disclosed
definition of ‘Financial Expert’ and selection criteria for board members
(including independent director).
However, the definition of ‘Independent Director’ is available in the annual
report of Bharat Heavy Electricals Ltd. (BHEL) hence it is assigned a score of
1 point. All companies (except BHEL) did not get any point.
6. Post Board meeting follow up system and compliance of the board procedures
In the Corporate Governance score, the sixth point was about disclosure of
Post Board meeting follow up system and compliance of the board procedures.
The point was assigned a weightage of 2 on a scale of 100. The systematic
disclosures about the Post Board meeting follow up system are not sufficiently
available in the annual report of the sample companies.
Hence, All 8 companies did not get any point in this section.

Chapter : 4 Analysis of Corporate Governance Practices
86
7. Appointment of lead independent director
In the Corporate Governance score, the seventh point was about the
appointment of lead independent director. The point was assigned a weightage
of 2 on a scale of 100. Among the sample, none of the companies have
formally appointed lead independent director.
Hence, All 8 companies did not get any point in this section.
8. Disclosure of other provision as to the boards and committees
In the Corporate Governance score, the eighth point was about the disclosure
of other provision as to the boards and committees. The point was assigned a
weightage of 1 on a scale of 100. It is observed that all the companies have
sufficiently disclosed about the various committees and sub-committees of the
board.
Hence, All 8 companies get expected score of 1.
9. Disclosure of Remuneration Policy & Remuneration of Directors
In the Corporate Governance score, the ninth point was about the disclosure of
Remuneration Policy & Remuneration of Directors. The point was assigned a
weightage of 2 on a scale of 100. The point was further equally divided into
two points, ( i ) Disclosure of remuneration policy and (ii) Disclosure of
remuneration to directors.
All companies have sufficiently disclosed about remuneration to directors. The
remuneration policy of ABB is sufficiently disclosed in the annual report.
Hence, all companies (except ABB) did not get any point in this section.
However, ABB gets the score of 1.
10. Code of Conduct
In the Corporate Governance score, the tenth point was about the code of
conduct. The point was assigned a weightage of 2 on a scale of 100. The point
was further equally divided into two points,
(i) Information on Code of Conduct and
(ii) Affirmation regarding compliance for code of conduct.

Chapter : 4 Analysis of Corporate Governance Practices
87
It is observed that all the companies have sufficiently disclosed about both the
above points.
Hence, All 8 companies get expected score of 2.
11. Board Committees
In the Corporate Governance score, the eleventh point is about the various
committees of the board. The point is assigned a weightage of 25 on a scale of
100. The classification of the point is as under.
Table : 4.4 Criteria for Determination of points for Board Committees
Sr. No. Particulars PointsI Audit Committee 8II Remuneration Committee 6III Shareholders' / Investors Grievance Committee 5IV Nomination Committee 2V Other Committees 4
Total 25
a. Audit Committee
The Audit Committee is assigned a weightage of 8. It is further
classified as under.
Table : 4.5 Criteria for Determination of points for Audit Committees
Sr. No. Particulars Points I Transparency in composition of audit committee 1
Ii Compliance of minimum requirement of the number of independent directors in the committee
1
Iii Compliance of minimum requirement of the number of meetings of the committee.
1
Iv Information about literacy & expertise of committee members. 1
v Information about participation of head of finance, statutory auditor and chief internal auditor in the committee meeting
2
vi Disclosure of audit committee charter and terms of reference 1 vii Publishing of audit committee report 1
Total 8
It is observed that all companies have made sufficient disclosure about
the audit committee.
However, none of among the sample companies, has published Audit
Committee Report in the annual report.
Hence, All 8 companies get expected score of 7.
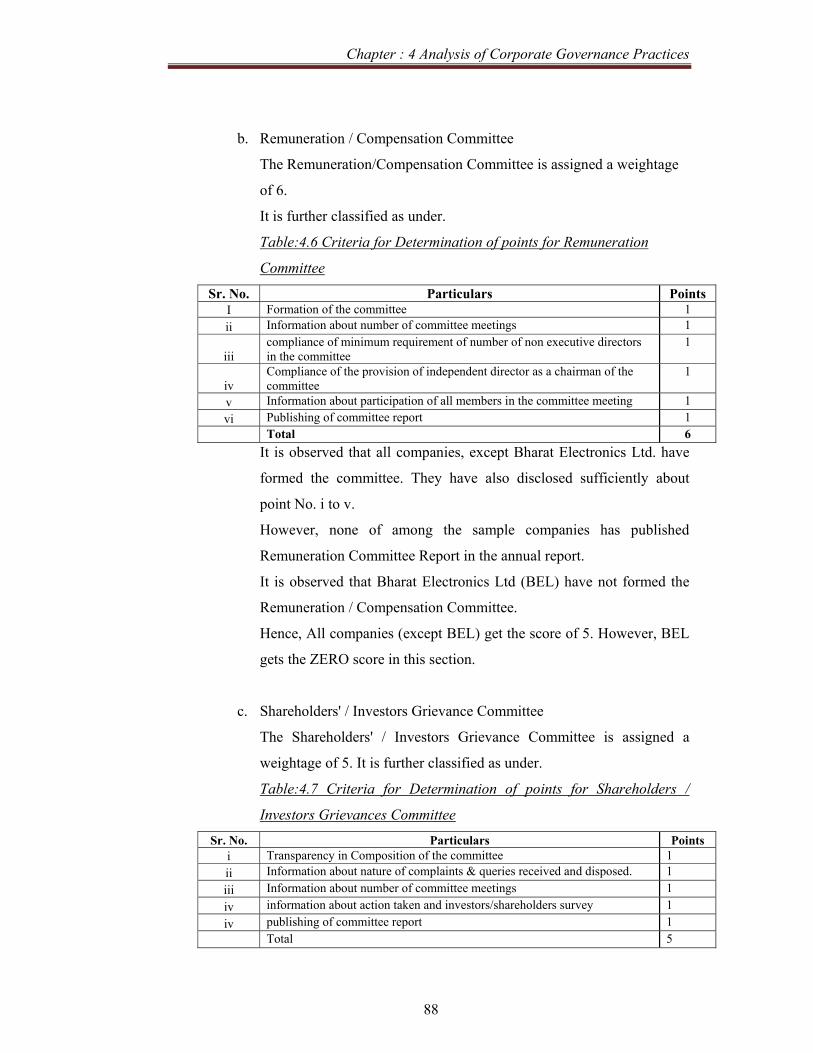
Chapter : 4 Analysis of Corporate Governance Practices
88
b. Remuneration / Compensation Committee
The Remuneration/Compensation Committee is assigned a weightage
of 6.
It is further classified as under.
Table:4.6 Criteria for Determination of points for Remuneration
Committee
Sr. No. Particulars Points I Formation of the committee 1 ii Information about number of committee meetings 1
iii compliance of minimum requirement of number of non executive directors in the committee
1
iv Compliance of the provision of independent director as a chairman of the committee
1
v Information about participation of all members in the committee meeting 1 vi Publishing of committee report 1
Total 6 It is observed that all companies, except Bharat Electronics Ltd. have
formed the committee. They have also disclosed sufficiently about
point No. i to v.
However, none of among the sample companies has published
Remuneration Committee Report in the annual report.
It is observed that Bharat Electronics Ltd (BEL) have not formed the
Remuneration / Compensation Committee.
Hence, All companies (except BEL) get the score of 5. However, BEL
gets the ZERO score in this section.
c. Shareholders' / Investors Grievance Committee
The Shareholders' / Investors Grievance Committee is assigned a
weightage of 5. It is further classified as under.
Table:4.7 Criteria for Determination of points for Shareholders /
Investors Grievances Committee
Sr. No. Particulars Points i Transparency in Composition of the committee 1 ii Information about nature of complaints & queries received and disposed. 1 iii Information about number of committee meetings 1 iv information about action taken and investors/shareholders survey 1 iv publishing of committee report 1
Total 5
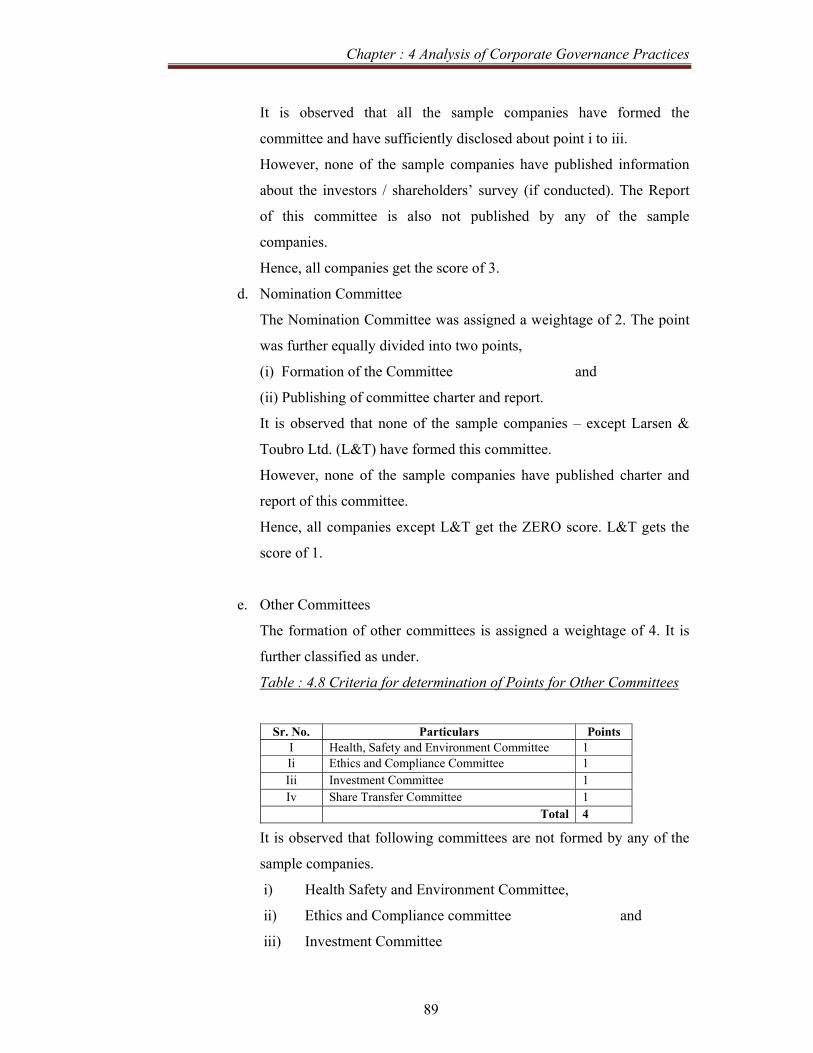
Chapter : 4 Analysis of Corporate Governance Practices
89
It is observed that all the sample companies have formed the
committee and have sufficiently disclosed about point i to iii.
However, none of the sample companies have published information
about the investors / shareholders’ survey (if conducted). The Report
of this committee is also not published by any of the sample
companies.
Hence, all companies get the score of 3.
d. Nomination Committee
The Nomination Committee was assigned a weightage of 2. The point
was further equally divided into two points,
(i) Formation of the Committee and
(ii) Publishing of committee charter and report.
It is observed that none of the sample companies – except Larsen &
Toubro Ltd. (L&T) have formed this committee.
However, none of the sample companies have published charter and
report of this committee.
Hence, all companies except L&T get the ZERO score. L&T gets the
score of 1.
e. Other Committees
The formation of other committees is assigned a weightage of 4. It is
further classified as under.
Table : 4.8 Criteria for determination of Points for Other Committees
It is observed that following committees are not formed by any of the
sample companies.
i) Health Safety and Environment Committee,
ii) Ethics and Compliance committee and
iii) Investment Committee
Sr. No. Particulars Points I Health, Safety and Environment Committee 1 Ii Ethics and Compliance Committee 1 Iii Investment Committee 1 Iv Share Transfer Committee 1 Total 4
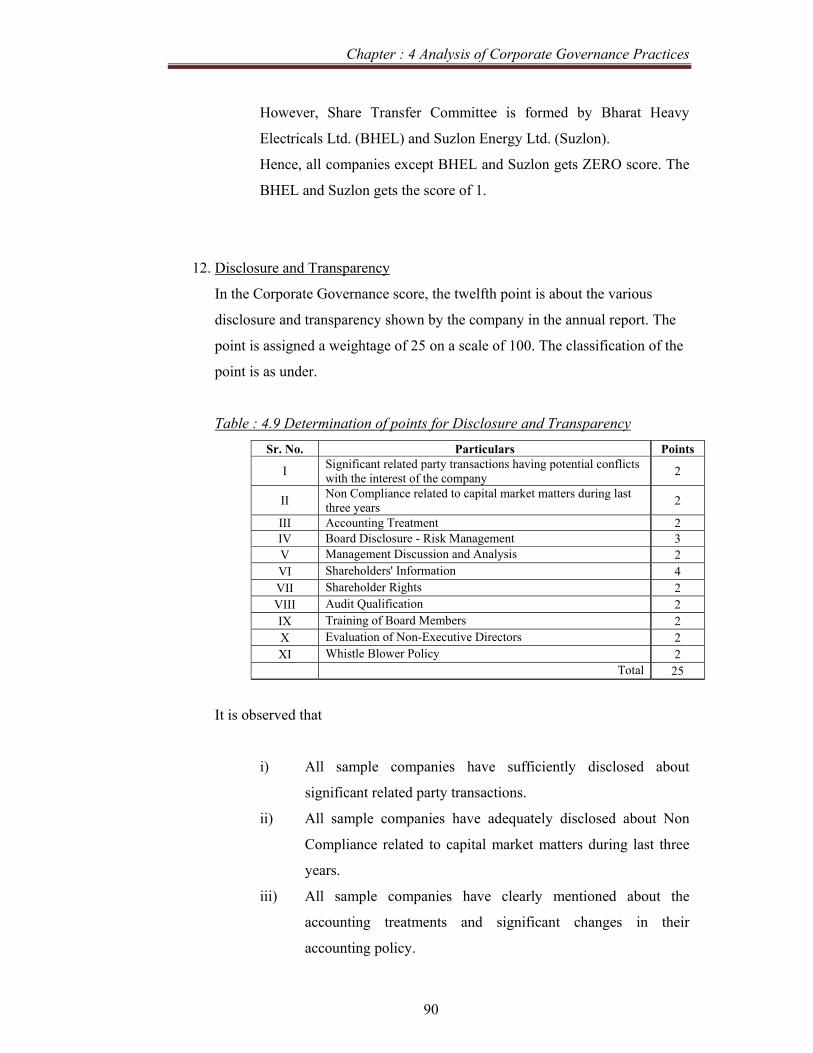
Chapter : 4 Analysis of Corporate Governance Practices
90
However, Share Transfer Committee is formed by Bharat Heavy
Electricals Ltd. (BHEL) and Suzlon Energy Ltd. (Suzlon).
Hence, all companies except BHEL and Suzlon gets ZERO score. The
BHEL and Suzlon gets the score of 1.
12. Disclosure and Transparency
In the Corporate Governance score, the twelfth point is about the various
disclosure and transparency shown by the company in the annual report. The
point is assigned a weightage of 25 on a scale of 100. The classification of the
point is as under.
Table : 4.9 Determination of points for Disclosure and Transparency
Sr. No. Particulars Points
I Significant related party transactions having potential conflicts with the interest of the company 2
II Non Compliance related to capital market matters during last three years 2
III Accounting Treatment 2 IV Board Disclosure - Risk Management 3 V Management Discussion and Analysis 2 VI Shareholders' Information 4 VII Shareholder Rights 2 VIII Audit Qualification 2 IX Training of Board Members 2 X Evaluation of Non-Executive Directors 2 XI Whistle Blower Policy 2
Total 25
It is observed that
i) All sample companies have sufficiently disclosed about
significant related party transactions.
ii) All sample companies have adequately disclosed about Non
Compliance related to capital market matters during last three
years.
iii) All sample companies have clearly mentioned about the
accounting treatments and significant changes in their
accounting policy.

Chapter : 4 Analysis of Corporate Governance Practices
91
iv) All sample companies have given sufficient information about
risk management and policies of the board.
However, no sample company has published risk management
report.
v) All sample companies have published the Management
Discussion and Analysis as a part of the annual report.
vi) All sample companies have sufficiently disclosed the
shareholders’ information.
vii) None of the sample companies have published rights of the
share holders as a part of their annual report.
viii) All sample companies are clear from any audit qualification.
ix) ABB Ltd and Bharat Electronics Ltd. have given information
about the training to board members. However, it is not given
by other sample companies.
x) None of the sample companies have given information about
the system of Evaluation of Non Executive Directors.
xi) ABB Ltd and Bharat Electronics Ltd. (BEL) have given
information about the Whistle Blower Policy. However, it is
not given by other sample companies.
Hence, all companies except ABB and BEL gets the score of 16. ABB
and BEL gets the score of 20.
13. General Body Meetings
The Thirteenth score point was disclosure about the General Body Meetings
thus the point was assigned a weightage of 3 on a scale of 100. This point is
further equally divided into the disclosure regarding the following :
i) Location and time of general meetings held in last three years
ii) Details of Special Resolution passed in last three AGMs \ EGMs
iii) Details of resolution passed last year through postal ballot including
conducting official and voting process
All 8 companies have sufficiently disclosed about the above points in the
annual report.
Hence, all 8 companies get the expected score of 3.
Chapter : 4 Analysis of Corporate Governance Practices
92
14. Means of communication and General shareholder information
The Fourteenth score point was disclosure about the means of communication
and general shareholder information. This point was assigned a weightage of 2
on a scale of 100.
All 8 companies have sufficiently disclosed about the point in the annual
report.
Hence, all 8 companies get the expected score of 2.
15. CEO / CFO Certification
The Fifteenth score point was about the certification of CEO \ CFO for the
corporate governance. This point was assigned a weightage of 2 on a scale of
100.
It is observed that all 8 companies have certification from CEO \ CFO.
Hence, all 8 companies get the expected score of 2.
16. Compliance of Corporate Governance and Auditors' Certificate
The Sixteenth score point was about the compliance of Corporate Governance
guidelines issued by SEBI and Auditor’s Certificate. This point was assigned a
weightage of 10 on a scale of 100. The companies who have clean certification
can are assigned 10 points, whereas companies who do not have a clean
certification are assigned 5 points. It is observed that all 8 companies have
clean certificate from auditor. Hence, all 8 companies get the expected score
of 10.
17. Disclosure of Stakeholders' interests :
The Seventeenth score point was about the disclosure of the stakeholders’
interest. This point was assigned a weightage of 10 on a scale of 100. These
points are divided equally to the following.
i) Environment, Health & Safety Measures (EHS)
ii) Human Resource Development Initiative (HRD)
iii) Corporate Social Responsibility (CSR)
iv) Industrial Relation (IR)
v) Disclosure of policies on EHS, HRD, CSR & IR

Chapter : 4 Analysis of Corporate Governance Practices
93
It is observed that most of the companies have provided information about above
mentioned points in various forms. The disclosure about all items except Corporate
Social Responsibility are not adequately provided in the report. The information
regarding Corporate Social Responsibility is not adequately provided in the report of
BEL, CG, L&T and PL. However, the information regarding CSR is adequately
provided in the report of ABB, BHEL, Siemens and Suzlon. Hence, ABB, BHEL
Siemens and Suzlon are getting a score of 2. However, BEL, CG, L&T and PL get
ZERO score. The capital goods score of the all companies in the Capital Goods
Industry can be summarized with the help of following graph as under.
Graph : 4.1 : Corporate Governance score Capital Goods Industry
Hence, ABB Ltd. gets highest score of 69 whereas Punj Lloyd gets the lowest score of
59 in the Capital Goods industry. It can be also been analyzed that that the Industry
Average Score of Capital Goods Industry (63) is LOWER than the Aggregate
Average Score of all Industries.
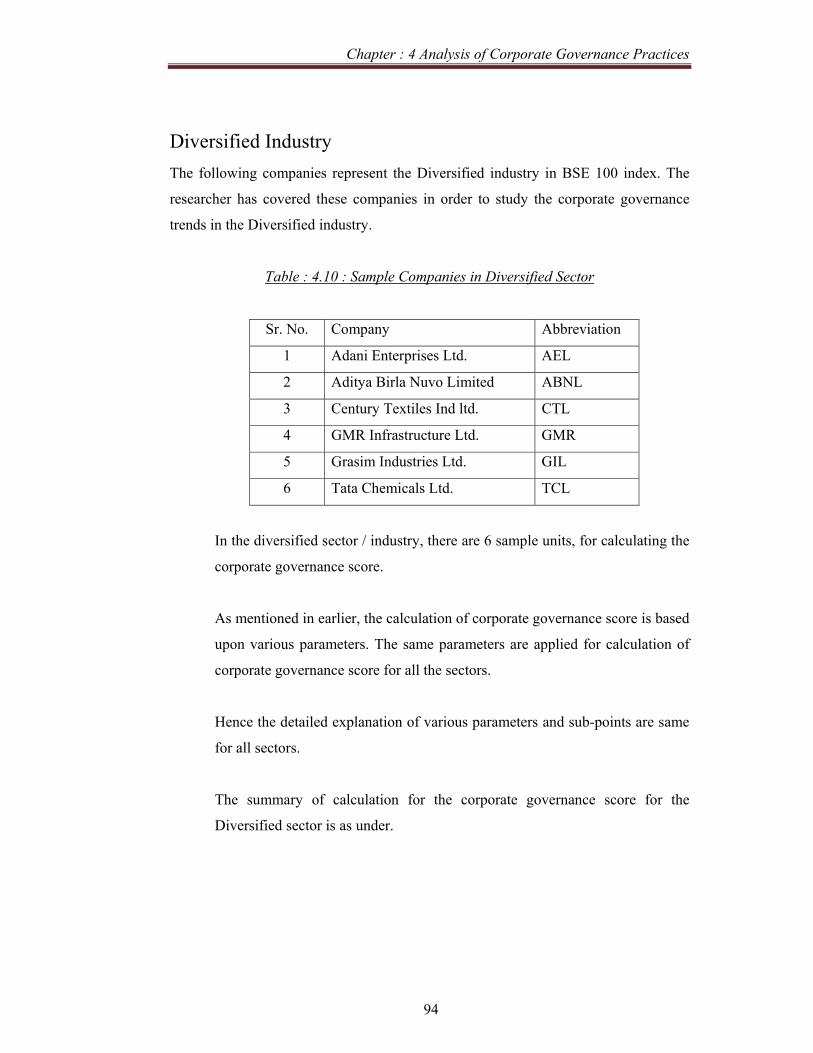
Chapter : 4 Analysis of Corporate Governance Practices
94
Diversified Industry The following companies represent the Diversified industry in BSE 100 index. The
researcher has covered these companies in order to study the corporate governance
trends in the Diversified industry.
Table : 4.10 : Sample Companies in Diversified Sector
Sr. No. Company Abbreviation
1 Adani Enterprises Ltd. AEL
2 Aditya Birla Nuvo Limited ABNL
3 Century Textiles Ind ltd. CTL
4 GMR Infrastructure Ltd. GMR
5 Grasim Industries Ltd. GIL
6 Tata Chemicals Ltd. TCL
In the diversified sector / industry, there are 6 sample units, for calculating the
corporate governance score.
As mentioned in earlier, the calculation of corporate governance score is based
upon various parameters. The same parameters are applied for calculation of
corporate governance score for all the sectors.
Hence the detailed explanation of various parameters and sub-points are same
for all sectors.
The summary of calculation for the corporate governance score for the
Diversified sector is as under.

Chapter : 4 Analysis of Corporate Governance Practices
95
Table : 4.11 Corporate Governance Score for Diversified Sector
D I V E R S I F I E D - 0 6 C O M P A N I E S Criterion for Evaluation of Governance Standard for INDUSTRY AVG : 66, AGGREGATE AVG : 67
No. Governance Parameters Points AdaniAB Nuvo Century
GMR Infra Grasim
Tata Chem
1 Statement of Company's philosophy on code of governance 2 2 2 2 2 2 2
2 Structure and Strength of board 2 2 2 2 2 2 23 Chairman & CEO Duality 5 1 1 3 1 3 3
4 Disclosure of Tenure and Age limit of directors 2 2 2 2 2 2 2
5 Disclosure of : 3 0 0 0 0 0 0
6
Post Board meeting follow up system and compliance of the board procedures 2 0 0 0 0 0 0
7 Appointment of lead independent director 2 0 0 0 0 0 0
8 Disclosure of other provision as to the boards &committees 1 1 1 1 1 1 1
9 Disclosure of : 2 2 2 2 2 1 2 10 Code of Conduct 2 2 2 2 2 2 2 11 Board Committee 25 16 10 10 15 11 16 12 Disclosure and Transparency 25 22 18 18 20 18 2013 General Body Meetings 3 3 3 3 3 3 3
14 Means of communication and General shareholder info 2 2 2 2 2 2 2
15 CEO / CFO Certification 2 2 2 2 2 2 2
16 Compliance of Corporate Governance and Auditors' Certificate 10 10 10 10 10 10 10
17 Disclosure of Stakeholders' interests : 10 4 0 2 4 6 4
T O T A L 100 71 57 61 68 65 71COMPANY RANK 1 5 4 2 3 1

Chapter : 4 Analysis of Corporate Governance Practices
96
Diversified Industries - Analysis of Corporate Governance Score
1. Statement of Company's philosophy on code of governance:
In the Diversified sector there are 6 sample units, as mentioned earlier, the
first score point having a weightage of 2 was, statement of Company’s
philosophy on Corporate Governance All companies get the expected score of
2 as all companies have sufficient disclosure of the statement of Company's
philosophy on code of governance.
2. Structure and Strength of board
In the Corporate Governance score, the second score point was about the
Structure and Strength of the board having a weightage of 2. All 6 companies
get the expected score of 2. All companies have sufficiently disclosed the
composition of the Board of Directors.
3. Chairman and CEO Duality
As mentioned earlier, this point carries a weightage of 5. No company among
this sample is assigned a score of 5 as no company is having Non Executive
Independent Chairman. However, Siemens and Century, Grasim and Tata
Chemicals have Promoter Non Executive Chairman hence are assigned a score
of 3. While Adani, Aditya Birla Nuvo and GMR Infra are assigned a score of
1 as they have Promoter Executive Chairman - Cum – Managing Director.
4. Disclosure of Tenure and Age limit of directors
As mentioned earlier, this point was assigned a weightage of 2. All 6
companies get the expected score of 2. All companies have sufficiently
disclosed the tenure and age limit of Directors.
5. Disclosure of Definition and selection criteria for (Independent) Directors
As mentioned earlier, this point was assigned a weightage of 3. None of the
companies have disclosed definition of ‘Financial Expert’ and selection
criteria for board members (including independent director).
Chapter : 4 Analysis of Corporate Governance Practices
97
6. Post Board meeting follow up system and compliance of the board procedures
This point was assigned a weightage of 2. The systematic disclosure about the
Post Board meeting follow up system is not sufficiently available in any
annual report of the sample companies. Hence, none of the sample companies
could get any point in this section.
7. Appointment of Lead Independent Director
This point is about appointment of lead independent director and carries a
weightage of 2. Among the sample, none of the companies have formally
appointed lead independent director. Hence, none of the sample companies
could get any point in this section.
8. Disclosure of other provision as to the boards and committees
The point about disclosure of other provision as to the boards and committees
carries a weightage of 1. It is observed that all the companies have sufficiently
disclosed about the various committees and sub-committees of the board.
Hence, all companies get expected score of 1.
9. Disclosure of Remuneration Policy & Remuneration of Directors
This point is about the disclosure of Remuneration Policy & Remuneration of
Directors and it carries a weightage of 2. All companies (Except Grasim) have
sufficiently disclosed about remuneration to directors and remuneration
policy. However, Grasim has not sufficiently disclosed the remuneration
policy in the annual report. Hence, all companies (except Grasim) get 2 points
whereas Grasim is awarded 1 point.
10. Code of Conduct
As mentioned earlier, this point is about code of conduct and carries a
weightage of 2. The point was further equally divided into two points,
(i) Information on Code of Conduct and
(ii) Affirmation regarding compliance for code of conduct.

Chapter : 4 Analysis of Corporate Governance Practices
98
It is observed that all the companies have sufficiently disclosed about both the
above points. Hence, all companies get expected score of 2.
11. Board Committees
In the Corporate Governance score, the eleventh point is about the various
committees of the board. The point carries a weightage of 25 on a scale of
100. The sub classification of the point is as under.
Sr. No. Particulars PointsI Audit Committee 8Ii Remuneration Committee 6Iii Shareholders' / Investors Grievance Committee 5Iv Nomination Committee 2V Other Committees 4
Total 25
a. Audit Committee
The Audit Committee is assigned a weightage of 8. It is observed that
all companies have made sufficient disclosure about the audit
committee. However, none of among the sample companies, have
published Audit Committee Report in the annual report Hence, All
companies get expected score of 7.
b. Remuneration / Compensation Committee
The Remuneration/Compensation Committee is assigned a weightage
of 6.
It is observed that three of the sample companies (Adani, GMR and
Tata Chemicals) have formed the committee. They have also made
sufficient disclosure. Whereas remaining companies have not formed
the committee.
However, none of among the sample companies has published
Remuneration Committee Report in the annual report.
It is observed that Aditya Birla Nuvo, Century and Grasim have not
formed the Remuneration / Compensation Committee.
Hence, Adani, GMR and Tata Chemicals get the score of 5. However,
remaining three sample companies get the ZERO score in this section.

Chapter : 4 Analysis of Corporate Governance Practices
99
c. Shareholders' / Investors Grievance Committee
The Shareholders' / Investors Grievance Committee is assigned a
weightage of 5. It is observed that all the sample companies have
formed the committee. However, none of the sample companies have
published information about the investors / shareholders’ survey (if
conducted). The Report of this committee is also not published by any
of the sample companies.
Hence, all companies except Century get the score of 3. In case of
Century the information about number of committee meetings is not
available it is awarded 2 points.
d. Nomination Committee
The Nomination Committee was assigned a weightage of 2. It is
observed that none of the sample companies have formed this
committee. Hence, all companies get the ZERO score.
e. Other Committees
The formation of other committees is assigned a weightage of 4. Its
classification is already mentioned earlier.
It is observed that following committees are not formed by any of the
sample companies.
ii) Ethics and Compliance committee and
iii) Investment Committee
However, Share Transfer Committee is formed by Adani and Century.
Health safety and environment committee is formed by Grasim. Hence,
all companies except Adani, Century and Grasim gets ZERO score.
The Adani, Century and Grasim gets the score of 1.
12. Disclosure and Transparency
This is the point is about the various disclosure and transparency shown by the
company in the annual report. The point is assigned a weightage of 25. The
classification of the point is already mentioned earlier.
Chapter : 4 Analysis of Corporate Governance Practices
100
It is observed that
i) All sample companies have sufficiently disclosed about
significant related party transactions.
ii) All sample companies have adequately disclosed about Non
Compliance related to capital market matters during last three
years.
iii) All sample companies have clearly mentioned about the
accounting treatments and significant changes in their
accounting policy.
iv) All sample companies have given sufficient information about
risk management and policies of the board.
However, no sample company has published risk management
report.
v) All sample companies have published the Management
Discussion and Analysis as a part of the annual report.
vi) All sample companies have sufficiently disclosed the
shareholders’ information.
vii) None of the sample companies have published rights of the
share holders as a part of their annual report.
viii) All sample companies are clear from any audit qualification.
ix) Adani have given information about the training to board
members. However, it is not given by other sample companies.
x) None of the sample companies have given information about
the system of Evaluation of Non Executive Directors.
xi) Adani, GMR and Tata Chemicals have given information about
the Whistle Blower Policy. However, it is not given by other
sample companies.
Hence, all companies except Adani, GMR and Tata Chemicals gets the
score of 16. Tata Chemicals and GMR gets the score of 20. Whereas
Adani gets a score of 22.
Chapter : 4 Analysis of Corporate Governance Practices
101
13. General Body Meetings
This point was about the General Body Meetings, carrying a weightage of 3.
All companies have sufficiently disclosed about the various points related to
General body meetings in the annual report. Hence, all companies get the
expected score of 3.
14. Means of communication and General shareholder information
The Fourteenth score point was disclosure about the means of communication
and general shareholder information and carries weightage of 2. All sample
companies have sufficiently disclosed about the point in the annual report.
Hence, all companies get the expected score of 2.
15. CEO / CFO Certification
The Fifteenth score point was about the certification of CEO \ CFO, carrying a
weightage of 2. It is observed that all companies have certification from CEO \
CFO. Hence, all companies get the expected score of 2.
16. Compliance of Corporate Governance and Auditors' Certificate
The Sixteenth score point was about the compliance of Corporate Governance
guidelines issued by SEBI and Auditor’s Certificate, carrying a weightage of
10. It is observed that all sample companies have clean certificate from
auditor. Hence, all companies get the expected score of 10.
17. Disclosure of Stakeholders' interests :
The Seventeenth score point was about the disclosure of the stakeholders’
interest and was assigned a weightage of 10. These points are divided equally
to the following.
i) Environment, Health & Safety Measures (EHS)
ii) Human Resource Development Initiative (HRD)
iii) Corporate Social Responsibility (CSR)
iv) Industrial Relation (IR)
v) Disclosure of policies on EHS, HRD, CSR & IR
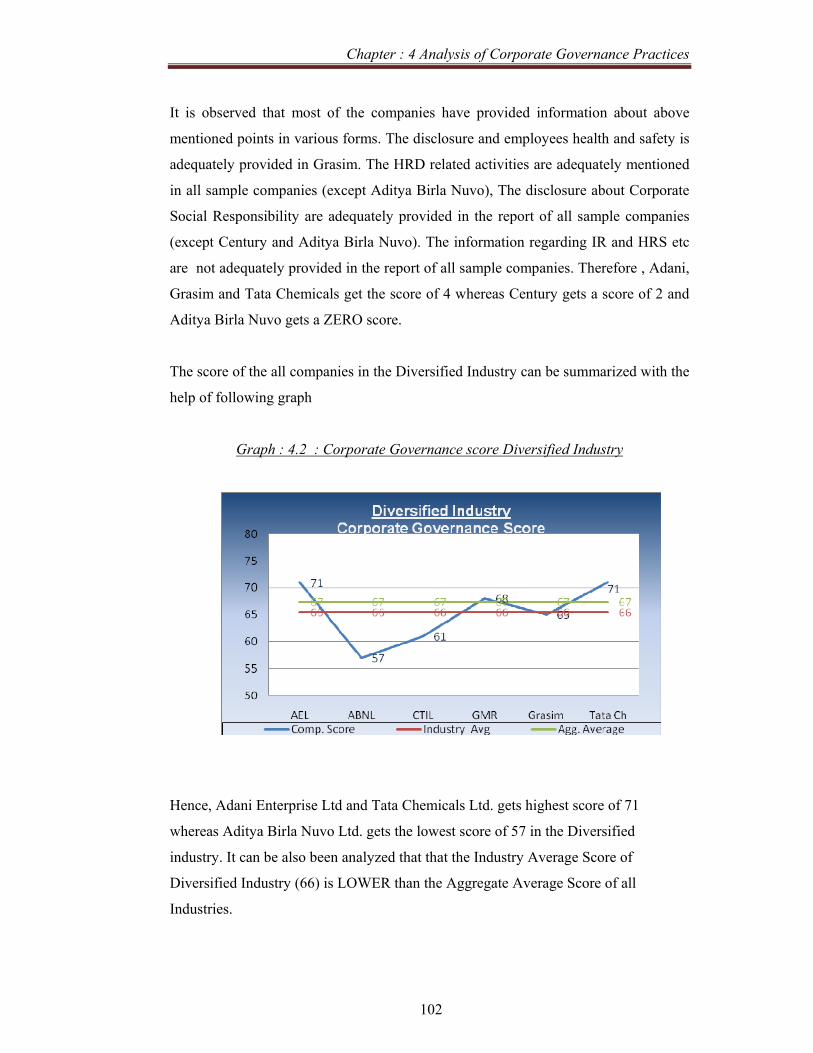
Chapter : 4 Analysis of Corporate Governance Practices
102
It is observed that most of the companies have provided information about above
mentioned points in various forms. The disclosure and employees health and safety is
adequately provided in Grasim. The HRD related activities are adequately mentioned
in all sample companies (except Aditya Birla Nuvo), The disclosure about Corporate
Social Responsibility are adequately provided in the report of all sample companies
(except Century and Aditya Birla Nuvo). The information regarding IR and HRS etc
are not adequately provided in the report of all sample companies. Therefore , Adani,
Grasim and Tata Chemicals get the score of 4 whereas Century gets a score of 2 and
Aditya Birla Nuvo gets a ZERO score.
The score of the all companies in the Diversified Industry can be summarized with the
help of following graph
Graph : 4.2 : Corporate Governance score Diversified Industry
Hence, Adani Enterprise Ltd and Tata Chemicals Ltd. gets highest score of 71
whereas Aditya Birla Nuvo Ltd. gets the lowest score of 57 in the Diversified
industry. It can be also been analyzed that that the Industry Average Score of
Diversified Industry (66) is LOWER than the Aggregate Average Score of all
Industries.
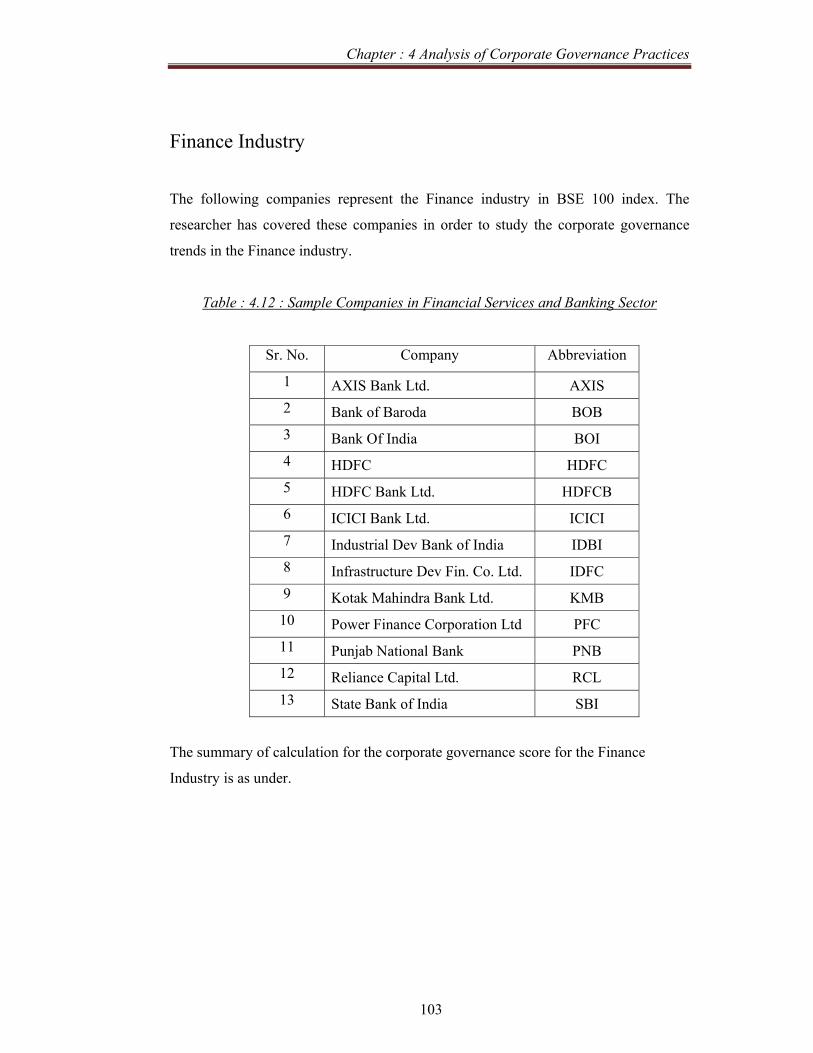
Chapter : 4 Analysis of Corporate Governance Practices
103
Finance Industry
The following companies represent the Finance industry in BSE 100 index. The
researcher has covered these companies in order to study the corporate governance
trends in the Finance industry.
Table : 4.12 : Sample Companies in Financial Services and Banking Sector
Sr. No. Company Abbreviation
1 AXIS Bank Ltd. AXIS 2 Bank of Baroda BOB 3 Bank Of India BOI 4 HDFC HDFC 5 HDFC Bank Ltd. HDFCB 6 ICICI Bank Ltd. ICICI 7 Industrial Dev Bank of India IDBI 8 Infrastructure Dev Fin. Co. Ltd. IDFC 9 Kotak Mahindra Bank Ltd. KMB 10 Power Finance Corporation Ltd PFC 11 Punjab National Bank PNB 12 Reliance Capital Ltd. RCL 13 State Bank of India SBI
The summary of calculation for the corporate governance score for the Finance
Industry is as under.

Chapter : 4 Analysis of Corporate Governance Practices
104
Table : 4.13 Corporate Governance Score for Financial Services and Banking Sector
F I N A N C E A N D R E L A T E D - 13 COMPANIES Criterion for Governance Standard Industry Average : 70 : Aggregate Average : 67
No. Governance Parameters POINTS AXIS BOB BOI HDFC
HDFC B ICICI IDBI IDFC KMB PFC PNB RCL SBI
1
Statement of Company's philosophy on code of governance 2 2 2 2 2 2 2 2 2 2 2 2 2 2
2 Structure and Strength of board 2 2 2 2 2 2 2 2 2 2 2 2 2 2
3 Chairman & CEO Duality 5 2 2 2 2 2 5 2 5 5 2 2 3 2
4
Disclosure of Tenure and Age limit of directors 2 2 2 2 2 2 2 2 2 2 2 2 2 2
5 Disclosure of : 3 0 0 0 0 0 0 0 0 0 0 0 0 0
6
Post Board meeting follow up system and compliance of the board procedures 2 0 0 0 0 2 0 0 0 0 0 0 0 0
7
Appointment of lead independent director 2 0 0 0 0 2 0 0 0 0 0 0 1 0
8
Disclosure of other provision as to the boards and committees 1 1 1 1 1 1 1 1 1 1 1 1 1 1
9 Disclosure of : 2 1 1 1 1 1 2 2 2 2 2 1 2 1 10 Code of Conduct 2 2 2 2 2 2 2 2 2 2 2 2 2 2 11 Board Committee 25 17 18 16 19 19 19 12 15 18 10 16 16 10
12 Disclosure and Transparency 25 22 22 16 18 24 24 18 18 24 20 16 22 20
13 General Body Meetings 3 3 3 3 3 3 3 3 3 3 3 3 3 3
14
Means of communication and General shareholder information 2 2 2 2 2 2 2 2 2 2 2 2 2 2
15 CEO / CFO Certification 2 2 2 2 2 2 2 2 2 2 2 2 2 2
16
Compliance of Corporate Governance and Auditors' Certificate 10 10 10 10 10 10 10 10 10 10 10 10 10 10
17
Disclosure of Stakeholders' interests : 10 2 2 2 4 4 4 0 4 4 6 4 6 2
T O T A L 100 70 71 63 70 80 80 60 70 79 66 65 76 61 Company Rank 5 4 8 5 1 1 10 5 2 6 7 3 9
Financial Services and Banking Industry- Analysis of Corporate Governance Score
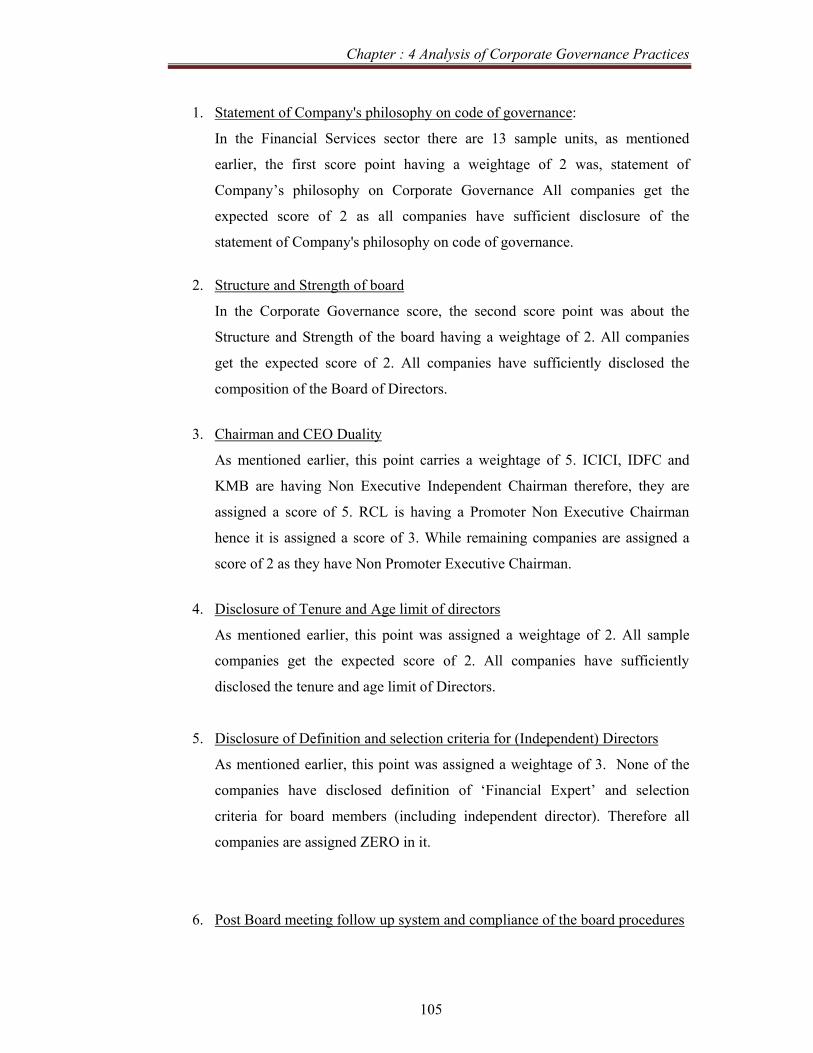
Chapter : 4 Analysis of Corporate Governance Practices
105
1. Statement of Company's philosophy on code of governance:
In the Financial Services sector there are 13 sample units, as mentioned
earlier, the first score point having a weightage of 2 was, statement of
Company’s philosophy on Corporate Governance All companies get the
expected score of 2 as all companies have sufficient disclosure of the
statement of Company's philosophy on code of governance.
2. Structure and Strength of board
In the Corporate Governance score, the second score point was about the
Structure and Strength of the board having a weightage of 2. All companies
get the expected score of 2. All companies have sufficiently disclosed the
composition of the Board of Directors.
3. Chairman and CEO Duality
As mentioned earlier, this point carries a weightage of 5. ICICI, IDFC and
KMB are having Non Executive Independent Chairman therefore, they are
assigned a score of 5. RCL is having a Promoter Non Executive Chairman
hence it is assigned a score of 3. While remaining companies are assigned a
score of 2 as they have Non Promoter Executive Chairman.
4. Disclosure of Tenure and Age limit of directors
As mentioned earlier, this point was assigned a weightage of 2. All sample
companies get the expected score of 2. All companies have sufficiently
disclosed the tenure and age limit of Directors.
5. Disclosure of Definition and selection criteria for (Independent) Directors
As mentioned earlier, this point was assigned a weightage of 3. None of the
companies have disclosed definition of ‘Financial Expert’ and selection
criteria for board members (including independent director). Therefore all
companies are assigned ZERO in it.
6. Post Board meeting follow up system and compliance of the board procedures
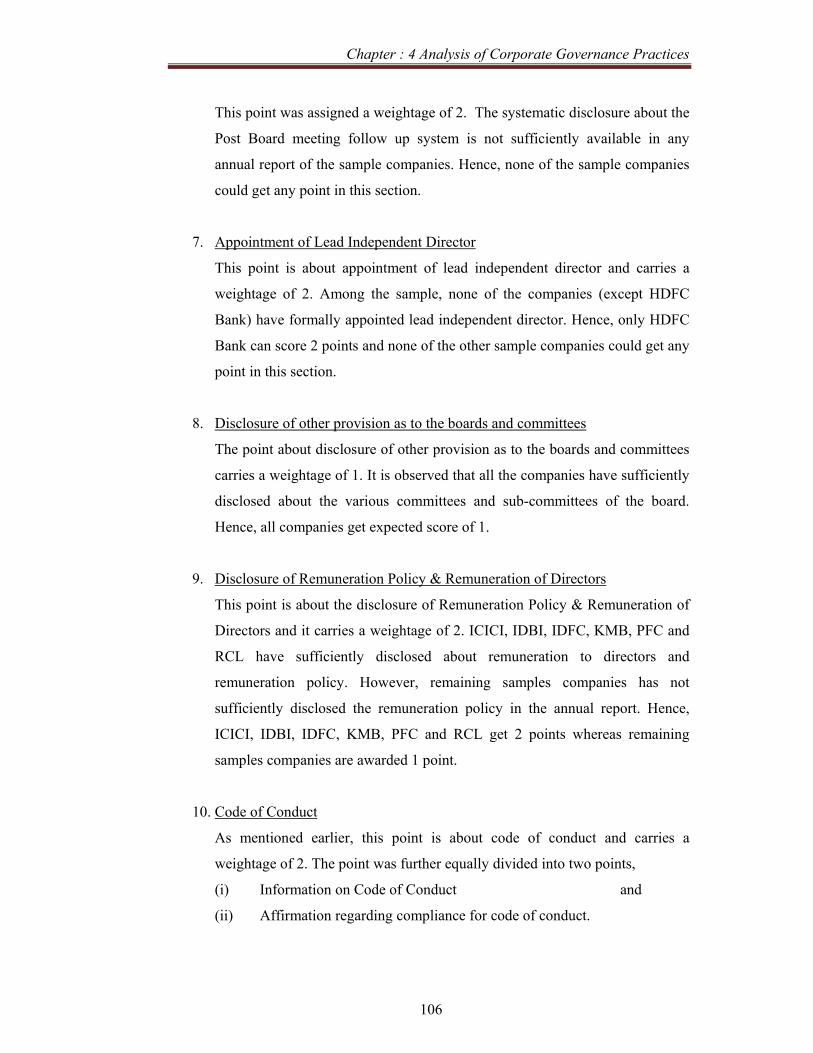
Chapter : 4 Analysis of Corporate Governance Practices
106
This point was assigned a weightage of 2. The systematic disclosure about the
Post Board meeting follow up system is not sufficiently available in any
annual report of the sample companies. Hence, none of the sample companies
could get any point in this section.
7. Appointment of Lead Independent Director
This point is about appointment of lead independent director and carries a
weightage of 2. Among the sample, none of the companies (except HDFC
Bank) have formally appointed lead independent director. Hence, only HDFC
Bank can score 2 points and none of the other sample companies could get any
point in this section.
8. Disclosure of other provision as to the boards and committees
The point about disclosure of other provision as to the boards and committees
carries a weightage of 1. It is observed that all the companies have sufficiently
disclosed about the various committees and sub-committees of the board.
Hence, all companies get expected score of 1.
9. Disclosure of Remuneration Policy & Remuneration of Directors
This point is about the disclosure of Remuneration Policy & Remuneration of
Directors and it carries a weightage of 2. ICICI, IDBI, IDFC, KMB, PFC and
RCL have sufficiently disclosed about remuneration to directors and
remuneration policy. However, remaining samples companies has not
sufficiently disclosed the remuneration policy in the annual report. Hence,
ICICI, IDBI, IDFC, KMB, PFC and RCL get 2 points whereas remaining
samples companies are awarded 1 point.
10. Code of Conduct
As mentioned earlier, this point is about code of conduct and carries a
weightage of 2. The point was further equally divided into two points,
(i) Information on Code of Conduct and
(ii) Affirmation regarding compliance for code of conduct.

Chapter : 4 Analysis of Corporate Governance Practices
107
It is observed that all the companies have sufficiently disclosed about both the
above points. Hence, all companies get expected score of 2.
11. Board Committees
In the Corporate Governance score, the eleventh point is about the various
committees of the board. The point carries a weightage of 25 on a scale of
100. The sub classification of the point is as under.
Sr. No. Particulars PointsI Audit Committee 8Ii Remuneration Committee 6Iii Shareholders' / Investors Grievance Committee 5Iv Nomination Committee 2V Other Committees 4
Total 25
a. Audit Committee
The Audit Committee is assigned a weightage of 8. It is observed that
all companies have made sufficient disclosure about the audit
committee. However, none of among the sample companies, have
published Audit Committee Report in the annual report Hence, All
companies get expected score of 7.
b. Remuneration / Compensation Committee
The Remuneration/Compensation Committee is assigned a weightage
of 6.
It is observed that all of the sample companies (except SBI & PFC)
have formed the committee. BOI and IDBI have not sufficiently
disclosed details about the committee. However, none of among the
sample companies (except HDFC) has published Remuneration
Committee Report in the annual report.
It is observed that PFC and SBI have not formed the Remuneration /
Compensation Committee.
Hence, HDFC Bank get a score of 6. AXIS, BOB, HDFCB, ICICI,
IDFC, KMB, PNB and RCL get the score of 5. BOI get a score of 3,

Chapter : 4 Analysis of Corporate Governance Practices
108
IDBI get a score of 1. However, PNB and SBI three sample
companies get the ZERO score in this section.
c. Shareholders' / Investors Grievance Committee
The Shareholders' / Investors Grievance Committee is assigned a
weightage of 5. It is observed that all the sample companies have
formed the committee. However, none of the sample companies have
published information about the investors / shareholders’ survey (if
conducted). The Report of this committee is also not published by any
of the sample companies (except HDFC).
Hence, all companies except HDFC get the score of 3. In case of
HDFC the report about committee is available it is awarded 4 points.
d. Nomination Committee
The Nomination Committee was assigned a weightage of 2. It is
observed that IDBI, IFC, PFC and SBI have not formed this
committee. Hence, they get the ZERO score. Remaining sample
companies have formed the committee but their charter and reports are
not available, hence they get a score of 1.
e. Other Committees
The formation of other committees is assigned a weightage of 4. Its
classification is already mentioned earlier.
It is observed that following Health Safety and Environment
committees are not formed by any of the sample companies.
Ethics and Compliance committee is formed by HDFCB and ICICI
bank.
Investment Committee is formed by AXIS, BOB, BOI HDFCB, ICICI,
IDBI and KMB. Share Transfer Committee is formed by BOB, BOI,
HDFCB, ICICI and KMB. Hence, HDFC, IDFC, PFC, PNB, RCL and
SBI gets ZERO score. HDFCB and ICICI gets a score of 3, BOB, BOI
and KMB gets a score of 2 and IDBI and Axis gets a score of 1.

Chapter : 4 Analysis of Corporate Governance Practices
109
12. Disclosure and Transparency
This is the point is about the various disclosure and transparency shown by the
company in the annual report. The point is assigned a weightage of 25. The
classification of the point is already mentioned earlier.
It is observed that
i) All sample companies have sufficiently disclosed about
significant related party transactions.
ii) All sample companies have adequately disclosed about Non
Compliance related to capital market matters during last three
years.
iii) All sample companies have clearly mentioned about the
accounting treatments and significant changes in their
accounting policy.
iv) All sample companies have given sufficient information about
risk management and policies of the board.
However, no sample company has published risk management
report.
v) All sample companies have published the Management
Discussion and Analysis as a part of the annual report.
vi) All sample companies have sufficiently disclosed the
shareholders’ information.
vii) HDFC, HDFCB, ICICI KMB, RCL and SBI have published
rights of the share holders as a part of their annual report.
Remaining sample companies have not published the same.
viii) All sample companies are clear from any audit qualification.
ix) Seven sample companies have given information about the
training to board members. However, it is not given by
remaining sample companies.
x) AXIS, BOB, HDFCB, ICICI and KMB have given information
about the system of Evaluation of Non Executive Directors.
Remaining players have not provided the same information.
xi) All companies except BOI, HDFC and PNB have given
information about the Whistle Blower Policy.
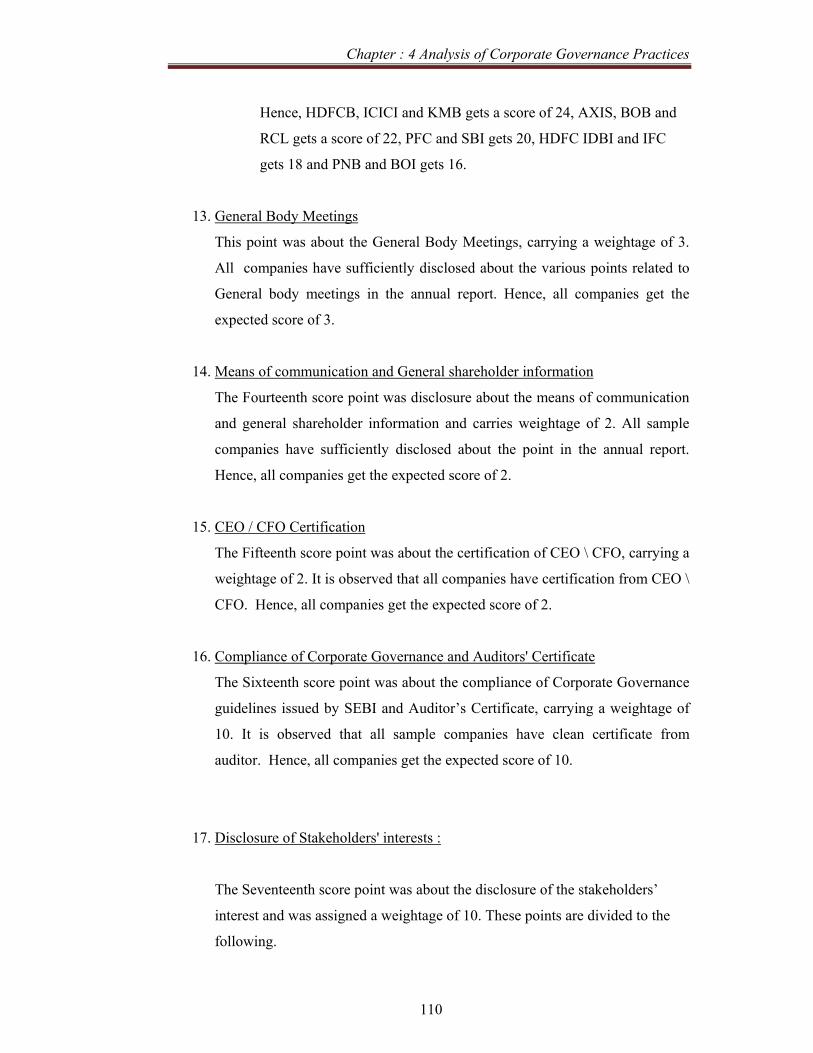
Chapter : 4 Analysis of Corporate Governance Practices
110
Hence, HDFCB, ICICI and KMB gets a score of 24, AXIS, BOB and
RCL gets a score of 22, PFC and SBI gets 20, HDFC IDBI and IFC
gets 18 and PNB and BOI gets 16.
13. General Body Meetings
This point was about the General Body Meetings, carrying a weightage of 3.
All companies have sufficiently disclosed about the various points related to
General body meetings in the annual report. Hence, all companies get the
expected score of 3.
14. Means of communication and General shareholder information
The Fourteenth score point was disclosure about the means of communication
and general shareholder information and carries weightage of 2. All sample
companies have sufficiently disclosed about the point in the annual report.
Hence, all companies get the expected score of 2.
15. CEO / CFO Certification
The Fifteenth score point was about the certification of CEO \ CFO, carrying a
weightage of 2. It is observed that all companies have certification from CEO \
CFO. Hence, all companies get the expected score of 2.
16. Compliance of Corporate Governance and Auditors' Certificate
The Sixteenth score point was about the compliance of Corporate Governance
guidelines issued by SEBI and Auditor’s Certificate, carrying a weightage of
10. It is observed that all sample companies have clean certificate from
auditor. Hence, all companies get the expected score of 10.
17. Disclosure of Stakeholders' interests :
The Seventeenth score point was about the disclosure of the stakeholders’
interest and was assigned a weightage of 10. These points are divided to the
following.

Chapter : 4 Analysis of Corporate Governance Practices
111
i) Environment, Health & Safety Measures (EHS)
ii) Human Resource Development Initiative (HRD)
iii) Corporate Social Responsibility (CSR)
iv) Industrial Relation (IR)
v) Disclosure of policies on EHS, HRD, CSR & IR
It is observed that most of the companies have provided information about above
mentioned points in various forms. The disclosure and employees health and safety is
adequately provided in PFC and RCL. The HRD related activities are adequately
mentioned in all sample companies (except IDBI), The disclosure about Corporate
Social Responsibility are adequately provided in the report of all sample companies
(except AXIS, BOB, BOI and IDBI). The information regarding IR and HRS etc are
not adequately provided in the report of all sample companies. Therefore , PFC and
RCL gets a score of 6, HDFC, HDFCB, ICICI, IDFC, KMB and PNB get the score of
4 whereas AXIS, BOB, BOI and SBI gets a score of 2 and IDBI gets a ZERO score.
The score of the all companies in the Banking and financial service industry can be
summarized with the help of following graph
Graph : 4.3 : Corporate Governance score Financial Services Industry
Hence, HDFCB, ICICI, gets highest score of 80 whereas IDBI gets the lowest score
of 60. The industry Average Score of Financial and Banking industry (70) is higher
than the Aggregate Average Score of all Industries.
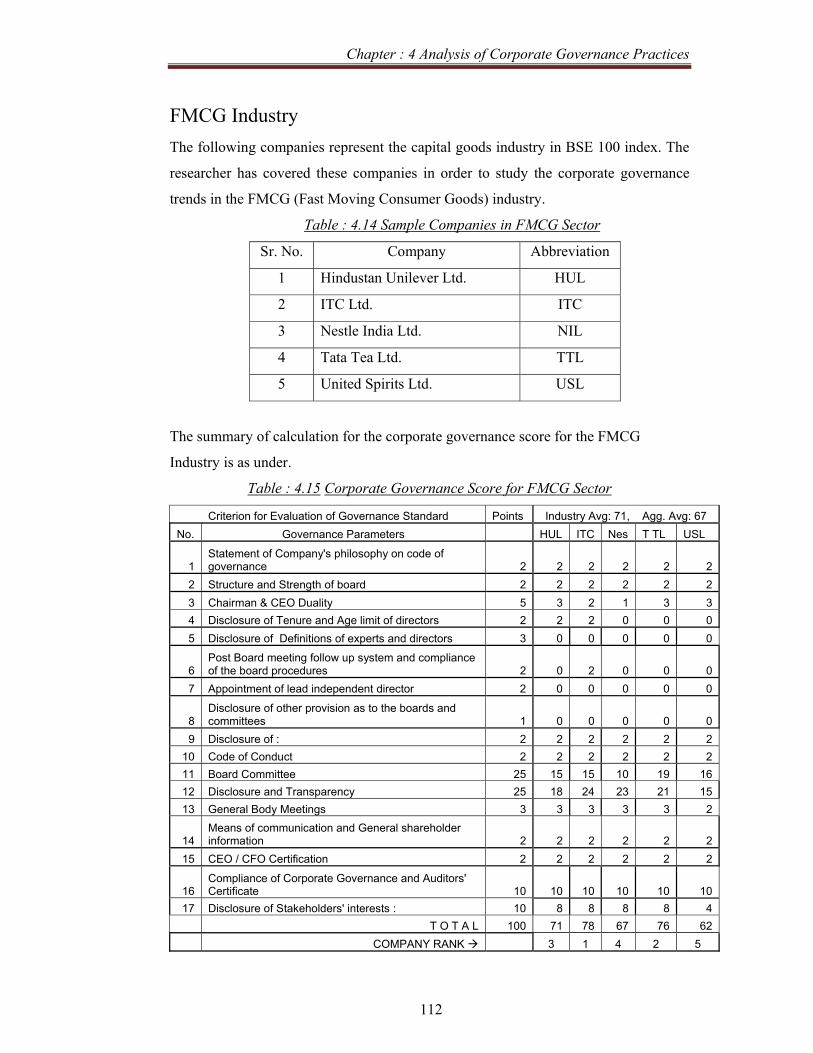
Chapter : 4 Analysis of Corporate Governance Practices
112
FMCG Industry The following companies represent the capital goods industry in BSE 100 index. The
researcher has covered these companies in order to study the corporate governance
trends in the FMCG (Fast Moving Consumer Goods) industry.
Table : 4.14 Sample Companies in FMCG Sector
Sr. No. Company Abbreviation
1 Hindustan Unilever Ltd. HUL
2 ITC Ltd. ITC
3 Nestle India Ltd. NIL
4 Tata Tea Ltd. TTL
5 United Spirits Ltd. USL
The summary of calculation for the corporate governance score for the FMCG
Industry is as under.
Table : 4.15 Corporate Governance Score for FMCG Sector
Criterion for Evaluation of Governance Standard Points Industry Avg: 71, Agg. Avg: 67 No. Governance Parameters HUL ITC Nes T TL USL
1 Statement of Company's philosophy on code of governance 2 2 2 2 2 2
2 Structure and Strength of board 2 2 2 2 2 23 Chairman & CEO Duality 5 3 2 1 3 34 Disclosure of Tenure and Age limit of directors 2 2 2 0 0 05 Disclosure of Definitions of experts and directors 3 0 0 0 0 0
6 Post Board meeting follow up system and compliance of the board procedures 2 0 2 0 0 0
7 Appointment of lead independent director 2 0 0 0 0 0
8 Disclosure of other provision as to the boards and committees 1 0 0 0 0 0
9 Disclosure of : 2 2 2 2 2 2 10 Code of Conduct 2 2 2 2 2 2 11 Board Committee 25 15 15 10 19 16 12 Disclosure and Transparency 25 18 24 23 21 1513 General Body Meetings 3 3 3 3 3 2
14 Means of communication and General shareholder information 2 2 2 2 2 2
15 CEO / CFO Certification 2 2 2 2 2 2
16 Compliance of Corporate Governance and Auditors' Certificate 10 10 10 10 10 10
17 Disclosure of Stakeholders' interests : 10 8 8 8 8 4 T O T A L 100 71 78 67 76 62
COMPANY RANK 3 1 4 2 5
Chapter : 4 Analysis of Corporate Governance Practices
113
FMCG Sector - Analysis of Corporate Governance Score
1. Statement of Company's philosophy on code of governance:
In the FMCG sector there are 5 sample units, as mentioned earlier, the first
score point having a weightage of 2 was, statement of Company’s philosophy
on Corporate Governance All companies get the expected score of 2 as all
companies have sufficient disclosure of the statement of Company's
philosophy on code of governance.
2. Structure and Strength of board
In the Corporate Governance score, the second score point was about the
Structure and Strength of the board having a weightage of 2. All companies
get the expected score of 2. All companies have sufficiently disclosed the
composition of the Board of Directors.
3. Chairman and CEO Duality
As mentioned earlier, this point carries a weightage of 5. No company among
this sample is assigned a score of 5 as no company is having Non Executive
Independent Chairman. However, TTL, HUL and USL have Promoter Non
Executive Chairman hence are assigned a score of 3. While ITC have
promoter Executive Chairman and is assigned a score of 2. Whereas Nestle
have Promoter Executive Chairman and is assigned a score of 1.
4. Disclosure of Tenure and Age limit of directors
As mentioned earlier, this point was assigned a weightage of 2. HUL and ITC
get the expected score of 2. The Remaining samples companies have not
sufficiently disclosed the tenure and age limit of Directors hence, they get a
ZERO in it.
5. Disclosure of Definition and selection criteria for (Independent) Directors
As mentioned earlier, this point was assigned a weightage of 3. None of the
companies have disclosed definition of ‘Financial Expert’ and selection
criteria for board members (including independent director).
Chapter : 4 Analysis of Corporate Governance Practices
114
6. Post Board meeting follow up system and compliance of the board procedures
This point was assigned a weightage of 2. The systematic disclosure about the
Post Board meeting follow up system is not sufficiently available in any
annual report of the sample companies (Except ITC). Hence, ITC gets a score
of 2 where as other sample companies could get any point in this section.
7. Appointment of Lead Independent Director
This point is about appointment of lead independent director and carries a
weightage of 2. Among the sample, none of the companies have formally
appointed lead independent director. Hence, none of the sample companies
could get any point in this section.
8. Disclosure of other provision as to the boards and committees
The point about disclosure of other provision as to the boards and committees
carries a weightage of 1. It is observed that none of the companies have
sufficiently disclosed about the various committees and sub-committees of the
board. Hence, all companies do not get expected score of 1.
9. Disclosure of Remuneration Policy & Remuneration of Directors
This point is about the disclosure of Remuneration Policy & Remuneration of
Directors and it carries a weightage of 2. All companies have sufficiently
disclosed about remuneration to directors and remuneration policy. Hence, all
companies get 2 points.
10. Code of Conduct
As mentioned earlier, this point is about code of conduct and carries a
weightage of 2. The point was further equally divided into two points,
(i) Information on Code of Conduct and
(ii) Affirmation regarding compliance for code of conduct.
It is observed that all the companies have sufficiently disclosed about both the
above points. Hence, all companies get expected score of 2.
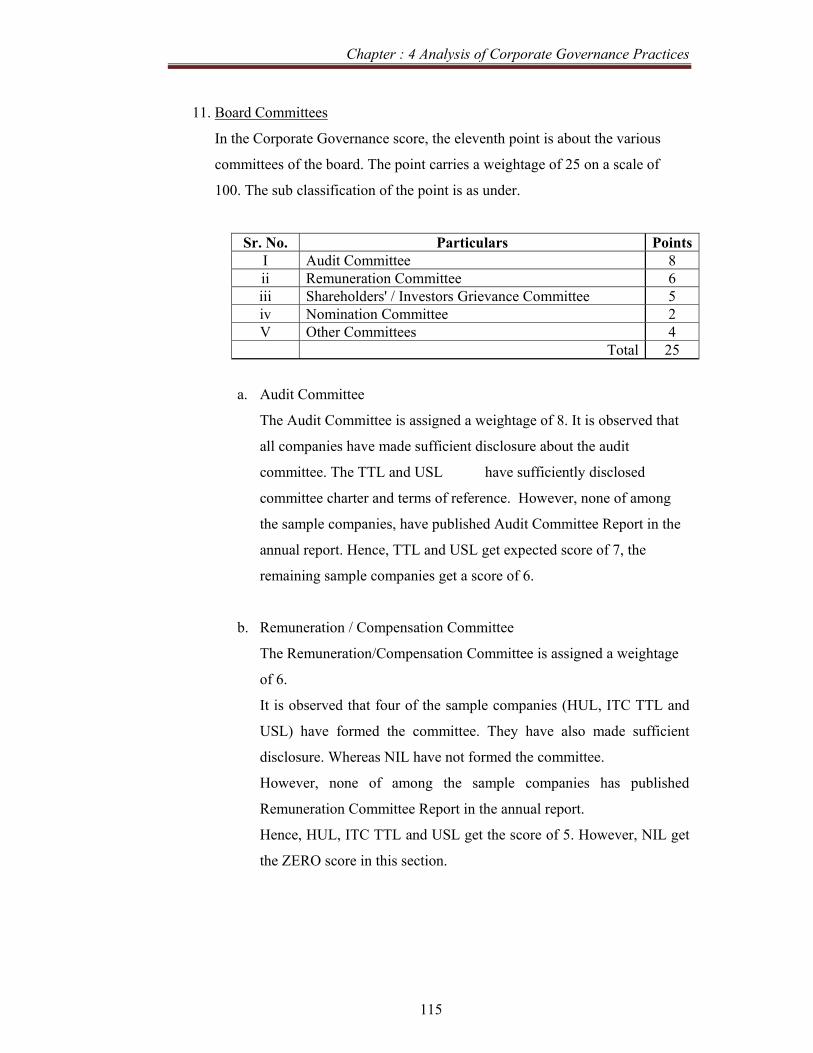
Chapter : 4 Analysis of Corporate Governance Practices
115
11. Board Committees
In the Corporate Governance score, the eleventh point is about the various
committees of the board. The point carries a weightage of 25 on a scale of
100. The sub classification of the point is as under.
Sr. No. Particulars PointsI Audit Committee 8 ii Remuneration Committee 6 iii Shareholders' / Investors Grievance Committee 5 iv Nomination Committee 2 V Other Committees 4
Total 25
a. Audit Committee
The Audit Committee is assigned a weightage of 8. It is observed that
all companies have made sufficient disclosure about the audit
committee. The TTL and USL have sufficiently disclosed
committee charter and terms of reference. However, none of among
the sample companies, have published Audit Committee Report in the
annual report. Hence, TTL and USL get expected score of 7, the
remaining sample companies get a score of 6.
b. Remuneration / Compensation Committee
The Remuneration/Compensation Committee is assigned a weightage
of 6.
It is observed that four of the sample companies (HUL, ITC TTL and
USL) have formed the committee. They have also made sufficient
disclosure. Whereas NIL have not formed the committee.
However, none of among the sample companies has published
Remuneration Committee Report in the annual report.
Hence, HUL, ITC TTL and USL get the score of 5. However, NIL get
the ZERO score in this section.

Chapter : 4 Analysis of Corporate Governance Practices
116
c. Shareholders' / Investors Grievance Committee
The Shareholders' / Investors Grievance Committee is assigned a
weightage of 5. It is observed that all the sample companies have
formed the committee. However, none of the sample companies have
published information about the investors / shareholders’ survey (if
conducted). The Report of this committee is also not published by any
of the sample companies.
Hence, all companies except Century get the score of 3.
d. Nomination Committee
The Nomination Committee was assigned a weightage of 2. It is
observed that none of the sample companies (except TTL have formed
this committee). Hence, all companies (except TTL) get the ZERO
score. Whereas TTL gets a score of 2.
e. Other Committees
The formation of other committees is assigned a weightage of 4. Its
classification is already mentioned earlier.
It is observed that following committees are not formed by any of the
sample companies.
i) Health , Safety and Environment and,
ii) Investment Committee
However, Share Transfer Committee is formed by all sample
companies. Ethics and Compliance committee is formed by TTL.
Hence, all companies except TTL gets a score of 1 whereas TTL gets a
score of 2.
12. Disclosure and Transparency
This is the point is about the various disclosure and transparency shown by the
company in the annual report. The point is assigned a weightage of 25. The
classification of the point is already mentioned earlier.
Chapter : 4 Analysis of Corporate Governance Practices
117
It is observed that
i) All sample companies have sufficiently disclosed about
significant related party transactions.
ii) All sample companies have adequately disclosed about Non
Compliance related to capital market matters during last three
years.
iii) All sample companies have clearly mentioned about the
accounting treatments and significant changes in their
accounting policy.
iv) All sample companies have given sufficient information about
risk management and policies of the board.
However, no sample company has published risk management
report.
v) All sample companies have published the Management
Discussion and Analysis as a part of the annual report.
vi) All sample companies have sufficiently disclosed the
shareholders’ information.
vii) All the sample companies have published rights of the share
holders as a part of their annual report.
viii) All sample companies (except HUL and USL) are clear from
any audit qualification.
ix) ITC and NIL have given information about the training to
board members. However, it is not given by other sample
companies.
x) ITC and NIL have systematically informed about evaluation of
Non Executive Director, HUL and TTL have partially disclosed
about the system of Evaluation of Non Executive Directors.
Whereas USL have not disclosed about it.
xi) HUL, ITC, NIL and TTL have given information about the
Whistle Blower Policy. However, it is not given by other
sample companies.
Chapter : 4 Analysis of Corporate Governance Practices
118
Hence, ITC gets a highest score of 24, NIL gets a score of 23, TTL
gets a score of 21, HUL gets a score of 15 and USL gets a lowest score
of 15.
13. General Body Meetings
This point was about the General Body Meetings, carrying a weightage of 3.
All companies (except USL) have sufficiently disclosed about the various
points related to General body meetings in the annual report. Hence, USL gets
a score of 2, whereas remaining sample companies get the expected score of 3.
14. Means of communication and General shareholder information
The Fourteenth score point was disclosure about the means of communication
and general shareholder information and carries weightage of 2. All sample
companies have sufficiently disclosed about the point in the annual report.
Hence, all companies get the expected score of 2.
15. CEO / CFO Certification
The Fifteenth score point was about the certification of CEO \ CFO, carrying a
weightage of 2. It is observed that all companies have certification from CEO \
CFO. Hence, all companies get the expected score of 2.
16. Compliance of Corporate Governance and Auditors' Certificate
The Sixteenth score point was about the compliance of Corporate Governance
guidelines issued by SEBI and Auditor’s Certificate, carrying a weightage of
10. It is observed that all sample companies have clean certificate from
auditor. Hence, all companies get the expected score of 10.
17. Disclosure of Stakeholders' interests :
The Seventeenth score point was about the disclosure of the stakeholders’
interest and was assigned a weightage of 10. These points are divided equally
to the following.
i) Environment, Health & Safety Measures (EHS)
ii) Human Resource Development Initiative (HRD)

Chapter : 4 Analysis of Corporate Governance Practices
119
iii) Corporate Social Responsibility (CSR)
iv) Industrial Relation (IR)
v) Disclosure of policies on EHS, HRD, CSR & IR
It is observed that most of the companies have provided information about above
mentioned points in various forms. EHS, HRD, CSR & IR policies are not disclosed
adequately in the report of any sample companies. All sample companies (except
USL) have sufficiently provided details about CSR and IR. Whereas EHS and HRD
related activities are adequately mentioned in all sample companies. Therefore, HUL,
ITC NIL and TTL gets the score of 8 whereas USL gets a score of 4.
The score of the all companies in the Diversified Industry can be summarized with the
help of following graph
Graph : 4.4 : Corporate Governance score FMCG Industry
Hence, ITC gets highest score of 78 whereas USL gets the lowest score of 62. The
Industry Average Score of FMCG Industry (71) is higher than the Aggregate Average
Score of all Industries.

Chapter : 4 Analysis of Corporate Governance Practices
120
Healthcare Industry
The following companies represent the Healthcare industry in BSE 100 index. The
researcher has covered these companies in order to study the corporate governance
trends in the Healthcare industry.
Table : 4.16 Sample Companies in Healthcare Sector
Sr. No. Company Abbreviation
1 Cipla Ltd. CIL 2 Divi's Laboratories Ltd. DLL 3 Dr Reddy's Laboratories Ltd. DRL 4 GlaxoSmithKline Pharmaceuticals Ltd. GSK 5 Glenmark Pharmaceuticals Ltd. GPL 6 Ranbaxy Laboratories Ltd. RLL 7 Sun Pharmaceutical Inds Ltd. SPL
The calculation of the corporate governance score for the Healthcare Industry is as
under.
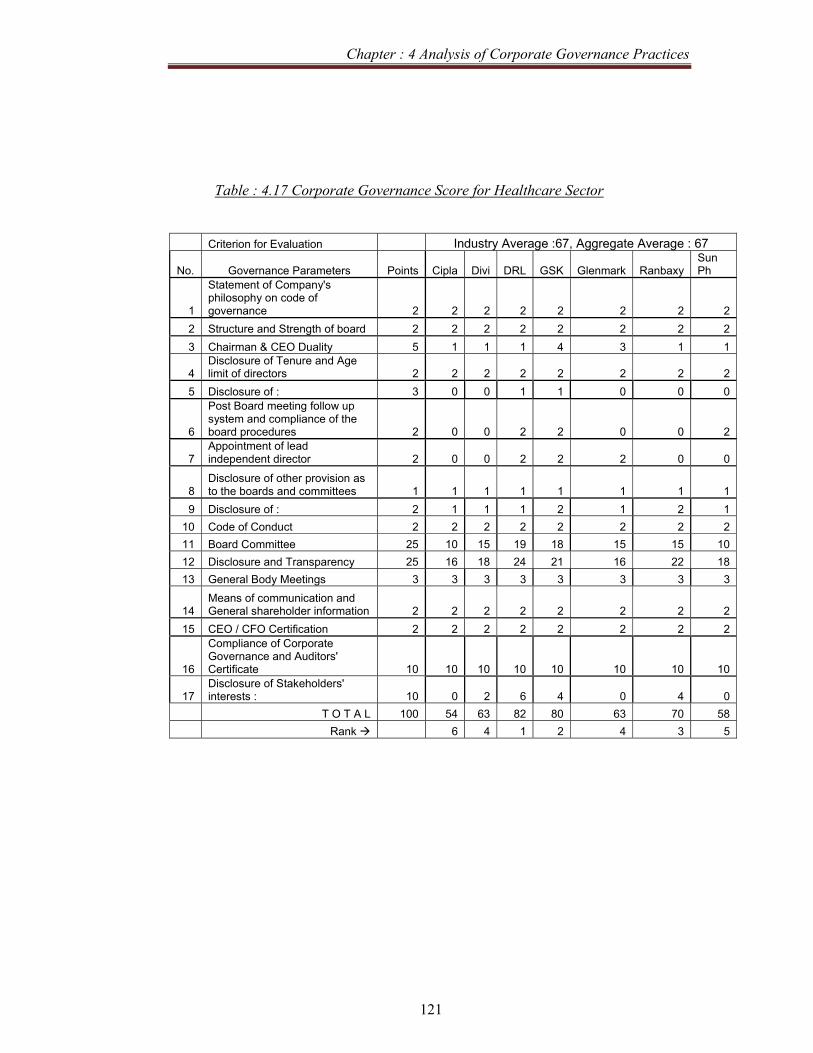
Chapter : 4 Analysis of Corporate Governance Practices
121
Table : 4.17 Corporate Governance Score for Healthcare Sector
Criterion for Evaluation Industry Average :67, Aggregate Average : 67
No. Governance Parameters Points Cipla Divi DRL GSK Glenmark Ranbaxy Sun Ph
1
Statement of Company's philosophy on code of governance 2 2 2 2 2 2 2 2
2 Structure and Strength of board 2 2 2 2 2 2 2 2 3 Chairman & CEO Duality 5 1 1 1 4 3 1 1
4 Disclosure of Tenure and Age limit of directors 2 2 2 2 2 2 2 2
5 Disclosure of : 3 0 0 1 1 0 0 0
6
Post Board meeting follow up system and compliance of the board procedures 2 0 0 2 2 0 0 2
7 Appointment of lead independent director 2 0 0 2 2 2 0 0
8 Disclosure of other provision as to the boards and committees 1 1 1 1 1 1 1 1
9 Disclosure of : 2 1 1 1 2 1 2 1 10 Code of Conduct 2 2 2 2 2 2 2 2 11 Board Committee 25 10 15 19 18 15 15 10 12 Disclosure and Transparency 25 16 18 24 21 16 22 18 13 General Body Meetings 3 3 3 3 3 3 3 3
14 Means of communication and General shareholder information 2 2 2 2 2 2 2 2
15 CEO / CFO Certification 2 2 2 2 2 2 2 2
16
Compliance of Corporate Governance and Auditors' Certificate 10 10 10 10 10 10 10 10
17 Disclosure of Stakeholders' interests : 10 0 2 6 4 0 4 0
T O T A L 100 54 63 82 80 63 70 58 Rank 6 4 1 2 4 3 5

Chapter : 4 Analysis of Corporate Governance Practices
122
Healthcare Industry - Analysis of Corporate Governance Score
1. Statement of Company's philosophy on code of governance:
In the Healthcare sector there are 7 sample units, as mentioned earlier, the first
score point having a weightage of 2 was, statement of Company’s philosophy
on Corporate Governance All companies get the expected score of 2 as all
companies have sufficient disclosure of the statement of Company's
philosophy on code of governance.
2. Structure and Strength of board
In the Corporate Governance score, the second score point was about the
Structure and Strength of the board having a weightage of 2. All companies
get the expected score of 2. All companies have sufficiently disclosed the
composition of the Board of Directors.
3. Chairman and CEO Duality
As mentioned earlier, this point carries a weightage of 5. No company among
this sample is assigned a score of 5 as no company is having Non Executive
Independent Chairman. GSK have Non Promoter Non Executive Chairman
hence it is assigned a score of 4. GPL have Promoter Non Executive Chairman
hence it is assigned a score of 3. However, remaining all sample companies
are having Promoter Executive Chairman hence, they are assigned a score of
1.
4. Disclosure of Tenure and Age limit of directors
As mentioned earlier, this point was assigned a weightage of 2. All sample
companies get the expected score of 2.
5. Disclosure of Definition and selection criteria for (Independent) Directors
As mentioned earlier, this point was assigned a weightage of 3. GSK and
DRL have disclosed selection criteria for independent directors. However,
none of the sample companies have disclosed definition of ‘Financial Expert’
Chapter : 4 Analysis of Corporate Governance Practices
123
and selection criteria for board members (including independent director).
Hence, GSK and DRL are assigned a score of 1 where as other sample
companies get Zero.
6. Post Board meeting follow up system and compliance of the board procedures
This point was assigned a weightage of 2. The systematic disclosure about the
Post Board meeting follow up system is not sufficiently available in any
annual report of the sample companies (Except DRL, GSK and SPL). Hence,
this three sample companies get a score of 2 where as other sample companies
could get any point in this section.
7. Appointment of Lead Independent Director
This point is about appointment of lead independent director and carries a
weightage of 2. Among the sample, three companies, DRL, GSK and GPL
have formally appointed lead independent director. Hence, these three
companies get expected score of 2 where as other sample companies could not
get any point in this section.
8. Disclosure of other provision as to the boards and committees
The point about disclosure of other provision as to the boards and committees
carries a weightage of 1. It is observed that all of the companies have
sufficiently disclosed about the various committees and sub-committees of the
board. Hence, all companies get expected score of 1.
9. Disclosure of Remuneration Policy & Remuneration of Directors
This point is about the disclosure of Remuneration Policy & Remuneration of
Directors and it carries a weightage of 2. All companies have sufficiently
disclosed about remuneration to directors. However, remuneration policy is
sufficiently disclosed in GSK and RLL. Hence, these two companies get a
score of 2. Other sample companies get an expected score of 1 point.

Chapter : 4 Analysis of Corporate Governance Practices
124
10. Code of Conduct
As mentioned earlier, this point is about code of conduct and carries a
weightage of 2. The point was further equally divided into two points,
(i) Information on Code of Conduct and
(ii) Affirmation regarding compliance for code of conduct.
It is observed that all the companies have sufficiently disclosed about both the
above points. Hence, all companies get expected score of 2.
11. Board Committees
In the Corporate Governance score, the eleventh point is about the various
committees of the board. The point carries a weightage of 25 on a scale of
100. The sub classification of the point is as under.
Sr. No. Particulars PointsI Audit Committee 8 ii Remuneration Committee 6 iii Shareholders' / Investors Grievance Committee 5 iv Nomination Committee 2 V Other Committees 4
Total 25
a. Audit Committee
The Audit Committee is assigned a weightage of 8. It is observed that
all companies have made sufficient disclosure about the audit
committee. All sample companies have sufficiently disclosed
committee charter and terms of reference. However, two companies,
DRL and GSK, have published Audit Committee Report in the annual
report. Hence, DRL and GSK get expected score of 7, the remaining
sample companies get a score of 6.
b. Remuneration / Compensation Committee
The Remuneration/Compensation Committee is assigned a weightage
of 6.
It is observed that all companies (except Cipla and Sun Pharma) the
have formed the committee. They have also made sufficient disclosure.
Chapter : 4 Analysis of Corporate Governance Practices
125
DRL and GSK have published Remuneration Committee Report in the
annual report.
Hence, DLL, GPL and RLL get the score of 5. However, DRL and
GSK get the score of 7. Whereas Cipla and Sun Pharma gets Zero in
this section.
c. Shareholders' / Investors Grievance Committee
The Shareholders' / Investors Grievance Committee is assigned a
weightage of 5. It is observed that all the sample companies (except
GSK) have formed the committee. However, none of the sample
companies have published information about the investors /
shareholders’ survey (if conducted). The Report of this committee is
also not published by any of the sample companies.
Hence, all companies except GSK get the score of 3.
d. Nomination Committee
The Nomination Committee was assigned a weightage of 2. It is
observed that none of the sample companies (except GSK have formed
this committee). Hence, all companies (except GSK) get the ZERO
score. Whereas GSK gets a score of 2.
e. Other Committees
The formation of other committees is assigned a weightage of 4. Its
classification is already mentioned earlier.
It is observed that following committees are not formed by any of the
sample companies.
i) Health , Safety and Environment and,
ii) Share Transfer Committee
However, Ethics and Compliance Committee and Investment
Committee are formed by two sample companies, DRL and GSK.
Hence, all companies except DRL and GSK gets a score of 2 whereas
Zero to others.

Chapter : 4 Analysis of Corporate Governance Practices
126
12. Disclosure and Transparency
This is the point is about the various disclosure and transparency shown by the
company in the annual report. The point is assigned a weightage of 25. The
classification of the point is already mentioned earlier.
It is observed that
i) All sample companies have sufficiently disclosed about
significant related party transactions.
ii) All sample companies have adequately disclosed about Non
Compliance related to capital market matters during last three
years.
iii) All sample companies have clearly mentioned about the
accounting treatments and significant changes in their
accounting policy.
iv) All sample companies have given sufficient information about
risk management and policies of the board.
However, no sample company (Except GSK) has published risk
management report.
v) All sample companies have published the Management
Discussion and Analysis as a part of the annual report.
vi) All sample companies have sufficiently disclosed the
shareholders’ information.
vii) DRL RLL and SPL have published rights of the share holders
as a part of their annual report whereas other players have not
done it.
viii) All sample companies are clear from any audit qualification.
ix) DRL and GSK have given information about the training to
board members. However, it is not given by other sample
companies.
x) DLL, DRL and RLL have systematically informed about
evaluation of Non Executive Director, Whereas other
companies have not disclosed about it.
Chapter : 4 Analysis of Corporate Governance Practices
127
xi) DLL, DRL & RLL have given information about the Whistle
Blower Policy. However, it is not given by other sample
companies.
Hence, DRL gets a highest score of 24, RLL gets a score of 22, GSK
gets a score of 21, SPL and DLL gets a score of 18 and Cipla and
Glenmark gets a lowest score of 16.
13. General Body Meetings
This point was about the General Body Meetings, carrying a weightage of 3.
All companies have sufficiently disclosed about the various points related to
General body meetings in the annual report. Hence, all sample companies get
the expected score of 3.
14. Means of communication and General shareholder information
The Fourteenth score point was disclosure about the means of communication
and general shareholder information and carries weightage of 2. All sample
companies have sufficiently disclosed about the point in the annual report.
Hence, all companies get the expected score of 2.
15. CEO / CFO Certification
The Fifteenth score point was about the certification of CEO \ CFO, carrying a
weightage of 2. It is observed that all companies have certification from CEO \
CFO. Hence, all companies get the expected score of 2.
16. Compliance of Corporate Governance and Auditors' Certificate
The Sixteenth score point was about the compliance of Corporate Governance
guidelines issued by SEBI and Auditor’s Certificate, carrying a weightage of
10. It is observed that all sample companies have clean certificate from
auditor. Hence, all companies get the expected score of 10.
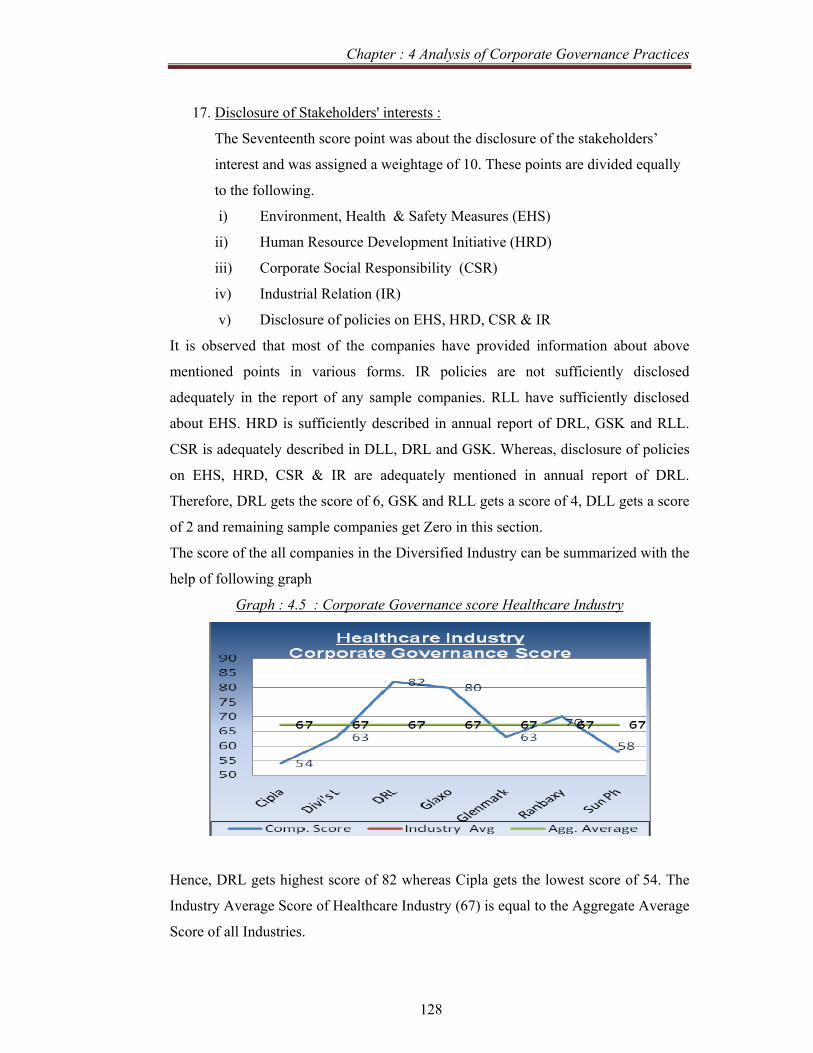
Chapter : 4 Analysis of Corporate Governance Practices
128
17. Disclosure of Stakeholders' interests :
The Seventeenth score point was about the disclosure of the stakeholders’
interest and was assigned a weightage of 10. These points are divided equally
to the following.
i) Environment, Health & Safety Measures (EHS)
ii) Human Resource Development Initiative (HRD)
iii) Corporate Social Responsibility (CSR)
iv) Industrial Relation (IR)
v) Disclosure of policies on EHS, HRD, CSR & IR
It is observed that most of the companies have provided information about above
mentioned points in various forms. IR policies are not sufficiently disclosed
adequately in the report of any sample companies. RLL have sufficiently disclosed
about EHS. HRD is sufficiently described in annual report of DRL, GSK and RLL.
CSR is adequately described in DLL, DRL and GSK. Whereas, disclosure of policies
on EHS, HRD, CSR & IR are adequately mentioned in annual report of DRL.
Therefore, DRL gets the score of 6, GSK and RLL gets a score of 4, DLL gets a score
of 2 and remaining sample companies get Zero in this section.
The score of the all companies in the Diversified Industry can be summarized with the
help of following graph
Graph : 4.5 : Corporate Governance score Healthcare Industry
Hence, DRL gets highest score of 82 whereas Cipla gets the lowest score of 54. The
Industry Average Score of Healthcare Industry (67) is equal to the Aggregate Average
Score of all Industries.

Chapter : 4 Analysis of Corporate Governance Practices
129
Housing Related Industry The following companies represent the Housing Related industry in BSE 100 index.
The researcher has covered these companies in order to study the corporate
governance trends in the Housing Related industry.
Table : 4.18 Sample Companies in Housing Related Sector
Sr. No. Company Abbreviation
1 ACC Ltd. ACC 2 Ambuja Cements Ltd. ACL 3 DLF Ltd. DLF 4 India Cements Ltd. ICL 5 IVRCL Infra & Projects Ltd. IIL 6 Jaiprakash Associates Ltd. JAL 7 Ultratech cement limited UCL 8 Unitech Ltd. UNL
The calculation of the corporate governance score for the Housing Related
Industry is as under.
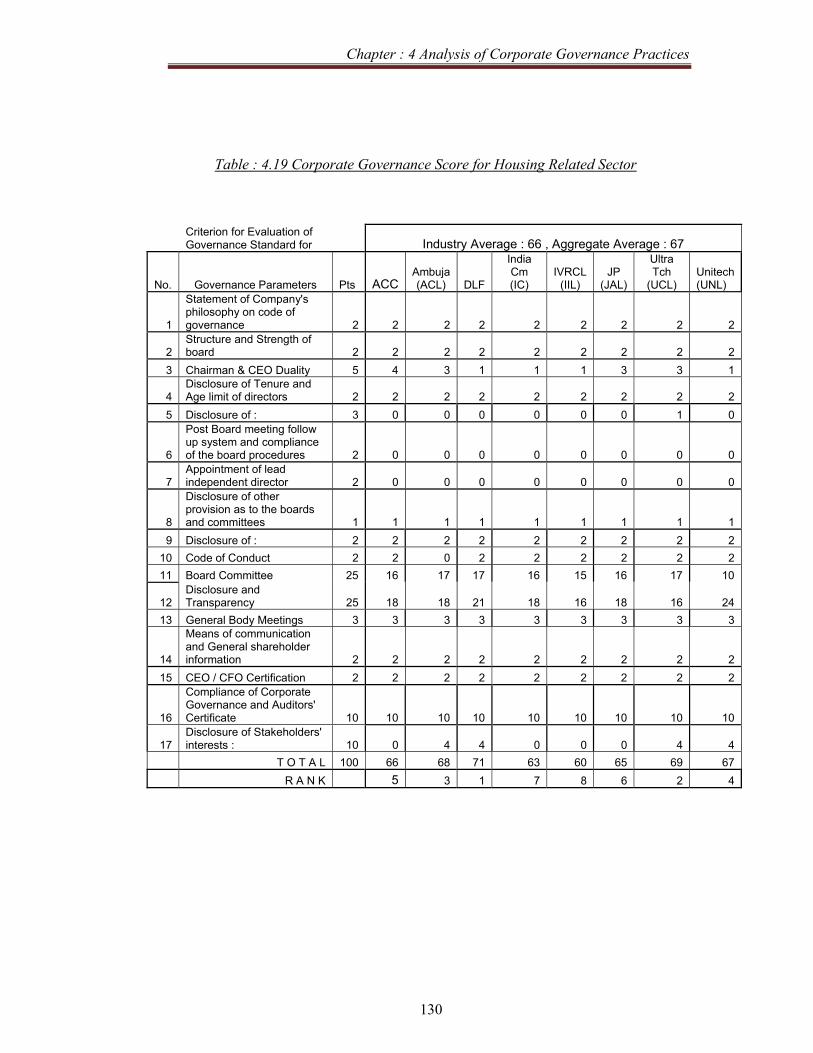
Chapter : 4 Analysis of Corporate Governance Practices
130
Table : 4.19 Corporate Governance Score for Housing Related Sector
Criterion for Evaluation of Governance Standard for Industry Average : 66 , Aggregate Average : 67
No. Governance Parameters Pts ACCAmbuja (ACL) DLF
India Cm (IC)
IVRCL (IIL)
JP (JAL)
Ultra Tch
(UCL) Unitech (UNL)
1
Statement of Company's philosophy on code of governance 2 2 2 2 2 2 2 2 2
2 Structure and Strength of board 2 2 2 2 2 2 2 2 2
3 Chairman & CEO Duality 5 4 3 1 1 1 3 3 1
4 Disclosure of Tenure and Age limit of directors 2 2 2 2 2 2 2 2 2
5 Disclosure of : 3 0 0 0 0 0 0 1 0
6
Post Board meeting follow up system and compliance of the board procedures 2 0 0 0 0 0 0 0 0
7 Appointment of lead independent director 2 0 0 0 0 0 0 0 0
8
Disclosure of other provision as to the boards and committees 1 1 1 1 1 1 1 1 1
9 Disclosure of : 2 2 2 2 2 2 2 2 2 10 Code of Conduct 2 2 0 2 2 2 2 2 2 11 Board Committee 25 16 17 17 16 15 16 17 10
12 Disclosure and Transparency 25 18 18 21 18 16 18 16 24
13 General Body Meetings 3 3 3 3 3 3 3 3 3
14
Means of communication and General shareholder information 2 2 2 2 2 2 2 2 2
15 CEO / CFO Certification 2 2 2 2 2 2 2 2 2
16
Compliance of Corporate Governance and Auditors' Certificate 10 10 10 10 10 10 10 10 10
17 Disclosure of Stakeholders' interests : 10 0 4 4 0 0 0 4 4
T O T A L 100 66 68 71 63 60 65 69 67 R A N K 5 3 1 7 8 6 2 4
Chapter : 4 Analysis of Corporate Governance Practices
131
Housing Related Industry - Analysis of Corporate Governance Score
1. Statement of Company's philosophy on code of governance:
In the Housing related sector, there are 8 sample units, as mentioned earlier,
the first score point having a weightage of 2 was, statement of Company’s
philosophy on Corporate Governance All companies get the expected score of
2 as all companies have sufficient disclosure of the statement of Company's
philosophy on code of governance.
2. Structure and Strength of board
In the Corporate Governance score, the second score point was about the
Structure and Strength of the board having a weightage of 2. All companies
get the expected score of 2. All companies have sufficiently disclosed the
composition of the Board of Directors.
3. Chairman and CEO Duality
As mentioned earlier, this point carries a weightage of 5. No company among
this sample is assigned a score of 5 as no company is having Non Executive
Independent Chairman. ACC have Non Promoter Non Executive Chairman
hence it is assigned a score of 4. ACL, JAL and UPL have Promoter Non
Executive Chairman hence it is assigned a score of 3. However, remaining all
sample companies are having Promoter Executive Chairman hence, they are
assigned a score of 1.
4. Disclosure of Tenure and Age limit of directors
As mentioned earlier, this point was assigned a weightage of 2. All sample
companies get the expected score of 2.
5. Disclosure of Definition and selection criteria for (Independent) Directors
As mentioned earlier, this point was assigned a weightage of 3. UCL have
defined the definition of independent directors. However, none of the sample
companies have disclosed definition of ‘Financial Expert’ and selection
criteria for board members (including independent director). Hence, UCL is
assigned a score of 1 where as other sample companies get Zero.

Chapter : 4 Analysis of Corporate Governance Practices
132
6. Post Board meeting follow up system and compliance of the board procedures
This point was assigned a weightage of 2. The systematic disclosure about the
Post Board meeting follow up system is not sufficiently available in any
annual report of the sample companies. Hence, no company could get any
point in this section.
7. Appointment of Lead Independent Director
This point is about appointment of lead independent director and carries a
weightage of 2. Among the sample, no company has formally appointed lead
independent director. Hence, none of the sample companies could not get any
point in this section.
8. Disclosure of other provision as to the boards and committees
The point about disclosure of other provision as to the boards and committees
carries a weightage of 1. It is observed that all of the companies have
sufficiently disclosed about the various committees and sub-committees of the
board. Hence, all companies get expected score of 1.
9. Disclosure of Remuneration Policy & Remuneration of Directors
This point is about the disclosure of Remuneration Policy & Remuneration of
Directors and it carries a weightage of 2. All companies have sufficiently
disclosed about remuneration to directors and remuneration policy. Hence,
these sample companies get a score of 2.
10. Code of Conduct
As mentioned earlier, this point is about code of conduct and carries a
weightage of 2. The point was further equally divided into two points,
(i) Information on Code of Conduct and
(ii) Affirmation regarding compliance for code of conduct.
It is observed that all the companies (except ACL) have sufficiently disclosed
about both the above points. Hence, all companies get expected score of 2
whereas ACL gets Zero score.
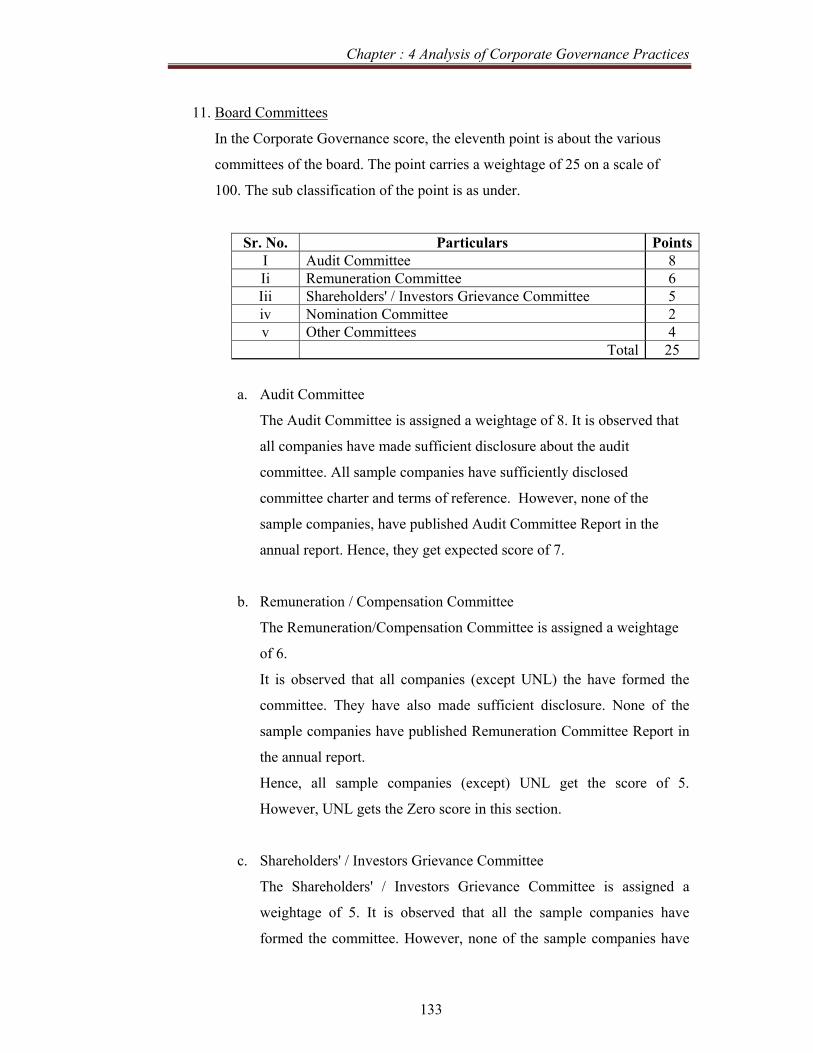
Chapter : 4 Analysis of Corporate Governance Practices
133
11. Board Committees
In the Corporate Governance score, the eleventh point is about the various
committees of the board. The point carries a weightage of 25 on a scale of
100. The sub classification of the point is as under.
Sr. No. Particulars PointsI Audit Committee 8 Ii Remuneration Committee 6 Iii Shareholders' / Investors Grievance Committee 5 iv Nomination Committee 2 v Other Committees 4
Total 25
a. Audit Committee
The Audit Committee is assigned a weightage of 8. It is observed that
all companies have made sufficient disclosure about the audit
committee. All sample companies have sufficiently disclosed
committee charter and terms of reference. However, none of the
sample companies, have published Audit Committee Report in the
annual report. Hence, they get expected score of 7.
b. Remuneration / Compensation Committee
The Remuneration/Compensation Committee is assigned a weightage
of 6.
It is observed that all companies (except UNL) the have formed the
committee. They have also made sufficient disclosure. None of the
sample companies have published Remuneration Committee Report in
the annual report.
Hence, all sample companies (except) UNL get the score of 5.
However, UNL gets the Zero score in this section.
c. Shareholders' / Investors Grievance Committee
The Shareholders' / Investors Grievance Committee is assigned a
weightage of 5. It is observed that all the sample companies have
formed the committee. However, none of the sample companies have

Chapter : 4 Analysis of Corporate Governance Practices
134
published information about the investors / shareholders’ survey (if
conducted). The Report of this committee is also not published by any
of the sample companies.
Hence, all companies get the score of 3.
d. Nomination Committee
The Nomination Committee was assigned a weightage of 2. It is
observed that none of the sample companies have formed this
committee. Hence, all companies get the ZERO score.
e. Other Committees
The formation of other committees is assigned a weightage of 4. Its
classification is already mentioned earlier.
It is observed that following committees are not formed by any of the
sample companies.
i) Health , Safety and Environment
However, Ethics - Compliance Committee is formed by three sample
companies (ACC, ACL & DLF) and Investment Committee is formed
by two sample companies, DLF and UCL. Share Transfer Committee
is formed by ACL, ICL, JAL and UCL. Hence, ACL, DLF & UCL
gets a score of 2, ACC, ICL and JAL gets a score of 1. IIL and UNL
gets a Zero score.
12. Disclosure and Transparency
This is the point is about the various disclosure and transparency shown by the
company in the annual report. The point is assigned a weightage of 25. The
classification of the point is already mentioned earlier.
It is observed that
i) All sample companies have sufficiently disclosed about
significant related party transactions.

Chapter : 4 Analysis of Corporate Governance Practices
135
ii) All sample companies have adequately disclosed about Non
Compliance related to capital market matters during last three
years.
iii) All sample companies have clearly mentioned about the
accounting treatments and significant changes in their
accounting policy.
iv) All sample companies have given sufficient information about
risk management and policies of the board.
However, no sample company (Except DLF) has published risk
management report.
v) All sample companies have published the Management
Discussion and Analysis as a part of the annual report.
vi) All sample companies have sufficiently disclosed the
shareholders’ information.
vii) All sample companies (except IIL, JAL and UCL) have
published rights of the share holders as a part of their annual
report.
viii) All sample companies are clear from any audit qualification.
ix) JAL and UNL have given information about the training to
board members. However, it is not given by other sample
companies.
x) UNL has systematically informed about evaluation of Non
Executive Director, whereas other companies have not
disclosed about it.
xi) DLF & UNL have given information about the Whistle Blower
Policy. However, it is not given by other sample companies.
Hence, UNL gets a highest score of 24, DLF gets a score of 21, ACC,
ACL, JAL & ICL gets a score of 18, and IIL and UCL gets a lowest
score of 16.
Chapter : 4 Analysis of Corporate Governance Practices
136
13. General Body Meetings
This point was about the General Body Meetings, carrying a weightage of 3.
All companies have sufficiently disclosed about the various points related to
General body meetings in the annual report. Hence, all sample companies get
the expected score of 3.
14. Means of communication and General shareholder information
The Fourteenth score point was disclosure about the means of communication
and general shareholder information and carries weightage of 2. All sample
companies have sufficiently disclosed about the point in the annual report.
Hence, all companies get the expected score of 2.
15. CEO / CFO Certification
The Fifteenth score point was about the certification of CEO \ CFO, carrying a
weightage of 2. It is observed that all companies have certification from CEO \
CFO. Hence, all companies get the expected score of 2.
16. Compliance of Corporate Governance and Auditors' Certificate
The Sixteenth score point was about the compliance of Corporate Governance
guidelines issued by SEBI and Auditor’s Certificate, carrying a weightage of
10. It is observed that all sample companies have clean certificate from
auditor. Hence, all companies get the expected score of 10.
17. Disclosure of Stakeholders' interests :
The Seventeenth score point was about the disclosure of the stakeholders’
interest and was assigned a weightage of 10. This points are divided equally to
the following.
i) Environment, Health & Safety Measures (EHS)
ii) Human Resource Development Initiative (HRD)
iii) Corporate Social Responsibility (CSR)
iv) Industrial Relation (IR)
v) Disclosure of policies on EHS, HRD, CSR & IR
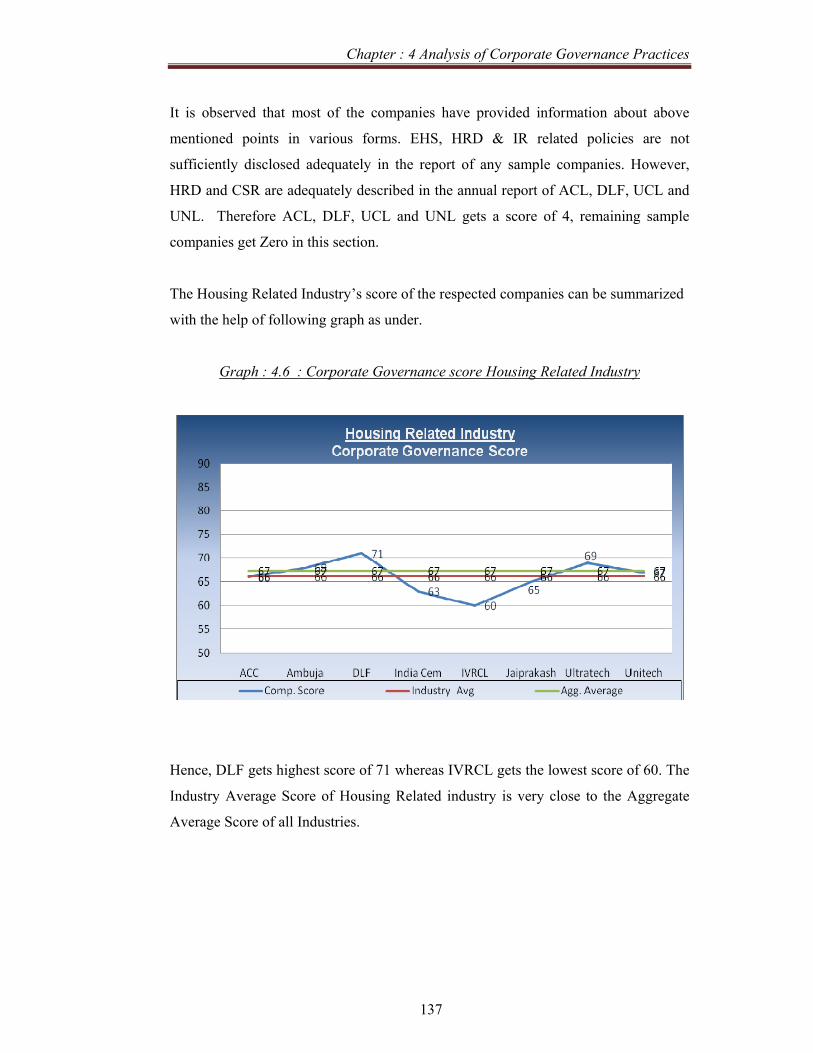
Chapter : 4 Analysis of Corporate Governance Practices
137
It is observed that most of the companies have provided information about above
mentioned points in various forms. EHS, HRD & IR related policies are not
sufficiently disclosed adequately in the report of any sample companies. However,
HRD and CSR are adequately described in the annual report of ACL, DLF, UCL and
UNL. Therefore ACL, DLF, UCL and UNL gets a score of 4, remaining sample
companies get Zero in this section.
The Housing Related Industry’s score of the respected companies can be summarized
with the help of following graph as under.
Graph : 4.6 : Corporate Governance score Housing Related Industry
Hence, DLF gets highest score of 71 whereas IVRCL gets the lowest score of 60. The
Industry Average Score of Housing Related industry is very close to the Aggregate
Average Score of all Industries.
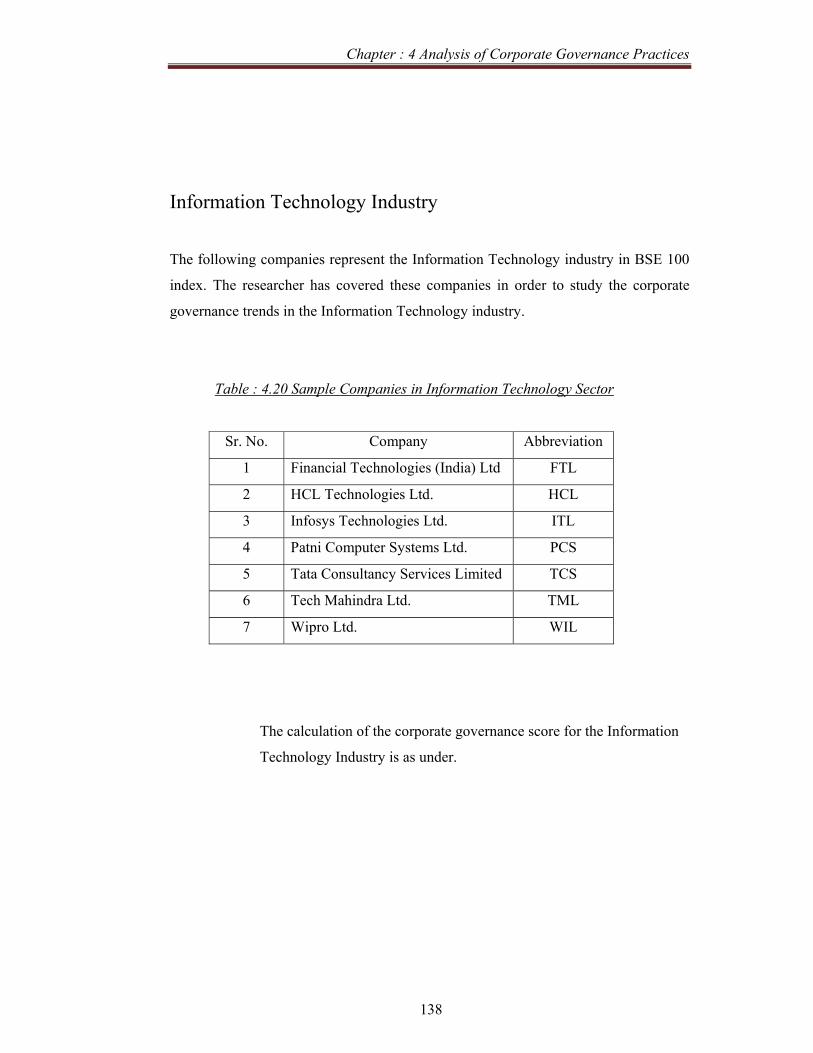
Chapter : 4 Analysis of Corporate Governance Practices
138
Information Technology Industry
The following companies represent the Information Technology industry in BSE 100
index. The researcher has covered these companies in order to study the corporate
governance trends in the Information Technology industry.
Table : 4.20 Sample Companies in Information Technology Sector
Sr. No. Company Abbreviation
1 Financial Technologies (India) Ltd FTL
2 HCL Technologies Ltd. HCL
3 Infosys Technologies Ltd. ITL
4 Patni Computer Systems Ltd. PCS
5 Tata Consultancy Services Limited TCS
6 Tech Mahindra Ltd. TML
7 Wipro Ltd. WIL
The calculation of the corporate governance score for the Information
Technology Industry is as under.

Chapter : 4 Analysis of Corporate Governance Practices
139
Table : 4.21 Corporate Governance Score for Information Technology Sector
Industry Average : 71, Aggregate Average : 67 Criterion for Evaluation of Governance Standard for FTL HCL ITL PCS TCS TML WIL
No. Governance Parameters POINTS FTIL HCL Infosys PCS TCS Tech Mah Wipro
1
Statement of Company's philosophy on code of governance 2 2 2 2 2 2 2 2
2 Structure and Strength of board 2 2 2 2 2 2 2 2
3 Chairman & CEO Duality 5 1 1 3 1 3 3 1
4 Disclosure of Tenure and Age limit of directors 2 2 2 2 2 2 2 2
5 Disclosure of : 3 0 0 3 0 0 0 1
6
Post Board meeting follow up system and compliance of the board procedures 2 0 0 2 0 0 0 2
7 Appointment of lead independent director 2 0 0 2 0 0 0 0
8
Disclosure of other provision as to the boards and committees 1 1 1 1 1 1 1 1
9 Disclosure of : 2 2 2 2 1 2 1 2 10 Code of Conduct 2 2 2 2 2 2 2 2 11 Board Committee 25 16 15 20 10 18 16 16 12 Disclosure and Transparency 25 18 18 25 18 20 18 25 13 General Body Meetings 3 3 3 3 3 3 3 3
14
Means of communication and General shareholder information 2 2 2 2 2 2 2 2
15 CEO / CFO Certification 2 2 2 2 2 2 2 2
16
Compliance of Corporate Governance and Auditors' Certificate 10 10 10 10 5 10 10 10
17 Disclosure of Stakeholders' interests : 10 4 0 8 4 6 4 4
T O T A L 100 67 62 91 55 75 68 77 Rank 5 6 1 7 3 4 2

Chapter : 4 Analysis of Corporate Governance Practices
140
Information Technology Industry - Analysis of Corporate Governance Score
1. Statement of Company's philosophy on code of governance:
In the IT and ITES related sector, there are 7 sample units, as mentioned
earlier, the first score point having a weightage of 2 was, statement of
Company’s philosophy on Corporate Governance All companies get the
expected score of 2 as all companies have sufficient disclosure of the
statement of Company's philosophy on code of governance.
2. Structure and Strength of board
In the Corporate Governance score, the second score point was about the
Structure and Strength of the board having a weightage of 2. All companies
get the expected score of 2. All companies have sufficiently disclosed the
composition of the Board of Directors.
3. Chairman and CEO Duality
As mentioned earlier, this point carries a weightage of 5. No company among
this sample is assigned a score of 5 as no company is having Non Executive
Independent Chairman. ITL, TCS and TML have Promoter Non Executive
Chairman hence it is assigned a score of 3. However, remaining all sample
companies are having Promoter Executive Chairman hence, they are assigned
a score of 1.
4. Disclosure of Tenure and Age limit of directors
As mentioned earlier, this point was assigned a weightage of 2. All sample
companies get the expected score of 2.
5. Disclosure of Definition and selection criteria for (Independent) Directors
As mentioned earlier, this point was assigned a weightage of 3. ITL have
defined both definitions and selection criteria for board of directors.. However,
none of the other sample companies have disclosed definition of ‘Financial
Expert’ and selection criteria for board members (including independent
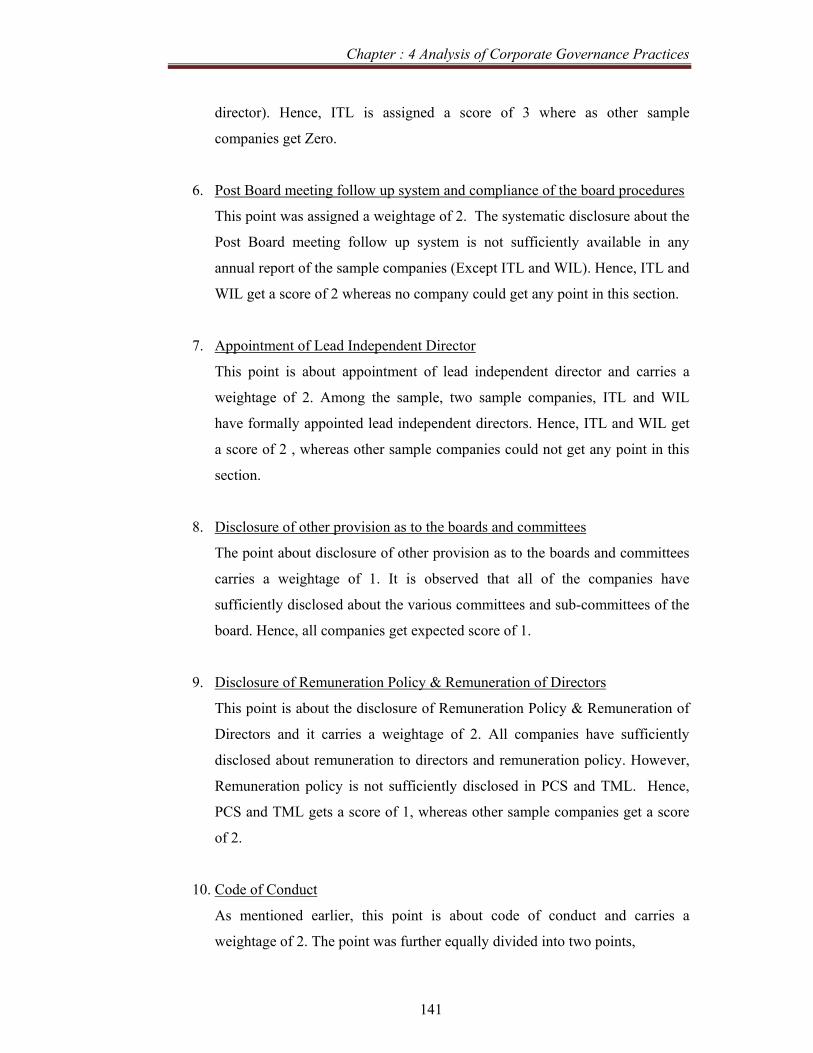
Chapter : 4 Analysis of Corporate Governance Practices
141
director). Hence, ITL is assigned a score of 3 where as other sample
companies get Zero.
6. Post Board meeting follow up system and compliance of the board procedures
This point was assigned a weightage of 2. The systematic disclosure about the
Post Board meeting follow up system is not sufficiently available in any
annual report of the sample companies (Except ITL and WIL). Hence, ITL and
WIL get a score of 2 whereas no company could get any point in this section.
7. Appointment of Lead Independent Director
This point is about appointment of lead independent director and carries a
weightage of 2. Among the sample, two sample companies, ITL and WIL
have formally appointed lead independent directors. Hence, ITL and WIL get
a score of 2 , whereas other sample companies could not get any point in this
section.
8. Disclosure of other provision as to the boards and committees
The point about disclosure of other provision as to the boards and committees
carries a weightage of 1. It is observed that all of the companies have
sufficiently disclosed about the various committees and sub-committees of the
board. Hence, all companies get expected score of 1.
9. Disclosure of Remuneration Policy & Remuneration of Directors
This point is about the disclosure of Remuneration Policy & Remuneration of
Directors and it carries a weightage of 2. All companies have sufficiently
disclosed about remuneration to directors and remuneration policy. However,
Remuneration policy is not sufficiently disclosed in PCS and TML. Hence,
PCS and TML gets a score of 1, whereas other sample companies get a score
of 2.
10. Code of Conduct
As mentioned earlier, this point is about code of conduct and carries a
weightage of 2. The point was further equally divided into two points,

Chapter : 4 Analysis of Corporate Governance Practices
142
(i) Information on Code of Conduct and
(ii) Affirmation regarding compliance for code of conduct.
It is observed that all the companies have sufficiently disclosed about both the
above points. Hence, all companies get expected score of 2.
11. Board Committees
In the Corporate Governance score, the eleventh point is about the various
committees of the board. The point carries a weightage of 25 on a scale of
100. The sub classification of the point is as under.
Sr. No. Particulars PointsI Audit Committee 8 ii Remuneration Committee 6 iii Shareholders' / Investors Grievance Committee 5 iv Nomination Committee 2 v Other Committees 4
Total 25
a. Audit Committee
The Audit Committee is assigned a weightage of 8. It is observed that
all companies have made sufficient disclosure about the audit
committee. All sample companies have sufficiently disclosed
committee charter and terms of reference. However, none of the
sample companies, have published Audit Committee Report in the
annual report. Hence, they get expected score of 7.
b. Remuneration / Compensation Committee
The Remuneration/Compensation Committee is assigned a weightage
of 6.
It is observed that all companies (except PCS) the have formed the
committee. They have also made sufficient disclosure. None of the
sample companies have published Remuneration Committee Report in
the annual report.
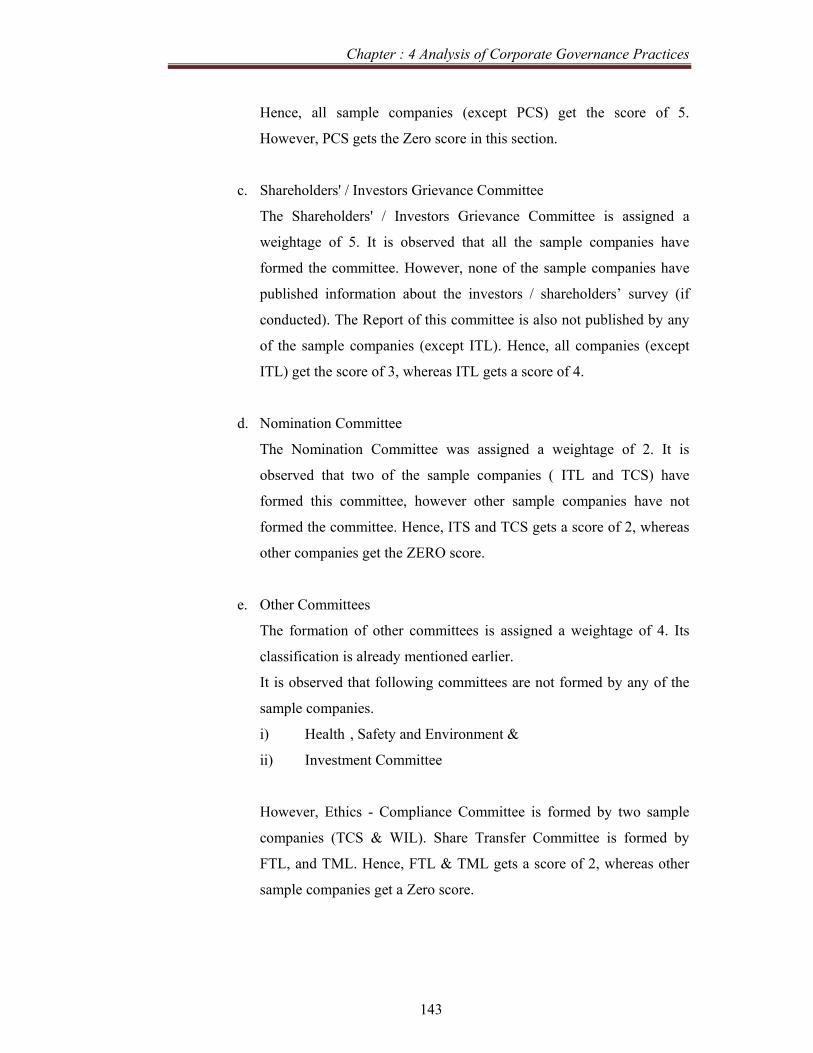
Chapter : 4 Analysis of Corporate Governance Practices
143
Hence, all sample companies (except PCS) get the score of 5.
However, PCS gets the Zero score in this section.
c. Shareholders' / Investors Grievance Committee
The Shareholders' / Investors Grievance Committee is assigned a
weightage of 5. It is observed that all the sample companies have
formed the committee. However, none of the sample companies have
published information about the investors / shareholders’ survey (if
conducted). The Report of this committee is also not published by any
of the sample companies (except ITL). Hence, all companies (except
ITL) get the score of 3, whereas ITL gets a score of 4.
d. Nomination Committee
The Nomination Committee was assigned a weightage of 2. It is
observed that two of the sample companies ( ITL and TCS) have
formed this committee, however other sample companies have not
formed the committee. Hence, ITS and TCS gets a score of 2, whereas
other companies get the ZERO score.
e. Other Committees
The formation of other committees is assigned a weightage of 4. Its
classification is already mentioned earlier.
It is observed that following committees are not formed by any of the
sample companies.
i) Health , Safety and Environment &
ii) Investment Committee
However, Ethics - Compliance Committee is formed by two sample
companies (TCS & WIL). Share Transfer Committee is formed by
FTL, and TML. Hence, FTL & TML gets a score of 2, whereas other
sample companies get a Zero score.
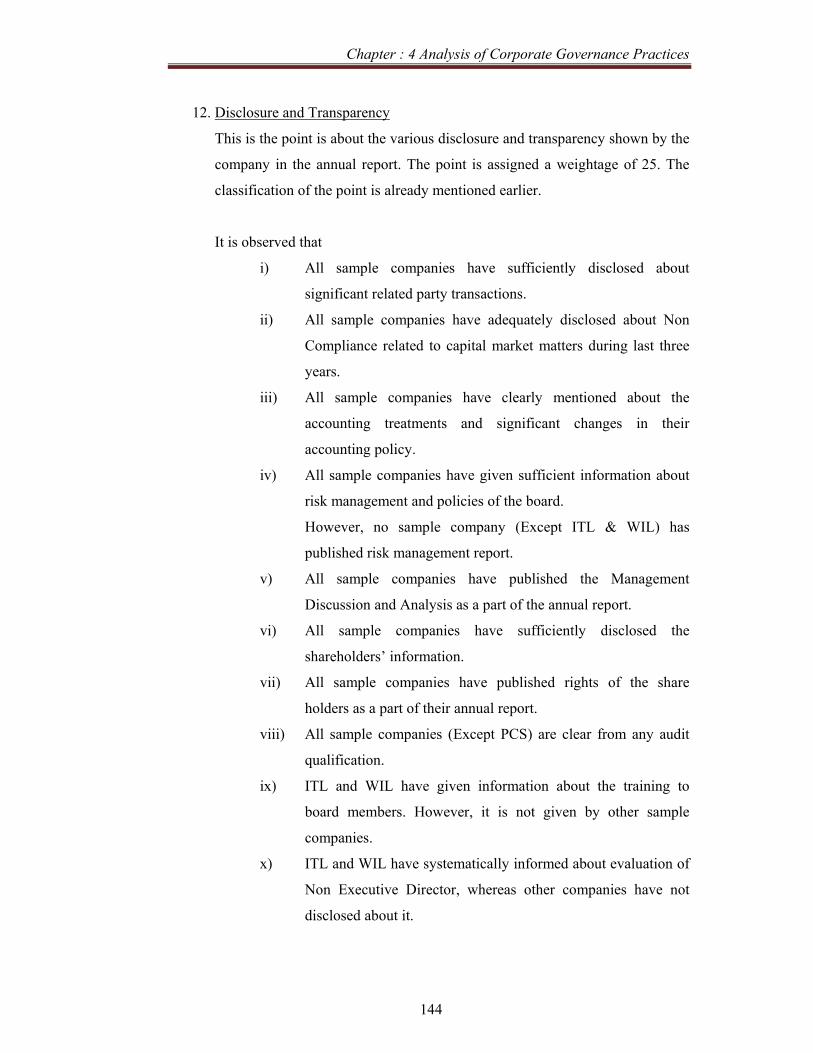
Chapter : 4 Analysis of Corporate Governance Practices
144
12. Disclosure and Transparency
This is the point is about the various disclosure and transparency shown by the
company in the annual report. The point is assigned a weightage of 25. The
classification of the point is already mentioned earlier.
It is observed that
i) All sample companies have sufficiently disclosed about
significant related party transactions.
ii) All sample companies have adequately disclosed about Non
Compliance related to capital market matters during last three
years.
iii) All sample companies have clearly mentioned about the
accounting treatments and significant changes in their
accounting policy.
iv) All sample companies have given sufficient information about
risk management and policies of the board.
However, no sample company (Except ITL & WIL) has
published risk management report.
v) All sample companies have published the Management
Discussion and Analysis as a part of the annual report.
vi) All sample companies have sufficiently disclosed the
shareholders’ information.
vii) All sample companies have published rights of the share
holders as a part of their annual report.
viii) All sample companies (Except PCS) are clear from any audit
qualification.
ix) ITL and WIL have given information about the training to
board members. However, it is not given by other sample
companies.
x) ITL and WIL have systematically informed about evaluation of
Non Executive Director, whereas other companies have not
disclosed about it.
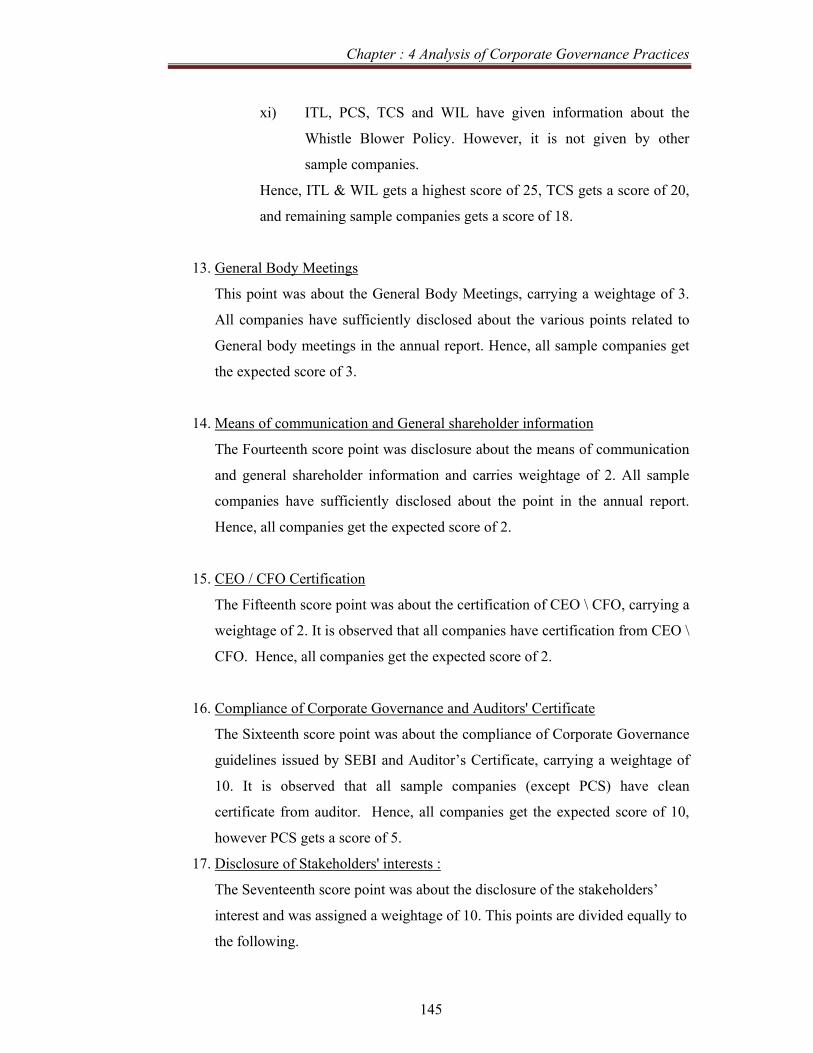
Chapter : 4 Analysis of Corporate Governance Practices
145
xi) ITL, PCS, TCS and WIL have given information about the
Whistle Blower Policy. However, it is not given by other
sample companies.
Hence, ITL & WIL gets a highest score of 25, TCS gets a score of 20,
and remaining sample companies gets a score of 18.
13. General Body Meetings
This point was about the General Body Meetings, carrying a weightage of 3.
All companies have sufficiently disclosed about the various points related to
General body meetings in the annual report. Hence, all sample companies get
the expected score of 3.
14. Means of communication and General shareholder information
The Fourteenth score point was disclosure about the means of communication
and general shareholder information and carries weightage of 2. All sample
companies have sufficiently disclosed about the point in the annual report.
Hence, all companies get the expected score of 2.
15. CEO / CFO Certification
The Fifteenth score point was about the certification of CEO \ CFO, carrying a
weightage of 2. It is observed that all companies have certification from CEO \
CFO. Hence, all companies get the expected score of 2.
16. Compliance of Corporate Governance and Auditors' Certificate
The Sixteenth score point was about the compliance of Corporate Governance
guidelines issued by SEBI and Auditor’s Certificate, carrying a weightage of
10. It is observed that all sample companies (except PCS) have clean
certificate from auditor. Hence, all companies get the expected score of 10,
however PCS gets a score of 5.
17. Disclosure of Stakeholders' interests :
The Seventeenth score point was about the disclosure of the stakeholders’
interest and was assigned a weightage of 10. This points are divided equally to
the following.
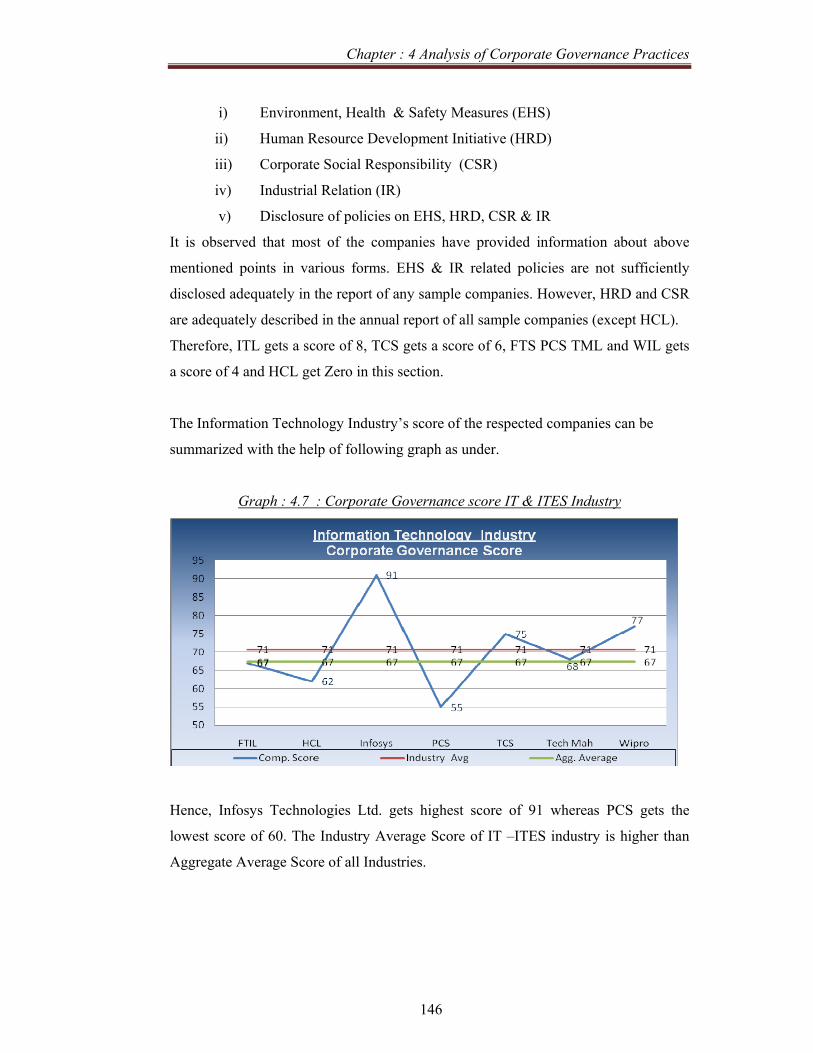
Chapter : 4 Analysis of Corporate Governance Practices
146
i) Environment, Health & Safety Measures (EHS)
ii) Human Resource Development Initiative (HRD)
iii) Corporate Social Responsibility (CSR)
iv) Industrial Relation (IR)
v) Disclosure of policies on EHS, HRD, CSR & IR
It is observed that most of the companies have provided information about above
mentioned points in various forms. EHS & IR related policies are not sufficiently
disclosed adequately in the report of any sample companies. However, HRD and CSR
are adequately described in the annual report of all sample companies (except HCL).
Therefore, ITL gets a score of 8, TCS gets a score of 6, FTS PCS TML and WIL gets
a score of 4 and HCL get Zero in this section.
The Information Technology Industry’s score of the respected companies can be
summarized with the help of following graph as under.
Graph : 4.7 : Corporate Governance score IT & ITES Industry
Hence, Infosys Technologies Ltd. gets highest score of 91 whereas PCS gets the
lowest score of 60. The Industry Average Score of IT –ITES industry is higher than
Aggregate Average Score of all Industries.
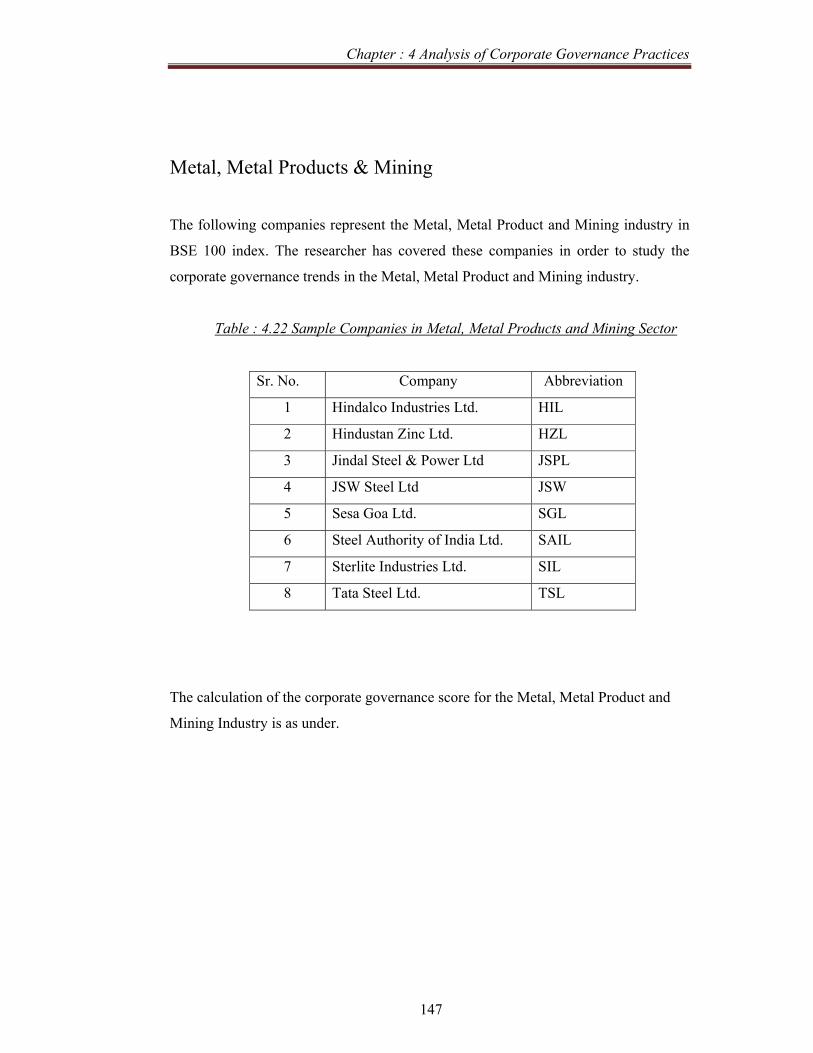
Chapter : 4 Analysis of Corporate Governance Practices
147
Metal, Metal Products & Mining
The following companies represent the Metal, Metal Product and Mining industry in
BSE 100 index. The researcher has covered these companies in order to study the
corporate governance trends in the Metal, Metal Product and Mining industry.
Table : 4.22 Sample Companies in Metal, Metal Products and Mining Sector
Sr. No. Company Abbreviation
1 Hindalco Industries Ltd. HIL
2 Hindustan Zinc Ltd. HZL
3 Jindal Steel & Power Ltd JSPL
4 JSW Steel Ltd JSW
5 Sesa Goa Ltd. SGL
6 Steel Authority of India Ltd. SAIL
7 Sterlite Industries Ltd. SIL
8 Tata Steel Ltd. TSL
The calculation of the corporate governance score for the Metal, Metal Product and
Mining Industry is as under.
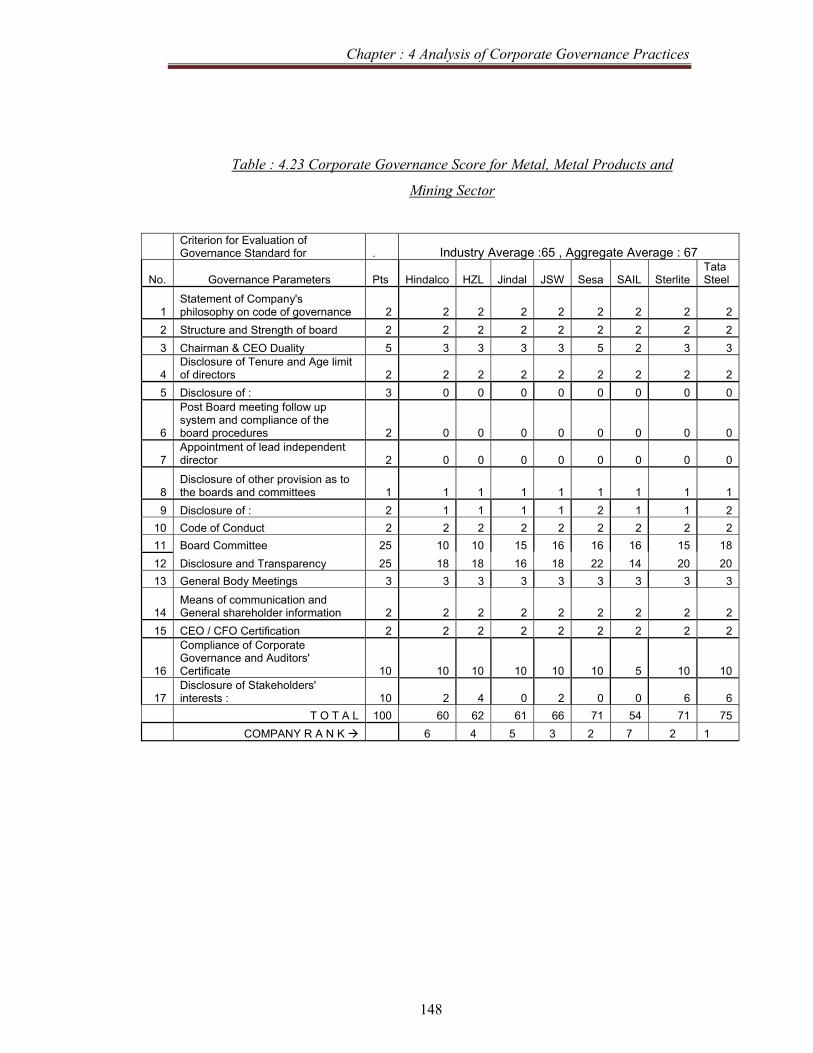
Chapter : 4 Analysis of Corporate Governance Practices
148
Table : 4.23 Corporate Governance Score for Metal, Metal Products and
Mining Sector
Criterion for Evaluation of Governance Standard for . Industry Average :65 , Aggregate Average : 67
No. Governance Parameters Pts Hindalco HZL Jindal JSW Sesa SAIL Sterlite Tata Steel
1 Statement of Company's philosophy on code of governance 2 2 2 2 2 2 2 2 2
2 Structure and Strength of board 2 2 2 2 2 2 2 2 2 3 Chairman & CEO Duality 5 3 3 3 3 5 2 3 3
4 Disclosure of Tenure and Age limit of directors 2 2 2 2 2 2 2 2 2
5 Disclosure of : 3 0 0 0 0 0 0 0 0
6
Post Board meeting follow up system and compliance of the board procedures 2 0 0 0 0 0 0 0 0
7 Appointment of lead independent director 2 0 0 0 0 0 0 0 0
8 Disclosure of other provision as to the boards and committees 1 1 1 1 1 1 1 1 1
9 Disclosure of : 2 1 1 1 1 2 1 1 2 10 Code of Conduct 2 2 2 2 2 2 2 2 2 11 Board Committee 25 10 10 15 16 16 16 15 18 12 Disclosure and Transparency 25 18 18 16 18 22 14 20 20 13 General Body Meetings 3 3 3 3 3 3 3 3 3
14 Means of communication and General shareholder information 2 2 2 2 2 2 2 2 2
15 CEO / CFO Certification 2 2 2 2 2 2 2 2 2
16
Compliance of Corporate Governance and Auditors' Certificate 10 10 10 10 10 10 5 10 10
17 Disclosure of Stakeholders' interests : 10 2 4 0 2 0 0 6 6
T O T A L 100 60 62 61 66 71 54 71 75 COMPANY R A N K 6 4 5 3 2 7 2 1
Chapter : 4 Analysis of Corporate Governance Practices
149
Metal, Metal Products & Mining Industry - Analysis of Corporate Governance
Score
1. Statement of Company's philosophy on code of governance:
In the Metal, Metal Products & Mining related sector, there are 8 sample units,
as mentioned earlier, the first score point having a weightage of 2 was,
statement of Company’s philosophy on Corporate Governance All companies
get the expected score of 2 as all companies have sufficient disclosure of the
statement of Company's philosophy on code of governance.
2. Structure and Strength of board
In the Corporate Governance score, the second score point was about the
Structure and Strength of the board having a weightage of 2. All companies
get the expected score of 2. All companies have sufficiently disclosed the
composition of the Board of Directors.
3. Chairman and CEO Duality
As mentioned earlier, this point carries a weightage of 5. SGL gets a score of 5
as it is having a Non Executive Independent Chairman. HIL, HZL, JSPL,
JSW, SIL & TSL have Promoter Non Executive Chairman hence it is assigned
a score of 3. However, SAIL have a Non Promoter Executive Chairman hence,
it is assigned a score of 1.
4. Disclosure of Tenure and Age limit of directors
As mentioned earlier, this point was assigned a weightage of 2. All sample
companies get the expected score of 2.
5. Disclosure of Definition and selection criteria for (Independent) Directors
As mentioned earlier, this point was assigned a weightage of 3. None of the
sample companies have disclosed definition of ‘Financial Expert’ and
selection criteria for board members (including independent director). Hence,
all companies get Zero.
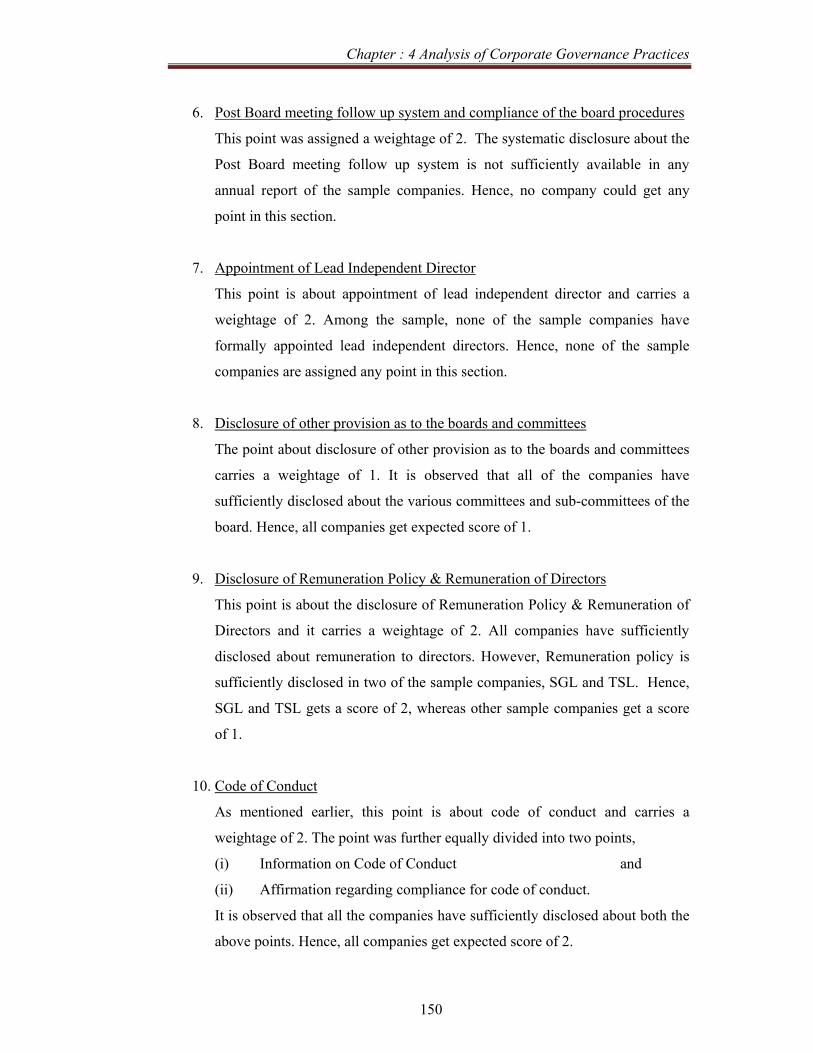
Chapter : 4 Analysis of Corporate Governance Practices
150
6. Post Board meeting follow up system and compliance of the board procedures
This point was assigned a weightage of 2. The systematic disclosure about the
Post Board meeting follow up system is not sufficiently available in any
annual report of the sample companies. Hence, no company could get any
point in this section.
7. Appointment of Lead Independent Director
This point is about appointment of lead independent director and carries a
weightage of 2. Among the sample, none of the sample companies have
formally appointed lead independent directors. Hence, none of the sample
companies are assigned any point in this section.
8. Disclosure of other provision as to the boards and committees
The point about disclosure of other provision as to the boards and committees
carries a weightage of 1. It is observed that all of the companies have
sufficiently disclosed about the various committees and sub-committees of the
board. Hence, all companies get expected score of 1.
9. Disclosure of Remuneration Policy & Remuneration of Directors
This point is about the disclosure of Remuneration Policy & Remuneration of
Directors and it carries a weightage of 2. All companies have sufficiently
disclosed about remuneration to directors. However, Remuneration policy is
sufficiently disclosed in two of the sample companies, SGL and TSL. Hence,
SGL and TSL gets a score of 2, whereas other sample companies get a score
of 1.
10. Code of Conduct
As mentioned earlier, this point is about code of conduct and carries a
weightage of 2. The point was further equally divided into two points,
(i) Information on Code of Conduct and
(ii) Affirmation regarding compliance for code of conduct.
It is observed that all the companies have sufficiently disclosed about both the
above points. Hence, all companies get expected score of 2.

Chapter : 4 Analysis of Corporate Governance Practices
151
11. Board Committees
In the Corporate Governance score, the eleventh point is about the various
committees of the board. The point carries a weightage of 25 on a scale of
100. The sub classification of the point is as under.
Sr. No. Particulars PointsI Audit Committee 8 ii Remuneration Committee 6 iii Shareholders' / Investors Grievance Committee 5 iv Nomination Committee 2 v Other Committees 4
Total 25
a. Audit Committee
The Audit Committee is assigned a weightage of 8. It is observed that
all companies have made sufficient disclosure about the audit
committee. All sample companies have sufficiently disclosed
committee charter and terms of reference. However, none of the
sample companies, have published Audit Committee Report in the
annual report. Hence, they get expected score of 7.
b. Remuneration / Compensation Committee
The Remuneration/Compensation Committee is assigned a weightage
of 6.
It is observed that all companies (except HIL & HZL) have formed the
committee. They have also made sufficient disclosure. None of the
sample companies have published Remuneration Committee Report in
the annual report.
Hence, all sample companies (except HIL & HZL) get the score of 5.
However, HIL & HZL gets the Zero score in this section.
c. Shareholders' / Investors Grievance Committee
The Shareholders' / Investors Grievance Committee is assigned a
weightage of 5. It is observed that all the sample companies have
formed the committee. However, none of the sample companies have

Chapter : 4 Analysis of Corporate Governance Practices
152
published information about the investors / shareholders’ survey (if
conducted). The Report of this committee is also not published by any
of the sample companies. Hence, all companies get the score of 3.
d. Nomination Committee
The Nomination Committee was assigned a weightage of 2. It is
observed that three of the sample companies (JSW, SAIL and TSL)
have formed this committee, however other sample companies have
not formed the committee. Hence, JSW, SAIL and TSL gets a score of
2, whereas other companies get the ZERO score.
e. Other Committees
The formation of other committees is assigned a weightage of 4. Its
classification is already mentioned earlier.
It is observed that following committees are not formed by any of the
sample companies.
i) Health , Safety and Environment &
ii) Investment Committee
However, Ethics - Compliance Committee is formed by one sample
companies (TSL). Share Transfer Committee is formed by SGL, and
TSL. Hence, TSL gets a score of 2, SGL gets a score of 1, whereas
other sample companies get a Zero score.
12. Disclosure and Transparency
This is the point is about the various disclosure and transparency shown by the
company in the annual report. The point is assigned a weightage of 25. The
classification of the point is already mentioned earlier.
It is observed that
i) All sample companies have sufficiently disclosed about
significant related party transactions.
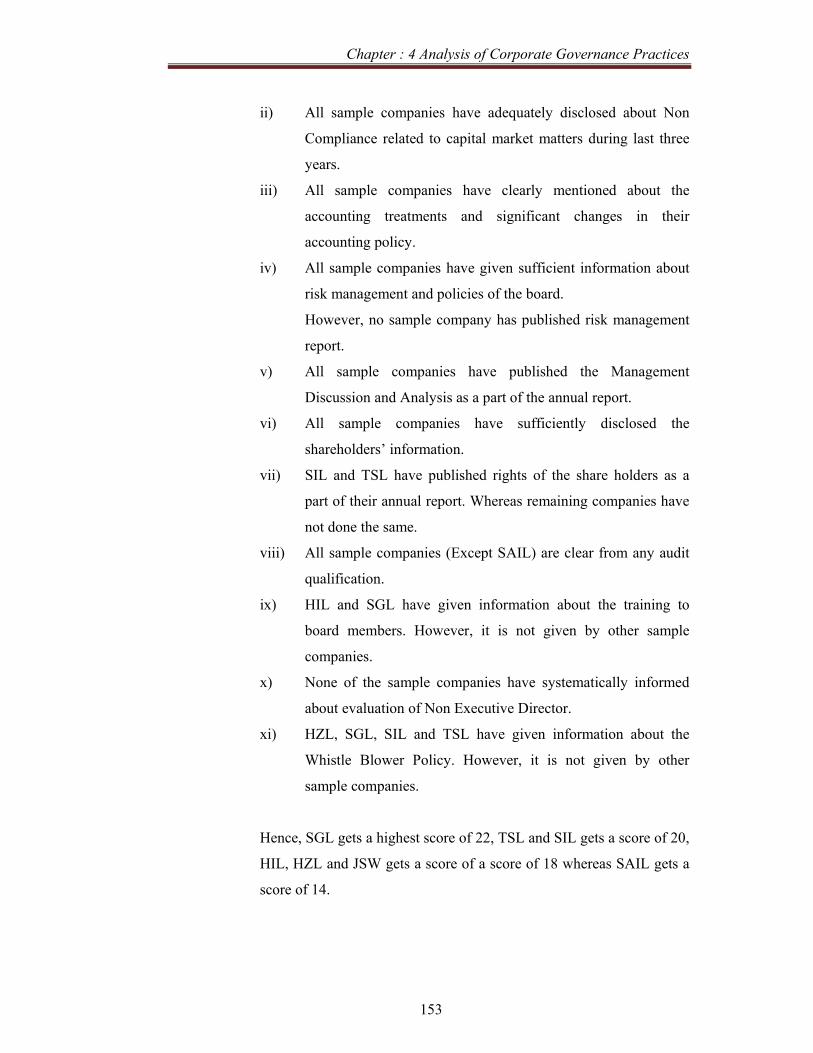
Chapter : 4 Analysis of Corporate Governance Practices
153
ii) All sample companies have adequately disclosed about Non
Compliance related to capital market matters during last three
years.
iii) All sample companies have clearly mentioned about the
accounting treatments and significant changes in their
accounting policy.
iv) All sample companies have given sufficient information about
risk management and policies of the board.
However, no sample company has published risk management
report.
v) All sample companies have published the Management
Discussion and Analysis as a part of the annual report.
vi) All sample companies have sufficiently disclosed the
shareholders’ information.
vii) SIL and TSL have published rights of the share holders as a
part of their annual report. Whereas remaining companies have
not done the same.
viii) All sample companies (Except SAIL) are clear from any audit
qualification.
ix) HIL and SGL have given information about the training to
board members. However, it is not given by other sample
companies.
x) None of the sample companies have systematically informed
about evaluation of Non Executive Director.
xi) HZL, SGL, SIL and TSL have given information about the
Whistle Blower Policy. However, it is not given by other
sample companies.
Hence, SGL gets a highest score of 22, TSL and SIL gets a score of 20,
HIL, HZL and JSW gets a score of a score of 18 whereas SAIL gets a
score of 14.
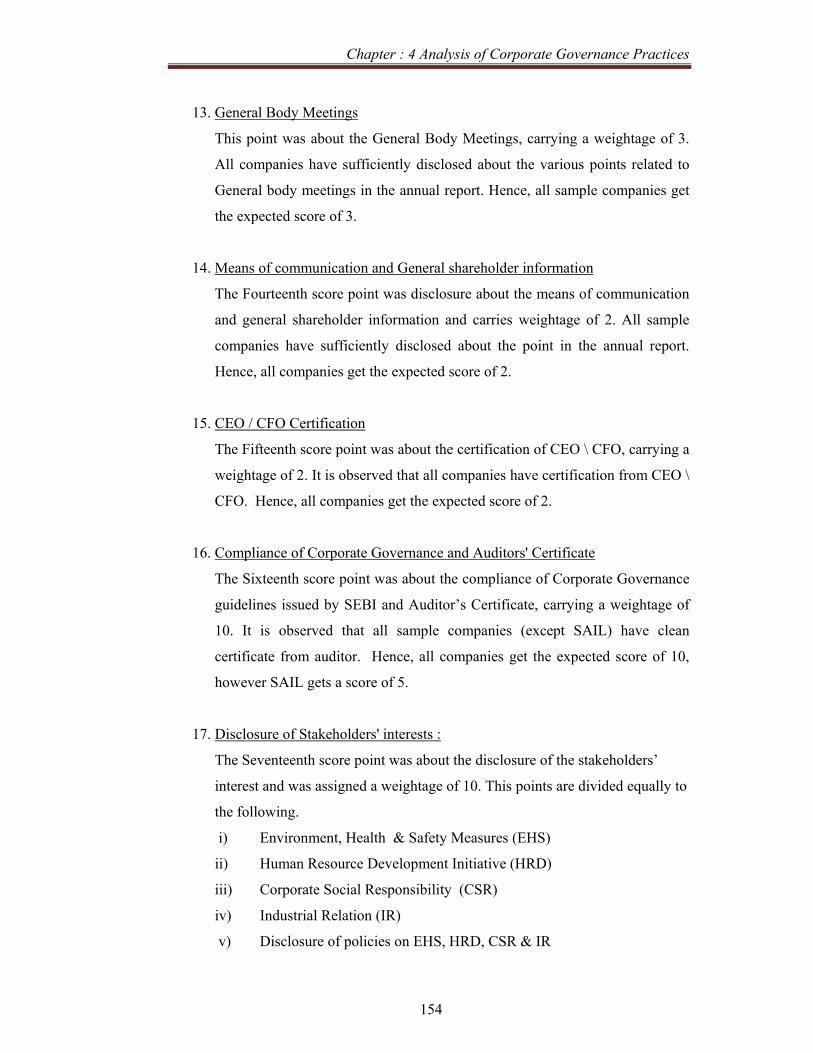
Chapter : 4 Analysis of Corporate Governance Practices
154
13. General Body Meetings
This point was about the General Body Meetings, carrying a weightage of 3.
All companies have sufficiently disclosed about the various points related to
General body meetings in the annual report. Hence, all sample companies get
the expected score of 3.
14. Means of communication and General shareholder information
The Fourteenth score point was disclosure about the means of communication
and general shareholder information and carries weightage of 2. All sample
companies have sufficiently disclosed about the point in the annual report.
Hence, all companies get the expected score of 2.
15. CEO / CFO Certification
The Fifteenth score point was about the certification of CEO \ CFO, carrying a
weightage of 2. It is observed that all companies have certification from CEO \
CFO. Hence, all companies get the expected score of 2.
16. Compliance of Corporate Governance and Auditors' Certificate
The Sixteenth score point was about the compliance of Corporate Governance
guidelines issued by SEBI and Auditor’s Certificate, carrying a weightage of
10. It is observed that all sample companies (except SAIL) have clean
certificate from auditor. Hence, all companies get the expected score of 10,
however SAIL gets a score of 5.
17. Disclosure of Stakeholders' interests :
The Seventeenth score point was about the disclosure of the stakeholders’
interest and was assigned a weightage of 10. This points are divided equally to
the following.
i) Environment, Health & Safety Measures (EHS)
ii) Human Resource Development Initiative (HRD)
iii) Corporate Social Responsibility (CSR)
iv) Industrial Relation (IR)
v) Disclosure of policies on EHS, HRD, CSR & IR

Chapter : 4 Analysis of Corporate Governance Practices
155
It is observed that most of the companies have provided information about above
mentioned points in various forms. EHS & IR related policies are not sufficiently
disclosed adequately in the report of any sample companies. However, HRD and CSR
are adequately described in the annual report of JSW, SIL and TSL. Therefore SIL
and TSL gets a score of 6, HZL gets a score of 4, JSW and HIL gets a score of 2, and
JSPL, SGL and SAIL gets Zero in this section.
The Metal, Metal Products and Mining Industry’s score of the respected companies
can be summarized with the help of following graph as under.
Graph : 4.8 : Corporate Governance score Metal & Mining Industry
Hence, Tata Steel Ltd. gets highest score of 75 whereas SAIL gets the lowest score of
54. The Industry Average Score of Metal and Mining related industry is marginally
lower then aggregate score of all Industries.

Chapter : 4 Analysis of Corporate Governance Practices
156
Oil & Gas Industry The following companies represent the Oil and Gas industry in BSE 100 index. The
researcher has covered these companies in order to study the corporate governance
trends in the Oil and Gas industry.
Table : 4.24 Sample Companies in Oil and Gas Sector
Sr. No. Company Abbreviation
1 Aban Offshore Ltd. AOL
2 Bharat Petroleum Corpn Ltd. BPCL
3 Cairn India Ltd. CIL
4 Essar Oil Ltd. EOL
5 Gail (India) Ltd. GAIL
6 Hindustan Petroleum Corp Ltd. HPCL
7 Indian Oil Corporation Ltd. IOCL
8 ONGC Ltd. ONGC
9 Reliance Industries Ltd. RIL
10 Reliance Natural Resources Ltd.
RNRL
11 Reliance Petroleum Ltd. RPL
The calculation of the corporate governance score for the Oil and Gas
Industry is as under.

Chapter : 4 Analysis of Corporate Governance Practices
157
Table : 4.25 Corporate Governance Score for Oil and Gas Sector
Criterion for Evaluation of Governance Standard for . Industry Average : 68, Aggregate Average : 67
No. Governance Parameters Pnt Aban
off B P Cairn Essar Gail HPCL IOCL ONGC RIL RNRL RPL
1
Statement of Company's philosophy on code of governance 2 2 2 2 2 2 2 2 2 2 2 2
2 Structure and Strength of board 2 2 2 2 2 2 2 2 2 2 2 2
3 Chairman & CEO Duality 5 5 1 4 3 2 2 2 2 1 1 1
4 Disclosure of Tenure and Age limit of directors 2 0 0 0 0 0 0 0 2 2 2 2
5 Disclosure of : 3 0 0 0 0 0 0 0 0 0 0 1
6
Post Board meeting follow up system and compliance of the board procedures 2 0 0 0 0 0 2 0 2 2 0 2
7 Appointment of lead independent director 2 0 0 0 0 0 0 0 0 2 0 2
8
Disclosure of other provision as to the boards and committees 1 0 1 1 1 1 1 1 1 1 1 1
9 Disclosure of : 2 1 1 1 2 2 2 2 2 2 2 2 10 Code of Conduct 2 2 1 2 2 2 2 2 2 2 2 2 11 Board Committee 25 16 10 17 14 17 12 15 18 19 16 12
12 Disclosure and Transparency 25 19 18 20 18 20 16 20 22 24 22 22
13 General Body Meetings 3 3 3 3 3 3 3 3 3 3 3 3
14
Means of communication and General shareholder information 2 2 2 2 2 2 2 2 2 2 2 2
15 CEO / CFO Certification 2 2 2 2 2 2 2 2 2 2 2 2
16
Compliance of Corporate Governance and Auditors' Certificate 10 10 5 10 10 10 10 10 10 10 10 10
17 Disclosure of Stakeholders' interests : 10 4 4 6 0 4 2 2 4 4 4 0
T O T A L 100 68 52 72 61 69 60 65 76 80 71 68 Company Rank 6 10 3 8 5 9 7 2 1 4 6

Chapter : 4 Analysis of Corporate Governance Practices
158
Oil and Gas Industry - Analysis of Corporate Governance Score
1. Statement of Company's philosophy on code of governance:
In the Oil and Gas sector, there are 11 sample units, as mentioned earlier, the
first score point having a weightage of 2 was, statement of Company’s
philosophy on Corporate Governance All companies get the expected score of
2 as all companies have sufficient disclosure of the statement of Company's
philosophy on code of governance.
2. Structure and Strength of board
In the Corporate Governance score, the second score point was about the
Structure and Strength of the board having a weightage of 2. All companies
get the expected score of 2. All companies have sufficiently disclosed the
composition of the Board of Directors.
3. Chairman and CEO Duality
As mentioned earlier, this point carries a weightage of 5. No company among
this sample is assigned a score of 5 AOL is having Non Executive
Independent Chairman hence it is assigned a score of 5. CIL is having Non
Promoter Non Executive Chairman hence it is assigned a score of 4. EOL have
Promoter Non Executive Chairman hence it is assigned a score of 3. GAIL,
HPCL IOCL and ONGC have Non promoter Executive Chairman cum
Managing Director hence, they are assigned a score of 2.
However, RIL, RNRL and RPL are having Promoter Executive Chairman
hence, they are assigned a score of 1.
4. Disclosure of Tenure and Age limit of directors
As mentioned earlier, this point was assigned a weightage of 2. ONGC, RIL,
RPL and RNRL have disclosed it and hence, they are assigned a score of 2,
whereas other sample companies get Zero in it.
5. Disclosure of Definition and selection criteria for (Independent) Directors
As mentioned earlier, this point was assigned a weightage of 3. RPL have
defined the definition of independent directors. However, none of the sample
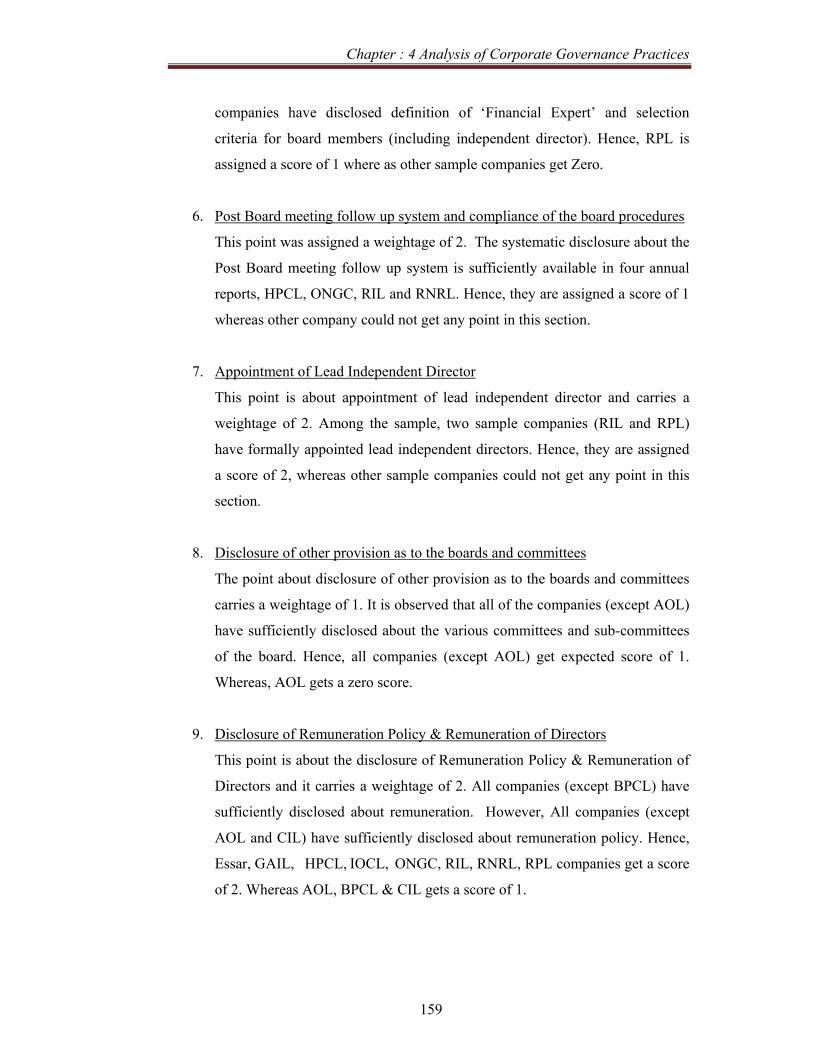
Chapter : 4 Analysis of Corporate Governance Practices
159
companies have disclosed definition of ‘Financial Expert’ and selection
criteria for board members (including independent director). Hence, RPL is
assigned a score of 1 where as other sample companies get Zero.
6. Post Board meeting follow up system and compliance of the board procedures
This point was assigned a weightage of 2. The systematic disclosure about the
Post Board meeting follow up system is sufficiently available in four annual
reports, HPCL, ONGC, RIL and RNRL. Hence, they are assigned a score of 1
whereas other company could not get any point in this section.
7. Appointment of Lead Independent Director
This point is about appointment of lead independent director and carries a
weightage of 2. Among the sample, two sample companies (RIL and RPL)
have formally appointed lead independent directors. Hence, they are assigned
a score of 2, whereas other sample companies could not get any point in this
section.
8. Disclosure of other provision as to the boards and committees
The point about disclosure of other provision as to the boards and committees
carries a weightage of 1. It is observed that all of the companies (except AOL)
have sufficiently disclosed about the various committees and sub-committees
of the board. Hence, all companies (except AOL) get expected score of 1.
Whereas, AOL gets a zero score.
9. Disclosure of Remuneration Policy & Remuneration of Directors
This point is about the disclosure of Remuneration Policy & Remuneration of
Directors and it carries a weightage of 2. All companies (except BPCL) have
sufficiently disclosed about remuneration. However, All companies (except
AOL and CIL) have sufficiently disclosed about remuneration policy. Hence,
Essar, GAIL, HPCL, IOCL, ONGC, RIL, RNRL, RPL companies get a score
of 2. Whereas AOL, BPCL & CIL gets a score of 1.

Chapter : 4 Analysis of Corporate Governance Practices
160
10. Code of Conduct
As mentioned earlier, this point is about code of conduct and carries a
weightage of 2. The point was further equally divided into two points,
(i) Information on Code of Conduct and
(ii) Affirmation regarding compliance for code of conduct.
It is observed that all the companies (except BPCL) have sufficiently disclosed
about both the above points. Hence, all companies get expected score of 2
whereas ACL gets a score of 1.
11. Board Committees
In the Corporate Governance score, the eleventh point is about the various
committees of the board. The point carries a weightage of 25 on a scale of
100. The sub classification of the point is as under.
Sr. No. Particulars PointsI Audit Committee 8 ii Remuneration Committee 6 iii Shareholders' / Investors Grievance Committee 5 iv Nomination Committee 2 v Other Committees 4
Total 25
a. Audit Committee
The Audit Committee is assigned a weightage of 8. It is observed that
all companies have made sufficient disclosure about the audit
committee. All sample companies have sufficiently disclosed
committee charter and terms of reference. However, none of the
sample companies, have published Audit Committee Report in the
annual report. Hence, they get expected score of 7.
b. Remuneration / Compensation Committee
The Remuneration/Compensation Committee is assigned a weightage
of 6.
Chapter : 4 Analysis of Corporate Governance Practices
161
It is observed that all companies (except BPCL, HPCL & RPL) the
have formed the committee. They have also made sufficient disclosure.
None of the sample companies have published Remuneration
Committee Report in the annual report.
Hence, all sample companies (except BPCL, HPCL & RPL) get the
score of 5. However, BPCL, HPCL & RPL gets the Zero score in this
section.
c. Shareholders' / Investors Grievance Committee
The Shareholders' / Investors Grievance Committee is assigned a
weightage of 5. It is observed that all the sample companies have
formed the committee. However, three of the sample companies (AOL,
RIL and RPL) have published information about the investors /
shareholders’ survey (if conducted). The Report of this committee is
also not published by any of the sample companies.
Hence, all companies (except AOL, RIL and RPL) get the score of 3.
Whereas, AOL, RIL and RPL gets a score of 4.
d. Nomination Committee
The Nomination Committee was assigned a weightage of 2. It is
observed that three sample companies ( CIL, RPL and RNRL) have
formed this committee. However the charter of the committee is
published by CIL only. Hence, these three companies get a score of 1.
Whereas, other sample companies get the ZERO score.
e. Other Committees
The formation of other committees is assigned a weightage of 4. Its
classification is already mentioned earlier. However, Environment
committee is formed by HPCL, ONGC and RIL. Ethics - Compliance
Committee is formed by two sample companies (ONGC & RIL) and
Investment Committee is formed by three sample companies, GAIL,
HPCL and RIL. Share Transfer Committee is formed by GAIL and
Chapter : 4 Analysis of Corporate Governance Practices
162
ONGC. Hence, ONGC and RIL gets a score of 3, HPCL and GAIL
gets a score of 2. Whereas other sample companies get a Zero score.
12. Disclosure and Transparency
This is the point is about the various disclosure and transparency shown by the
company in the annual report. The point is assigned a weightage of 25. The
classification of the point is already mentioned earlier.
It is observed that
i) All sample companies have sufficiently disclosed about
significant related party transactions.
ii) All sample companies have adequately disclosed about Non
Compliance related to capital market matters during last three
years.
iii) All sample companies have clearly mentioned about the
accounting treatments and significant changes in their
accounting policy.
iv) All sample companies have given sufficient information about
risk management and policies of the board.
However, no sample company (Except DLF) has published risk
management report.
v) All sample companies have published the Management
Discussion and Analysis as a part of the annual report.
vi) All sample companies have sufficiently disclosed the
shareholders’ information.
vii) All sample companies (except IIL, JAL and UCL) have
published rights of the share holders as a part of their annual
report.
viii) All sample companies are clear from any audit qualification.
ix) JAL and UNL have given information about the training to
board members. However, it is not given by other sample
companies.
Chapter : 4 Analysis of Corporate Governance Practices
163
x) UNL has systematically informed about evaluation of Non
Executive Director, whereas other companies have not
disclosed about it.
xi) DLF & UNL have given information about the Whistle Blower
Policy. However, it is not given by other sample companies.
Hence, UNL gets a highest score of 24, DLF gets a score of 21, ACC,
ACL, JAL & ICL gets a score of 18, and IIL and UCL gets a lowest
score of 16.
13. General Body Meetings
This point was about the General Body Meetings, carrying a weightage of 3.
All companies have sufficiently disclosed about the various points related to
General body meetings in the annual report. Hence, all sample companies get
the expected score of 3.
14. Means of communication and General shareholder information
The Fourteenth score point was disclosure about the means of communication
and general shareholder information and carries weightage of 2. All sample
companies have sufficiently disclosed about the point in the annual report.
Hence, all companies get the expected score of 2.
15. CEO / CFO Certification
The Fifteenth score point was about the certification of CEO \ CFO, carrying a
weightage of 2. It is observed that all companies have certification from CEO \
CFO. Hence, all companies get the expected score of 2.
16. Compliance of Corporate Governance and Auditors' Certificate
The Sixteenth score point was about the compliance of Corporate Governance
guidelines issued by SEBI and Auditor’s Certificate, carrying a weightage of
10. It is observed that all sample companies have clean certificate from
auditor. Hence, all companies get the expected score of 10.
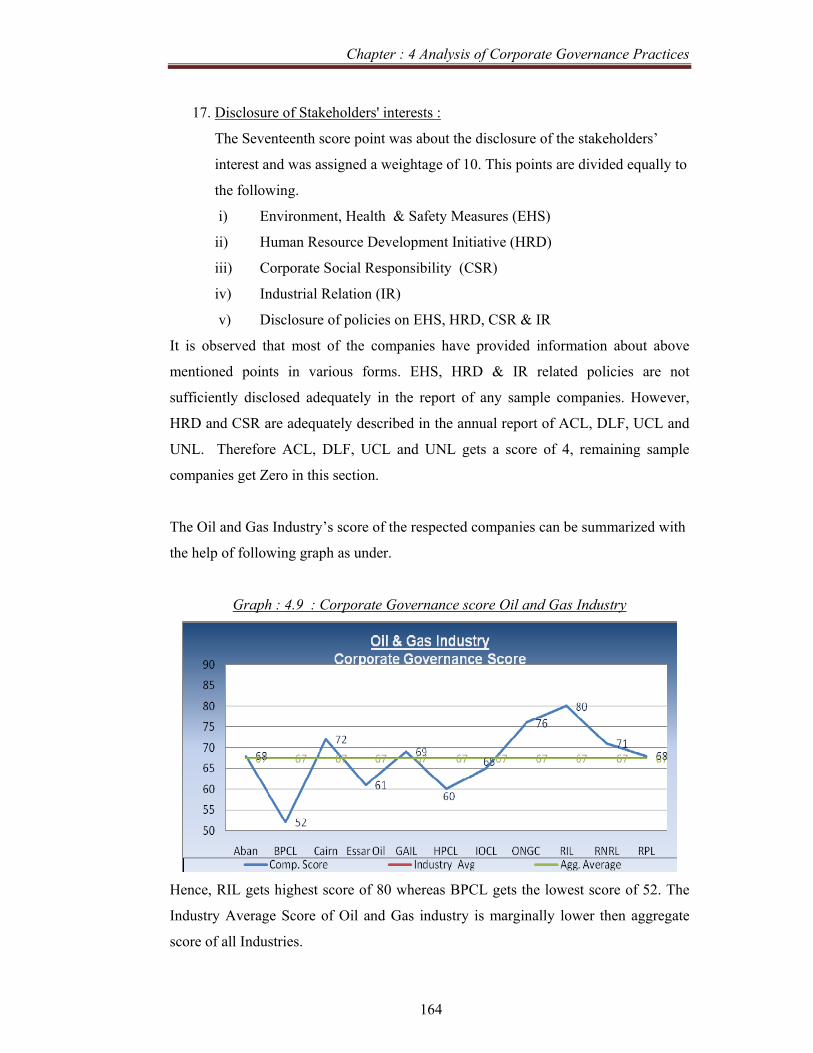
Chapter : 4 Analysis of Corporate Governance Practices
164
17. Disclosure of Stakeholders' interests :
The Seventeenth score point was about the disclosure of the stakeholders’
interest and was assigned a weightage of 10. This points are divided equally to
the following.
i) Environment, Health & Safety Measures (EHS)
ii) Human Resource Development Initiative (HRD)
iii) Corporate Social Responsibility (CSR)
iv) Industrial Relation (IR)
v) Disclosure of policies on EHS, HRD, CSR & IR
It is observed that most of the companies have provided information about above
mentioned points in various forms. EHS, HRD & IR related policies are not
sufficiently disclosed adequately in the report of any sample companies. However,
HRD and CSR are adequately described in the annual report of ACL, DLF, UCL and
UNL. Therefore ACL, DLF, UCL and UNL gets a score of 4, remaining sample
companies get Zero in this section.
The Oil and Gas Industry’s score of the respected companies can be summarized with
the help of following graph as under.
Graph : 4.9 : Corporate Governance score Oil and Gas Industry
Hence, RIL gets highest score of 80 whereas BPCL gets the lowest score of 52. The
Industry Average Score of Oil and Gas industry is marginally lower then aggregate
score of all Industries.
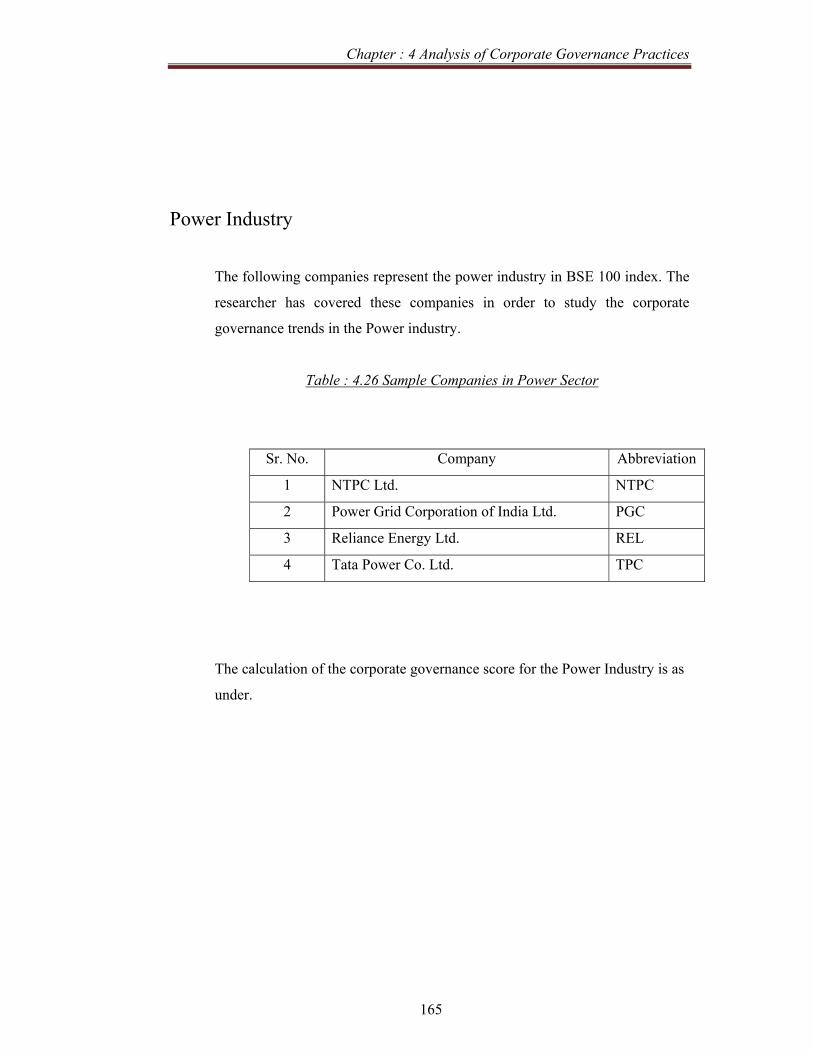
Chapter : 4 Analysis of Corporate Governance Practices
165
Power Industry
The following companies represent the power industry in BSE 100 index. The
researcher has covered these companies in order to study the corporate
governance trends in the Power industry.
Table : 4.26 Sample Companies in Power Sector
Sr. No. Company Abbreviation
1 NTPC Ltd. NTPC
2 Power Grid Corporation of India Ltd. PGC
3 Reliance Energy Ltd. REL
4 Tata Power Co. Ltd. TPC
The calculation of the corporate governance score for the Power Industry is as
under.
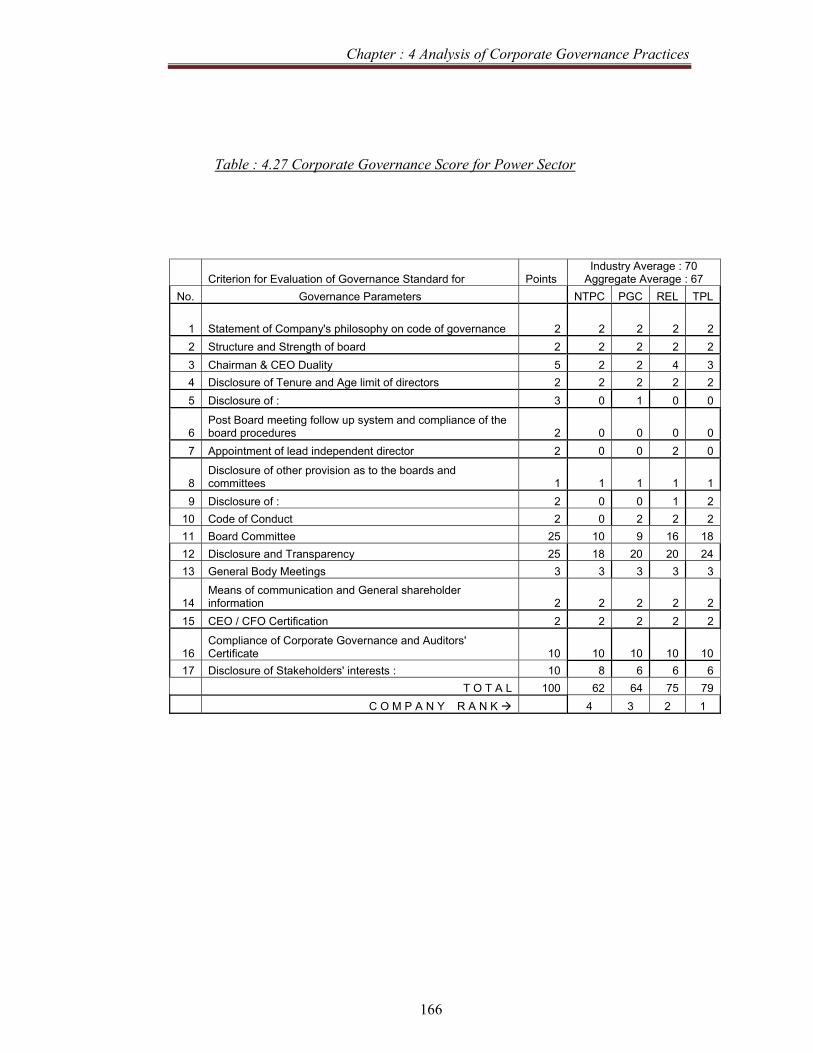
Chapter : 4 Analysis of Corporate Governance Practices
166
Table : 4.27 Corporate Governance Score for Power Sector
Criterion for Evaluation of Governance Standard for Points Industry Average : 70
Aggregate Average : 67 No. Governance Parameters NTPC PGC REL TPL
1 Statement of Company's philosophy on code of governance 2 2 2 2 22 Structure and Strength of board 2 2 2 2 23 Chairman & CEO Duality 5 2 2 4 34 Disclosure of Tenure and Age limit of directors 2 2 2 2 25 Disclosure of : 3 0 1 0 0
6 Post Board meeting follow up system and compliance of the board procedures 2 0 0 0 0
7 Appointment of lead independent director 2 0 0 2 0
8 Disclosure of other provision as to the boards and committees 1 1 1 1 1
9 Disclosure of : 2 0 0 1 2 10 Code of Conduct 2 0 2 2 2 11 Board Committee 25 10 9 16 18 12 Disclosure and Transparency 25 18 20 20 2413 General Body Meetings 3 3 3 3 3
14 Means of communication and General shareholder information 2 2 2 2 2
15 CEO / CFO Certification 2 2 2 2 2
16 Compliance of Corporate Governance and Auditors' Certificate 10 10 10 10 10
17 Disclosure of Stakeholders' interests : 10 8 6 6 6 T O T A L 100 62 64 75 79
C O M P A N Y R A N K 4 3 2 1
Chapter : 4 Analysis of Corporate Governance Practices
167
Power Industry - Analysis of Corporate Governance Score
1. Statement of Company's philosophy on code of governance:
In the Power sector there are 4 sample companies, as mentioned earlier, the
first score point having a weightage of 2 was, statement of Company’s
philosophy on Corporate Governance All companies get the expected score of
2 as all companies have sufficient disclosure of the statement of Company's
philosophy on code of governance.
2. Structure and Strength of board
In the Corporate Governance score, the second score point was about the
Structure and Strength of the board having a weightage of 2. All companies
get the expected score of 2. All companies have sufficiently disclosed the
composition of the Board of Directors.
3. Chairman and CEO Duality
As mentioned earlier, this point carries a weightage of 5. No company among
this sample is assigned a score of 5 as no company is having Non Executive
Independent Chairman. REL is having Non Promoter Non Executive
Chairman therefore it is assigned a score of 4. TPL is have a Promoter Non
Executive Chairman hence are assigned a score of 3. While NTPC and PGC
are having non-promoter Executive Chairman and is assigned a score of 2.
4. Disclosure of Tenure and Age limit of directors
As mentioned earlier, this point was assigned a weightage of 2. All companies
have sufficiently provided the details of this section. Hence they get the
expected score of 2.
5. Disclosure of Definition and selection criteria for (Independent) Directors
As mentioned earlier, this point was assigned a weightage of 3. PGC have
disclosed details about one of the definitions. However, None of the
companies have disclosed definition of ‘Financial Expert’ and selection
criteria for board members (including independent director). Therefore PGC is
assigned a score of 1 whereas remaining companies get a Zero Score.

Chapter : 4 Analysis of Corporate Governance Practices
168
6. Post Board meeting follow up system and compliance of the board procedures
This point was assigned a weightage of 2. The systematic disclosure about the
Post Board meeting follow up system is not sufficiently available in any
annual report of the sample companies. Hence, none of the sample companies
could get any point in this section.
7. Appointment of Lead Independent Director
This point is about appointment of lead independent director and carries a
weightage of 2. Among the sample, REL has appointed lead independent
director. Hence, REL gets a score of 2 whereas other sample companies could
get any point in this section.
8. Disclosure of other provision as to the boards and committees
The point about disclosure of other provision as to the boards and committees
carries a weightage of 1. It is observed that all companies have sufficiently
disclosed about the various committees and sub-committees of the board.
Hence, all companies get expected score of 1.
9. Disclosure of Remuneration Policy & Remuneration of Directors
This point is about the disclosure of Remuneration Policy & Remuneration of
Directors and it carries a weightage of 2. TPL have sufficiently disclosed
about remuneration to directors and remuneration policy. However, REL has
provided only one part of it in detail, hence it is assigned a score of 1.
However all other sample companies get a Zero score.
10. Code of Conduct
As mentioned earlier, this point is about code of conduct and carries a
weightage of 2. The point was further equally divided into two points,
(i) Information on Code of Conduct and
(ii) Affirmation regarding compliance for code of conduct.

Chapter : 4 Analysis of Corporate Governance Practices
169
It is observed that all the companies (except NTPC) have sufficiently
disclosed about both the above points. Hence, all companies (except NTPC)
get expected score of 2 whereas NTPC gets a Zero score.
11. Board Committees
In the Corporate Governance score, the eleventh point is about the various
committees of the board. The point carries a weightage of 25 on a scale of
100. The sub classification of the point is as under.
Sr. No. Particulars PointsI Audit Committee 8 ii Remuneration Committee 6 iii Shareholders' / Investors Grievance Committee 5 iv Nomination Committee 2 V Other Committees 4
Total 25
a. Audit Committee
The Audit Committee is assigned a weightage of 8. It is observed that
all companies have made sufficient disclosure about the audit
committee. The PGC have not clarified about information about
participation of head of finance, statutory auditor and chief internal
auditor in the committee meeting. NTPC have not adequately disclosed
about audit committee charter and terms of reference. Other sample
companies have sufficiently disclosed committee charter and terms of
reference. However, none of among the sample companies, have
published Audit Committee Report in the annual report. Hence, REL
and TPL get expected score of 7, NTPC get a score of 6, and PGC gets
a score of 5.

Chapter : 4 Analysis of Corporate Governance Practices
170
b. Remuneration / Compensation Committee
The Remuneration/Compensation Committee is assigned a weightage
of 6. It is observed that two of the sample companies (REL and TPL)
have formed the committee. They have also made sufficient disclosure.
NTPC and PGC have not formed the same committee. However, none
of among the sample companies has published Remuneration
Committee Report in the annual report. Hence, REL and TPL get the
score of 5. However, NTPC and PGC get the ZERO score in this
section.
c. Shareholders' / Investors Grievance Committee
The Shareholders' / Investors Grievance Committee is assigned a
weightage of 5. It is observed that all the sample companies have
formed the committee. However, none of the sample companies
(except TPL) have published information about the investors /
shareholders’ survey (if conducted). The Report of this committee is
also not published by any of the sample companies. Hence, all
companies except Century get the score of 3.
d. Nomination Committee
The Nomination Committee was assigned a weightage of 2. It is
observed that none of the sample companies (except TPL) have formed
this committee). Hence, all companies (except TPL) get the ZERO
score. Whereas, TPL gets a score of 2.
e. Other Committees
The formation of other committees is assigned a weightage of 4. Its
classification is already mentioned earlier. Health Safety and
Environment Committee is formed by REL. Ethics and compliance
Committee is formed by TPL is formed by all sample companies.
Investment committee is formed by NTPC. Share Transfer Committee
is formed by PGC. Hence, all companies except gets a score of 1.
Chapter : 4 Analysis of Corporate Governance Practices
171
12. Disclosure and Transparency
This is the point is about the various disclosure and transparency shown by the
company in the annual report. The point is assigned a weightage of 25. The
classification of the point is already mentioned earlier.
It is observed that
i) All sample companies have sufficiently disclosed about
significant related party transactions.
ii) All sample companies have adequately disclosed about Non
Compliance related to capital market matters during last three
years.
iii) All sample companies have clearly mentioned about the
accounting treatments and significant changes in their
accounting policy.
iv) All sample companies have given sufficient information about
risk management and policies of the board.
However, no sample company has published risk management
report.
v) All sample companies have published the Management
Discussion and Analysis as a part of the annual report.
vi) All sample companies have sufficiently disclosed the
shareholders’ information.
vii) All the sample companies have published rights of the share
holders as a part of their annual report.
viii) All sample companies are clear from any audit qualification.
ix) PGC and TPL have given information about the training to
board members. However, it is not given by other sample
companies.
x) TPL have systematically informed about evaluation of Non
Executive Director. Whereas other companies have not
disclosed about it.
xi) REL & TPL have given information about the Whistle Blower
Policy. However, it is not given by other sample companies.
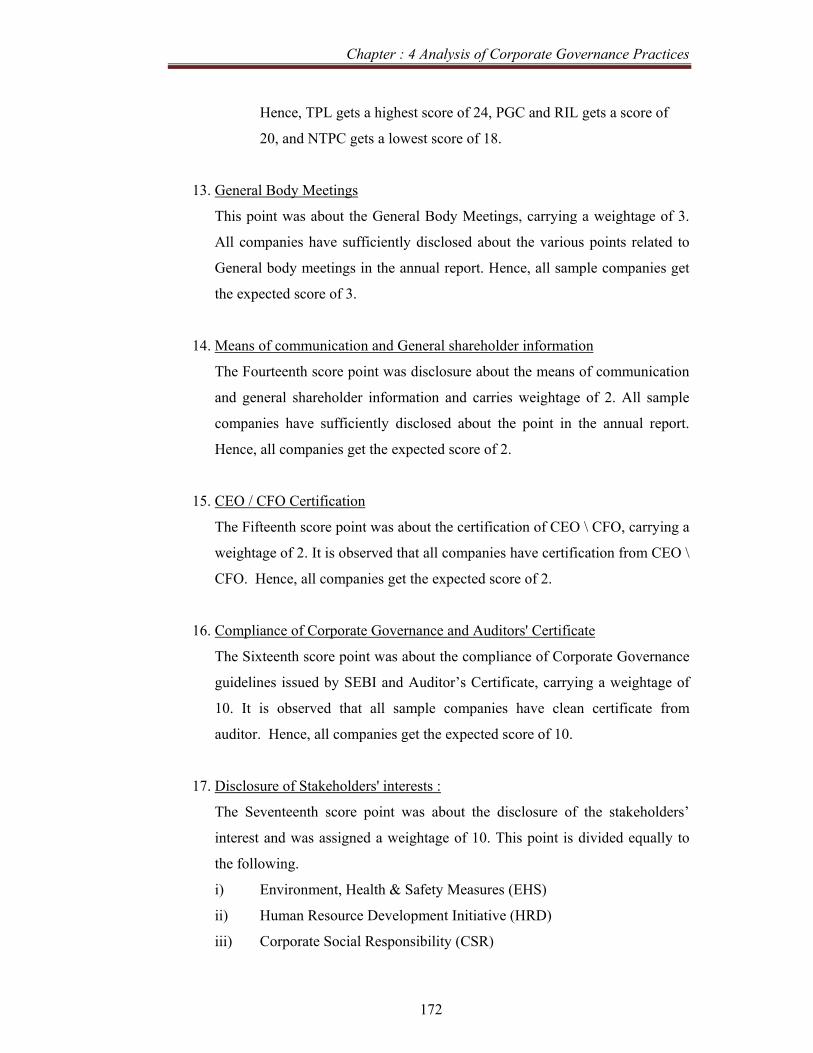
Chapter : 4 Analysis of Corporate Governance Practices
172
Hence, TPL gets a highest score of 24, PGC and RIL gets a score of
20, and NTPC gets a lowest score of 18.
13. General Body Meetings
This point was about the General Body Meetings, carrying a weightage of 3.
All companies have sufficiently disclosed about the various points related to
General body meetings in the annual report. Hence, all sample companies get
the expected score of 3.
14. Means of communication and General shareholder information
The Fourteenth score point was disclosure about the means of communication
and general shareholder information and carries weightage of 2. All sample
companies have sufficiently disclosed about the point in the annual report.
Hence, all companies get the expected score of 2.
15. CEO / CFO Certification
The Fifteenth score point was about the certification of CEO \ CFO, carrying a
weightage of 2. It is observed that all companies have certification from CEO \
CFO. Hence, all companies get the expected score of 2.
16. Compliance of Corporate Governance and Auditors' Certificate
The Sixteenth score point was about the compliance of Corporate Governance
guidelines issued by SEBI and Auditor’s Certificate, carrying a weightage of
10. It is observed that all sample companies have clean certificate from
auditor. Hence, all companies get the expected score of 10.
17. Disclosure of Stakeholders' interests :
The Seventeenth score point was about the disclosure of the stakeholders’
interest and was assigned a weightage of 10. This point is divided equally to
the following.
i) Environment, Health & Safety Measures (EHS)
ii) Human Resource Development Initiative (HRD)
iii) Corporate Social Responsibility (CSR)

Chapter : 4 Analysis of Corporate Governance Practices
173
iv) Industrial Relation (IR)
v) Disclosure of policies on EHS, HRD, CSR & IR
It is observed that most of the companies have provided information about above
mentioned points in various forms. EHS, HRD, CSR & IR policies are not disclosed
adequately in the report of any sample companies. All sample companies have
sufficiently provided details about CSR and IR. Whereas EHS and HRD related
activities are adequately mentioned in all sample companies. Therefore, NTPC gets
the score of 8 whereas PGC, REL and TPL gets a score of 6.
The Power Industry’s score of the respected companies can be summarized with the
help of following graph as under.
Graph : 4.10 : Corporate Governance score Power Industry
Hence, Tata Power Ltd gets highest score of 79 whereas NTPC gets the lowest score
of 62. The Industry Average Score of Power industry is higher then aggregate score of
all Industries.

Chapter : 4 Analysis of Corporate Governance Practices
174
Telecom Industry
The following companies represent the telecom industry in BSE 100 index.
The researcher has covered these companies in order to study the corporate
governance trends in the Power industry.
Table : 4.28 Sample Companies in Telecom Sector
Sr. No. Company Abbreviation
1 Bharti Airtel Ltd. BAL
2 Idea Cellular Ltd ICL
3 Mahanagar Telephone Nigam Ltd. MTNL
4 Reliance Communications Ltd. RCL
5 Tata Communications Ltd. TCL
The calculation of the corporate governance score for the Telecom Industry is
as under.

Chapter : 4 Analysis of Corporate Governance Practices
175
Table: 4.29 Corporate Governance Score for Telecom Sector
Criterion for Evaluation of Governance Standard for No.
Industry Average : 66, Aggregate Average : 67
No. Governance Parameters Bharti Idea MTNL Rel Tata
1 Statement of Company's philosophy on code of governance 2 2 2 2 2 2
2 Structure and Strength of board 2 2 2 2 2 23 Chairman & CEO Duality 5 1 3 2 3 54 Disclosure of Tenure and Age limit of directors 2 2 2 0 2 25 Disclosure of : 3 2 0 0 0 1
6 Post Board meeting follow up system and compliance of the board procedures 2 0 0 0 0 0
7 Appointment of lead independent director 2 2 0 0 0 0
8 Disclosure of other provision as to the boards and committees 1 2 2 2 2 2
9 Disclosure of : 2 2 2 2 2 2 10 Code of Conduct 2 2 2 2 2 2 11 Board Committee 25 17 15 8 16 15 12 Disclosure and Transparency 25 20 18 14 22 1813 General Body Meetings 3 3 3 3 3 3
14 Means of communication and General shareholder information 2 2 2 2 2 2
15 CEO / CFO Certification 2 2 2 2 2 2
16 Compliance of Corporate Governance and Auditors' Certificate 10 10 10 5 10 10
17 Disclosure of Stakeholders' interests : 10 4 2 2 2 2 T O T A L 100 75 67 48 72 70
R A N K 1 4 5 2 3
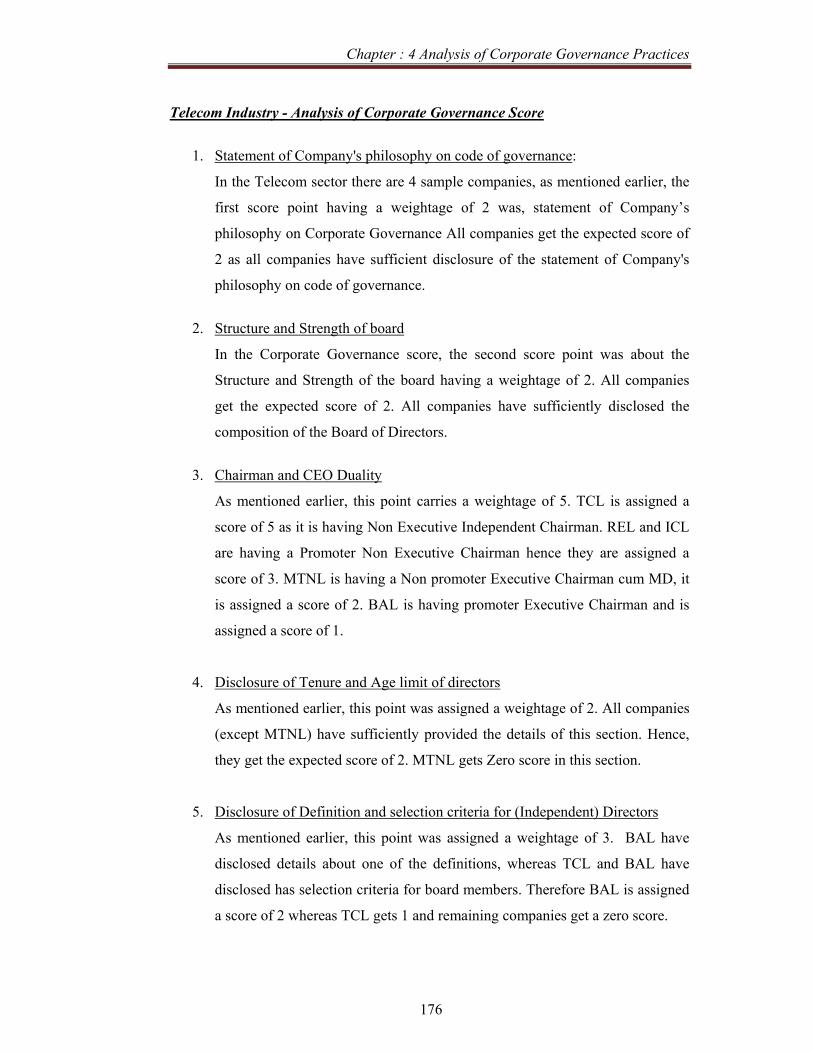
Chapter : 4 Analysis of Corporate Governance Practices
176
Telecom Industry - Analysis of Corporate Governance Score
1. Statement of Company's philosophy on code of governance:
In the Telecom sector there are 4 sample companies, as mentioned earlier, the
first score point having a weightage of 2 was, statement of Company’s
philosophy on Corporate Governance All companies get the expected score of
2 as all companies have sufficient disclosure of the statement of Company's
philosophy on code of governance.
2. Structure and Strength of board
In the Corporate Governance score, the second score point was about the
Structure and Strength of the board having a weightage of 2. All companies
get the expected score of 2. All companies have sufficiently disclosed the
composition of the Board of Directors.
3. Chairman and CEO Duality
As mentioned earlier, this point carries a weightage of 5. TCL is assigned a
score of 5 as it is having Non Executive Independent Chairman. REL and ICL
are having a Promoter Non Executive Chairman hence they are assigned a
score of 3. MTNL is having a Non promoter Executive Chairman cum MD, it
is assigned a score of 2. BAL is having promoter Executive Chairman and is
assigned a score of 1.
4. Disclosure of Tenure and Age limit of directors
As mentioned earlier, this point was assigned a weightage of 2. All companies
(except MTNL) have sufficiently provided the details of this section. Hence,
they get the expected score of 2. MTNL gets Zero score in this section.
5. Disclosure of Definition and selection criteria for (Independent) Directors
As mentioned earlier, this point was assigned a weightage of 3. BAL have
disclosed details about one of the definitions, whereas TCL and BAL have
disclosed has selection criteria for board members. Therefore BAL is assigned
a score of 2 whereas TCL gets 1 and remaining companies get a zero score.
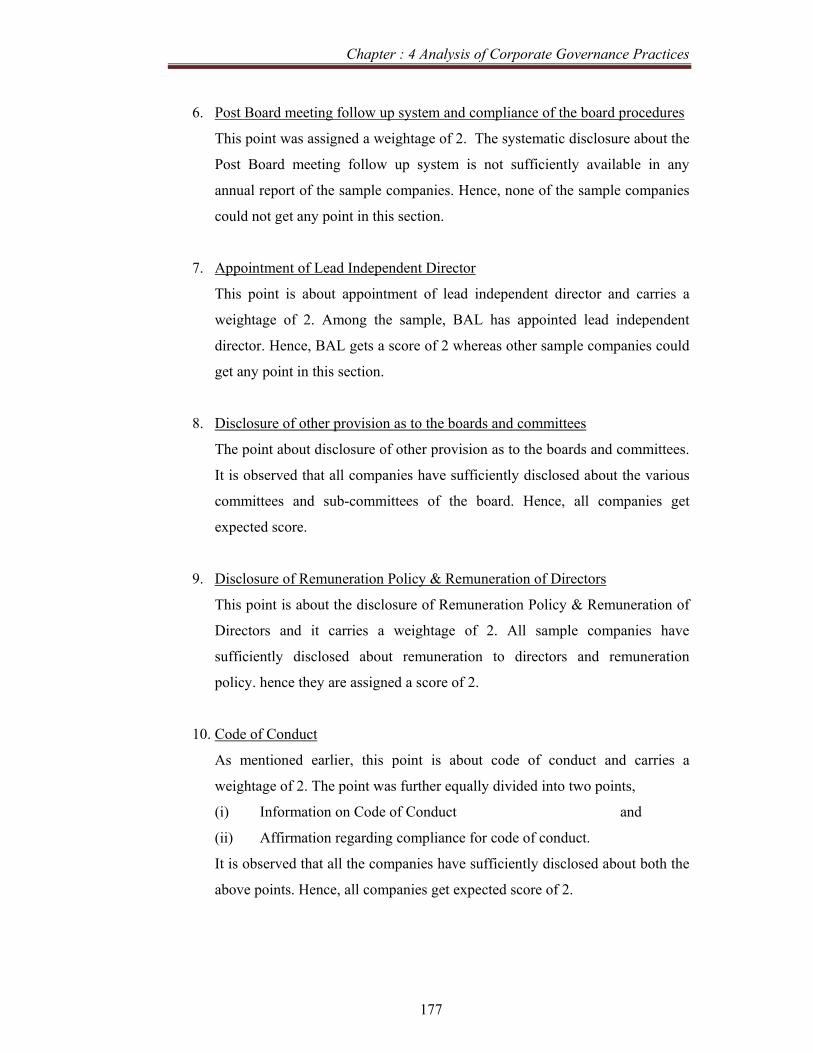
Chapter : 4 Analysis of Corporate Governance Practices
177
6. Post Board meeting follow up system and compliance of the board procedures
This point was assigned a weightage of 2. The systematic disclosure about the
Post Board meeting follow up system is not sufficiently available in any
annual report of the sample companies. Hence, none of the sample companies
could not get any point in this section.
7. Appointment of Lead Independent Director
This point is about appointment of lead independent director and carries a
weightage of 2. Among the sample, BAL has appointed lead independent
director. Hence, BAL gets a score of 2 whereas other sample companies could
get any point in this section.
8. Disclosure of other provision as to the boards and committees
The point about disclosure of other provision as to the boards and committees.
It is observed that all companies have sufficiently disclosed about the various
committees and sub-committees of the board. Hence, all companies get
expected score.
9. Disclosure of Remuneration Policy & Remuneration of Directors
This point is about the disclosure of Remuneration Policy & Remuneration of
Directors and it carries a weightage of 2. All sample companies have
sufficiently disclosed about remuneration to directors and remuneration
policy. hence they are assigned a score of 2.
10. Code of Conduct
As mentioned earlier, this point is about code of conduct and carries a
weightage of 2. The point was further equally divided into two points,
(i) Information on Code of Conduct and
(ii) Affirmation regarding compliance for code of conduct.
It is observed that all the companies have sufficiently disclosed about both the
above points. Hence, all companies get expected score of 2.
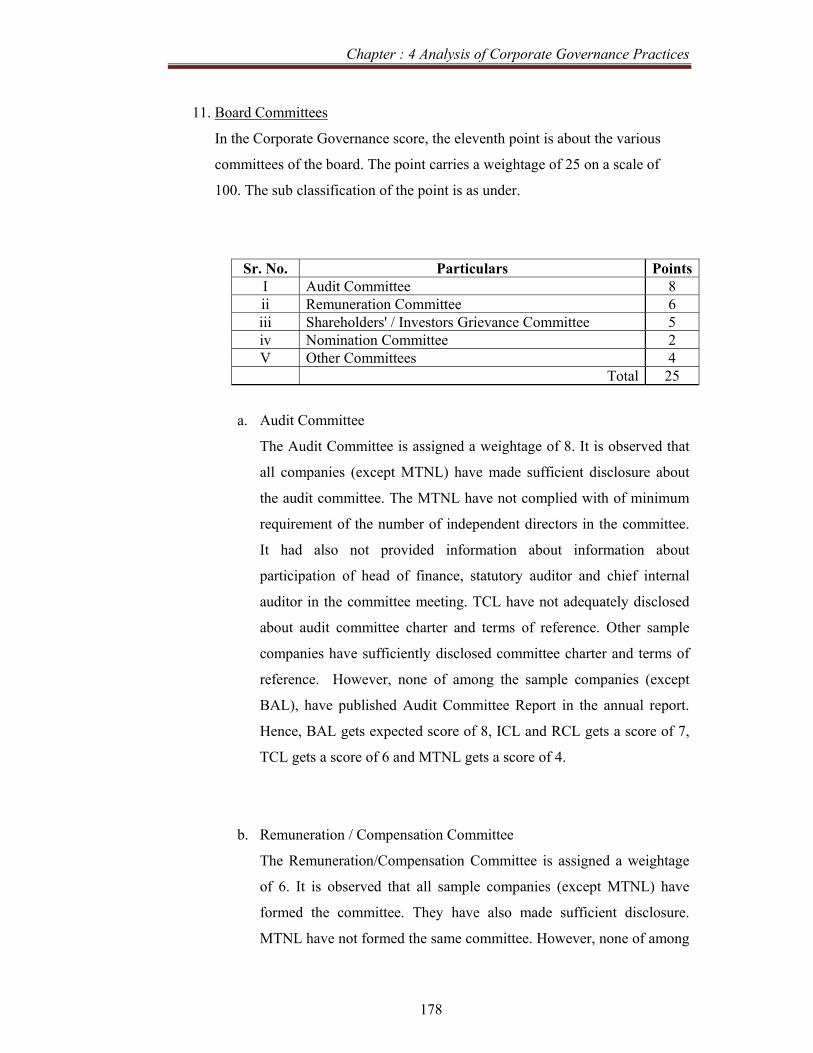
Chapter : 4 Analysis of Corporate Governance Practices
178
11. Board Committees
In the Corporate Governance score, the eleventh point is about the various
committees of the board. The point carries a weightage of 25 on a scale of
100. The sub classification of the point is as under.
Sr. No. Particulars PointsI Audit Committee 8 ii Remuneration Committee 6 iii Shareholders' / Investors Grievance Committee 5 iv Nomination Committee 2 V Other Committees 4
Total 25
a. Audit Committee
The Audit Committee is assigned a weightage of 8. It is observed that
all companies (except MTNL) have made sufficient disclosure about
the audit committee. The MTNL have not complied with of minimum
requirement of the number of independent directors in the committee.
It had also not provided information about information about
participation of head of finance, statutory auditor and chief internal
auditor in the committee meeting. TCL have not adequately disclosed
about audit committee charter and terms of reference. Other sample
companies have sufficiently disclosed committee charter and terms of
reference. However, none of among the sample companies (except
BAL), have published Audit Committee Report in the annual report.
Hence, BAL gets expected score of 8, ICL and RCL gets a score of 7,
TCL gets a score of 6 and MTNL gets a score of 4.
b. Remuneration / Compensation Committee
The Remuneration/Compensation Committee is assigned a weightage
of 6. It is observed that all sample companies (except MTNL) have
formed the committee. They have also made sufficient disclosure.
MTNL have not formed the same committee. However, none of among

Chapter : 4 Analysis of Corporate Governance Practices
179
the sample companies has published Remuneration Committee Report
in the annual report. Hence, all sample companies (except MTNL) gets
the score of 5. However, MTNL gets the ZERO score in this section.
c. Shareholders' / Investors Grievance Committee
The Shareholders' / Investors Grievance Committee is assigned a
weightage of 5. It is observed that all the sample companies have
formed the committee. However, none of the sample companies have
published information about the investors / shareholders’ survey (if
conducted). The Report of this committee is also not published by any
of the sample companies. Hence, all companies except Century get the
score of 3.
d. Nomination Committee
The Nomination Committee was assigned a weightage of 2. It is
observed that none of the sample companies (except RCL) have
formed this committee). Hence, all companies (except RCL) get the
ZERO score. Whereas, RCL gets a score of 2.
e. Other Committees
The formation of other committees is assigned a weightage of 4. Its
classification is already mentioned earlier. Health Safety and
Environment Committee is not formed by any of the sample
companies. Ethics and compliance Committee is formed by TCL is
formed by all sample companies. Investment committee is formed by
BAL. Share Transfer Committee is formed by MTNL. Hence, all
companies except RCL and ICL gets a score of 1.
12. Disclosure and Transparency
This is the point is about the various disclosure and transparency shown by the
company in the annual report. The point is assigned a weightage of 25. The
classification of the point is already mentioned earlier.
It is observed that

Chapter : 4 Analysis of Corporate Governance Practices
180
i) All sample companies have sufficiently disclosed about
significant related party transactions.
ii) All sample companies have adequately disclosed about Non
Compliance related to capital market matters during last three
years.
iii) All sample companies (except MTNL) have clearly mentioned
about the accounting treatments and significant changes in their
accounting policy.
iv) All sample companies have given sufficient information about
risk management and policies of the board.
However, no sample company has published risk management
report.
v) All sample companies have published the Management
Discussion and Analysis as a part of the annual report.
vi) All sample companies have sufficiently disclosed the
shareholders’ information.
vii) All the sample companies (except MTNL and TCL) have
published rights of the share holders as a part of their annual
report.
viii) All sample companies are clear from any audit qualification.
ix) RCL have given information about the training to board
members. However, it is not given by other sample companies.
x) None of the sample companies have systematically informed
about evaluation of Non Executive Director. Whereas other
companies have not disclosed about it.
xi) BAL, RCL and TCL have given information about the Whistle
Blower Policy. However, it is not given by other sample
companies.
Hence, BAL gets a highest score of 17, RCL gets a score of 16, ICL
and TCL gets a score of 15. Whereas MTNL gets a lowest score of 8.
Chapter : 4 Analysis of Corporate Governance Practices
181
13. General Body Meetings
This point was about the General Body Meetings, carrying a weightage of 3.
All companies have sufficiently disclosed about the various points related to
General body meetings in the annual report. Hence, all sample companies get
the expected score of 3.
14. Means of communication and General shareholder information
The Fourteenth score point was disclosure about the means of communication
and general shareholder information and carries weightage of 2. All sample
companies have sufficiently disclosed about the point in the annual report.
Hence, all companies get the expected score of 2.
15. CEO / CFO Certification
The Fifteenth score point was about the certification of CEO \ CFO, carrying a
weightage of 2. It is observed that all companies have certification from CEO \
CFO. Hence, all companies get the expected score of 2.
16. Compliance of Corporate Governance and Auditors' Certificate
The Sixteenth score point was about the compliance of Corporate Governance
guidelines issued by SEBI and Auditor’s Certificate, carrying a weightage of
10. It is observed that all sample (except MTNL) companies have clean
certificate from auditor. Hence, all companies get the expected score of 10.
MTNL gets a score of 5.
17. Disclosure of Stakeholders' interests :
The Seventeenth score point was about the disclosure of the stakeholders’
interest and was assigned a weightage of 10. This point is divided equally to
the following.
i) Environment, Health & Safety Measures (EHS)
ii) Human Resource Development Initiative (HRD)
iii) Corporate Social Responsibility (CSR)
iv) Industrial Relation (IR)
v) Disclosure of policies on EHS, HRD, CSR & IR
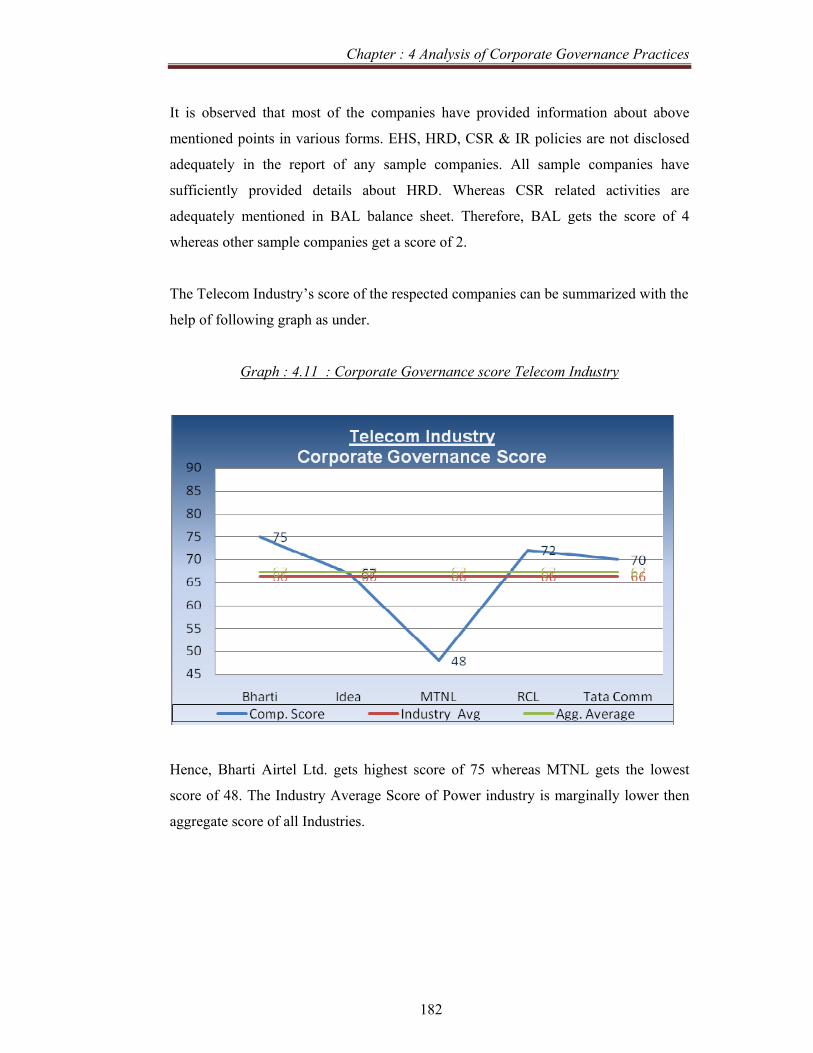
Chapter : 4 Analysis of Corporate Governance Practices
182
It is observed that most of the companies have provided information about above
mentioned points in various forms. EHS, HRD, CSR & IR policies are not disclosed
adequately in the report of any sample companies. All sample companies have
sufficiently provided details about HRD. Whereas CSR related activities are
adequately mentioned in BAL balance sheet. Therefore, BAL gets the score of 4
whereas other sample companies get a score of 2.
The Telecom Industry’s score of the respected companies can be summarized with the
help of following graph as under.
Graph : 4.11 : Corporate Governance score Telecom Industry
Hence, Bharti Airtel Ltd. gets highest score of 75 whereas MTNL gets the lowest
score of 48. The Industry Average Score of Power industry is marginally lower then
aggregate score of all Industries.
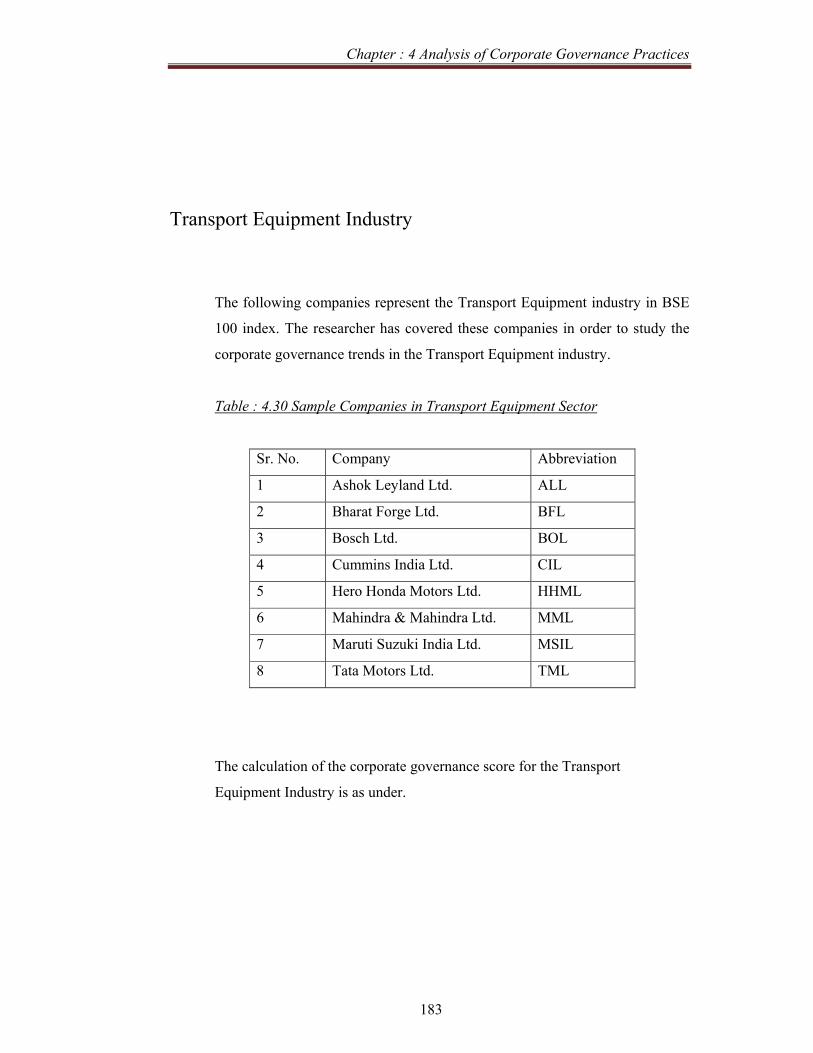
Chapter : 4 Analysis of Corporate Governance Practices
183
Transport Equipment Industry
The following companies represent the Transport Equipment industry in BSE
100 index. The researcher has covered these companies in order to study the
corporate governance trends in the Transport Equipment industry.
Table : 4.30 Sample Companies in Transport Equipment Sector
Sr. No. Company Abbreviation
1 Ashok Leyland Ltd. ALL
2 Bharat Forge Ltd. BFL
3 Bosch Ltd. BOL
4 Cummins India Ltd. CIL
5 Hero Honda Motors Ltd. HHML
6 Mahindra & Mahindra Ltd. MML
7 Maruti Suzuki India Ltd. MSIL
8 Tata Motors Ltd. TML
The calculation of the corporate governance score for the Transport
Equipment Industry is as under.

Chapter : 4 Analysis of Corporate Governance Practices
184
Table : 4.31 Corporate Governance Score for Transport Equipment Sector
Criterion for Evaluation . Industry Average : 67, Aggregate Average : 67
No. Governance Parameters Pts
Ashok L BhFL Bosch
Cum IL
Hero H M&M
Maruti S
Tata Motors
1
Statement of Company's philosophy on code of governance 2 2 2 2 2 2 2 2 2
2 Structure and Strength of board 2 2 2 2 2 2 2 2 2
3 Chairman & CEO Duality 5 3 1 3 1 1 3 4 3
4
Disclosure of Tenure and Age limit of directors 2 2 2 2 2 2 2 2 2
5 Disclosure of : 3 0 0 0 0 0 0 0 0
6
Post Board meeting follow up system and compliance of the board procedures 2 0 0 0 0 0 2 0 0
7
Appointment of lead independent director 2 0 0 0 0 0 0 0 0
8
Disclosure of other provision as to the boards and committees 1 1 1 1 1 1 1 1 1
9 Disclosure of : 2 2 1 1 1 2 2 1 2 10 Code of Conduct 2 2 2 2 2 2 2 2 2 11 Board Committee 25 17 10 16 10 14 16 10 19
12 Disclosure and Transparency 25 18 16 18 16 18 18 18 24
13 General Body Meetings 3 3 3 3 3 3 3 3 3
14
Means of communication and General shareholder information 2 2 2 2 2 2 2 2 2
15 CEO / CFO Certification 2 2 2 2 2 2 2 2 2
16
Compliance of Corporate Governance and Auditors' Certificate 10 10 10 10 10 10 10 10 10
17
Disclosure of Stakeholders' interests : 10 2 4 8 4 4 4 4 8
T O T A L 100 68 58 72 58 65 71 63 82 COMPANY RANK 4 7 2 7 5 3 6 1
Chapter : 4 Analysis of Corporate Governance Practices
185
Transport Equipment Industry - Analysis of Corporate Governance Score
1. Statement of Company's philosophy on code of governance:
In the Transport sector there are 8 sample companies, as mentioned earlier, the
first score point having a weightage of 2 was, statement of Company’s
philosophy on Corporate Governance All companies get the expected score of
2 as all companies have sufficient disclosure of the statement of Company's
philosophy on code of governance.
2. Structure and Strength of board
In the Corporate Governance score, the second score point was about the
Structure and Strength of the board having a weightage of 2. All companies
get the expected score of 2. All companies have sufficiently disclosed the
composition of the Board of Directors.
3. Chairman and CEO Duality
As mentioned earlier, this point carries a weightage of 5. None among sample
companies is assigned a score of 5 as they do not have a Non Executive
Independent Chairman. MSIL is assigned a score of 4 as it has Non Promoter
Non Executive Chairman. ALL, BOL, MML and TML are having a Promoter
Non Executive Chairman hence they are assigned a score of 3. BFL, CIL and
HHML are having promoter Executive Chairman and is assigned a score of 1.
4. Disclosure of Tenure and Age limit of directors
As mentioned earlier, this point was assigned a weightage of 2. All companies
have sufficiently provided the details of this section. Hence, they get the
expected score of 2.
5. Disclosure of Definition and selection criteria for (Independent) Directors
As mentioned earlier, this point was assigned a weightage of 3. None of the
sample companies have disclosed details about it hence all get a Zero score.
Chapter : 4 Analysis of Corporate Governance Practices
186
6. Post Board meeting follow up system and compliance of the board procedures
This point was assigned a weightage of 2. The systematic disclosure about the
Post Board meeting follow up system is not sufficiently available in any
annual report of the sample companies (except MML). Hence, MML gets a
score of 2, whereas other sample companies could not get any point in this
section.
7. Appointment of Lead Independent Director
This point is about appointment of lead independent director and carries a
weightage of 2. Among the sample, none of the companies has appointed lead
independent director. Hence, none of the sample companies could get any
point in this section.
8. Disclosure of other provision as to the boards and committees
The point about disclosure of other provision as to the boards and committees.
It is observed that all companies have sufficiently disclosed about the various
committees and sub-committees of the board. Hence, all companies get
expected score.
9. Disclosure of Remuneration Policy & Remuneration of Directors
This point is about the disclosure of Remuneration Policy & Remuneration of
Directors and it carries a weightage of 2. All sample companies have
sufficiently disclosed about remuneration to directors and remuneration
policy. hence they are assigned a score of 2.
10. Code of Conduct
As mentioned earlier, this point is about code of conduct and carries a
weightage of 2. The point was further equally divided into two points,
(i) Information on Code of Conduct and
(ii) Affirmation regarding compliance for code of conduct.
It is observed that all the companies have sufficiently disclosed about both the
above points. Hence, all companies get expected score of 2.

Chapter : 4 Analysis of Corporate Governance Practices
187
11. Board Committees
In the Corporate Governance score, the eleventh point is about the various
committees of the board. The point carries a weightage of 25 on a scale of
100. The sub classification of the point is as under.
Sr. No. Particulars PointsI Audit Committee 8 ii Remuneration Committee 6 iii Shareholders' / Investors Grievance Committee 5 iv Nomination Committee 2 V Other Committees 4
Total 25
a. Audit Committee
The Audit Committee is assigned a weightage of 8. It is observed that
all companies have made sufficient disclosure about the audit
committee. All sample companies have sufficiently disclosed
committee charter and terms of reference. However, none of among
the sample companies (except ALL), have published Audit Committee
Report in the annual report. Hence, ALL gets expected score of 8,
remaining sample companies gets a score of gets a score of 7.
b. Remuneration / Compensation Committee
The Remuneration/Compensation Committee is assigned a weightage
of 6. It is observed that all sample companies (except BFL, CIL,
MSIL) have formed the committee. They have also made sufficient
disclosure. BFL, CIL, MSIL have not formed the same committee.
However, none of among the sample companies has published
Remuneration Committee Report in the annual report. HHML have not
disclosed about number of committee meetings. Hence, all sample
companies (except BFL, CIL, MSIL) gets the score of 5. However,
HHML gets the 4 score in this section. Remaining sample companies
get a Zero score in it.

Chapter : 4 Analysis of Corporate Governance Practices
188
c. Shareholders' / Investors Grievance Committee
The Shareholders' / Investors Grievance Committee is assigned a
weightage of 5. It is observed that all the sample companies have
formed the committee. However, none of the sample companies
(except ALL & TML) have published information about the investors /
shareholders’ survey (if conducted). ALL & TML have published
survey of investors. The Report of this committee is also not published
by any of the sample companies. Hence, all companies except ALL &
TML get the score of 3. ALL and TML gets a score of 4.
d. Nomination Committee
The Nomination Committee was assigned a weightage of 2. It is
observed that none of the sample companies (except TML) have
formed this committee). Hence, all companies (except TML) get the
ZERO score. Whereas, TML gets a score of 1.
e. Other Committees
The formation of other committees is assigned a weightage of 4. Its
classification is already mentioned earlier. Health Safety and
Environment Committee is formed by TML. Ethics and compliance
Committee is also formed by TML. Investment committee is formed
by HHML. Share Transfer Committee is formed by BOL and HHML.
Hence, TML gets a score of 2. BOL, HHML and MML gets a score of
1. Remaining sample companies gets a zero score.
12. Disclosure and Transparency
This is the point is about the various disclosure and transparency shown by the
company in the annual report. The point is assigned a weightage of 25. The
classification of the point is already mentioned earlier.
It is observed that
i) All sample companies have sufficiently disclosed about
significant related party transactions.
Chapter : 4 Analysis of Corporate Governance Practices
189
ii) All sample companies have adequately disclosed about Non
Compliance related to capital market matters during last three
years.
iii) All sample companies have clearly mentioned about the
accounting treatments and significant changes in their
accounting policy.
iv) All sample companies have given sufficient information about
risk management and policies of the board.
However, no sample company has published risk management
report.
v) All sample companies have published the Management
Discussion and Analysis as a part of the annual report.
vi) All sample companies have sufficiently disclosed the
shareholders’ information.
vii) All the sample companies (except CIL and MSIL) have
published rights of the share holders as a part of their annual
report.
viii) All sample companies (except ALL,BFL,BOL &CIL) are clear
from any audit qualification.
ix) TML have given information about the training to board
members. However, it is not given by other sample companies.
x) None of the sample companies (except TML) have
systematically informed about evaluation of Non Executive
Director. Whereas other companies have not disclosed about it.
xi) ALL,BOL, CIL, MSIL and TML have given information about
the Whistle Blower Policy. However, it is not given by other
sample companies.
Hence, TML gets a highest score of 24, BFL and CIL gets a score of
16,. Whereas remaining sample companies gets a score of 18.
Chapter : 4 Analysis of Corporate Governance Practices
190
13. General Body Meetings
This point was about the General Body Meetings, carrying a weightage of 3.
All companies have sufficiently disclosed about the various points related to
General body meetings in the annual report. Hence, all sample companies get
the expected score of 3.
14. Means of communication and General shareholder information
The Fourteenth score point was disclosure about the means of communication
and general shareholder information and carries weightage of 2. All sample
companies have sufficiently disclosed about the point in the annual report.
Hence, all companies get the expected score of 2.
15. CEO / CFO Certification
The Fifteenth score point was about the certification of CEO \ CFO, carrying a
weightage of 2. It is observed that all companies have certification from CEO \
CFO. Hence, all companies get the expected score of 2.
16. Compliance of Corporate Governance and Auditors' Certificate
The Sixteenth score point was about the compliance of Corporate Governance
guidelines issued by SEBI and Auditor’s Certificate, carrying a weightage of
10. It is observed that all sample companies have clean certificate from
auditor. Hence, all companies get the expected score of 10.
17. Disclosure of Stakeholders' interests :
The Seventeenth score point was about the disclosure of the stakeholders’
interest and was assigned a weightage of 10. This point is divided equally to
the following.
i) Environment, Health & Safety Measures (EHS)
ii) Human Resource Development Initiative (HRD)
iii) Corporate Social Responsibility (CSR)
iv) Industrial Relation (IR)
v) Disclosure of policies on EHS, HRD, CSR & IR
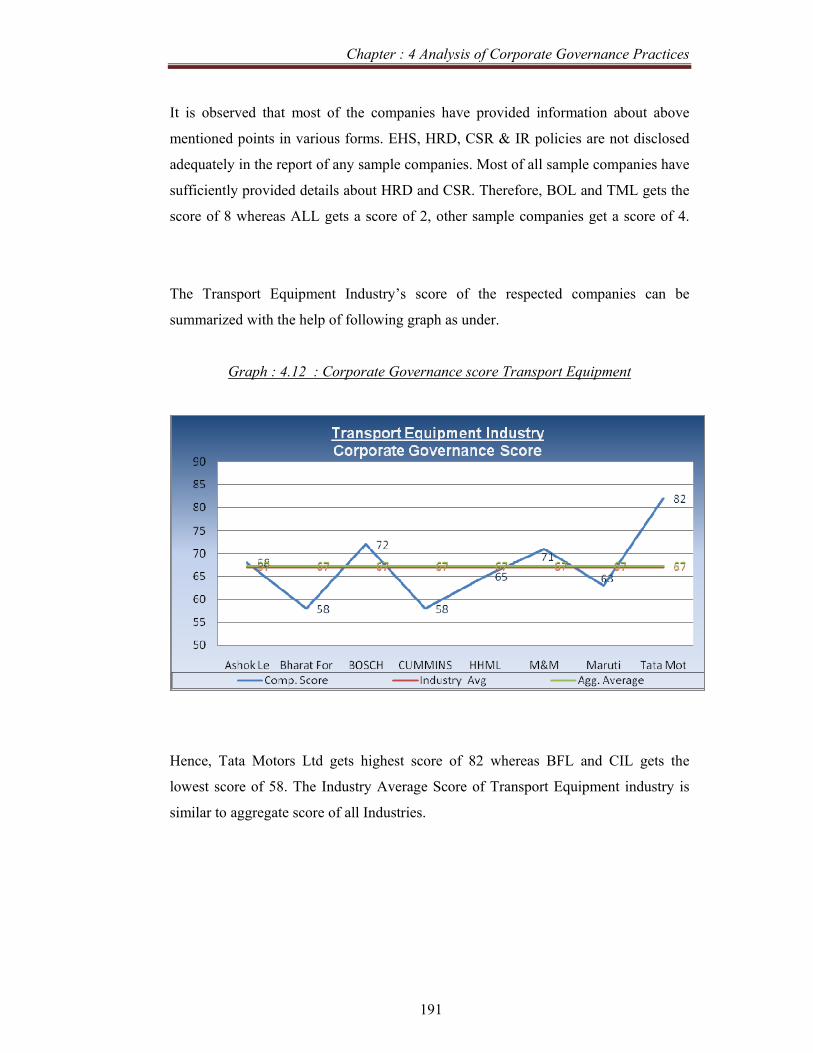
Chapter : 4 Analysis of Corporate Governance Practices
191
It is observed that most of the companies have provided information about above
mentioned points in various forms. EHS, HRD, CSR & IR policies are not disclosed
adequately in the report of any sample companies. Most of all sample companies have
sufficiently provided details about HRD and CSR. Therefore, BOL and TML gets the
score of 8 whereas ALL gets a score of 2, other sample companies get a score of 4.
The Transport Equipment Industry’s score of the respected companies can be
summarized with the help of following graph as under.
Graph : 4.12 : Corporate Governance score Transport Equipment
Hence, Tata Motors Ltd gets highest score of 82 whereas BFL and CIL gets the
lowest score of 58. The Industry Average Score of Transport Equipment industry is
similar to aggregate score of all Industries.

Chapter : 4 Analysis of Corporate Governance Practices
192
Summary of Corporate Governance Score of Various Industries
The corporate governance score of various industry is summarized as under :
Table : 4.32 Summary of Corporate Governance Score for various industries
Sr. No. Sector No. of
CompaniesAverage of Sector
Maximum Score
MinimumScore
1 Capital Goods 08 63 69 59
2 Diversified 06 66 71 57
3 Finance 13 70 80 60
4 FMCG 05 71 78 62
5 Healthcare 07 67 82 54
6 Housing Related 08 66 71 60
7 Information
Technology 07 71 91 55
8 Mining, Metal Products 08 65 75 54
9 Oil and Gas 11 68 80 52
10 Power 04 70 79 62
11 Telecom 05 66 75 48
12 Transport Equipments 08 67 82 58
Total Companies 90
Aggregate Average 67
As indicated in above table, the sector of IT and FMCG sector are highest in corporate
governance score (71) where as capital goods sector is lowest with 63 point score.

SGN
Chapter: 5
Analysis of Financial Performance of Companies
• Evaluation of the Financial Performance
o Capital Goods Sector
o Diversified Sector
o Finance and Financial Services Sector
o FMCG Sector
o Healthcare related sector
o Housing Related Sector
o Information Technology related sector
o Metal, Metallurgy and Mining related sector
o Oil and Gas Related Sector
o Power Sector
o Telecom Sector
o Transport Equipment Sector
o Aggregate of all sectors
• Testing of Hypothesis
Chapter : 5 Analysis of Financial Performance of Companies
194
Evaluation of the Financial Performance.
As mentioned in Chapter 2, there are several tools available for analyzing the
financial performance of a company. However, the following parameters are used to
analyze the financial performance for this research.
a) EBIT / SALES Ratio:
This ratio is used to analyze the operational efficiency of the company and the
sector. This ratio also indicates the impact of sales on Earnings Before Interest
and Taxes.
b) SALES / TOTAL ASSETS :
Assets are used to generate sales. Therefore, a firm is required to manage the
assets with adequate efficiency to maximize sales. The relationship between
Sales and Total Assets is known as Total Assets Turnover. A high ratio
indicates better utilization of investments made in assets. However, it
ultimately depends upon industry.
c) Earnings Per Share :
Earnings Per Share is net profit divided by number of equity shares. This
indicates earnings earned by company per share during the year. A high EPS
indicates better performance. However, one has to consider the face value of
the share as it varies from Rs. 1 to Rs. 10.
d) Price Earnings Multiple :
This is one of the most popular among the financial analysts to value the
firm’s performance as expected by the shareholders. This can be calculated as
under :
P/E Ratio = Market Value Per Share \ EPS
This ratio indicates investors’ expectations about the firm’s performance & It
also reflects investors’ expectations about the growth in the firm’s earnings.
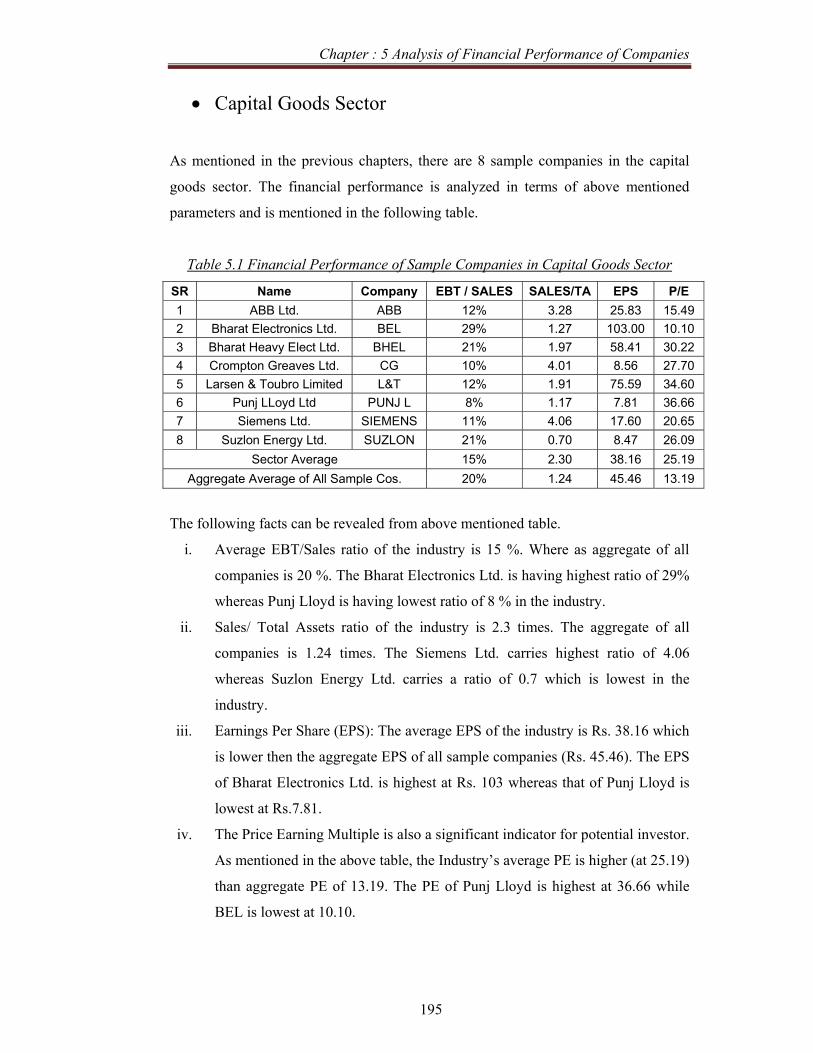
Chapter : 5 Analysis of Financial Performance of Companies
195
• Capital Goods Sector
As mentioned in the previous chapters, there are 8 sample companies in the capital
goods sector. The financial performance is analyzed in terms of above mentioned
parameters and is mentioned in the following table.
Table 5.1 Financial Performance of Sample Companies in Capital Goods Sector
SR Name Company EBT / SALES SALES/TA EPS P/E 1 ABB Ltd. ABB 12% 3.28 25.83 15.49 2 Bharat Electronics Ltd. BEL 29% 1.27 103.00 10.10 3 Bharat Heavy Elect Ltd. BHEL 21% 1.97 58.41 30.22 4 Crompton Greaves Ltd. CG 10% 4.01 8.56 27.70 5 Larsen & Toubro Limited L&T 12% 1.91 75.59 34.60 6 Punj LLoyd Ltd PUNJ L 8% 1.17 7.81 36.66 7 Siemens Ltd. SIEMENS 11% 4.06 17.60 20.65 8 Suzlon Energy Ltd. SUZLON 21% 0.70 8.47 26.09
Sector Average 15% 2.30 38.16 25.19 Aggregate Average of All Sample Cos. 20% 1.24 45.46 13.19
The following facts can be revealed from above mentioned table.
i. Average EBT/Sales ratio of the industry is 15 %. Where as aggregate of all
companies is 20 %. The Bharat Electronics Ltd. is having highest ratio of 29%
whereas Punj Lloyd is having lowest ratio of 8 % in the industry.
ii. Sales/ Total Assets ratio of the industry is 2.3 times. The aggregate of all
companies is 1.24 times. The Siemens Ltd. carries highest ratio of 4.06
whereas Suzlon Energy Ltd. carries a ratio of 0.7 which is lowest in the
industry.
iii. Earnings Per Share (EPS): The average EPS of the industry is Rs. 38.16 which
is lower then the aggregate EPS of all sample companies (Rs. 45.46). The EPS
of Bharat Electronics Ltd. is highest at Rs. 103 whereas that of Punj Lloyd is
lowest at Rs.7.81.
iv. The Price Earning Multiple is also a significant indicator for potential investor.
As mentioned in the above table, the Industry’s average PE is higher (at 25.19)
than aggregate PE of 13.19. The PE of Punj Lloyd is highest at 36.66 while
BEL is lowest at 10.10.

Chapter : 5 Analysis of Financial Performance of Companies
196
For further analysis a correlation is also calculated for further calculation in context of
Corporate Governance Score.
Table 5.2 : Table indicating Correlation between Financial Performance and
Corporate Governance for the sample companies in Capital Goods Sector DIR BC TD GI EBT / SALES SALES/TA EPS P/E DIR 1.00 BC 0.13 1.00 TD 0.33 -0.70 1.00 GI 0.38 0.40 0.00 1.00 EBT / SALES -0.30 -0.57 0.41 0.12 1.00 SALES/TA 0.80 0.15 -0.01 0.17 -0.53 1.00 EPS 0.03 -0.59 0.45 -0.31 0.65 -0.31 1.00 P/E -0.37 0.71 -0.83 -0.24 -0.52 -0.21 -0.32 1.00
As mentioned in the above table, the following can be analyzed.
i) Directors related disclosure is negatively related with two of the financial
parameters, one is EBT/Sales and the other is P/E multiple. The Directors
related disclosure is positively related with all corporate governance
related parameters.
ii) Board Committees related disclosure is negatively related with two of the
financial parameters, EBT/Sales and EPS. It is also negatively related with
one of the corporate governance parameters i.e. Transparency Disclosure
iii) Transparency Disclosure is negatively related with two of the financial
performance related parameters one is Sales/TA and the other is P/E
Multiple. It is also negatively related with one of the corporate governance
related parameter i.e. Board Committee and is not related with disclosure
of general information.
iv) General Information related disclosure is positively related with all corporate
governance parameters, however, it is negatively related two of the
financial performance parameters, i.e. EPS and P/E.

Chapter : 5 Analysis of Financial Performance of Companies
197
• Diversified Sector As mentioned in the previous chapters, there are 6 sample companies in the
Diversified sector. The financial performance is analyzed in terms of initially
mentioned parameters and is mentioned in the following table.
Table 5.3 Financial Performance of Sample Companies in Diversified Sector
SR Name Company EBT / SALES SALES/TA EPS P/E 1 Adani Enterprises Ltd. AEL 3% 2.63 12.66 38.70 2 Aditya Birla Nuvo Limited ABNL 8% 0.59 26.05 44.19 3 Century Textiles Ind ltd. CTIL 11% 1.18 30.00 21.77 4 GMR Infrastructure Ltd. GMR 58% 0.02 0.37 337.84 5 Grasim Industries Ltd. Grasim 26% 0.97 223.32 11.44 6 Tata Chemicals Ltd. Tata Ch 24% 0.78 42.82 6.07
Average of Sector 22% 1.03 55.87 76.67 Aggregate Average of All Sample Cos. 20% 1.24 45.46 13.19
The following facts can be revealed from above mentioned table.
i. Average EBT/Sales ratio of the industry is 22 %. Where as aggregate of all
companies is 21 %. The GMR Infrastructure Ltd. is having highest ratio of
58% whereas Adani Enterprise Ltd. is having lowest ratio of 3 % in the
industry.
ii. Sales/ Total Assets ratio of the industry is 1.03 times. The aggregate of all
companies is 1.22 times. The Adani Enterprises Ltd. carries highest ratio of
2.63 whereas GMR Infrastructure Ltd. carries a ratio of 0.02 which is lowest
in the industry.
iii. Earnings Per Share (EPS): The average EPS of the industry is 55.87 which is
significantly higher than the aggregate EPS of all sample companies. The EPS
of Grasim Industries Ltd. is highest at Rs. 223 whereas that of GMR
Infrastructure Ltd. is lowest at Rs.0.37.
iv. The Price Earning Multiple is also a significant indicator for potential investor.
As mentioned in the above table, the Industry’s average PE is significantly
higher (at 76.67) than aggregate PE of 13.19. The PE of GMR Infrastructure
Ltd. is highest at 337.84 while Tata Chemicals is lowest at 6.07.
For further analysis a correlation is also calculated for further calculation in context of
Corporate Governance Score.

Chapter : 5 Analysis of Financial Performance of Companies
198
Table 5.4 : Table indicating Correlation between Financial Performance and
Corporate Governance for the sample companies in Diversified Sector
DIR BC TD GI EBT / SALES SALES/TA EPS P/E DIR 1.00 BC -0.14 1.00 TD -0.33 0.91 1.00 GI 0.13 0.46 0.32 1.00 EBT / SALES -0.13 0.30 0.02 0.41 1.00 SALES/TA -0.06 0.23 0.54 0.15 -0.71 1.00 EPS 0.22 -0.36 -0.46 0.59 0.02 -0.03 1.00 P/E -0.50 0.31 0.22 0.08 0.84 -0.52 -0.38 1.00
The following facts can be revealed from above mentioned table.
i) Director’s related disclosure is positively related with all corporate governance
parameters. It is positively related with three financial parameters, viz.
EBT/Sales, EPS and P/E. It is negatively related with one financial
parameter, Sales/TA.
ii) Board Committees related disclosure is positively related with all Corporate
Governance parameters, it is negatively related with two financial
parameters (Sales/TA and P/E). It is positively associated with remaining
one financial parameter EPS. It is neutral with one financial parameter,
EBT/Sales.
iii) Transparency Disclosure is positively related with all Corporate Governance
related parameters. It positively related three financial performance related
parameters, (EBT/Sales, EPS and P/E). It is negatively related with one
parameter, Sales/TA.
iv) General Information related disclosure is positively related with all Corporate
Governance related parameters. It is also positively related with all
financial performance related parameters.

Chapter : 5 Analysis of Financial Performance of Companies
199
• Financial Services & Banking Sector
As mentioned in the previous chapters, there are 13 sample companies in the banking
and financial services related sector. The financial performance is analyzed in terms
of initially mentioned parameters and is mentioned in the following table.
Table 5.5 Financial Performance of Sample Companies in Financial Services Sector
SR Name Company EBT / SALES SALES/TA EPS P/E 1 AXIS Bank Ltd. AXIS 19% 0.08 31.31 22.76 2 Bank of Baroda BOB 16% 0.08 39.41 6.63 3 Bank Of India BOI 18% 0.08 40.83 5.66 4 HDFC HDFC 41% 0.10 85.28 24.98 5 HDFC Bank Ltd. HDFC B 18% 0.09 45.59 24.13 6 ICICI Bank Ltd. ICICI B 13% 0.10 39.15 19.35 7 Industrial Dev Bank of India IDBI 9% 0.07 10.10 8.07 8 Infrastructure Dev Fin. Co. Ltd. IDFC 34% 0.09 5.36 14.37 9 Kotak Mahindra Bank Ltd. KML 18% 0.27 29.18 18.39
10 Power Finance Corp. Ltd PFC 35% 0.10 10.51 13.13 11 Punjab National Bank PNB 20% 0.08 69.87 6.54 12 Reliance Capital Ltd. RCL 56% 0.14 41.75 25.06 13 State Bank of India SBI 2% 0.08 126.50 12.51
Average of Sector 23% 0.10 44.22 15.50 Aggregate Average of All Sample Cos. 20% 1.24 45.46 13.19
The following facts can be revealed from above mentioned table.
i. Average EBT/Sales ratio of the industry is 23 %. Where as aggregate of all
companies is 20 %. The Reliance Capital Ltd. is having highest ratio of 56%
whereas State Bank of India is having lowest ratio of 2 % in the industry.
ii. Sales/ Total Assets ratio of the industry is 0.10 times. The aggregate of all
companies is 1.22 times. Kotak Mahindra Bank Ltd. carries highest ratio of
0.27 whereas Industrial Development Bank of India carries ratio of 0.07 which
is lowest in the industry.
iii. Earnings Per Share (EPS): The average EPS of the industry is 44.22 which is
very close to the aggregate EPS of all sample companies. The EPS of State
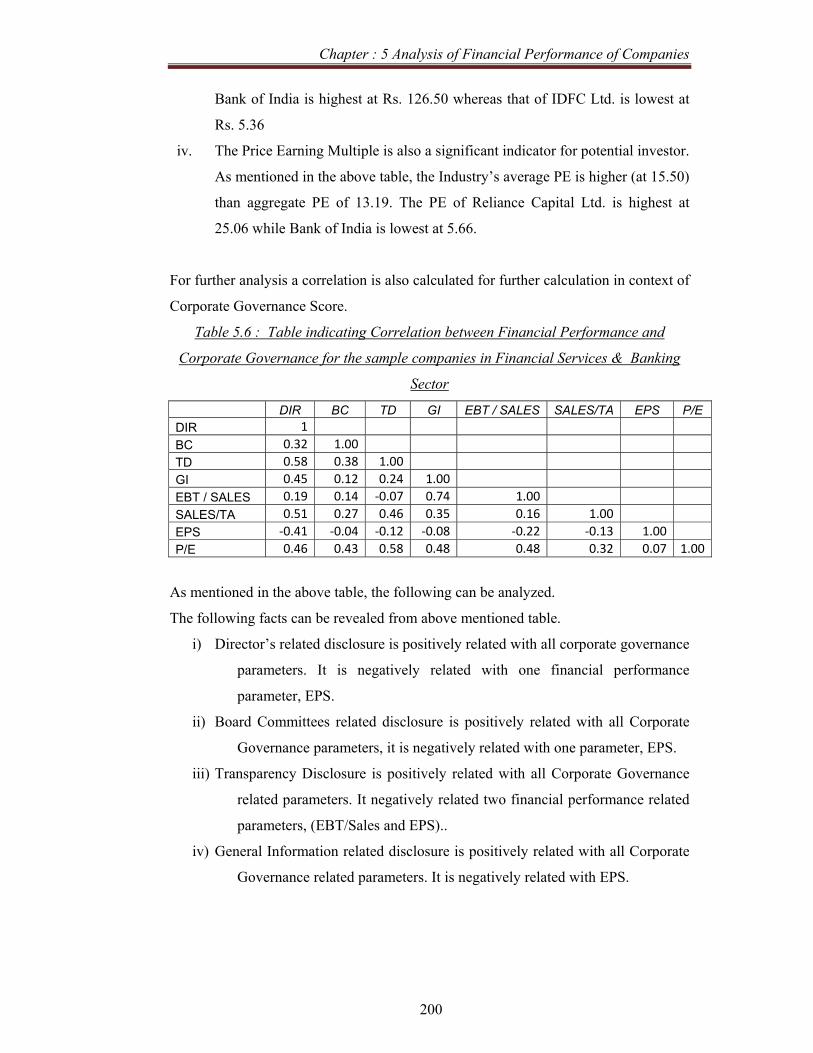
Chapter : 5 Analysis of Financial Performance of Companies
200
Bank of India is highest at Rs. 126.50 whereas that of IDFC Ltd. is lowest at
Rs. 5.36
iv. The Price Earning Multiple is also a significant indicator for potential investor.
As mentioned in the above table, the Industry’s average PE is higher (at 15.50)
than aggregate PE of 13.19. The PE of Reliance Capital Ltd. is highest at
25.06 while Bank of India is lowest at 5.66.
For further analysis a correlation is also calculated for further calculation in context of
Corporate Governance Score.
Table 5.6 : Table indicating Correlation between Financial Performance and
Corporate Governance for the sample companies in Financial Services & Banking
Sector
DIR BC TD GI EBT / SALES SALES/TA EPS P/E DIR 1 BC 0.32 1.00TD 0.58 0.38 1.00GI 0.45 0.12 0.24 1.00EBT / SALES 0.19 0.14 ‐0.07 0.74 1.00SALES/TA 0.51 0.27 0.46 0.35 0.16 1.00 EPS ‐0.41 ‐0.04 ‐0.12 ‐0.08 ‐0.22 ‐0.13 1.00P/E 0.46 0.43 0.58 0.48 0.48 0.32 0.07 1.00
As mentioned in the above table, the following can be analyzed.
The following facts can be revealed from above mentioned table.
i) Director’s related disclosure is positively related with all corporate governance
parameters. It is negatively related with one financial performance
parameter, EPS.
ii) Board Committees related disclosure is positively related with all Corporate
Governance parameters, it is negatively related with one parameter, EPS.
iii) Transparency Disclosure is positively related with all Corporate Governance
related parameters. It negatively related two financial performance related
parameters, (EBT/Sales and EPS)..
iv) General Information related disclosure is positively related with all Corporate
Governance related parameters. It is negatively related with EPS.

Chapter : 5 Analysis of Financial Performance of Companies
201
• FMCG Sector.
As mentioned in the previous chapters, there are 5 sample companies in the Fast
Moving Consumer Goods (FMCG) related sector. The financial performance is
analyzed in terms of initially mentioned parameters and is mentioned in the following
table.
Table 5.7 Financial Performance of Sample Companies in FMCG Sector
SR Name Company EBT / SALES SALES/TA EPS P/E 1 Hindustan Unilever Ltd. HUL 15% 8.38 11.46 18.39 2 ITC Ltd. ITC 21% 1.71 8.29 21.76 3 Nestle India Ltd. Nestle 18% 9.68 55.39 24.10 4 Tata Tea Ltd. Tata Tea 34% 0.44 50.79 14.79 5 United Spirits Ltd. United Sp 15% 1.02 31.84 43.97
Average of Sector 20% 4.25 31.55 24.60 Aggregate Average of All Sample Cos. 20% 1.24 45.46 13.19
The following facts can be revealed from above mentioned table.
i. Average EBT/Sales ratio of the industry is 20 %. Where as aggregate of all
companies is 21 %. The Tata Tea Ltd. is having highest ratio of 34% whereas
Hindustan Unilever Ltd. and United Spirits Ltd. are having lowest ratio of 15
% in the industry.
ii. Sales/ Total Assets ratio of the industry is 4.25 times, which is significantly
higher than aggregate of all companies, which is 1.22 times. Nestle India Ltd.
carries highest ratio of 9.68 whereas Tata Tea Ltd. carries ratio of 0.44 which
is lowest in the industry.
iii. Earnings Per Share (EPS): The average EPS of the industry is Rs. 31.55 which
is lower then the aggregate EPS of all sample companies which is Rs. 45.46 .
The EPS of Nestle India Ltd. is highest at Rs. 55.39 whereas that of ITC Ltd.
is lowest at Rs. 8.29.
iv. The Price Earning Multiple is also a significant indicator for potential investor.
As mentioned in the above table, the Industry’s average PE is higher (at 24.60)
than aggregate PE of 13.19. The PE of United Spirits Ltd is highest at 43.97
while Tata Tea Ltd is lowest at 14.79.
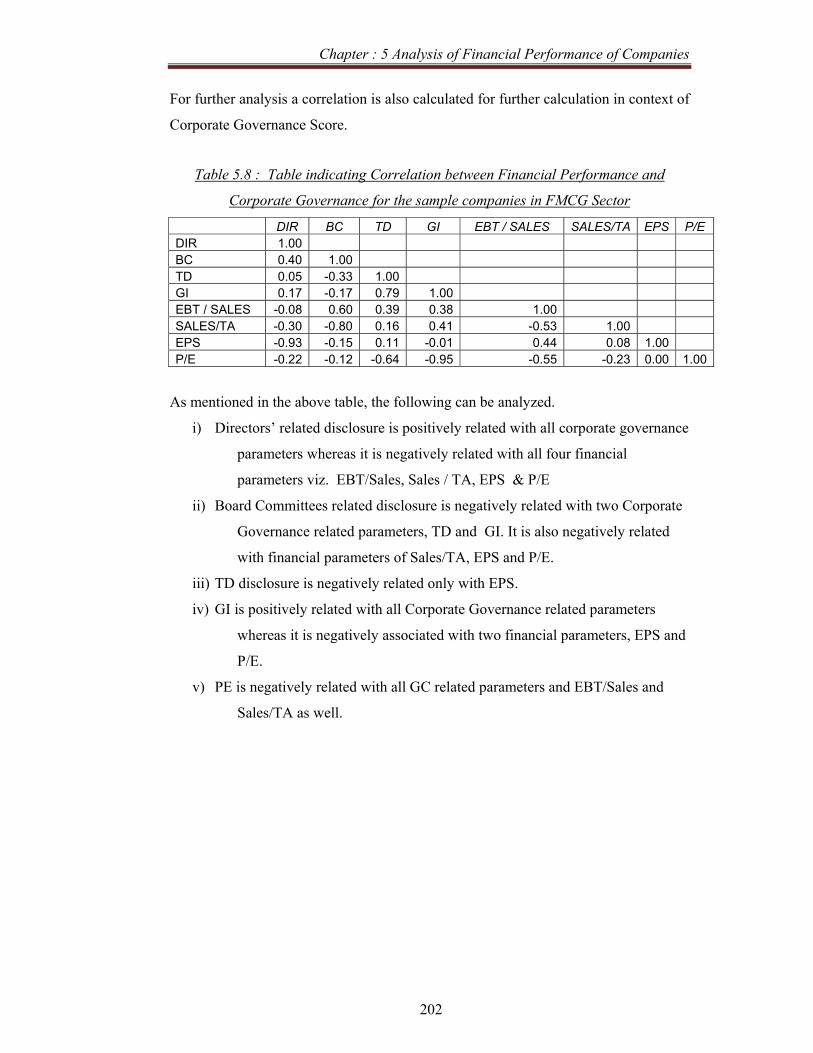
Chapter : 5 Analysis of Financial Performance of Companies
202
For further analysis a correlation is also calculated for further calculation in context of
Corporate Governance Score.
Table 5.8 : Table indicating Correlation between Financial Performance and
Corporate Governance for the sample companies in FMCG Sector
DIR BC TD GI EBT / SALES SALES/TA EPS P/E DIR 1.00 BC 0.40 1.00 TD 0.05 -0.33 1.00 GI 0.17 -0.17 0.79 1.00 EBT / SALES -0.08 0.60 0.39 0.38 1.00 SALES/TA -0.30 -0.80 0.16 0.41 -0.53 1.00 EPS -0.93 -0.15 0.11 -0.01 0.44 0.08 1.00 P/E -0.22 -0.12 -0.64 -0.95 -0.55 -0.23 0.00 1.00
As mentioned in the above table, the following can be analyzed.
i) Directors’ related disclosure is positively related with all corporate governance
parameters whereas it is negatively related with all four financial
parameters viz. EBT/Sales, Sales / TA, EPS & P/E
ii) Board Committees related disclosure is negatively related with two Corporate
Governance related parameters, TD and GI. It is also negatively related
with financial parameters of Sales/TA, EPS and P/E.
iii) TD disclosure is negatively related only with EPS.
iv) GI is positively related with all Corporate Governance related parameters
whereas it is negatively associated with two financial parameters, EPS and
P/E.
v) PE is negatively related with all GC related parameters and EBT/Sales and
Sales/TA as well.
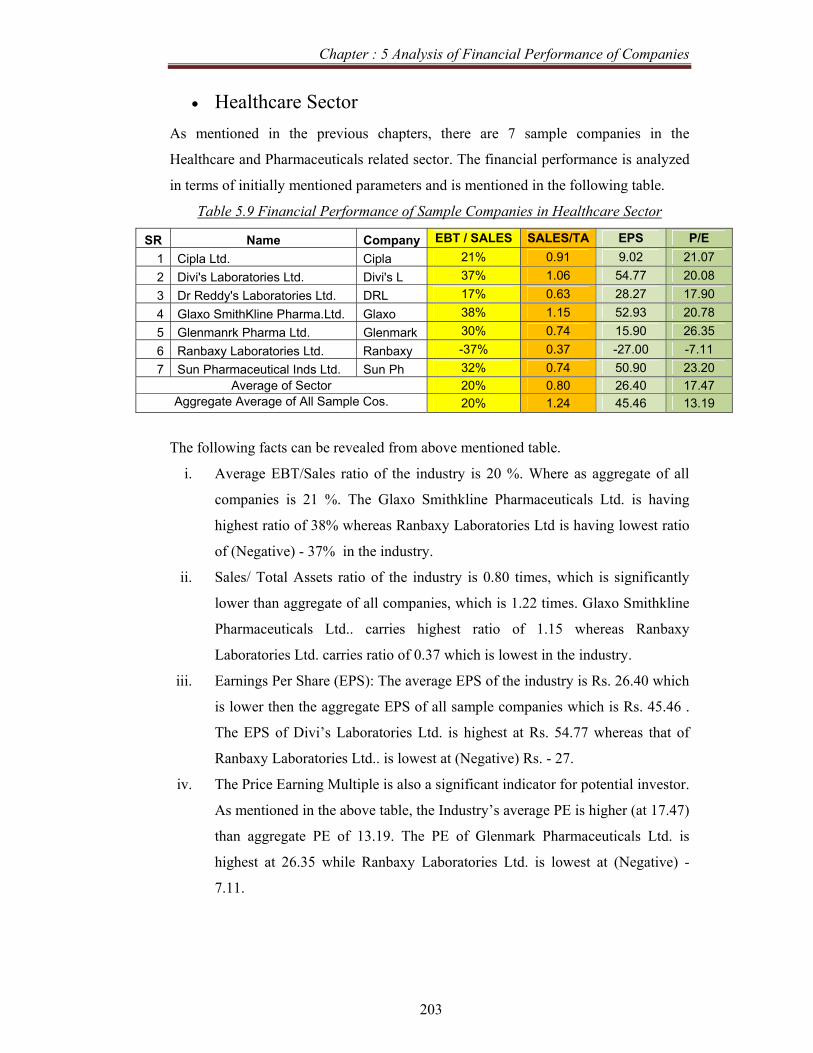
Chapter : 5 Analysis of Financial Performance of Companies
203
• Healthcare Sector
As mentioned in the previous chapters, there are 7 sample companies in the
Healthcare and Pharmaceuticals related sector. The financial performance is analyzed
in terms of initially mentioned parameters and is mentioned in the following table.
Table 5.9 Financial Performance of Sample Companies in Healthcare Sector
SR Name Company EBT / SALES SALES/TA EPS P/E 1 Cipla Ltd. Cipla 21% 0.91 9.02 21.07 2 Divi's Laboratories Ltd. Divi's L 37% 1.06 54.77 20.08 3 Dr Reddy's Laboratories Ltd. DRL 17% 0.63 28.27 17.90 4 Glaxo SmithKline Pharma.Ltd. Glaxo 38% 1.15 52.93 20.78 5 Glenmanrk Pharma Ltd. Glenmark 30% 0.74 15.90 26.35 6 Ranbaxy Laboratories Ltd. Ranbaxy -37% 0.37 -27.00 -7.11 7 Sun Pharmaceutical Inds Ltd. Sun Ph 32% 0.74 50.90 23.20
Average of Sector 20% 0.80 26.40 17.47 Aggregate Average of All Sample Cos. 20% 1.24 45.46 13.19
The following facts can be revealed from above mentioned table.
i. Average EBT/Sales ratio of the industry is 20 %. Where as aggregate of all
companies is 21 %. The Glaxo Smithkline Pharmaceuticals Ltd. is having
highest ratio of 38% whereas Ranbaxy Laboratories Ltd is having lowest ratio
of (Negative) - 37% in the industry.
ii. Sales/ Total Assets ratio of the industry is 0.80 times, which is significantly
lower than aggregate of all companies, which is 1.22 times. Glaxo Smithkline
Pharmaceuticals Ltd.. carries highest ratio of 1.15 whereas Ranbaxy
Laboratories Ltd. carries ratio of 0.37 which is lowest in the industry.
iii. Earnings Per Share (EPS): The average EPS of the industry is Rs. 26.40 which
is lower then the aggregate EPS of all sample companies which is Rs. 45.46 .
The EPS of Divi’s Laboratories Ltd. is highest at Rs. 54.77 whereas that of
Ranbaxy Laboratories Ltd.. is lowest at (Negative) Rs. - 27.
iv. The Price Earning Multiple is also a significant indicator for potential investor.
As mentioned in the above table, the Industry’s average PE is higher (at 17.47)
than aggregate PE of 13.19. The PE of Glenmark Pharmaceuticals Ltd. is
highest at 26.35 while Ranbaxy Laboratories Ltd. is lowest at (Negative) -
7.11.
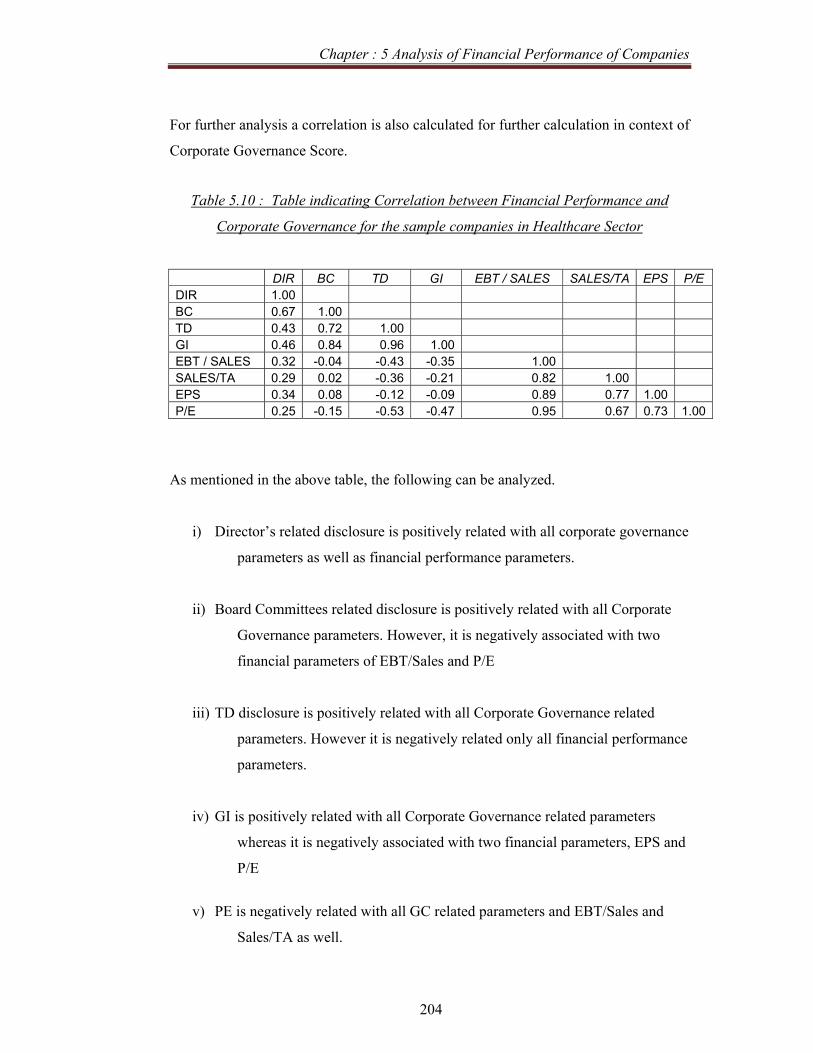
Chapter : 5 Analysis of Financial Performance of Companies
204
For further analysis a correlation is also calculated for further calculation in context of
Corporate Governance Score.
Table 5.10 : Table indicating Correlation between Financial Performance and
Corporate Governance for the sample companies in Healthcare Sector
DIR BC TD GI EBT / SALES SALES/TA EPS P/E DIR 1.00 BC 0.67 1.00 TD 0.43 0.72 1.00 GI 0.46 0.84 0.96 1.00 EBT / SALES 0.32 -0.04 -0.43 -0.35 1.00 SALES/TA 0.29 0.02 -0.36 -0.21 0.82 1.00 EPS 0.34 0.08 -0.12 -0.09 0.89 0.77 1.00 P/E 0.25 -0.15 -0.53 -0.47 0.95 0.67 0.73 1.00
As mentioned in the above table, the following can be analyzed.
i) Director’s related disclosure is positively related with all corporate governance
parameters as well as financial performance parameters.
ii) Board Committees related disclosure is positively related with all Corporate
Governance parameters. However, it is negatively associated with two
financial parameters of EBT/Sales and P/E
iii) TD disclosure is positively related with all Corporate Governance related
parameters. However it is negatively related only all financial performance
parameters.
iv) GI is positively related with all Corporate Governance related parameters
whereas it is negatively associated with two financial parameters, EPS and
P/E
v) PE is negatively related with all GC related parameters and EBT/Sales and
Sales/TA as well.

Chapter : 5 Analysis of Financial Performance of Companies
205
• Housing Related Sector As mentioned in the previous chapters, there are 8 sample companies in the
Housing related sector. The financial performance is analyzed in terms of initially
mentioned parameters and is mentioned in the following table.
Table 5.11 Financial Performance of Sample Companies in Housing Related Sector
SR Name Company EBT / SALES SALES/TA EPS P/E 1 ACC Ltd. ACC 20% 1.50 64.63 5.71 2 Ambuja Cements Ltd. Ambuja 32% 0.98 9.21 5.45 3 DLF Ltd. DLF 51% 0.31 15.48 37.48 4 India Cements Ltd. India Cem. 24% 0.66 23.97 6.74 5 IVRCL Infra & Projects Ltd. IVRCL 8% 1.37 16.08 20.68 6 Jaiprakash Associates Ltd. Jaiprakash 20% 0.32 5.42 34.87 7 Ultratech cement limited Ultratech 24% 1.26 80.94 9.27 8 Unitech Ltd. Unitech 46% 0.29 6.35 38.61
Average of Sector 28% 0.84 27.76 19.85
Aggregate Average of All Sample Cos. 20% 1.24 45.46 13.19
The following facts can be revealed from above mentioned table.
i. Average EBT/Sales ratio of the industry is 28 %. Where as aggregate of all
companies is 21 %. The DLF Ltd. is having highest ratio of 51% whereas
IVRCL Infra and Projects Ltd is having lowest ratio of 8 % in the industry.
ii. Sales/ Total Assets ratio of the industry is 0.84 times, which is significantly
lower than aggregate of all companies, which is 1.22 times. ACC Limited
carries highest ratio of 1.50 whereas Jaiprakash Associates Ltd. carries ratio of
0.32 which is lowest in the industry.
iii. Earnings Per Share (EPS): The average EPS of the industry is Rs. 27.76 which
is lower then the aggregate EPS of all sample companies which is Rs. 45.46 .
The EPS of Ultratech Cement Ltd. is highest at Rs. 80.94 whereas that of
Jaiprakash Associates Ltd. is lowest at Rs. 5.42.
iv. The Price Earning Multiple is also a significant indicator for potential investor.
As mentioned in the above table, the Industry’s average PE is higher (at 19.45)
than aggregate PE of 13.19. The PE of Unitech Ltd. is highest at 38.61 while
Ambuja Cements Ltd. is lowest at 5.45.
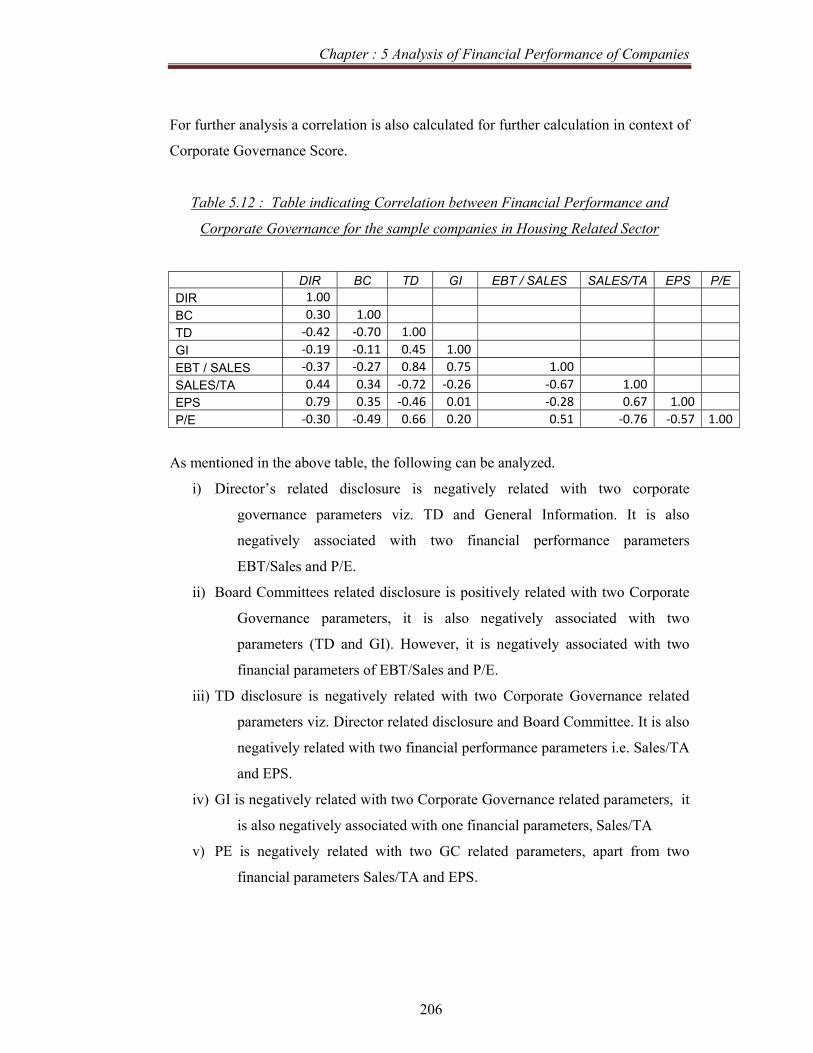
Chapter : 5 Analysis of Financial Performance of Companies
206
For further analysis a correlation is also calculated for further calculation in context of
Corporate Governance Score.
Table 5.12 : Table indicating Correlation between Financial Performance and
Corporate Governance for the sample companies in Housing Related Sector
DIR BC TD GI EBT / SALES SALES/TA EPS P/E DIR 1.00BC 0.30 1.00TD ‐0.42 ‐0.70 1.00GI ‐0.19 ‐0.11 0.45 1.00EBT / SALES ‐0.37 ‐0.27 0.84 0.75 1.00 SALES/TA 0.44 0.34 ‐0.72 ‐0.26 ‐0.67 1.00 EPS 0.79 0.35 ‐0.46 0.01 ‐0.28 0.67 1.00P/E ‐0.30 ‐0.49 0.66 0.20 0.51 ‐0.76 ‐0.57 1.00
As mentioned in the above table, the following can be analyzed.
i) Director’s related disclosure is negatively related with two corporate
governance parameters viz. TD and General Information. It is also
negatively associated with two financial performance parameters
EBT/Sales and P/E.
ii) Board Committees related disclosure is positively related with two Corporate
Governance parameters, it is also negatively associated with two
parameters (TD and GI). However, it is negatively associated with two
financial parameters of EBT/Sales and P/E.
iii) TD disclosure is negatively related with two Corporate Governance related
parameters viz. Director related disclosure and Board Committee. It is also
negatively related with two financial performance parameters i.e. Sales/TA
and EPS.
iv) GI is negatively related with two Corporate Governance related parameters, it
is also negatively associated with one financial parameters, Sales/TA
v) PE is negatively related with two GC related parameters, apart from two
financial parameters Sales/TA and EPS.
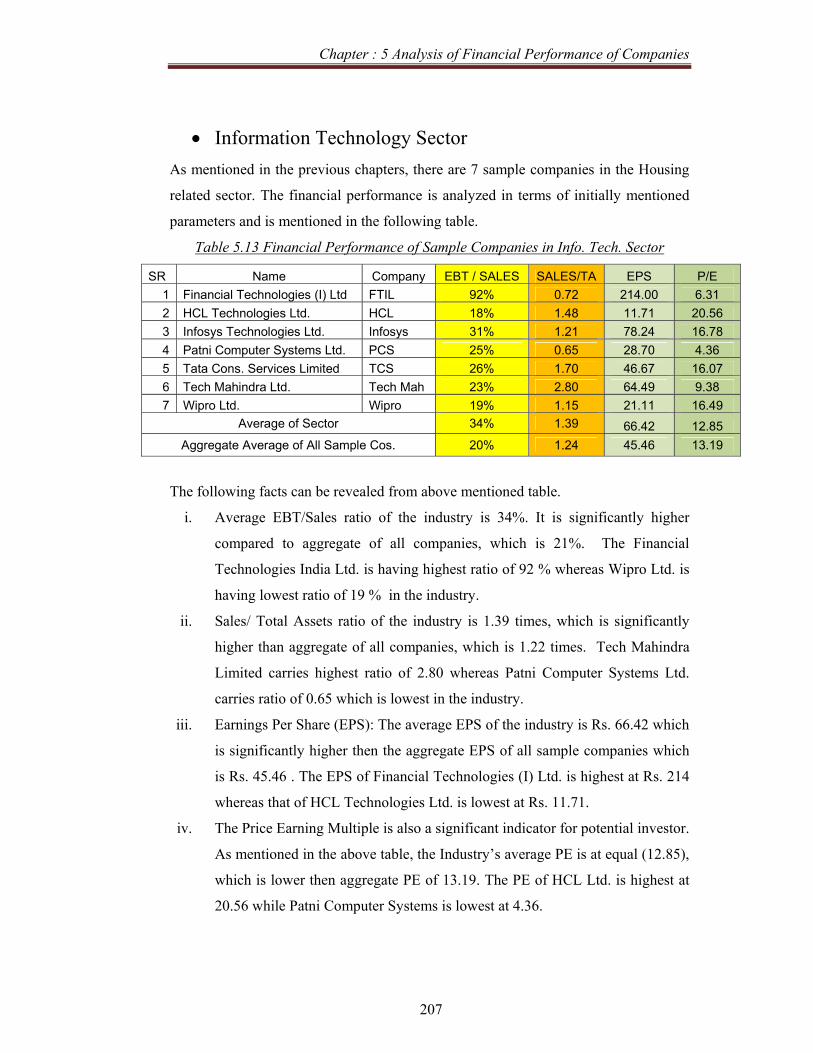
Chapter : 5 Analysis of Financial Performance of Companies
207
• Information Technology Sector As mentioned in the previous chapters, there are 7 sample companies in the Housing
related sector. The financial performance is analyzed in terms of initially mentioned
parameters and is mentioned in the following table.
Table 5.13 Financial Performance of Sample Companies in Info. Tech. Sector
SR Name Company EBT / SALES SALES/TA EPS P/E 1 Financial Technologies (I) Ltd FTIL 92% 0.72 214.00 6.31 2 HCL Technologies Ltd. HCL 18% 1.48 11.71 20.56 3 Infosys Technologies Ltd. Infosys 31% 1.21 78.24 16.78 4 Patni Computer Systems Ltd. PCS 25% 0.65 28.70 4.36 5 Tata Cons. Services Limited TCS 26% 1.70 46.67 16.07 6 Tech Mahindra Ltd. Tech Mah 23% 2.80 64.49 9.38 7 Wipro Ltd. Wipro 19% 1.15 21.11 16.49
Average of Sector 34% 1.39 66.42 12.85 Aggregate Average of All Sample Cos. 20% 1.24 45.46 13.19
The following facts can be revealed from above mentioned table.
i. Average EBT/Sales ratio of the industry is 34%. It is significantly higher
compared to aggregate of all companies, which is 21%. The Financial
Technologies India Ltd. is having highest ratio of 92 % whereas Wipro Ltd. is
having lowest ratio of 19 % in the industry.
ii. Sales/ Total Assets ratio of the industry is 1.39 times, which is significantly
higher than aggregate of all companies, which is 1.22 times. Tech Mahindra
Limited carries highest ratio of 2.80 whereas Patni Computer Systems Ltd.
carries ratio of 0.65 which is lowest in the industry.
iii. Earnings Per Share (EPS): The average EPS of the industry is Rs. 66.42 which
is significantly higher then the aggregate EPS of all sample companies which
is Rs. 45.46 . The EPS of Financial Technologies (I) Ltd. is highest at Rs. 214
whereas that of HCL Technologies Ltd. is lowest at Rs. 11.71.
iv. The Price Earning Multiple is also a significant indicator for potential investor.
As mentioned in the above table, the Industry’s average PE is at equal (12.85),
which is lower then aggregate PE of 13.19. The PE of HCL Ltd. is highest at
20.56 while Patni Computer Systems is lowest at 4.36.

Chapter : 5 Analysis of Financial Performance of Companies
208
For further analysis a correlation is also calculated for further calculation in context of
Corporate Governance Score.
Table 5.14: Table indicating Correlation between Financial Performance and
Corporate Governance for the sample companies in Info Tech Sector
DIR BC TD GI EBT / SALES SALES/TA EPS P/E DIR 1.00 BC 0.77 1.00 TD 0.84 0.56 1.00 GI 0.80 0.92 0.62 1.00 EBT / SALES -0.15 0.09 -0.25 0.16 1.00 SALES/TA 0.03 0.32 -0.16 0.24 -0.42 1.00 EPS -0.02 0.23 -0.20 0.32 0.97 -0.25 1.00 P/E 0.47 0.58 0.49 0.29 -0.49 0.22 -0.49 1.00
i) Director’s related disclosure is positively related with all corporate governance
parameters. It is negatively associated with two financial performance
parameters EBT/Sales and EPS.
ii) Board Committees related disclosure is positively related with all Corporate
Governance parameters, and it is also positively associated all financial
parameters.
iii) Transparency Disclosure is positively related with all Corporate Governance
related parameters. However it is negatively related three financial
performance parameters viz. EBT/Sales, Sales/TA and EPS.
iv) General Information related disclosure is positively related with all Corporate
Governance related parameters. It is positively related with all financial
performance parameters as well.
v) PE is positively related with all GC related parameters; however it is
negatively related with two financial parameters of EBT/Sales and EPS.

Chapter : 5 Analysis of Financial Performance of Companies
209
• Metal, Metal Products and Mining Related Sector As mentioned in the previous chapters, there are 8 sample companies in the Metal,
Metal Products and Mining related sector. The financial performance is analyzed in
terms of initially mentioned parameters and is mentioned in the following table.
Table 5.15 Financial Performance of Sample Companies in Metal & Mining Sector
SR Name Company EBT / SALES SALES/TA EPS P/E 1 Hindalco Industries Ltd. Hindalco 15% 0.73 24.51 6.01 2 Hindustan Zinc Ltd. HZL 69% 0.71 104.04 4.87 3 Jindal Steel & Power Ltd Jindal St 28% 0.67 80.34 21.49 4 JSW Steel Ltd JSW St 19% 0.78 95.26 7.75 5 Sesa Goa Ltd. Sesa Goa 61% 1.29 379.06 7.39 6 Steel Authority of India Ltd. SAIL 27% 1.66 18.25 9.95 7 Sterlite Industries Ltd. Sterlite 8% 0.80 14.10 46.60 8 Tata Steel Ltd. Tata Steel 35% 0.43 67.17 8.82
Average of Sector 33% 0.88 97.84 14.11
Aggregate Average of All Sample Cos. 20% 1.24 45.46 13.19
The following facts can be revealed from above mentioned table.
i. Average EBT/Sales ratio of the industry is 33%. It is significantly higher
compared to aggregate of all companies, which is 21%. The Hindustan Zinc
Ltd. is having highest ratio of 69 % whereas Sterlite Industries Ltd. is having
lowest ratio of 8 % in the industry.
ii. Sales/ Total Assets ratio of the industry is 0.88 times, which is lower than
aggregate of all companies, which is 1.22 times. Steel Authority of India
Limited carries highest ratio of 1.66 whereas Tata Steel Ltd. carries ratio of
0.43 which is lowest in the industry.
iii. Earnings Per Share (EPS): The average EPS of the industry is Rs. 97.84 which
is significantly higher then the aggregate EPS of all sample companies which
is Rs. 45.46 . The EPS of Sesa Goa Ltd. is highest at Rs. 379.06 whereas that
of Sterlite Industries Ltd. is lowest at Rs. 14.10.
iv. The Price Earning Multiple is also a significant indicator for potential investor.
As mentioned in the above table, the Industry’s average PE is marginally
lower (12.88) with aggregate PE of 13.19. The PE of Sterlite Industries Ltd. is
highest at 46.60 while Hindustan Zinc Ltd. is lowest at 4.87.
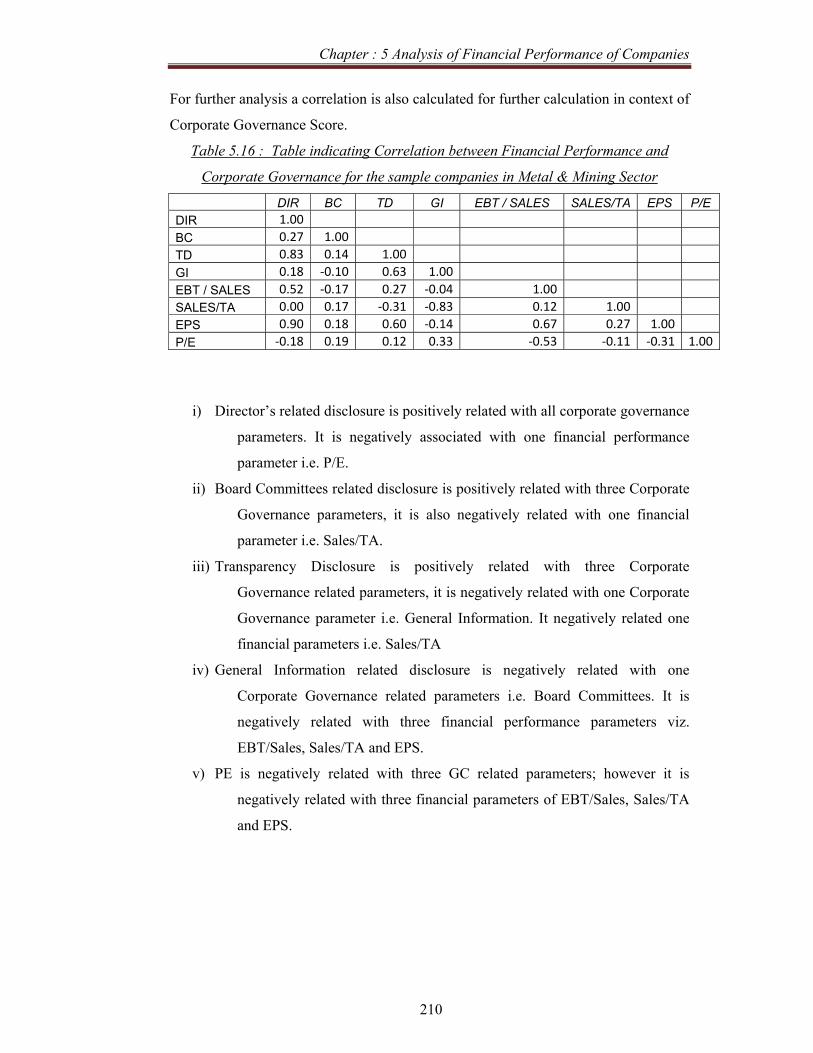
Chapter : 5 Analysis of Financial Performance of Companies
210
For further analysis a correlation is also calculated for further calculation in context of
Corporate Governance Score.
Table 5.16 : Table indicating Correlation between Financial Performance and
Corporate Governance for the sample companies in Metal & Mining Sector
DIR BC TD GI EBT / SALES SALES/TA EPS P/E DIR 1.00 BC 0.27 1.00TD 0.83 0.14 1.00GI 0.18 ‐0.10 0.63 1.00EBT / SALES 0.52 ‐0.17 0.27 ‐0.04 1.00SALES/TA 0.00 0.17 ‐0.31 ‐0.83 0.12 1.00 EPS 0.90 0.18 0.60 ‐0.14 0.67 0.27 1.00P/E ‐0.18 0.19 0.12 0.33 ‐0.53 ‐0.11 ‐0.31 1.00
i) Director’s related disclosure is positively related with all corporate governance
parameters. It is negatively associated with one financial performance
parameter i.e. P/E.
ii) Board Committees related disclosure is positively related with three Corporate
Governance parameters, it is also negatively related with one financial
parameter i.e. Sales/TA.
iii) Transparency Disclosure is positively related with three Corporate
Governance related parameters, it is negatively related with one Corporate
Governance parameter i.e. General Information. It negatively related one
financial parameters i.e. Sales/TA
iv) General Information related disclosure is negatively related with one
Corporate Governance related parameters i.e. Board Committees. It is
negatively related with three financial performance parameters viz.
EBT/Sales, Sales/TA and EPS.
v) PE is negatively related with three GC related parameters; however it is
negatively related with three financial parameters of EBT/Sales, Sales/TA
and EPS.

Chapter : 5 Analysis of Financial Performance of Companies
211
• Oil & Gas Sector As mentioned in the previous chapters, there are 11 sample companies in the
Oil and Gas related sector. The financial performance is analyzed in terms of
initially mentioned parameters and is mentioned in the following table.
Table 5.17 Financial Performance of Sample Companies in Oil and Gas Sector
The following facts can be revealed from above mentioned table.
i. Average EBT/Sales ratio of the industry is almost 0 %. Mainly because of
negative EBT / sales ratio of Cairn India Ltd. The average EBT/Sales ratio is
significantly lower compared to aggregate of all companies, which is 21%.
The ONGC Ltd. is having highest ratio of 39 % whereas Cairn India Ltd. is
having lowest ratio of (Negative) – 138%.
ii. Sales/ Total Assets ratio of the industry is 1.55 times, which is higher than
aggregate of all companies, which is 1.22 times. Bharat Petroleum
Corporation Limited carries highest ratio of 4.37 whereas Cairn India Ltd.
carries ratio of 0.00 which is lowest in the industry.
iii. Earnings Per Share (EPS): The average EPS of the industry is Rs.45.83 which
is almost equal to the aggregate EPS of all sample companies which is Rs.
45.46 . The EPS of Reliance Industries Ltd. is highest at Rs. 133.86 whereas
that of Cairn India Ltd. is lowest at (Negative) Rs. -0.44.
iv. The Price Earning Multiple is also a significant indicator for potential investor.
SR Name Company EBT / SALES SALES/TA EPS P/E 1 Aban Offshore Ltd. Aban 38% 0.26 34.54 74.75 2 Bharat Petroleum Corp Ltd. BPCL 2% 4.37 43.72 8.62 3 Cairn India Ltd. Cairn -138% 0.00 -0.44 -459.66 4 Essar Oil Ltd. Essar Oil -8% 0.04 -0.36 -521.11 5 Gail (India) Ltd. GAIL 21% 1.19 30.76 12.19 6 Hindustan Petroleum Corp Ltd. HPCL 1% 3.59 33.48 7.47 7 Indian Oil Corporation Ltd. IOCL 4% 2.74 58.39 7.19 8 ONGC Ltd. ONGC 39% 0.72 78.09 12.23 9 Reliance Industries Ltd. RIL 17% 0.93 133.86 15.84
10 Reliance Natural Res.Ltd. RNRL 23% 0.13 0.44 211.02 11 Reliance Petroleum Ltd. RPL 0% 0.00 0.00 0.00
Average of Sector 0% 1.55 45.83 -70.16 Aggregate Average of All Sample Cos. 20% 1.24 45.46 13.19
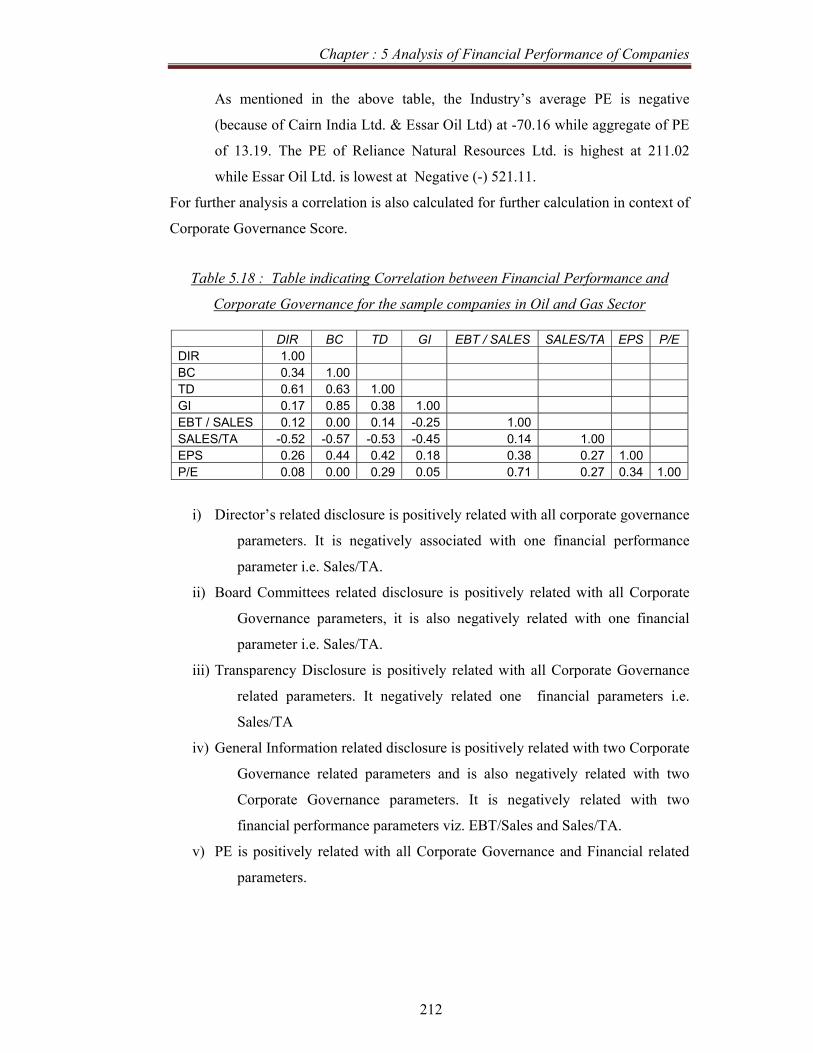
Chapter : 5 Analysis of Financial Performance of Companies
212
As mentioned in the above table, the Industry’s average PE is negative
(because of Cairn India Ltd. & Essar Oil Ltd) at -70.16 while aggregate of PE
of 13.19. The PE of Reliance Natural Resources Ltd. is highest at 211.02
while Essar Oil Ltd. is lowest at Negative (-) 521.11.
For further analysis a correlation is also calculated for further calculation in context of
Corporate Governance Score.
Table 5.18 : Table indicating Correlation between Financial Performance and
Corporate Governance for the sample companies in Oil and Gas Sector
i) Director’s related disclosure is positively related with all corporate governance
parameters. It is negatively associated with one financial performance
parameter i.e. Sales/TA.
ii) Board Committees related disclosure is positively related with all Corporate
Governance parameters, it is also negatively related with one financial
parameter i.e. Sales/TA.
iii) Transparency Disclosure is positively related with all Corporate Governance
related parameters. It negatively related one financial parameters i.e.
Sales/TA
iv) General Information related disclosure is positively related with two Corporate
Governance related parameters and is also negatively related with two
Corporate Governance parameters. It is negatively related with two
financial performance parameters viz. EBT/Sales and Sales/TA.
v) PE is positively related with all Corporate Governance and Financial related
parameters.
DIR BC TD GI EBT / SALES SALES/TA EPS P/E DIR 1.00 BC 0.34 1.00 TD 0.61 0.63 1.00 GI 0.17 0.85 0.38 1.00 EBT / SALES 0.12 0.00 0.14 -0.25 1.00 SALES/TA -0.52 -0.57 -0.53 -0.45 0.14 1.00 EPS 0.26 0.44 0.42 0.18 0.38 0.27 1.00 P/E 0.08 0.00 0.29 0.05 0.71 0.27 0.34 1.00
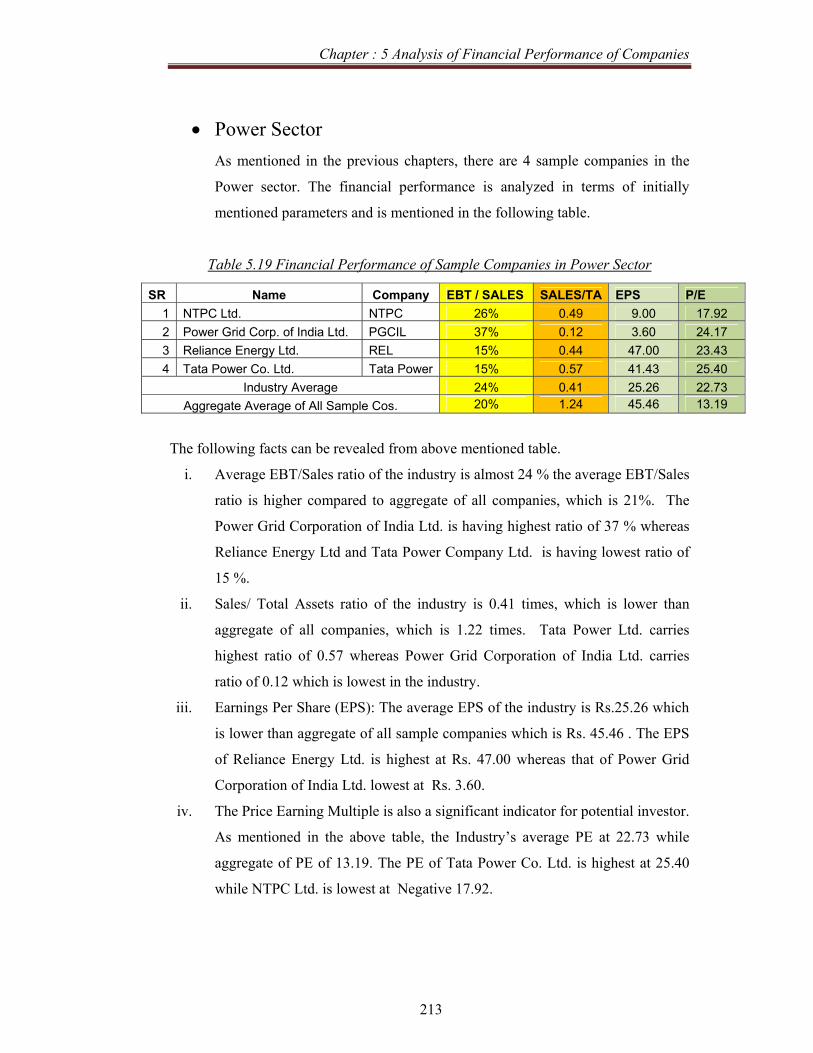
Chapter : 5 Analysis of Financial Performance of Companies
213
• Power Sector As mentioned in the previous chapters, there are 4 sample companies in the
Power sector. The financial performance is analyzed in terms of initially
mentioned parameters and is mentioned in the following table.
Table 5.19 Financial Performance of Sample Companies in Power Sector
The following facts can be revealed from above mentioned table.
i. Average EBT/Sales ratio of the industry is almost 24 % the average EBT/Sales
ratio is higher compared to aggregate of all companies, which is 21%. The
Power Grid Corporation of India Ltd. is having highest ratio of 37 % whereas
Reliance Energy Ltd and Tata Power Company Ltd. is having lowest ratio of
15 %.
ii. Sales/ Total Assets ratio of the industry is 0.41 times, which is lower than
aggregate of all companies, which is 1.22 times. Tata Power Ltd. carries
highest ratio of 0.57 whereas Power Grid Corporation of India Ltd. carries
ratio of 0.12 which is lowest in the industry.
iii. Earnings Per Share (EPS): The average EPS of the industry is Rs.25.26 which
is lower than aggregate of all sample companies which is Rs. 45.46 . The EPS
of Reliance Energy Ltd. is highest at Rs. 47.00 whereas that of Power Grid
Corporation of India Ltd. lowest at Rs. 3.60.
iv. The Price Earning Multiple is also a significant indicator for potential investor.
As mentioned in the above table, the Industry’s average PE at 22.73 while
aggregate of PE of 13.19. The PE of Tata Power Co. Ltd. is highest at 25.40
while NTPC Ltd. is lowest at Negative 17.92.
SR Name Company EBT / SALES SALES/TA EPS P/E 1 NTPC Ltd. NTPC 26% 0.49 9.00 17.92 2 Power Grid Corp. of India Ltd. PGCIL 37% 0.12 3.60 24.17 3 Reliance Energy Ltd. REL 15% 0.44 47.00 23.43 4 Tata Power Co. Ltd. Tata Power 15% 0.57 41.43 25.40
Industry Average 24% 0.41 25.26 22.73 Aggregate Average of All Sample Cos. 20% 1.24 45.46 13.19
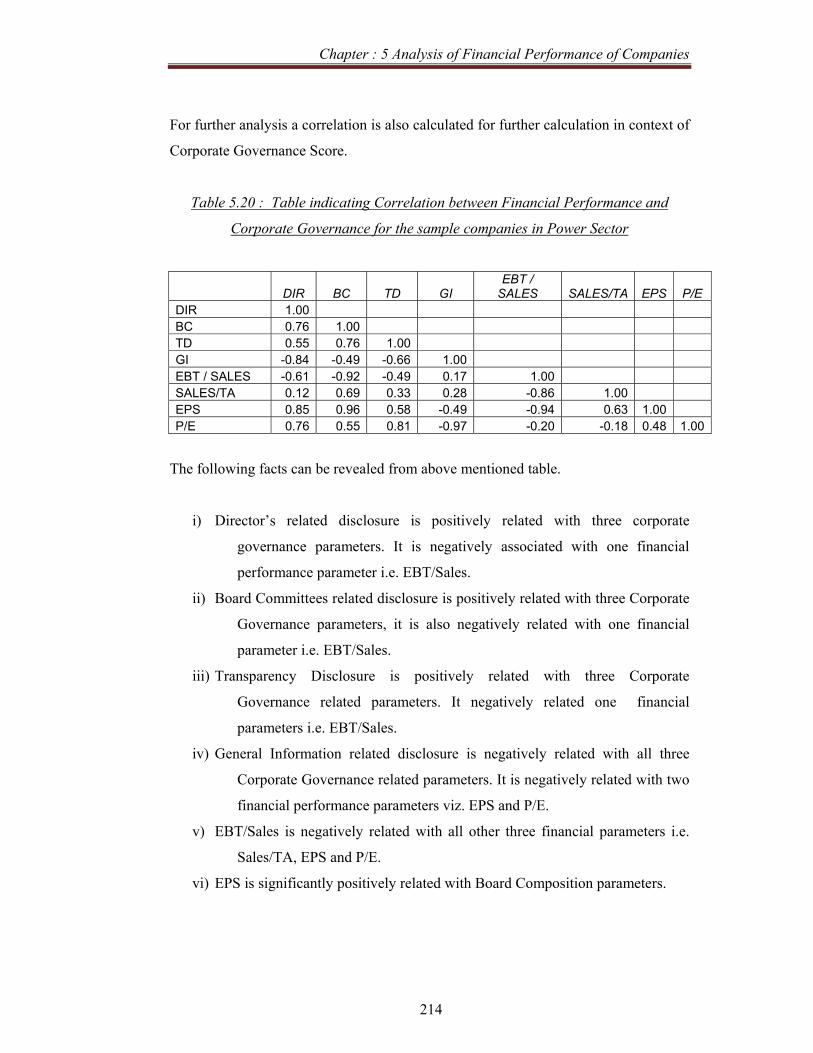
Chapter : 5 Analysis of Financial Performance of Companies
214
For further analysis a correlation is also calculated for further calculation in context of
Corporate Governance Score.
Table 5.20 : Table indicating Correlation between Financial Performance and
Corporate Governance for the sample companies in Power Sector
DIR BC TD GI EBT /
SALES SALES/TA EPS P/E DIR 1.00 BC 0.76 1.00 TD 0.55 0.76 1.00 GI -0.84 -0.49 -0.66 1.00 EBT / SALES -0.61 -0.92 -0.49 0.17 1.00 SALES/TA 0.12 0.69 0.33 0.28 -0.86 1.00 EPS 0.85 0.96 0.58 -0.49 -0.94 0.63 1.00 P/E 0.76 0.55 0.81 -0.97 -0.20 -0.18 0.48 1.00
The following facts can be revealed from above mentioned table.
i) Director’s related disclosure is positively related with three corporate
governance parameters. It is negatively associated with one financial
performance parameter i.e. EBT/Sales.
ii) Board Committees related disclosure is positively related with three Corporate
Governance parameters, it is also negatively related with one financial
parameter i.e. EBT/Sales.
iii) Transparency Disclosure is positively related with three Corporate
Governance related parameters. It negatively related one financial
parameters i.e. EBT/Sales.
iv) General Information related disclosure is negatively related with all three
Corporate Governance related parameters. It is negatively related with two
financial performance parameters viz. EPS and P/E.
v) EBT/Sales is negatively related with all other three financial parameters i.e.
Sales/TA, EPS and P/E.
vi) EPS is significantly positively related with Board Composition parameters.
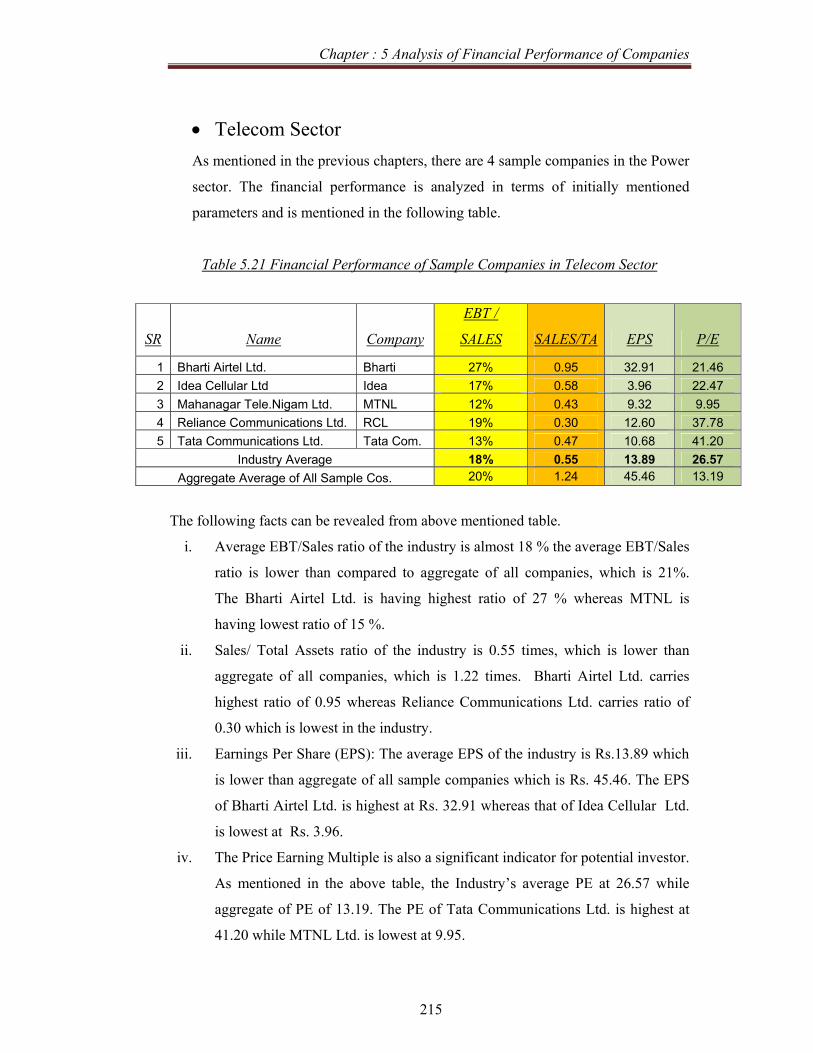
Chapter : 5 Analysis of Financial Performance of Companies
215
• Telecom Sector As mentioned in the previous chapters, there are 4 sample companies in the Power
sector. The financial performance is analyzed in terms of initially mentioned
parameters and is mentioned in the following table.
Table 5.21 Financial Performance of Sample Companies in Telecom Sector
The following facts can be revealed from above mentioned table.
i. Average EBT/Sales ratio of the industry is almost 18 % the average EBT/Sales
ratio is lower than compared to aggregate of all companies, which is 21%.
The Bharti Airtel Ltd. is having highest ratio of 27 % whereas MTNL is
having lowest ratio of 15 %.
ii. Sales/ Total Assets ratio of the industry is 0.55 times, which is lower than
aggregate of all companies, which is 1.22 times. Bharti Airtel Ltd. carries
highest ratio of 0.95 whereas Reliance Communications Ltd. carries ratio of
0.30 which is lowest in the industry.
iii. Earnings Per Share (EPS): The average EPS of the industry is Rs.13.89 which
is lower than aggregate of all sample companies which is Rs. 45.46. The EPS
of Bharti Airtel Ltd. is highest at Rs. 32.91 whereas that of Idea Cellular Ltd.
is lowest at Rs. 3.96.
iv. The Price Earning Multiple is also a significant indicator for potential investor.
As mentioned in the above table, the Industry’s average PE at 26.57 while
aggregate of PE of 13.19. The PE of Tata Communications Ltd. is highest at
41.20 while MTNL Ltd. is lowest at 9.95.
SR Name Company
EBT /
SALES SALES/TA EPS P/E
1 Bharti Airtel Ltd. Bharti 27% 0.95 32.91 21.46 2 Idea Cellular Ltd Idea 17% 0.58 3.96 22.47 3 Mahanagar Tele.Nigam Ltd. MTNL 12% 0.43 9.32 9.95 4 Reliance Communications Ltd. RCL 19% 0.30 12.60 37.78 5 Tata Communications Ltd. Tata Com. 13% 0.47 10.68 41.20
Industry Average 18% 0.55 13.89 26.57 Aggregate Average of All Sample Cos. 20% 1.24 45.46 13.19

Chapter : 5 Analysis of Financial Performance of Companies
216
For further analysis a correlation is also calculated for further calculation in context of
Corporate Governance Score.
Table 5.22 : Table indicating Correlation between Financial Performance and
Corporate Governance for the sample companies in Telecom Sector
DIR BC TD GI EBT / SALES SALES/TA EPS P/E DIR 1.00 BC 0.81 1.00 TD 0.56 0.89 1.00 GI 0.84 0.98 0.81 1.00 EBT / SALES 0.40 0.70 0.68 0.75 1.00 SALES/TA 0.40 0.39 0.10 0.54 0.73 1.00 EPS 0.41 0.43 0.39 0.53 0.85 0.77 1.00 P/E 0.71 0.64 0.66 0.54 0.01 -0.33 -0.07 1.00
The following facts can be revealed from above mentioned table.
i) Director’s related disclosure is positively related with all corporate governance
parameters. It is also positively associated with all financial performance
parameter. Its relation with P/E is more significant.
ii) Board Committees related disclosure is positively related with all Corporate
Governance parameters, it is also negatively related with all financial
parameter. It is significantly associated with EBT/Sales.
iii) Transparency Disclosure is positively related with all Corporate Governance
related parameters. It also negatively related all financial performance
related parameter. It is also significantly related with EBT/Sales and P/E.
iv) General Information related disclosure is positively related with all Corporate
Governance related parameters. It is also positively related with all
financial performance related parameter, more particularly, EBT/Sales.
v) P/E is negatively related with all two financial parameters i.e. Sales/TA and
EPS.
vi) EBT/Sales is significantly positively related with two corporate governance
parameters Board Composition parameters (Board Composition and
General Information disclosure).

Chapter : 5 Analysis of Financial Performance of Companies
217
• Transport Equipment Sector As mentioned in the previous chapters, there are 6 sample companies in the
Power sector. The financial performance is analyzed in terms of initially
mentioned parameters and is mentioned in the following table.
Table 5.23 Financial Performance of Sample Companies in
Transport Equipment Sector
The following facts can be revealed from above mentioned table.
i. Average EBT/Sales ratio of the industry is almost 20 % while the average
EBT/Sales of all companies is 21%. The Bharat Forge Ltd. is having highest
ratio of 17 % whereas Ashok Leyland and Tata Motors is having lowest ratio
of 8%.
ii. Sales/ Total Assets ratio of the industry is 2.03 times, which is higher than
aggregate of all companies, which is 1.22 times. Ashok Leyland Ltd. carries
highest ratio of 2.37 whereas Bharat Forge Ltd. carries ratio of 0.80 which is
lowest in the industry.
iii. Earnings Per Share (EPS): The average EPS of the industry is Rs.54.40 which
is higher than aggregate of all sample companies which is Rs. 45.46. The EPS
of Bosch Ltd. is highest at Rs. 198.00 whereas that of Ashok Leyland Ltd. is
lowest at Rs. 3.53.
iv. The Price Earning Multiple is also a significant indicator for potential investor.
As mentioned in the above table, the Industry’s average PE at 13.92 while
aggregate of PE of 13.19. The PE of Bharat Forge Ltd. is highest at 20 while
Ashok Leyland Ltd. is lowest at 8.67.
SR Name Company EBT / SALES SALES/TA EPS P/E 1 Ashok Leyland Ltd. Ashok Le 8% 2.37 3.53 8.67 2 Bharat Forge Ltd. Bharat Forge 17% 0.80 12.25 20.00 3 Bosch Ltd. BOSCH 17% 1.50 198.00 13.64 4 Cummins India Ltd. CUMMINS 16% 2.16 14.18 17.98 5 Hero Honda Motors Ltd. HHML 13% 3.40 48.47 13.03 6 Mahindra & Mahindra Ltd. M&M 10% 1.93 46.24 13.24 7 Maruti Suzuki India Ltd. Maruti 14% 1.88 59.91 13.27 8 Tata Motors Ltd. Tata Mot 8% 2.22 52.64 11.52
Industry Average 13% 2.03 54.40 13.92 Aggregate Average of All Sample Cos. 20% 1.24 45.46 13.19

Chapter : 5 Analysis of Financial Performance of Companies
218
For further analysis a correlation is also calculated for further calculation in context of
Corporate Governance Score.
Table 5.24: Table indicating Correlation between Financial Performance and
Corporate Governance for the sample companies in Transport Equipment Sector
DIR BC TD GI EBT / SALES SALES/TA EPS P/E DIR 1.00 BC 0.60 1.00TD 0.46 0.74 1.00GI 0.05 0.41 0.61 1.00EBT / SALES ‐0.69 ‐0.75 ‐0.70 0.08 1.00 SALES/TA 0.10 0.31 0.26 ‐0.18 ‐0.45 1.00 EPS 0.13 0.27 0.14 0.73 0.33 ‐0.17 1.00P/E ‐0.69 ‐0.76 ‐0.56 0.00 0.80 ‐0.55 ‐0.12 1.00
The following facts can be revealed from above mentioned table.
v) Director’s related disclosure is positively related with all corporate governance
parameters. It is positively related with two financial performance
parameter viz. Sales / TA and EPS. It is negatively related with remaining
two financial performance parameters (EBT/Sales and P/E).
vi) Board Committees related disclosure is positively related with all Corporate
Governance parameters, it is negatively related with two financial
parameters (EBT/Sales and P/E). It is positively associated with remaining
two financial parameters, Sales/TA and EPS.
vii) Transparency Disclosure is positively related with all Corporate Governance
related parameters. It negatively related two financial performance related
parameters, (EBT/Sales and P/E). It is also positively related with
remaingin two parameters, Sales/TA and EPS.
viii) General Information related disclosure is positively related with all
Corporate Governance related parameters. It is also positively related with
two financial performance related parameter, EBT/Sales & EPS. However,
there is no relation of GI score with P/E.
ix) PE is negatively related with three of corporate governance parameters, viz
Directors related Disclosure, Board Composition and Transparency related
disclosures.

Chapter : 5 Analysis of Financial Performance of Companies
219
• All Sample Industries
Table 5.25: Table indicating Correlation between Financial Performance and
Corporate Governance for the all Sample Companies
DIR BC TD GI EBT / SALES SALES/TA EPS P/E DIR 1.00 BC 0.44 1.00TD 0.38 0.36 1.00GI 0.15 0.27 0.51 1.00EBT / SALES 0.09 0.00 0.03 0.04 1.00SALES/TA ‐0.19 ‐0.13 ‐0.09 0.13 ‐0.09 1.00 EPS 0.13 0.09 0.07 0.08 0.35 0.02 1.00
P/E 0.04 ‐0.01 0.05 0.04 0.57 0.05 0.02 1.00
The following facts can be revealed from above mentioned table.
i) Director’s related disclosure is positively related with all corporate governance
parameters. It is positively related with three financial parameters, viz.
EBT/Sales, EPS and P/E. It is negatively related with one financial
parameter, Sales/TA.
ii) Board Committees related disclosure is positively related with all Corporate
Governance parameters, it is negatively related with two financial
parameters (Sales/TA and P/E). It is positively associated with remaining
one financial parameter EPS. It is neutral with one financial parameter,
EBT/Sales.
iii) Transparency Disclosure is positively related with all Corporate Governance
related parameters. It positively related three financial performance related
parameters, (EBT/Sales, EPS and P/E). It is negatively related with one
parameter, Sales/TA.
iv) General Information related disclosure is positively related with all Corporate
Governance related parameters. It is also positively related with all
financial performance related parameters.
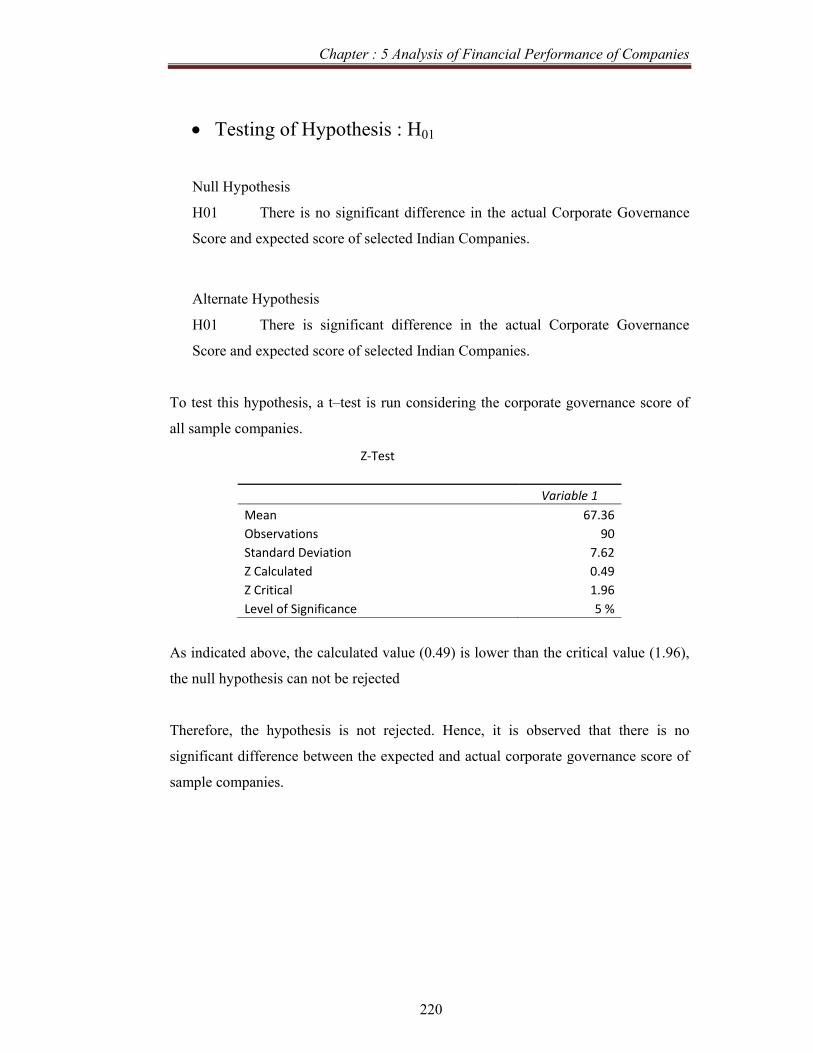
Chapter : 5 Analysis of Financial Performance of Companies
220
• Testing of Hypothesis : H01
Null Hypothesis
H01 There is no significant difference in the actual Corporate Governance
Score and expected score of selected Indian Companies.
Alternate Hypothesis
H01 There is significant difference in the actual Corporate Governance
Score and expected score of selected Indian Companies.
To test this hypothesis, a t–test is run considering the corporate governance score of
all sample companies.
Z‐Test
Variable 1 Mean 67.36 Observations 90 Standard Deviation 7.62 Z Calculated 0.49 Z Critical 1.96 Level of Significance 5 %
As indicated above, the calculated value (0.49) is lower than the critical value (1.96),
the null hypothesis can not be rejected
Therefore, the hypothesis is not rejected. Hence, it is observed that there is no
significant difference between the expected and actual corporate governance score of
sample companies.

Chapter : 5 Analysis of Financial Performance of Companies
221
• H02
Null Hypothesis
H02 There is no significant difference in the Corporate Governance Score among
various sectors of the Indian companies.
Alternate Hypothesis
H02 There is significant difference in the Corporate Governance Score among
various sectors of the Indian companies.
The hypothesis is tested with the help of the following table.
t‐Test
Variable 1 Mean 67.5 Observations 12 Level of significance 5 % Standard Deviation 2.54 T Calculated Value 0.50 T Critical Value 2.20
As indicated above the calculated value (0.50) is lower than the critical value (2.20).
Therefore, the null hypothesis can not be rejected. Hence, it is observed that there is
no significant difference among the various sectors of Indian companies for corporate
governance score.

Chapter : 5 Analysis of Financial Performance of Companies
222
H03
Null Hypothesis
H03: There is a positive impact of Corporate Governance on the financial
performance of the selected Indian companies
Alternate Hypothesis
H03: There is no positive impact of Corporate Governance on the financial
performance of the selected Indian companies
To test this hypothesis, a correlation is run between following two key performance
variables.
i) EBT /Sales Ratio ( of all sectors and all industries)
ii) Corporate Governance Score ( of all sectors and all industries).
The correlation test is executed to observe the above mentioned correlation. The result
is Positive 0.02.
Hence, it is observed that the EBT / Sales ratio which is indicative of firm’s financial
performance is positively related with Corporate Governance Score.
Therefore, The H03 is accepted.
SGN
Chapter: 6
Summary and Conclusion
• Summary
• Findings on the basis of Hypothesis Testing
• Conclusion
• Bibliography
o Books
o Reports on Corporate Governance
o Institutional Publications on Corporate Governance
o Useful Websites on Corporate Governance
Chapter:6 Summary and Conclusion
224
Summary India, the government has proactively strengthened the corporate governance
guidelines, mainly through the introduction of the amended Clause 49. There are
provisions aimed at vesting shareholders with greater powers, implementing stricter
measures for investor protection, creating independent director requirements and
improving the quality and depth of disclosures provided in the financial statements.
The fundamental objective of good corporate governance and ethics” is to ensure the
commitment of an organization in managing the company in a legal and transparent
manner in order to maximize the long-term value of the company for its shareholders,
customers, competitors, employees and all other partners.
It is important to understand that effective and efficient governance by the board is
just one component of governance and ethics. Robust governance practices and
ethical behavior leading to a world class company not only hinges on the functioning
of the board, but is also dependent on how various interconnected building blocks of
the ecosystem work together.1
Good corporate governance helps to prevent corporate scandals, fraud, and potential
civil and criminal liability of the organization. It is also good business. A good
corporate governance image enhances the reputation of the organization.2
There are several developments in corporate sector at national and international level
which indicate that a detailed study is required in corporate governance area. If we
look into history, there are several attempts made by Government and various trade
associations for systematic development of Corporate Governance.
Even recently, in December 2009, the Ministry of Corporate Affairs (MCA) published
a new set of “Corporate Governance Voluntary Guidelines 2009”, designed to
encourage companies to adopt better practices. This indicates that there is a need to
examine the prevailing corporate practices in Indian context.
Chapter:6 Summary and Conclusion
225
The First chapter deals with an overview. In the first chapter researcher has focused
on corporate governance meaning, history and lank marks developments in this sector
at international as well as national level.
It is rightly described at in a narrow sense, corporate governance involves a set of
relationships amongst the company’s management, its board of directors, its
shareholders, its auditors and other stakeholders. While In a broader sense, good
corporate governance may extent- to - which companies are run in an open and honest
manner- is important for overall market confidence, the efficiency of capital
allocation, the growth and development of countries’ industrial bases, and ultimately
the nations’ overall wealth and welfare.
There were several frauds and scams in the corporate history of the world. It was felt
that the system for regulation is not satisfactory and it was felt that it needed
substantial external regulations. These regulations should penalize the wrong doers
while those who abide by rules and regulations, should be rewarded by the market
forces. In this context there were several developments in countries like USA, UK etc.
In USA, the development of the Foreign and Corrupt Practices Act of 1977 and in
1979 proposal by Securities and Exchange Commission’s for mandatory reporting on
internal financial controls were major development. However, the latest and the most
impactful development is introduction of Sorbanes Oxley Act – 2002 was another
landmark development for corporate governance. In UK, the seeds of modern
corporate governance were sown by the Bank of Credit and Commerce International
(BCCI) and the Barings Bank scandal, as a result the Committee of Sponsoring
Organizations (COSO) was formed, which produced report in 1992 framework and
was endorsed an refined in four subsequent UK reports : Cadbury, Ruthman, Hampel
and Turbull.
There were several committees formed at international level in the area of corporate
governance like, Cadbury committee on Corporate Governance – 1992, The Paul
Ruthman Committee, The Greenbury Committee, The Hampel Committee, The
Turnbull Committee,

Chapter:6 Summary and Conclusion
226
Organization for Economic Co-operation and Development (OECD) was also one of
the earliest non-governmental organizations to work on and spell out principles and
practices that should govern corporate in their goal to attain long-term shareholder
value. The OECD were trend setters as the Code of Best practices are associated with
Cadbury report. The following points were included in the OECD principles, The
rights of shareholders, Equitable treatment of shareholders, Role of stakeholders in
corporate governance, Disclosure and Transparency and Responsibilities of the board
There have been several major corporate governance initiatives launched in India
since the mid-1990s. The first was by the Confederation of Indian Industry (CII),
India’s largest industry and business association, which came up with the first
voluntary code of corporate governance in 1998. The second was by the SEBI, now
enshrined as Clause 49 of the listing agreement. The third was the Naresh Chandra
Committee, which submitted its report in 2002. The fourth was again by SEBI — the
Narayana Murthy Committee, which also submitted its report in 2002. Based on some
of the recommendation of this committee, SEBI revised Clause 49 of the listing
agreement in August 2003.
Subsequently, SEBI withdrew the revised Clause 49 in December 2003, and currently,
the original Clause 49 is in force. More recently, in December 2009, the Ministry of
Corporate Affairs (MCA) published a new set of “Corporate Governance Voluntary
Guidelines 2009”, designed to encourage companies to adopt better practices in the
running of boards and board committees, the appointment and rotation of external
auditors, and creating a whistle blowing mechanism.
Despite these wide-ranging developments in regulation and policy, what becomes
increasingly apparent in India is that the reform process has not addressed, or
effectively addressed, a key challenge at the heart of the governance problem, namely
the accountability of promoters to other shareholders.
Chapter:6 Summary and Conclusion
227
The Second chapter deals with financial performance. The financial performance is
useful to several stake holders, like creditors, suppliers of long term debt, investors,
management etc.
As indicated in the second chapter, the performance of the firm can be measured by
its financial results i.e, by its size of earnings Riskiness and profitability are two major
factors which jointly determine the value of the concern. Financial decisions which
increase risks will decrease the value of the firm and on the other hand, financial
decisions which increase the profitability will increase value of the firm. Risk and
profitability are two essential ingredients of a business concern.
A company’s financial performance, therefore is normally judged by the following
ways i) ratio analysis, ii) DuPont Analysis, iii) Comparative Statement Analysis and
iv) Time Series analysis / Trend Analysis and v) Inter-firm Analysis.
Ratio analysis is Ratios are calculated based on the financial and related statement
like. Profit & Loss account, Balance Sheet etc. The ratios are normally classified as
under: a)Liquidity Ratios, b) Leverage Ratios, c) Activity Ratios and d)
Profitability Ratios
For the purpose of this project, the researcher has taken the following three ratios
a) Return on Equity, b) Earnings Per Share and c) Price Earnings Ratio.
All three parameters are discussed in detailed along with various other ratios in the
second chapter. However, it is to be noted that fundamentally, the balance sheet
indicates the financial position of the company as on that point of time. However,
profit and loss account is a statement, which is prepared for a particular financial year.
In Indian context, where an analyst has to rely upon the audited financial statement
for a particular company, the performance is to be judged from the financial statement
only.
Chapter:6 Summary and Conclusion
228
The Third chapter is about research methodology. There are several developments in
corporate sector at national and international level which indicate that a detailed study
is required in corporate governance area. More recently, in December 2009, the
Ministry of Corporate Affairs (MCA) published a new set of “Corporate Governance
Voluntary Guidelines 2009”, designed to encourage companies to adopt better
practices in the running of boards and board committees, the appointment and rotation
of external auditors, and creating a whistle blowing mechanism.
This indicates that there is a need to examine the prevailing corporate practices in
Indian context. In this context this research is taken up.
The broader objective of this research is to understand the Corporate Governance
processes of Indian Companies and to see the impact of Corporate Governance on the
Financial Performance.
This objectives can be summarized as under;
• To understand the concept of corporate governance practices in true sense and
in Indian context.
• To study the acceptance and implementation of corporate governance in
Indian corporate.
• To study the corporate governance practices and measure in terms of corporate
governance score
• To understand firm financial performance and corporate governance.
• To know the impact of corporate governance on financial performance.
The formulation of the study has been framed out from two perspectives :
• To evaluate the implementation of Corporate Governance Code by assessing corporate governance score
• To evaluate the financial performance of the sample company using various financial ratios.
Chapter:6 Summary and Conclusion
229
The broader assumptions in the study are as under: H01 There is no significant difference in the expected and actual Corporate
Governance Score of selected Indian Companies. H02 There is no significant difference in the Corporate Governance Score
among various sectors of the Indian companies. H03 There is a positive impact of Corporate Governance on the financial
performance of the selected Indian companies.
The following methodology is followed for the project.
First of all calculation of financial ratios (For measuring the Financial Performance).
The researcher have considered the following ratios as key financial performance
indicator. The focus of the research is on Corporate Governance, the following
financial parameters are considered. i) EBT / Sales, ii) Sales / Total Assets, iii)
Earning Per Share, iv) P/E Multiple.
Evaluation of Governance Standard
After analysis of governance structure, process and disclosures made on corporate
governance, the question comes to mind is what is the standard and quality of
governance that has been achieved by various companies. To arrive at a corporate
governance score, (out of 100) several parameters are considered and they are divided
into four key areas (Directors Information, Board Committee, Transparency and
Disclosure and General Information), each carrying a weightage of 25 points each.
After analysis of governance structure, process and disclosures made on corporate
governance, the question comes to mind is what is the standard and quality of
governance that has been achieved by various companies?
Score Range Rank
86 – 100 Excellent
71 – 85 Very Good
56 – 70 Good
41 – 55 Average
Below 41 Poor
The above score indicate the category of the company on the corporate governance
score card.
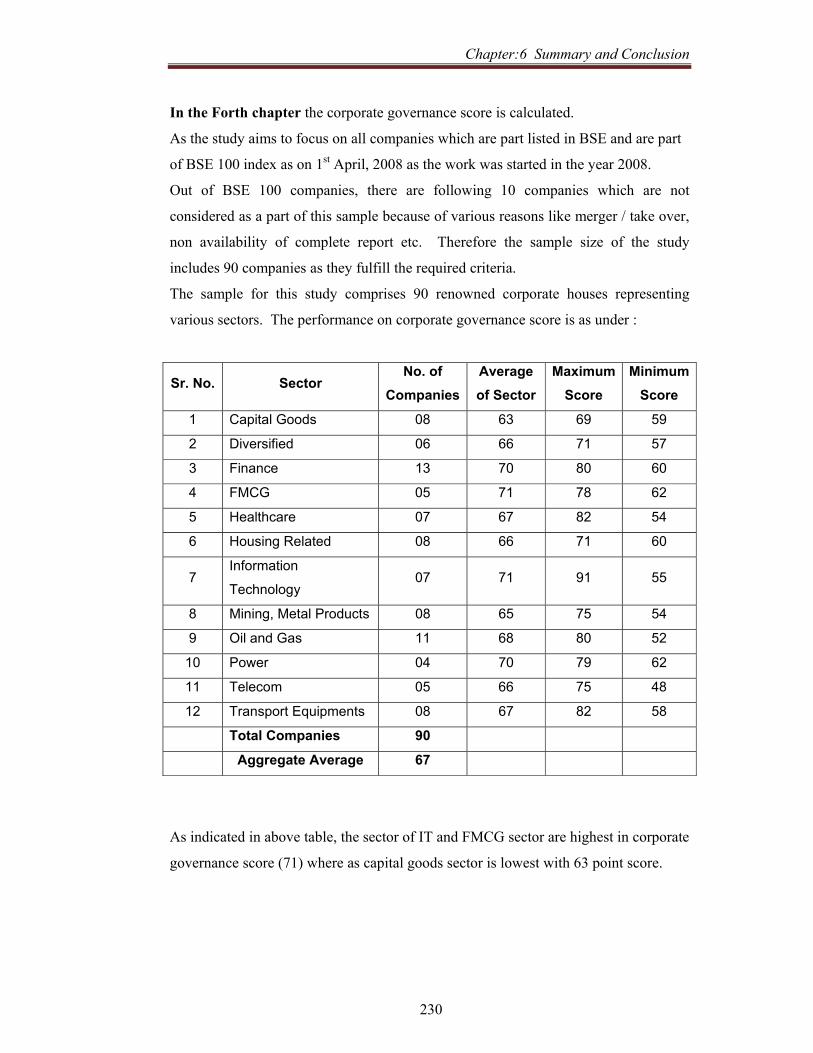
Chapter:6 Summary and Conclusion
230
In the Forth chapter the corporate governance score is calculated.
As the study aims to focus on all companies which are part listed in BSE and are part
of BSE 100 index as on 1st April, 2008 as the work was started in the year 2008.
Out of BSE 100 companies, there are following 10 companies which are not
considered as a part of this sample because of various reasons like merger / take over,
non availability of complete report etc. Therefore the sample size of the study
includes 90 companies as they fulfill the required criteria.
The sample for this study comprises 90 renowned corporate houses representing
various sectors. The performance on corporate governance score is as under :
Sr. No. Sector No. of
CompaniesAverage of Sector
Maximum Score
MinimumScore
1 Capital Goods 08 63 69 59
2 Diversified 06 66 71 57
3 Finance 13 70 80 60
4 FMCG 05 71 78 62
5 Healthcare 07 67 82 54
6 Housing Related 08 66 71 60
7 Information
Technology 07 71 91 55
8 Mining, Metal Products 08 65 75 54
9 Oil and Gas 11 68 80 52
10 Power 04 70 79 62
11 Telecom 05 66 75 48
12 Transport Equipments 08 67 82 58
Total Companies 90
Aggregate Average 67
As indicated in above table, the sector of IT and FMCG sector are highest in corporate
governance score (71) where as capital goods sector is lowest with 63 point score.
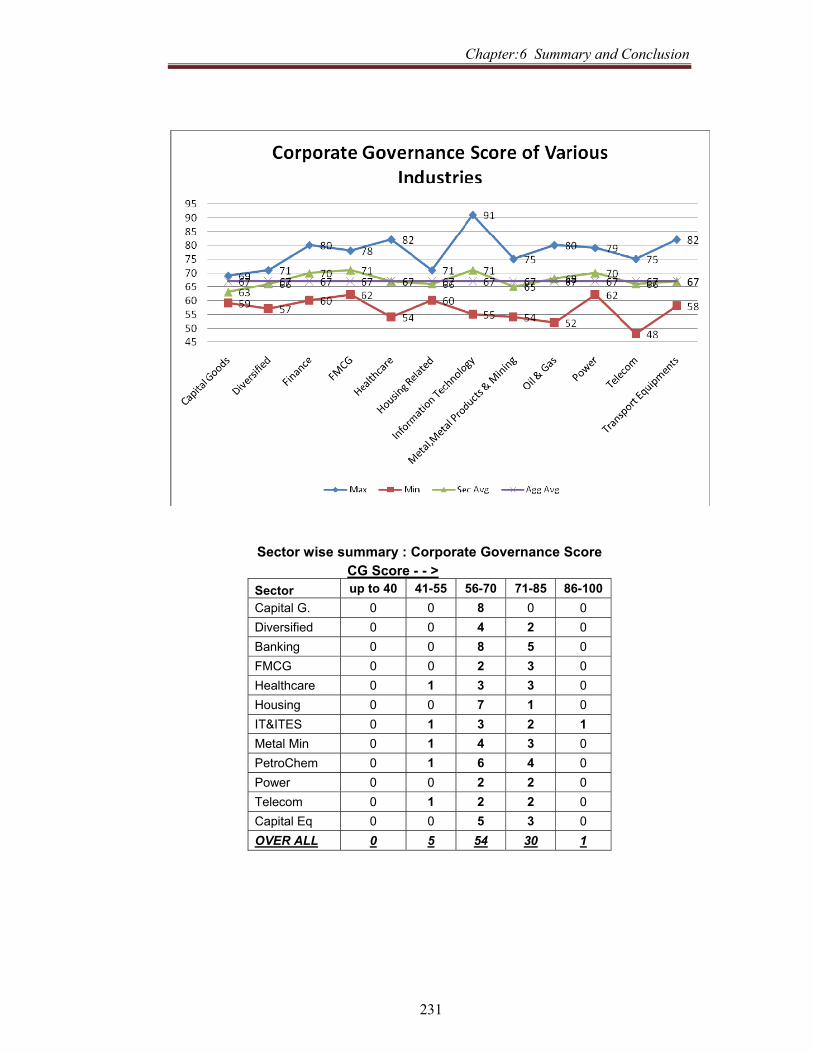
Chapter:6 Summary and Conclusion
231
Sector wise summary : Corporate Governance Score CG Score - - >
Sector up to 40 41-55 56-70 71-85 86-100 Capital G. 0 0 8 0 0 Diversified 0 0 4 2 0 Banking 0 0 8 5 0 FMCG 0 0 2 3 0 Healthcare 0 1 3 3 0 Housing 0 0 7 1 0 IT&ITES 0 1 3 2 1 Metal Min 0 1 4 3 0 PetroChem 0 1 6 4 0 Power 0 0 2 2 0 Telecom 0 1 2 2 0 Capital Eq 0 0 5 3 0 OVER ALL 0 5 54 30 1

Chapter:6 Summary and Conclusion
232
In the Fifth chapter, the financial performance of the sample companies is
calculated.
As mentioned in Chapter 2, there are several tools available for analyzing the
financial performance of a company. However, the following parameters are used to
analyze the financial performance for this research.
a) EBIT / Sales Ratio (ES) b) Sales/ Total Assets (SA) c) Earnings Per Share
(EPS) d) P/E Muliple (PE)
The summary of above ratios is mentioned as under:
SN Sector No. Co.s ES (%) SA EPS PE
H L A H L A H L A H L A 1 Capital Goods 08 29 8 15 4.06 0.70 2.30 103.00 7.81 38.16 36.66 10.10 25.19 2 Diversified 06 58 3 22 2.63 0.02 1.03 223.00 0.37 55.87 337.84 6.07 76.67 3 Finance/ Banks 13 56 2 23 0.27 0.07 0.10 126.50 5.36 44.22 25.06 5.66 15.50 4 FMCG 05 34 15 20 9.68 0.44 4.25 55.39 8.29 31.55 43.97 14.79 24.60 5 Healthcare 07 38 -37 20 1.15 0.37 0.80 54.77 -27.00 26.40 26.35 -7.11 17.47 6 Housing Related 08 51 8 28 1.50 0.32 0.84 80.94 5.42 27.76 38.61 5.45 19.85 7 Info.Technology 07 92 19 34 2.80 0.65 1.39 214.00 11.71 66.42 20.56 4.36 12.85 8 Mining, Metal Products 08 69 8 33 1.66 0.43 0.88 379.06 14.10 97.84 46.60 4.87 14.11 9 Oil and Gas 11 39 -138 00 4.37 0.00 1.55 133.86 -0.44 45.83 211.02 -521.11 -70.16
10 Power 04 37 15 24 0.57 0.12 0.41 47.00 3.60 25.26 25.40 17.92 22.73 11 Telecom 05 27 15 18 0.95 0.30 0.55 32.91 3.96 13.89 41.20 9.95 26.57 12 Transport Equipments 08 17 8 13 2.37 0.80 2.03 198.00 3.53 54.40 20.00 8.67 13.92
Total Companies 90 Aggregate Average 20 1.24 45.46 13.19
As mentioned in the above table, the Information Technology which is having highest
average EBIT/ Sales ratio where as oil and gas sector is lowest ratio. Average Sales to
Total Assets ratio is highest in FMCG sector whereas is lowest in Financial services
and banking sector. Average EPS is highest in mining, metal and metal proeucts
sector, whereas is lowest in Telecom sector. Average PE is highest in Diversified
sector, whereas is lowest in Oil and Gas sector.
Thereafter the researcher has tried to find out the correlation between the four
parameters of Corporate Governance Score and four financial performance
parameters. The below mentioned are its key findings.
The analysis of the Capital Goods sector indicates a strong positive relationship
between DI and SA whereas TI and PE are negatively related.
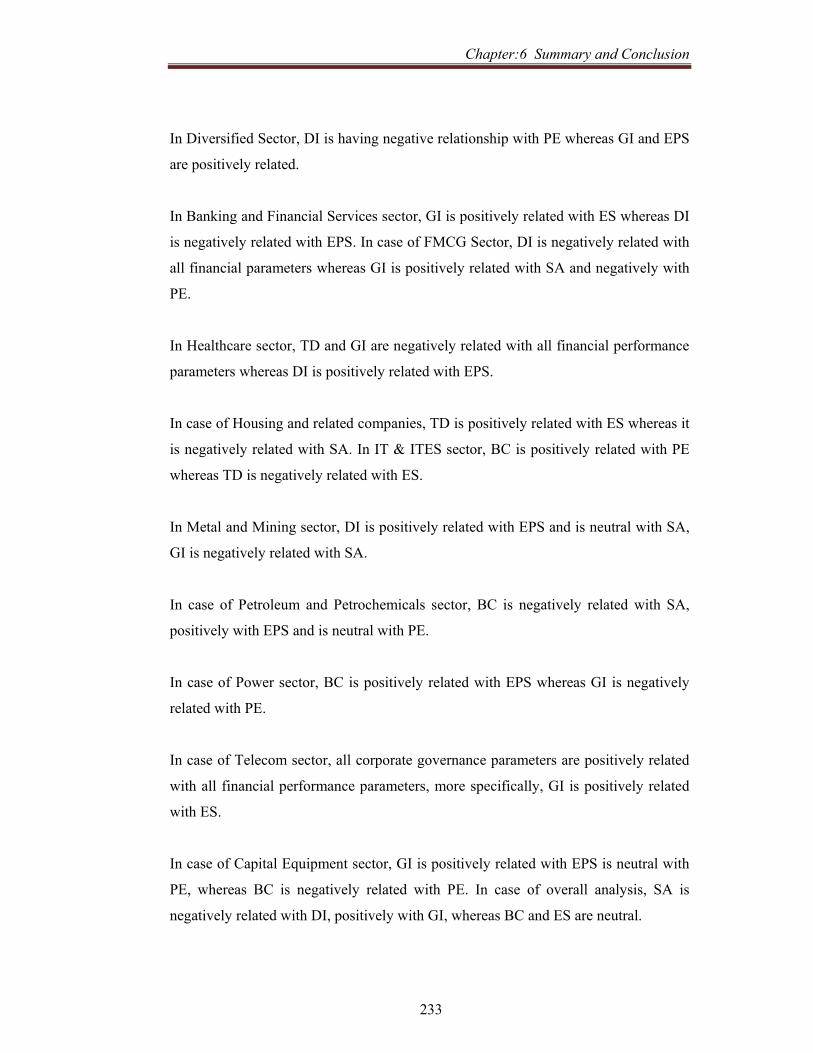
Chapter:6 Summary and Conclusion
233
In Diversified Sector, DI is having negative relationship with PE whereas GI and EPS
are positively related.
In Banking and Financial Services sector, GI is positively related with ES whereas DI
is negatively related with EPS. In case of FMCG Sector, DI is negatively related with
all financial parameters whereas GI is positively related with SA and negatively with
PE.
In Healthcare sector, TD and GI are negatively related with all financial performance
parameters whereas DI is positively related with EPS.
In case of Housing and related companies, TD is positively related with ES whereas it
is negatively related with SA. In IT & ITES sector, BC is positively related with PE
whereas TD is negatively related with ES.
In Metal and Mining sector, DI is positively related with EPS and is neutral with SA,
GI is negatively related with SA.
In case of Petroleum and Petrochemicals sector, BC is negatively related with SA,
positively with EPS and is neutral with PE.
In case of Power sector, BC is positively related with EPS whereas GI is negatively
related with PE.
In case of Telecom sector, all corporate governance parameters are positively related
with all financial performance parameters, more specifically, GI is positively related
with ES.
In case of Capital Equipment sector, GI is positively related with EPS is neutral with
PE, whereas BC is negatively related with PE. In case of overall analysis, SA is
negatively related with DI, positively with GI, whereas BC and ES are neutral.
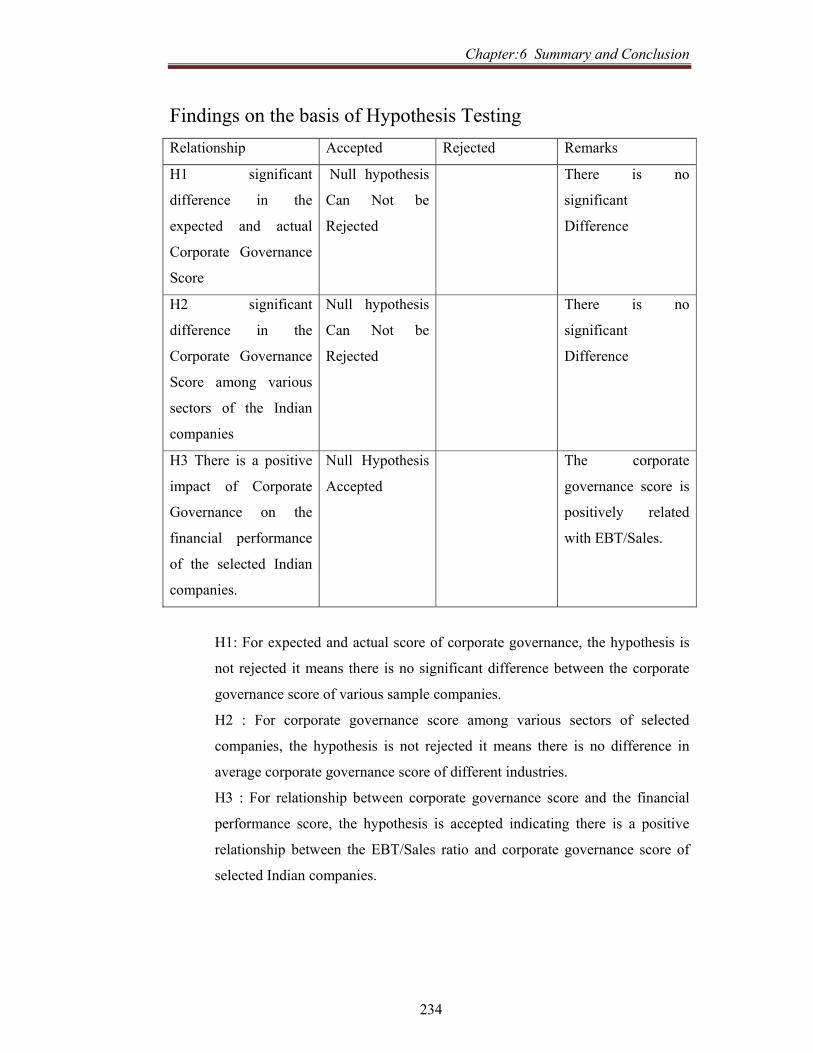
Chapter:6 Summary and Conclusion
234
Findings on the basis of Hypothesis Testing Relationship Accepted Rejected Remarks
H1 significant
difference in the
expected and actual
Corporate Governance
Score
Null hypothesis
Can Not be
Rejected
There is no
significant
Difference
H2 significant
difference in the
Corporate Governance
Score among various
sectors of the Indian
companies
Null hypothesis
Can Not be
Rejected
There is no
significant
Difference
H3 There is a positive
impact of Corporate
Governance on the
financial performance
of the selected Indian
companies.
Null Hypothesis
Accepted
The corporate
governance score is
positively related
with EBT/Sales.
H1: For expected and actual score of corporate governance, the hypothesis is
not rejected it means there is no significant difference between the corporate
governance score of various sample companies.
H2 : For corporate governance score among various sectors of selected
companies, the hypothesis is not rejected it means there is no difference in
average corporate governance score of different industries.
H3 : For relationship between corporate governance score and the financial
performance score, the hypothesis is accepted indicating there is a positive
relationship between the EBT/Sales ratio and corporate governance score of
selected Indian companies.

Chapter:6 Summary and Conclusion
235
Conclusion This study is based on secondary data related to the published data of sampled
group companies. The study is related with corporate governance disclosure
disclosed by sampled group companies. Thus this study has scope of further
investigation. As corporate governance has been evolved as recent practice
among Indian companies, the study itself is an investigation for this evolving
concept.
Chapter:6 Summary and Conclusion
236
References
1. Nasscom Corporate Governance Report
http://www.nasscom.in/Nasscom/templates/NormalPage.aspx?id=59073
2. Corporate Governance best practices F D Lipman & L K Lipman , john wiely
and sons pp. 3
3. Nasscom Corporate Governance Report
http://www.nasscom.in/Nasscom/templates/NormalPage.aspx?id=59073
Bibliography
237
SGN
Bibliography Books
1. AlMA (1997). Corporate Governance and Business Ethics. New Delhi: Excel
Books.
2. Akoi, M. and H. Kim (eds.) (1995). Corporate Governance in Transitional
Economies: Insider Control and the Role of Banks. Washington, D.C.: The
World Bank.
3. Arora, Ramesh K and Tanjul Saxena (eds.) (2004). Corporate Governance:
Issues and Perspectives.
4. Arora, Ramesh K. and Tanjul Saxena (ed.) (2004). Corporate Governance,
Issues and Perspective..
5. Bajaj, P. S. and Raj Agarwal (2004). Business Ethics: An Indian Perspective.
New Delhi: Biztantra.
6. Balachandran, S. (1996). Managing Ethics. Sangeath Associates.
7. Balasubramanian, (1988). Corporate Boards and Governance. New Delhi:
Sterling.
8. Banerjee, A. M. and K. A. Chandrasekaran (1996). Renewing Governance:
Issues and Options. New Delhi: Tata McGraw Hill.
9. Berte, A. A., and G. C. Means (1932). The Modern Corporations and Private
Properties. New York: McGraw-HilI.
10. Bhagawati, J. (1993). India in Transition: Freeing the Economy. Oxford:
Oxford University Press.
11. Bharat Law House (2003). Bharai's Manual of SEBI Act, Rules, Regulations,
Guidelines, Circulars, etc. New Delhi: Bharat Law House.
12. Birch, D. and J. Batten (2001). Corporate Citizenship in Australia: A Survey
of Corporate Australia. Melbourne: Deakin University.
13. Blair, Margaret (1998). Ownership and Control: Rethinking Corporate
Governance in Twenty-first Century. Washington, D.C.: Brookings Institution.
14. Boatright, John R (2003). Ethics and the Conduct of Business. Delhi: Pearson
Education.
15. Bradburn, Roger (2001). Understanding Buliness Ethics. London: Continuum.
Bibliography
238
16. Caroselli, Marlene (2004). 50 Activities for Promoting Ethics in the
Organisation. Amherst, MA: HRD Press.
17. Chakraborty, S. K. (1998). Value and Ethics for Organisations: Theory and
Practices. New Delhi: Oxford University Press.
18. Chakraborty, S. K. (2002). The Management and Ethics Omnibus. New Delhi:
Oxford University Press.
19. CharkhamandSimpson (1999). Fair Shares: The Future of Shareholder Power
and Responsibility. New Delhi: Oxford University Press.
20. CharkhamJ.P. (1994). Keeping Good Companies:A Study of Corporate
Governance in Five Companies . New Delhi: Oxford University Press.
21. Chew, D. H. (ed.) (1997). Studies in International Corporate Finance and
Governance Systems: A Comparison of U.S., Japan, and
1. Europe. Oxford University Press.
22. Choudhary, Nagendra V. (ed.) (2003). Corporate Governance in Emerging
Markets. Hyderabad: ICFAI.
23. Chris, Moon and Bonny Clive (2002). Business Ethics. London: Profile
Books.
24. Chryssides, G. D. and J. H. Kaler (1994). Introduction to Business Ethics.
London: Chapman and Hall.
25. Ciulla, Joanne B. (2003). The Ethics of Leadership. Thomson Learning.
26. Colley, John L et al. (2003). Corporate Governance. New Delhi: Tata McGraw
Hill.
27. Collins, J. c. and Porras, J. I. (1997). Built to Last. New York: Random House.
28. David, Murray (2001). Ethics in Organizations. New Delhi: Crest Pub.
29. Denise, Theodore C. et al. (1996). Great Traditions in Ethics. New York:
Wadsworth.
30. Dept. of Advertising. Advertising Laws and Ethics. Austin: University of
Texas.
31. Des Jar dins, Joseph Rand J. J. McCall (eds.) (1985). Contemporary Issues in
Business Ethics. California: Wadsworth Publication.
32. Drian, Robert F. (2000). Globalisation and Corporate Ethics. Jamshedpur:
XLRI.

Bibliography
239
33. Frederick, William G. et al, (1992). Business and Society: Corporate Strategy,
Public Policy and Ethics. New York: McGraw Hill.
34. Friedman, Milton (1962). Capitalism and Freedom. Chicago: University of
Chicago Press.
35. Fritzsche, David J. (1997). Business Ethics: A Global and Managerial
Perspective. Singapore: The McGraw-HilI Companies.
36. Fritzsche, David J. (1997). Business Ethics: Global and Managerial. New
York: McGraw Hill.
37. Garratt, Bob (2003). Thin on Top: Why Corporate Governance Matters and
How to Measure and Improve Board Performance. London: Nicholas Brealey
Publishing.
38. Gera, M. R. (ed.) (1997). Corporate Governance and Business Ethics. New
Delhi: Excel Books.
39. Giri, Ananta K. (1998). Values, Ethics and Business. Jaipur: Rawat
Publications.
40. Gopalsamy N. (1998). Corporate Governance: The New Paradigm. New
Delhi: Wheeler Publishing.
41. Hartman, Laura Pincus (2003). Perspectives in Business Ethics. New Delhi:
Tata McGraw Hill.
42. Hazarika, Anjali (ed.) (1998).Corporate Social Responsibility and the Oil-
Global Experiences. New Delhi: Tata McGraw Hill.
43. Hoffman, Michael W. and J. M. Moore (1984). Business Ethics: Reading and
Cases. New York: McGraw Hill.
44. Hosmer, Lame Tone (1996). Ethics of Management. New Delhi: U B S
Publishers.
45. ICFAI. Corporate Governance in Emerging Markets, vols. 1 and 2, Corporate
Governance Series. Hyderabad: ICFAI University.
46. Jennings, Marianne M (1993). Case Studies in Business Ethics. West
Publishing.
47. Joshi, Vasudha (2004). Corporate Governance: The Indian Scenario. New
Delhi: Foundation Books.
48. Kapoor, N. D. (2004). Corporate Laws and Secretarial Practice. New Delhi:
Sultan Chand & Sons.
Bibliography
240
49. Keasey, K., S. Thompson and M. Wright (eds.) (1997). Corporate
Governance: Economic, Management, and Financial Issues. Oxford University
Press.
50. Khanna, Sri Ram (ed.) (2004). Financial Markets in India and Protection of
Investors. VOICE (Voluntary Organization in Interest of Consumer
Education). New Delhi: New Century Publications.
51. Khera, Shiv (2004). Ethics and Values. New Delhi: Sterling.
52. Kotler, Philip and Lee Nancy (2005). Corporate Social Responsibility.
Hoboken, NJ: John Wiley.
53. Kumar, Surendar (2002). Corporate Governance: A Question of Ethics. New
Delhi: Galgotia Publishers.
54. LIBA (1996). Ethics and Social Responsibility of Business. Chennai: Loyola
Institute of Business Administration.
55. Luftkin, J. c. and David Gallagher (eds) (1994). International Corporate
Governance. London: Euromoney Publications.
56. Maher, M. and T. Anderson (2000). Convergence and Diversity of Corporate
Governance Regimes and Capital Markets. Oxford: Oxford University Press.
57. Mathias, Theophane A. (1994). Corporate Ethics. New Delhi: Allied
Publishers.
58. Millstein and Katsh (2003). The Limits of Corporate Power. New York:
Macmillan.
59. Mitsuihiro, Fukao (1995). Financial Integration, Corporate Governance, and
the Performance of Multinational Companies. Washington, D.C.: Brookings
Institution.
60. Mittal, K. M. (1988). Social Responsibilities of Business - Concepts, Areas
and Progress. Delhi: Chanakya Publications.
61. Monks, R. A. G. (2001). The New Global Investors: How Share owners Can
Unlock Sustainable Prosperity Worldwide. Oxford: Capstone Publication.
62. Monks, R. A. G. and N. Minnow (2001). Corporate Governance, 2nd ed.
Oxford: Blackwell Publishing.
63. Neelamegam, R. and R. Srinivasan (1998). Investors' Protection: A Study of
Legal Aspects. Delhi: Raj Publications.
Bibliography
241
64. OECD (1998). Corporate Governance, State-owned Enterprises and
Privatisation. OECD Proceedings.
65. OECD (2004). Principles of Corporate Governance. Paris: OECD
Publications.
66. Parikh, Kirit S. and R. Radhakrishna, (eds.) India Development Report 2004-
05. New Delhi: Oxford University Press.
67. Petrick, Joseph A and John F. Quinn, "Management Ethics: Integrity at
Work", Response Books, (1997).
68. Post, James E., Anne T. Lawrence and James Weber (1999). Business and
Society Corporate Strategy, Public Policy, Ethics, 9th ed. New York:
McGraw-Hill.
69. Raj, Rituparna (1999). A Study in Business Ethics. Mumbai: Himalaya
Publishing House.
70. Rajagopalan, R. (2003). Directors and Corporate Governance. Chennai:
Company Law Institute of India Pvt. Ltd.
71. Reddy, Sumati (ed.) (2003). Corporate Social Responsibility: Concepts and
Cases. Hyderabad: ICFAI.
72. Reddy, Y. R. K. and Raju Yerram (2000). Corporate Governance in Banking
and Finance. New Delhi: Tata McGraw Hill.
73. Reed, Darryl and Sanjoy MUkherjee (eds.) (2003). Corporate Governance,
Economic Reforms, and Development _ The Indian Experience. New Delhi:
Oxford University Press.
74. Reed, Darryl and Sanjoy Mukherjee (eds.) Corporate Governance, Economic
Reforms, and Development _ The Indian Experience. New Delhi: Oxford
University Press.
75. Rosenthal, Sandra and R. A. Buchholz (1999). Rethinking Business Ethics.
New York: Oxford University Press.
76. Sadri Sorab et al. (1998). Business Ethics: Concepts and Cases. New Delhi:
Tata McGraw Hill.
77. Sadri Sorab et al. (1999). Theory and Practice of Managerial Ethics. Jaico.
78. Sengupta, N. K. (1983). Changing Patterns of Corporate Management. New
Delhi: Vikas Publishing House.
Bibliography
242
79. Sharma, Poonam and T. Bhal Kanika (2004). Managerial Ethics. New Delhi:
Sage Publishers.
80. Shaw, William H. (2002). Business Ethics. Thomson Learning.
81. Shrivastava, Harsh and Shankar Venkateswaran (2001). The Business of
Social Responsibility - The Why, Where and How of Social Responsibility in
India. Bangalore: Books for Change.
82. Singer, Peter (2000). Practical Ethics. Cambridge University Press.
83. Singh, Devi and Subhash Garg (eds.) (2001). Corporate Governance. New
Delhi: Excel Books.
84. Sorell, Tom and Hendry John (1994). Business Ethics. Oxford: Butterworth-
Heinemann.
85. Stacey James E and Sturdivant Frederick D. (1994). Corporate Social
Challenge. Chicago: Richard D. Irwin.
86. Stapled on, G. P. (1996). Institutional Shareholders and Corporate
Governance. Oxford: Clarendon Press.
87. Sturdivant, Frederick D. (1985). Corporate Social Challenge. Chicago:
Richard Irwin.
88. Tricker, B.,H. Thomas and D. O'Neal (1999}.Corporate Governance: The
Ideological Imperative, Strategic Integration. Chichester: Wiley.
89. Vedpuriswar, A. V. (2002). Leadership and Corporate Governance.
Hyderabad: ICFAI.
90. Velasquez, Manuel G. (1992). Business Ethics: Concepts and Cases. Upper
Saddle River, NJ: Prentice Hall.
91. Weiss, Joseph W (2004). Business Ethics. Mason, OH: Thomson/South
Western.
92. Weston, Mitchel and J. Harold Mulherin (2002). Takeovers, Restructuring and
Corporate Governance.4th ed. New Delhi: Pearson Education.
93. Williamson, O. E. (1985). The Economic Institutions of Capitalism. New
York: Free Press.
94. Williamson, O. E. (1996). The Mechanisms of Governance. New York:
Oxford University Press.
95. World Bank (1998). Ethics and Values: Global Perspective. Times Business.

Bibliography
243
Journals 1. Balasubramanian, N. (1999). "Changing Perceptions of Corporate Governance
in India". ASCI Journal of Management, vol. 27 (1&2).
2. Byrne, John A. (2002). "After Enron: The Ideal Corporation", Business Week.
3. Chang, S. J. and Daesung Ha (2001). "Corporate Governance in 21st
Century". American Business Review.
4. Classens, 5., S. Djankov, and L. Larry (2000). "The Separation of Ownership
and Control in East Asian Corporations". Journal of Financial Economics,
vol. 58, pp. 81-112,
5. Coffee, J. (1999). "The Future as History: The Prospects for Global
Convergence in Corporate Governance and its Implications".
Northwestern University Law Review, vol. 93. pp. -641-708.
6. Conyon, M., P. Gregg and S. Machin (1995). "Taking Care of Business:
Executive Compensation in the UK". Economic Journal.
7. Coughlan, A. and R. Schmidt (1985). "Executive Compensation, Managerial
Turnover and Firm Performance". Journal of Accounting and Economics,
vol. 7, pp. 43-66.
8. Demsetz, H. (1983). "The Structure of Ownership and Theory of Firm".
Journal of Law and Economics, vol. 26. pp. 375-390,
9. Easterbrook, F. H. (1984). "Two Agency-cost Explanations of Dividends",
American Economic Review, vol. 74 .. PP• 650-659.
10. Garen, J. (1994). "Executive Compensation and Principal-Agent Theory".
Journal of Political Economy, vol. 102. pp. 1175-1199.
11. Gollanapalli, Sarath (2003). "Corporation Governance: A Global Perspective".
Effective Executive.
12. Gosh, D. N. (2000). "Corporate Governance and Boardroom Politics".
Economic and Political Weekly.
13. Cuhan, S. (1998). "Governance and World Bank: A Critique". Economic and
Political Weekly, Vol. XXXIII (January 24). pp.185-190.
14. Holderness, C. G. and D. P. Sheehan (1988). "The Role of Majority
Shareholders in Publicly-held Corporations". Journal of.
15. Financial Economics, vol. 20, pp. 317-346.

Bibliography
244
16. Jensen, M. C. and R. S. Ruback (1983). "The Market for Corporate Control:
The Scientific Evidence'. Journal of Financial Economics, Vol. 2, pp.5-50,
17. Jensen, M. C. and W. H. Meckling (1976). "Theory of the Firm: Managerial
Behaviour, Agency Costs, and Ownership Structure".
18. Journal of Financial Economics, vol. 3, pp. 305-360.
19. Kamerschen, D. R. (1968) "Influence of Ownership and Control on Profit
Rates", American Economic Review.
20. Kathuria V. and S. Dash (1999). "Board Size and Corporate Financial
Performance:
21. Kraft, K. and J. Hage (1990). "Strategy, Social Responsibility and
Implementation". Journal of Business Ethics.
22. Kroegner, Barry F. (2003). "Strengthening Corporate Governance". ICFAI
Reader.
23. La Porta Rafael, Florencio Lopez-de-Silanes and Andrei Shieifer (1999).
"Corporate Ownership Around the World". Journal of Finance, 54(2), 471-
517.
24. La Porta, R., F. Lopez-de-Silanes, A.Shleifer, and R. Vishny (2002). "Investor
Protection and Corporate Valuation". Journal of Finance.
25. Machold, S. and A. K. Vasudevan (2004). "Corporate Governance Models in
Emerging Markets: The Case of India" . International Journal of Business
Governance and Ethics, vol.I, no.1.
26. Main, B. and J. Johnson (1993). "Remuneration Committees and Corporate
Governance". Accounting and Business Research, vol. 23. pp. 351-362.
27. McConnell, J. J. aria H. Servaes (1990). "Additional Evidence on Equity
Ownership and Corporate Value". Journal of Financial Economics, 27, pp.
595-612.
28. Morek, R.,A,-snreifer and R. W. Vishny (1988). "Management Ownership and
Market Valuation: An Empirical Analysis". Journal of Financial
Economics, 20, pp. 293-315,
29. Panchali;-J;-N.-(1999). "Corporate Governance: Indian Experiences", A
Background Paper for National Roundtable on Corporate Governance.
30. Panchali, J. N. (2001). "Corporate Governance: Indian Experiences", in
"Corporate Excellence through Corporate Governance Contemporary
Bibliography
245
Practices and Prognosis". (Edited by ICSI Centre for Corporate Research
and Training, 2001.)
31. Panchali, J. N. (2001). "Ownership Pattern and Corporate Performance",
Management Review. Indian Institute of Management, Bangalore.
32. Panchali, J. N. (2002). "Institutional Investors and Corporate Governance",
Management Review. Indian Institute of Management, Bangalore.
33. Panchali, J. N. (July 1999). "Promoting Corporate Governance: Role of
Mutual Funds". Journal of Applied Finance.
34. Panchali, J. N. and N. Desai (July 1997) "Ownership Structure and Financial
Performance: An Inquiry into Corporate Governance in Indian Corporate
Sector", ICFAI Journal of Applied Finance.
35. Panchali, J. N. and R. Baid (2002), "Corporate Governance: An Alternate
Approach" . Journal of Business Perspectives. MDI Publication.
36. Paril, R. H. (1997). "Corporate Governance in India: Some Ground Realities".
Management Review, vol.9.
37. Paul, C. and M. Watson (2000). "Three Surveys on Corporate Governance",
McKinsey Quarterly, no.4.
38. Porter, M. E. and C. Vander Linde (1995). "Green and Competitive: Ending
the Stalemate". Harward Business Review.
39. Rangarajan, C. 2000). "Corporate Governance - Some Issues". Indian
Management.
40. Reinhard, F. (1998). "Environmental Product Differentiation: Implications for
Corporate Strategy". California Management Review.
41. Reinhard, F. (1999). "Market Failure and the Environmental Policies of Firms:
Economic Rationale for 'Beyond Compliance Behaviour'". Journal of
Industrial Ecology.
42. Rugman, A. and A. Venbeke (2000). "Six Cases of Corporate Strategic
Responses to Environmental Regulation". European Management Review.
43. Sanyal, R. and J. Nevas (1991). "The Valdez Principles: Implications for
Corporate Social Performance Model". Academy of Management Review,
vol. 20, no. 1. pp. 43-64.

Bibliography
246
44. Sarcar, J. and S. Sarcar (2000). "Large Shareholder Activism in Corporate
Governance in Developing Countries: Evidence from India, 2000",
International Review of Finance, pp. 161-194.
45. Sarkar, Jayati and Subrata Sarkar (2000). "Large Shareholder Activism in
Corporate Governance in Developing Countries:
46. Evidence from India", International Review of Finance, vol.I, Issue 3.
47. Shieifer, Andrei and Robert W. Vishny (1997). "A Survey of Corporate
Governance". Journal of Finance, 52(2). pp. 737-83.
48. Shleifer, A and R. W. Vishny (1997). "A Survey of Corporate Governance".
The Journal of Finance, vol. III, no.2. pp 737-783.
49. Shleifer, A. and R. Vishny (1986). "Large Shareholders and Corporate
Control". Journal (if Political Economy, vol. 94. pp. 461-488.
50. Shleifer, A. and R. Vishny (1997). "A Survey of Corporate Governance".
Journal of Finance, vol. 52. pp. 737-783.
51. Smallman, Clive (2004). "Exploring Theoretical Paradigms in Corporate
Governance". International Journal of Business Governance and Ethics,
vol. 1.
52. Sundarajan, S. (1996). "Corporate Governance: Improving Accounting
Practices". Management Review.
53. Thonet, P. J. and O. H. Poensgen (1979). "Managerial Control and Economic
Performance in Western Gennany". The Journal of Industrial Economics,
XXVIII, no.1, pp. 23-37.
54. Vittal, N. (1998). "Corporate Governance: Principles and Objectives". Vision,
July-December.
55. Weisbach, M. (1988). "Outside Directors and CEO Turnover". Journal of
Financial Economics, vol. 20. pp. 431-460.

Bibliography
247
Reports on Corporate Governance
1. Cadbury, Sir Adrian (1992). Report of the Committee on the Financial
Aspects of Corporate Governance.
2. Department of Company Affairs (2000). Report of the Task Force on
Corporate Excellence through Governance.
3. Dr. Ganguly Group (2002). Report of the Consultative Group of Directors of
Banks/Financial Institutions (known as Dr. Ganguly Group). Reserve Bank of
India.
4. Greenbury Report (1995). "Directors' Remuneration-Report of a Study
Group". London: Gee Publishing.
5. Hampel Committee (1998). Report on Corporate Governance.
6. Kumar Mangalam Birla Committee (1999). Report on Corporate Governance.
Securities and Exchange Board of India.
7. Narasimham Committee (1991). The Financial System Report.
8. Narayana Murthy Committee (2003). Report on Corporate Governance. SEBI.
9. Naresh Chandra Committee (2002). Report on Corporate Audit and
Governance.
10. Padmanabhan Committee Report (1995). Review of the System on "On-site
Supervision over Banks".
11. Patterson Report (2001). "The Link Between Corporate Governance and
Performance".
12. Second Narasimham Committee (1998). Report on Banking Sector Reforms.
13. Task Force Report (1999). "Principles of Corporate Governance". OECD.
14. The Confederation of the Indian Industry (1998). "Desirable Corporate
Governance: A Code".
15. Turnbull Committee's Report (1998). "Combined Code of Best Practices on
Corporate Governance"

Bibliography
248
Institutional Publications on Corporate Governance 1. Berglof, Erik and Stijn C1aessens (2001). "Enforcement and Corporate
Governance". Draft Discussion Paper.
2. CIPE (March 2002). "Instituting Corporate Governance in Developing,
Emerging and Transition Economies". A Handbook, http://www.cipe.org
1. De, B. (2003). "The Incidence and Performance Effects of Interlocking
Directorates in Emerging Market Business Groups: Evidence from India'.
Working Paper WP-2003-001. Mumbai: Indira Gandhi Institute of
Development Research.
3. Dyck, A. (2001). "Privatisation and Corporate Governance: Principles,
Evidence, and Future Challenges". The World Bank Research Observer,
vol. 16, no.1.
4. Fond, Mark L. De and Mingyi Hung. "Investor Protection and Corporate
Governance: Evidence from Worldwide CEO Turn¬over". SSRN
Resources, University of Southern California. www.ssm.com
5. Global Virtue Ethics Review (1999). "The Critical Role of the Corporation in
a Global Society: A Position Paper of The Caux Round Table.
6. Hilmer, F. (1993). "Strictly Boardroom: Improving Governance to Enhance
Company Performance". Sydney: The Sydney Institute.
7. Khanna, T., and K. Palepu (1999). "Emerging Market Business Groups,
Foreign Investors and Corporate Governance". NBER Working Paper No.
W6955.
8. La Porta, R., F. Lopez-de-Silanes and A. Shleifer (1998). "Corporate
Ownership Around the World". NBER Working Paper Series, Working
paper 6625.
9. Mayer, e. (1996). "Corporate Governance, Competition and Performance".
OECD Working Paper, no. 164.
10. OECD (1997). "Impact of Institutional Investors on Financial Markets".
Financial Market Trends, no. 68.
11. OECD (1999). "Principles of Corporate Governance". www.oecd.org
12. OECD (2001). "Corporate Governance and National Development, Technical
Papers No. 180". www.oecd.org
Bibliography
249
13. OECD (2001). "Corporate Governance and National Development". Technical
Papers". no. 180. www.oecd.org
14. Panchali, J. N. (2001). "Corporate Governance: Indian Experiences, in
"Corporate Excellence through Corporate Governance-Contemporary
Practices and Prognosis. ICSI Centre for Corporation Research and
Training.
15. Panchali, Jinesh N., "Excellence in Corporate Governance (An exercise in
assessment of corporate governance practices in the Indian corporate
sector)". Indian Institute of Capital Market.
16. Patibandla, M. (2001). "Equity Pattern, Corporate Governance and
Performance: a Study of India's Corporate Sector'. Department of
International Economics and Management, Working Paper WP9.
Copenhagen: Copenhagen Business School.
17. Rafael La Porta, Florencio Lopez De Silanes, Andrei Shleifer and Robert
Vishney (1999) "Investor Protection and Corporate Governance",
www.rru.worldbank.org,
18. Reserve Bank of India (1998-99). "Report on Currency and Finance". vol. I
Chapter 8.
19. RGICS (1998). "Corporate Governance and Ethics", Conference Papers and
Proceedings Rajiv Gandhi Institute for Contemporary Studies.
20. Sarkar, J and S. Sarkar (2000). "The Governance of Indian Corporates" India
Development Report. IGIDR.
21. Securities and Exchange Board of India. "A Quick Reference Guide for
Investors".
22. Stein, J.e., (2001), "Agency, Information and Corporate Investment", NBER
working paper 8342.
23. World Bank (1999). "Corporate Governance, Overview". www.worldbank.org
24. World Bank (1999). "Corporate Governance: Framework for Implementation,
Overview". www.worldbank.org.
25. Xu, Xianonian and Yan Wang (1997). "Ownership Structure, Corporate
Governance, and Corporate Performance: The Case of Chinese Stock
Companies", Policy Research Working Paper 1794. World Bank.

Bibliography
250
Useful Websites on Corporate Governance
1. http://papers.ssrn.com/
2. http://publish.gio.gov.tw /FCJ/past/03120531.htmI
3. http://refrigeratedtrans.com
4. www.academyofcg.org/archives/jun-2003.htm#article2
5. www.angeIo.edu/events/university_symposium/archive.htm
6. www.bIonnet.com/2003/11/06/stories/2003110601430400.htm
7. www.bseindia.com/shareholding/ sharehoId_search.asp
8. www.bucklin.org/ideaI_director.htm
9. www.bucklin.org/ideaI_director.htm
10. www.businessweek.com
11. www.businessweek.com/magazine/content/02_34/b3796603.htm
12. www.cipe.org
13. www.cipe.org/publications/fs/ert/e18/corp_gov.htm
14. www.corrosion-doctors.org/Modules/mod-environ.htm
15. www.dca.nic.in/corp-exc.htm
16. www.dca.nic.in/naresh/chap1n.htm
17. www.dca.nic.in/naresh/chap5n.htm
18. www.edepositoryindia.com/index5ca.htmI
19. www.eubusiness.com/topics/ CSR/EUNews.2003-10.01.5556
20. www.feem.it/feem/pub/publications/wpapers/defauIt.htm
21. www.financiaIexpress.com/fe/daily/20000608/fco08032.htmI
22. www.findarticles.com/cCdis/ m4339 / 2_23 / 8825991/ pl1/ artocle.jhtmI?term
23. www.findarticles.com/cCdIs/ m1094/3_38/107422979 / pl/ article.jhtmI
24. www.gca-cma.org/edemo.htm
25. www.gdrc.org/u-gov/g-attributes.htmI
26. www.geometricsoftware.com/investors/corporate.htm
27. www.gIobalchange.com/corporategovernance.htm
28. www.hindu.com/thehindu/jobs/index.htm
29. www.indiainfoline.com/nevi/cadb.html
30. www.marsh.com
Bibliography
251
31. www.neelyenterprise.com/idealorg.doc
32. www.nse-india.com
33. www.oecd.org
34. www.rieti.go.jp/cgi/en/columns/columns_008.htm
35. www.romankoch.ch/capslock/corpgov.htm
36. www.socialdialogue.net/en/en_csr_index.htm
37. www.stakeholderalliance.org
38. www.stakeholderalliance.org
39. www.thebusinessline.com/bline/2002/09/25/stores/2002092502690300.htm
40. www.thehindu.com/thehindu/jobs/0401/2004011400341000.htm
41. www.thehindubusinessline.com/bline/2003/08/08/stories/
42. www.unescap.org/huset//gg/governance.htm
43. www.unescap.org/huset/gg/governance.htm
44. www.vanguard.com/bogle_site/ sp20020214.html
45. www.wcfcg.net/artl1.htm
46. www.worldbank.org
Bibliography
252
Official Reports on Corporate Governance
• CONFEDERATION OF INDIAN INDUSTRY (1998). Desirable Corporate
Governance: A Code. (Based on the recommendations of the National Task
Force on Corporate Governance, chaired by Rahul Bajaj.)
• DEPARTMENT OF COMPANY AFFAIRS (2000). Report of the Task Force
on Corporate Excellence through Governance. (On the basis of the report
submitted by a committee chaired by Dr. P. 1. Sanjeeva Reddy.)
• MINISTRY OF FINANCE AND COMPANY AFFAIRS (2003). Report of
the Committee on Regulation of Private Companies and Partnership (also
known as Naresh Chandra Committee 11).
• RESERVE BANK OF INDIA (2001). Report of the Advisory Group on
Corporate Governance. (Standing Committee on International Financial
Standards and Codes.)
• RESERVE BANK OF INDIA (2002). Report of the Consultative Group of
Directors of Banks/Financial Institutions (also known as the Ganguly
Committee).
• SECURITIES AND EXCHANGE BOARD OF INDIA (1999). Report of the
Kumar Mangalam Birla Committee on Corporate Governance. (Submitted by
the Birla Committee appointed by SEBI, India's capital market regulator.)
• SECURITIES AND EXCHANGE BOARD OF INDIA (2002). Report of the
Committee on Corporate Audit and Governance (under the chairmanship of
Naresh Chandra).
• SECURITIES AND EXCHANGE BOARD OF INDIA (2003). Report of the
SEBI Committee on Corporate Governance (under the chairmanship of N. R.
Narayanamurthy of Infosys).
Bibliography
253
Prominent Guidelines on Corporate Governance
• AFL-CIO Guidelines American Federation of Labor and Congress of
Industrial Organistions, Investing Our Future: AFL-CIO Proxy Voting
Guidelines (1997).
• ALI Principles American Law Institute, Principles of Corporate Governance:
Analysis and Recommendations (1994).
• Bosch Report Working Party of the Australian Institute of Company Directors
and others, Corporate Practices and Conduct (3'd edition, 1995).
• Cadbury Code Committee on the Financial Aspects of Corporate Governance
(Sir Adrian Cadbury, Chairman): Code of Best Practice (1992).
• Cadbury Report Committee on the Financial Aspects of Corporate
Governance (Sir Adrian Cadbury, Chairman), "The Financial Aspects of
Corporate Governance", (1992).
• CISCO Guide The City Group for Smaller Companies, The Financial Aspects
of Corporate Governance: Guidance for Smaller Companies.
• Council of Institutional Investors' Policies Council of Institutional Investors,
Corporate Governance Policies.
• IFSA Guidelines Investment and Financial Services Association, Corporate
Governance: Guide for Investment Management and Corporations (1999).
• Malaysian Code on Corporate Governance
• Stock Exchange of Hong Kong (SEHK) Code of Best Practice for Listed
Companies of the Stock Exchange of Hong Kong, China (1996).
• Toronto Guidelines Toronto Stock Exchange, The Toronto Stock Exchange
Company Manual
• Toronto Report Toronto Stock Exchange Committee on Corporate
Governance in Canada, Where Were Directors? Guidelines for Improved
Corporate Governance in Canada.
• UK Combined Code Financial Services Authority, The Listing Rules, and
Combined code.
• US Business Roundtable Report Business Roundtable, Corporate Governance
and American Competitiveness.
Bibliography
254
Links on Corporate Governance
A) European Union • Commission/DG Internal Market: Directors' Remuneration
• Commission/DG Internal Market: Independent Directors and Board
Committees
• Commission/DG Internal Market: European Corporate Governance Forum
• Eul-Lex: Communication Modernising Company Law' and Enhancing
Corporate Governance in the European Union - A Plan to Move Forward,
Com (2003) 284
• Commission: Memo Action Plan on "Modernising Company Law and
Enhancing Corporate Governance in the European Union" (21 May 2003)
• DG Internal Market: Synthesis of the responses to the commission's
communication (Nov. 2003)
• Commission, DG Internal Market: Company Law and Corporate Governance
• Winter Group Report: A modern regulatory framework for company law in
Europe (November 2002)
• Commission: Press release 4 November 2002
• Winter Group: A Modern Regulatory Framework for Company Law in
Europe: A Consultative Document of the High Level Group of Company Law
Experts (April 2002)
• Winter Group: Report of the High Level Group of Company Law Experts on
Issues Related to Takeover Bids (January 2002)
• Commission: Comparative Study of Corporate Governance Codes Relevant to
the European Union and its Member States (March 2002)
• Commission: Discussion of Individual Corporate Governance Codes (March
2002)
• DG ECOFIN: Issues in Corporate Governance (March 2004)
• Parliament :OEIL: Company Law Perspectives in the European Union
• Parliament: Draft report on the Communication Modernising company law
and enhancing corporate governance in the European Union [Report MEP
Fiorella Ghilardotti] (March 2004)

Bibliography
255
B) Governments • Belgium: Report of the Belgian Commission on Corporate Finance (1998)
• Germany: German Panel on Corporate Governance-Corporate Governance
Rules for Quoted German Companies (January 2000)
• UK: Hamper Report - Committee on Corporate Governance Final Report
(January 1998)
• UK: Cadbury Commission-Report of the Committee on the Financial Aspects
of Corporate Governance (December 1992)
• United States: Sarbanes-Oxley Act on Public Company Accounting Reform
and Investor Protection (2002)
• India: Report of the Task Force on Corporate Excellence through Governance
(2000), Dept.of Company Affaires, Govt of India
• India: Report of the Committee on Regulation of Private Companies and
Partnerships Ministry of Finance & Company Affairs Government of India
(2003).
C) International Organisations • International Chamber of Commerce (ICC): Corporate Governance
• World Council for Corporate Governance (WCFCG): website
• Global Corporate Governance Forum (GCGF): website
• OECD: Principles of Corporate Governance (Revised -January 2004)
• OECD: Survey of Corporate Governance Development in OECD Countries
• OECD: Corporate Affairs-Activities on Corporate Governance
• OECD: Guidelines for Multinational Enterprises
• OECD Business Sector Advisory Group on Corporate Governance: Corporate
Governance-Improving Competitiveness and Access to Capital in Global
Markets, Report to the OECD (Millstein Report) (April 1998)
• World Bank: Corporate Governance in Private Sector Development
• European Bank for Reconstruction and Development (EBRD): Sound
Business Standards and Corporate Practices (September 1997)

SGN
ANNEXURE : 1 : CLAUSE 49 OF LISTING AGGREEMENT
Annexure : I : Clause 49 of Listing Agreement
ii
Clause 49 - Corporate Governance The company agrees to comply with the following provisions: I. Board of Directors Composition of Board (i) The board of directors of the company shall have an optimum combination of executive and non-executive directors with not less than fifty percent of the board of directors comprising of non-executive directors. The number of independent directors would depend on whether the Chairman is executive or non-executive. In case of a non-executive chairman, at least one-third of board should comprise of independent directors and in case of an executive chairman, at least half of board should comprise of independent directors. Explanation (i): For the purpose of this clause, the expression ‘independent director’ shall mean non-executive director of the company who apart from receiving director’s remuneration, does not have any material pecuniary relationships or transactions with the company, its promoters, its senior management or its holding company, its subsidiaries and associated companies; is not related to promoters or management at the board level or at one level below the board; has not been an executive of the company in the immediately preceding three financial years; is not a partner or an executive of the statutory audit firm or the internal audit firm that is associated with the company, and has not been a partner or an executive of any such firm for the last three years. This will also apply to legal firm(s) and consulting firm(s) that have a material association with the entity. is not a supplier, service provider or customer of the company. This should include lessor-lessee type relationships also; and is not a substantial shareholder of the company, i.e. owning two percent or more of the block of voting shares. Explanation (ii): Institutional directors on the boards of companies shall be considered as independent directors whether the institution is an investing institution or a lending institution. (B) Non executive directors’ compensation and disclosures (i) All compensation paid to non-executive directors shall be fixed by the Board of Directors and shall be approved by shareholders in general meeting. Limits shall be set for the maximum number of stock options that can be granted to non-executive directors in any financial year and in aggregate. The stock options granted to the non-executive directors shall vest after a period of at least one year from the date such non-executive directors have retired from the Board of the Company. (ii)The considerations as regards compensation paid to an independent director shall be the same as those applied to a non-executive director. (iii)The company shall publish its compensation philosophy and statement of entitled compensation in respect of non-executive directors in its annual report. Alternatively,

Annexure : I : Clause 49 of Listing Agreement
iii
this may be put up on the company’s website and reference drawn thereto in the annual report. Company shall disclose on an annual basis, details of shares held by non-executive directors, including on an "if-converted" basis. (iv)Non-executive directors shall be required to disclose their stock holding (both own or held by / for other persons on a beneficial basis) in the listed company in which they are proposed to be appointed as directors, prior to their appointment. These details should accompany their notice of appointment (C) Independent Director Independent Director shall however periodically review legal compliance reports prepared by the company as well as steps taken by the company to cure any taint. In the event of any proceedings against an independent director in connection with the affairs of the company, defence shall not be permitted on the ground that the independent director was unaware of this responsibility. The considerations as regards remuneration paid to an independent director shall be the same as those applied to a non executive director (D) Board Procedure The board meeting shall be held at least four times a year, with a maximum time gap of four months between any two meetings. The minimum information to be made available to the board is given in Annexure–IA. A director shall not be a member in more than 10 committees or act as Chairman of more than five committees across all companies in which he is a director. Furthermore it should be a mandatory annual requirement for every director to inform the company about the committee positions he occupies in other companies and notify changes as and when they take place. Explanation: For the purpose of considering the limit of the committees on which a director can serve, all public limited companies, whether listed or not, shall be included and all other companies (i e private limited companies, foreign companies and companies under Section 25 of the Companies Act, etc) shall be excluded. Further only the three committees viz. the Audit Committee, the Shareholders’ Grievance Committee and the Remuneration Committee shall be considered for this purpose. (E) Code of Conduct It shall be obligatory for the Board of a company to lay down the code of conduct for all Board members and senior management of a company. This code of conduct shall be posted on the website of the company.

Annexure : I : Clause 49 of Listing Agreement
iv
All Board members and senior management personnel shall affirm compliance with the code on an annual basis. The annual report of the company shall contain a declaration to this effect signed by the CEO and COO. Explanation: For this purpose, the term "senior management" shall mean personnel of the company who are members of its management / operating council (i.e. core management team excluding Board of Directors). Normally, this would comprise all members of management one level below the executive directors (F) Term of Office of Non–executive directors Person shall be eligible for the office of non-executive director so long as the term of office did not exceed nine years in three terms of three years each, running continuously. II Audit Committee. Qualified and Independent Audit Committee A qualified and independent audit committee shall be set up and shall comply with the following:
• The audit committee shall have minimum three members. All the members of audit committee shall be non-executive directors, with the majority of them being independent.
• All members of audit committee shall be financially literate and at least one member shall have accounting or related financial management expertise.
Explanation (i):The term "financially literate" means the ability to read and understand basic financial statements i.e. balance sheet, profit and loss account, and statement of cash flows. Explanation (ii): A member will be considered to have accounting or related financial management expertise if he or she possesses experience in finance or accounting, or requisite professional certification in accounting, or any other comparable experience or background which results in the individual’s financial sophistication, including being or having been a chief executive officer, chief financial officer, or other senior officer with financial oversight responsibilities.
• The Chairman of the Committee shall be an independent director;
• The Chairman shall be present at Annual General Meeting to answer shareholder queries;
The audit committee should invite such of the executives, as it considers appropriate (and particularly the head of the finance function) to be present at the meetings of the committee, but on occasions it may also meet without the presence of any executives of the company. The finance director, head of internal audit and when required, a representative of the external auditor shall be present as invitees for the meetings of the audit committee;
• The Company Secretary shall act as the secretary to the committee.
Annexure : I : Clause 49 of Listing Agreement
v
(B) Meeting of Audit Committee The audit committee shall meet at least thrice a year. One meeting shall be held before finalization of annual accounts and one every six months. The quorum shall be either two members or one third of the members of the audit committee, whichever is higher and minimum of two independent directors. (C) Powers of Audit Committee The audit committee shall have powers which should include the following: To investigate any activity within its terms of reference. To seek information from any employee. To obtain outside legal or other professional advice. To secure attendance of outsiders with relevant expertise, if it considers necessary. (D) Role of Audit Committee (i) The role of the audit committee shall include the following:
• Oversight of the company’s financial reporting process and the disclosure of its financial information to ensure that the financial statement is correct, sufficient and credible.
• Recommending the appointment and removal of external auditor, fixation of audit fee and also approval for payment for any other services.
• Reviewing with management the annual financial statements before submission to the board, focusing primarily on;
• Any changes in accounting policies and practices. • Major accounting entries based on exercise of judgment by management. • Qualifications in draft audit report. • Significant adjustments arising out of audit. • The going concern assumption. • Compliance with accounting standards. • Compliance with stock exchange and legal requirements concerning financial
statements • Any related party transactions • Reviewing with the management, external and internal auditors, the adequacy
of internal control systems. • Reviewing the adequacy of internal audit function, including the structure of
the internal audit department, staffing and seniority of the official heading the department, reporting structure coverage and frequency of internal audit.
• Discussion with internal auditors any significant findings and follow up there on.
• Reviewing the findings of any internal investigations by the internal auditors into matters where there is suspected fraud or irregularity or a failure of internal control systems of a material nature and reporting the matter to the board.
Annexure : I : Clause 49 of Listing Agreement
vi
• Discussion with external auditors before the audit commences about nature
and scope of audit as well as post-audit discussion to ascertain any area of concern.
• Reviewing the company’s financial and risk management policies. • To look into the reasons for substantial defaults in the payment to the
depositors, debenture holders, shareholders (in case of non payment of declared dividends) and creditors.
Explanation (i): The term "related party transactions" shall have the same meaning as contained in the Accounting Standard 18, Related Party Transactions, issued by The Institute of Chartered Accountants of India. Explanation (ii): If the company has set up an audit committee pursuant to provision of the Companies Act, the company agrees that the said audit committee shall have such additional functions / features as is contained in the Listing Agreement. (E) Review of information by Audit Committee (i) The Audit Committee shall mandatorily review the following information: Financial statements and draft audit report, including quarterly / half-yearly financial information; Management discussion and analysis of financial condition and results of operations; Reports relating to compliance with laws and to risk management; Management letters / letters of internal control weaknesses issued by statutory / internal auditors; and Records of related party transactions The appointment, removal and terms of remuneration of the Chief internal auditor shall be subject to review by the Audit Committee III. Audit Reports and Audit Qualifications Disclosure of Accounting Treatment In case it has followed a treatment different from that prescribed in an Accounting Standards, management shall justify why they believe such alternative treatment is more representative of the underlined business transactions. Management shall also clearly explain the alternative accounting treatment in the footnote of financial statements.
Annexure : I : Clause 49 of Listing Agreement
vii
IV. Whistle Blower Policy (A) Internal Policy on access to Audit Committees: Personnel who observe an unethical or improper practice (not necessarily a violation of law) shall be able to approach the audit committee without necessarily informing their supervisors. Companies shall take measures to ensure that this right of access is communicated to all employees through means of internal circulars, etc. The employment and other personnel policies of the company shall contain provisions protecting "whistle blowers" from unfair termination and other unfair prejudicial employment practices. Company shall annually affirm that it has not denied any personnel access to the audit committee of the company (in respect of matters involving alleged misconduct) and that it has provided protection to "whistle blowers" from unfair termination and other unfair or prejudicial employment practices. Such affirmation shall form a part of the Board report on Corporate Governance that is required to be prepared and submitted together with the annual report. The appointment, removal and terms of remuneration of the chief internal auditor shall be subject to review by the Audit Committee. V. Subsidiary Companies The company agrees that provisions relating to the composition of the Board of Directors of the holding company shall be made applicable to the composition of the Board of Directors of subsidiary companies At least one independent director on the Board of Directors of the holding company shall be a director on the Board of Directors of the subsidiary company. The Audit Committee of the holding company shall also review the financial statements, in particular the investments made by the subsidiary company. (iv) The minutes of the Board meetings of the subsidiary company shall be placed for review at the Board meeting of the holding company. (v) The Board report of the holding company should state that they have reviewed the affairs of the subsidiary company also
Annexure : I : Clause 49 of Listing Agreement
viii
VI. Disclosure of contingent liabilities (i) The company agrees that management shall provide a clear description in plain English of each material contingent liability and its risks, which shall be accompanied by the auditor’s clearly worded comments on the management’s view. This section shall be highlighted in the significant accounting policies and notes on accounts, as well as, in the auditor’s report, where necessary. VII. Disclosures (A) Basis of related party transactions (i) A statement of all transactions with related parties including their basis shall be placed before the Audit Committee for formal approval/ratification. If any transaction is not on an arm’s length basis, management shall provide an explanation to the Audit Committee justifying the same. (B) Board Disclosures –Risk management (i) It shall put in place procedures to inform Board members about the risk assessment and minimization procedures. These procedures shall be periodically reviewed to ensure that executive management controls risk through means of a properly defined framework. (ii) Management shall place a report certified by the compliance officer of the company, before the entire Board of Directors every quarter documenting the business risks faced by the company, measures to address and minimize such risks, and any limitations to the risk taking capacity of the corporation. This document shall be formally approved by the Board. (C) Proceeds from Initial Public Offerings (IPOs) (i) When money is raised through an Initial Public Offering (IPO) it shall disclose to the Audit Committee, the uses / applications of funds by major category (capital expenditure, sales and marketing, working capital, etc), on a quarterly basis as a part of their quarterly declaration of financial results. Further, on an annual basis, the company shall prepare a statement of funds utilized for purposes other than those stated in the offer document/prospectus. This statement shall be certified by the independent auditors of the company. The audit committee shall make appropriate recommendations to the Board to take up steps in this matter.
Annexure : I : Clause 49 of Listing Agreement
ix
(D) Remuneration of Directors All pecuniary relationship or transactions of the non-executive director’s vis-à-vis the company shall be disclosed in the Annual Report. (ii) Further the following disclosures on the remuneration of directors shall be made in the section on the corporate governance of the annual report. All elements of remuneration package of all the directors i.e. salary, benefits, bonuses, stock options, pension etc. Details of fixed component and performance linked incentives, along with the performance criteria. Service contracts, notice period, severance fees. Stock option details, if any – and whether issued at a discount as well as the period over which accrued and over which exercisable. (E) Management As part of the directors’ report or as an addition there to, a Management Discussion and Analysis report should form part of the annual report to the shareholders. This Management Discussion & Analysis should include discussion on the following matters within the limits set by the company’s competitive position: Industry structure and developments. Opportunities and Threats. Segment–wise or product-wise performance. Outlook Risks and concerns. Internal control systems and their adequacy. Discussion on financial performance with respect to operational performance. Material developments in Human Resources / Industrial Relations front, including number of people employed. Management shall make disclosures to the board relating to all material financial and commercial transactions, where they have personal interest, that may have a potential conflict with the interest of the company at large (for e.g. dealing in company shares, commercial dealings with bodies, which have shareholding of management and their relatives etc.)
Annexure : I : Clause 49 of Listing Agreement
x
(F) Shareholders (i) In case of the appointment of a new director or re-appointment of a director the shareholders must be provided with the following information: A brief resume of the director; Nature of his expertise in specific functional areas ; and Names of companies in which the person also holds the directorship and the membership of Committees of the board. (ii) Information like quarterly results, presentation made by companies to analysts shall be put on company’s web-site, or shall be sent in such a form so as to enable the stock exchange on which the company is listed to put it on its own web-site. (iii) A board committee under the chairmanship of a non-executive director shall be formed to specifically look into the redressal of shareholder and investors complaints like transfer of shares, non-receipt of balance sheet, non-receipt of declared dividends etc. This Committee shall be designated as ‘Shareholders/Investors Grievance Committee’. (iv)To expedite the process of share transfers the board of the company shall delegate the power of share transfer to an officer or a committee or to the registrar and share transfer agents. The delegated authority shall attend to share transfer formalities at least once in a fortnight. VIII. CEO/CFO certification CEO (either the Executive Chairman or the Managing Director) and the CFO (whole-time Finance Director or other person discharging this function) of the company shall certify that, to the best of their knowledge and belief: They have reviewed the balance sheet and profit and loss account and all its schedules and notes on accounts, as well as the cash flow statements and the Directors’ Report; These statements do not contain any materially untrue statement or omit any material fact nor do they contain statements that might be misleading;
Annexure : I : Clause 49 of Listing Agreement
xi
These statements together present a true and fair view of the company, and are in compliance with the existing accounting standards and / or applicable laws / regulations; They are responsible for establishing and maintaining internal controls and have evaluated the effectiveness of internal control systems of the company; and they have also disclosed to the auditors and the Audit Committee, deficiencies in the design or operation of internal controls, if any, and what they have done or propose to do to rectify these; They have also disclosed to the auditors as well as the Audit Committee, instances of significant fraud, if any, that involves management or employees having a significant role in the company’s internal control systems; and They have indicated to the auditors, the Audit Committee and in the notes on accounts, whether or not there were significant changes in internal control and / or of accounting policies during the year. IX. Report on Corporate Governance (i) There shall be a separate section on Corporate Governance in the annual reports of company, with a detailed compliance report on Corporate Governance. Non-compliance of any mandatory requirement i.e. which is part of the listing agreement with reasons thereof and the extent to which the non-mandatory requirements have been adopted should be specifically highlighted. The suggested list of items to be included in this report is given in Annexure-1B and list of non-mandatory requirements is given in Annexure –1C. (ii) The companies shall submit a quarterly compliance report to the stock exchanges within 15 days from the close of quarter as per the format given below. The report shall be submitted either by the Compliance Officer or the Chief Executive Officer of the company after obtaining due approvals.

Annexure : I : Clause 49 of Listing Agreement
xii
Format of Quarterly Compliance Report on Corporate Governance Name of the Company: Quarter ending on: Particulars Clause of Listing
Agreement. Compliance Status Remarks
I. Board of Directors 49 I (A)Composition of Board 49(IA) (B)Non-executive Directors’ compensation & disclosures
(IB)
(C)Independent Director (IC) (D)Board Procedure 9 (ID) (E)Code of Conduct 9 (IE) (F)Term of office of non-executive directors
49 (IF)
II. Audit Committee 9 (II) (A)Qualified & Independent Audit Committee
9 (IIA)
(B)Meeting of Audit Committee 9 (IIB) (C)Powers of Audit Committee 9 (IIC) (D)Role of Audit Committee II(D) (E)Review of Information by Audit Committee
49 (IIE)
III. Audit Reports and Audit Qualifications
49 (III)
IV.Whistle Blower Policy 49 (IV) V. Subsidiary Companies 49 (V) VI. Disclosure of contingent liabilities
49 (VI)
VII.Disclosures 49 (VII) (A)Basis of related party transactions
IIA)
(B)Board Disclosures (VIIB) (C)Proceeds from Initial Public offerings
49 (VIIC)
(D)Remuneration of Directors 49 (VIID) (E)Management (VIIE) (F)Shareholders 49 (VIIF) VIII.CEO/CFO Certification 49 (VIII) IX. Report on Corporate Governance
49 (IX)
X. Compliance 49 (X) Note: 1) The details under each head shall be provided to incorporate all the information required as per the provisions of the clause 49 of the Listing Agreement. 2) In the column No.3, compliance or non-compliance may be indicated by Yes/No/N.A.. For example, if the Board has been composed in accordance with the clause 49 I of the Listing Agreement, "Yes" may be indicated. Similarly, in case the company has not come out with an IPO, the words "N.A." may be indicated against 49 (VIIC).
Annexure : I : Clause 49 of Listing Agreement
xiii
3) In the remarks column, reasons for non-compliance may be indicated, for example, in case of requirement related to circulation of information to the shareholders, which would be done only in the AGM/EGM, it might be indicated in the "Remarks" column as – "will be complied with at the AGM". Similarly, in respect of matters which can be complied with only where the situation arises, for example, "Report on Corporate Governance" is to be a part of Annual Report only, the words "will be complied in the next Annual Report" may be indicated. X. Compliance The company shall obtain a certificate from either the auditors or practicing company secretaries regarding compliance of conditions of corporate governance as stipulated in this clause and annex the certificate with the directors’ report, which is sent annually to all the shareholders of the company. The same certificate shall also be sent to the Stock Exchanges along with the annual returns filed by the company. Schedule of implementation (1) The provisions of the revised clause 49 shall be implemented as per the schedule of implementation given below: (i) By all entities seeking listing for the first time, at the time of listing. (ii) By all companies which were required to comply with the requirement of the erstwhile clause 49 i.e. all listed entities having a paid up share capital of Rs 3 crores and above or net worth of Rs 25 crores or more at any time in the history of the entity . These entities shall be required to comply with the requirement of this clause on or before March 31, 2004. (2) The non-mandatory requirement given in Annexure – 1C shall be implemented as per the discretion of the company. However, the disclosures of the adoption/non-adoption of the non-mandatory requirements shall be made in the section on corporate governance of the Annual Report.