SFX Entertainment Inc. · COMPANY PROFILE SFX EntertainmentInstitutional Ownership: 35.9 430 Park...
21
EQUITY RESEARCH INITIATION John Tinker (212) 895-3735 [email protected] Kevin Rippey (212) 895-3619 [email protected] Media SFXE - NASDAQ September 17, 2014 Closing Price 09/17/2014 $6.36 Rating: Buy 12-Month Target Price: $9.00 52-Week Range: $5.41 - $13.39 Market Cap ($M): $562 Shares O/S: 89 Float: 53.9% Avg. Daily Volume (000): 550 Dividend Yield: 0.00% Dividend: $0.00 Fiscal Year End: December Revenue ($M) 2013A 2014E 2015E 1Q 40 38A 42 2Q 70 82A 103 3Q 114 165 206 4Q 93 136 141 FY 316 421 491 EBITDA ($M) 2013A 2014E 2015E 1Q 7 (11)A (3) 2Q 2 (12)A (11) 3Q 17 32 53 4Q 26 32 44 FY 52 41 84 EV/EBITDA 2013A 2014E 2015E NM 17.2x 8.1x 13 12 11 10 9 8 7 6 5 Nov-13 Jan-14 Mar-14 May-14 Jul-14 Sep-14 20 15 10 5 0 Price Volume Volume (MM) Price (USD) SFXE Source: Factset SFX Entertainment Inc. Buy Millennial Music & Marketing; Initiating Coverage of SFX Entertainment Inc. with Buy Rating and $9 Price Target Summary • We believe SFXE is a pure-play on elusive global Millennial media consumption and a shift in marketing budgets as consumer brands seek new ways to reach consumers in their 20s. • Non-traditional CEO Bob Sillerman has a long successful entrepreneurial history of building businesses and then selling them. • Current signed sponsorship partnerships are anticipated to generate high margin $50M-$60M in sponsorship revenue over the next 12 months with upside if performance benchmarks are hit. • Cash generating ability of SFXE's festival brands obscured by start up costs associated with the ramp to 78 festivals in 2014 from 45 festivals in 2013. • At 5.7x 2016 EV/EBITDA, we see a compelling risk/reward in SFXE shares as we anticipate EBITDA of $105M in 2016 compared to our 2014 estimate of $41M. Details We are initiating coverage of SFXE with a Buy recommendation. SFXE has fallen ~50% since its IPO in the Fall of 2013 as investors have sold shares as its business model evolved from a simple roll up story to a build out of festival brands as a marketing platform targeted at Millennials. We forecast a secular shift in the ~$2.6B of global live music sponsorship budgets toward Electronic Dance Music (EDM) festivals as brands seek new ways to engage with difficult to reach Millennials. We believe that by 2016 EDM should comprise 8% of total live global sponsorship budgets, or $208M. SFXE has announced sponsorship agreements with sponsors in three of the top six key categories including Anheuser-Busch-InBev, MasterCard and T-Mobile. Under currently signed deals SFXE expects to generate sponsorship revenue of $50M- $60M over the next 12 months compared to near zero over the previous 12 months. The build out of festival brands across new geographies and the associated costs of expanding festival footprints has obscured the cash generating ability of major festival brands. SFXE has expanded its festival line to a planned 78 in 2014 from 45 in 2013. The opex associated with expanding its festival footprint has in our view masked the cash generating ability of SFXE's festivals and dropped estimated EDITDA to $41M this year from pro-forma $52M in 2013. We forecast EBITDA growing 104% to $84M in 2015 and 25% in 2016 to $105M as EBITDA margins approach high teens compared to low-single digit margins for traditional concerts. Our $9 SFXE price target is based on an 8x multiple on our $105M 2016 EBITDA estimate. We believe the stock provides a compelling risk reward given it currently trades at 5.7x our 2016 EV/EBITDA estimates. We believe there is upside to our target 8x multiple as SFXE de-risks with additional sponsorship commitments over the next 12-18 months. Investors who prefer a broad based portfolio should consider owning Live Nation, trading at 8.5x 2015 EBITDA. Investors in Madison Square Garden (trading at 11.6x FY16) focused on MSG's next acquisition, might consider SFXE as a potential target. SEE PAGES 17 - 20 FOR IMPORTANT DISCLOSURES AND DISCLAIMERS
Transcript of SFX Entertainment Inc. · COMPANY PROFILE SFX EntertainmentInstitutional Ownership: 35.9 430 Park...
EQUITY RESEARCHINITIATION
John Tinker(212) [email protected]
Kevin Rippey(212) [email protected]
Media
SFXE - NASDAQ September 17, 2014
Closing Price 09/17/2014 $6.36Rating: Buy12-Month Target Price: $9.0052-Week Range: $5.41 - $13.39Market Cap ($M): $562Shares O/S: 89Float: 53.9%Avg. Daily Volume (000): 550Dividend Yield: 0.00%Dividend: $0.00Fiscal Year End: December
Revenue ($M) 2013A 2014E 2015E1Q 40 38A 422Q 70 82A 1033Q 114 165 2064Q 93 136 141FY 316 421 491
EBITDA ($M) 2013A 2014E 2015E1Q 7 (11)A (3)2Q 2 (12)A (11)3Q 17 32 534Q 26 32 44FY 52 41 84
EV/EBITDA
2013A 2014E 2015E NM 17.2x 8.1x
13
12
11
10
9
8
7
6
5Nov-13 Jan-14 Mar-14 May-14 Jul-14 Sep-14
20
15
10
5
0
Price Volume
Volume (MM) Price (USD)SFXE
Source: Factset
SFX Entertainment Inc. BuyMillennial Music & Marketing; Initiating Coverage of SFXEntertainment Inc. with Buy Rating and $9 Price Target
Summary
• We believe SFXE is a pure-play on elusive global Millennial mediaconsumption and a shift in marketing budgets as consumer brands seek newways to reach consumers in their 20s.
• Non-traditional CEO Bob Sillerman has a long successful entrepreneurialhistory of building businesses and then selling them.
• Current signed sponsorship partnerships are anticipated to generate highmargin $50M-$60M in sponsorship revenue over the next 12 months withupside if performance benchmarks are hit.
• Cash generating ability of SFXE's festival brands obscured by start up costsassociated with the ramp to 78 festivals in 2014 from 45 festivals in 2013.
• At 5.7x 2016 EV/EBITDA, we see a compelling risk/reward in SFXE shares aswe anticipate EBITDA of $105M in 2016 compared to our 2014 estimate of$41M.
Details
We are initiating coverage of SFXE with a Buy recommendation. SFXE hasfallen ~50% since its IPO in the Fall of 2013 as investors have sold shares as itsbusiness model evolved from a simple roll up story to a build out of festival brandsas a marketing platform targeted at Millennials.
We forecast a secular shift in the ~$2.6B of global live music sponsorshipbudgets toward Electronic Dance Music (EDM) festivals as brands seek newways to engage with difficult to reach Millennials. We believe that by 2016EDM should comprise 8% of total live global sponsorship budgets, or $208M.SFXE has announced sponsorship agreements with sponsors in three of the top sixkey categories including Anheuser-Busch-InBev, MasterCard and T-Mobile. Undercurrently signed deals SFXE expects to generate sponsorship revenue of $50M-$60M over the next 12 months compared to near zero over the previous 12 months.
The build out of festival brands across new geographies and the associatedcosts of expanding festival footprints has obscured the cash generating abilityof major festival brands. SFXE has expanded its festival line to a planned 78 in2014 from 45 in 2013. The opex associated with expanding its festival footprint hasin our view masked the cash generating ability of SFXE's festivals and droppedestimated EDITDA to $41M this year from pro-forma $52M in 2013. We forecastEBITDA growing 104% to $84M in 2015 and 25% in 2016 to $105M as EBITDAmargins approach high teens compared to low-single digit margins for traditionalconcerts.
Our $9 SFXE price target is based on an 8x multiple on our $105M 2016 EBITDAestimate. We believe the stock provides a compelling risk reward given it currentlytrades at 5.7x our 2016 EV/EBITDA estimates. We believe there is upside to ourtarget 8x multiple as SFXE de-risks with additional sponsorship commitmentsover the next 12-18 months. Investors who prefer a broad based portfolio shouldconsider owning Live Nation, trading at 8.5x 2015 EBITDA. Investors in MadisonSquare Garden (trading at 11.6x FY16) focused on MSG's next acquisition, mightconsider SFXE as a potential target.
SEE PAGES 17 - 20 FOR IMPORTANT DISCLOSURES AND DISCLAIMERS
COMPANY PROFILE
SFX Entertainment
430 Park Avenue
New York, NY 10022
(646) 561-6400
Website: www.sfxii.com
Company Description: SFX Entertainment, Inc. is the largest global producer of live events and digital
entertainment content focused exclusively on electronic dance music (EDM) and other world-class
festivals. SFX's mission is to enable EDM by providing fans with live experiences, music discovery, and
digital connectivity with its content and the broader EDM community. SFX was borne out of the
technology revolution, as the music industry evolved into DJ and producer-led creations driven by social
and digital consumer media. SFX produces and promotes a growing portfolio of live events that includes
leading brands such as Tomorrowland, TomorrowWorld, Mysteryland, Sensation, Stereosonic, Electric
Zoo, Disco Donnie Presents, Life in Color, Nature One, Mayday, and Ruhr-in-Love. SFX also operates
Beatport, an online resource for EDM DJs and a trusted destination for the growing EDM community to
discover and stream music, follow DJs, and keep abreast of news, information and events, in addition to
offering year-round entertainment to EDM fans around the globe through other digital assets. SFXE
cam public in October 2013 at $13 a share and raised $240M.
Robert F.X. Sillerman: Chairman of the Board and Chief Executive Officer. Mr. Sillerman has
served as Chairman of the Board and CEO since the company’s inception. He was the Executive
Chairman, a Member of the Office of the Chairman, and a director of the original SFX—SFX
Entertainment Inc., a company that owned and operated live entertainment venues—from its formation
in December 1997 through its sale to Clear Channel in August 2000 for $4.4B. previously Mr. had built
and sold SFX Broadcasting, a radio station operator for $2.1B. Mr. Sillerman also served as the Chief
Executive Officer and Chairman of CKX, Inc., a company that owned the rights to Graceland and
"American Idol", from February 2005 until May 2010. Mr. Sillerman is also Chairman and CEO of Viggle.
Timothy J. Crowhurst: President. Mr. Crowhurst has been President since June 2013. Prior to joining
SFX, Mr. Crowhurst founded White Oak, an investment management and corporate advisory firm
focused on internet, media, and entertainment. Prior to White Oak, Mr. Crowhurst was with Goldman
Sachs from 1999 through 2012, where, most recently, he served as a Managing Director in the
Technology, Media, and Telecom Group within the Investment Banking Division.
Richard Rosenstein: Chief Financial Officer, Chief Administrative Officer, and Executive Vice
President. Mr. Rosenstein has been EVP of Corporate Strategy & Development since October 2012.
He was named Chief Financial Officer in February 2013 and appointed Chief Administrative Officer in
June 2014. Prior to joining the company, Mr. Rosenstein was Vice President at Baron Capital, Inc., and
before that, he was Partner at Keel Capital Management LLC, a hedge fund, from 2004 to 2007. Prior to
2004, Mr. Rosenstein was a Managing Director at Goldman Sachs, where he covered media companies
in equity research.
Risks:
EDM proves to be a fad in the U.S.
SFXE's non-traditional CEO raises concerns.
SFXE is unable to expand festival brands into new geographies.
There is a lack of meaningful contribution from new sponsorship categories.
Consensus estimates fall into line with our estimates.
Institutional Ownership: 35.9%
Insider Ownership: 47.9%
(Source: Bloomberg)
Balance Sheet Summary ($M):
(As of March 31, 2014)
Equity: $244.7
Assets: $687.5
Analysts Covering SFXE: 3
# of Buys: 3
# of Holds: 0
# of Sells: 0
(Excluding Maxim Group LLC)
Consensus EBITDA Estimates:
Current Year: $36M
Next Year: $118M
Investor Relations Contact:
Joseph Jaffoni, JCIR
(212) 835-8500
2Maxim Group LLC
SFX Entertainment Inc. (SFXE)
Investment Overview
Following a ~50% sell-off since going public in 2013, we believe Wall Street is underestimating the
ability of SFXE's festival brands to generate cash flow as a sponsorship platform. We estimate that, in
2016, SFXE could generate $105M of EBITDA, up 165% from our 2014 estimate of $41M and down from
2013's estimated pro forma EBITDA of $53M. In our view, the scale and quality of SFXE's festival brands
represent a global marketing platform uniquely suited to Millenial media consumption patterns and ideally
positioned for marketers seeking to connect with the difficult-to-reach demographic.
SFXE shares are down ~50% since the IPO, as specifics regarding the company's business model and
strategy have evolved. At the time of the IPO, investors saw potential for immediate top-line growth driven
by a rollup of a wide range of assets tied to the electronic music genre. This strategy was refined as
management's focus has been on acquiring and building large multi-day festivals with attendance exceeding
50,000 (providing more attractive sustainable economics than smaller indoor shows). The build-out of
additional festivals is focused on taking high-quality and established festival brands into new geographies.
Despite better economics, the build-out of festival brands in new locations takes time—a particular festival
only occurs once a year and typically loses money in its first year. The shift in strategy led to initial top- and
bottom-line estimates proving aggressive.
While Wall Street's short-term estimates proved to be overly optimistic, we believe the medium- and longer-
term organic growth story remains intact as the $2.6B in global live entertainment sponsorship budgets
undergo a secular shift towards EDM festivals (given these events represent a unique channel to reach
Millennials).
We believe announcements about new sponsorship partners in addition to SFXE's current agreements with
AB InBev, MasterCard, and T-Mobile will be near-term catalysts. New major sponsorship deals could likely
come from a spirits, soda, or automotive brand sponsor, as these categories round out the top six live music
sponsor categories. New agreements would complement the current $50M-$60M in run rate sponsorship
revenue. These high-margin sponsorship agreements are particularly attractive given they help smooth out
the seasonality in SFXE's core festival business, which generates more than 70% of revenue in the second
half of the calendar year.
We understand that some investors may take issue with SFXE's non-traditional CEO; however, we note that
Mr. Sillerman has a long track record of being a shrewd dealmaker—particularly when he sold the original
SFX Entertainment (and precursor to Live Nation) to Clear Channel for $4.4B in 2000. The sale of the
original SFX could provide a roadmap for an ultimate sale of SFXE in its current form.
3Maxim Group LLC
SFX Entertainment Inc. (SFXE)
Sponsorship
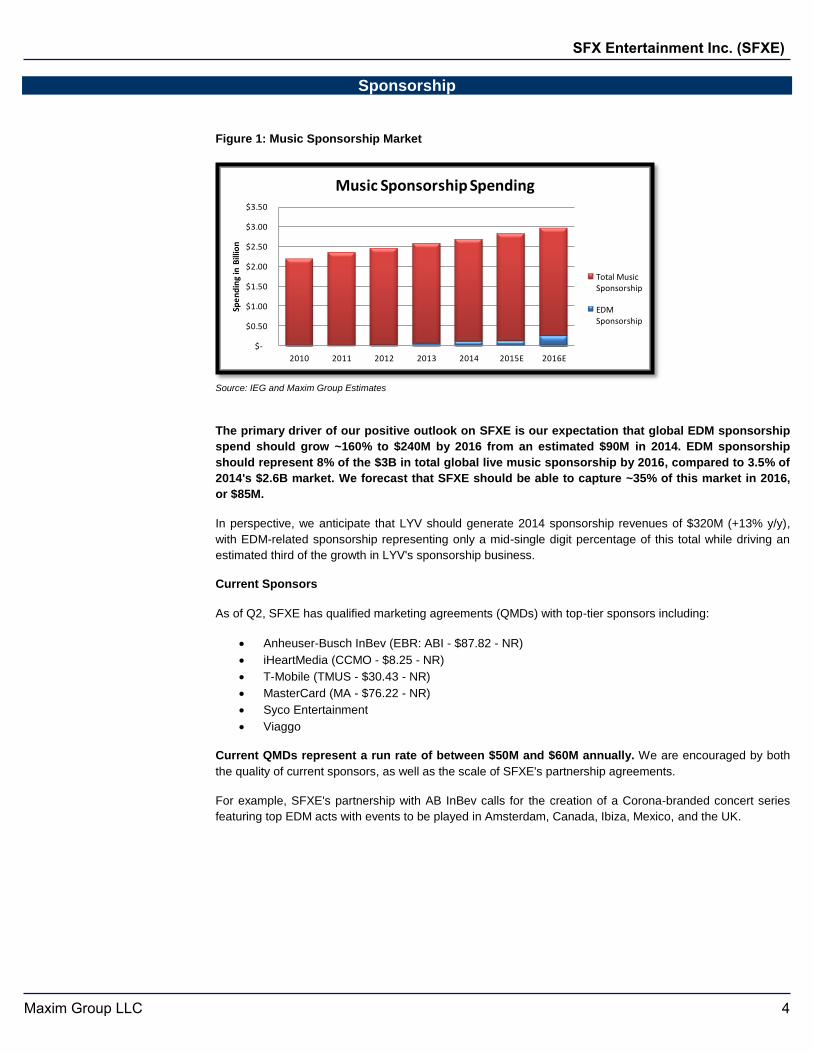
Figure 1: Music Sponsorship Market
Source: IEG and Maxim Group Estimates
The primary driver of our positive outlook on SFXE is our expectation that global EDM sponsorship
spend should grow ~160% to $240M by 2016 from an estimated $90M in 2014. EDM sponsorship
should represent 8% of the $3B in total global live music sponsorship by 2016, compared to 3.5% of
2014's $2.6B market. We forecast that SFXE should be able to capture ~35% of this market in 2016,
or $85M.
In perspective, we anticipate that LYV should generate 2014 sponsorship revenues of $320M (+13% y/y),
with EDM-related sponsorship representing only a mid-single digit percentage of this total while driving an
estimated third of the growth in LYV's sponsorship business.
Current Sponsors
As of Q2, SFXE has qualified marketing agreements (QMDs) with top-tier sponsors including:
Anheuser-Busch InBev (EBR: ABI - $87.82 - NR)
iHeartMedia (CCMO - $8.25 - NR)
T-Mobile (TMUS - $30.43 - NR)
MasterCard (MA - $76.22 - NR)
Syco Entertainment
Viaggo
Current QMDs represent a run rate of between $50M and $60M annually. We are encouraged by both
the quality of current sponsors, as well as the scale of SFXE's partnership agreements.
For example, SFXE's partnership with AB InBev calls for the creation of a Corona-branded concert series
featuring top EDM acts with events to be played in Amsterdam, Canada, Ibiza, Mexico, and the UK.
$-
$0.50
$1.00
$1.50
$2.00
$2.50
$3.00
$3.50
2010 2011 2012 2013 2014 2015E 2016E
Spe
nd
ing
in B
illio
n
Music Sponsorship Spending
Total Music Sponsorship
EDM Sponsorship
4Maxim Group LLC
SFX Entertainment Inc. (SFXE)
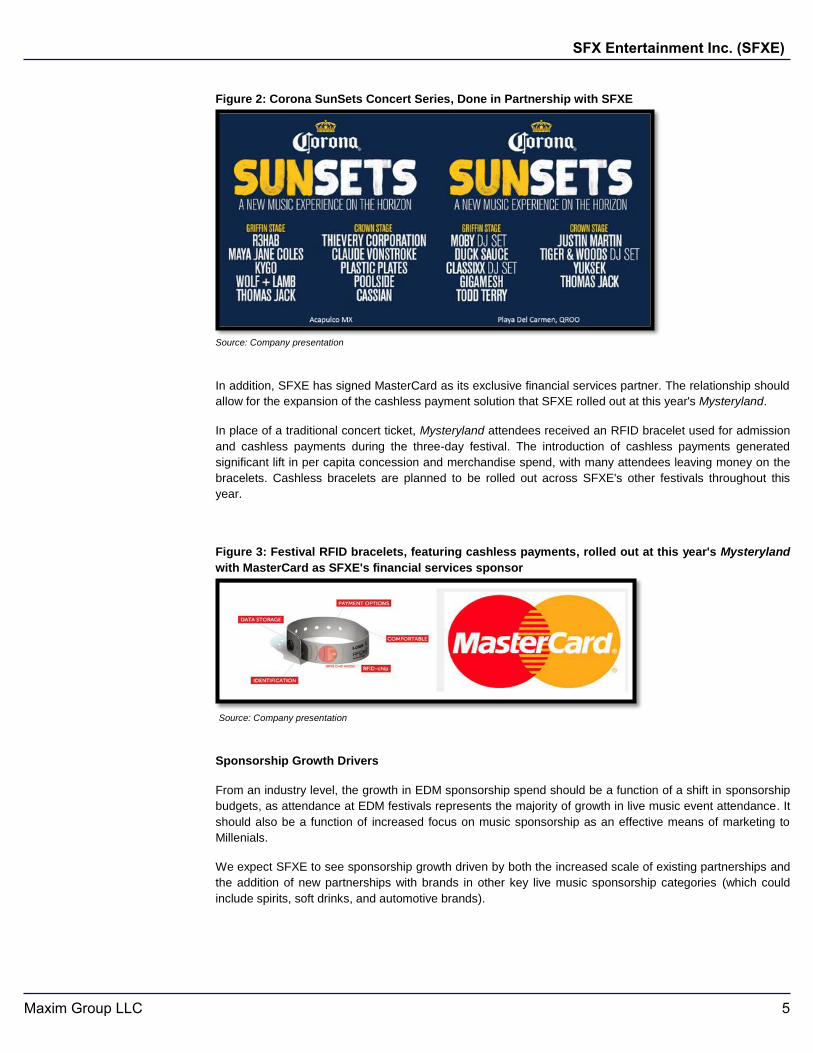
Figure 2: Corona SunSets Concert Series, Done in Partnership with SFXE
Source: Company presentation
In addition, SFXE has signed MasterCard as its exclusive financial services partner. The relationship should
allow for the expansion of the cashless payment solution that SFXE rolled out at this year's Mysteryland.
In place of a traditional concert ticket, Mysteryland attendees received an RFID bracelet used for admission
and cashless payments during the three-day festival. The introduction of cashless payments generated
significant lift in per capita concession and merchandise spend, with many attendees leaving money on the
bracelets. Cashless bracelets are planned to be rolled out across SFXE's other festivals throughout this
year.
Figure 3: Festival RFID bracelets, featuring cashless payments, rolled out at this year's Mysteryland
with MasterCard as SFXE's financial services sponsor
Source: Company presentation
Sponsorship Growth Drivers
From an industry level, the growth in EDM sponsorship spend should be a function of a shift in sponsorship
budgets, as attendance at EDM festivals represents the majority of growth in live music event attendance. It
should also be a function of increased focus on music sponsorship as an effective means of marketing to
Millenials.
We expect SFXE to see sponsorship growth driven by both the increased scale of existing partnerships and
the addition of new partnerships with brands in other key live music sponsorship categories (which could
include spirits, soft drinks, and automotive brands).
5Maxim Group LLC
SFX Entertainment Inc. (SFXE)
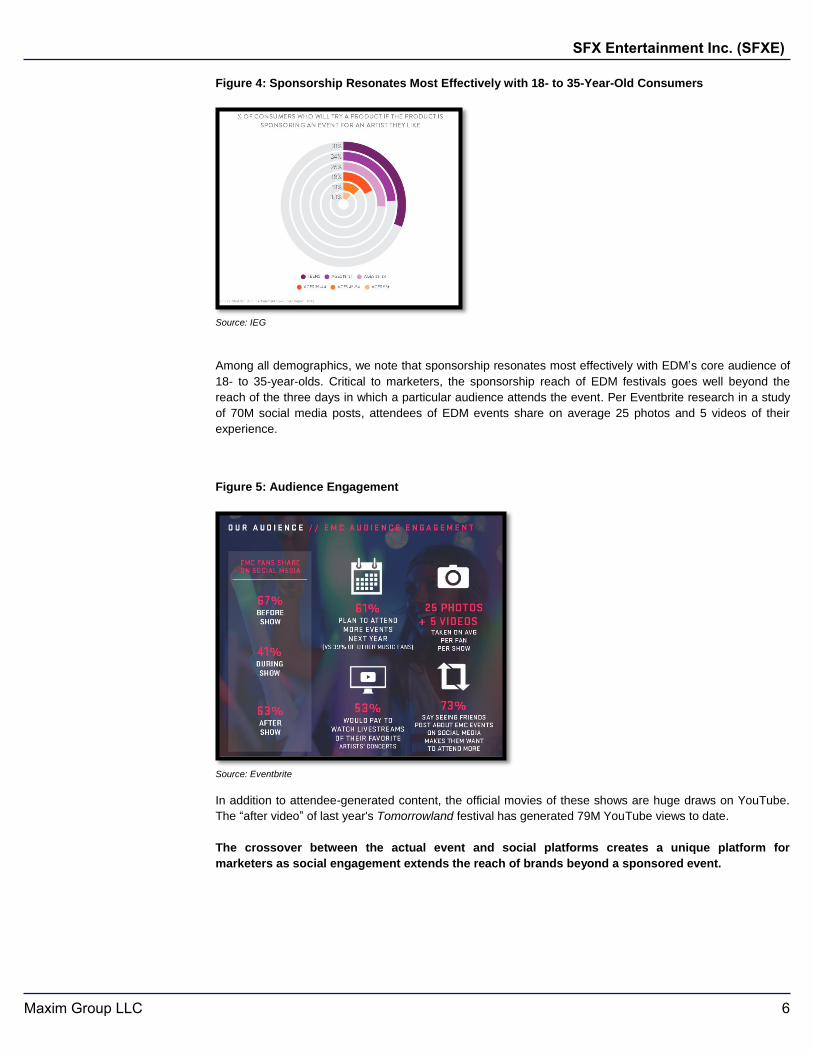
Figure 4: Sponsorship Resonates Most Effectively with 18- to 35-Year-Old Consumers
Source: IEG
Among all demographics, we note that sponsorship resonates most effectively with EDM’s core audience of
18- to 35-year-olds. Critical to marketers, the sponsorship reach of EDM festivals goes well beyond the
reach of the three days in which a particular audience attends the event. Per Eventbrite research in a study
of 70M social media posts, attendees of EDM events share on average 25 photos and 5 videos of their
experience.
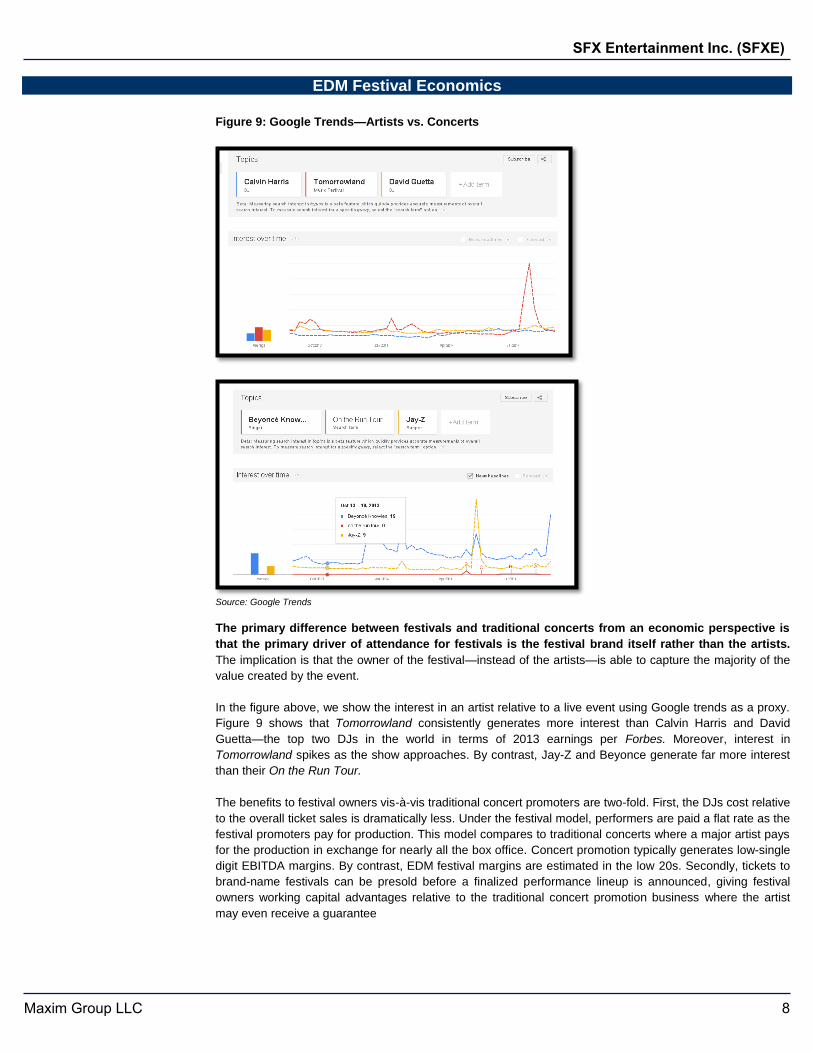
Figure 5: Audience Engagement
Source: Eventbrite
In addition to attendee-generated content, the official movies of these shows are huge draws on YouTube.
The “after video” of last year's Tomorrowland festival has generated 79M YouTube views to date.
The crossover between the actual event and social platforms creates a unique platform for
marketers as social engagement extends the reach of brands beyond a sponsored event.
6Maxim Group LLC
SFX Entertainment Inc. (SFXE)
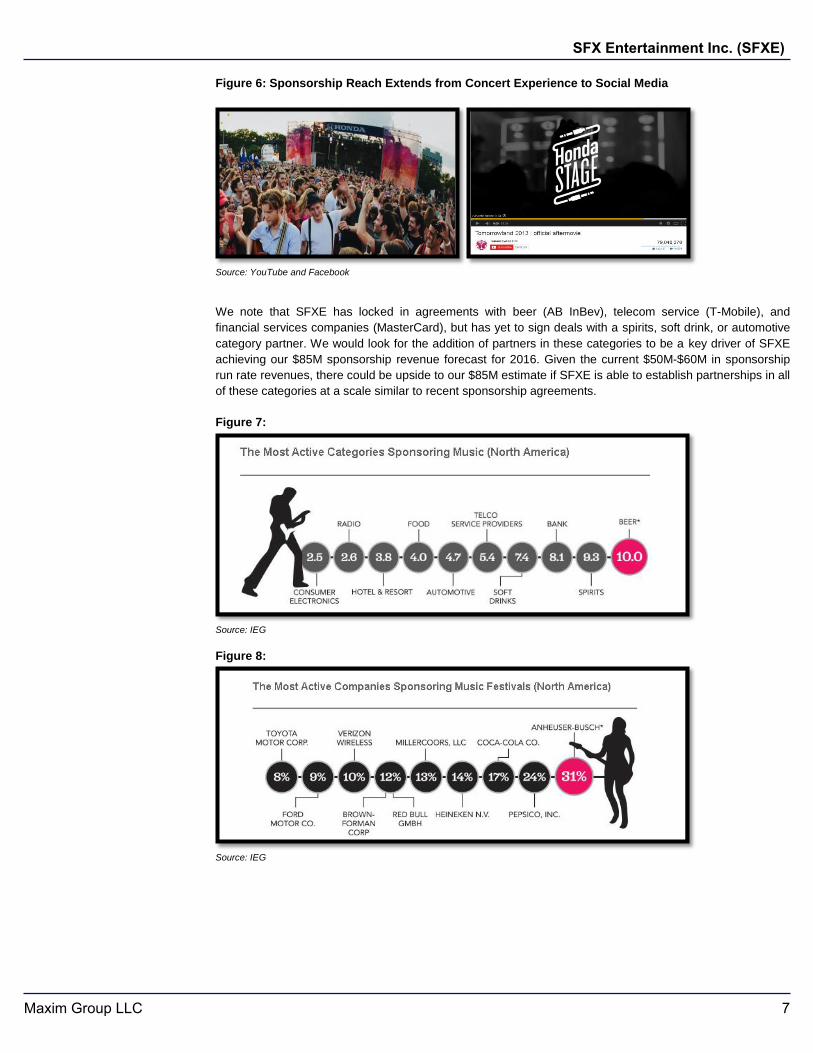
Figure 6: Sponsorship Reach Extends from Concert Experience to Social Media
Source: YouTube and Facebook
We note that SFXE has locked in agreements with beer (AB InBev), telecom service (T-Mobile), and
financial services companies (MasterCard), but has yet to sign deals with a spirits, soft drink, or automotive
category partner. We would look for the addition of partners in these categories to be a key driver of SFXE
achieving our $85M sponsorship revenue forecast for 2016. Given the current $50M-$60M in sponsorship
run rate revenues, there could be upside to our $85M estimate if SFXE is able to establish partnerships in all
of these categories at a scale similar to recent sponsorship agreements.
Figure 7:
Source: IEG
Figure 8:
Source: IEG
7Maxim Group LLC
SFX Entertainment Inc. (SFXE)
EDM Festival Economics
Figure 9: Google Trends—Artists vs. Concerts
Source: Google Trends
The primary difference between festivals and traditional concerts from an economic perspective is
that the primary driver of attendance for festivals is the festival brand itself rather than the artists.
The implication is that the owner of the festival—instead of the artists—is able to capture the majority of the
value created by the event.
In the figure above, we show the interest in an artist relative to a live event using Google trends as a proxy.
Figure 9 shows that Tomorrowland consistently generates more interest than Calvin Harris and David
Guetta—the top two DJs in the world in terms of 2013 earnings per Forbes. Moreover, interest in
Tomorrowland spikes as the show approaches. By contrast, Jay-Z and Beyonce generate far more interest
than their On the Run Tour.
The benefits to festival owners vis-à-vis traditional concert promoters are two-fold. First, the DJs cost relative
to the overall ticket sales is dramatically less. Under the festival model, performers are paid a flat rate as the
festival promoters pay for production. This model compares to traditional concerts where a major artist pays
for the production in exchange for nearly all the box office. Concert promotion typically generates low-single
digit EBITDA margins. By contrast, EDM festival margins are estimated in the low 20s. Secondly, tickets to
brand-name festivals can be presold before a finalized performance lineup is announced, giving festival
owners working capital advantages relative to the traditional concert promotion business where the artist
may even receive a guarantee
8Maxim Group LLC
SFX Entertainment Inc. (SFXE)
The key drawback of festivals is that festival brands, like any other brand, require investment to build. As a
result, festivals have a difficult time breaking even in the first year, even if they are tied to an established
festival brand. For example, Patrick Moxey's Ultra has expanded its brand from its original location in Miami
to include separate festivals in Buenos Aires, Korea, Europe, Japan, Chile, South Africa, and Brazil.
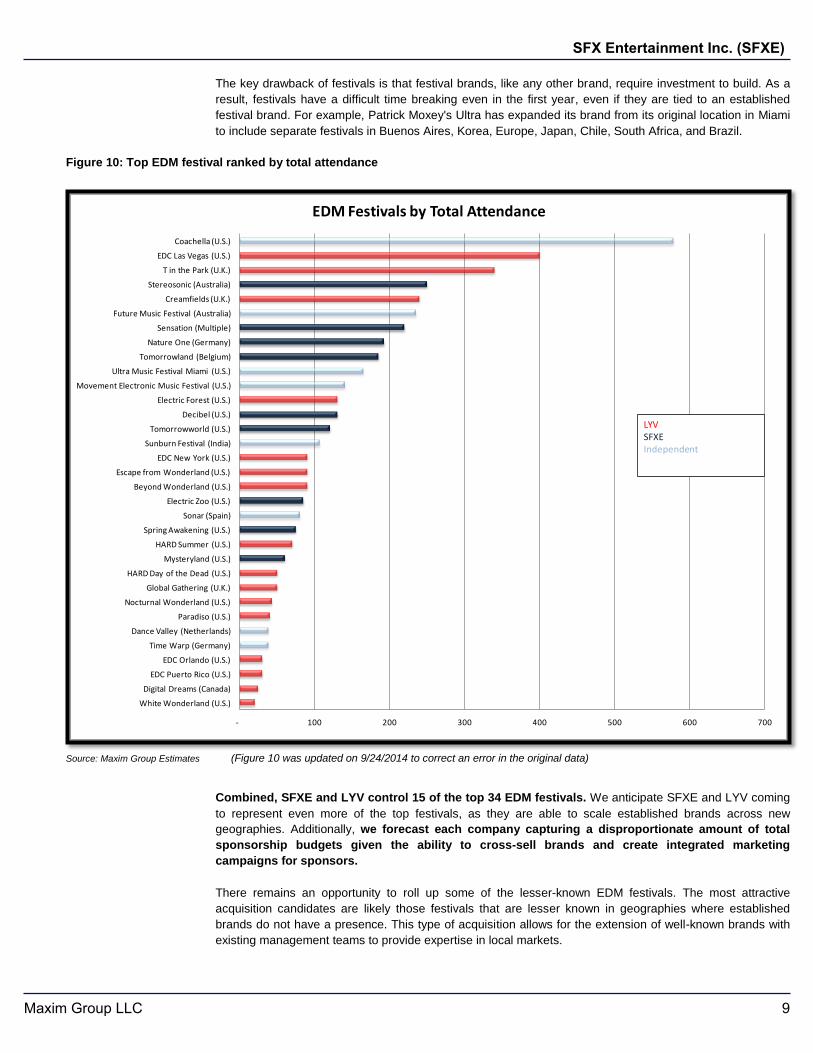
Figure 10: Top EDM festival ranked by total attendance
Source: Maxim Group Estimates (Figure 10 was updated on 9/24/2014 to correct an error in the original data)
Combined, SFXE and LYV control 15 of the top 34 EDM festivals. We anticipate SFXE and LYV coming
to represent even more of the top festivals, as they are able to scale established brands across new
geographies. Additionally, we forecast each company capturing a disproportionate amount of total
sponsorship budgets given the ability to cross-sell brands and create integrated marketing
campaigns for sponsors.
There remains an opportunity to roll up some of the lesser-known EDM festivals. The most attractive
acquisition candidates are likely those festivals that are lesser known in geographies where established
brands do not have a presence. This type of acquisition allows for the extension of well-known brands with
existing management teams to provide expertise in local markets.
- 100 200 300 400 500 600 700
White Wonderland (U.S.)
Digital Dreams (Canada)
EDC Puerto Rico (U.S.)
EDC Orlando (U.S.)
Time Warp (Germany)
Dance Valley (Netherlands)
Paradiso (U.S.)
Nocturnal Wonderland (U.S.)
Global Gathering (U.K.)
HARD Day of the Dead (U.S.)
Mysteryland (U.S.)
HARD Summer (U.S.)
Spring Awakening (U.S.)
Sonar (Spain)
Electric Zoo (U.S.)
Beyond Wonderland (U.S.)
Escape from Wonderland (U.S.)
EDC New York (U.S.)
Sunburn Festival (India)
Tomorrowworld (U.S.)
Decibel (U.S.)
Electric Forest (U.S.)
Movement Electronic Music Festival (U.S.)
Ultra Music Festival Miami (U.S.)
Tomorrowland (Belgium)
Nature One (Germany)
Sensation (Multiple)
Future Music Festival (Australia)
Creamfields (U.K.)
Stereosonic (Australia)
T in the Park (U.K.)
EDC Las Vegas (U.S.)
Coachella (U.S.)
EDM Festivals by Total Attendance
LYV SFXEIndependent
9Maxim Group LLC
SFX Entertainment Inc. (SFXE)
We see it as less likely that a brand like Coachella or Ultra could be acquired on favorable economic terms
as these owners have already established their brands, making an accretive acquisition difficult in the
current environment.
Among the largest festivals not controlled by SFXE or LYV, we estimate that Coachella, owned by AEG,
generated $75M in revenue across two weekends in 2014, with total attendance of 580k.
Ultra is owned by EDM mogul Patrick Moxey. Ultra's Miami music festival hosted 330k attendance days in
one weekend in 2014, after hosting two weekends in the previous two years. The Ultra brand is extending
internationally with Ultra-branded festivals rolling out in Argentina, Croatia, Japan, Ibiza, and Chile in 2014,
as well as additional dates in South Africa and South Korea planned for 2015.
Attendance Growth Dynamics
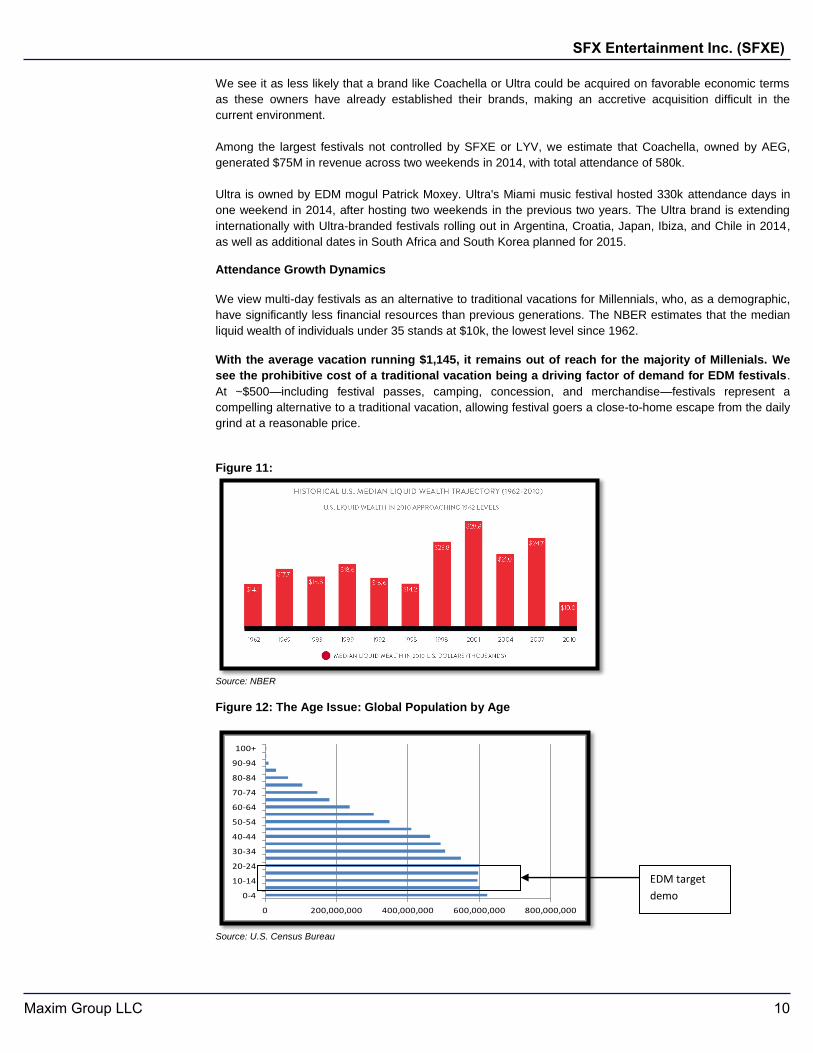
We view multi-day festivals as an alternative to traditional vacations for Millennials, who, as a demographic,
have significantly less financial resources than previous generations. The NBER estimates that the median
liquid wealth of individuals under 35 stands at $10k, the lowest level since 1962.
With the average vacation running $1,145, it remains out of reach for the majority of Millenials. We
see the prohibitive cost of a traditional vacation being a driving factor of demand for EDM festivals.
At ~$500—including festival passes, camping, concession, and merchandise—festivals represent a
compelling alternative to a traditional vacation, allowing festival goers a close-to-home escape from the daily
grind at a reasonable price.
Figure 11:
Source: NBER
Figure 12: The Age Issue: Global Population by Age
Source: U.S. Census Bureau
0 200,000,000 400,000,000 600,000,000 800,000,000
0-4
10-14
20-24
30-34
40-44
50-54
60-64
70-74
80-84
90-94
100+
EDM target
demo
10Maxim Group LLC
SFX Entertainment Inc. (SFXE)
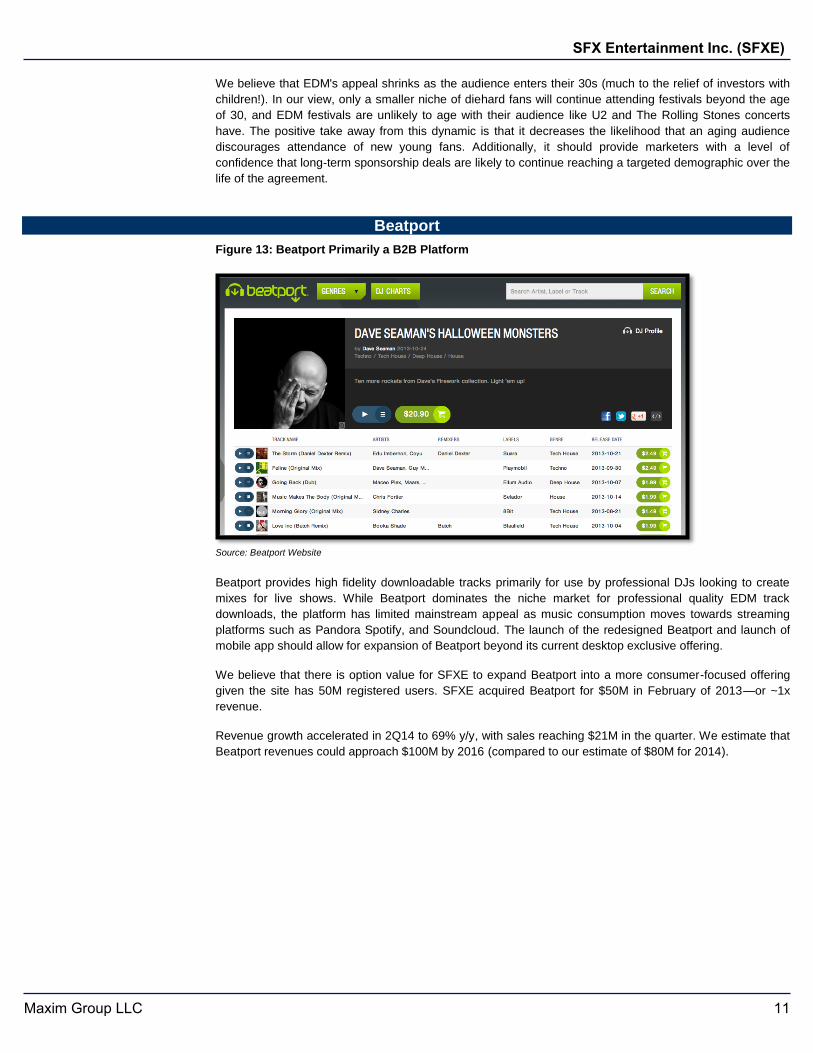
We believe that EDM's appeal shrinks as the audience enters their 30s (much to the relief of investors with
children!). In our view, only a smaller niche of diehard fans will continue attending festivals beyond the age
of 30, and EDM festivals are unlikely to age with their audience like U2 and The Rolling Stones concerts
have. The positive take away from this dynamic is that it decreases the likelihood that an aging audience
discourages attendance of new young fans. Additionally, it should provide marketers with a level of
confidence that long-term sponsorship deals are likely to continue reaching a targeted demographic over the
life of the agreement.
Beatport
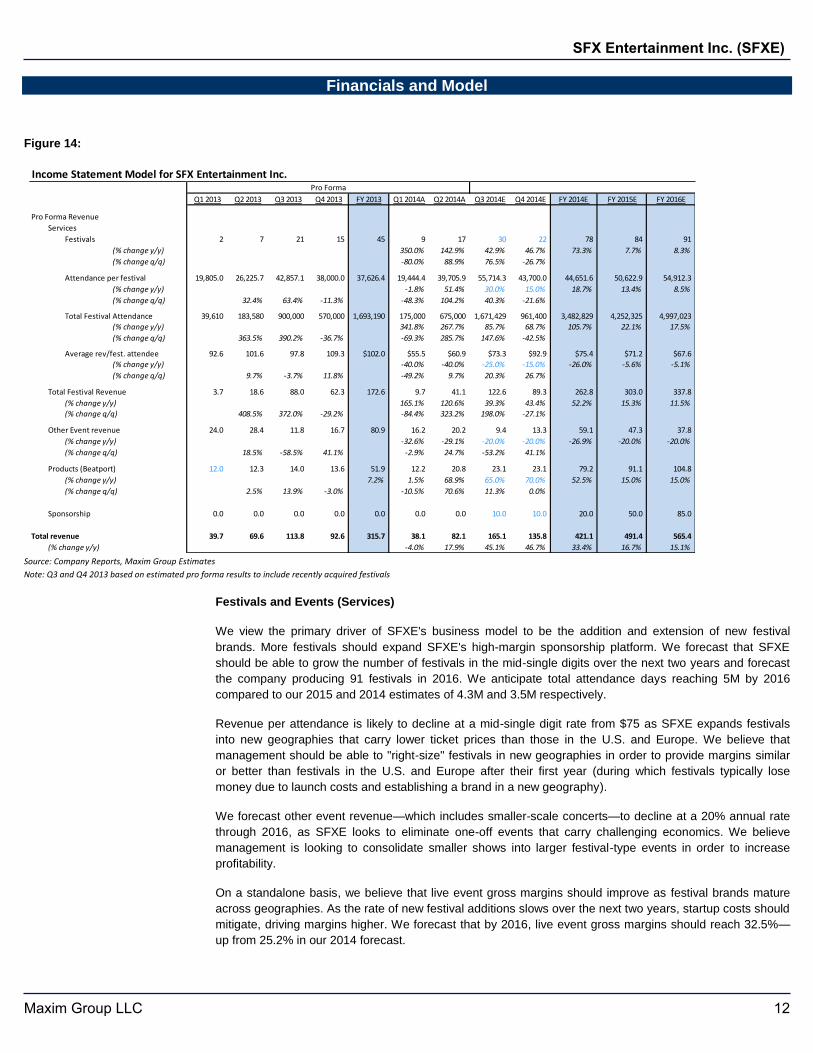
Figure 13: Beatport Primarily a B2B Platform
Source: Beatport Website
Beatport provides high fidelity downloadable tracks primarily for use by professional DJs looking to create
mixes for live shows. While Beatport dominates the niche market for professional quality EDM track
downloads, the platform has limited mainstream appeal as music consumption moves towards streaming
platforms such as Pandora Spotify, and Soundcloud. The launch of the redesigned Beatport and launch of
mobile app should allow for expansion of Beatport beyond its current desktop exclusive offering.
We believe that there is option value for SFXE to expand Beatport into a more consumer-focused offering
given the site has 50M registered users. SFXE acquired Beatport for $50M in February of 2013—or ~1x
revenue.
Revenue growth accelerated in 2Q14 to 69% y/y, with sales reaching $21M in the quarter. We estimate that
Beatport revenues could approach $100M by 2016 (compared to our estimate of $80M for 2014).
11Maxim Group LLC
SFX Entertainment Inc. (SFXE)
Financials and Model
Figure 14:
Source: Company Reports, Maxim Group Estimates
Note: Q3 and Q4 2013 based on estimated pro forma results to include recently acquired festivals
Festivals and Events (Services)
We view the primary driver of SFXE's business model to be the addition and extension of new festival
brands. More festivals should expand SFXE's high-margin sponsorship platform. We forecast that SFXE
should be able to grow the number of festivals in the mid-single digits over the next two years and forecast
the company producing 91 festivals in 2016. We anticipate total attendance days reaching 5M by 2016
compared to our 2015 and 2014 estimates of 4.3M and 3.5M respectively.
Revenue per attendance is likely to decline at a mid-single digit rate from $75 as SFXE expands festivals
into new geographies that carry lower ticket prices than those in the U.S. and Europe. We believe that
management should be able to "right-size" festivals in new geographies in order to provide margins similar
or better than festivals in the U.S. and Europe after their first year (during which festivals typically lose
money due to launch costs and establishing a brand in a new geography).
We forecast other event revenue—which includes smaller-scale concerts—to decline at a 20% annual rate
through 2016, as SFXE looks to eliminate one-off events that carry challenging economics. We believe
management is looking to consolidate smaller shows into larger festival-type events in order to increase
profitability.
On a standalone basis, we believe that live event gross margins should improve as festival brands mature
across geographies. As the rate of new festival additions slows over the next two years, startup costs should
mitigate, driving margins higher. We forecast that by 2016, live event gross margins should reach 32.5%—
up from 25.2% in our 2014 forecast.
Income Statement Model for SFX Entertainment Inc.
Q1 2013 Q2 2013 Q3 2013 Q4 2013 FY 2013 Q1 2014A Q2 2014A Q3 2014E Q4 2014E FY 2014E FY 2015E FY 2016E
Pro Forma Revenue
Services
Festivals 2 7 21 15 45 9 17 30 22 78 84 91
(% change y/y) 350.0% 142.9% 42.9% 46.7% 73.3% 7.7% 8.3%
(% change q/q) -80.0% 88.9% 76.5% -26.7%
Attendance per festival 19,805.0 26,225.7 42,857.1 38,000.0 37,626.4 19,444.4 39,705.9 55,714.3 43,700.0 44,651.6 50,622.9 54,912.3
(% change y/y) -1.8% 51.4% 30.0% 15.0% 18.7% 13.4% 8.5%
(% change q/q) 32.4% 63.4% -11.3% -48.3% 104.2% 40.3% -21.6%
Total Festival Attendance 39,610 183,580 900,000 570,000 1,693,190 175,000 675,000 1,671,429 961,400 3,482,829 4,252,325 4,997,023
(% change y/y) 341.8% 267.7% 85.7% 68.7% 105.7% 22.1% 17.5%
(% change q/q) 363.5% 390.2% -36.7% -69.3% 285.7% 147.6% -42.5%
Average rev/fest. attendee 92.6 101.6 97.8 109.3 $102.0 $55.5 $60.9 $73.3 $92.9 $75.4 $71.2 $67.6
(% change y/y) -40.0% -40.0% -25.0% -15.0% -26.0% -5.6% -5.1%
(% change q/q) 9.7% -3.7% 11.8% -49.2% 9.7% 20.3% 26.7%
Total Festival Revenue 3.7 18.6 88.0 62.3 172.6 9.7 41.1 122.6 89.3 262.8 303.0 337.8
(% change y/y) 165.1% 120.6% 39.3% 43.4% 52.2% 15.3% 11.5%
(% change q/q) 408.5% 372.0% -29.2% -84.4% 323.2% 198.0% -27.1%
Other Event revenue 24.0 28.4 11.8 16.7 80.9 16.2 20.2 9.4 13.3 59.1 47.3 37.8
(% change y/y) -32.6% -29.1% -20.0% -20.0% -26.9% -20.0% -20.0%
(% change q/q) 18.5% -58.5% 41.1% -2.9% 24.7% -53.2% 41.1%
Products (Beatport) 12.0 12.3 14.0 13.6 51.9 12.2 20.8 23.1 23.1 79.2 91.1 104.8
(% change y/y) 7.2% 1.5% 68.9% 65.0% 70.0% 52.5% 15.0% 15.0%
(% change q/q) 2.5% 13.9% -3.0% -10.5% 70.6% 11.3% 0.0%
Sponsorship 0.0 0.0 0.0 0.0 0.0 0.0 0.0 10.0 10.0 20.0 50.0 85.0
Total revenue 39.7 69.6 113.8 92.6 315.7 38.1 82.1 165.1 135.8 421.1 491.4 565.4
(% change y/y) -4.0% 17.9% 45.1% 46.7% 33.4% 16.7% 15.1%
Pro Forma
12Maxim Group LLC
SFX Entertainment Inc. (SFXE)
Beatport (Products)
Beatport remains the wildcard in our model. The B2B digital music sales platform dominates the market
for high quality digital music tracks necessary for DJs to create mixes. While the platform has nice optionality
in our view, it remains unclear if Beatport will gain traction with a wider consumer audience. We forecast
Beatport revenue reaching $100M by 2016 on organic sales growth and increased advertising.
We estimate that Beatport margins should remain relatively stable near 35% through 2016 as Beatport
receives a rev share on sales made on the platform. If SFXE is able to establish Beatport as a more B2C
offering, these margins could expand.
Sponsorship
We are forecasting sponsorship revenue to ramp to $85M by 2016 from a standing start. SFXE
management has noted that its current sponsorship partnerships have reached a run rate of $50M-$60M.
We believe that the announcement of new partners—particularly in key live sponsorship categories,
including spirits, soft drinks, and automobiles—could provide a near-term catalyst to SFXE shares.
Sponsorship provides attractive economics as it both smoothes out the seasonality in SFXE's business and
generates margins that exceed 70%.
Consolidated Results
We are forecasting EBITDA to reach $105M by 2016, a 25% increase over 2015, which in turn is growing
104% compared to our 2014 estimate of $42M—a 59% CAGR. Timing within quarters is difficult to judge, as
EBITDA growth is dependent on the announcement of new sponsorship partners. Additionally, should SFXE
look to further expand its festival lineup beyond our estimates, the associated start-up costs could prove our
2016 EBITDA estimates aggressive, with benefits realized in out years beyond our forecast period.
We are higher than consensus of $36M in 2014 but significantly lower than consensus of $118M in 2015
and $177M in 2016. We have taken a more conservative view than the Street as we believe it takes longer
and is more complicated to build a global business than implied by consensus forecasts.
In a steady state, we estimate that SFXE's business generates EBITDA margins of ~20%, with upside
possible to management's target of 25% if sponsorship comes to represent a greater proportion of sales mix.
Worth noting: SFXE is attempting to pursue relatively aggressive accounting with respect to its qualified
marketing agreements (QMDs), as these deals are structured with performance escalators. SFXE is
attempting to claim benefits of these performance escalators as they are achieved rather than at the time
paid.
Balance Sheet
SFXE currently has net debt of $162M after issuing $220M in notes in February. Leverage stands at ~3.0x
net debt to adjusted EBITDA.
Looking at acquired assets, SFXE has a combined $520M in intangible assets and goodwill. We believe this
is reflective of the price paid for its series of acquisitions over the past two years. In comparison, SFXE's
current market cap is $560M. A potential alternative to valuing SFXE is taking the $520M book value of
acquired assets and layering in the value of potential future sponsorship opportunities.
This valuation methodology is unconventional, however, it provides a rough guide to the market value of the
scaled marketing platform that SFXE has created. Ascribing a highly conservative ~6x multiple to our
estimated 2016 sponsorship EBITDA estimate of $60M (on top of the $520M spent on acquisitions) leads to
a valuation equivalent to our target 2016 enterprise value of $845M - $9/share. Ascribing a 12x multiple
would increase our valuation by an additional ~$4/share. The current valuation may explain why Chairman
and CEO Bob Sillerman has committed to repurchase stock.
13Maxim Group LLC
SFX Entertainment Inc. (SFXE)
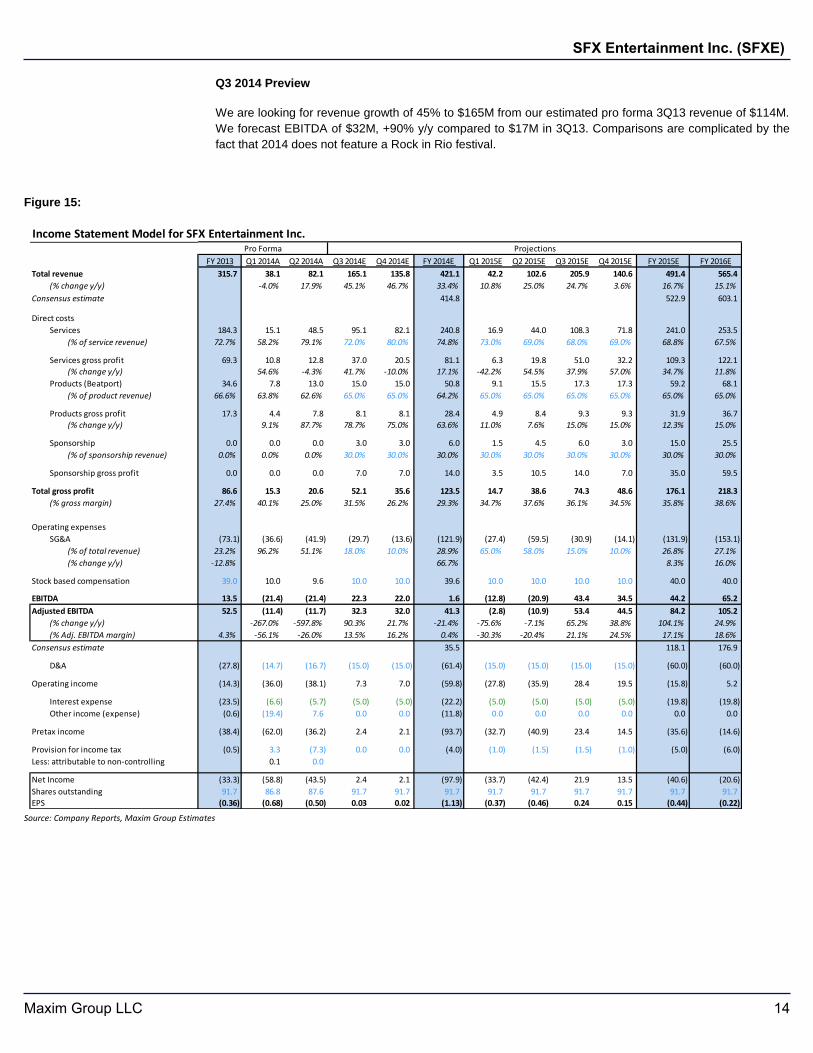
Q3 2014 Preview
We are looking for revenue growth of 45% to $165M from our estimated pro forma 3Q13 revenue of $114M.
We forecast EBITDA of $32M, +90% y/y compared to $17M in 3Q13. Comparisons are complicated by the
fact that 2014 does not feature a Rock in Rio festival.
Figure 15:
Source: Company Reports, Maxim Group Estimates
Income Statement Model for SFX Entertainment Inc.
FY 2013 Q1 2014A Q2 2014A Q3 2014E Q4 2014E FY 2014E Q1 2015E Q2 2015E Q3 2015E Q4 2015E FY 2015E FY 2016E
Total revenue 315.7 38.1 82.1 165.1 135.8 421.1 42.2 102.6 205.9 140.6 491.4 565.4
(% change y/y) -4.0% 17.9% 45.1% 46.7% 33.4% 10.8% 25.0% 24.7% 3.6% 16.7% 15.1%
Consensus estimate 414.8 522.9 603.1
Direct costs
Services 184.3 15.1 48.5 95.1 82.1 240.8 16.9 44.0 108.3 71.8 241.0 253.5
(% of service revenue) 72.7% 58.2% 79.1% 72.0% 80.0% 74.8% 73.0% 69.0% 68.0% 69.0% 68.8% 67.5%
Services gross profit 69.3 10.8 12.8 37.0 20.5 81.1 6.3 19.8 51.0 32.2 109.3 122.1
(% change y/y) 54.6% -4.3% 41.7% -10.0% 17.1% -42.2% 54.5% 37.9% 57.0% 34.7% 11.8%
Products (Beatport) 34.6 7.8 13.0 15.0 15.0 50.8 9.1 15.5 17.3 17.3 59.2 68.1
(% of product revenue) 66.6% 63.8% 62.6% 65.0% 65.0% 64.2% 65.0% 65.0% 65.0% 65.0% 65.0% 65.0%
Products gross profit 17.3 4.4 7.8 8.1 8.1 28.4 4.9 8.4 9.3 9.3 31.9 36.7
(% change y/y) 9.1% 87.7% 78.7% 75.0% 63.6% 11.0% 7.6% 15.0% 15.0% 12.3% 15.0%
Sponsorship 0.0 0.0 0.0 3.0 3.0 6.0 1.5 4.5 6.0 3.0 15.0 25.5
(% of sponsorship revenue) 0.0% 0.0% 0.0% 30.0% 30.0% 30.0% 30.0% 30.0% 30.0% 30.0% 30.0% 30.0%
Sponsorship gross profit 0.0 0.0 0.0 7.0 7.0 14.0 3.5 10.5 14.0 7.0 35.0 59.5
Total gross profit 86.6 15.3 20.6 52.1 35.6 123.5 14.7 38.6 74.3 48.6 176.1 218.3
(% gross margin) 27.4% 40.1% 25.0% 31.5% 26.2% 29.3% 34.7% 37.6% 36.1% 34.5% 35.8% 38.6%
Operating expenses
SG&A (73.1) (36.6) (41.9) (29.7) (13.6) (121.9) (27.4) (59.5) (30.9) (14.1) (131.9) (153.1)
(% of total revenue) 23.2% 96.2% 51.1% 18.0% 10.0% 28.9% 65.0% 58.0% 15.0% 10.0% 26.8% 27.1%
(% change y/y) -12.8% 66.7% 8.3% 16.0%
Stock based compensation 39.0 10.0 9.6 10.0 10.0 39.6 10.0 10.0 10.0 10.0 40.0 40.0
EBITDA 13.5 (21.4) (21.4) 22.3 22.0 1.6 (12.8) (20.9) 43.4 34.5 44.2 65.2
Adjusted EBITDA 52.5 (11.4) (11.7) 32.3 32.0 41.3 (2.8) (10.9) 53.4 44.5 84.2 105.2
(% change y/y) -267.0% -597.8% 90.3% 21.7% -21.4% -75.6% -7.1% 65.2% 38.8% 104.1% 24.9%
(% Adj. EBITDA margin) 4.3% -56.1% -26.0% 13.5% 16.2% 0.4% -30.3% -20.4% 21.1% 24.5% 17.1% 18.6%
Consensus estimate 35.5 118.1 176.9
D&A (27.8) (14.7) (16.7) (15.0) (15.0) (61.4) (15.0) (15.0) (15.0) (15.0) (60.0) (60.0)
Operating income (14.3) (36.0) (38.1) 7.3 7.0 (59.8) (27.8) (35.9) 28.4 19.5 (15.8) 5.2
Interest expense (23.5) (6.6) (5.7) (5.0) (5.0) (22.2) (5.0) (5.0) (5.0) (5.0) (19.8) (19.8)
Other income (expense) (0.6) (19.4) 7.6 0.0 0.0 (11.8) 0.0 0.0 0.0 0.0 0.0 0.0
Pretax income (38.4) (62.0) (36.2) 2.4 2.1 (93.7) (32.7) (40.9) 23.4 14.5 (35.6) (14.6)
Provision for income tax (0.5) 3.3 (7.3) 0.0 0.0 (4.0) (1.0) (1.5) (1.5) (1.0) (5.0) (6.0)
Less: attributable to non-controlling 0.1 0.0
Net Income (33.3) (58.8) (43.5) 2.4 2.1 (97.9) (33.7) (42.4) 21.9 13.5 (40.6) (20.6)
Shares outstanding 91.7 86.8 87.6 91.7 91.7 91.7 91.7 91.7 91.7 91.7 91.7 91.7
EPS (0.36) (0.68) (0.50) 0.03 0.02 (1.13) (0.37) (0.46) 0.24 0.15 (0.44) (0.22)
Pro Forma Projections
14Maxim Group LLC
SFX Entertainment Inc. (SFXE)
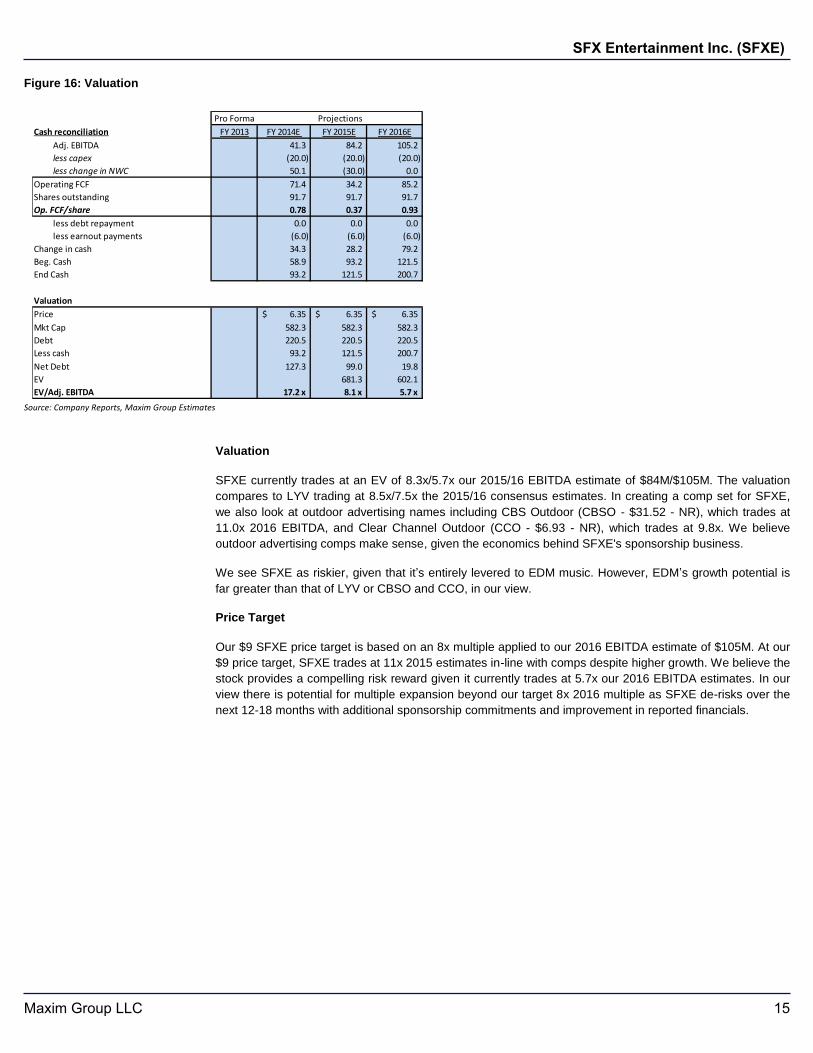
Figure 16: Valuation
Source: Company Reports, Maxim Group Estimates
Valuation
SFXE currently trades at an EV of 8.3x/5.7x our 2015/16 EBITDA estimate of $84M/$105M. The valuation
compares to LYV trading at 8.5x/7.5x the 2015/16 consensus estimates. In creating a comp set for SFXE,
we also look at outdoor advertising names including CBS Outdoor (CBSO - $31.52 - NR), which trades at
11.0x 2016 EBITDA, and Clear Channel Outdoor (CCO - $6.93 - NR), which trades at 9.8x. We believe
outdoor advertising comps make sense, given the economics behind SFXE's sponsorship business.
We see SFXE as riskier, given that it’s entirely levered to EDM music. However, EDM’s growth potential is
far greater than that of LYV or CBSO and CCO, in our view.
Price Target
Our $9 SFXE price target is based on an 8x multiple applied to our 2016 EBITDA estimate of $105M. At our
$9 price target, SFXE trades at 11x 2015 estimates in-line with comps despite higher growth. We believe the
stock provides a compelling risk reward given it currently trades at 5.7x our 2016 EBITDA estimates. In our
view there is potential for multiple expansion beyond our target 8x 2016 multiple as SFXE de-risks over the
next 12-18 months with additional sponsorship commitments and improvement in reported financials.
Cash reconciliation FY 2013 FY 2014E FY 2015E FY 2016E
Adj. EBITDA 52.5 41.3 84.2 105.2
less capex (10.0) (20.0) (20.0) (20.0)
less change in NWC 0.0 50.1 (30.0) 0.0
Operating FCF 42.5 71.4 34.2 85.2
Shares outstanding 91.7 91.7 91.7 91.7
Op. FCF/share 0.46 0.78 0.37 0.93
less debt repayment 0.0 0.0 0.0 0.0
less earnout payments 0.0 (6.0) (6.0) (6.0)
Change in cash 33.3 34.3 28.2 79.2
Beg. Cash 87.8 58.9 93.2 121.5
End Cash 121.1 93.2 121.5 200.7
Valuation
Price 6.35$ 6.35$ 6.35$
Mkt Cap 582.3 582.3 582.3 582.3
Debt 97.2 220.5 220.5 220.5
Less cash 121.1 93.2 121.5 200.7
Net Debt (23.9) 127.3 99.0 19.8
EV 681.3 602.1
EV/Adj. EBITDA NM 17.2 x 8.1 x 5.7 x
Pro Forma Projections
15Maxim Group LLC
SFX Entertainment Inc. (SFXE)
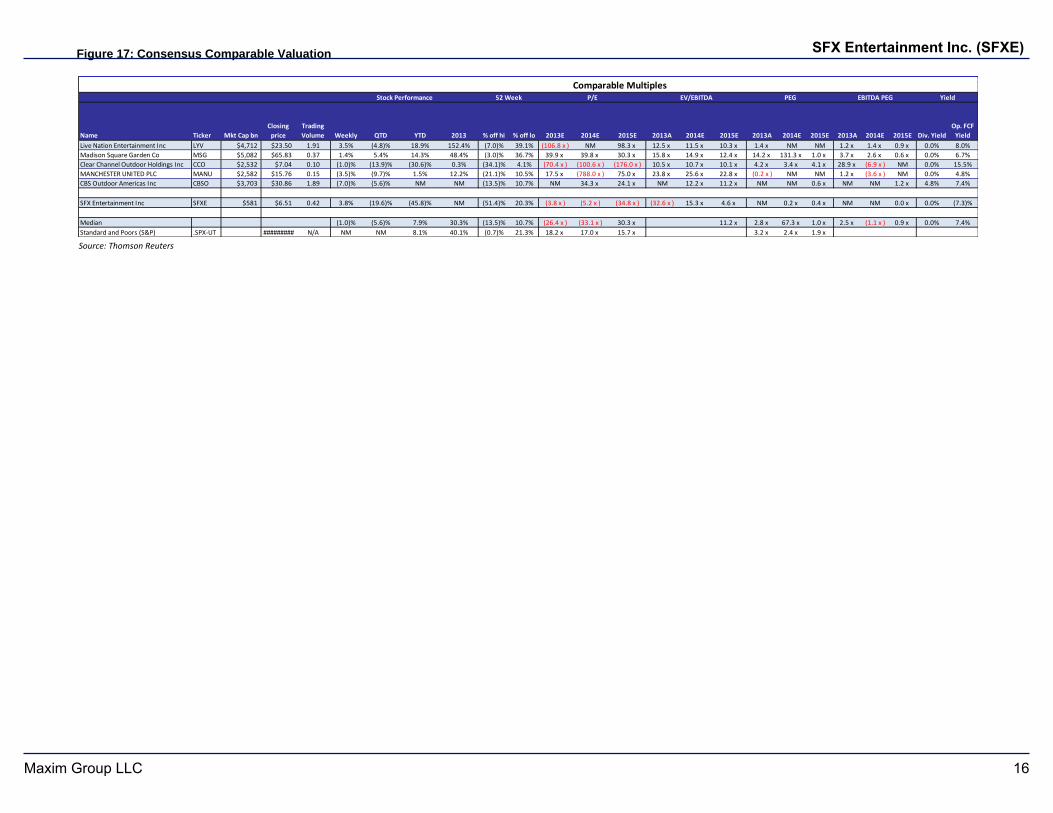
Figure 17: Consensus Comparable Valuation
Source: Thomson Reuters
Name Ticker Mkt Cap bn
Closing
price
Trading
Volume Weekly QTD YTD 2013 % off hi % off lo 2013E 2014E 2015E 2013A 2014E 2015E 2013A 2014E 2015E 2013A 2014E 2015E Div. Yield
Op. FCF
Yield
Live Nation Entertainment Inc LYV $4,712 $23.50 1.91 3.5% (4.8)% 18.9% 152.4% (7.0)% 39.1% (106.8 x ) NM 98.3 x 12.5 x 11.5 x 10.3 x 1.4 x NM NM 1.2 x 1.4 x 0.9 x 0.0% 8.0%
Madison Square Garden Co MSG $5,082 $65.83 0.37 1.4% 5.4% 14.3% 48.4% (3.0)% 36.7% 39.9 x 39.8 x 30.3 x 15.8 x 14.9 x 12.4 x 14.2 x 131.3 x 1.0 x 3.7 x 2.6 x 0.6 x 0.0% 6.7%
Clear Channel Outdoor Holdings Inc CCO $2,532 $7.04 0.10 (1.0)% (13.9)% (30.6)% 0.3% (34.1)% 4.1% (70.4 x ) (100.6 x ) (176.0 x ) 10.5 x 10.7 x 10.1 x 4.2 x 3.4 x 4.1 x 28.9 x (6.9 x ) NM 0.0% 15.5%
MANCHESTER UNITED PLC MANU $2,582 $15.76 0.15 (3.5)% (9.7)% 1.5% 12.2% (21.1)% 10.5% 17.5 x (788.0 x ) 75.0 x 23.8 x 25.6 x 22.8 x (0.2 x ) NM NM 1.2 x (3.6 x ) NM 0.0% 4.8%
CBS Outdoor Americas Inc CBSO $3,703 $30.86 1.89 (7.0)% (5.6)% NM NM (13.5)% 10.7% NM 34.3 x 24.1 x NM 12.2 x 11.2 x NM NM 0.6 x NM NM 1.2 x 4.8% 7.4%
SFX Entertainment Inc SFXE $581 $6.51 0.42 3.8% (19.6)% (45.8)% NM (51.4)% 20.3% (3.8 x ) (5.2 x ) (34.8 x ) (32.6 x ) 15.3 x 4.6 x NM 0.2 x 0.4 x NM NM 0.0 x 0.0% (7.3)%
Median (1.0)% (5.6)% 7.9% 30.3% (13.5)% 10.7% (26.4 x ) (33.1 x ) 30.3 x 11.2 x 2.8 x 67.3 x 1.0 x 2.5 x (1.1 x ) 0.9 x 0.0% 7.4%
Standard and Poors (S&P) .SPX-UT ######### N/A NM NM 8.1% 40.1% (0.7)% 21.3% 18.2 x 17.0 x 15.7 x 3.2 x 2.4 x 1.9 x
Comparable MultiplesStock Performance 52 Week P/E EV/EBITDA PEG EBITDA PEG Yield
16Maxim Group LLC
SFX Entertainment Inc. (SFXE)
Related Companies Mentioned in this ReportCompany Ticker Rating 12 Month Price Target Price
09/23/14CBS Corporation CBS Not Rated - $55.03
DISCLOSURES
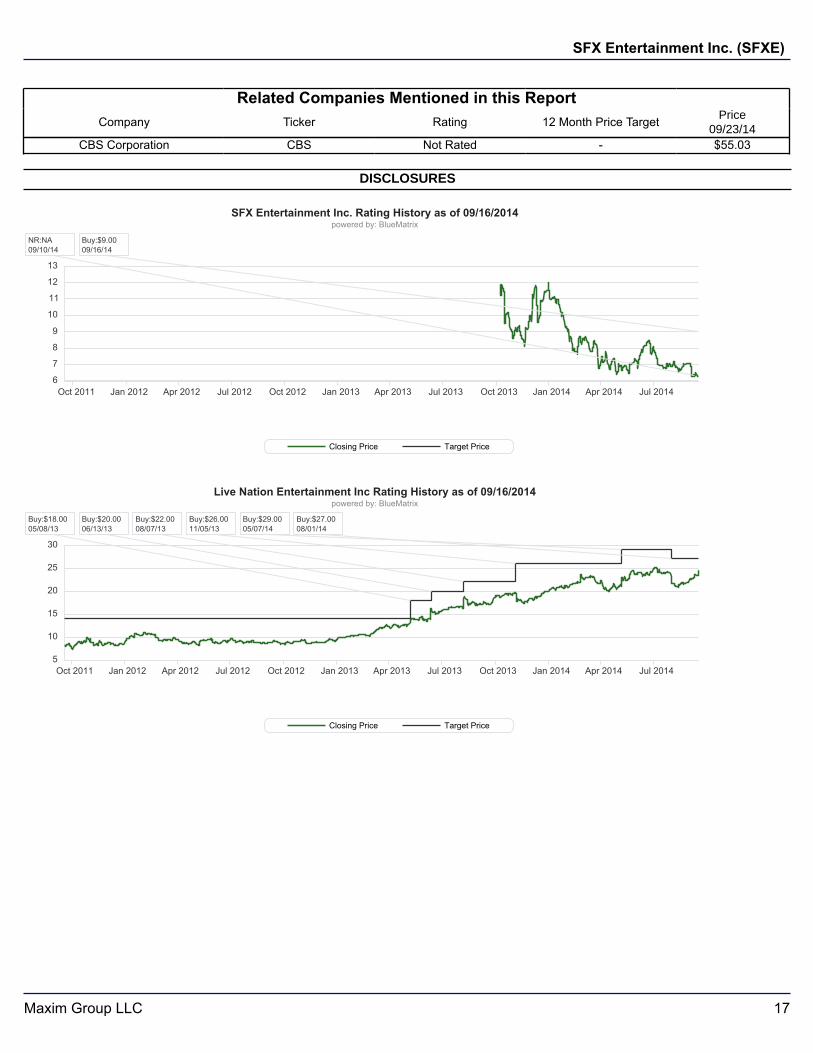
Oct 2011 Jan 2012 Apr 2012 Jul 2012 Oct 2012 Jan 2013 Apr 2013 Jul 2013 Oct 2013 Jan 2014 Apr 2014 Jul 2014
13
12
11
10
9
8
7
6
Closing Price Target Price
SFX Entertainment Inc. Rating History as of 09/16/2014
NR:NA09/10/14
Buy:$9.0009/16/14
powered by: BlueMatrix
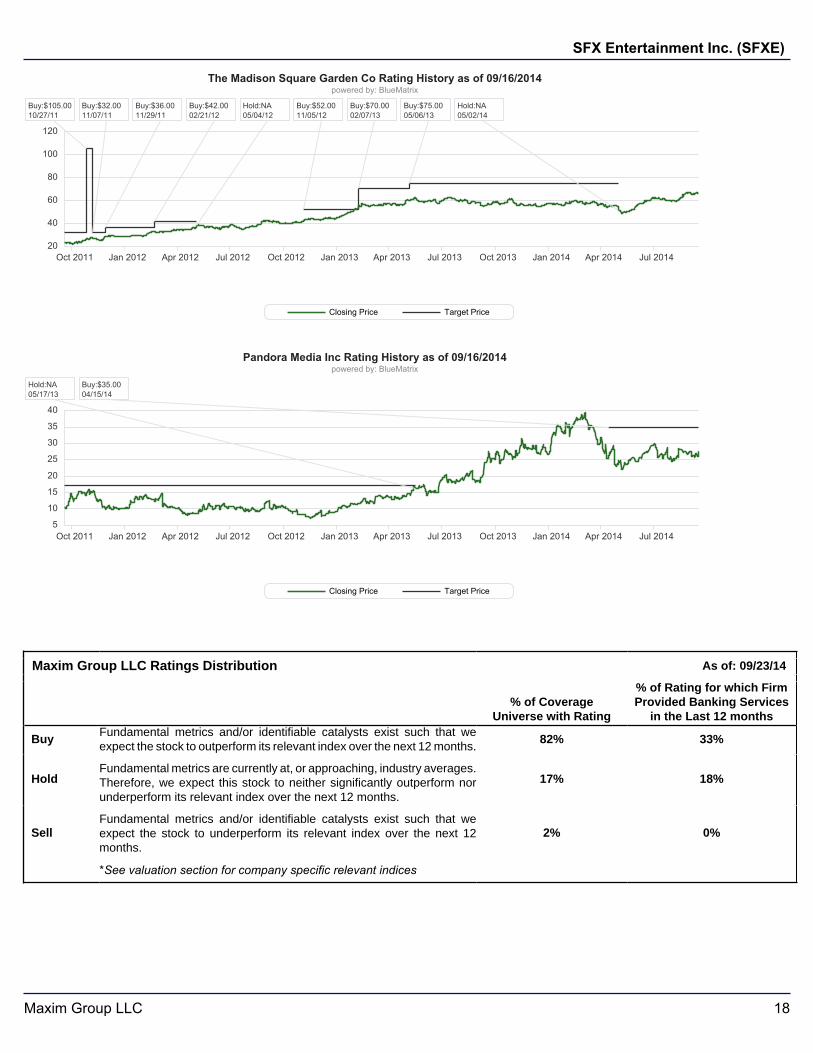
Oct 2011 Jan 2012 Apr 2012 Jul 2012 Oct 2012 Jan 2013 Apr 2013 Jul 2013 Oct 2013 Jan 2014 Apr 2014 Jul 2014
30
25
20
15
10
5
Closing Price Target Price
Live Nation Entertainment Inc Rating History as of 09/16/2014
Buy:$18.0005/08/13
Buy:$20.0006/13/13
Buy:$22.0008/07/13
Buy:$26.0011/05/13
Buy:$29.0005/07/14
Buy:$27.0008/01/14
powered by: BlueMatrix
17Maxim Group LLC
SFX Entertainment Inc. (SFXE)
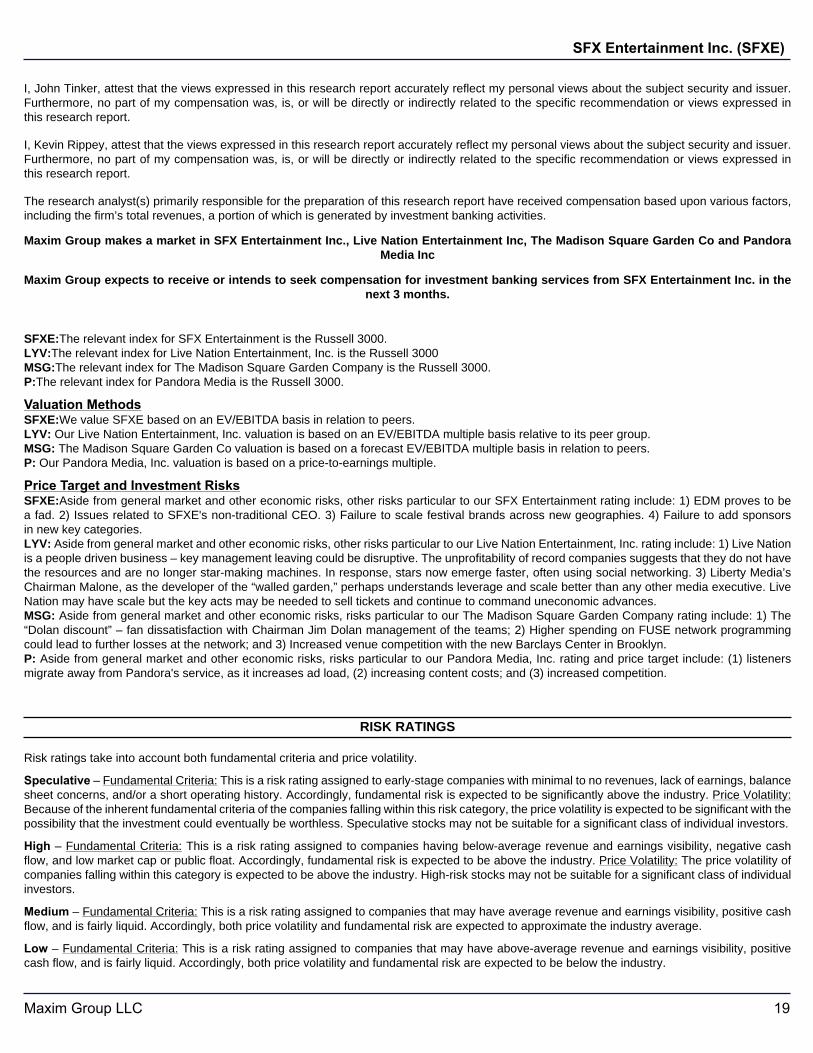
Oct 2011 Jan 2012 Apr 2012 Jul 2012 Oct 2012 Jan 2013 Apr 2013 Jul 2013 Oct 2013 Jan 2014 Apr 2014 Jul 2014
120
100
80
60
40
20
Closing Price Target Price
The Madison Square Garden Co Rating History as of 09/16/2014
Buy:$105.0010/27/11
Buy:$32.0011/07/11
Buy:$36.0011/29/11
Buy:$42.0002/21/12
Hold:NA05/04/12
Buy:$52.0011/05/12
Buy:$70.0002/07/13
Buy:$75.0005/06/13
Hold:NA05/02/14
powered by: BlueMatrix
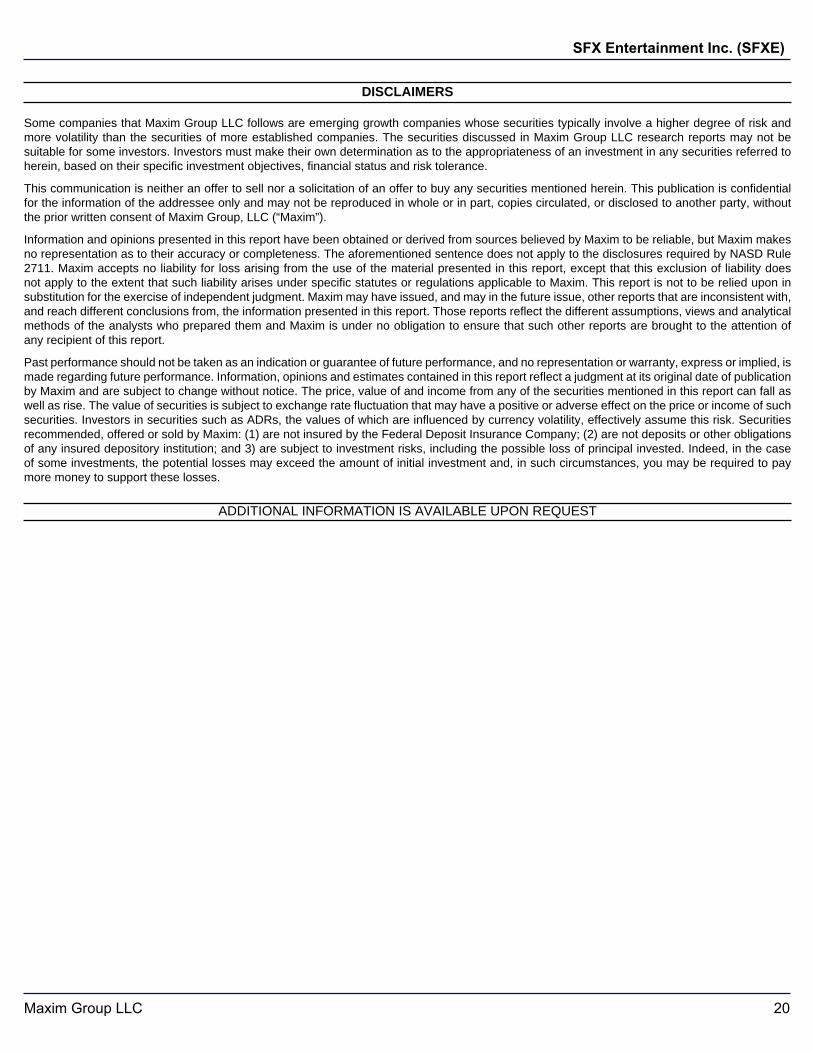
Oct 2011 Jan 2012 Apr 2012 Jul 2012 Oct 2012 Jan 2013 Apr 2013 Jul 2013 Oct 2013 Jan 2014 Apr 2014 Jul 2014
40
35
30
25
20
15
10
5
Closing Price Target Price
Pandora Media Inc Rating History as of 09/16/2014
Hold:NA05/17/13
Buy:$35.0004/15/14
powered by: BlueMatrix
Maxim Group LLC Ratings Distribution As of: 09/23/14
% of CoverageUniverse with Rating
% of Rating for which FirmProvided Banking Services
in the Last 12 months
BuyFundamental metrics and/or identifiable catalysts exist such that weexpect the stock to outperform its relevant index over the next 12 months.
82% 33%
HoldFundamental metrics are currently at, or approaching, industry averages.Therefore, we expect this stock to neither significantly outperform norunderperform its relevant index over the next 12 months.
17% 18%
SellFundamental metrics and/or identifiable catalysts exist such that weexpect the stock to underperform its relevant index over the next 12months.
*See valuation section for company specific relevant indices
2% 0%
18Maxim Group LLC
SFX Entertainment Inc. (SFXE)
I, John Tinker, attest that the views expressed in this research report accurately reflect my personal views about the subject security and issuer.Furthermore, no part of my compensation was, is, or will be directly or indirectly related to the specific recommendation or views expressed inthis research report.
I, Kevin Rippey, attest that the views expressed in this research report accurately reflect my personal views about the subject security and issuer.Furthermore, no part of my compensation was, is, or will be directly or indirectly related to the specific recommendation or views expressed inthis research report.
The research analyst(s) primarily responsible for the preparation of this research report have received compensation based upon various factors,including the firm’s total revenues, a portion of which is generated by investment banking activities.
Maxim Group makes a market in SFX Entertainment Inc., Live Nation Entertainment Inc, The Madison Square Garden Co and PandoraMedia Inc
Maxim Group expects to receive or intends to seek compensation for investment banking services from SFX Entertainment Inc. in thenext 3 months.
SFXE:The relevant index for SFX Entertainment is the Russell 3000.LYV:The relevant index for Live Nation Entertainment, Inc. is the Russell 3000MSG:The relevant index for The Madison Square Garden Company is the Russell 3000.P:The relevant index for Pandora Media is the Russell 3000.
Valuation MethodsSFXE:We value SFXE based on an EV/EBITDA basis in relation to peers.LYV: Our Live Nation Entertainment, Inc. valuation is based on an EV/EBITDA multiple basis relative to its peer group.MSG: The Madison Square Garden Co valuation is based on a forecast EV/EBITDA multiple basis in relation to peers.P: Our Pandora Media, Inc. valuation is based on a price-to-earnings multiple.
Price Target and Investment RisksSFXE:Aside from general market and other economic risks, other risks particular to our SFX Entertainment rating include: 1) EDM proves to bea fad. 2) Issues related to SFXE's non-traditional CEO. 3) Failure to scale festival brands across new geographies. 4) Failure to add sponsorsin new key categories.LYV: Aside from general market and other economic risks, other risks particular to our Live Nation Entertainment, Inc. rating include: 1) Live Nationis a people driven business – key management leaving could be disruptive. The unprofitability of record companies suggests that they do not havethe resources and are no longer star-making machines. In response, stars now emerge faster, often using social networking. 3) Liberty Media’sChairman Malone, as the developer of the “walled garden,” perhaps understands leverage and scale better than any other media executive. LiveNation may have scale but the key acts may be needed to sell tickets and continue to command uneconomic advances.MSG: Aside from general market and other economic risks, risks particular to our The Madison Square Garden Company rating include: 1) The“Dolan discount” – fan dissatisfaction with Chairman Jim Dolan management of the teams; 2) Higher spending on FUSE network programmingcould lead to further losses at the network; and 3) Increased venue competition with the new Barclays Center in Brooklyn.P: Aside from general market and other economic risks, risks particular to our Pandora Media, Inc. rating and price target include: (1) listenersmigrate away from Pandora's service, as it increases ad load, (2) increasing content costs; and (3) increased competition.
RISK RATINGS
Risk ratings take into account both fundamental criteria and price volatility.
Speculative – Fundamental Criteria: This is a risk rating assigned to early-stage companies with minimal to no revenues, lack of earnings, balancesheet concerns, and/or a short operating history. Accordingly, fundamental risk is expected to be significantly above the industry. Price Volatility:Because of the inherent fundamental criteria of the companies falling within this risk category, the price volatility is expected to be significant with thepossibility that the investment could eventually be worthless. Speculative stocks may not be suitable for a significant class of individual investors.
High – Fundamental Criteria: This is a risk rating assigned to companies having below-average revenue and earnings visibility, negative cashflow, and low market cap or public float. Accordingly, fundamental risk is expected to be above the industry. Price Volatility: The price volatility ofcompanies falling within this category is expected to be above the industry. High-risk stocks may not be suitable for a significant class of individualinvestors.
Medium – Fundamental Criteria: This is a risk rating assigned to companies that may have average revenue and earnings visibility, positive cashflow, and is fairly liquid. Accordingly, both price volatility and fundamental risk are expected to approximate the industry average.
Low – Fundamental Criteria: This is a risk rating assigned to companies that may have above-average revenue and earnings visibility, positivecash flow, and is fairly liquid. Accordingly, both price volatility and fundamental risk are expected to be below the industry.
19Maxim Group LLC
SFX Entertainment Inc. (SFXE)
DISCLAIMERS
Some companies that Maxim Group LLC follows are emerging growth companies whose securities typically involve a higher degree of risk andmore volatility than the securities of more established companies. The securities discussed in Maxim Group LLC research reports may not besuitable for some investors. Investors must make their own determination as to the appropriateness of an investment in any securities referred toherein, based on their specific investment objectives, financial status and risk tolerance.
This communication is neither an offer to sell nor a solicitation of an offer to buy any securities mentioned herein. This publication is confidentialfor the information of the addressee only and may not be reproduced in whole or in part, copies circulated, or disclosed to another party, withoutthe prior written consent of Maxim Group, LLC (“Maxim”).
Information and opinions presented in this report have been obtained or derived from sources believed by Maxim to be reliable, but Maxim makesno representation as to their accuracy or completeness. The aforementioned sentence does not apply to the disclosures required by NASD Rule2711. Maxim accepts no liability for loss arising from the use of the material presented in this report, except that this exclusion of liability doesnot apply to the extent that such liability arises under specific statutes or regulations applicable to Maxim. This report is not to be relied upon insubstitution for the exercise of independent judgment. Maxim may have issued, and may in the future issue, other reports that are inconsistent with,and reach different conclusions from, the information presented in this report. Those reports reflect the different assumptions, views and analyticalmethods of the analysts who prepared them and Maxim is under no obligation to ensure that such other reports are brought to the attention ofany recipient of this report.
Past performance should not be taken as an indication or guarantee of future performance, and no representation or warranty, express or implied, ismade regarding future performance. Information, opinions and estimates contained in this report reflect a judgment at its original date of publicationby Maxim and are subject to change without notice. The price, value of and income from any of the securities mentioned in this report can fall aswell as rise. The value of securities is subject to exchange rate fluctuation that may have a positive or adverse effect on the price or income of suchsecurities. Investors in securities such as ADRs, the values of which are influenced by currency volatility, effectively assume this risk. Securitiesrecommended, offered or sold by Maxim: (1) are not insured by the Federal Deposit Insurance Company; (2) are not deposits or other obligationsof any insured depository institution; and 3) are subject to investment risks, including the possible loss of principal invested. Indeed, in the caseof some investments, the potential losses may exceed the amount of initial investment and, in such circumstances, you may be required to paymore money to support these losses.
ADDITIONAL INFORMATION IS AVAILABLE UPON REQUEST
20Maxim Group LLC
SFX Entertainment Inc. (SFXE)
Capital Markets/Syndicate: 212-895-3695
Corporate Finance: 212-895-3511
Equity/Options Trading: 212-895-3790
Equity Research: 212-895-3736
Event Driven/Risk Arb Group: 212-895-3878
Fixed Income Trading: 212-895-3875
Global Equity Trading: 212-895-3623
Institutional Sales: 212-895-3755
Institutional Sales Trading: 212-895-3873
Prime Brokerage: 212-895-3723
Wealth Management: 212-895-3624
Woodbury, New York San Francisco, California
20 Crossways Park Drive North 50 California Street
Suite 304 Suite 1500
Woodbury, NY 11797 San Francisco, CA 94111
Tel: 516-393-8300 Tel: 415-762-0113
Red Bank, New Jersey Boston, Massachusetts 246 Maple Avenue 225 Franklin Street
Red Bank, NJ 07701 Suite 2607
Tel: 732-784-1900 Boston, MA 02110
Tel: 617-217-2444
Boca Raton, Florida 7900 Glades Road
Boca Raton, FL 33434
Tel: 561-465-2605
Corporate Headquarters The Chrysler Building
405 Lexington Ave., 2nd FL
New York, NY 10174
Tel: 212-895-3500
Tel: 212-895-3500