SFD report Presentation - University of KwaZulu-Natal
23
Contents ¤ The Durban SFD ¤ Overview of the System ¤ Summary of the Service Delivery Analysis ¤ Weaknesses in the Results ¤ Key Points of Interest ¤ The Way Forward 1
Transcript of SFD report Presentation - University of KwaZulu-Natal
Contents
¤ The Durban SFD
¤ Overview of the System
¤ Summary of the Service Delivery Analysis
¤ Weaknesses in the Results
¤ Key Points of Interest
¤ The Way Forward
1
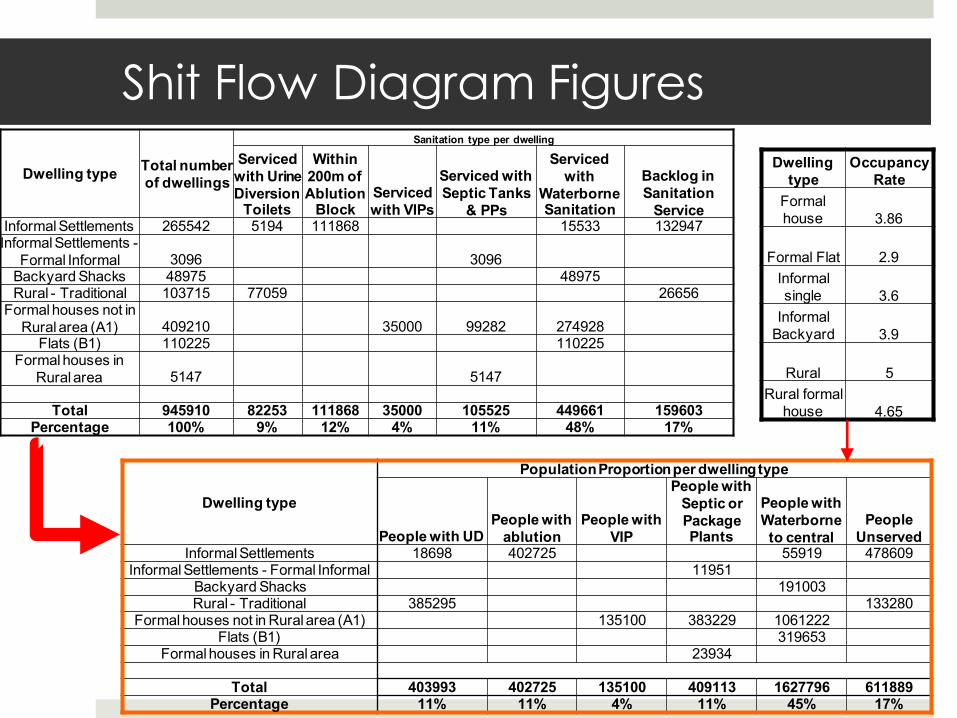
Shit Flow Diagram FiguresDwelling type Total number
of dwellings
Sanitation type per dwelling
Serviced with Urine Diversion
Toilets
Within 200m of Ablution
BlockServiced with VIPs
Serviced with Septic Tanks
& PPs
Serviced with
Waterborne Sanitation
Backlog in Sanitation
ServiceInformal Settlements 265542 5194 111868 15533 132947Informal Settlements -
Formal Informal 3096 3096Backyard Shacks 48975 48975Rural - Traditional 103715 77059 26656
Formal houses not in Rural area (A1) 409210 35000 99282 274928
Flats (B1) 110225 110225Formal houses in
Rural area 5147 5147
Total 945910 82253 111868 35000 105525 449661 159603Percentage 100% 9% 12% 4% 11% 48% 17%
Dwelling type
Population Proportion per dwelling type
People with UDPeople with
ablutionPeople with
VIP
People with Septic or Package Plants
People with Waterborne to central
People Unserved
Informal Settlements 18698 402725 55919 478609Informal Settlements - Formal Informal 11951
Backyard Shacks 191003Rural - Traditional 385295 133280
Formal houses not in Rural area (A1) 135100 383229 1061222Flats (B1) 319653
Formal houses in Rural area 23934
Total 403993 402725 135100 409113 1627796 611889Percentage 11% 11% 4% 11% 45% 17%
Dwelling type
Occupancy Rate
Formal house 3.86
Formal Flat 2.9Informal single 3.6
Informal Backyard 3.9
Rural 5Rural formal
house 4.65
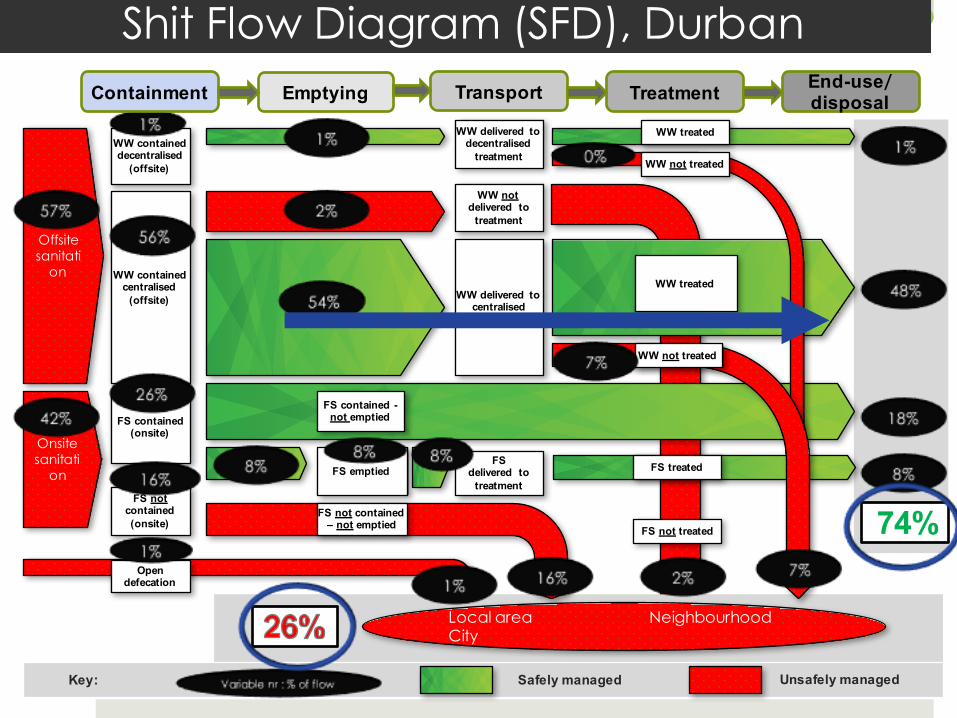
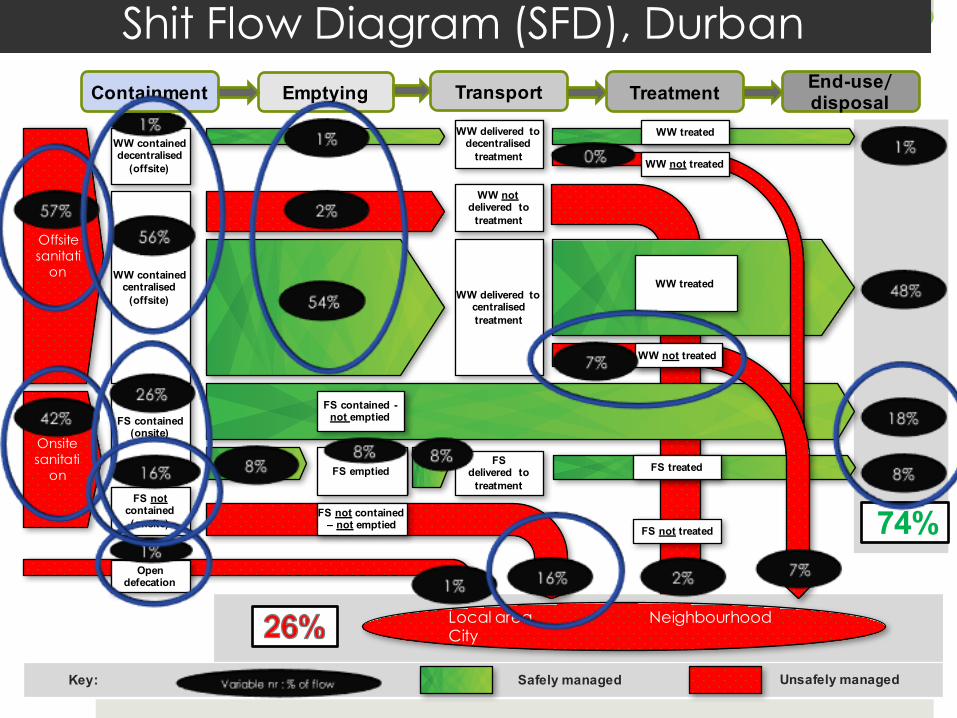
Durban, South Africa 01.04.2016Field based assessment
Local area Neighbourhood City
WW contained decentralised
(offsite)
FS delivered to
treatment
Offsite sanitati
on
Onsite sanitati
on
74%
FS contained (onsite)
FS emptied
FS not treated
WW delivered to decentralised
treatment
WW not delivered to
treatment
WW contained centralised
(offsite) WW delivered to centralisedtreatment
Treatment End-use/ disposalTransportEmptyingContainment
Key: Safely managed Unsafely managed
WW treated
FS contained -not emptied
Open defecation
WW treated
FS treated
FS not contained – not emptied
FS not contained (onsite)
WW not treated
WW not treated
Shit Flow Diagram (SFD), Durban
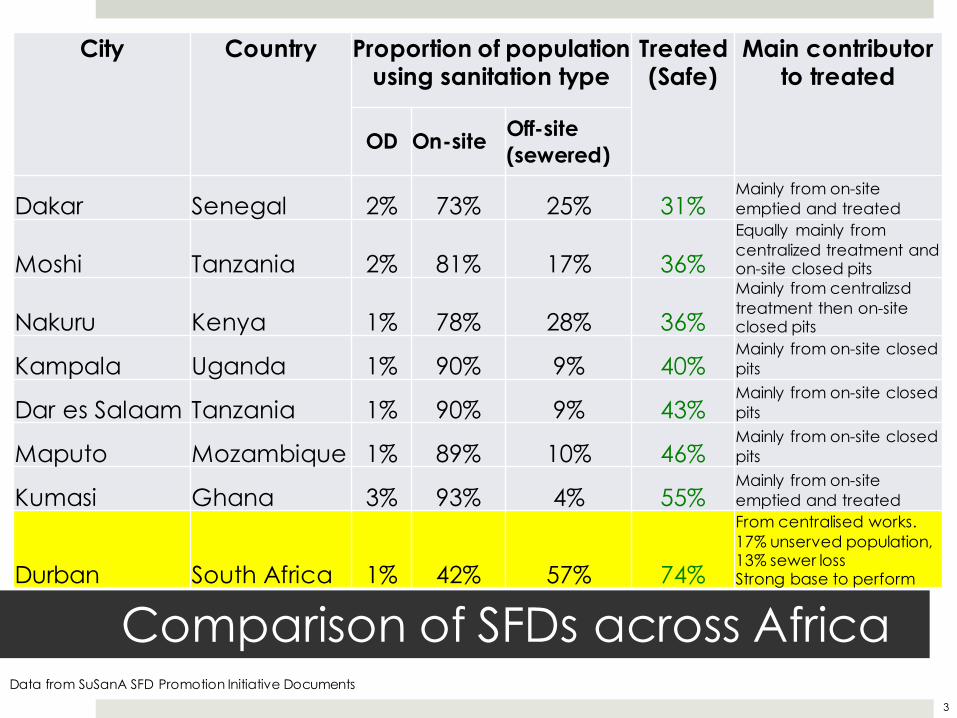
Comparison of SFDs across Africa3
Data from SuSanA SFD Promotion Initiative Documents
City Country Proportion of population using sanitation type
Treated (Safe)
Main contributor to treated
OD On-site Off-site (sewered)
Dakar Senegal 2% 73% 25% 31%Mainly from on-site emptied and treated
Moshi Tanzania 2% 81% 17% 36%Equally mainly from centralized treatment and on-site closed pits
Nakuru Kenya 1% 78% 28% 36%Mainly from centralizsdtreatment then on-site closed pits
Kampala Uganda 1% 90% 9% 40%Mainly from on-site closed pits
Dar es Salaam Tanzania 1% 90% 9% 43%Mainly from on-site closed pits
Maputo Mozambique 1% 89% 10% 46%Mainly from on-site closed pits
Kumasi Ghana 3% 93% 4% 55%Mainly from on-site emptied and treated
Durban South Africa 1% 42% 57% 74%
From centralised works.17% unserved population, 13% sewer lossStrong base to perform
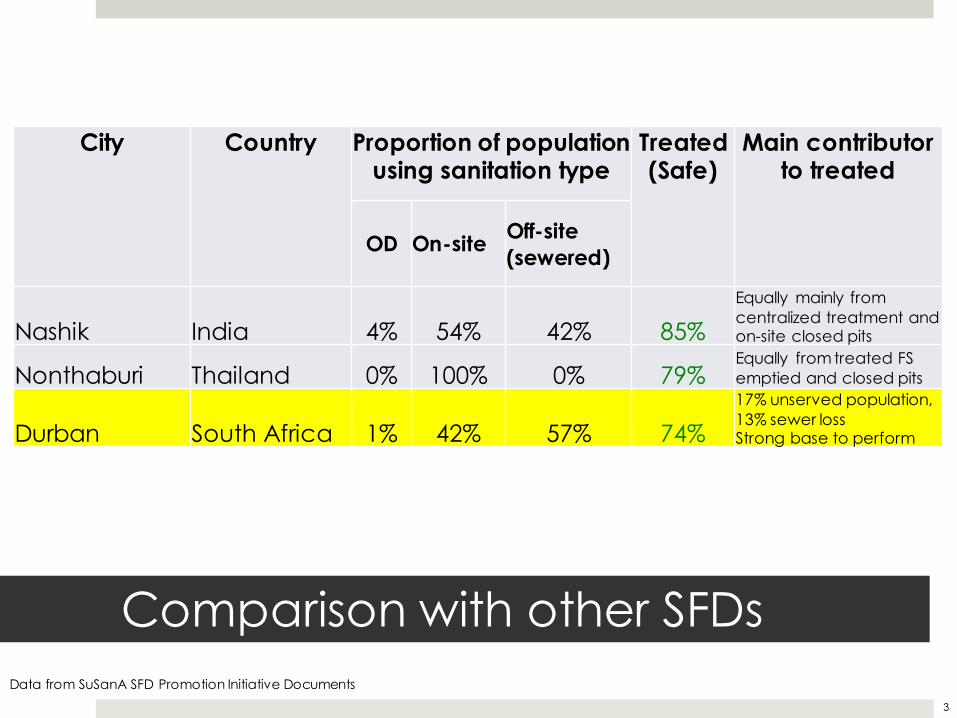
Comparison with other SFDs
3
Data from SuSanA SFD Promotion Initiative Documents
City Country Proportion of population using sanitation type
Treated (Safe)
Main contributor to treated
OD On-site Off-site (sewered)
Nashik India 4% 54% 42% 85%Equally mainly from centralized treatment and on-site closed pits
Nonthaburi Thailand 0% 100% 0% 79%Equally from treated FS emptied and closed pits
Durban South Africa 1% 42% 57% 74%17% unserved population, 13% sewer lossStrong base to perform
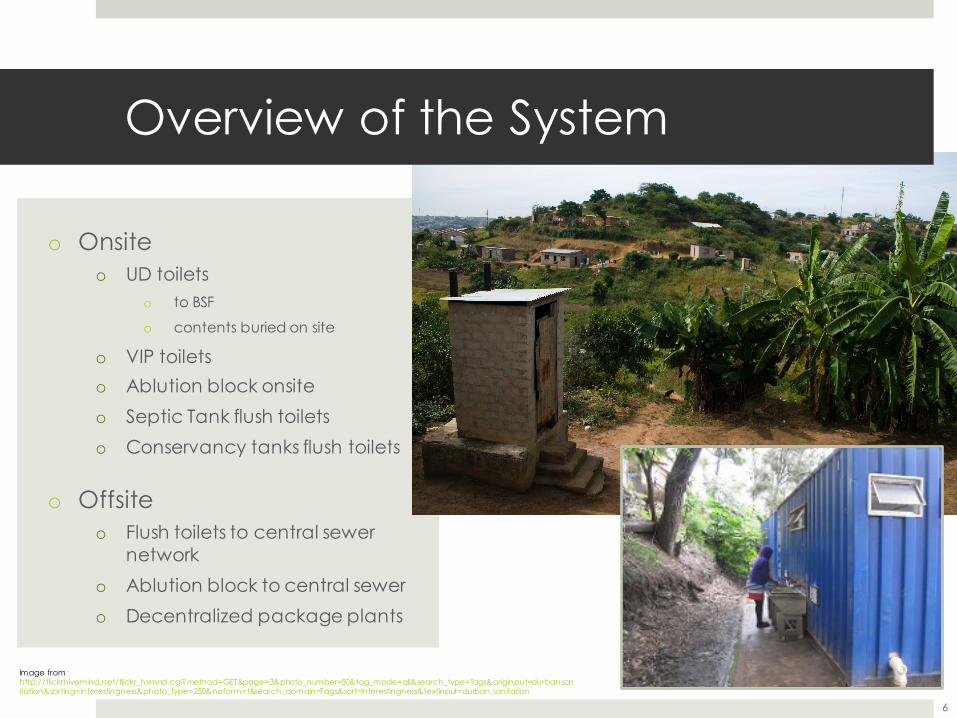
o Onsiteo UD toilets
o to BSF
o contents buried on site
o VIP toiletso Ablution block onsiteo Septic Tank flush toiletso Conservancy tanks flush toilets
o Offsiteo Flush toilets to central sewer
networko Ablution block to central sewero Decentralized package plants
6
Image from: http://flickrhivemind.net/flickr_hvmnd.cgi?method=GET&page=3&photo_number=50&tag_mode=all&search_type=Tags&originput=durban,sanitation&sorting=Interestingness&photo_type=250&noform=t&search_domain=Tags&sort=Interestingness&textinput=durban,sanitation
Overview of the System
Durban, South Africa 01.04.2016Field based assessmentShit Flow Diagram (SFD), Durban
Local area Neighbourhood City
WW contained decentralised
(offsite)
FS delivered to
treatment
Offsite sanitati
on
Onsite sanitati
on
74%
FS contained (onsite)
FS emptied
FS not treated
WW delivered to decentralised
treatment
WW not delivered to
treatment
WW contained centralised
(offsite) WW delivered to centralisedtreatment
Treatment End-use/ disposalTransportEmptyingContainment
Key: Safely managed Unsafely managed
WW treated
FS contained -not emptied
Open defecation
WW treated
FS treated
FS not contained – not emptied
FS not contained (onsite)
WW not treated
WW not treated
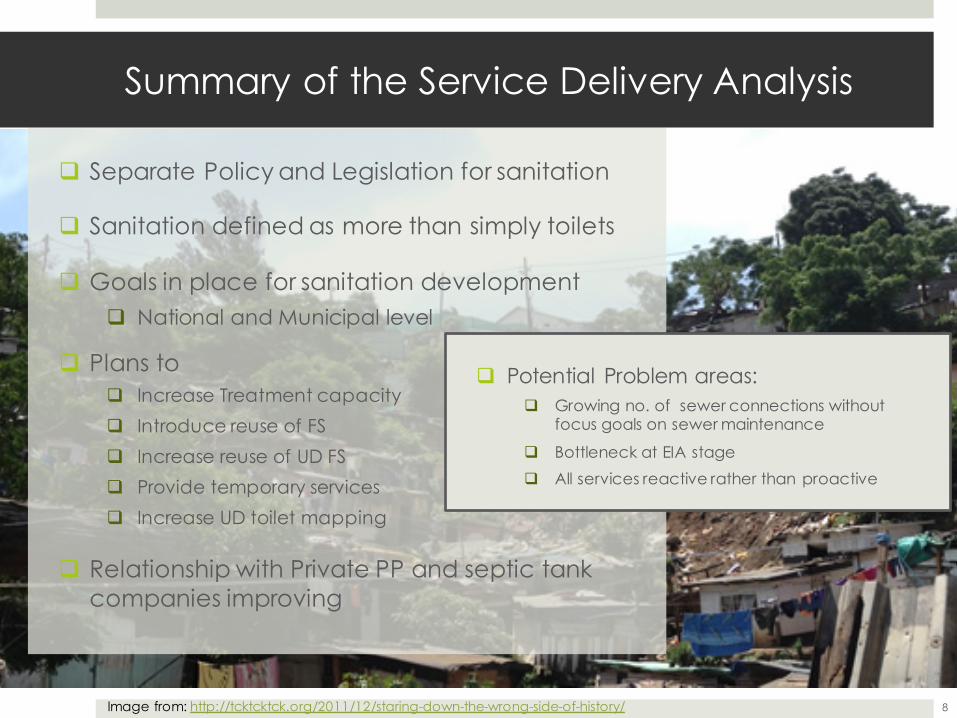
q Separate Policy and Legislation for sanitation
q Sanitation defined as more than simply toilets
q Goals in place for sanitation developmentq National and Municipal level
q Plans toq Increase Treatment capacityq Introduce reuse of FSq Increase reuse of UD FSq Provide temporary servicesq Increase UD toilet mapping
q Relationship with Private PP and septic tank companies improving
8
Summary of the Service Delivery Analysis
q Potential Problem areas:q Growing no. of sewer connections without
focus goals on sewer maintenance
q Bottleneck at EIA stageq All services reactive rather than proactive
Image from: http://tcktcktck.org/2011/12/staring-down-the-wrong-side-of-history/
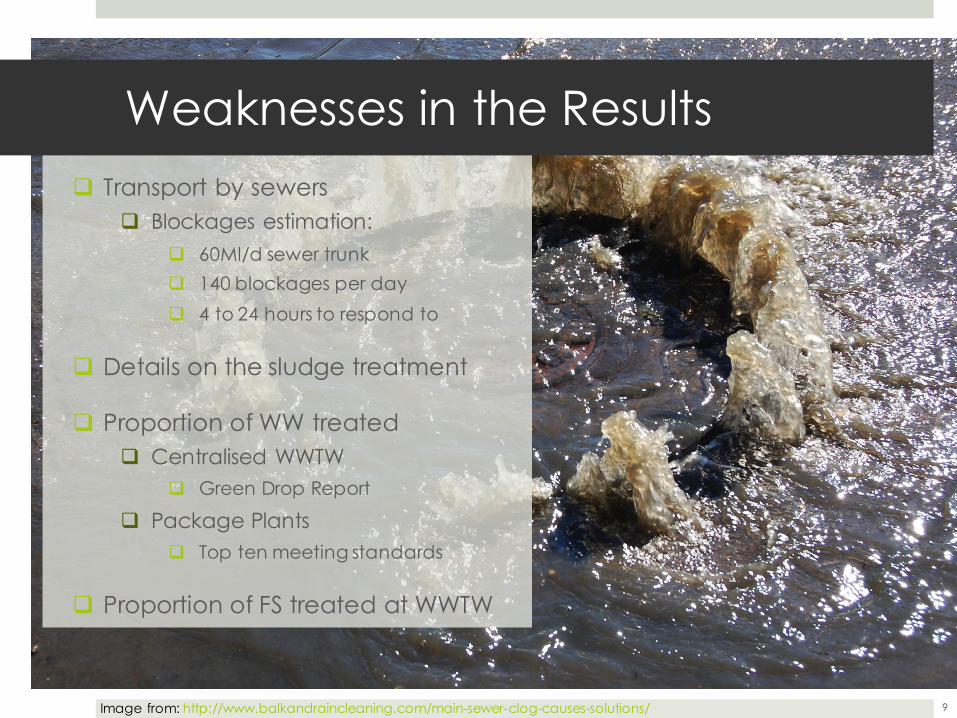
q Transport by sewersq Blockages estimation:
q 60Ml/d sewer trunkq 140 blockages per dayq 4 to 24 hours to respond to
q Details on the sludge treatment
q Proportion of WW treatedq Centralised WWTW
q Green Drop Report
q Package Plantsq Top ten meeting standards
q Proportion of FS treated at WWTW
Weaknesses in the Results
9Image from: http://www.balkandraincleaning.com/main-sewer-clog-causes-solutions/
HAVELOCK HOUSEHOLD ENUMERATION REPORT
HAVELOCK, DURBAN, MAY 2012
Informal Settlement Network Havelock Community Leadership and
Community Organisation Resource Centre
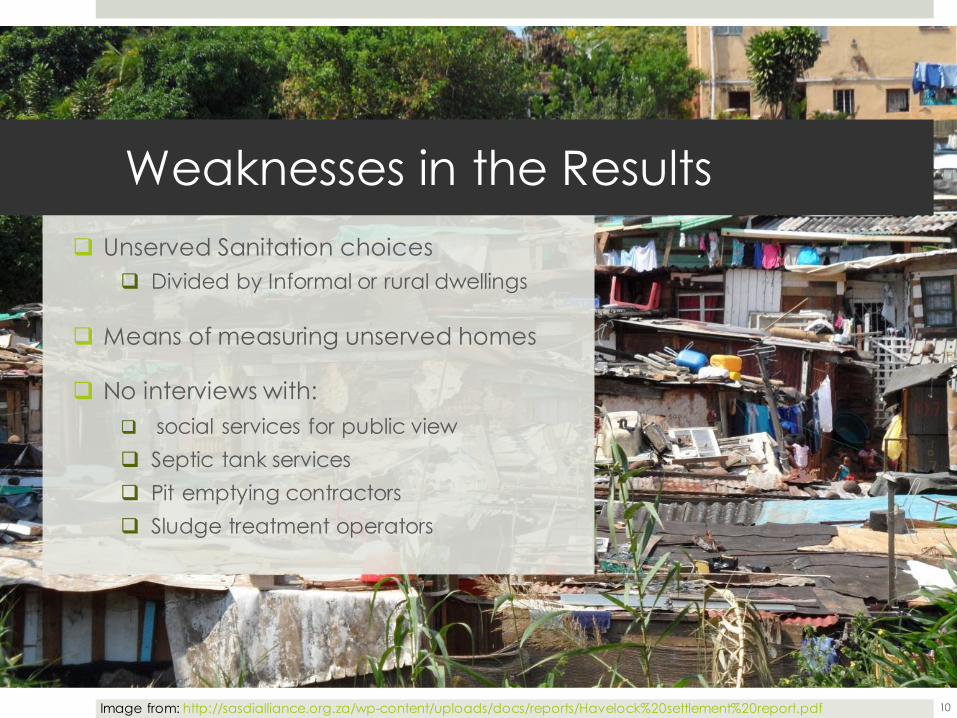
q Unserved Sanitation choicesq Divided by Informal or rural dwellings
q Means of measuring unserved homes
q No interviews with:q social services for public viewq Septic tank servicesq Pit emptying contractorsq Sludge treatment operators
Weaknesses in the Results
10Image from: http://sasdialliance.org.za/wp-content/uploads/docs/reports/Havelock%20settlement%20report.pdf
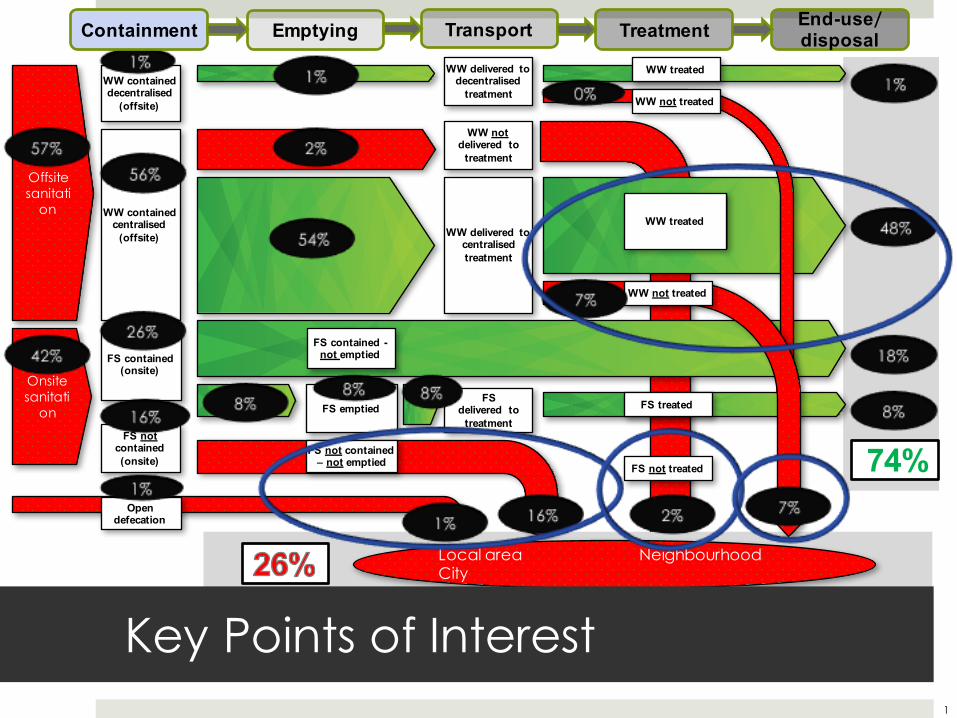
Local area Neighbourhood City
WW contained decentralised
(offsite)
FS delivered to
treatment
Offsite sanitati
on
Onsite sanitati
on
74%
FS contained (onsite)
FS emptied
FS not treated
WW delivered to decentralised
treatment
WW not delivered to
treatment
WW contained centralised
(offsite) WW delivered to centralisedtreatment
Treatment End-use/ disposalTransportEmptyingContainment
WW treated
FS contained -not emptied
Open defecation
WW treated
FS treated
FS not contained – not emptied
FS not contained (onsite)
WW not treated
WW not treated
Key Points of Interest11
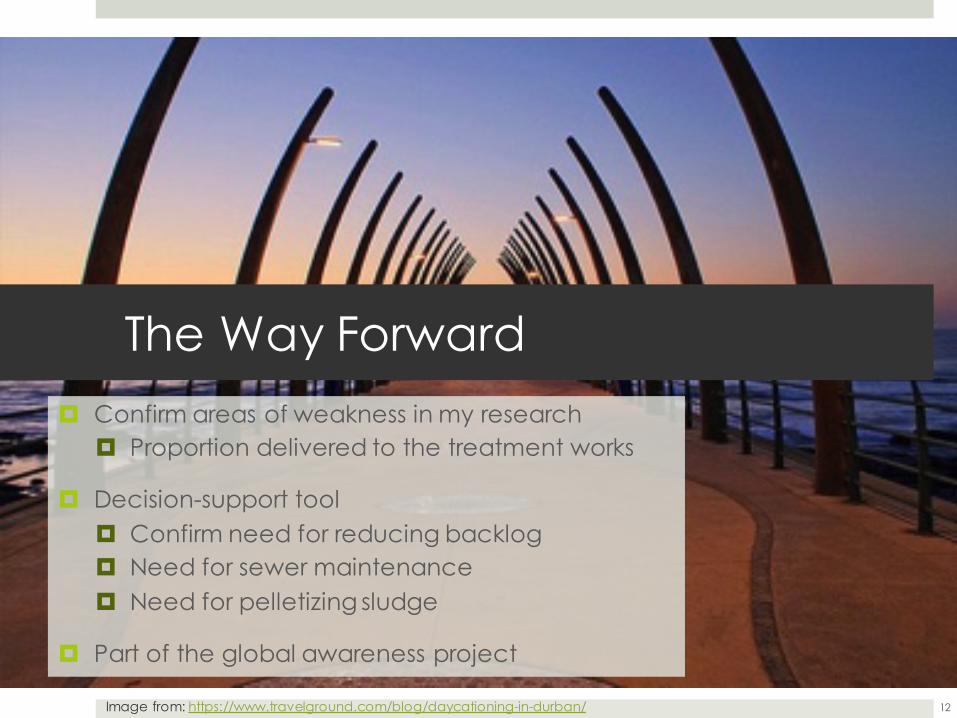
The Way Forward
12
¤ Confirm areas of weakness in my research¤ Proportion delivered to the treatment works
¤ Decision-support tool¤ Confirm need for reducing backlog¤ Need for sewer maintenance¤ Need for pelletizing sludge
¤ Part of the global awareness project
Image from: https://www.travelground.com/blog/daycationing-in-durban/
q Chris Buckley from PRG
q eThekwini Water and Sanitation
q Lars Schoebitz from Eawag
Acknowledgements
13
Thank you
14Image from: https://snapflycook.wordpress.com/
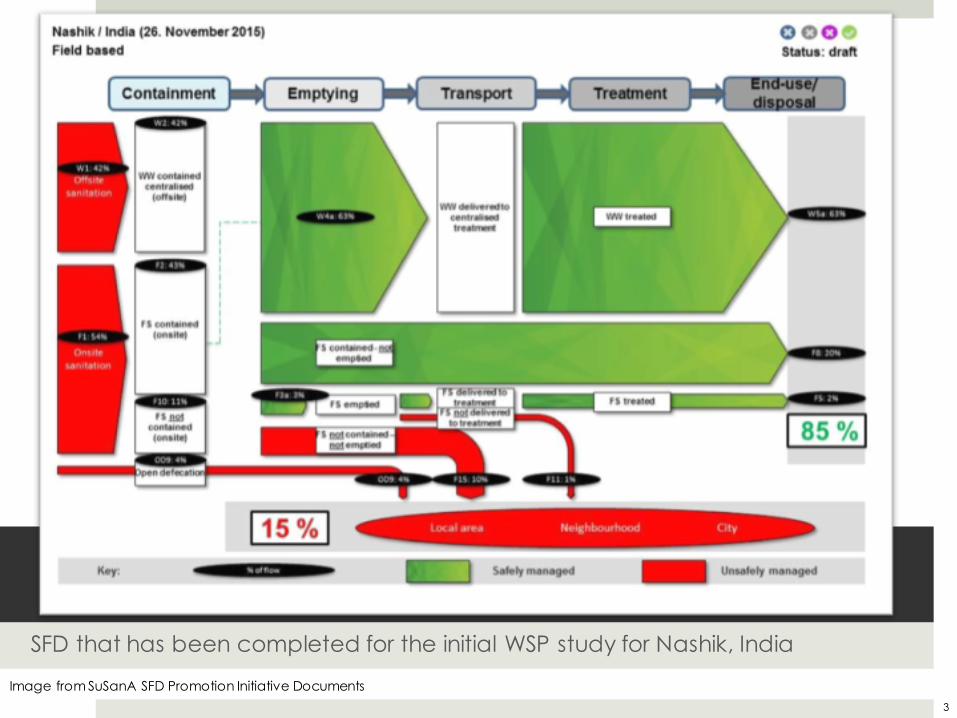
SFD that has been completed for the initial WSP study for Nashik, India
3
Image from SuSanA SFD Promotion Initiative Documents
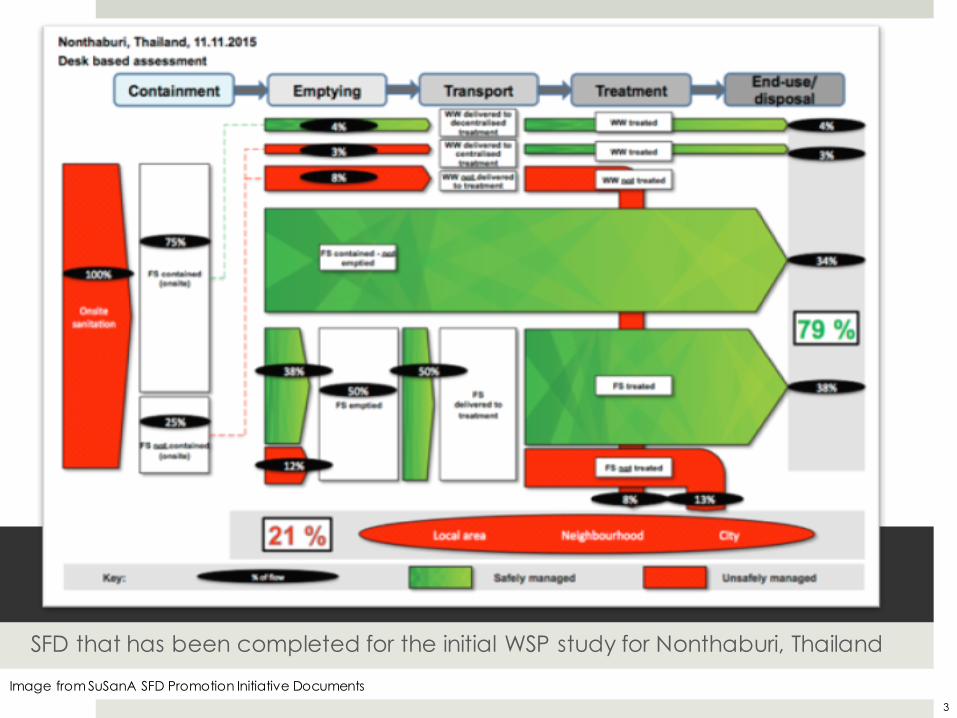
SFD that has been completed for the initial WSP study for Nonthaburi, Thailand
3
Image from SuSanA SFD Promotion Initiative Documents
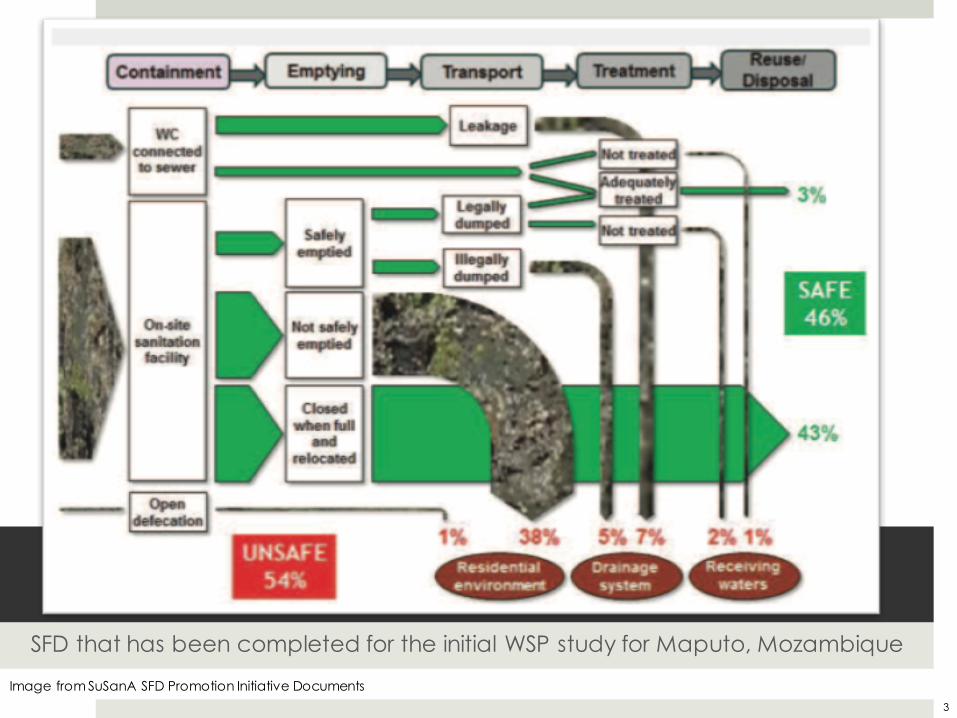
SFD that has been completed for the initial WSP study for Maputo, Mozambique
3
Image from SuSanA SFD Promotion Initiative Documents
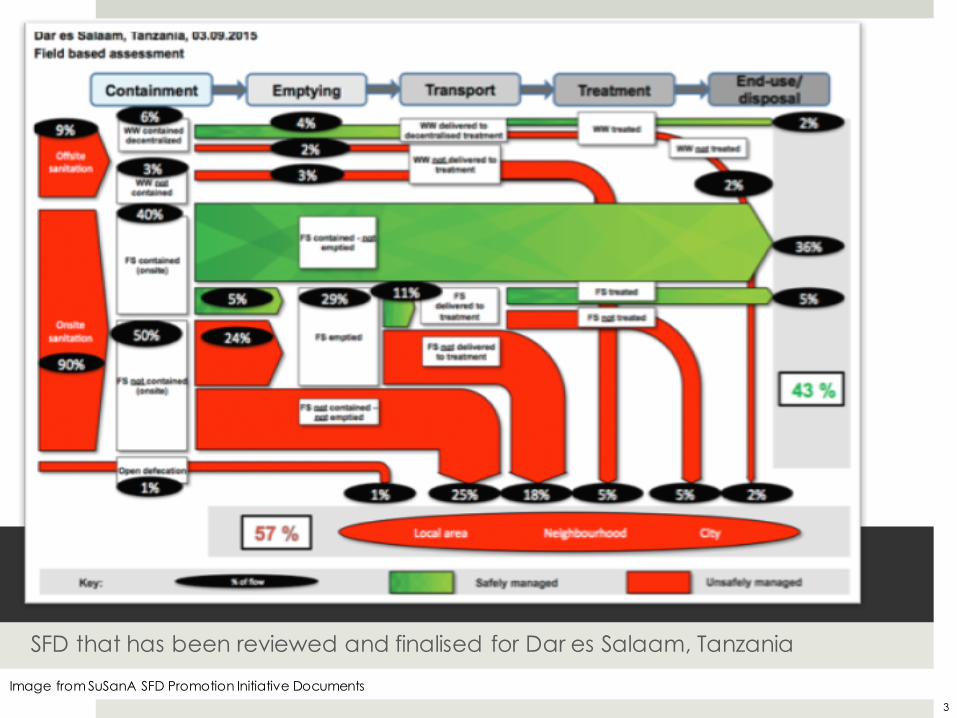
SFD that has been reviewed and finalised for Dar es Salaam, Tanzania
3
Image from SuSanA SFD Promotion Initiative Documents
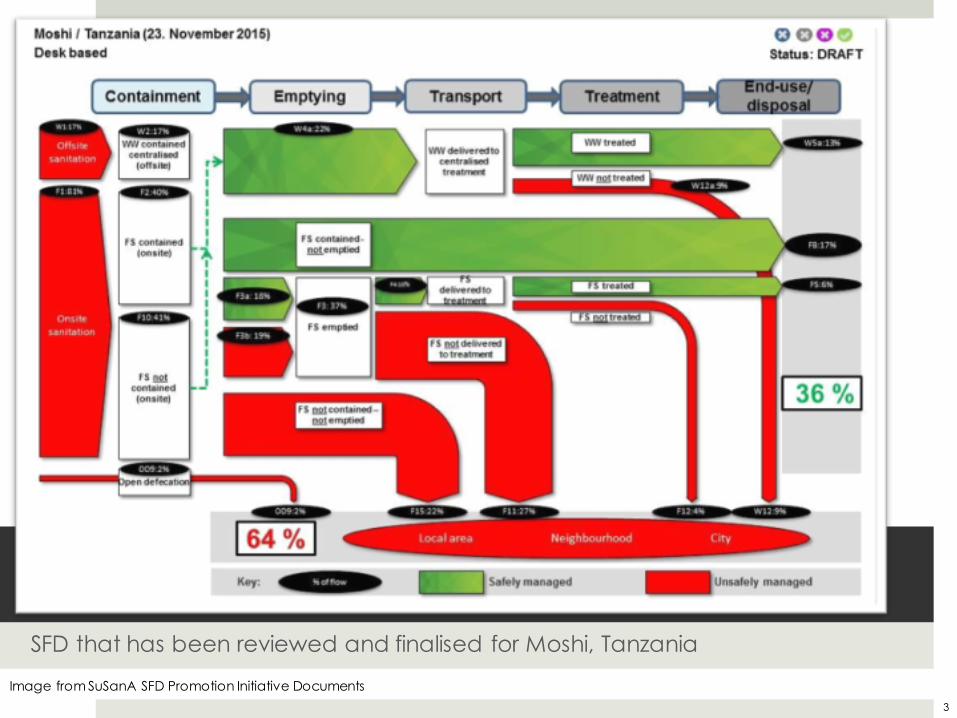
SFD that has been reviewed and finalised for Moshi, Tanzania
3
Image from SuSanA SFD Promotion Initiative Documents

SFD that has been reviewed and finalised for Nakuru, Kenya
3
Image from SuSanA SFD Promotion Initiative Documents
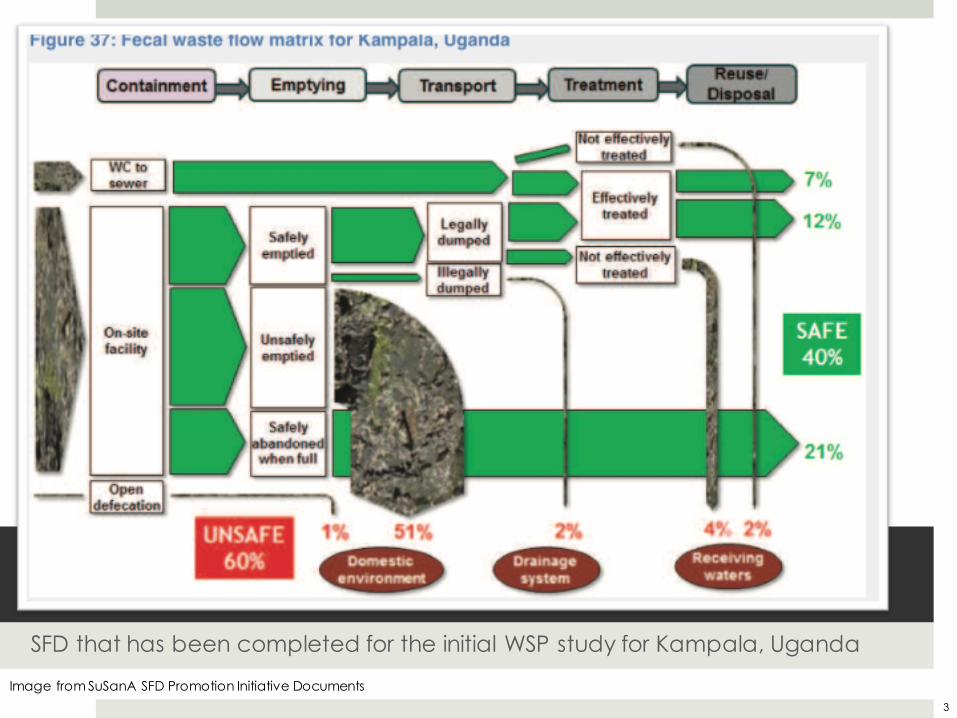
SFD that has been completed for the initial WSP study for Kampala, Uganda
3
Image from SuSanA SFD Promotion Initiative Documents
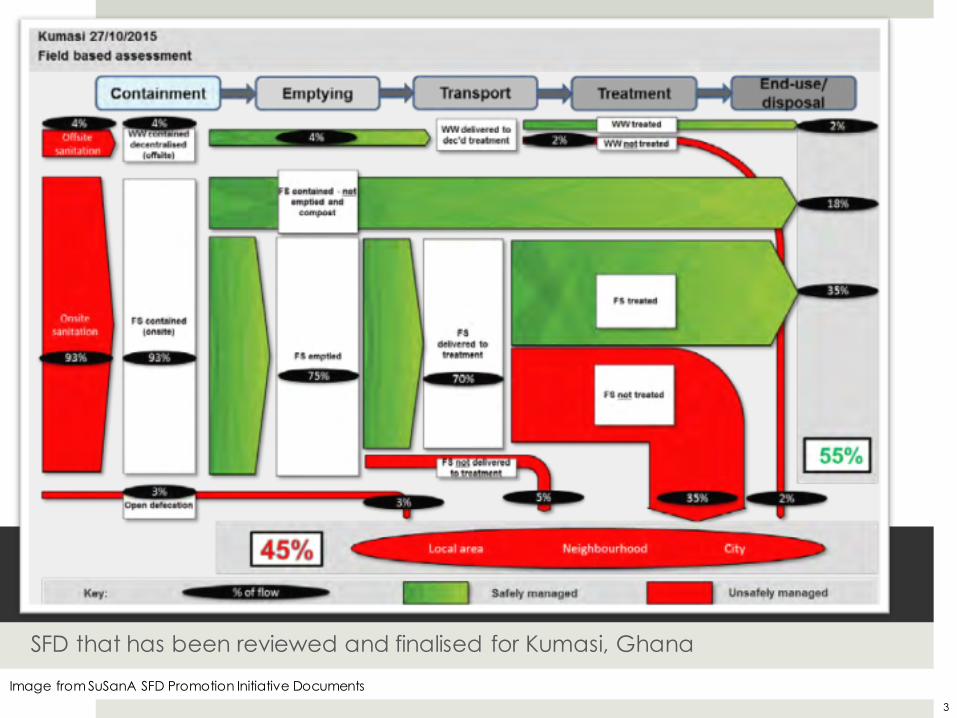
SFD that has been reviewed and finalised for Kumasi, Ghana
3
Image from SuSanA SFD Promotion Initiative Documents

SFD that has been completed for the initial WSP study for Dakar, Senegal
3
Image from SuSanA SFD Promotion Initiative Documents